telecoms and pay-tv complaints · broadband), pay-monthly mobile telephony ... section 2 and annex...
TRANSCRIPT
Publication Date: 18 July 2018
Telecoms and pay-TV complaints
Q1 (January to March) 2018
About this document
This document presents data on the number of complaints made by residential consumers to Ofcom
about the largest telecoms and pay-TV providers in the quarter January 2018 to March 2018.
The four services covered in this report are: fixed line telephony (landline), fixed broadband (fixed
broadband), pay-monthly mobile telephony (pay-monthly mobile) and pay TV (pay TV).
This document is intended to help consumers make better informed decisions, especially those who
are thinking about changing provider or purchasing a new service. We also believe that publication
of provider-specific complaint volumes incentivises providers to improve their performance.
Complaint volume data is one of a number of measures that can provide an indication of service
quality. In May 2018, we published our second annual Comparing Service Quality report to provide
an annual update on a range of other service quality metrics such as customer satisfaction.
The next complaints publication will include data for the period April to June 2018, and we expect to
publish it in October 2018.
Contents
Section
1. Summary 1
2. Background 4
3. Trend data 7
Annex
A1. Telecoms and pay-TV complaints detailed methodology 13
1
1. Summary 1.1 Ofcom receives complaints from residential customers about their landline, fixed
broadband, pay-monthly mobile and pay-TV services. We compile that data and work out
the number of complaints received by provider and by service. To account for differences
in the size of providers we calculate the number of complaints received per 100,000
customers. We publish that data on a quarterly basis.
1.2 The complaints data for Q1 (January to March) 2018 is presented in the league tables
below.1 We believe this is important information for customers to be aware of when
comparing providers and deciding which service to opt for. Section 2 and Annex A1 of this
report explain a number of points about the data, including its limitations, which readers
should be aware of.
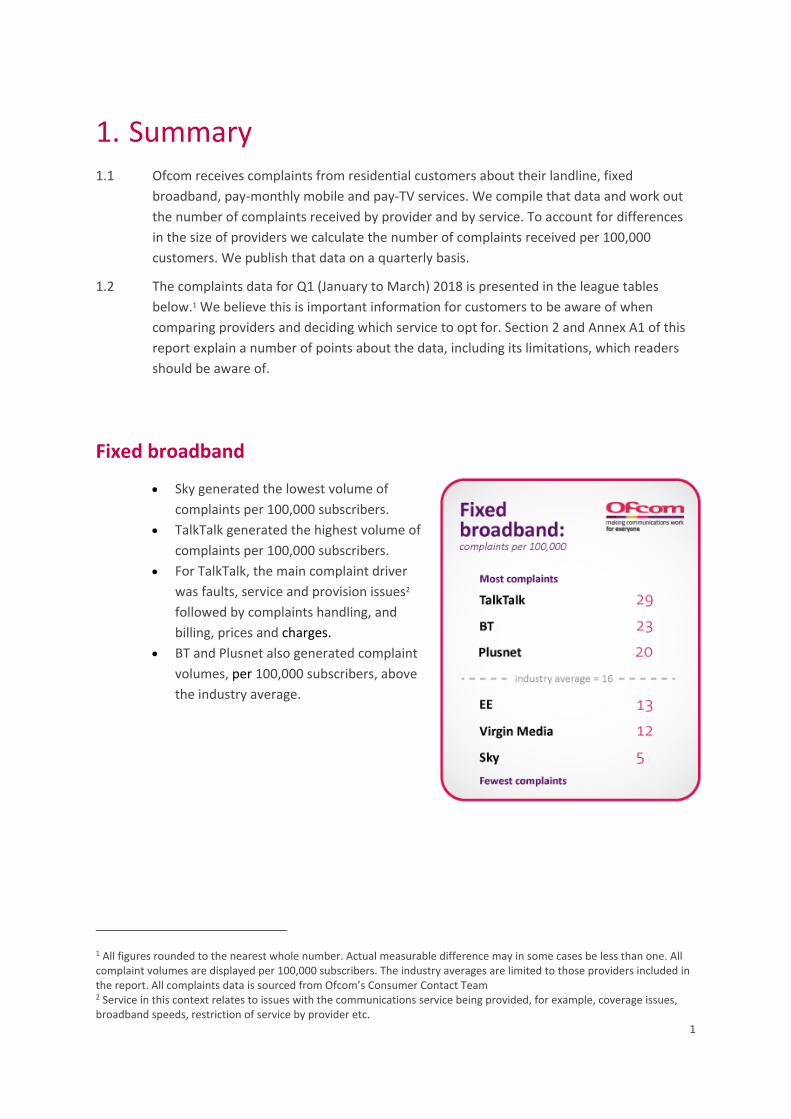
Fixed broadband
• Sky generated the lowest volume of
complaints per 100,000 subscribers.
• TalkTalk generated the highest volume of
complaints per 100,000 subscribers.
• For TalkTalk, the main complaint driver
was faults, service and provision issues2
followed by complaints handling, and
billing, prices and charges.
• BT and Plusnet also generated complaint
volumes, per 100,000 subscribers, above
the industry average.
1 All figures rounded to the nearest whole number. Actual measurable difference may in some cases be less than one. All complaint volumes are displayed per 100,000 subscribers. The industry averages are limited to those providers included in the report. All complaints data is sourced from Ofcom’s Consumer Contact Team 2 Service in this context relates to issues with the communications service being provided, for example, coverage issues, broadband speeds, restriction of service by provider etc.
2
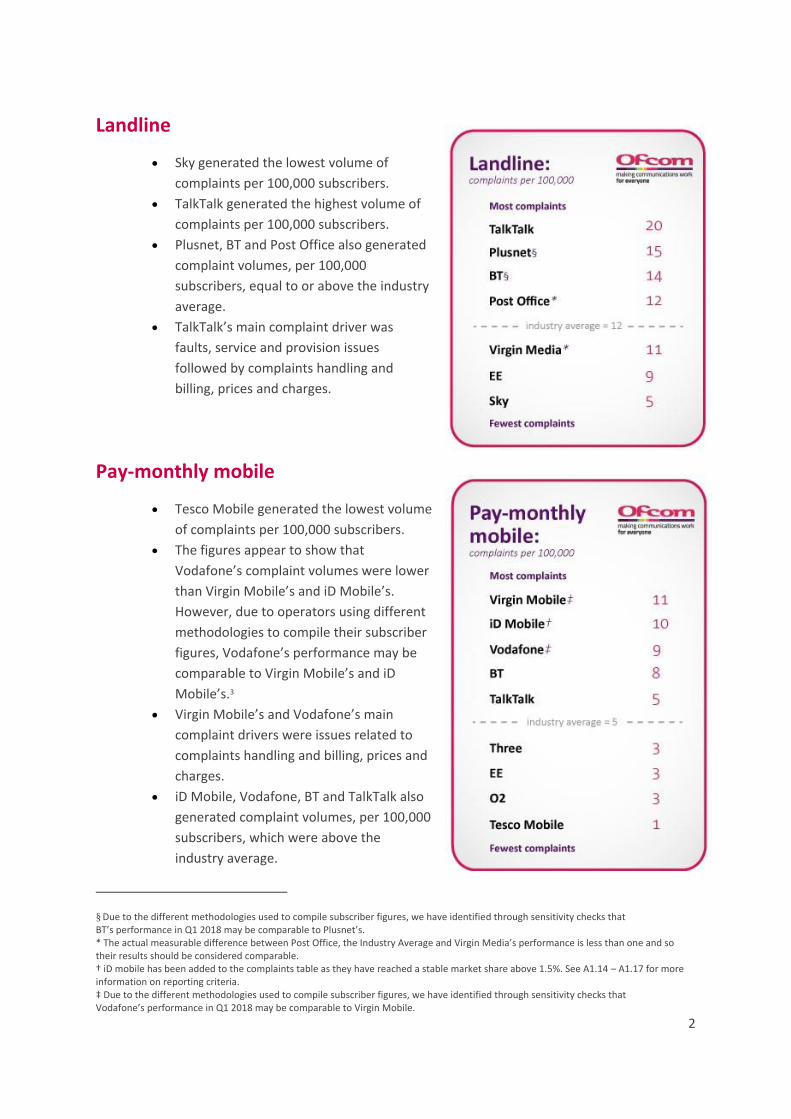
Landline
• Sky generated the lowest volume of
complaints per 100,000 subscribers.
• TalkTalk generated the highest volume of
complaints per 100,000 subscribers.
• Plusnet, BT and Post Office also generated
complaint volumes, per 100,000
subscribers, equal to or above the industry
average.
• TalkTalk’s main complaint driver was
faults, service and provision issues
followed by complaints handling and
billing, prices and charges.
Pay-monthly mobile
• Tesco Mobile generated the lowest volume
of complaints per 100,000 subscribers.
• The figures appear to show that
Vodafone’s complaint volumes were lower
than Virgin Mobile’s and iD Mobile’s.
However, due to operators using different
methodologies to compile their subscriber
figures, Vodafone’s performance may be
comparable to Virgin Mobile’s and iD
Mobile’s.3
• Virgin Mobile’s and Vodafone’s main
complaint drivers were issues related to
complaints handling and billing, prices and
charges.
• iD Mobile, Vodafone, BT and TalkTalk also
generated complaint volumes, per 100,000
subscribers, which were above the
industry average.
§ Due to the different methodologies used to compile subscriber figures, we have identified through sensitivity checks that BT’s performance in Q1 2018 may be comparable to Plusnet’s. * The actual measurable difference between Post Office, the Industry Average and Virgin Media’s performance is less than one and so their results should be considered comparable. † iD mobile has been added to the complaints table as they have reached a stable market share above 1.5%. See A1.14 – A1.17 for more information on reporting criteria. ‡ Due to the different methodologies used to compile subscriber figures, we have identified through sensitivity checks that Vodafone’s performance in Q1 2018 may be comparable to Virgin Mobile.
3
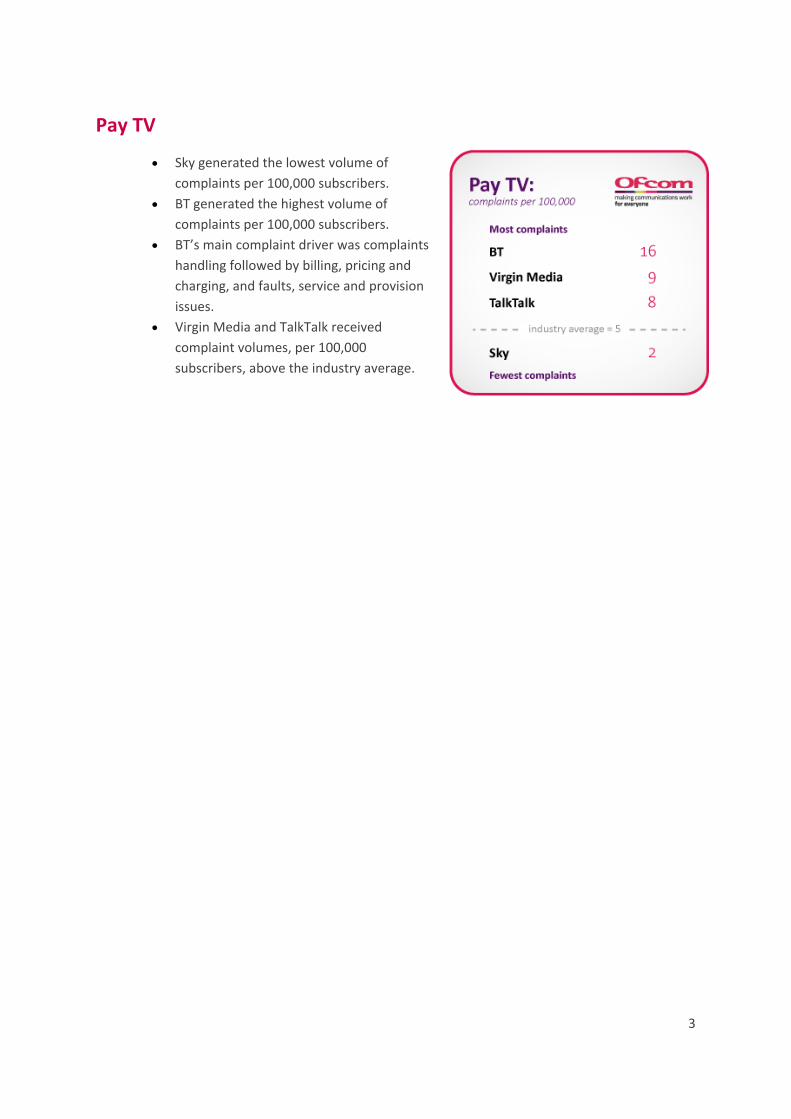
Pay TV
• Sky generated the lowest volume of
complaints per 100,000 subscribers.
• BT generated the highest volume of
complaints per 100,000 subscribers.
• BT’s main complaint driver was complaints
handling followed by billing, pricing and
charging, and faults, service and provision
issues.
• Virgin Media and TalkTalk received
complaint volumes, per 100,000
subscribers, above the industry average.
4
2. Background
2.1 Ofcom’s principal duty is to further the interests of citizens and consumers, where
appropriate by promoting competition. In doing so we must have regard to the interests of
consumers in terms of price, quality of service and value for money. Consumer information
plays a critical role in promoting effective competition and the absence of key information
can lead to poor purchasing decisions and inhibit switching.
2.2 Consumers’ overall level of satisfaction with communications services is 87% for landline
services, 80% for broadband services and 91% for all mobile services.4 Where concerns
arise, consumers typically raise their complaint with their provider in the first instance.5 If
the provider is not able to resolve the complaint within eight weeks, or if deadlock is
reached earlier, the consumer can make an application to an independent Alternative
Dispute Resolution (ADR) scheme. The ADR scheme can examine the complaint and make a
judgement on the issue.6
2.3 In addition, some consumers choose to contact Ofcom due to our role as regulator of
communications services. On average, we receive nearly 300 consumer contacts a day, by
telephone call, email and letter7. Many of these contacts result in complaints, and some
contain more than one complaint.8 These complaints are likely to be made where a
consumer has been unable to resolve an issue with their provider to their satisfaction.
While we do not resolve individual complaints ourselves, we offer consumers advice on
how they might best seek to resolve the issues that are raised.
2.4 We record complaints by service (e.g. fixed broadband or mobile) and by provider. We
believe that this information is useful for consumers; for example, this data may be
relevant to those considering a new service or change of provider.
4 See Choosing the best broadband, mobile and landline provider - Comparing Service Quality 2017 (see pages 8-9) (https://www.ofcom.org.uk/__data/assets/pdf_file/0023/113639/full-report.pdf). 5 This has been found in research, including, for example, that carried out for the 2008 Consumer Complaints Review available at http://stakeholders.ofcom.org.uk/binaries/consultations/alt_dis_res/research.pdf 6 Ofcom requires all providers to be a member of an approved ADR scheme: Ombudsman Services: Communications and the Communications and Internet Services Adjudication Scheme. 7 Ofcom received around 90,000 calls and items of correspondence directly from consumers in 2016/17 (source: Ofcom 2016/17 Annual Report, page 35: http://www.ofcom.org.uk/_data/assets/pdf_file/0021/104358/annual-report-2016-accessible.pdf) 8 Where a consumer complains about a single matter, we record that as a single complaint. If they complain about two or more separate matters relating to one service (e.g. fixed broadband), we record that as two complaints. Where they complain about more than two matters, we record the two most serious ones (through discussion with the caller) unless it is not possible to determine this (e.g. the contact is made by letter) or the consumer insists on all complaints being logged. Complainants raising more than two matters relating to the same service account for around 1% or less of total complainants in each sector. In general, we record up to two complaints per service per contact. An average of 1.6 complaints were recorded per consumer contact with Ofcom in 2016.
5
2.5 We also use the complaints data to inform policy, enforcement and monitoring work9 to
deliver positive results for consumers. One example of this is our work on complaints
handling and customer service, where we continue to remain concerned that complaint
volumes are too high. We are currently focused on driving down complaints to Ofcom in
these areas and are working with the industry to target reductions in complaint numbers.
Why publish provider-specific complaints?
2.6 We consider there are a range of measures that are useful to consumers in terms of
understanding service quality. Since April 2011 we have published quarterly residential
Ofcom complaints data by provider. Complementary to this report, we have also, since
2009, regularly published research on ‘customer service satisfaction’ on a provider-specific
basis. The latest research was published as part of Ofcom’s ‘Comparing Service Quality’
report in May 2018.10 That report includes additional consumer research and other metrics,
broken down by service and provider, showing, for example, general levels of consumer
satisfaction, satisfaction with reliability and satisfaction with complaints handling.
2.7 The ADR schemes that Ofcom approves, Communications and Internet Services
Adjudication Scheme (CISAS) and Ombudsman Services: Communications (OS), also publish
quarterly complaints information regarding their member CPs that have a market share
over 1.5%.11
2.8 The publication of performance data is consistent with our statutory duty relating to
transparency and our obligations as a public authority. Moreover, it is in line with our
principal duty to further the interests of citizens and consumers, where appropriate by
promoting competition. Consumer information plays a critical role in ensuring that
competitive communications markets work for consumers. The absence of information can
lead to poor purchasing decisions. Therefore, if information is not readily available or is
unclear, there may be a case for Ofcom to intervene in the interests of consumers. Under
section 26 of the Communications 2003, we have a duty to arrange for the publication of
such information and advice as appears to us to be appropriate to make available to
consumers.12
2.9 We recognise that there is no single source of information that can give consumers a full
picture of the relative performance of different providers. In addition, different service
features will matter more for some consumers than for others. Ofcom research suggests
that, for many consumers, comparative price and network performance information is of
primary importance. In light of this, we have ensured that consumers have improved
9 Information on any investigation we launch as a result of complaints to Ofcom can be found in the enforcement bulletin http://stakeholders.ofcom.org.uk/enforcement/competition-bulletins/ 10 See The 2018 Comparing Service Quality - May 2018. 11 See https://www.cedr.com/cisas/quarterly-case-data/ and https://www.ombudsman-services.org/for-consumers/complaints-data 12 Having regard to the need to exclude confidential information from publication. For the reasons set out here, Ofcom considers that, having had that regard, publication of the information in this report is appropriate.
6
information available in these areas. Examples include publication of broadband speeds
research,13 mobile coverage maps,14 and our scheme for accrediting price comparison
calculators.15
2.10 In addition, the publication of provider-specific complaints data may act as an incentive for
providers to improve their performance.16 Similar information is also available to guide
consumers in a number of other sectors, including, for example, financial services.17
2.11 We believe that our complaints data, along with other information,18 can be useful for
consumers seeking to compare providers.19 We also observe that the data is of interest to
intermediaries such as consumer groups, journalists and price comparison services who
advise consumers.
2.12 Taking the above into consideration, we consider that the objectives of publishing this
report are to:
• ensure transparency of data;
• further the interests of citizens and consumers by providing them with information
that will help them facilitate and take advantage of a competitive market; and
• incentivise improved provider performance.
2.13 Further information about the methodology for compiling the complaints data, including
how we account for the variation in size of provider, limitations of the data and how we
record complaints about bundled services, can be found in Annex 1.
13 Available at: https://www.ofcom.org.uk/research-and-data/telecoms-research/broadband-research/broadband-speeds 14 http://maps.ofcom.org.uk/check-coverage/ 15 See: https://www.ofcom.org.uk/consultations-and-statements/category-2/price-calculator-accreditation 16 See the responses of key consumer groups to Ofcom’s consultation on complaints handling procedures at: http://stakeholders.ofcom.org.uk/consultations/complaints_procedures/?showResponses=true 17 http://www.fca.org.uk/consumers/complaints-and-compensation/complaints-data 18 For example, information on price, speed, coverage, contract terms and so on. 19 In the Statement for our Review of Complaints Procedures, we said that publishing complaints data would likely benefit consumers in respect of price, quality and value for money. We also noted that there are a number of ways for such information to be made public. See: http://stakeholders.ofcom.org.uk/consultations/complaints_procedures/statement/
7
3. Trend data
Introduction
3.1 This section sets out our trend data20 on residential consumer complaints received by
Ofcom across landline, fixed broadband, pay-monthly mobile and pay TV services, by CP.21
3.2 In general, the data is presented on a quarterly basis from Q2 (April to June) 2016 to Q1
(January to March) 2018 inclusive.22 Only providers who meet the current generally applied
criterion for inclusion (having a market share of 1.5% of more in the relevant market) are
included in the report. The information is presented per 100,000 subscribers for the period
covered.23
3.3 An interactive tool which accompanies this report has now been updated to include this Q1
2018 data.24 It allows readers to easily search for the data they want to find (for instance by
service or provider), and to make comparisons across different providers.
20 The industry averages are limited to those providers included in the report. All complaints data is sourced from Ofcom’s Consumer Contact Team. 21 As detailed in our Q2 2014 report, we have determined that the current complaint ratios for pay-as-you-go (PAYG) mobile services are so small that they are unable to provide meaningful comparisons. As of the Q3 2017 report, given the lack of change in the PAYG results, we have removed the PAYG trend data but it is still accessible in the csv file that accompanies this report https://www.ofcom.org.uk/research-and-data/multi-sector-research/telecoms-complaints-data 22 Figure 1 shows complaint volumes dating further back to: Q4 (October – December) 2010 for fixed broadband and fixed line services, Q2 (April – June) 2011 for pay-monthly mobile services; and Q4 (October – December) 2011 for pay-TV services. 23 Operators use different methodologies to compile their subscriber figures. As a result, their performances in quarters where they were the subject of similar numbers of complaints may be comparable. Ofcom carries out sensitivity checks on the data and reports on this in the quarter concerned. These points are explained further in Annex 1. Consumers considering the data in the trends graphs in figures 2, 3, 4 and 5 below may also wish, therefore, to consult Ofcom’s complaints reports for relevant quarter(s) and to see the section entitled ‘Complaints as proportion of subscribers’ on pages 17-18 of this report, which explain Ofcom’s approach. 24 https://www.ofcom.org.uk/research-and-data/multi-sector-research/telecoms-complaints-data
8
Relative complaints by service sector
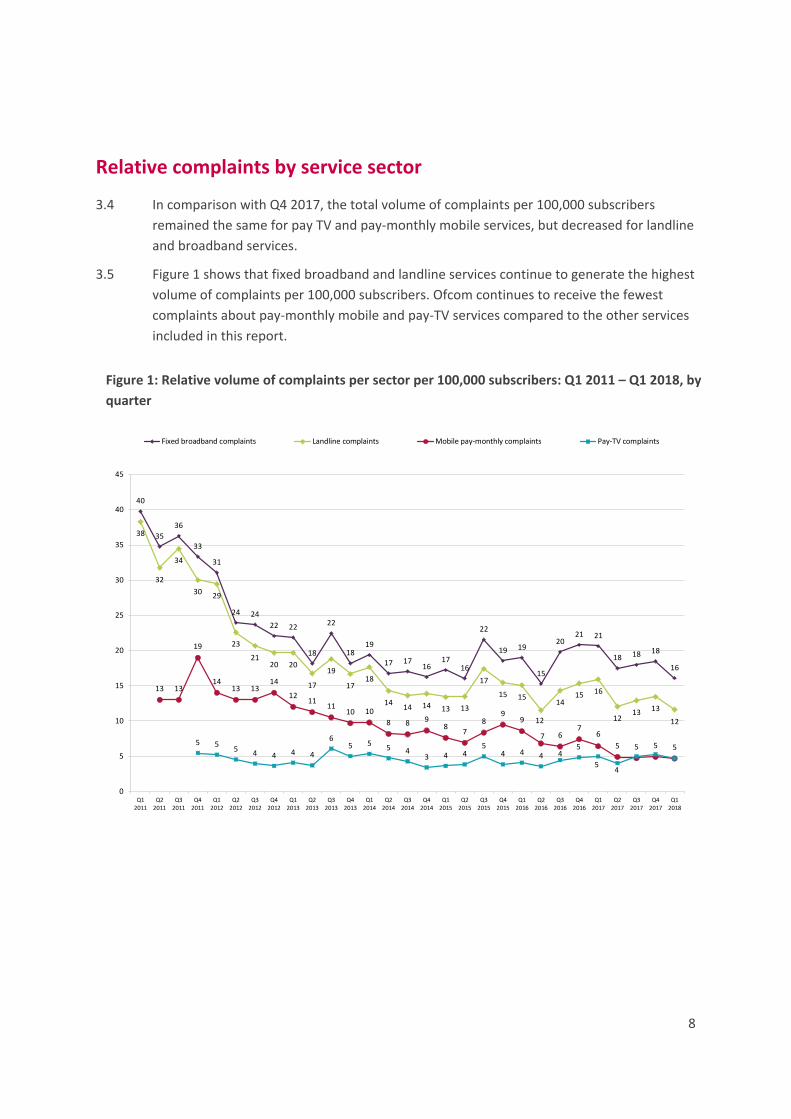
3.4 In comparison with Q4 2017, the total volume of complaints per 100,000 subscribers
remained the same for pay TV and pay-monthly mobile services, but decreased for landline
and broadband services.
3.5 Figure 1 shows that fixed broadband and landline services continue to generate the highest
volume of complaints per 100,000 subscribers. Ofcom continues to receive the fewest
complaints about pay-monthly mobile and pay-TV services compared to the other services
included in this report.
40
35
36
33
31
24 24
22 22
18
22
1819
17 1716
1716
22
19 19
15
2021 21
18 18 18
16
38
32
34
30 29
23
2120 20
17
19
1718
1414 14 13 13
17
15 15
12
1415 16
1213 13
12
13 13
19
1413 13
14
1211
1110 10
8 8 98
7
89
9
7 67
6
5 5 5 55 5
54 4 4 4
65 5
5 43 4 4
54 4 4 4
5
54
0
5
10
15
20
25
30
35
40
45
Q12011
Q22011
Q32011
Q42011
Q12012
Q22012
Q32012
Q42012
Q12013
Q22013
Q32013
Q42013
Q12014
Q22014
Q32014
Q42014
Q12015
Q22015
Q32015
Q42015
Q12016
Q22016
Q32016
Q42016
Q12017
Q22017
Q32017
Q42017
Q12018
Fixed broadband complaints Landline complaints Mobile pay-monthly complaints Pay-TV complaints
Figure 1: Relative volume of complaints per sector per 100,000 subscribers: Q1 2011 – Q1 2018, by
quarter
9
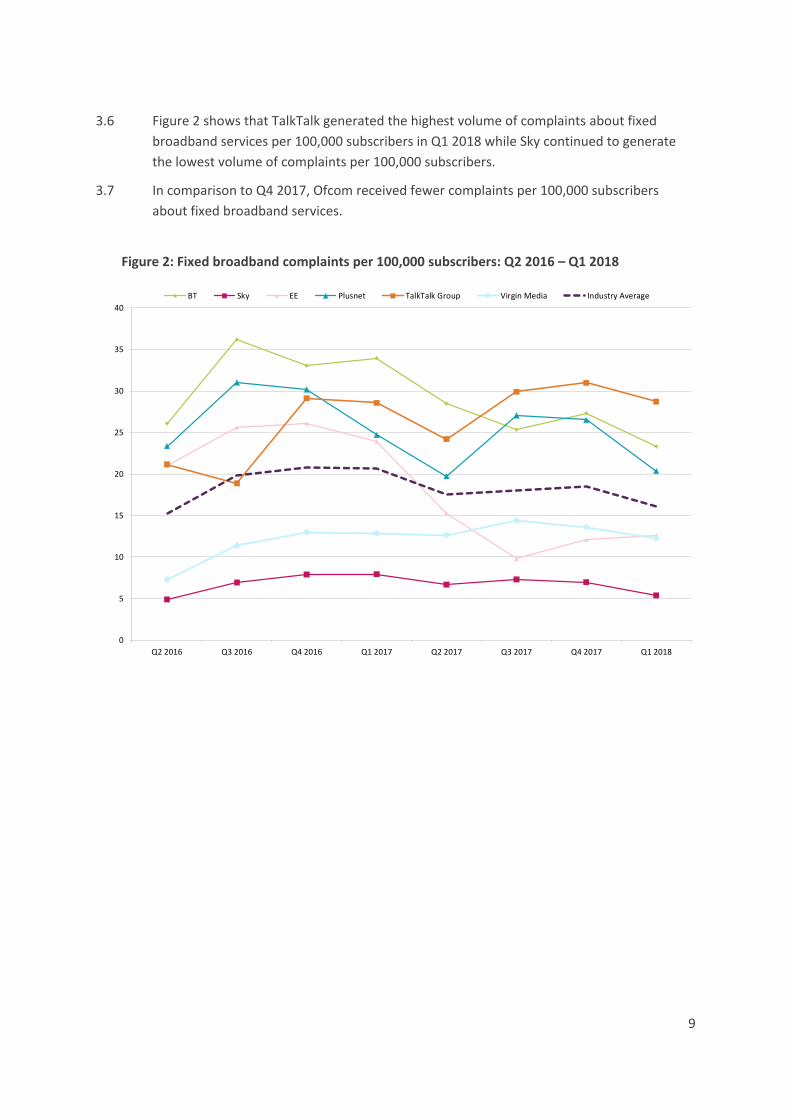
3.6 Figure 2 shows that TalkTalk generated the highest volume of complaints about fixed
broadband services per 100,000 subscribers in Q1 2018 while Sky continued to generate
the lowest volume of complaints per 100,000 subscribers.
3.7 In comparison to Q4 2017, Ofcom received fewer complaints per 100,000 subscribers
about fixed broadband services.
0
5
10
15
20
25
30
35
40
Q2 2016 Q3 2016 Q4 2016 Q1 2017 Q2 2017 Q3 2017 Q4 2017 Q1 2018
BT Sky EE Plusnet TalkTalk Group Virgin Media Industry Average
Figure 2: Fixed broadband complaints per 100,000 subscribers: Q2 2016 – Q1 2018
10
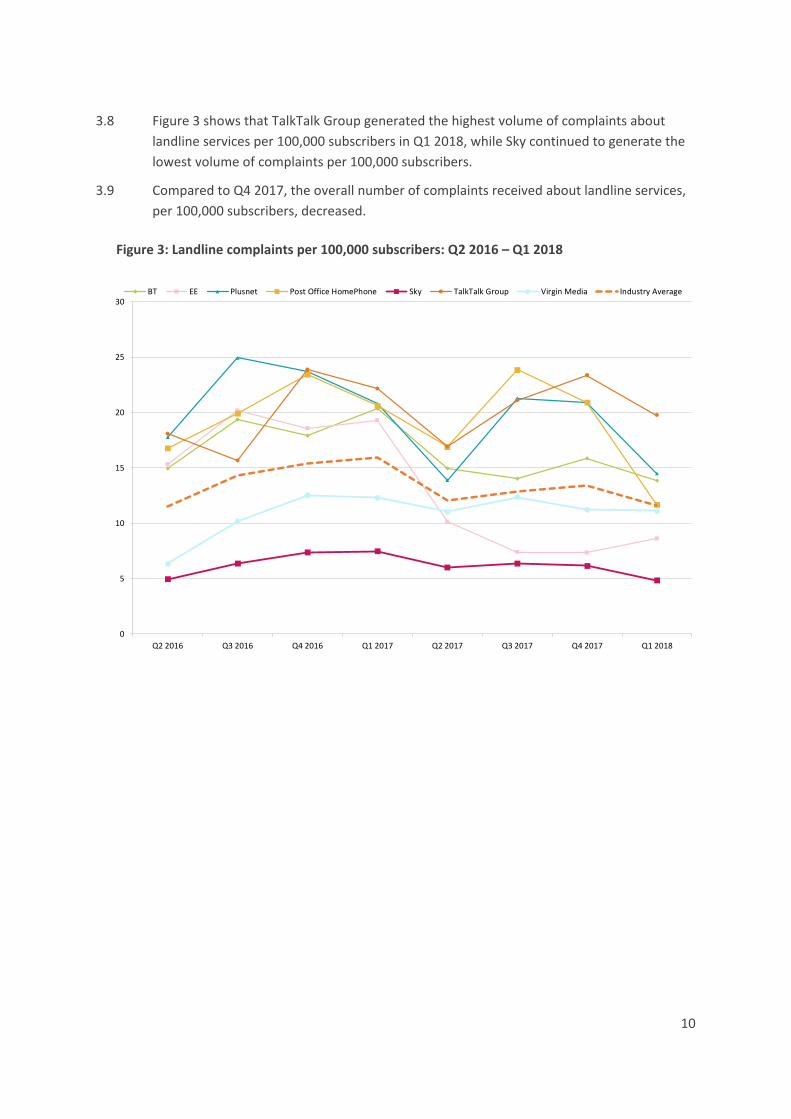
3.8 Figure 3 shows that TalkTalk Group generated the highest volume of complaints about
landline services per 100,000 subscribers in Q1 2018, while Sky continued to generate the
lowest volume of complaints per 100,000 subscribers.
3.9 Compared to Q4 2017, the overall number of complaints received about landline services,
per 100,000 subscribers, decreased.
0
5
10
15
20
25
30
Q2 2016 Q3 2016 Q4 2016 Q1 2017 Q2 2017 Q3 2017 Q4 2017 Q1 2018
BT EE Plusnet Post Office HomePhone Sky TalkTalk Group Virgin Media Industry Average
Figure 3: Landline complaints per 100,000 subscribers: Q2 2016 – Q1 2018
11
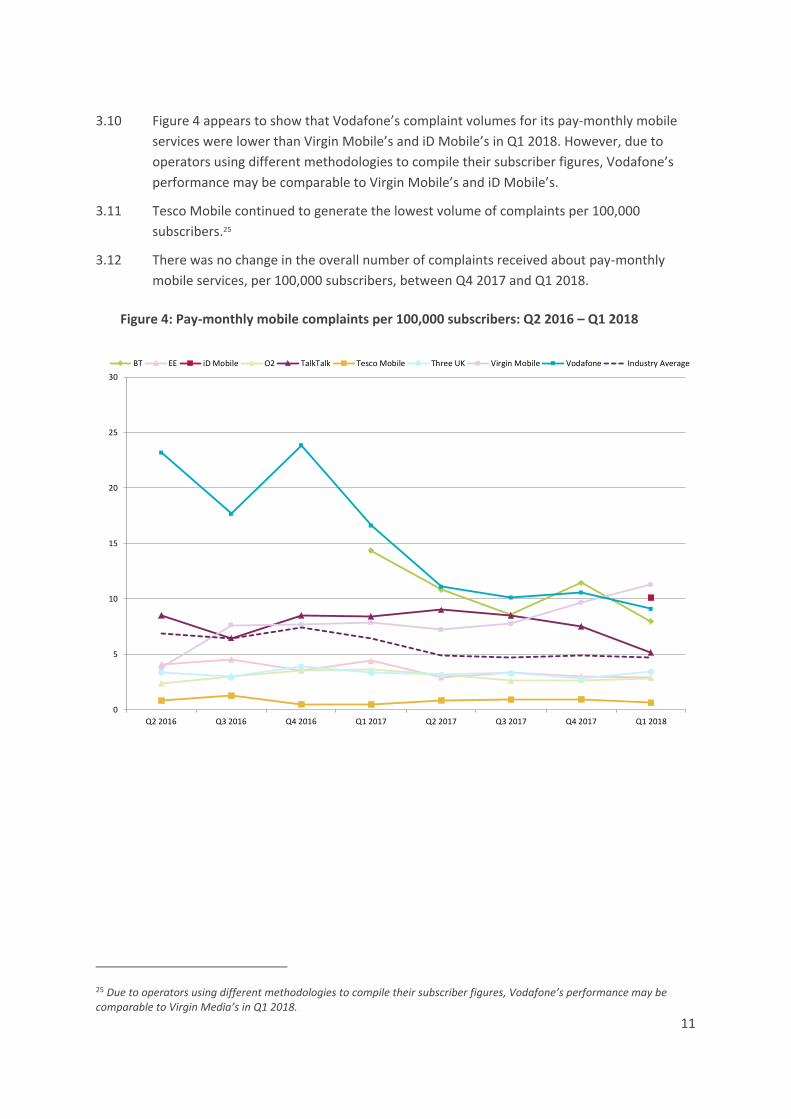
3.10 Figure 4 appears to show that Vodafone’s complaint volumes for its pay-monthly mobile
services were lower than Virgin Mobile’s and iD Mobile’s in Q1 2018. However, due to
operators using different methodologies to compile their subscriber figures, Vodafone’s
performance may be comparable to Virgin Mobile’s and iD Mobile’s.
3.11 Tesco Mobile continued to generate the lowest volume of complaints per 100,000
subscribers.25
3.12 There was no change in the overall number of complaints received about pay-monthly
mobile services, per 100,000 subscribers, between Q4 2017 and Q1 2018.
25 Due to operators using different methodologies to compile their subscriber figures, Vodafone’s performance may be comparable to Virgin Media’s in Q1 2018.
0
5
10
15
20
25
30
Q2 2016 Q3 2016 Q4 2016 Q1 2017 Q2 2017 Q3 2017 Q4 2017 Q1 2018
BT EE iD Mobile O2 TalkTalk Tesco Mobile Three UK Virgin Mobile Vodafone Industry Average
Figure 4: Pay-monthly mobile complaints per 100,000 subscribers: Q2 2016 – Q1 2018
12
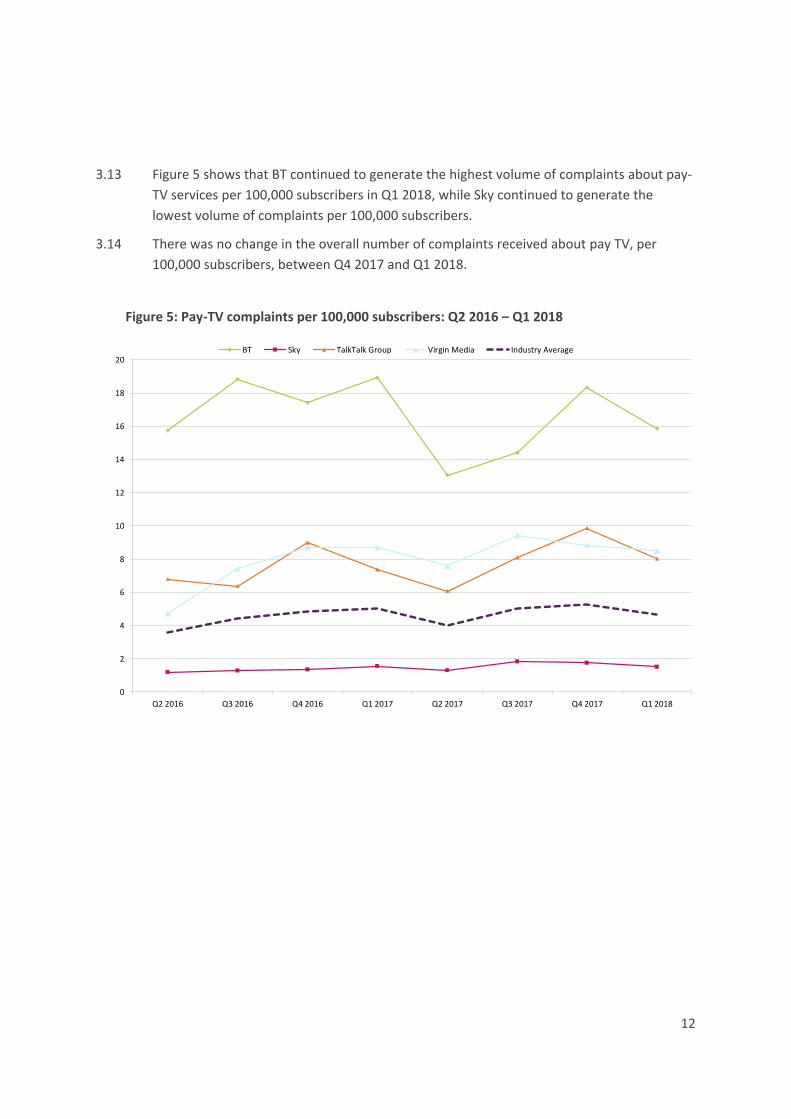
3.13 Figure 5 shows that BT continued to generate the highest volume of complaints about pay-
TV services per 100,000 subscribers in Q1 2018, while Sky continued to generate the
lowest volume of complaints per 100,000 subscribers.
3.14 There was no change in the overall number of complaints received about pay TV, per
100,000 subscribers, between Q4 2017 and Q1 2018.
0
2
4
6
8
10
12
14
16
18
20
Q2 2016 Q3 2016 Q4 2016 Q1 2017 Q2 2017 Q3 2017 Q4 2017 Q1 2018
BT Sky TalkTalk Group Virgin Media Industry Average
Figure 5: Pay-TV complaints per 100,000 subscribers: Q2 2016 – Q1 2018
13
A1. Telecoms and pay-TV complaints detailed methodology
Introduction
A1.1 Consumers, both residential and business, can contact Ofcom with complaints or enquiries
over the phone, by letter or through one of the dedicated complaint submission forms on
our website.26 All complaints27 are logged in the same database by Ofcom’s Consumer
Contact Team (CCT), providing a record of the total complaints that Ofcom has received, as
well as details on the services affected and the providers of those services.
A1.2 In this Annex, we outline key elements of the approach we take to the publication of our
complaints data.
Limitations
A1.3 When considering the information in this report, readers should note a number of
important limitations that apply to the complaints information we publish. In particular:
• The data only covers complaints that consumers have chosen to report to Ofcom, and
does not represent complaints consumers may have made directly to their providers or
to other agencies (e.g. Alternative Dispute Resolution schemes). As such it only
provides a partial picture of complaints relating to any provider.
• The complaints data reflects the views of consumers as reported to Ofcom and the way
we record them. Ofcom has sought to ensure that its data is sound but has not checked
the veracity of individual complaints.
• Contact with Ofcom may reflect the relative (lack of) quality of complaints handling
services, as well as the quality of service received. Given this, companies with poor
complaints handling processes may feature more prominently than those with good
complaints handling processes.
• Ofcom may see spikes in call volumes from customers of certain providers when we
publicise certain types of enforcement action (e.g. investigations, fines).
• Bigger performance fluctuations are likely for smaller operators compared to larger
operators because of the smaller numbers of subscribers against which complaints are
measured for these operators. This should be taken into account when observing
shorter term movements in the data.
26 Refer to: https://www.ofcom.org.uk/complain-to-ofcom 27 A complaint is an expression of dissatisfaction made by a customer related to the communications provider’s services, or to the complaint-handling process itself. Where the complaint is made to Ofcom over the phone, the consumer is asked whether their call is about an enquiry or complaint.
14
Scope of the data published
A1.4 We collect complaints data across a wide range of services - broadcasting, spectrum,
telecoms and post.28
A1.5 The focus of this publication is complaints made by residential29 consumers in relation to
landline, fixed broadband, pay-monthly mobile telephony and pay TV services.
A1.6 Consumers complain to Ofcom about a wide range of issues30 so we have considered
carefully the way we record complaints and what level of data would be useful and robust
enough for publication. In any particular call to Ofcom, or other contact with us, a
consumer may complain about one or more separate matters. If they complain about two
separate matters (e.g. billing and complaint handling) relating to one service (e.g. fixed
broadband), we record that as two complaints. Where they complain about more than two
matters, we generally record only the two most serious ones per service unless it is not
possible to determine this through discussion with the consumer (e.g. the contact is made
by letter) or the consumer insists on all their complaints being logged. Complainants raising
more than two matters relating to the same service account for around 1% or less of total
complainants in each sector. In general, we record up to two complaints per service per
contact. An average of 1.6 complaints were recorded per consumer contact with Ofcom in
2016.
A1.7 In view of the complexity of some of the data, our current position is that we should only
publish complaints data by service rather than by detailed category of complaint for each
service.
A1.8 The four services31 covered in this publication are:
• Fixed broadband – which includes copper-based ADSL services, cable services and fibre
services;
• Pay-monthly mobile services;32
• Landline - includes complaints against companies that offer both line rental and calls as
well as those that supply calls only services; and
• Pay TV - includes complaints relating to access to the service but does not include the
content delivered over the pay-TV service. This category includes services provided
through cable, satellite, digital terrestrial television or over a dedicated broadband
connection.
28 We publish complaints about the content of programmes broadcast on television by provider in our Broadcasting Bulletins. Spectrum complaints cannot be reported in more detail as the majority of complaints are about interference and as such are not provider specific. 29 Ofcom records business and residential telecoms complaints separately, based on how the individual identifies themselves when reporting the complaint. 30 We currently record over 159 different categories of telecoms complaints. 31 See footnote 24 32 Mobile pay-monthly services will include complaints about use of data through a mobile handset but do not include dongles or datacards.
15
A1.9 For reference, landline can be provided as a combined calls and line rental service or as a
call only service. As both services can generate landline complaints, Ofcom considers it is
appropriate for consumers for them both to be included in the customer base used here.
Complaints about bundled services
A1.10 Many consumers choose to purchase a bundle of services from one provider (for example,
landline with a fixed broadband service). Any issues that subsequently arise may affect one
or more of those services and this influences how a complaint may be recorded by us.
A1.11 The approach we take when recording complaints received from consumers who take a
bundle of services from a provider is as follows:
• If the complaint only relates to one of the services in the bundle, the complaint is
recorded against that single service only. For example, if a consumer has fixed line
telephony and fixed broadband as part of a bundle and complains about slow
broadband speeds, the complaint would be logged against the broadband service only
as it is this aspect of the service that is causing the problem.
• If the complaint is about an issue that affects a number of services in a bundle, the
complaint is recorded against each affected service for that provider. For example, if a
consumer complains about being mis-sold a triple play service, the complaint will be
counted as a fixed telephony, fixed broadband and as a pay-TV complaint for that
provider.
A1.12 This approach enables us to have a record of all complaints received by provider and by
service. Also, as we are publishing total complaints by provider for each service, but not
across the services in aggregate, the complaints are not double counted.
Complaints about transfers to unknown providers
A1.13 If a consumer is unexpectedly told by their existing provider that a request has been made
to transfer their service to another provider, they may complain to Ofcom without knowing
the name of the new provider.33 In these circumstances Ofcom refers the case to
Openreach to find out recent activity on the line, including applications to transfer and
completed transfers. If a request for a transfer has been made by another provider, the
complaint is recorded against that other provider. If no request for a transfer has been
made, then the complaint is recorded against the existing provider.
33 Their existing provider may not have visibility of the new provider either, and may only be aware that a request has been made to take over the service.

16
Focus on the largest providers
A1.14 Ofcom records complaints received by it against any provider in the UK. The size of each
individual provider varies greatly, as does the number of complaints received. As a result,
to ensure that this report covers as many providers as reasonably practicable, we adopt a
criterion to help us decide which providers are included in the report.
A1.15 Specifically, following a review,34 from Q2 2014 onwards this report now generally includes
complaints data35 for those providers which, for the service being reported, have a stable
market share of 1.5% or more in the relevant market.36 A provider will generally37 be
removed from the report if, from Q2 2014 onward, its market share has dropped below
1.5% for four consecutive quarters.38
A1.16 For providers included in the reporting for periods before Q2 2014, we have not
retrospectively adjusted the previous generally applied publication criteria for inclusion
(i.e. having a 4% market share and regular generation of at least 30 complaints per month).
Therefore, the previous criteria still apply to those reports.
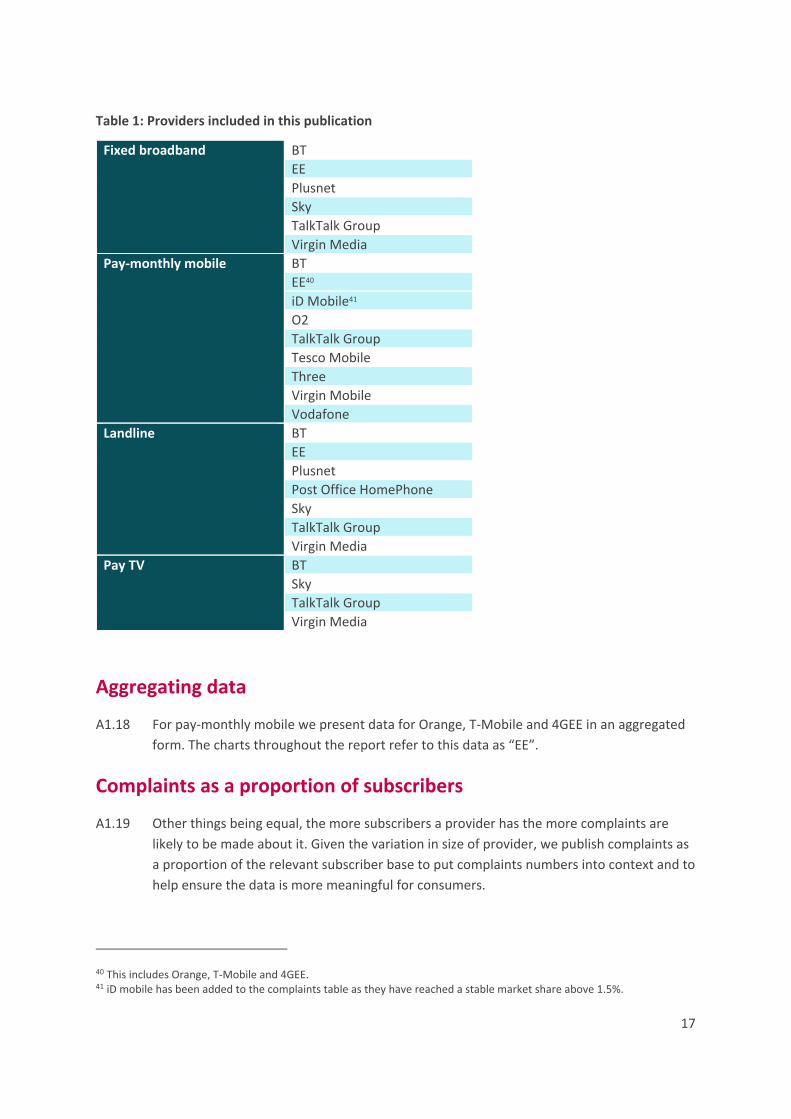
A1.17 The current scope of the report encompasses the providers set out in Table 1 below.
Together, these providers account for at least 90% of each market covered.39
34 For publications up to, and including, Q1 2014, providers were generally included in the report if they had a relevant market share of 4% and regularly generated more than 30 complaints per month. See our Q2 2014 report for further detail. 35 In the absence of exceptional circumstances, in which, should they apply, we may take a different approach. 36 From time to time, new providers may join the group of those whose market share is above 1.5%. New providers will generally be added to the report after a period in which their market share has consistently been above that mark such that it should be considered a stable market share above that threshold. 37 In the absence of exceptional circumstances. 38 Ofcom is aware that TalkTalk has ceased offering new mobile pay-monthly contracts. Ofcom will continue to monitor TalkTalk Mobile’s market share for forthcoming quarterly reports and will, if appropriate, remove it from the report in due course. 39 At least 90% of market for fixed lines, 97% for fixed broadband, 97% for pay-monthly mobile telephony and 90% for pay TV.
17
Table 1: Providers included in this publication
Fixed broadband BT
EE
Plusnet
Sky
TalkTalk Group
Virgin Media
Pay-monthly mobile BT
EE40
iD Mobile41
O2
TalkTalk Group
Tesco Mobile
Three
Virgin Mobile
Vodafone
Landline BT
EE
Plusnet
Post Office HomePhone
Sky
TalkTalk Group
Virgin Media
Pay TV BT
Sky
TalkTalk Group
Virgin Media
Aggregating data
A1.18 For pay-monthly mobile we present data for Orange, T-Mobile and 4GEE in an aggregated
form. The charts throughout the report refer to this data as “EE”.
Complaints as a proportion of subscribers
A1.19 Other things being equal, the more subscribers a provider has the more complaints are
likely to be made about it. Given the variation in size of provider, we publish complaints as
a proportion of the relevant subscriber base to put complaints numbers into context and to
help ensure the data is more meaningful for consumers.
40 This includes Orange, T-Mobile and 4GEE. 41 iD mobile has been added to the complaints table as they have reached a stable market share above 1.5%.
18
A1.20 To achieve this, we use the number of subscribers42 provided to Ofcom by the operators in
question. We do not collect these returns for pay-TV providers and so, to calculate pay-TV
complaints per one-hundred thousand subscribers, we use customer data from the
providers own published investor reports. If they are not in the public domain we request
them from providers directly.
A1.21 We understand from providers that quarterly subscription data is more robust than
monthly data43 and therefore we use quarterly data to calculate the complaints data.
A1.22 While the subscriber figures provided to Ofcom are the most accurate ones available for
each provider, there are some differences in the methodologies which they use to compile
them. These differences mean that there may be instances where one provider has
reported a customer as being a residential user when another would not have. Ofcom has
carried out checks on the data in the report to ensure that it is accurate enough to be of
use to those seeking to compare providers. In instances where there is little material
difference between operator complaint levels, we treat their performances similarly.
Approach to provider subscriber figure adjustments
A1.23 Occasionally, providers re-submit their subscriber figures after publication of one of our
complaints reports. For example, where it finds the data it gave us was incorrect. If a
provider subsequently resubmits its subscriber figures, Ofcom will not usually adjust
historic data unless the discrepancy has a significant impact on the results.
The industry average line
A1.24 As an additional data point against which to measure the performance of each provider,
we include an industry average line. This shows the average number of complaints per
100,000 subscribers across all the providers included in the published data for each service.
It does not include smaller providers who generally have a market share lower than 1.5%.
42 Note that it is possible for an individual to have more than one subscription. 43 Particularly where the quarterly data is reported externally.