telecommunications - pulse modulation and … low-pass filter ..... 32 practical low-pass filter...
TRANSCRIPT

Telecommunications Communications Technologies
Pulse Modulation and Sampling (PAM / PWM / PPM)
Courseware Sample 39862-F0

Order no.: 39862-10 First Edition Revision level: 09/2016
By the staff of Festo Didactic
© Festo Didactic Ltée/Ltd, Quebec, Canada 2007 Internet: www.festo-didactic.com e-mail: [email protected]
Printed in Canada All rights reserved ISBN 978-2-89640-233-5 (Printed version) ISBN 978-2-89747-793-6 (CD-ROM) Legal Deposit – Bibliothèque et Archives nationales du Québec, 2007 Legal Deposit – Library and Archives Canada, 2007
The purchaser shall receive a single right of use which is non-exclusive, non-time-limited and limited geographically to use at the purchaser's site/location as follows.
The purchaser shall be entitled to use the work to train his/her staff at the purchaser’s site/location and shall also be entitled to use parts of the copyright material as the basis for the production of his/her own training documentation for the training of his/her staff at the purchaser’s site/location with acknowledgement of source and to make copies for this purpose. In the case of schools/technical colleges, training centers, and universities, the right of use shall also include use by school and college students and trainees at the purchaser’s site/location for teaching purposes.
The right of use shall in all cases exclude the right to publish the copyright material or to make this available for use on intranet, Internet and LMS platforms and databases such as Moodle, which allow access by a wide variety of users, including those outside of the purchaser’s site/location.
Entitlement to other rights relating to reproductions, copies, adaptations, translations, microfilming and transfer to and storage and processing in electronic systems, no matter whether in whole or in part, shall require the prior consent of Festo Didactic.
Information in this document is subject to change without notice and does not represent a commitment on the part of Festo Didactic. The Festo materials described in this document are furnished under a license agreement or a nondisclosure agreement.
Festo Didactic recognizes product names as trademarks or registered trademarks of their respective holders.
All other trademarks are the property of their respective owners. Other trademarks and trade names may be used in this document to refer to either the entity claiming the marks and names or their products. Festo Didactic disclaims any proprietary interest in trademarks and trade names other than its own.

© Festo Didactic 39862-10 III
Safety and Common Symbols
The following safety and common symbols may be used in this manual and on the equipment:
Symbol Description
DANGER indicates a hazard with a high level of risk which, if not avoided, will result in death or serious injury.
WARNING indicates a hazard with a medium level of risk which, if not avoided, could result in death or serious injury.
CAUTION indicates a hazard with a low level of risk which, if not avoided, could result in minor or moderate injury.
CAUTION used without the Caution, risk of danger sign , indicates a hazard with a potentially hazardous situation which, if not avoided, may result in property damage.
Caution, risk of electric shock
Caution, hot surface
Caution, risk of danger
Caution, lifting hazard
Caution, hand entanglement hazard
Notice, non-ionizing radiation
Direct current
Alternating current
Both direct and alternating current
Three-phase alternating current
Earth (ground) terminal
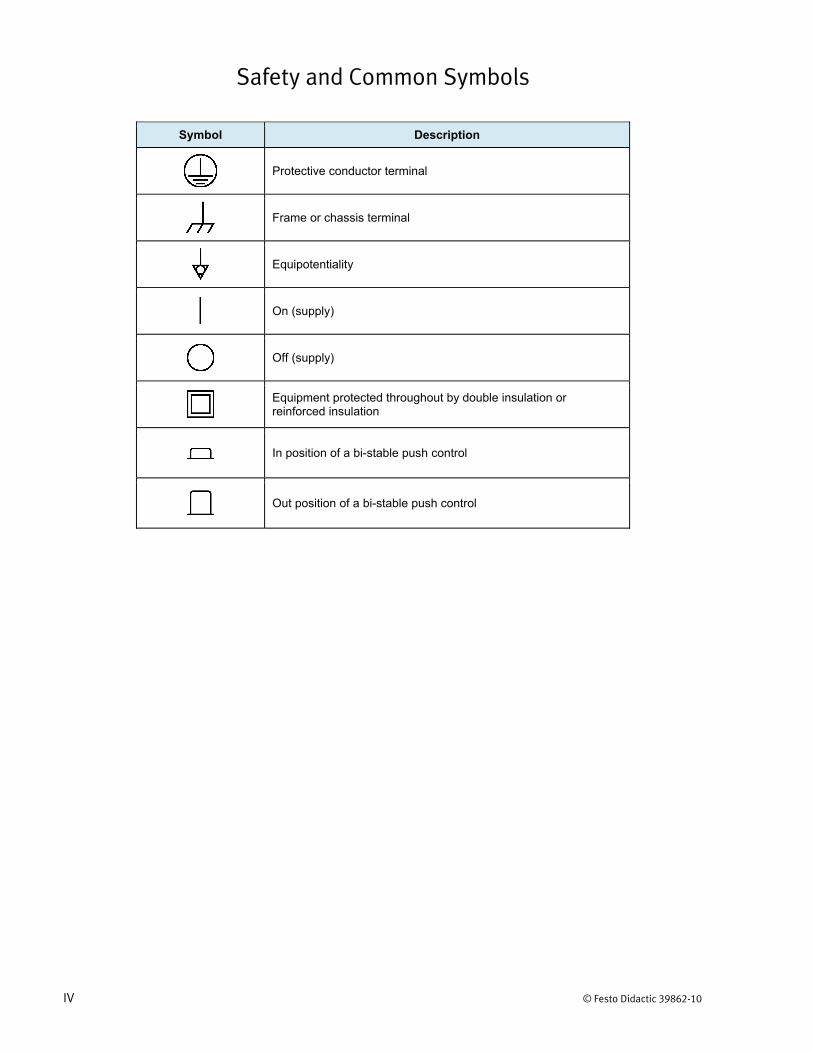
Safety and Common Symbols
IV © Festo Didactic 39862-10
Symbol Description
Protective conductor terminal
Frame or chassis terminal
Equipotentiality
On (supply)
Off (supply)
Equipment protected throughout by double insulation or reinforced insulation
In position of a bi-stable push control
Out position of a bi-stable push control
© Festo Didactic 39862-10 V
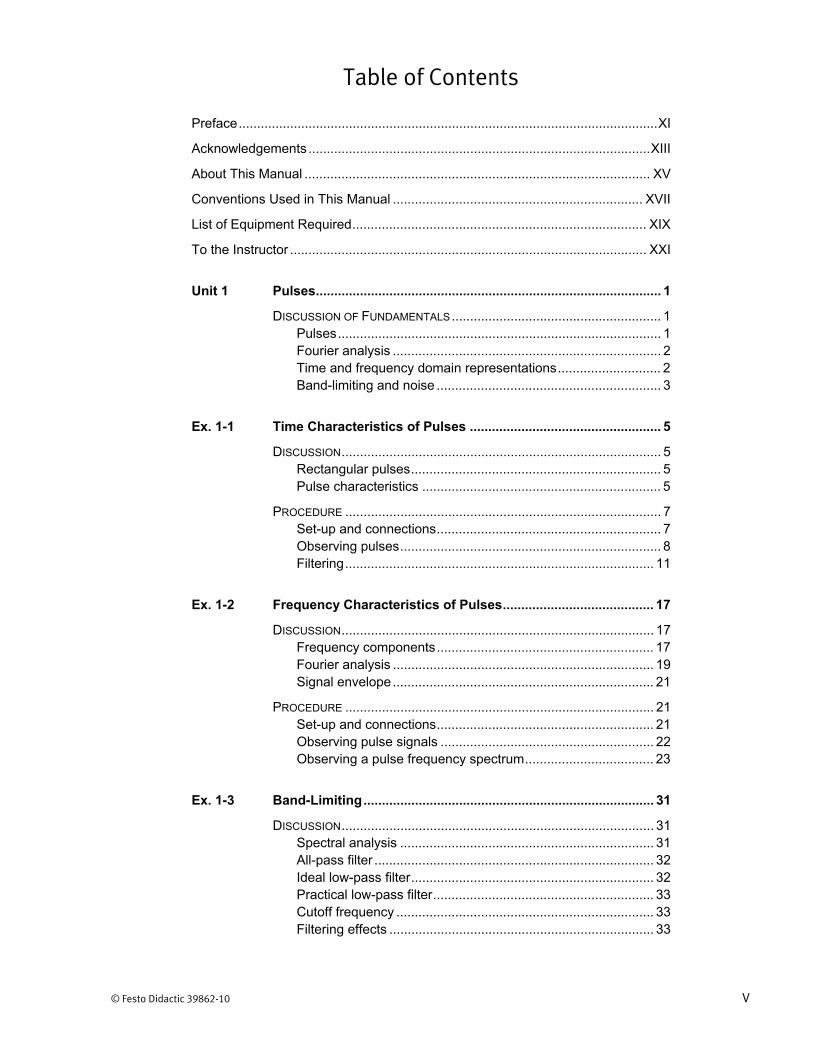
Table of Contents
Preface .................................................................................................................. XI
Acknowledgements ............................................................................................. XIII
About This Manual .............................................................................................. XV
Conventions Used in This Manual .................................................................... XVII
List of Equipment Required ................................................................................ XIX
To the Instructor ................................................................................................. XXI
Unit 1 Pulses .............................................................................................. 1
DISCUSSION OF FUNDAMENTALS ......................................................... 1Pulses ........................................................................................ 1Fourier analysis ......................................................................... 2Time and frequency domain representations ............................ 2Band-limiting and noise ............................................................. 3
Ex. 1-1 Time Characteristics of Pulses .................................................... 5
DISCUSSION ....................................................................................... 5Rectangular pulses .................................................................... 5Pulse characteristics ................................................................. 5
PROCEDURE ...................................................................................... 7Set-up and connections ............................................................. 7Observing pulses ....................................................................... 8Filtering .................................................................................... 11
Ex. 1-2 Frequency Characteristics of Pulses ......................................... 17
DISCUSSION ..................................................................................... 17Frequency components ........................................................... 17Fourier analysis ....................................................................... 19Signal envelope ....................................................................... 21
PROCEDURE .................................................................................... 21Set-up and connections ........................................................... 21Observing pulse signals .......................................................... 22Observing a pulse frequency spectrum ................................... 23
Ex. 1-3 Band-Limiting ............................................................................... 31
DISCUSSION ..................................................................................... 31Spectral analysis ..................................................................... 31All-pass filter ............................................................................ 32Ideal low-pass filter .................................................................. 32Practical low-pass filter ............................................................ 33Cutoff frequency ...................................................................... 33Filtering effects ........................................................................ 33

Table of Contents
VI © Festo Didactic 39862-10
PROCEDURE .................................................................................... 34Set-up and connections ........................................................... 34Observing a pulse signal ......................................................... 35Observing a pulse frequency spectrum ................................... 35Filtering in the frequency domain ............................................ 36Rise time .................................................................................. 41
Unit 2 Pulse Amplitude Modulation (PAM) ........................................... 53
DISCUSSION OF FUNDAMENTALS ....................................................... 53Pulse modulation ..................................................................... 53Nyquist rate ............................................................................. 53
Ex. 2-1 PAM Signals ................................................................................. 55
DISCUSSION ..................................................................................... 55Signal sampling ....................................................................... 55PAM signal generation ............................................................ 56Sampling rate .......................................................................... 57
PROCEDURE .................................................................................... 58Set-up and connections ........................................................... 58Sampling rates ......................................................................... 58Sampling modes and pulse width ............................................ 62
Ex. 2-2 Spectral Characteristics of PAM Signals .................................. 65
DISCUSSION ..................................................................................... 65Sampling .................................................................................. 65Aperture distortion ................................................................... 67
PROCEDURE .................................................................................... 68Set-up and connections ........................................................... 68Input signal spectrum .............................................................. 69PAM signal spectrum............................................................... 70Harmonics and replicas ........................................................... 74
Ex. 2-3 Aliasing and the Nyquist Rate .................................................... 81
DISCUSSION ..................................................................................... 81Sampling rate .......................................................................... 81Sampling Theorem .................................................................. 83
PROCEDURE .................................................................................... 85Set-up and connections ........................................................... 85Nyquist sampling rate – time domain ...................................... 85Nyquist sampling rate – frequency domain ............................. 90

Table of Contents
© Festo Didactic 39862-10 VII
Ex. 2-4 Pre-filtering ................................................................................... 95
DISCUSSION ..................................................................................... 95Pre-filtering .............................................................................. 95Practical limitations .................................................................. 95
PROCEDURE .................................................................................... 96Set-up and connections ........................................................... 96Pre-filtering .............................................................................. 97Dual input signals .................................................................... 99
Unit 3 Demodulating PAM Signals ...................................................... 109
DISCUSSION OF FUNDAMENTALS ..................................................... 109PAM demodulation ................................................................ 109Requirements for demodulation ............................................ 109
Ex. 3-1 PAM Signals Demodulation ...................................................... 111
DISCUSSION ................................................................................... 111Filtering .................................................................................. 111Aperture distortion ................................................................. 113
PROCEDURE .................................................................................. 114Set-up and connections ......................................................... 114PAM demodulation in the time domain ................................. 115PAM demodulation in the frequency domain ........................ 119
Ex. 3-2 Aliasing ....................................................................................... 125
DISCUSSION ................................................................................... 125Nyquist rate ........................................................................... 125Aliasing .................................................................................. 126
PROCEDURE .................................................................................. 127Set-up and connections ......................................................... 127PAM demodulation in the time domain ................................. 127PAM demodulation in the frequency domain ........................ 131
Unit 4 Pulse-Time Modulation (PWM / PPM) ....................................... 141
DISCUSSION OF FUNDAMENTALS ..................................................... 141PWM/PPM modulation ......................................................... 141PWM/PPM demodulation ..................................................... 143
Ex. 4-1 PWM and PPM Signal Modulation ............................................ 145
DISCUSSION ................................................................................... 145PWM/PPM generation .......................................................... 145Dynamic range ...................................................................... 146
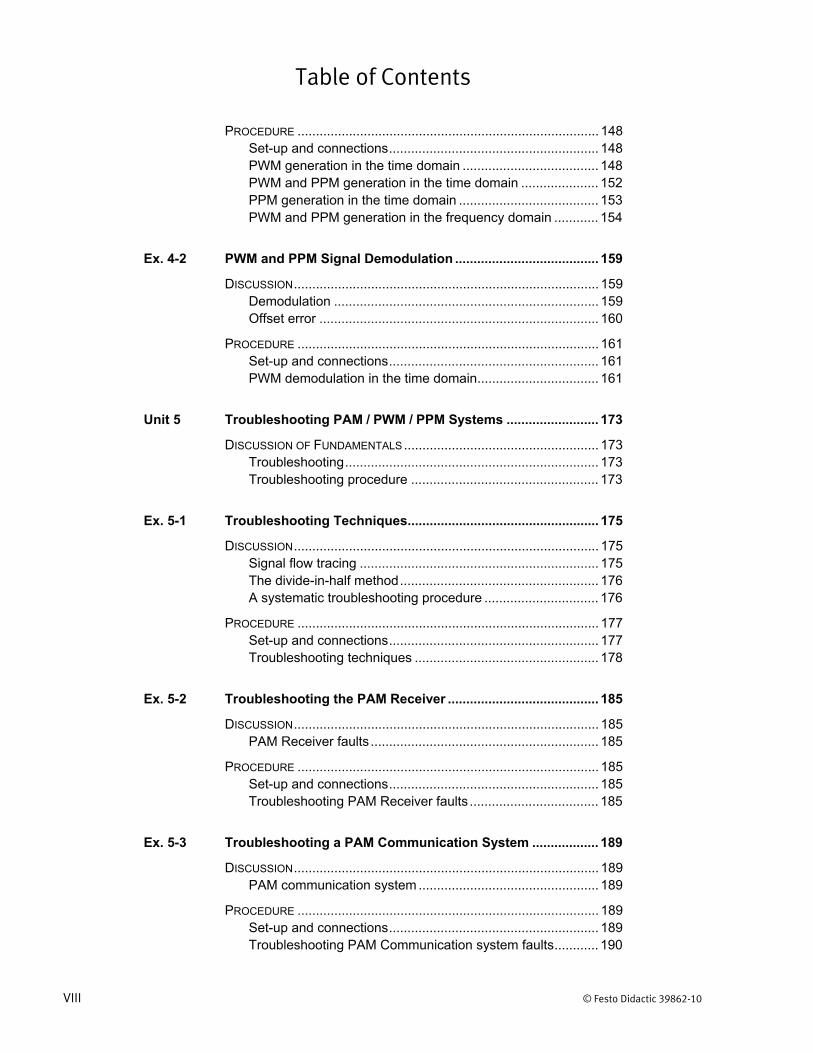
Table of Contents
VIII © Festo Didactic 39862-10
PROCEDURE .................................................................................. 148Set-up and connections ......................................................... 148PWM generation in the time domain ..................................... 148PWM and PPM generation in the time domain ..................... 152PPM generation in the time domain ...................................... 153PWM and PPM generation in the frequency domain ............ 154
Ex. 4-2 PWM and PPM Signal Demodulation ....................................... 159
DISCUSSION ................................................................................... 159Demodulation ........................................................................ 159Offset error ............................................................................ 160
PROCEDURE .................................................................................. 161Set-up and connections ......................................................... 161PWM demodulation in the time domain ................................. 161
Unit 5 Troubleshooting PAM / PWM / PPM Systems ......................... 173
DISCUSSION OF FUNDAMENTALS ..................................................... 173Troubleshooting ..................................................................... 173Troubleshooting procedure ................................................... 173
Ex. 5-1 Troubleshooting Techniques .................................................... 175
DISCUSSION ................................................................................... 175Signal flow tracing ................................................................. 175The divide-in-half method ...................................................... 176A systematic troubleshooting procedure ............................... 176
PROCEDURE .................................................................................. 177Set-up and connections ......................................................... 177Troubleshooting techniques .................................................. 178
Ex. 5-2 Troubleshooting the PAM Receiver ......................................... 185
DISCUSSION ................................................................................... 185PAM Receiver faults .............................................................. 185
PROCEDURE .................................................................................. 185Set-up and connections ......................................................... 185Troubleshooting PAM Receiver faults ................................... 185
Ex. 5-3 Troubleshooting a PAM Communication System .................. 189
DISCUSSION ................................................................................... 189PAM communication system ................................................. 189
PROCEDURE .................................................................................. 189Set-up and connections ......................................................... 189Troubleshooting PAM Communication system faults ............ 190
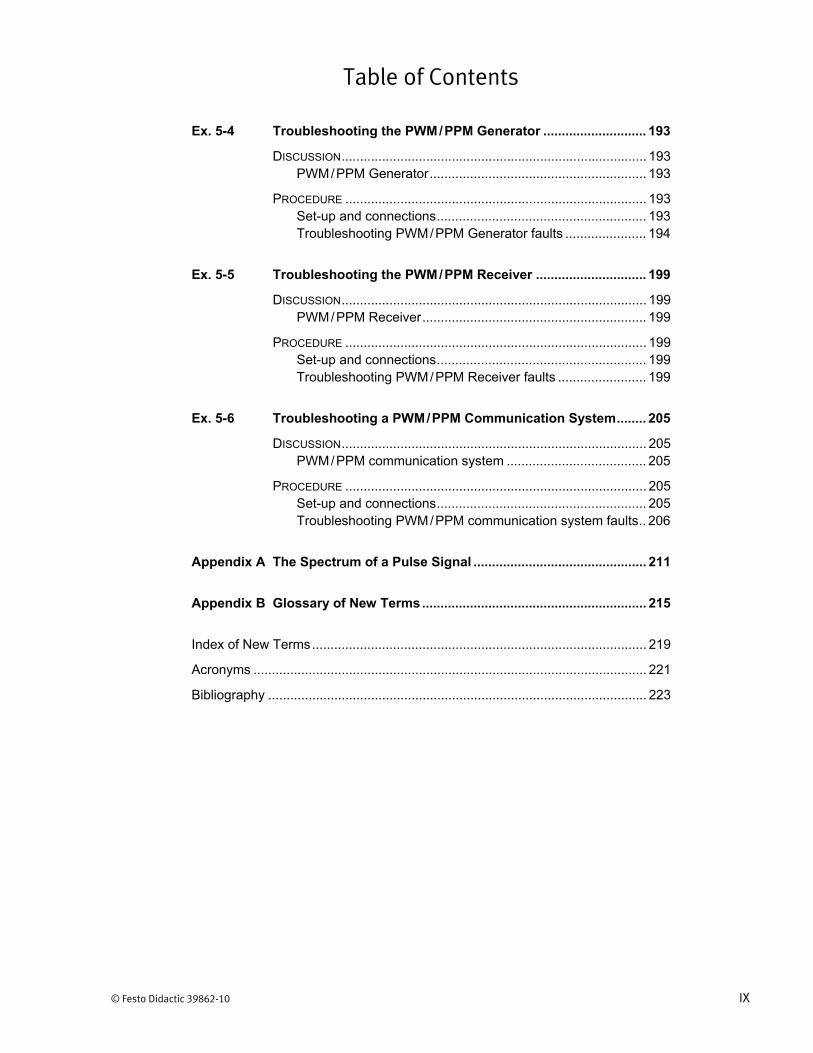
Table of Contents
© Festo Didactic 39862-10 IX
Ex. 5-4 Troubleshooting the PWM/PPM Generator ............................ 193
DISCUSSION ................................................................................... 193PWM/PPM Generator ........................................................... 193
PROCEDURE .................................................................................. 193Set-up and connections ......................................................... 193Troubleshooting PWM/PPM Generator faults ...................... 194
Ex. 5-5 Troubleshooting the PWM/PPM Receiver .............................. 199
DISCUSSION ................................................................................... 199PWM/PPM Receiver ............................................................. 199
PROCEDURE .................................................................................. 199Set-up and connections ......................................................... 199Troubleshooting PWM/PPM Receiver faults ........................ 199
Ex. 5-6 Troubleshooting a PWM/PPM Communication System ........ 205
DISCUSSION ................................................................................... 205PWM/PPM communication system ...................................... 205
PROCEDURE .................................................................................. 205Set-up and connections ......................................................... 205Troubleshooting PWM/PPM communication system faults .. 206
Appendix A The Spectrum of a Pulse Signal ............................................... 211
Appendix B Glossary of New Terms ............................................................. 215
Index of New Terms ........................................................................................... 219
Acronyms ........................................................................................................... 221
Bibliography ....................................................................................................... 223


© Festo Didactic 39862-10 XI
Preface
Digital communication offers so many advantages over analog communication that the majority of today’s communications systems are digital.
Unlike analog communication systems, digital systems do not require accurate recovery of the transmitted waveform at the receiver end. Instead, the receiver periodically detects which waveform is being transmitted, among a limited number of possible waveforms, and maps the detected waveform back to the data it represents. This allows extremely low error rates, even when the signal has been corrupted by noise.
The digital circuits are often implemented using application specific integrated circuits (ASIC) and field-programmable gate arrays (FPGA). Although this “system-on-a-chip” approach is very effective for commercial and military applications, the resulting systems do not allow access to internal signals and data and are therefore poorly suited for educational use. It is for this reason that we designed the Communications Technologies Training System.
The Communications Technologies Training System, Model 8087, is a state-of-the-art communications training system. Specially designed for hands-on training, it facilitates the study of many different types of digital modulation/demodulation technologies such as PAM, PWM, PPM, PCM, Delta Modulation, ASK, FSK, and BPSK as well as spectrally efficient technologies such as QPSK, QAM, and ADSL. The system also enables the study of direct-sequence and frequency-hopping spread spectrum (DSSS and FHSS), two key technologies used in modern wireless communication systems (CDMA cellular-telephony networks, Global Positioning System, Bluetooth interface for wireless connectivity, etc.) to implement code-division multiple access (CDMA), improve interference rejection, minimize interference with other systems, etc. The system is designed to reflect the standards commonly used in modern communications systems.
Unlike conventional, hardware-based training systems that use a variety of physical modules to implement different technologies and instruments, the Communications Technologies Training System is based on a Reconfigurable Training Module (RTM) and the Communications Technologies (LVCT) software, providing tremendous flexibility at a reduced cost.
Each of the communications technologies to be studied is provided as an application that can be selected from a menu. Once loaded into the LVCT software, the selected application configures the RTM to implement the communications technology, and provides a specially designed user interface for the student.
The LVCT software provides settings for full user control over the operating parameters of each communications technology application. Functional block diagrams for the circuits involved are shown on screen. The digital or analog signals at various points in the circuits can be viewed and analyzed using the virtual instruments included in the software. In addition, some of these signals are made available at physical connectors on the RTM and can be displayed and measured using conventional instruments.
The courseware for the Communications Technologies Training System consists of a series of student manuals covering the different technologies as well as instructor guides that provide the answers to procedure step questions and to

Preface
XII © Festo Didactic 39862-10
review questions. The Communications Technologies Training System and the accompanying courseware provide a complete study program for these key information-age technologies.
We invite readers of this manual to send us their tips, feedback, and suggestions for improving the book.
Please send these to [email protected].
The authors and Festo Didactic look forward to your comments.

© Festo Didactic 39862-10 XIII
Acknowledgements
We thank the following people for their participation in the development of the Communications Technologies Training System: Richard Tervo, Ph.D., P.Eng. from the University of New Brunswick, and John Ahern, M.Sc.A. and Marcel Pelletier, Ph.D. from Comlab Telecommunications Inc.

© Festo Didactic 39862-10 XV
About This Manual
Manual Objective
When you have completed this manual, you will be familiar with the principles of pulse modulation and sampling. You will be familiar with the time and frequency domain characteristics of pulses and with the three basic types of pulse modulation: PAM, PWM, and PPM.
Description
This Student Manual is divided into several units each of which covers one topic. Each unit begins with an Introduction presenting important background information. Following this are a number of exercises designed to present the subject matter in convenient instructional segments. In each exercise, principles and concepts are presented first followed by a step-by-step, hands-on procedure to complete the learning process.
Each exercise contains:
A clearly defined Exercise Objective
A Discussion Outline listing the main points presented in the Discussion
A Discussion of the theory involved
A Procedure Outline listing the main sections in the Procedure
A step-by-step Procedure in which the student observes and measures the important phenomena, including questions to help in understanding the important principles.
A Conclusion
Review Questions
a In this manual, all New Terms are defined in the Glossary of New Terms. In addition, an index of New Terms is provided at the end of this manual.
Safety considerations
Safety symbols that may be used in this manual and on the equipment are listed in the Safety Symbols table at the beginning of the manual.
Safety procedures related to the tasks that you will be asked to perform are indicated in each exercise.
Make sure that you are wearing appropriate protective equipment when performing the tasks. You should never perform a task if you have any reason to think that a manipulation could be dangerous for you or your teammates.
Systems of units
Units are expressed using the International System of Units (SI) followed by units expressed in the U.S. customary system of units (between parentheses).


© Festo Didactic 39862-10 XVII
Conventions Used in This Manual
Special character formats
New terms are shown in bold colored characters the first time they appear.
Important terms are shown in bold colored characters the first time they appear.
a Notes provide details that should be noted by the reader. b Tips provide information on effectively using the system. These are particularly helpful for inexperienced users.
c This symbol refers you to another manual or document.
Software commands and dialog box names are shown in color. “Choose File Print” means choose the Print command in the File menu.
Probe connections
Instrument probe connections to test points are usually presented in tables showing the type of probe to use, the test point (TP) to connect it to, and the signal present at that test point:
Probe Connect to Signal
Oscilloscope 1 TP1 AUDIO INPUT
Oscilloscope 2 TP2 Low-pass Filter output
Spectrum Analyzer TP2 Low-pass Filter output
System and instrument settings
Unless you are instructed to make specific settings, you can use any system and instrument settings that will allow you to observe the phenomena of interest. As a guide, important settings that were used to produce a figure may be shown beside the figure.
Colored sidebars contain complementary information that will be of interest to the reader.
Oscilloscope Settings: Channel 1 .......................... 500 mV/div Channel 2 ................................. 2 V/div Time Base ........................... 0.1 ms/div Slope .......................................... Rising Trigger Level ............................... 0.5 V Trigger Source ............................. Ch 2

© Festo Didactic 39862-10 XIX
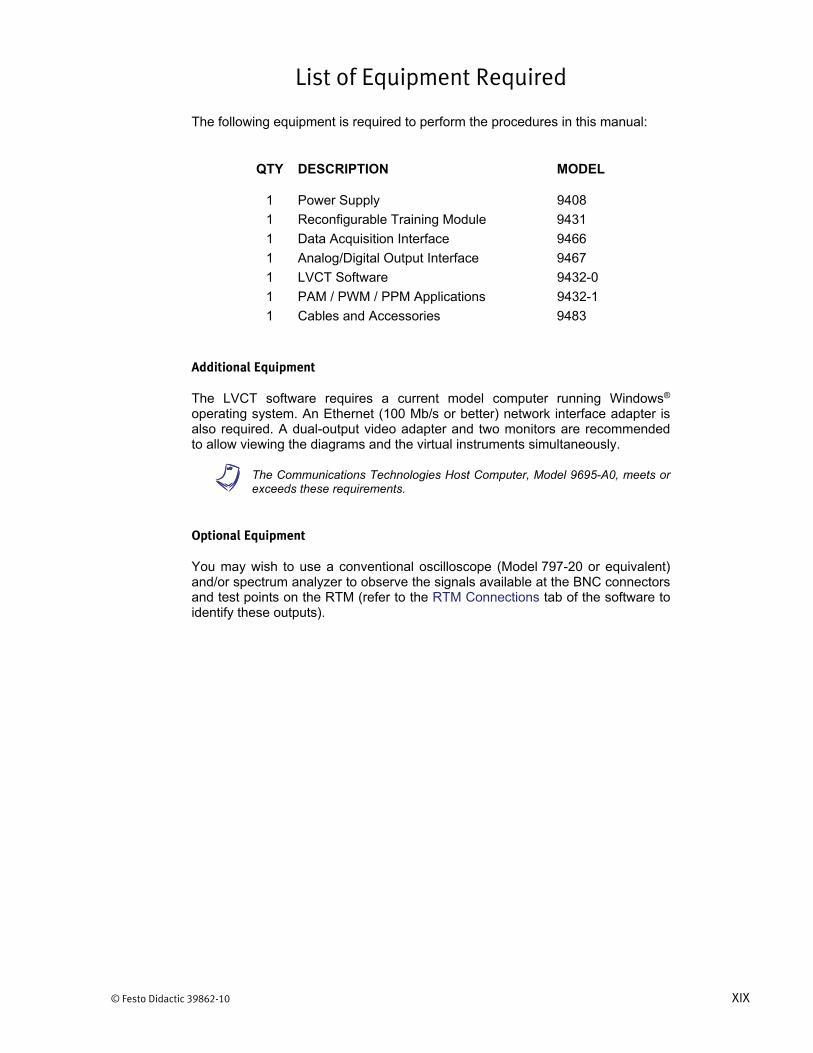
List of Equipment Required
The following equipment is required to perform the procedures in this manual:
QTY DESCRIPTION MODEL
1 Power Supply 9408 1 Reconfigurable Training Module 9431 1 Data Acquisition Interface 9466 1 Analog/Digital Output Interface 9467 1 LVCT Software 9432-0 1 PAM / PWM / PPM Applications 9432-1 1 Cables and Accessories 9483
Additional Equipment
The LVCT software requires a current model computer running Windows® operating system. An Ethernet (100 Mb/s or better) network interface adapter is also required. A dual-output video adapter and two monitors are recommended to allow viewing the diagrams and the virtual instruments simultaneously.
a The Communications Technologies Host Computer, Model 9695-A0, meets or exceeds these requirements.
Optional Equipment
You may wish to use a conventional oscilloscope (Model 797-20 or equivalent) and/or spectrum analyzer to observe the signals available at the BNC connectors and test points on the RTM (refer to the RTM Connections tab of the software to identify these outputs).

© Festo Didactic 39862-10 XXI
To the Instructor
You will find in this Instructor Guide all the elements included in the Student Manual together with the answers to all questions, results of measurements, graphs, explanations, suggestions, and, in some cases, instructions to help you guide the students through their learning process. All the information that applies to you is placed between markers and appears in red.
Accuracy of measurements
The numerical results of the hands-on exercises may differ from one student to another. For this reason, the results and answers given in this manual should be considered as a guide. Students who correctly performed the exercises should expect to demonstrate the principles involved and make observations and measurements similar to those given as answers.

Samples Exercises
Extracted from
the Student Manual
and the Instructor Guide


© Festo Didactic 39862-10 55
When you have completed this exercise, you will be familiar with the generation of both natural and flat-top sampled PAM signals. You will verify how the frequency and duty cycle of the sampling signal affect PAM signals as seen in the time domain.
The Discussion of this exercise covers the following points:
Signal sampling PAM signal generation Sampling rate
Signal sampling
In Pulse-Amplitude Modulation (PAM) a pulse signal is used to sample an analog signal. The result is a train of constant-width pulses. The amplitude of each pulse is proportional to the amplitude of the message signal at the time of sampling.
Figure 2-2 and Figure 2-3 show the time domain appearance of a PAM signal for a triangle wave message signal. In the figures you can see that the PAM signal is made up of small segments (samples) of the message signal. As shown in the figures, two types of sampling are possible. Figure 2-2 represents natural sampling while Figure 2-3 is the result obtained with flat-top sampling.
Figure 2-2. Natural sampling – time domain appearance of a PAM signal.
PAM Signals
Exercise 2-1
EXERCISE OBJECTIVE
DISCUSSION OUTLINE
DISCUSSION

Ex. 2-1 – PAM Signals Discussion
56 © Festo Didactic 39862-10
Figure 2-3. Flat-top sampling – time domain appearance of a PAM signal.
For a PAM signal produced with natural sampling, the sampled signal follows the waveform of the input signal during the time that each sample is taken. Flat-top sampling, however, produces pulses whose amplitude remains fixed during the sampling time. The amplitude value of the pulse depends on the amplitude of the input signal at the time of sampling.
PAM signal generation
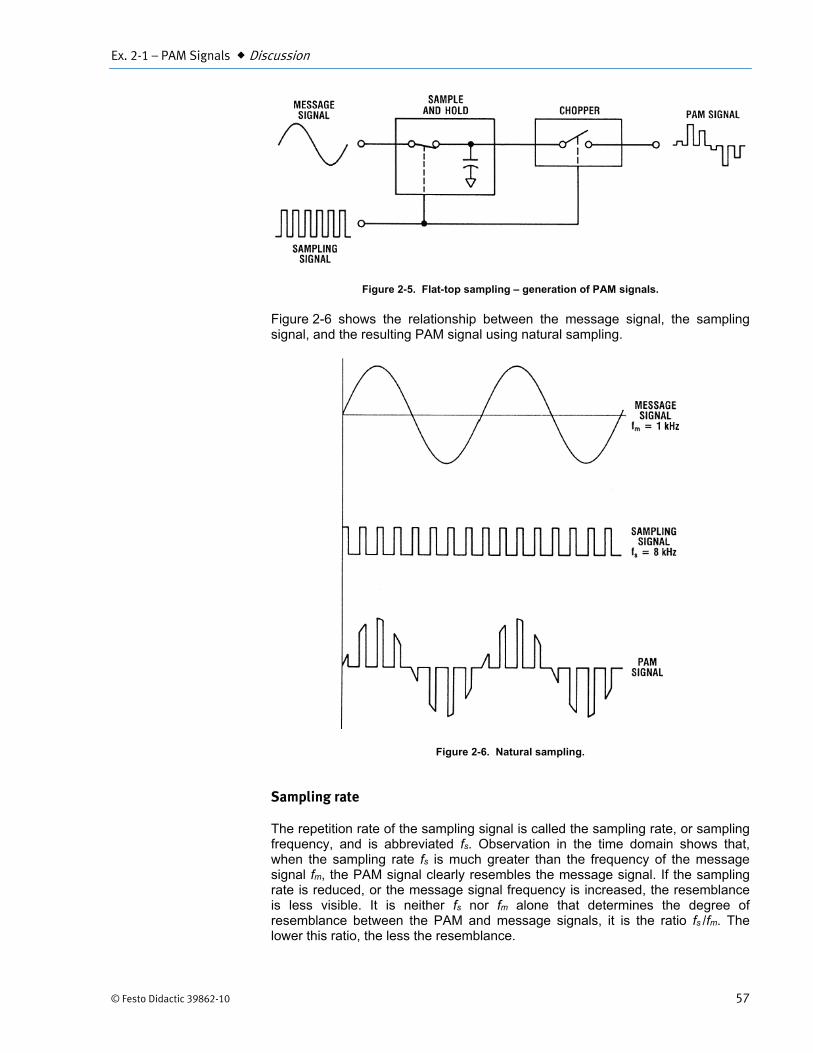
A PAM signal is generated by using a pulse train, called the sampling signal (or clock signal) to operate an electronic switch or "chopper". This produces samples of the analog message signal, as shown in Figure 2-4.
Figure 2-4. Natural sampling – generation of PAM signals.
The switch is closed for the duration of each pulse allowing the message signal at that sampling time to become part of the output. The switch is open for the remainder of each sampling period making the output zero. This type of sampling is called natural sampling.
For flat-top sampling, a sample-and-hold circuit is used in conjunction with the chopper to hold the amplitude of each pulse at a constant level during the sampling time, as shown in Figure 2-5.
Ex. 2-1 – PAM Signals Discussion
© Festo Didactic 39862-10 57
Figure 2-5. Flat-top sampling – generation of PAM signals.
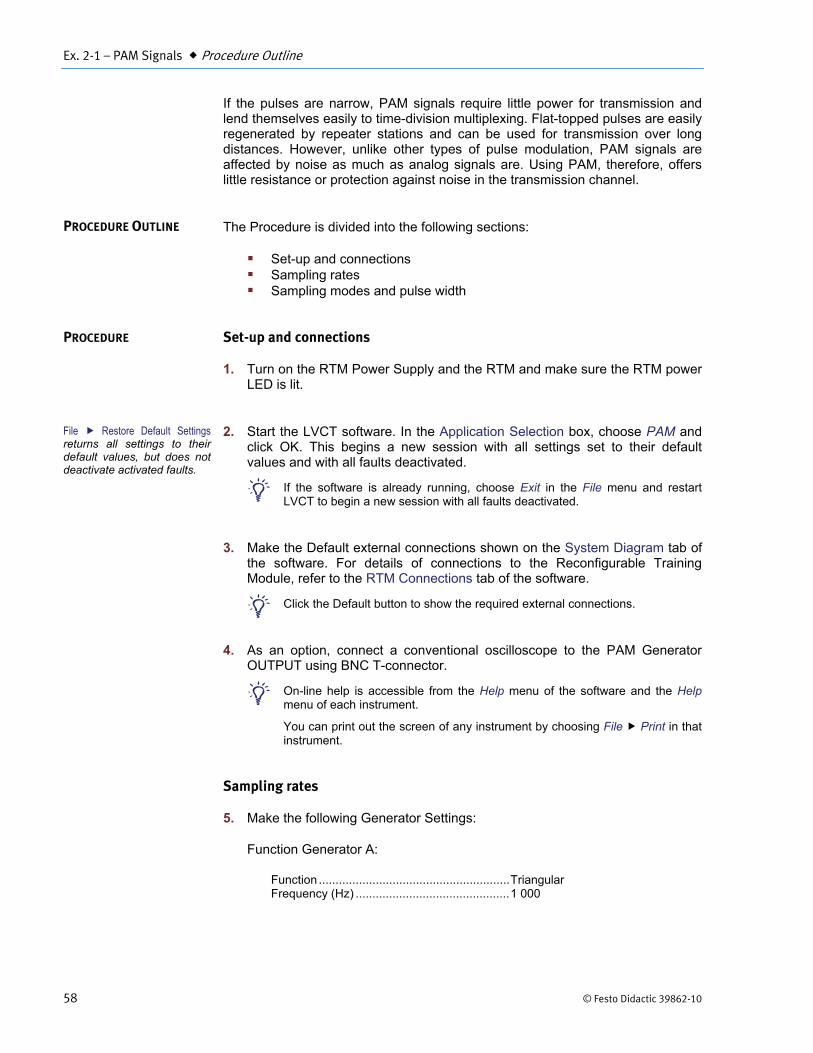
Figure 2-6 shows the relationship between the message signal, the sampling signal, and the resulting PAM signal using natural sampling.
Figure 2-6. Natural sampling.
Sampling rate
The repetition rate of the sampling signal is called the sampling rate, or sampling frequency, and is abbreviated fs. Observation in the time domain shows that, when the sampling rate fs is much greater than the frequency of the message signal fm, the PAM signal clearly resembles the message signal. If the sampling rate is reduced, or the message signal frequency is increased, the resemblance is less visible. It is neither fs nor fm alone that determines the degree of resemblance between the PAM and message signals, it is the ratio fs /fm. The lower this ratio, the less the resemblance.
Ex. 2-1 – PAM Signals Procedure Outline
58 © Festo Didactic 39862-10
If the pulses are narrow, PAM signals require little power for transmission and lend themselves easily to time-division multiplexing. Flat-topped pulses are easily regenerated by repeater stations and can be used for transmission over long distances. However, unlike other types of pulse modulation, PAM signals are affected by noise as much as analog signals are. Using PAM, therefore, offers little resistance or protection against noise in the transmission channel.
The Procedure is divided into the following sections:
Set-up and connections Sampling rates Sampling modes and pulse width
Set-up and connections
1. Turn on the RTM Power Supply and the RTM and make sure the RTM power LED is lit.
2. Start the LVCT software. In the Application Selection box, choose PAM and click OK. This begins a new session with all settings set to their default values and with all faults deactivated. b If the software is already running, choose Exit in the File menu and restart
LVCT to begin a new session with all faults deactivated.
3. Make the Default external connections shown on the System Diagram tab of the software. For details of connections to the Reconfigurable Training Module, refer to the RTM Connections tab of the software. b Click the Default button to show the required external connections.
4. As an option, connect a conventional oscilloscope to the PAM Generator OUTPUT using BNC T-connector. b On-line help is accessible from the Help menu of the software and the Help
menu of each instrument.
You can print out the screen of any instrument by choosing File Print in that instrument.
Sampling rates
5. Make the following Generator Settings:
Function Generator A:
Function ......................................................... Triangular Frequency (Hz) .............................................. 1 000
PROCEDURE OUTLINE
PROCEDURE
File Restore Default Settings returns all settings to their default values, but does not deactivate activated faults.
Double-click to select SWapp

Ex. 2-1 – PAM Signals Procedure
© Festo Didactic 39862-10 59
Function Generator B:
Function ......................................................... Pulse Frequency (Hz) .............................................. 10 000 Duty Cycle (%) ............................................... 50 Apply Duty Cycle to Clock ............................. On
6. Click the PAM Generator tab in order to display the PAM Generator diagram.
On the PAM Generator, ensure that Nat. is selected for the Mode for natural sampling.
Show the Probes bar (click in the toolbar or choose View Probes Bar). Connect the probes as follows:
Oscilloscope Probe Connect to Signal
1 TP1 AUDIO INPUT
2 TP8 OUTPUT
E TP6 Buffered CLOCK INPUT
7. Show the Oscilloscope (click in the toolbar or choose Instruments Oscilloscope). Figure 2-7 shows an example of settings and what you should observe.
Figure 2-7. Message signal, 10 kHz sampling signal and PAM signal.
8. What does this display represent?
The time domain appearance of a PAM signal with natural sampling.
Oscilloscope Settings: Channel 1.................................. 1 V/div Channel 2.................................. 1 V/div Channel E ................................. 2 V/div Time Base ........................... 0.2 ms/div Trigger Slope ............................. Rising Trigger Level ............................... 0.5 V Trigger Source ............................. Ch 1
Ex. 2-1 – PAM Signals Procedure
60 © Festo Didactic 39862-10
What is the ratio of the sampling frequency fs to the message signal frequency fm?
The ratio is fs / fm = 10 kHz / 1 kHz = 10
How many samples are taken of each cycle of the message signal?
10 samples
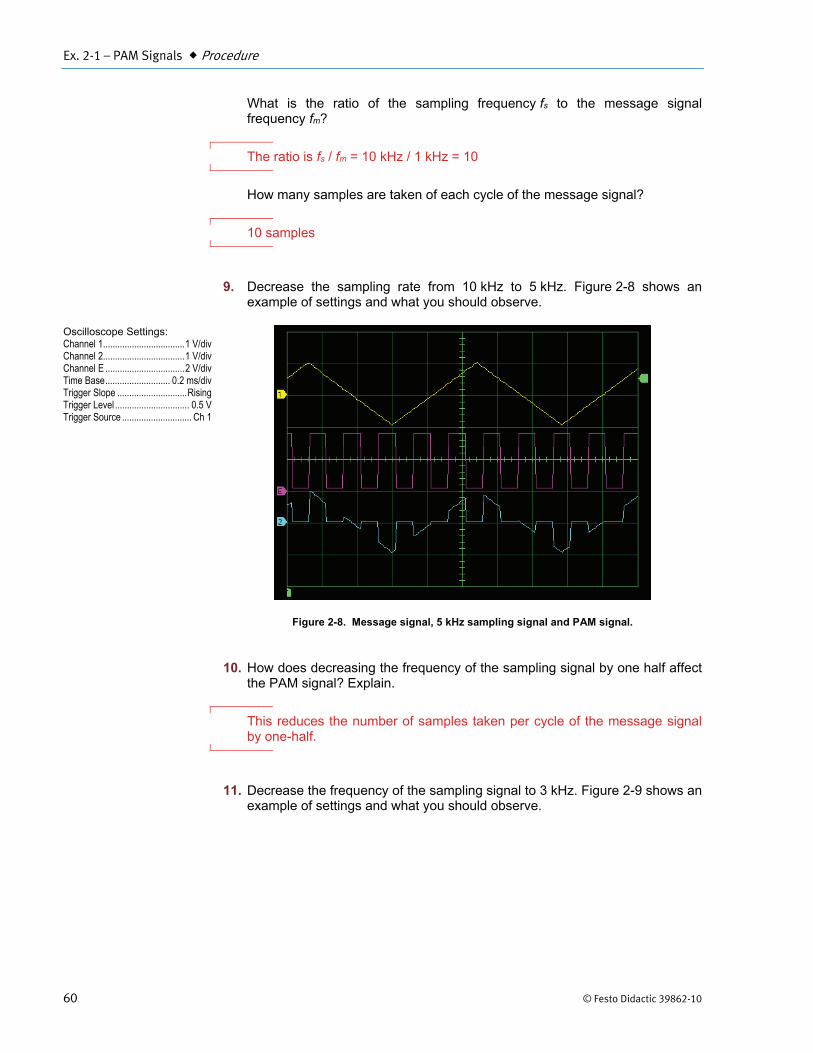
9. Decrease the sampling rate from 10 kHz to 5 kHz. Figure 2-8 shows an example of settings and what you should observe.
Figure 2-8. Message signal, 5 kHz sampling signal and PAM signal.
10. How does decreasing the frequency of the sampling signal by one half affect the PAM signal? Explain.
This reduces the number of samples taken per cycle of the message signal by one-half.
11. Decrease the frequency of the sampling signal to 3 kHz. Figure 2-9 shows an example of settings and what you should observe.
Oscilloscope Settings: Channel 1.................................. 1 V/div Channel 2.................................. 1 V/div Channel E ................................. 2 V/div Time Base ........................... 0.2 ms/div Trigger Slope ............................. Rising Trigger Level ............................... 0.5 V Trigger Source ............................. Ch 1

Ex. 2-1 – PAM Signals Procedure
© Festo Didactic 39862-10 61
Figure 2-9. Message signal, 3 kHz sampling signal and PAM signal.
What is the ratio of the sampling frequency fs to the message signal frequency fm?
The ratio is fs / fm = 3 kHz / 1 kHz = 3
How many samples are taken of each cycle of the message signal?
3 samples
Is the message signal more or less recognizable in the PAM signal as the sampling frequency is decreased? Explain.
Less recognizable because there are fewer samples per cycle of the message signal.
12. On the PAM Generator, set the Mode to Flat to switch between natural and flat-top sampling. Describe the difference between the two types of signals.
With natural sampling the pulses follow the waveform of the message signal during the sampling time. With flat-top sampling, the amplitude is constant during the sampling time.
13. Vary the Duty Cycle (pulse width) of the sampling signal and observe the changes on the oscilloscope. Describe the effects on the PAM signal.
The width of the samples varies with the sampling signal pulse width.
Oscilloscope Settings: Channel 1.................................. 1 V/div Channel 2.................................. 1 V/div Channel E ................................. 2 V/div Time Base ........................... 0.2 ms/div Trigger Slope ............................. Rising Trigger Level ............................... 0.5 V Trigger Source ............................. Ch 1
Ex. 2-1 – PAM Signals Procedure
62 © Festo Didactic 39862-10
Sampling modes and pulse width
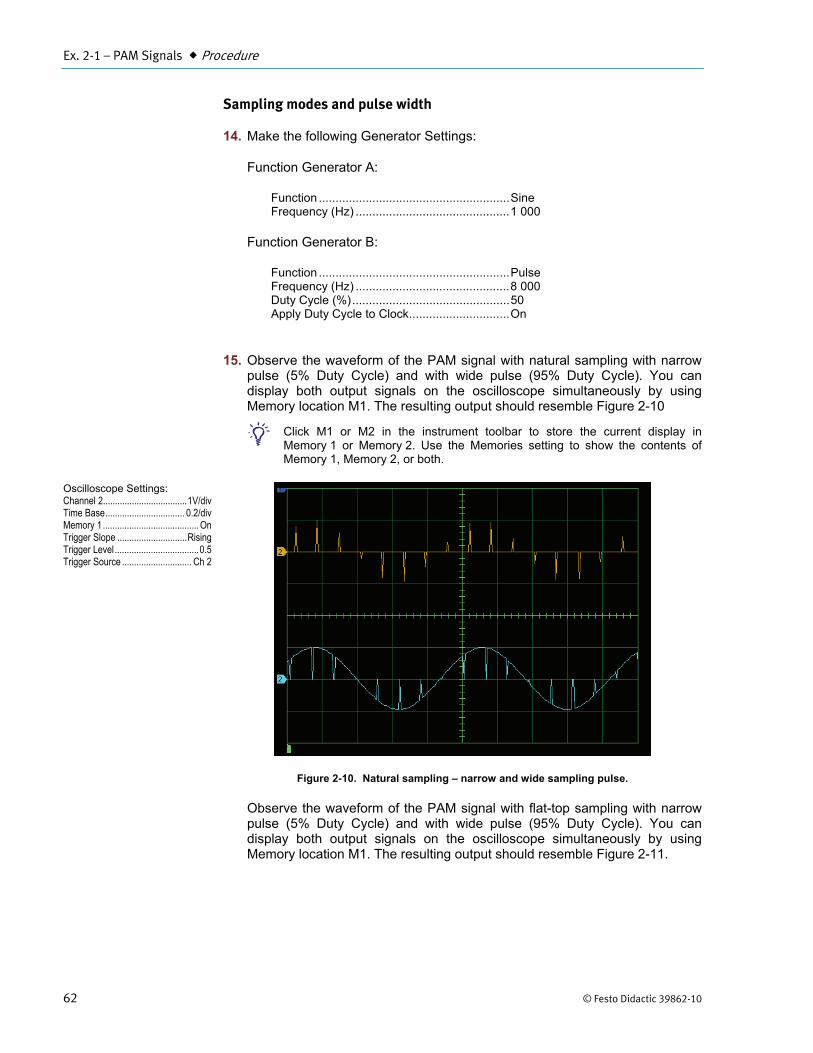
14. Make the following Generator Settings:
Function Generator A:
Function ......................................................... Sine Frequency (Hz) .............................................. 1 000
Function Generator B:
Function ......................................................... Pulse Frequency (Hz) .............................................. 8 000 Duty Cycle (%) ............................................... 50 Apply Duty Cycle to Clock .............................. On
15. Observe the waveform of the PAM signal with natural sampling with narrow pulse (5% Duty Cycle) and with wide pulse (95% Duty Cycle). You can display both output signals on the oscilloscope simultaneously by using Memory location M1. The resulting output should resemble Figure 2-10 b Click M1 or M2 in the instrument toolbar to store the current display in
Memory 1 or Memory 2. Use the Memories setting to show the contents of Memory 1, Memory 2, or both.
Figure 2-10. Natural sampling – narrow and wide sampling pulse.
Observe the waveform of the PAM signal with flat-top sampling with narrow pulse (5% Duty Cycle) and with wide pulse (95% Duty Cycle). You can display both output signals on the oscilloscope simultaneously by using Memory location M1. The resulting output should resemble Figure 2-11.
Oscilloscope Settings: Channel 2................................... 1V/div Time Base ................................. 0.2/div Memory 1 ........................................ On Trigger Slope ............................. Rising Trigger Level ................................... 0.5 Trigger Source ............................. Ch 2

Ex. 2-1 – PAM Signals Conclusion
© Festo Didactic 39862-10 63
Figure 2-11. Flat-top sampling – narrow and wide sampling pulse.
Is there a great difference in appearance between natural and flat-top sampling
a) when the pulses are very narrow? Explain.
No because the pulses are very narrow, there is very little difference.
b) when the pulses are very wide? Explain.
Yes. When the pulses are wide, the naturally sampled signal resembles the message signal whereas the flat-top sampled signal does not.
16. Adjust the Gain on the PAM Generator from Min to Max. What effect does this have on the output?
The amplitude of the output increases and decreases with the Gain setting.
17. When you have finished using the system, exit the LVCT software and turn off the equipment.
In this exercise, you saw that PAM signals consist of samples of the message signal. You observed the differences between natural and flat-top sampling using different sampling rates and pulse-widths.
Oscilloscope Settings: Channel 2................................... 1V/div Time Base ................................. 0.2/div Memory 1 ........................................ On Trigger Slope ............................. Rising Trigger Level ................................... 0.5 Trigger Source ............................. Ch 2
CONCLUSION

Ex. 2-1 – PAM Signals Review Questions
64 © Festo Didactic 39862-10
1. Describe the difference between natural and flat-top sampling?.
With natural sampling the PAM signal follows the waveform of the input signal during the sampling time. Flat-top sampling produces pulses with fixed amplitude during the sampling time.
2. What determines the amplitude of the samples for flat-top sampling?.
The amplitude of the message signal at the time of sampling.
3. If a periodic message signal with a frequency fm is sampled at a sampling rate fs , how would you determine the number of samples taken of each cycle of the message signal?.
The number of samples per cycle is equal to fs / fm.
4. Does the original message signal become more or less recognizable in a PAM signal when the sampling rate is increased?
More recognizable.
5. When the sampling signal pulses are wide, which sampling mode produces a PAM signal that closely resembles the message signal?
Natural sampling.
REVIEW QUESTIONS

© Festo Didactic 39862-10 223
Bibliography
STREMLER, Ferrel G., Introduction to Communications Systems, Second Edition, Reading, Mass., Addison-Wesley, 1982. ISBN 0-201-07251-3
SKLAR, Bernard. Digital Communications Fundamentals and Applications, Second Edition, Upper Saddle River, N.J., Prentice Hall Inc., 2001 ISBN 978-0-13084-788-7