teekay lng partners q2-2015 earnings presentation
TRANSCRIPT
TEEKAY LNG PARTNERS Q2-2015 EARNINGS PRESENTATION August 6, 2015

2
Forward Looking Statement
This presentation contains forward-looking statements (as defined in Section 21E of the Securities Exchange Act of 1934,
as amended) which reflect management’s current views with respect to certain future events and performance, including
statements regarding: the Partnership’s expected future revenues and remaining average contract duration;
fundamentals in the liquefied gas industry; the delivery timing and total cost of newbuilding vessels, the commencement of
related time charter contracts and the effect of these contracts on the Partnership’s distributable cash flows; the timing
and certainty of BP contracting one additional LNG carrier on similar terms as the first vessel; expected fuel-efficiency and
emission levels associated with the MEGI engines; the timing and certainty of exercising the Partnership’s existing option
to order one additional MEGI LNG carrier newbuilding; the outcome of the Partnership’s dispute over the Magellan Spirit
offhire incident and claimed charter contract termination; the Partnership’s access to competitive bank financing; and the
timing of the commencement of operations of the Freeport LNG project and the expected total LNG production capacity of
the project. The following factors are among those that could cause actual results to differ materially from the forward-
looking statements, which involve risks and uncertainties, and that should be considered in evaluating any such
statement: potential shipyard construction delays, newbuilding specification changes or cost overruns; changes in
production of LNG or LPG, either generally or in particular regions; changes in trading patterns or timing of start-up of new
LNG liquefaction and regasification projects significantly affecting overall vessel tonnage requirements; changes in
applicable industry laws and regulations and the timing of implementation of new laws and regulations; the potential for
early termination of long-term contracts of existing vessels in the Teekay LNG fleet; the inability of charterers to make
future charter payments; the inability of the Partnership to renew or replace long-term contracts on existing vessels; actual
performance of the MEGI engines; factors affecting the outcome of the Partnership’s dispute over the Magellan Spirit; the
Partnership’s ability to raise financing for its existing newbuildings or to purchase additional vessels or to pursue other
projects; timely completion of the Freeport LNG project as currently designed; and other factors discussed in Teekay LNG
Partners’ filings from time to time with the SEC, including its Report on Form 20-F for the fiscal year ended December 31,
2014. The Partnership expressly disclaims any obligation to release publicly any updates or revisions to any forward-
looking statements contained herein to reflect any change in the Partnership’s expectations with respect thereto or any
change in events, conditions or circumstances on which any such statement is based.
3
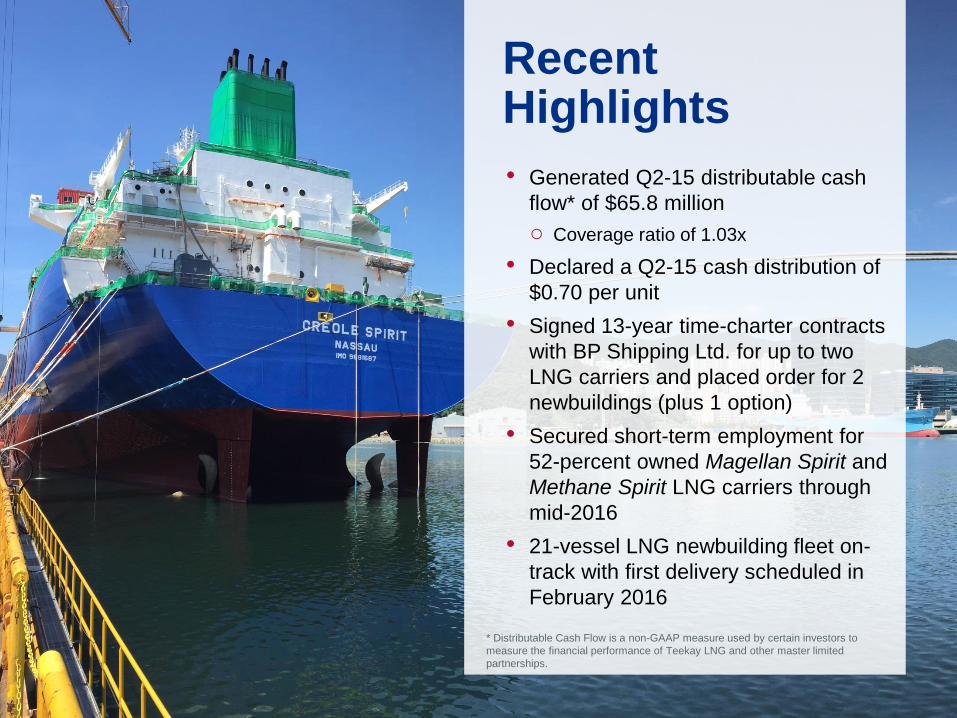
Recent Highlights
• Generated Q2-15 distributable cash
flow* of $65.8 million
○ Coverage ratio of 1.03x
• Declared a Q2-15 cash distribution of
$0.70 per unit
• Signed 13-year time-charter contracts
with BP Shipping Ltd. for up to two
LNG carriers and placed order for 2
newbuildings (plus 1 option)
• Secured short-term employment for
52-percent owned Magellan Spirit and
Methane Spirit LNG carriers through
mid-2016
• 21-vessel LNG newbuilding fleet on-
track with first delivery scheduled in
February 2016
* Distributable Cash Flow is a non-GAAP measure used by certain investors to
measure the financial performance of Teekay LNG and other master limited
partnerships.
4
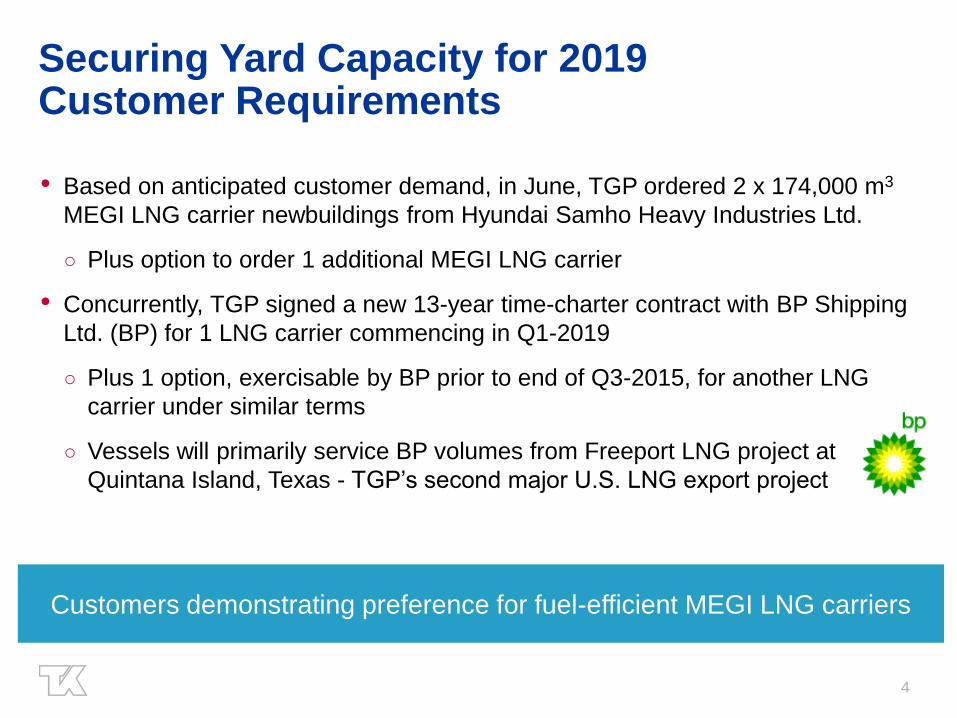
Securing Yard Capacity for 2019 Customer Requirements
• Based on anticipated customer demand, in June, TGP ordered 2 x 174,000 m3
MEGI LNG carrier newbuildings from Hyundai Samho Heavy Industries Ltd.
○ Plus option to order 1 additional MEGI LNG carrier
• Concurrently, TGP signed a new 13-year time-charter contract with BP Shipping
Ltd. (BP) for 1 LNG carrier commencing in Q1-2019
○ Plus 1 option, exercisable by BP prior to end of Q3-2015, for another LNG
carrier under similar terms
○ Vessels will primarily service BP volumes from Freeport LNG project at
Quintana Island, Texas - TGP’s second major U.S. LNG export project
Customers demonstrating preference for fuel-efficient MEGI LNG carriers
5
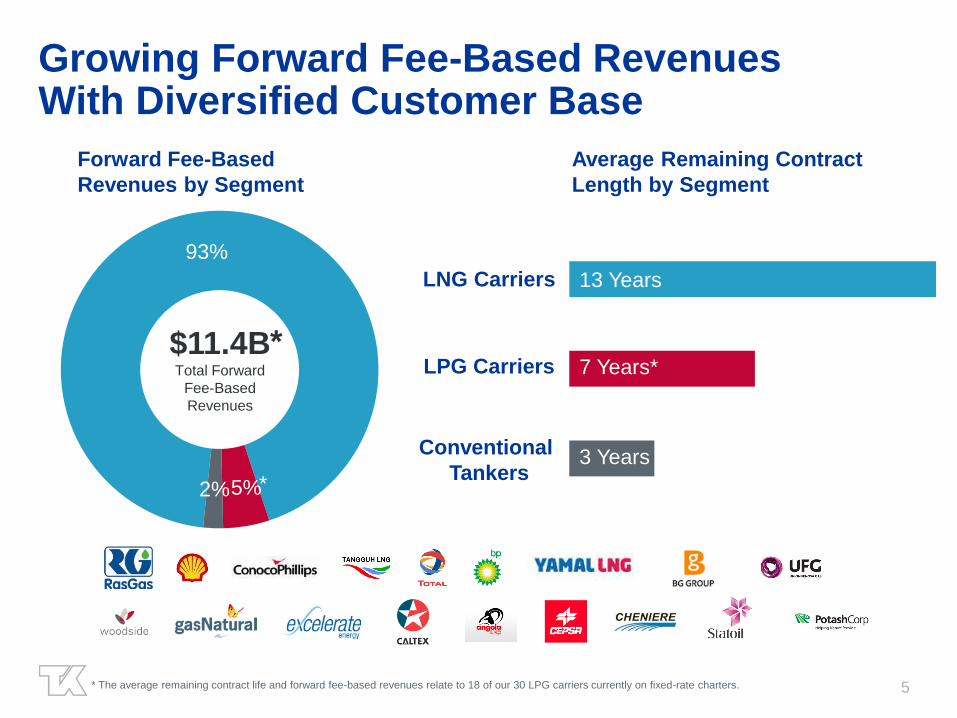
93%
5% 2%
Growing Forward Fee-Based Revenues With Diversified Customer Base
* The average remaining contract life and forward fee-based revenues relate to 18 of our 30 LPG carriers currently on fixed-rate charters.
Forward Fee-Based
Revenues by Segment
Average Remaining Contract
Length by Segment
13 Years
7 Years*
3 Years
*
$11.4B Total Forward
Fee-Based
Revenues
*
LNG Carriers
LPG Carriers
Conventional
Tankers
6
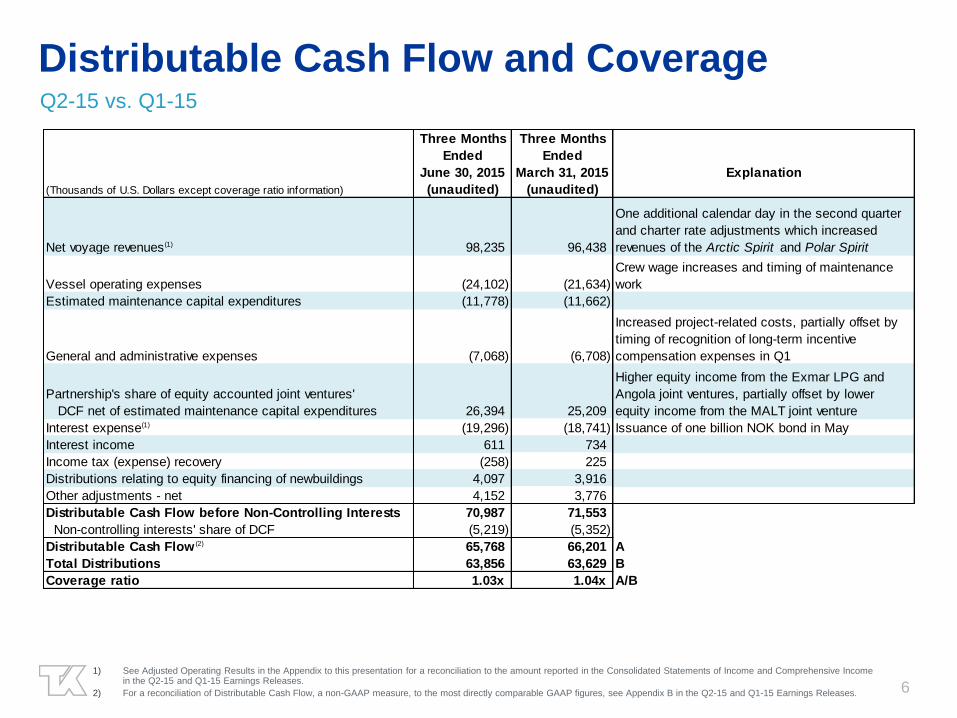
Distributable Cash Flow and Coverage Q2-15 vs. Q1-15
1) See Adjusted Operating Results in the Appendix to this presentation for a reconciliation to the amount reported in the Consolidated Statements of Income and Comprehensive Income in the Q2-15 and Q1-15 Earnings Releases.
2) For a reconciliation of Distributable Cash Flow, a non-GAAP measure, to the most directly comparable GAAP figures, see Appendix B in the Q2-15 and Q1-15 Earnings Releases.
Three Months Three Months
Ended Ended
June 30, 2015 March 31, 2015 Explanation
(Thousands of U.S. Dollars except coverage ratio information) (unaudited) (unaudited)
Net voyage revenues(1) 98,235 96,438
One additional calendar day in the second quarter
and charter rate adjustments which increased
revenues of the Arctic Spirit and Polar Spirit
Vessel operating expenses (24,102) (21,634)
Crew wage increases and timing of maintenance
work
Estimated maintenance capital expenditures (11,778) (11,662)
General and administrative expenses (7,068) (6,708)
Increased project-related costs, partially offset by
timing of recognition of long-term incentive
compensation expenses in Q1
Partnership's share of equity accounted joint ventures'
DCF net of estimated maintenance capital expenditures 26,394 25,209
Higher equity income from the Exmar LPG and
Angola joint ventures, partially offset by lower
equity income from the MALT joint venture
Interest expense(1) (19,296) (18,741) Issuance of one billion NOK bond in May
Interest income 611 734
Income tax (expense) recovery (258) 225
Distributions relating to equity financing of newbuildings 4,097 3,916
Other adjustments - net 4,152 3,776
Distributable Cash Flow before Non-Controlling Interests 70,987 71,553
Non-controlling interests' share of DCF (5,219) (5,352)
Distributable Cash Flow (2) 65,768 66,201 A
Total Distributions 63,856 63,629 B
Coverage ratio 1.03x 1.04x A/B
7
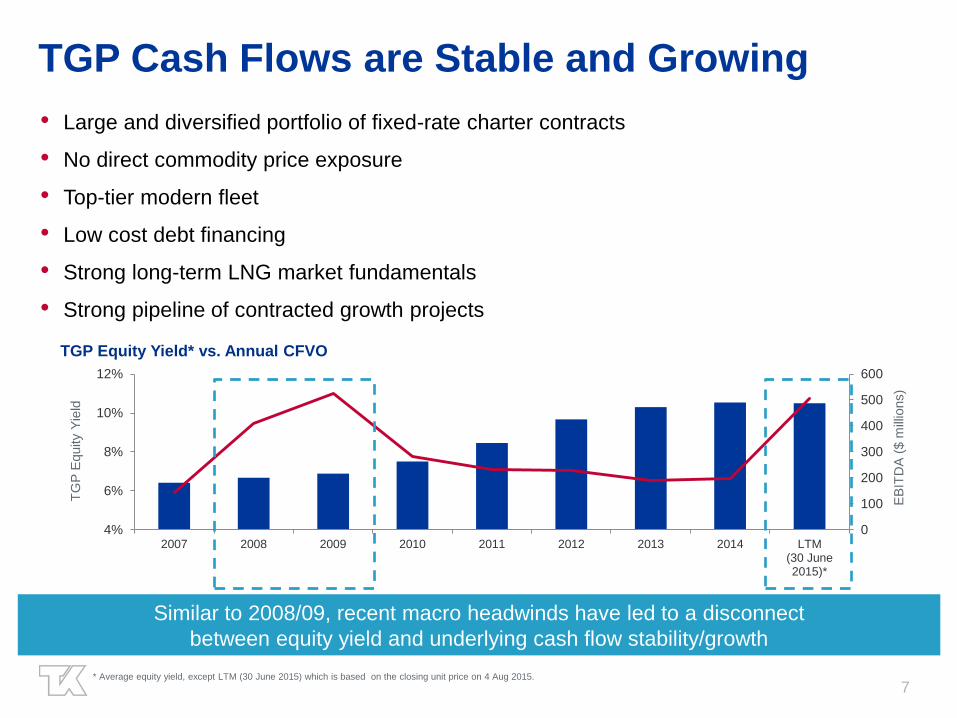
TGP Cash Flows are Stable and Growing
• Large and diversified portfolio of fixed-rate charter contracts
• No direct commodity price exposure
• Top-tier modern fleet
• Low cost debt financing
• Strong long-term LNG market fundamentals
• Strong pipeline of contracted growth projects
TGP Equity Yield* vs. Annual CFVO
0
100
200
300
400
500
600
4%
6%
8%
10%
12%
2007 2008 2009 2010 2011 2012 2013 2014 LTM(30 June2015)*
EB
ITD
A (
$ m
illio
ns)
TG
P E
quity
Yie
ld
Similar to 2008/09, recent macro headwinds have led to a disconnect
between equity yield and underlying cash flow stability/growth
* Average equity yield, except LTM (30 June 2015) which is based on the closing unit price on 4 Aug 2015.
8
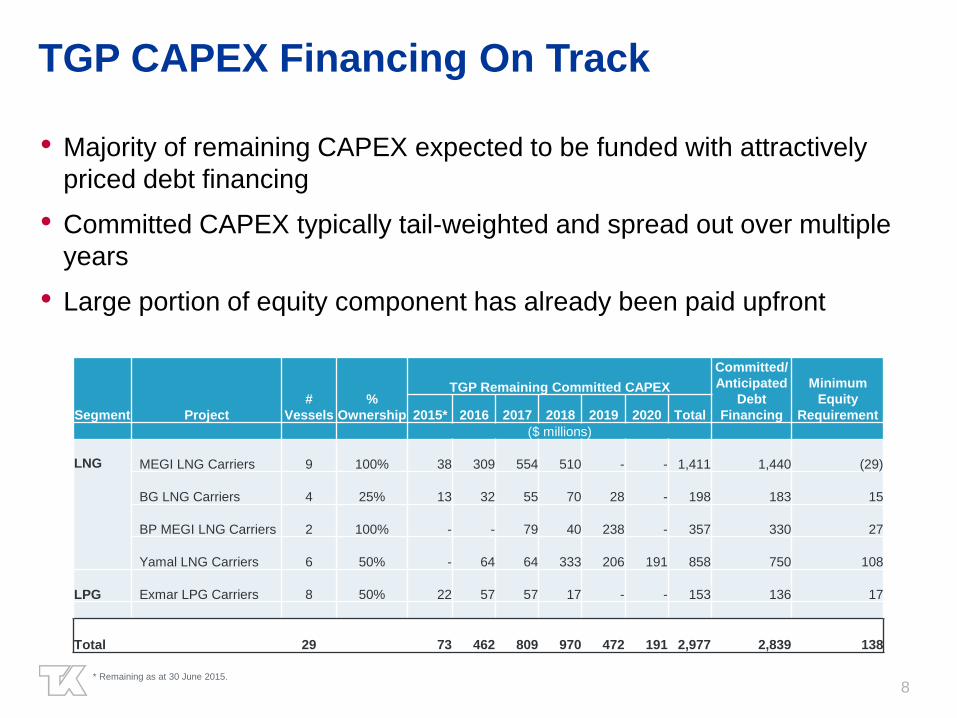
TGP CAPEX Financing On Track
Segment Project
#
Vessels
%
Ownership
TGP Remaining Committed CAPEX
Committed/
Anticipated
Debt
Financing
Minimum
Equity
Requirement 2015* 2016 2017 2018 2019 2020 Total
($ millions)
LNG MEGI LNG Carriers 9 100%
38
309
554
510
-
-
1,411
1,440
(29)
BG LNG Carriers 4 25%
13
32
55
70
28
-
198
183
15
BP MEGI LNG Carriers 2 100%
-
-
79
40
238
-
357
330
27
Yamal LNG Carriers 6 50%
-
64
64
333
206
191
858
750
108
LPG Exmar LPG Carriers 8 50%
22
57
57
17
-
-
153
136
17
Total 29
73
462
809
970
472
191
2,977
2,839
138
• Majority of remaining CAPEX expected to be funded with attractively
priced debt financing
• Committed CAPEX typically tail-weighted and spread out over multiple
years
• Large portion of equity component has already been paid upfront
* Remaining as at 30 June 2015.
9
Continued Access to Capital
• Strong interest from banks / Export Credit Agencies to finance projects
due to TGP cash flow stability
○ Strong portfolio of fee-based fixed rate contracts (over $11 billion of forward
revenue)
○ Long average tenor of charter contracts (~13 years)
○ Diverse customer base
• Bank margins have decreased over the past couple years
• Access to multiple capital markets
○ Project Bonds
○ Unsecured U.S. / NOK Bonds
○ Private / Public Equity Offerings
○ Continuous Offering Program
10
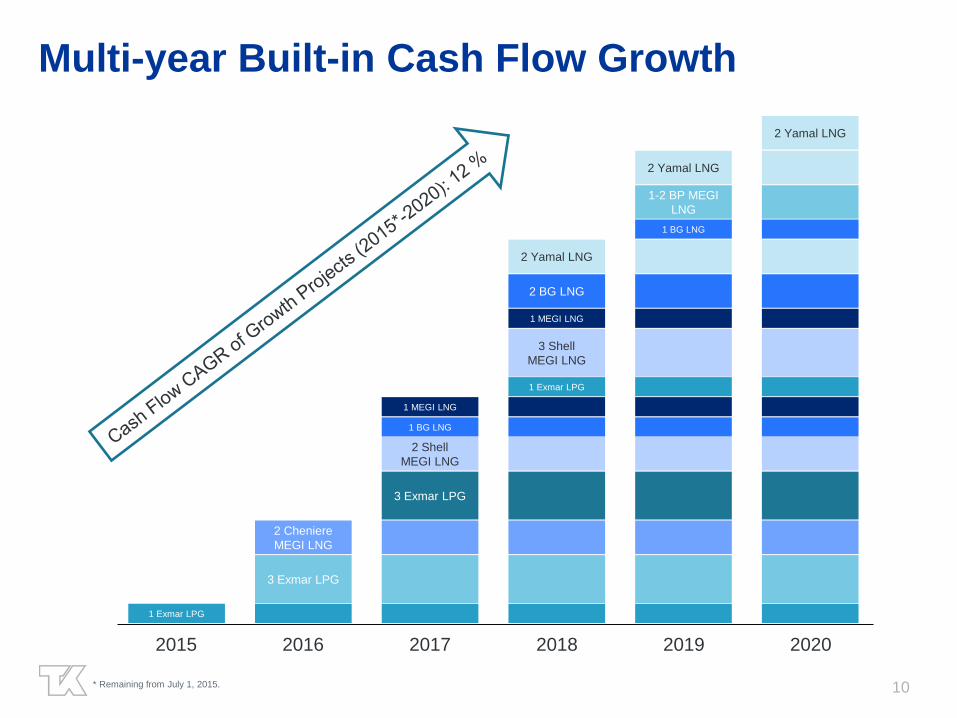
Multi-year Built-in Cash Flow Growth
2015 2016 2017 2018 2019 2020
1 Exmar LPG
3 Exmar LPG
2 Cheniere
MEGI LNG
3 Exmar LPG
2 Shell
MEGI LNG
1 BG LNG
1 MEGI LNG
1 Exmar LPG
3 Shell
MEGI LNG
1 MEGI LNG
2 BG LNG
2 Yamal LNG
1 BG LNG
1-2 BP MEGI
LNG
2 Yamal LNG
2 Yamal LNG
* Remaining from July 1, 2015.
11
Appendix

12
Adjusted Operating Results Q2-15
1) See Appendix A to the Partnership's Q2-15 earnings release for description of Appendix A items.
2) Reallocating the realized gains/losses to their respective line as if hedge accounting had applied. Please refer to footnotes (2) and (3) to the Consolidated Statements of Income and Comprehensive Income in the Q2-15 Earnings Release.
(in thousands of U.S. Dollars)
Voyage revenues 98,608 - - 98,608
Voyage expenses (373) - - (373)
Net voyage revenues 98,235 - - 98,235
Vessel operating expense (24,102) - - (24,102)
Depreciation and amortization (23,209) - - (23,209)
General and administrative (7,068) - - (7,068)
Income from vessel operations 43,856 - - 43,856
Equity income 29,002 (11,102) - 17,900
Interest expense (11,153) - (8,143) (19,296)
Interest income 611 - - 611
Realized and unrealized gain on derivative instruments 10,888 (18,207) 7,319 -
Foreign exchange loss (9,546) 8,722 824 -
Other income – net 335 - - 335
Income tax expense (258) - - (258)
Net income 63,735 (20,587) - 43,148
Less: Net income attributable to Non-controlling interests (5,642) 1,958 - (3,684)
NET INCOME ATTRIBUTABLE TO THE PARTNERS 58,093 (18,629) - 39,464
Three Months Ended
June 30, 2015
As Reported
Appendix A
Items (1)
Reclass for
Realized
Gains/Losses on
Derivatives (2)
TGP Adjusted Income
Statement
13
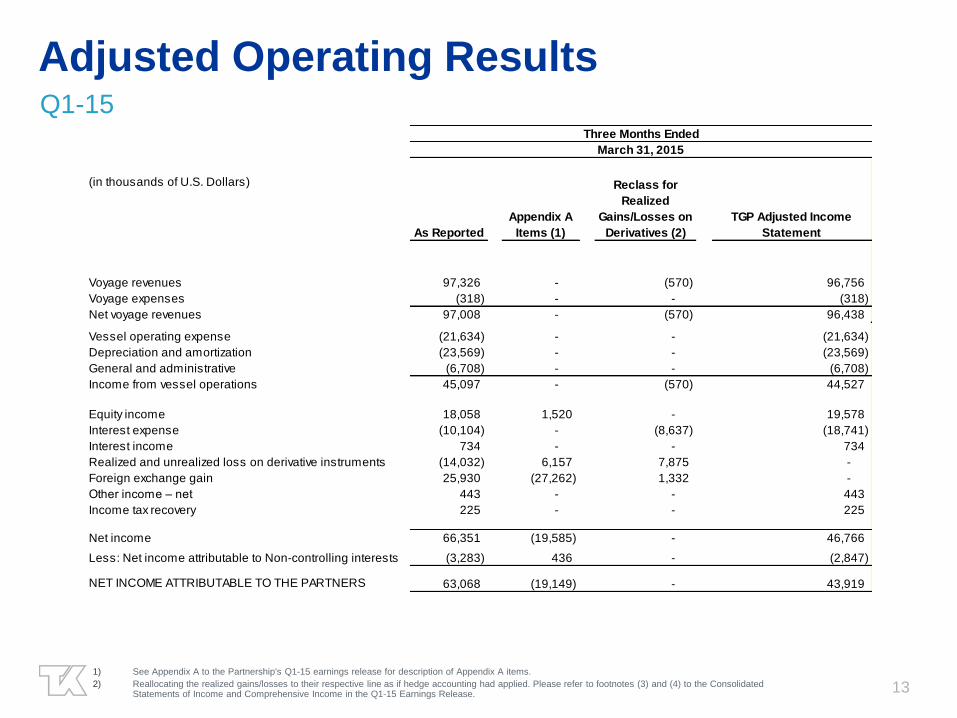
Adjusted Operating Results Q1-15
1) See Appendix A to the Partnership's Q1-15 earnings release for description of Appendix A items.
2) Reallocating the realized gains/losses to their respective line as if hedge accounting had applied. Please refer to footnotes (3) and (4) to the Consolidated Statements of Income and Comprehensive Income in the Q1-15 Earnings Release.
(in thousands of U.S. Dollars)
Voyage revenues 97,326 - (570) 96,756
Voyage expenses (318) - - (318)
Net voyage revenues 97,008 - (570) 96,438
Vessel operating expense (21,634) - - (21,634)
Depreciation and amortization (23,569) - - (23,569)
General and administrative (6,708) - - (6,708)
Income from vessel operations 45,097 - (570) 44,527
Equity income 18,058 1,520 - 19,578
Interest expense (10,104) - (8,637) (18,741)
Interest income 734 - - 734
Realized and unrealized loss on derivative instruments (14,032) 6,157 7,875 -
Foreign exchange gain 25,930 (27,262) 1,332 -
Other income – net 443 - - 443
Income tax recovery 225 - - 225
Net income 66,351 (19,585) - 46,766
Less: Net income attributable to Non-controlling interests (3,283) 436 - (2,847)
NET INCOME ATTRIBUTABLE TO THE PARTNERS 63,068 (19,149) - 43,919
Three Months Ended
March 31, 2015
As Reported
Appendix A
Items (1)
Reclass for
Realized
Gains/Losses on
Derivatives (2)
TGP Adjusted Income
Statement
14
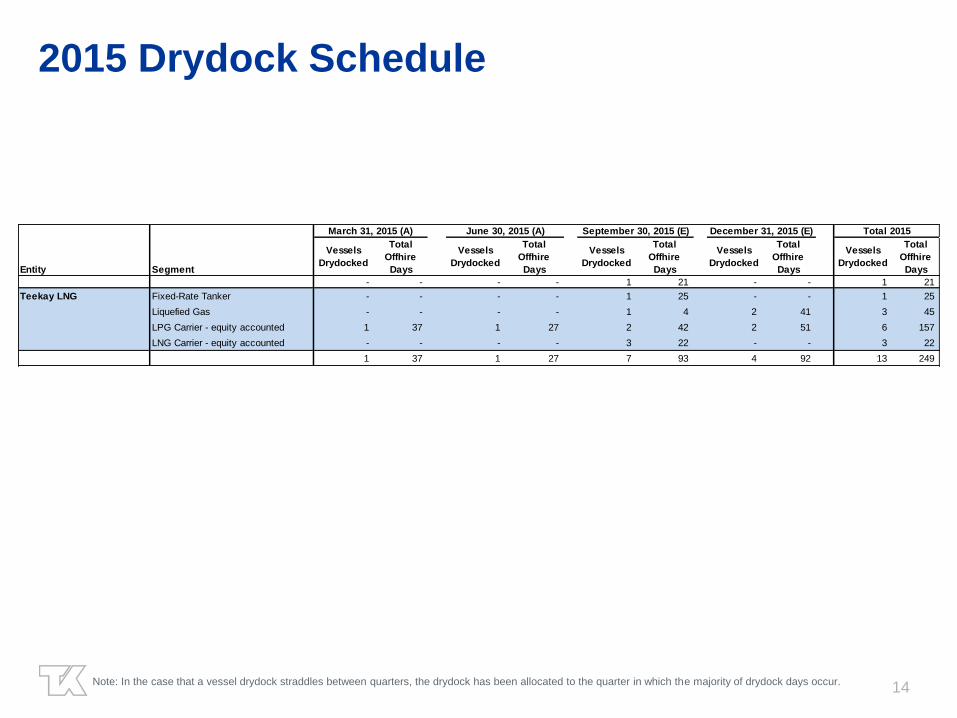
2015 Drydock Schedule
Note: In the case that a vessel drydock straddles between quarters, the drydock has been allocated to the quarter in which the majority of drydock days occur.
Entity Segment
Vessels
Drydocked
Total
Offhire
Days
Vessels
Drydocked
Total
Offhire
Days
Vessels
Drydocked
Total
Offhire
Days
Vessels
Drydocked
Total
Offhire
Days
Vessels
Drydocked
Total
Offhire
Days
- - - - 1 21 - - 1 21
Teekay LNG Fixed-Rate Tanker - - - - 1 25 - - 1 25
Liquefied Gas - - - - 1 4 2 41 3 45
LPG Carrier - equity accounted 1 37 1 27 2 42 2 51 6 157
LNG Carrier - equity accounted - - - - 3 22 - - 3 22
1 37 1 27 7 93 4 92 13 249
March 31, 2015 (A) June 30, 2015 (A) September 30, 2015 (E) December 31, 2015 (E) Total 2015