tectonic history along the south gabon basin:...
TRANSCRIPT

Ple
ase
note
that
this
is a
n au
thor
-pro
duce
d P
DF
of a
n ar
ticle
acc
ept
ed fo
r pu
blic
atio
n fo
llow
ing
peer
rev
iew
. The
def
initi
ve p
ub
lish
er-a
uthe
ntic
ated
ve
rsio
n is
ava
ilab
le o
n th
e pu
blis
her
Web
site
1
Marine and Petroleum Geology March 2007, Volume 24, Issue 3, Pages 151-172 http://dx.doi.org/10.1016/j.marpetgeo.2006.11.003 © 2007 Elsevier Ltd All rights reserved.
Archimer Archive Institutionnelle de l’Ifremer
http://www.ifremer.fr/docelec/
Tectonic history along the South Gabon Basin: Anomalous early post-rift subsidence
Stéphanie Dupréa, *, Giovanni Bertottia and Sierd Cloetingha
a Tectonics and Structural Geology Department, Faculty of Earth and Life Sciences, Vrije Universiteit, de Boelelaan 1085, 1081 HV Amsterdam, The Netherlands
*: Corresponding author : S. Dupré, Tel.: +31 20 59 87 370; Fax: +31 20 59 89 941; E-mail: [email protected]
Abstract: An integrated study of the South Gabon Margin (South Atlantic) based on reflection seismic and well data has been performed to quantify tectonic activity. A regional profile crossing the entire basin together with subsidence analysis, highlights important aspects of the post-rift history. The most striking event in the margin evolution appears to be the anomalous extra subsidence during the early post-rift period characterized by high sedimentation rates, equivalent to one third of the syn-rift subsidence. Although the presence of evaporite layers restricts knowledge of the underlying structures essentially composed of pre-rift and syn-rift sequences, the outcome of this post-rift tectonic study has strong implications for the rifting history. The early post-rift subsidence patterns can be related to a high thermal anomaly during the early rifting thermal state of the lithosphere. These findings are highly relevant for petroleum system studies and have implications for hydrocarbon generation. Keywords: Post-rift subsidence; Margin; Gabon

1. Background
1.1. Introduction
The rifted continental margins of the South Atlantic Ocean are exciting areas of research both for academic and hydrocarbon related purposes. The corresponding geological units remained quite poorly known until the nineties when major hydrocarbon discoveries were made, thereby provoking a sharp rise in interest (Jackson et al., 2000; Seranne et al., 1992; Teisserenc & Villemin, 1990). One major obstacle to obtain well-constrained reconstructions of the rift margin system is the presence of thick Late Aptian evaporites. Such deposits prevent from obtaining a complete seismic penetration of sedimentary sequence, and therefore, restrict our knowledge of the syn-rift period. We present results of analysis of industry seismic lines across the South Gabon Basin, stretching from the continental shelf in the east to the ocean-continent boundary in the west. After a description of key features observed along the main regional line and backstripped wells, we present a semi-quantitative reconstruction of the tectonic history of the margin with a focus on the subsidence patterns, subsequently we discuss the role of salt tectonics in the early post-rift subsidence history of the South Gabon Basin. While most of our data are restricted to the post-rift sequence, the derived subsidence pattern contains valuable information on the pre- and syn-rift evolution.
1.2. Geological setting
1.2.1. The South Atlantic Ocean
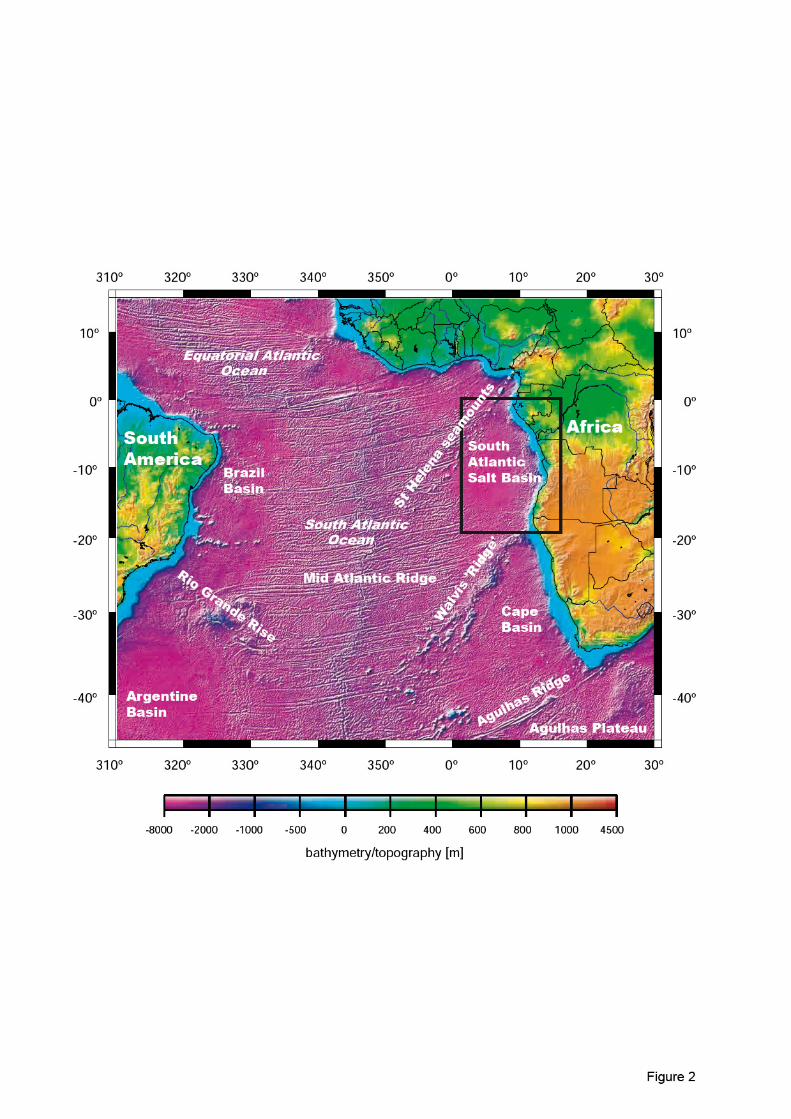
The Mesozoic tectonic evolution of the African plate has been characterized by three main crustal rifting stages (Binks & Fairhead, 1992; Janssen et al., 1995; Maurin & Guiraud, 1993). Break-up of Gondwana led first to the Karoo rifting and to the opening of the Central Atlantic Ocean by separating North West Africa and North America (180 Ma), and more recently (20 Ma) to the opening of the Red Sea-Gulf of Aden and to the rifting in the East African Rift System. In between, during Late Jurassic time (~150-140 Ma), continental rifting began between South America and Africa and led to the opening of the South Atlantic Ocean (Fig. 1) and to the formation of the West and Central African Rift System (Binks & Fairhead, 1992; Davison, 1999; Kampunzu & Popoff, 1991; Nürnberg & Müller, 1991; Teisserenc & Villemin, 1990). Crustal separation and onset of oceanic spreading took place ~133 Myr ago (magnetic anomaly M11) in the Cape Basin of South Africa and propagated northward to the Gulf of Guinea (Binks & Fairhead, 1992; Davison, 1999; Kampunzu & Popoff, 1991; Nürnberg & Müller, 1991; Teisserenc & Villemin, 1990; Uchupi & Emery, 1991). Three successive domains, austral, tropical and equatorial, delimited by inherited Gondwanian mega-discontinuities, characterize the South Atlantic (Popoff, 1988) (Fig. 1). From the Falkland to the Guinea Plateau, the continental rifting-drifting processes were reproduced in each domain every 20 Myr. Complete separation between the South American and African continents occurred in Late Albian-Cenomanian times with the opening of the Equatorial Atlantic Ocean. The west African rifted margin is divided into two main domains by the oceanic Walvis Ridge (Figs. 1 and 2). South of the ridge, a volcanic margin extends from South Africa to Namibia (i.e. Walvis, Ludentz, Orange and Le Cap basins), and is characterized by seaward dipping reflectors (Gladczenko et al., 1997). The region north of the Walvis Ridge stretching from Angola to Cameroon is characterized by post-rift evaporites forming the South Atlantic Salt Basin (Mocamedes, Kwanza, Lower
2

Congo, North and South Gabon, and Douala basins) (Fig. 1). The deposition of these sediments over such a large area, 250 km wide and 2000 km along strike (Jackson et al., 2000), was made possible by favourable climatic conditions and by restriction of the water circulation imposed by the Walvis Ridge (Dingle, 1999).
1.2.2. The Gabon Margin
The Gabon Basin is located at the limit of two old cratons which have been stable since ~2 Ga, the Sao Francisco Craton in Brazil and the Congo Craton in Africa (Castro, 1987; Reyre, 1984) (Fig. 1). In this region, two main rift axes developed, the Gabon-Sergipe-Alagoas (GSA) trend and the Recôncavo-Tucano-Jatobá (RTJ) trend (respectively numbered 8 and 10, and 9 on Fig. 1). While the RTJ trend evolved as a failed rift arm, the GSA trend indicated an advanced transitional evolution between the rift and drift stage (de Matos, 1992). Along the Gabon Margin, onset of rifting started in Neocomian-Berriasian times (~144 Ma) based on dating of the oldest rift sediments corresponding most exclusively to fluviatile basal sandstones (Guiraud & Maurin, 1991; Reyre, 1984; Teisserenc & Villemin, 1990). In Cabinda (Fig. 3), a volcanic layer found on top of the pre-rift sequence has been dated at 140 Ma ± 5 Myr, corresponding to the Jurassic-Cretaceous boundary (Brice et al., 1982). The end of rifting has been dated and associated with the magnetic anomaly M0 at ~118.5 Ma (Guiraud & Maurin, 1991; Teisserenc & Villemin, 1990). Based on these ages, rifting duration can be approximated to 25 Myr. The Gabon Margin is segmented by major normal faults parallel to the present-day coastline and by NE-SW trending strike-slip faults defining zones with partly different tectonic and stratigraphic histories (Guiraud & Maurin, 1991; Teisserenc & Villemin, 1990). The N'Komi fracture zone divides the Atlantic Basin into the North Sub-Basin and the South Sub-Basin (Fig. 3). North of Gabon, approaching the Equatorial domain, the west African margin acquires a more transform character (Mascle & Blarez, 1987; Meyers et al., 1996) (Fig. 1). Some of the southern major fault zones have been identified along the Gabon Basin by onshore outcrops, reflection seismic, well data and gravity anomalies (Brink, 1974; Karner et al., 1997). For instance, the Eastern Hinge separates continental margin sediments from the Precambrian Basement, while the Atlantic Hinge Zone is located in the shelf break area (Fig. 3). Based on wells (Brink, 1974; Teisserenc & Villemin, 1990) and detailed biostratigraphy (confidential data), the Atlantic Hinge Zone controlled the separation between deeper marine environments in the west from shelf deposits in the east, e.g. Madiela, Cap Lopez and Azilé groups (Fig. 4).
The oldest pre-rift sediments along the Gabon Margin are found in the north, in the Interior Basin, which is separated from the offshore Atlantic Basin by the Lambaréné Horst (Fig. 3). According to Teisserenc & Villemin (1990), they consist of Late Carboniferous to Triassic-Jurassic fluviatile and lacustrine deposits. Mbina Mounguengui et al. (2002) attributed the oldest sediments to be of Precambrian age. Continental rifting began in Berriasian time ~144 Ma (Reyre, 1984; Teisserenc & Villemin, 1990) and led to the formation of extensional faults, and therefore, to series of grabens and horsts. The grabens were filled with fluvio-lacustrine sediments. Break-up occurred around ~118 Myr ago. Following the cessation of rifting, in Late Aptian time, transitional to shallow marine sediments were deposited over most of the margin. They consist of sandstones, shales and evaporites (Ezanga sequence) (Fig. 4). From Late Aptian to Holocene time, the post-rift deposits consist of marine sediments, associated since Late Tertiary with the establishment of the Congo delta (Reyre, 1984).
3

1.3. Salt tectonics
Salt tectonics in rifted continental margins corresponds to synsedimentary
gravity-driven deformation above a substratum, which is inclined towards the ocean (Burollet, 1975; Cobbold et al., 1995; Demercian et al., 1993; Duval et al., 1992). This large-scale gravity gliding/spreading results from the deformation under their own weight of sediments deposited on a decollement level, e.g. the post-rift evaporite layer offshore Gabon. Such a process is now widely accepted and has been well described along numerous margins, e.g. in the Gulf of Guinea (Burollet, 1975; Duval et al., 1992; Mauduit, 1998; Spathopoulos, 1996), in the Angolan Margin (Fort et al., 2004), in the eastern Brazilian margin (Cobbold et al., 1995; Demercian et al., 1993), in the Norwegian margin (Bishop et al., 1995; Nilsen et al., 1995), in the eastern Mediterranean Basin (Sage & Letouzey, 1990) or in the Gulf of Mexico (Worrall & Snelson, 1989; Wu et al., 1990). Gravity-driven gliding/spreading leads to the development of a landward domain of extension and an oceanward domain of compressional deformation (Cramez & Jackson, 2000; Demercian et al., 1993; Marton et al., 2000; Spathopoulos, 1996; Wu et al., 1990). In addition to seismic and well data, which provide a good image of the salt structures, analogue and numerical modelling procedures have been developed to study salt diapirism (e.g. Daudré & Cloetingh, 1994) and simulate the processes of gravity gliding/spreading above salt. Analogue experiments have significantly contributed to the understanding of structure development in salt environment, i.e. grabens and tilted blocks (Mauduit et al., 1997b; Vendeville et al., 1987), extensional diapirs (Vendeville & Jackson, 1992a; Vendeville & Jackson, 1992b), rollovers and turtle back type structures (Mauduit & Brun, 1998; Mauduit et al., 1997a; Vendeville & Cobbold, 1987) and compressional structures (Brun & Fort, 2004; Cobbold et al., 1989; Fort, 2002; Mauduit, 1998). 2. Seismic units
The main source of data for this study is a set of 2D multi-channel seismic reflection lines assembled to form a single NE-SW trending profile across the South Gabon rifted continental margin, and extending along 170 km from the coastal area to the ocean-continent boundary (Fig. 3). Located in the northern part of the Salt basin between latitude 4ºS and 5ºS, these seismic lines are representative of the tectonic and the stratigraphic patterns of the surroundings. They have been previously migrated down to the salt layer (WesternGeco) and the composite profile provides an excellent image of the post-rift sequence. In the eastern part of the continental platform, seismic penetration is around 4 s TWT (two-way travel time). With the deepening of the sea bottom towards the southwest down to 3000-3500 m, penetration remains similar and coherent seismic events are visible down to 8 s TWT. Fourteen characteristic seismic horizons have been picked on minimum or maximum amplitude values based on distinct changes in the seismic facies. Well data and geological knowledge have also been used to derive velocities for the main seismic stratigraphic intervals, and thus, to obtain a depth-converted section. Adopted values are given in detail in Table 1.
Interpreted seismic sections are displayed in Figs. 5, 6 and 7. Four main sedimentary packages can be distinguished according to their characteristic seismic signature. The deepest horizons correspond to the pre-salt series, which comprise the syn-rift sedimentary sequences and the early post-rift series of the Late Aptian Gamba-Vembo formations (Fig. 4). The second post-rift seismic stratigraphic unit is formed by the Late Aptian evaporites of the Ezanga Formation and can be clearly followed along all seismic lines. Above this salt layer, carbonates of the Madiela Group
4

are found. They have a shallow water character in the east and deeper facies in the west. This sedimentary package is overlain by a deeper water siliciclastic one subdivided into two parts by a major unconformity and dominated in its upper portions by terrigenous input partly coming from the Congo delta.
2.1. Below the salt
The succession underlying the Ezanga salt Formation corresponds to syn-rift
and early post-rift sediments. Penetration and resolution in this succession is generally poor, making observations of the syn-rift geometries difficult. This is a consequence of the strong acoustic impedance of the evaporites and of the processing procedures adopted, which were principally aimed at imaging sediments above the salt. The best reflections from below the evaporites are observed under the continental shelf area, ~20 km east of the shelf break. These reflectors dip towards the ocean and are steeper than the overlying base salt, suggesting deposition in half grabens controlled by NE-dipping listric faults. Thickness of syn-rift sediments in this locality represents at least 1.6 s TWT (Fig. 5). Reflectors terminate towards the west in a zone without clear reflections. Well G2 located on the continental shelf (Fig. 3) partly traverses one syn-rift half-graben and contributes to define the bases of the Melania and Gamba formations (Fig. 4).
2.2. Evaporites
Along the South Gabon Margin, evaporites are found over the entire section
from the continental shelf in the east to the oceanic crust in the west. They correspond to the Ezanga Formation, deposited during the Late Aptian, ~116 to 114 Myr ago. Both floor and roof of the salt layer are imaged by strong clear reflections thanks to the strong acoustic impedance contrast between the evaporites and the underlying and overlying sediments. Few reflections are observed within the salt layer: they represent either noise, incorporated carbonate layers or sequences within the evaporite cycle as dolomite, anhydrite or halite. Mainly as a consequence of gravitational gliding, salt thickness is extremely variable. In the east, in the first 20 km of the section, salt forms vertical diapirs up to 1200 ms TWT high. Salt between diapirs is extremely thin to absent. Small normal faults are developed on the diapir heads, some of them reaching quite close to the present sea floor. Along the following 90 km of the section (roughly up to the termination of the second seismic line, Fig. 6), the salt layer is quite continuous and forms the detachment horizon on which the shallow water carbonate layer glides towards the ocean. Thicknesses are quite variable but are never very high, in the order of 300 ms TWT. Huge masses of evaporites are found in the most distal part of the continental margin and may extend on top of the oceanic crust as noted by (Jackson et al., 2000). In the southwestern part of the profile, along ~25 km, they form diapirs up to 1300 ms TWT high (Fig. 7). These diapirs are often subvertical and are typically squeezed, indicating a compressional tectonic regime whereas extensional diapir structures characterize the landward part of the margin (Brun & Fort, 2004; Fort, 2002; Fort et al., 2004; Mauduit, 1998). Faulting above the westernmost diapir, which reaches the sea bottom and causes collapse of the overburden sediments, indicates ongoing salt tectonic activity.
2.3. Carbonates
Evaporites are overlain by the Madiela carbonate succession deposited from
Late Aptian to Late Albian, i.e. ~114 to 99 Myr ago (Fig. 4). Along the examined
5

regional section, the top of the carbonates has been calibrated with well G2 located on the present-day continental shelf, where the Madiela sediments represent shallow water deposits. These carbonates produce strong subparallel reflectors. The presence of the Madiela seismic package has been extended towards the southwest, close to the oceanic domain although industry well data are not available. Indeed, a deep sea drilling located offshore Angola at 2448 m waterdepths penetrated down to Early Albian sediments (Bolli et al., 1978). Southwest of the so-called Atlantic Hinge Zone, shallow water carbonates (Azingo Formation) are replaced by deeper and more shaly deposits (Namina Formation) (Brink, 1974; Teisserenc & Villemin, 1990) (Fig. 4). This lateral facies change is based on biostratigraphy of a few wells located in the deep water area. Offshore South Gabon, the western limit of the carbonate platform has been mapped ~70 km away from the coastline by Teisserenc & Villemin (1990). Based on gravity, Karner et al. (1997) localised the Atlantic Hinge Zone west of the shelf break area (Fig. 3). Along the studied seismic lines offshore South Gabon, no lateral changes in seismic signature (amplitude or continuity) could be observed, and therefore, interpreted as a possible facies change. Because of data availability, stacking velocities could not be used to localise the transition between the shallow water carbonates and the shales. Based on literature and seismic analysis, the carbonate platform is then assumed to extend all along line 1, i.e. along at least ~80 km (Fig. 5). Probably the most apparent feature of the Madiela Group is the presence of listric faults, which dissected the carbonate platform during deposition. These growth faults form half grabens with tilted blocks and wedging units (e.g. Fig. 5, position 55 km). The reflectors diverge towards the fault surface. Most of the faults dip towards the southwest, that is, towards the ocean and sole out in the evaporites underlying the carbonates. Typical lateral fault spacing is 10 km on average. Vertical displacement is always comparable to the thickness of the formation. This thin-skinned extension above the post-rift Ezanga evaporites is the result of synsedimentary gravity-driven deformation (Burollet, 1975; Duval et al., 1992). The Madiela tilted blocks form 'pre-rafts' structures according to Duval et al. (1992) and Spathopoulos (1996). In areas where salt tectonics is more active (e.g. offshore Angola), these blocks are separated and disconnected from each other and form so-called 'rafts' (Duval et al., 1992; Lundin, 1992). At both ends of the profile, the Madiela sedimentary package is not continuous due to the upward piercement of the diapirs. In the southwestern part of the profile, over ~20 km east of the last massive diapir, Madiela reflectors converge upwards against salt diapirs documenting deposition during diapir growth. The uppermost beds onlap the salt roof (Fig. 7, see the four westernmost diapirs).
The primary thickness of the carbonate platform measured away from the listric faults is fairly constant along the profile and represents on average 600 ms TWT. The coeval shaly sediments deposited farther seawards present a similar time thickness. Little lateral thickness variation is observed along the entire profile.
2.4. Clastic sequence
The seismic package between the top of the Madiela sequence and the sea
bottom corresponds to clastic sediments deposited since the Late Albian, i.e. 99 Myr ago (Fig. 4). This clastic succession is subdivided into two parts by a major erosional unconformity which reaches the sea bottom ~10 km east of the shelf break and gently deepens towards the southwest cutting down-section in the lower unit along ~30 km (Figs. 5, 6 and 7). Farther to the southwest, at the end of the first line (Fig. 5), the surface looses its unconformable geometry and becomes parallel to bedding. Its detailed position is difficult to trace in the absence of wells. The seismic signature of the post-Madiela sediments contrasts significantly with that of the underlying ones that are disturbed by salt tectonics. This sedimentary succession is imaged by clear
6

continuous seismic reflectors, mainly subparallel to the bathymetry. Reflectors are usually undeformed though locally, perturbation and upward bending shapes are observed in relation to the flanks of salt diapirs. For instance in the eastern part of the section, high diapirs pierce through the Madiela sediments into those from the Cap Lopez Group (Figs. 4 & 5). The offsets of the shallow faults that reach the sea bottom are of a few tens of ms. Sediments are slightly affected by the upper parts of listric faults (see Fig. 5, western part of the shelf, position ~50 km). Displacements along these faults are always small (<50 ms TWT) and correspond to a small portion of the entire movement accommodated by the fault.
2.4.1. Below the unconformity
The package underneath and to the east of the unconformity is formed by Late Cretaceous to Eocene sediments (Rasmussen, 1997; Seranne et al., 1992) and extends along 50-60 km (Fig. 5), corresponding mainly to the shelf area. Deposits at the sea bottom are Late Cretaceous in age in the coastal area, and become younger to the southwest until the unconformity (Rasmussen, 1997). The youngest sediments traversed by well G2 are of Early-Middle Miocene age, based on regional knowledge and according to the subcrop age map of Rasmussen (1997). However, the stratigraphic control in well G2 does not allow us to identify the age of the top sediments, because it starts only ~650 m deep from the sea bottom, precisely into the Anguille Group (Late Cretaceous). In the easternmost part of the section, sediments of Cap Lopez Group are ~800 ms TWT thick. The reflectors are subparallel and subhorizontal, partly disturbed by diapirs. At ~15 km from the section end, thicknesses decrease down to ~500-600 ms TWT. Thicknesses of the Cap Lopez Group remain constant to the southwest at a few hundred ms TWT, until layers are cut by the erosional unconformity (Fig. 5). The post-Cap Lopez sequence formed by Late Cretaceous-Eocene sediments is only ~200 ms TWT thick in the easternmost part of the section. Farther southwest, at ~15 km from the section end, thicknesses increase rapidly and are between 800 and 1000 ms TWT until layers are again cut by the unconformity surface. From west to east, reflectors converge upwards at ~15 km from the section end. They are slightly dipping towards the southwest and have been eroded at the surface, resulting in a westward decreasing age of the subcrops.
Towards the southwest, sedimentary layers are cut by the unconformity surface down to the top of Madiela sequence. Seawards, after the erosional surface disappears, the post-Madiela deposits are thinner. Thicknesses do not exceed more than 200-250 ms TWT, along more than 80 km, up to the southwest end of the profile (Figs. 6 and 7).
2.4.2. Above the unconformity
Sediments above the unconformity surface produce clear and continuous
reflectors subparallel to the sea bottom. This package is formed by Neogene clastic sediments belonging to the Mandrové, M’Béga, N’Tchengué and Akosso groups (Fig. 4). There are no accurate data on the age of the upper clastic package, but based on the geometric relations and the uncertainty range of the hiatus, its age is most probably Early or Middle Miocene and younger (Rasmussen, 1997; Seranne et al., 1992). This sedimentary package corresponds mainly to terrigenous sediments fed by the Congo River fan system and by other regional rivers (Lavier et al., 2001). An example of a channel is visible on the southwestern part of line 3 (Fig. 7). On the whole, reflectors are subparallel to the sea bottom and indicate little deformation associated with movement of the underlying diapirs. These reflectors onlap the
7

unconformity surface, and a progressive increase in thickness towards the southwest is observed from 0 to 1500 ms TWT.
2.4.3. Erosional unconformities
Major unconformities, similar to the one observed along the composite seismic line, are present along the entire western African coast, from the Niger delta to the Namibe Basin (Seyve et al., 2000), as in many other places in Africa (Burke, 1996). It is generally assumed that 1) the unconformity surface formed during one event, and 2) this event was contemporaneous all along the margin. Data from the South Gabon do not support such a schematic view. Offshore Gabon, the hiatus corresponding to this submarine erosion varies according to different authors, from Eocene to Early Oligocene (Seyve et al., 2000), Middle Eocene to Early Miocene (Rasmussen, 1997). Whereas seismic records one single event (i.e. one major unconformity), more detailed studies based on well data reveal a more complex architecture resulting from several stacked erosional events (Seyve et al., 2000). Three regional unconformities were recorded in the area, at the top of the Animba Group (40.5 Ma), at the top of the Lower Mandrové Group (30 Ma) and at the top of the Upper Mandrové Group (15.5 Ma) (confidential data) (Fig. 4). 3. A geological cross section across the South Gabon Basin
3.1. Methods
For the purpose of depth conversion, the South Gabon profile has been
subdivided into four units, namely sub-salt siliciclastics, carbonates, salt and terrigenous-siliciclastic sediments. Despite the lack of constraints below the salt, we did attempt to depth-convert the domain underlying the evaporites where few reflections have been picked. Interval velocities are derived from well velocity surveys (e.g. sonic logs) and seismic stacking velocity functions (confidential data). These velocity studies cover the offshore South Gabon, the proximal domain and the ultra-deep water area, and the offshore Angola, from the Lower Congo Basin in the north to the Kwanza/Benguela/Namibe basins in the south (Fig. 1). Velocities have been determined down into the syn-rift section and have been calibrated to available wells (particularly to G2 located on the shelf). With the exception of the salt, the interval velocity of each lithology increases with depth, attributed to the compaction of the sediments and is defined as following:
V(z) = Vo + kz (1)
z depth (m) V(z) interval velocity (m.s-1) Vo initial velocity (m.s-1) k rate of change in velocity with increasing depth (s-1)
V(t) = Vo . ekt (2)
t one way travel time (s)
z = Vo (ekt-1)/k (3)
The k value, rate of velocity change, has been chosen for each unit by estimating its thickness and the velocities at its top and base. Velocity values and adopted
8

parameters are indicated in Table 1. A lateral change in velocity within the Madiela unit has been applied, following the facies change from shallow water carbonates in the proximal domain (line 1) to shaly deposits in the distal domain (lines 2 and 3). Estimated uncertainties associated with velocities may produce in the final depth conversion a total error of 100 to 200 metres down to the base of the salt, along the profile where well calibration was not possible. False reflections namely 'pull-up' and 'pull-down' appear beneath the salt layer on the time section. These are effects of velocity differentials upon the underlying sequences (i.e. the carbonates or the shales of the Madiela Group) caused by the variation in thickness of the constant-velocity salt layer (e.g. east of the section). Because the base of the evaporites can not be systematically picked with enough accuracy, the calculations of the corresponding depths are sometimes obviously not correct. Therefore, in these cases, the base of the salt has been locally smoothed (Fig. 8).
3.2. Depth-converted section
3.2.1. Overall geometry of the post-rift succession
Present-day water depths in the southern Gabon Margin increase from a few
tens of metres on the continental shelf to 3.5 km at the ocean-continent boundary (Figs. 3 and 8). Sea floor deepens towards the southwest with a slope of ~2.3˚ along a distance of ~60 km, from the position of well G2 to the western part of the middle line (position F in Figs. 6 and 8b). Farther southwest, the sea bottom is less inclined, with an average slope of 0.7˚, and becomes more or less horizontal farther in the ocean.
The sedimentary package as visible in depth-converted section has a fairly constant thickness along the entire profile. The average thickness of the post-salt succession can be approximated to 3000 metres. All along the profile, the base of the salt layer presents many irregularities, and the associated downslope changes towards the ocean allows to divide the margin into three distinct areas. In the easternmost part of the continental shelf, over a width of 30 km, the salt base is more or less horizontal (Fig. 8a). Farther, southwest of well G2, along ~100 km, a dip towards the southwest is observed associated with an angle of 2.7˚ on average. The slope is not constant but is composed of dipping portions and short-scale steps. At the western edge of the profile, along the last 12 km of evaporites, the slope of the salt floor dips towards the northeast and flattens (Fig. 8c).
3.2.2. Ezanga Formation
Due to salt mass displacement, salt thickness, corresponding to the Ezanga
Formation is quite variable. The highest diapirs, more than 2.0 km thick are located on each end of the profile, piercing into Cenomanian layers in the east and Miocene units in the west, even so they are not reaching the sea floor. From the shelf break towards the ocean, salt structures become higher and wider. From east to west, salt structures change progressively from quasi-disconnected and symmetrical diapirs (Fig. 8a) to an irregular layer 600 ± 200 m thick (Fig. 8b), and finally to large salt mass structures (Fig. 8c). Around the foot of the slope, swell structures disappear completely and are replaced by asymmetrical diapirs, tilted towards the southwest, with a height of 1600 to 2400 m. Along strike, along similar reflection seismic lines, salt structures follow an identical pattern from an extensional regime in the upslope domain (east) to a compressional regime in the downslope domain (west). At the western termination, the salt terminates with a huge salt mass extending laterally over more than 10 km (Fig. 8c).
9

3.2.3. Madiela Group
The average thickness of the Madiela Group, corresponding to the carbonate
platform and the coeval shaly deposits, represents ~1000 m. Lateral changes in thickness and structure are directly related to the salt mass distribution. Maximum thicknesses are found between swells or diapirs and correspond to 1300 m on average. Minimum values, hundreds of metres, characterize areas above salt structures. Along the whole regional profile, the entire sequence of the Madiela Group has been preserved with the exception of a minor erosion (of hundred of metres at maximum along ~1 km) related to the major submarine unconformity (Fig. 8a, position 60 km). In the eastern part of the section (line 1, Fig. 8a), the Madiela Group is mainly composed of shallow water carbonates and corresponds to thick deposits (e.g. 1500 m under well G2). Maximum thicknesses (up to 2500 m, ~10 km east of the shelf break) are associated with wide tilted blocks (width up to 10 km) and with large listric faults. Farther towards the ocean along ~30 km, a transitional zone to thinner deposits is observed with an average thickness of 500 m. Along the last 35 km of line 3, between the compressional diapirs, the deposits of the Namina Formation, the coeval shaly deposit of the shallow water carbonates, become thicker, 1400 m on average (Fig. 8c).
3.2.4. Post-Madiela succession
Along the entire section, the post-rift clastic succession on top of the Madiela
deposits represents a little more than half of the entire salt/post-salt sequence (with an average thickness of ~1.6 km). The thickness of this sedimentary succession increases irregularly from the coastal area towards the ocean from 1.2 to 3.0 km, resulting from variations in the amount of accommodation space and sedimentation architecture. Some of these irregularities are related to salt tectonics, which produces minor variations in thickness in the order of ~100 metres, up to 400 metres at maximum. East of the shelf break and of the unconformity, the Late Cretaceous-Early Tertiary clastic sediments correspond to an average thickness of 1.4 km. The Cap Lopez Group is 1.1 km thick along ~20 km in the easternmost side of the profile (Fig. 8a). Farther southwest, this thickness decreases to an average <400 m (e.g. ~180 m in well G2) and becomes insignificant west of the unconformity in the deep ocean area. On the other hand, the post-Cap Lopez sediments are thin in the easternmost part of the shelf reaching 400 metres maximum. Farther southwest, these layers thicken to 1.0 km on average until they are cut by the unconformity. Farther towards the ocean, thicknesses decrease, to a few hundred metres on average. West of the unconformity, the post-Madiela sedimentary column, composed for 80% of its thickness of the prograding Neogene deposits, form an irregular wedge shape reaching ~2.5 km at the western limit of the salt basin (Fig. 8c). West of the unconformity termination, the upper part of the clastic succession, from the Mandrové to the Akosso groups (Fig. 4), represents a thickness varying from ~1.0 to 2.0 km along ~100 km. 4. Subsidence analysis
4.1. Method and constraints
Definition of the present-day margin geometry and observation of thicknesses
have been complemented by subsidence analysis, derived from wells and geological interpretation of seismic lines. To quantify vertical movements and associated sedimentation rates, wells (T. Enoksen and A. Lønøy, personal communications) have
10

been backstripped, illustrating key features of the post-rift tectonic evolution of the continental shelf. Although limited to the post-rift period, the subsidence curves provide relevant information and constraints on the syn-rift thinning history, and therefore, on the tectono-thermal evolution of the margin.
The present study is based on 25 wells, mainly located offshore on the shelf area where water depths are <100 m (Fig. 3). The well distribution covers 300 km along the south Gabonese coast. On average, more than 3000 metres of sediments have been drilled in each well, including entirely the post-rift sequence and partly the syn-rift column. The majority of the wells penetrate the syn-rift sequence at least down to the Dentale Formation (Barremian). The most proximal wells even reach older sediments of the Kissenda Formation (Berriasian-Hauterivian), which represents one of the earliest syn-rift deposits (Fig. 4). Due to data confidentiality, no detailed descriptions of the wells (lithology, thickness, unit age, and paleowater depth) are presented.
Basement subsidence is calculated by restoring the sedimentary column to its initial thickness and density, using observed thickness, ages of horizons, lithologies and associated porosities and paleowater depths (T. Enoksen and A. Lønøy, personal communications). The density and the porosity were derived from the nature of the sediments (Table 2) known through detailed and numerous intervals of the wells (more than 25). The composition of each of these lithological units was identified (T. Enoksen and A. Lønøy, personal communications), and is modelled as a combination of sand, shale, silt, carbonate, halite and anhydrite (Table 2). Mechanical compaction is therefore applied using standard exponential porosity-depth relations relative to specific lithology. The porosity calculated for each lithological unit corresponds to a mean value derived from maximum and minimum prosity depth curves (Equations 4 and 5). See Table 2 for the density values and porosity parameters used and based principally on the studies of Bond & Kominz (1984) and Sclater & Christie (1980). Calculated porosity values were in good agreement with measured porosity data when available.
zcez 00
0 < z < zp (4)
zp < z < zc
ez1
1
(5)
z depth zp depth at which the deeper porosity relation (Equation 5)
takes over from the shallow one (Equation 4) 0,1 surface porosity c0, c1 characteristic depth constants
The tectonic subsidence is then calculated by removing the isostatic subsidence of the basement caused by the load of the sediments (Bond & Kominz, 1984; Sclater & Christie, 1980) using the assumption of the Airy isostasy.
The analysis has been concentrated on the shelf area, which is far better constrained than the rest of the section. As the continental shelf remained under a very small water column (less than a few hundred metres) during the post-rift period, paleowater depths do not have a major influence on the first order subsidence calculations. In absence of accurate paleowater depth data in more distal parts of the basin, backstripping of synthetic wells based on depth-converted seismic sections (e.g. G3 located in the deep offshore area at ~3 km water depth, Fig. 3) is not relevant. Besides, the long-term amplitude of the sea level, during the entire basin history, has
11

been higher relative to the present-day one, by a few hundred metres at maximum (Haq et al., 1987) (Fig. 4). Effects on subsidence curves are in the same range. Because variations in sea level do not modify the first order patterns of subsidence, they have not been included in the backstripping results of Figs. 9 and 10.
Due to well locations and penetration depths, subsidence curves are most accurate for the post-rift period along the continental shelf. Practically in all wells, the base of the syn-rift is unknown. Consequently, our subsidence curves do not stand for absolute depths of burial. In our diagram, the initial point (depth = 0) is not considered with respect to the initiation of rifting due to this lack of control on the total syn-rift sedimentary thickness. The zero level depth has been associated with the time of the oldest drilled formation and differs from one well to another, and therefore, does not correspond to the beginning of the subsidence. A further source of uncertainty linked with the synsedimentary gravity-driven deformation, concerns the drilled evaporite thickness which does not correspond to the initial thickness of deposition. The escape or the rise of salt results in underestimating (e.g. Fig. 9d) or overestimating (e.g. Fig. 9a) the amount of subsidence calculated for the depositional period, i.e. from 116 to 114 Ma. However, in wells where salt thickness is limited, thick carbonate layers are present, and vice versa. The underestimated subsidence during the Ezanga deposition period (116 to 114 Ma) is then compensated by the overestimated subsidence associated with the Madiela deposition period (114 to 99 Ma). Therefore, trends derived from backstripping for the early post-rift period have to be considered for the entire following time window, namely from 116 to 99 Ma.
In order to illustrate the subsidence history, results from 8 selected backstripped wells are presented. Some are located in the vicinity of the regional seismic profile composed of the gathering of lines 1, 2 and 3, such as the onshore well (G1) located ~20 km east of the section (Fig. 3) and the well (G2) penetrating the continental shelf (Fig. 9). Some other wells are located 50 to 200 km away north of the regional line (Fig. 10).
4.2. The syn-rift phase
Fifteen onshore and offshore wells, covering 100 km along the coast and 60
km along the NE-SW direction, penetrate significantly the syn-rift sequence (500 to 2000 m) from the Dentale down to the Kissenda formations. The corresponding decompacted sedimentary column at the end of the syn-rift phase (118 Ma) varies between 700 and 2400 m. Associated total subsidence values are similar since paleowater depths were small (Figs. 9 and 10). Sedimentation and subsidence rates represent minimum values, as the syn-rift section has not been drilled entirely. The maximum recorded basement subsidence does not exceed 2.5 km. For instance, at the position of well G2, the subsidence corresponds to 1.5 km (Fig. 9d). Except along line 1 (Fig. 5), seismic resolution does not allow to combine seismic and well data in order to determine if the syn-rift drilling is localised in a graben or not.
From the studied wells located along the shelf, syn-rift sedimentation rates vary between 100 and 1000 m/Myr according to the time period involved and the location, and correspond to an average peak of ~300 m/Myr. Along our section for instance, the graben at the position of well G2 is characterized by a syn-rift subsidence rate of 375 m/Myr (Fig. 9d). These sedimentation rates represent most likely minimum values because calculations are based on decompacted present-day thicknesses, and do not take into account the entire syn-rift period as any erosional periods. In the vicinity of our section, under the continental shelf, the break-up unconformity is recorded in the majority of the wells associated with larger gap time, especially in the eastern side. The Dentale and Gamba formations are rarely found in the most proximal wells although in the western part of the platform, Dentale deposits can be partly observed.
12

4.3. The post-rift phase
Accurate subsidence information obtained for the post-rift stage concern 21
locations, where wells transect the entire post-rift sequence, reaching the base of the Vembo/Gamba formations (Figs. 9 and 10). The well coverage is rather broad, 280 km along the coast and 75 km along a NE-SW axis from the coastal area towards the ocean. Therefore, observed similarities in subsidence histories reflect common geological history at a regional scale.
In the proximal domain, the post-rift period can be divided into three main phases characterized by specific subsidence patterns and sedimentation rates. A first period of rapid subsidence, of variable duration, is followed by a smoother and gentler transitional period associated with a decline of the subsidence and sedimentation rates, and eventually by a last stage with quasi-null subsidence amplitude (Figs. 9 and 10). Onshore and proximal wells (water depth <100 metres; e.g. G1, Fig. 9a), located in the vicinity of the seismic line (Fig. 8), record a rapid early post-rift subsidence period of 4 Myr with sedimentation rates of 200 m/Myr. For the wells located on the shelf and closely to our cross-section, the strong basement subsidence is observed for the first 19 Myr of the early post-rift history (i.e. 118 to 99 Myr) with a value of 1.9 km on average (e.g. G2, Fig. 9d). In some places north of our regional profile (Fig. 3), this period of rapid subsidence lasted even longer than 19 Myr, extending to 30 Myr on average (Figs. 9c and 10a) and including then the Cap Lopez, Azilé and partly Anguille deposits. However in both of these cases, corresponding sedimentation rates reach ~100 m/Myr on average. Following this rapid subsidence stage, a net decline of subsidence equivalent to a few hundred of metres and low associated sedimentation of less than 50 m/Myr are observed and concern a relatively short period. The duration of this second stage varies between 9 and 15 Myr depending on the location. The third post-rift phase that lasted since ~80 Ma corresponds to minor vertical movements of few hundred metres. Associated subsidence and sedimentation rates are very low, not more than a few m/Myr.
During Late Aptian and Albian times, significant subsidence and sedimentation took place with the deposition, along almost the entire South Gabon present-day continental shelf, of ~1.9 km on average of sediments (e.g. 1.7 km at G2). This sedimentary column includes the Gamba and Vembo formations (for 4%), the Ezanga evaporites and the Madiela shallow water carbonates (for 96%). All over the shelf domain, the amount of sediments deposited during the first 19 Myr of post-rift represents ~90% of the entire post-rift sequence thickness and corresponds to a high sedimentation rate of ~100 m/Myr, equivalent to one third of the syn-rift rate. 5. Post-rift margin tectonic evolution
Based on depth-converted sections and analysis of deposition, we will describe and discuss semi-quantitatively the South Gabon Margin history, from the deposition of the Aptian evaporites onward. Some main geological stages have been defined, corresponding to specific patterns of deposition, localisations of the main depocenters and sedimentation rates.
5.1. Late Aptian
During the Late Aptian, in the early post-rift phase, a wide evaporites basin was formed along ~2000 km of the newly created African margin, from Angola to Cameroon (Jackson et al., 2000). A similar salt basin developed along the South America Margin. The conjugate basins were separated by a mid-oceanic ridge, and did
13

not originally form a single salt basin (Jackson et al., 2000). Based on offshore cross section (Fig. 11), evaporites extend South Gabon along at least ~150 km in the NE-SW direction. We consider 1) a maximum lateral gliding of the salt towards the SW of a few tens of kilometres (Marton et al., 2000), and 2) a continuity of the salt deposit towards the NE along a few tens of kilometres. Indeed, onshore wells, located ~20 km away from the eastern termination of the seismic line 1, have traversed the Ezanga Formation (~800 m thick), and the Precambrian basement outcrops ~20 km east of the coastline (Seranne et al., 1992). Based on these two observations, the initial width of the evaporite basin along the considered section is approximated to ~150 km.
Thickness of the salt formation, and therefore, subsidence experienced during Aptian time are difficult to constrain because of later vertical and horizontal movements. Despite the 3D effects of salt gliding (Rouby et al., 2002), the initial salt thickness has been estimated based on the 2D cross section (Fig. 11). In this calculation, we neglected the amount of salt, which could have possibly been lost by dissolution through piercement diapirs reaching the sea bottom, thereby minimizing our estimate. The initial shape of the evaporite basin was definitely irregular, possibly a lens (Marton et al., 2000) or a wedge due to the ongoing subsidence. Assuming a simple geometry of a constant thickness layer, however, and dividing the present-day surface of the salt by the initial Erreur ! Signet non défini.width of the basin (~150 km), an initial depositional thickness of ~600 metres is obtained. This value differs from the estimation of 300 m by Brink (1974) who studied the platform area and did not include the entire evaporite system, especially the most distal part where massive salt structures are concentrated. In the centre of the African salt basin, in the Lower Congo or Kwanza Angolan basins, initial evaporite thickness reached more than 1000 metres (Jackson et al., 2000).
5.2. Late Aptian to Albian
Following the very shallow water depth conditions of evaporite deposition, strong subsidence associated with high sedimentation continued in Late Aptian along the entire margin, 4 to 19 Myr following continental break-up. From the coastal area to the current ocean-continent boundary area, seismic data reveal thick sedimentary sequences corresponding to the deposits of the Madiela Group (114 to 99 Ma). Decompaction of the Madiela unit, derived from the regional cross section (Fig. 11), has been performed along the profile. The procedure adopted is similar to that adopted for backstripping calculations, with porosity depth relation defined per geological unit (Table 3). Restored sedimentary columns for Albian time indicate a slight lateral increase in thickness towards the ocean. Deposits of the carbonate platform in the shelf domain, e.g. at the G2 position, reached 1700 m ± 150 m whereas in the deep area, e.g. at the G3 position, thickness of the coeval shaly deposits varied from around 2000 m ± 100 m. Based on lateral changes in the internal geometry of the Madiela unit (Figs. 8b and c) and on the general stratigraphy (Fig. 4), we deduce that the margin was divided laterally into two parts. In the easternmost part, including at least the present-day continental shelf, the sea floor was subhorizontal. Salt structures are not associated with gravity gliding. No horizontal evaporite movements are visible, only diapirs rising upwards due to the overlying loads (Figs. 5 and 8a). Over the continental shelf area where no tilting occurred, thick shallow water carbonates were deposited during ~15 Myr, attesting to a strong subsidence quantified by backstripping calculations (Figs. 9 and 10). Lateral distribution of the carbonate platform along South Gabon extends probably in the NE direction towards the Eastern Hinge Zone, which delimits the Precambrian basement from the onshore sedimentary cover (Fig. 3). South of Angola, in the Benguela Basin, the carbonate platform extends onland along tens of km in the ~EW direction, onlapping on the continental basement (Diakese et al., 2000).
14

Southwest of the Atlantic Hinge Zone, located a few tens of km west of the shelf break, shallow water carbonates (Azingo Formation) are replaced by contemporaneous deeper and more shaly deposits (Namina Formation) (Brink, 1974; Teisserenc & Villemin, 1990). The width of the carbonate platform is estimated at ~100 km in the NE-SW direction (Fig. 11). In the westernmost part of the margin, salt tectonics differs strongly and includes gliding of salt and overlying sediments as well as diapirism. Salt tectonics was triggered by the onset of tilting of the salt floor and by the load of the sediments above. Evidence for syntectonic sedimentation is provided by the gliding of the blocks with relative movement between them being accommodated by normal faults that sole out in the salt layer itself, resulting in lateral thickness variations within the Madiela blocks.
While it is obvious that tilting of the sea floor towards the southwest occurred since Late Aptian time across the western part of the basin, the amount of tilting is poorly constrained. The slope was probably progressively established through time as a direct consequence of differential subsidence rather than created during a single phase in Late Aptian-Early Albian times or several successive distinct phases. The slope characterizing the salt base was and is irregular (Fig. 11). No tilting occurred since Oligocene time in the present-day shelf break area, as revealed by salt tectonic activity and related listric faults that terminate in the pre-Oligocene sequences. We can reasonably assumed an average tilting of ~1º for the Late Albian period, with bathymetry starting to increase at ~55 km from the eastern end of the regional profile. Basinal facies has been mapped west of the Atlantic Hinge Zone by biostratigraphy in several wells, located at the present-day in the deep water area (Brink, 1974; Teisserenc & Villemin, 1990). The slope at the base of the salt combined with the restored sedimentary package at Albian time provides constraints on paleowater depths. Deepening of the western part of the basin indicates a progressive increase of the water column from a few hundred metres (G2 position) to ~1.4 km (G3 position).
5.3. Late Albian to Cenomanian
The open marine phase which started over the Ezanga evaporites and led to the development of a wide shallow carbonate platform during Late Aptian to Albian, continued during Cenomanian, 25 Myr after the continental break-up. In the eastern part of the margin, mainly shallow marine sandstones were deposited while deeper sedimentary facies, with siltstones and shales accumulated in the west (Brink, 1974). These sedimentary units correspond to the Cap Lopez Group (6 Myr deposition) (Fig. 4). As revealed by shallow seismic (Fig. 5), the position of the Cenomanian shelf break was located ~25-30 km east of the present-day one. Restored thickness of the Cap Lopez Group decreases towards the ocean along a distance of ~60 km, from 900 to 200 m. During a short period of time, i.e. ~6 Myr, significant amounts of sediment have accumulated on the shelf corresponding from east to west to sedimentation rates of 230 to 50 m/Myr respectively. Sedimentation took place mainly in the eastern part of the margin, on the continental shelf, with rather limited deposition farther towards the ocean (Figs. 8b and c). West of the present-day shelf break, the Cap Lopez sedimentary layers become much thinner, passing from few hundred to few tens of metres. Assuming a reasonable slope at the base of the salt of ~1.5º at Cenomanian time and considering the corresponding restored thicknesses, paleowater depths at the western end of the profile would have reached ~2.5 km. During a few Myr, strong subsidence affected the margin and took place along the entire profile with, in the most eastern part high sedimentation, and in the rest of the section the establishment of large water column. Salt tectonics affected the sedimentary formations but was significantly less active than during the Aptian - Early Albian period. The main evidence for salt activity is observed at both ends of the profile, where the diapirs are the highest, even so they are not piercing up to the sea floor. These salt structures were initiated during Late
15

Aptian and kept on growing during Cenomanian. In the easternmost part of the continental shelf, loading of the overburden sediments led to the rise of salt, given birth to diapir structures. In the westernmost part of the profile, due to the gliding along the slope of the salt floor, diapirs which were previously under extension became compressional, and moved upwards into the Miocene layers.
5.4. Late Cenomanian to Bartonian
From Late Cretaceous to Late Eocene time (25 to 77.5 Myr following continental break-up), clastic progradation took place along the South Gabon Margin, as revealed by seismic and oceanward migration of the shelf break (Figs. 5 and 8a). The exact position of the shelf break has been erased by mid-Tertiary erosional events. The migration of the continental shelf depocenter is estimated to be at least 30 km, which corresponds to the distance separating the Cenomanian shelf break from the Tertiary erosional unconformity. Subsidence in the easternmost part of the continental shelf ceased, and is represented westwards with much less intensity than during the first 25 Myr of post-rift (Figs. 9 and 10). Shallow water sedimentation with thicknesses at least equal to 1 km took place in the westernmost part of the continental shelf, while minor deposition (<500 metres) associated with large water column characterized the deeper parts of the margin. Assuming a slope at the base of the salt of 2.5º and considering the restored thicknesses, paleowater depth profile reached ~3.0 km at its oceanward termination.
5.5. Bartonian to Langhian
Erosion affected strongly the margin during the Oligocene-Miocene period (39.5 to 15.5 Ma) (Fig. 4), and represents a large scale feature occuring in different places along the southwestern African coast. A major submarine erosional unconformity is recorded on seismic (Fig. 5), running clearly along a distance of ~50 km. Sea floor was probably affected by erosional currents, generating slumps along the slope, accompanied by the retreat of the shelf break. Post-carbonate sediments (Cap Lopez to Animba groups) on both sides of the shelf break have been eroded over a distance of 50 km (Figs. 5 and 8a), and probably transported and redeposited westwards. Whereas seismic records one single unconformity surface, detailed stratigraphy led to the conclusion that the region has undergone several periods of erosion (Teisserenc & Villemin, 1990). The latest unconformity dated Early Miocene might have overprinted previous ones, e.g. the unconformity occurring at the Eocene-Oligocene transition. The superposition of effects related to different erosional events makes the distinction difficult. (Lavier et al., 2001) suggested that a succession of favourable climatic and tectonic conditions, i.e. global cooling at the Eocene-Oligocene transition (Lear et al., 2000) and Miocene epirogenic uplift of Africa (Bond, 1978; Lunde et al., 1992; Walgenwitz et al., 1990; Walgenwitz et al., 1992), led to an increase of the drainage network, resulting offshore in a major unconformity. Since the Early Miocene, the easternmost part of the profile, corresponding to the present-day continental shelf, did not experience subsidence (Figs. 9 and 10). A thin sequence (tens of metres) was deposited at very shallow water depth. Formation of accommodation space occurred westwards of the present-day shelf break in the deeper parts of the margin where sediments were transported. Progradation of the system led to thick deposition oceanwards, progressively increasing laterally to 2.5 km in the westernmost end of the profile, associated on average in the westernmost part of the margin with sedimentation rates comprising between 50 and 100 m/Myr.
16

6. Discussion
Rifted margin subsidence patterns often comprise two major and distinct phases, a rapid and strong syn-rift subsidence followed by a smoother post-rift thermal subsidence (McKenzie, 1978). However, many data analyses in extensive tectonic settings do not support such a schematic view (Ziegler & Cloetingh, 2004). In particular, the post-rift history can be sometimes controlled by compressive intraplate stresses, e.g. along the Norwegian or Australian margins (Cloetingh & Kooi, 1990; Kooi & Cloetingh, 1989; Reemst, 1995). Along the studied South Gabon Margin, the most striking event is the anomalous extra subsidence recorded during the early post-rift period, associated with high sedimentation rates reaching on average 100 m/Myr (Figs. 9 and 10). This subsidence pattern extends further south with similar subsidence evolution as derived from burial history curves of wells located in the Lower Congo and Kwanza basins offshore Angola (Spathopoulos, 1996). A period of rapid subsidence is recorded until the end of Albian time, for which the basement subsidence reaches an average of 2 km, following by a slowing down of the subsidence in Late Cretaceous. Based on our results and regional geological knowledge of the south African margins, several hypotheses are discussed to explain this anomalous pattern.
6.1. Ongoing rifting
A temporal shift of the boundary between the syn-rift and the post-rift period could explain the subsidence trends derived from backstripping calculations. If the Ezanga evaporites would be syn-rift, the anomalous strong subsidence observed in Late Aptian and Albian times, would be in fact partially associated with the syn-rift phase. This hypothesis has to be rejected because the post-breakup origin of the Aptian salt is very well constrained. Along the studied seismic lines, geometries of the post-salt structures are not characteristic of syn-rift deposits. Syn-rift grabens are observed below the evaporite layer (Fig. 5, position well G2). Identical structure patterns have been identified on a large dataset of seismic lines that cover the entire African salt basin, from Angola to Cameroon (Duval et al., 1992; Meyers et al., 1996; Teisserenc & Villemin, 1990). These post-salt structures, grabens and tilted blocks, are the results of synsedimentary gravity-driven deformation above an inclined substratum, with the salt layer acting as a decollement surface. This concept, widely accepted nowadays, has been well described along numerous margins, especially in the South Atlantic salt basins (Burollet, 1975; Cobbold et al., 1995; Demercian et al., 1993; Duval et al., 1992; Seranne et al., 1992; Spathopoulos, 1996), and has been successfully validated by analogue modelling experiments (Mauduit, 1998; Mauduit et al., 1997b; Vendeville & Cobbold, 1987; Vendeville et al., 1987). In addition to the seismic stratigraphy and structure, the post-breakup origin of the Aptian salt is supported by magnetic anomalies, plate reconstructions and hydrothermal potash evaporites (Jackson et al., 2000).
6.2. Salt tectonics contribution
The subsidence history of the South Atlantic salt basins during Cretaceous time, is rarely described and analysed. The main reason is related to the fact that salt tectonics might influence the subsidence. In such a case, subsidence curves reflect both effects caused by rifting and salt tectonics, the difficulty being to quantify the contribution of each process. For instance, the lateral movement of the salt might create some accommodation space, resulting in some extra subsidence. However, salt tectonics offshore South Gabon, especially in its easternmost side, is not responsible to a large extent for the subsidence, which occurred later on, in the early post-rift period. Below we present several arguments which favour another cause, most
17

probably related to the early rifting history, to explain the occurrence of such an extra subsidence. 1. Along the South Gabon, the estimate of the initial thickness of the post-rift evaporite sequence represents at least 600 m. During the short period of its deposition (~2 Myr), important subsidence is already required associated with such a high sedimentation rate. 2. As revealed by seismic, synsedimentary gravity-driven deformation occurred in Late Aptian time when the carbonate platform started to develop. This gravity gliding requires a dipping substratum. Consequently, at this early post-rift time, a slope was already established as a direct consequence of differential subsidence related to tectonics. 3. Lateral escape of the salt can contribute to increased subsidence, in areas where the amount of gliding is important. The South Gabon Basin is located in the northern part of the South Atlantic Salt Basin where evaporite thicknesses are much thinner than in the inner parts of the basin (i.e. offshore Angola). Salt tectonics in the studied region has been there less active, and the horizontal movement of the salt and of the overlying sequences is then limited. The Madiela Group sequence, which covers the evaporite layer, is relatively continuous and forms a series of tilted blocks, so-called pre-raft structures which are not disconnected from each other (Fig. 11) (Duval et al., 1992; Spathopoulos, 1996). 4. The easternmost part of the cross section (Fig. 8a) is characterized by vertical salt diapirs and subhorizontal salt floor. Although no gliding affected this area, strong subsidence occurred during at least 20 Myr, following the deposition of the Ezanga evaporites, attested by the thick shallow deposits from the Madiela and Cap Lopez groups. 5. If salt tectonics were responsible for generation of accommodation space required for the deposition of the thick Madiela unit (114 to 99 Ma), it could hardly explain the strong sedimentation, which kept on up to the end of the Cap Lopez deposition (93 Ma). Indeed, these sedimentary layers overlying the Madiela sequence have not been so much deformed by listric faults associated with salt movement (Figs. 5 and 8a).
6.3. Equatorial Ocean rifting
Janssen et al. (1995) presented backstripped wells from numerous African rifted basins, including the Gabon Basin. This study has focused on the tectonic subsidence that the basins have undergone, and has established a close correlation with the changes in plate motions. Offshore Gabon, they recorded high tectonic subsidence rate for the Albian period (40 to 55 m/Myr) and suggested that this acceleration in subsidence might be caused by the rifting and opening of the Equatorial Domain (Fig. 1). We do not exclude that the Equatorial Ocean rifting influenced the subsidence patterns along the South Gabon Margin. However, we favour the following scenario: the major contribution to the unexpectedly large subsidence in the early post-rift is related to the thermal state of the lithosphere.
6.4. Thermal anomaly
We propose that the subsidence patterns along the South Gabon margin is strongly controlled by the rifting process, namely the thermal state of the lithosphere during the syn-rift and possibly the pre-rift period. The delay in time of the smooth thermal subsidence by a few tens of Myr in this region may be easily explained by a high thermal state of the lithosphere. Such a thermal anomaly would have restricted the syn-rift subsidence and therefore prevent the development of thick syn-rift basins. Re-interpretation of deep multi-channel seismic reflection data (Rosendahl & Groschel, 2000; Rosendahl et al., 1991) integrated with gravity modelling analysis in the South Gabon Basin support such margin geometry with shallow depth syn-rift basins
18

associated with a relatively thin crust (Dupré, 2003; Dupré et al., 2001a). Further south, along the Angola Margin, the distribution together with the infill of the syn-rift depocentres are rather limited as inferred from the analysis of recently acquired deep reflection and refraction seismic lines (Contrucci et al., 2004; Moulin et al., 2005). Moreover, 2D forward numerical modelling simulating the thinning of the South Gabon rifted Margin, and the subsidence history and stratigraphy of the corresponding extensional basins, (Dupré, 2003; Dupré et al., 2003; Dupré et al., 2001b) requires strong thinning with the subcrustal lithosphere much more thinned than the crust. Such thinning may be related to a high thermal anomaly responsible subsequently in the initial post-rift stages for the elevated recorded subsidence rates. 7. Conclusions
An integrated study based on reflection seismic and well data allows to characterize quantitatively the tectonic evolution along the South Gabon Margin. The regional profile which is crossing the entire basin along ~200 km in combination with subsidence analysis highlights important aspects of the post-rift history, that have major implications for the rifting history. 1. The initial Erreur ! Signet non défini.width of the northern part of the African Salt Basin is estimated at ~150 km in the NE-SW direction of extension. The corresponding evaporite thickness reached at least ~600 metres in Late Aptian time, less than in the inner part of the Salt Basin, e.g. in the Angolan Basins where thicker layers of salt were deposited, more than 1000 metres. The width of the shallow water carbonate platform extended in Albian time along ~100 km in the NE-SW direction with an average thickness of ~1700 metres. The coeval shaly sediments deposited in deeper water environment southwest of the platform are slightly thicker, ~2000 metres. 2. Tilting of the sea floor towards the southwest occurred since Late Aptian time across the western part of the basin and led to the present-day configuration with an overall slope of the salt and post-salt sedimentary packages of ~2.7˚. Paleowater depth estimates indicate an increase through time of the water column in the most western part of the basin, from ~1.4 km in Late Albian time, ~2.5 km in Cenomanian time, ~3.0 km in Bartonian time to ~3.5 km at present-day. 3. In the proximal domain, the post-rift period can be divided into three main phases characterized by specific subsidence patterns and sedimentation rates. A first period of rapid subsidence occurred in Late Aptian-Albian times during ~19 Myr, reaching 100 m/Myr on average for the basement subsidence. This fast early post-rift subsidence stage is followed by a smoother transitional and relatively short period, 9 and 15 Myr depending on the location, characterized by a net decline of subsidence (few hundred m) and associated sedimentation (less than 50 m/Myr). The third post-rift phase, which lasted since ~80 Ma, corresponds to minor vertical movements of few hundred metres and quasi-null subsidence amplitude. Associated subsidence and sedimentation rates are very low (a few m/Myr). 4. During Late Aptian and Albian times, ~1.9 km of sediments were deposited offshore along almost the entire South Gabon present-day continental shelf. The associated sedimentary column includes the Gamba and Vembo formations (for 4%), the Ezanga salt and the Madiela shallow water carbonates (for 96%). All over the shelf area, the amount of sediments deposited during the first 19 Myr of post-rift represents ~90% of the entire post-rift sequence thickness and corresponds to a high sedimentation rate of ~100 m/Myr, equivalent to one third of the syn-rift rate. For the same period, the distal domain records stronger subsidence as indicated by the thicker sedimentary deposits, associated mainly to the Namina Formation deposition, coeval deposits of the shallow water carbonates from the proximal domain, and the initiation of strong paleowater depths related to the tilting of the basin oceanwards.
19

5. Rifted margin subsidence patterns often comprise two major and clearly distinct phases, a rapid and strong syn-rift subsidence followed by a smoother post-rift thermal subsidence. Along the studied South Gabon Margin, this is definitively not the case and the most striking event in the margin evolution is the anomalous extra subsidence recorded during the early post-rift period, associated with high sedimentation rates. This post-rift subsidence is unexpectedly large compared to the syn-rift subsidence, for a normal margin evolution. The transition time between the syn-rift and the post-rift period is clearly dated at 118 Ma, in relation with well defined stratigraphic units. Therefore, this period of strong subsidence, from 118 to 99 Ma, corresponds without any doubt to the early post-rift and cannot reflect a late syn-rift phase. Salt tectonics offshore South Gabon, although responsible for some accommodation space, cannot be the major cause to explain the total amount of the extra subsidence. Therefore, we propose an alternative scenario where the early post-rift subsidence patterns are related to the early rifting thermal state of the lithosphere. A high thermal anomaly in the mantle part of the lithosphere implies 1) restricted syn-rift subsidence associated with shallow syn-rift depocentres and 2) accentuated post-rift subsidence rates associated with the waning of such a significant thermal anomaly. The associated high thermal anomaly is highly relevant for petroleum system studies and has direct implications for hydrocarbon generation.
Acknowledgements
We are grateful to Norsk Hydro for funding this study and giving access to West Africa data, seismic and wells, and related internal reports. We thank especially N. Telnæs, C. Gustafsson, D. Hermansen and A. Lønøy. In the framework of a close collaboration between the Norsk Hydro Research centres of Bergen, Oslo and Luanda, the University of Bergen, the University of Rennes and the Vrije Universiteit of Amsterdam, we would like to thank all the participants, especially J.-P. Brun, X. Fort and E. Vågnes. We thank Western Geco, in particular Jodie Elliot and Phil Williams for providing authorisation for shallow seismic lines publication.
20

References
Binks, R.M. & Fairhead, J.D., 1992. A plate tectonic setting for Mesozoic rifts of West
and Central Africa. Tectonophysics, 213(1-2), 141-151. Bishop, D.J., Buchanan, P.G. & Bishop, C.J., 1995. Gravity-driven thin-skinned
extension above Zechstein Group evaporites in the western central North Sea; an application of computer-aided section restoration techniques. Marine and Petroleum Geology, 12(2), 115-135.
Bolli, H.M., Ryan, W.B.F., Foresman, J.B., Hottman, W.E., Kagami, H., Longoria, J.F., McKnight, B.K., Melguen, M., Natland, J.H., Proto, D.F. & Siesser, W.G., 1978. Angola continental margin; Sites 364 and 365. Initial Reports of the Deep Sea Drilling Project, 40, 357-455.
Bond, G., 1978. Evidence for late Tertiary uplift of Africa relative to North America, South America, Australia and Europe. Journal of Geology, 86(1), 47-65.
Bond, G.C. & Kominz, M.A., 1984. Construction of tectonic subsidence curves for the early Paleozoic miogeocline, southern Canadian Rocky Mountains; implications for subsidence mechanisms, age of breakup, and crustal thinning. Geological Society of America Bulletin, 95(2), 155-173.
Brice, S.E., Cochran, M.D., Pardo, G. & Edwards, A.D., 1982. Tectonics and sedimentation of the South Atlantic rift sequence; Cabinda, Angola. AAPG Memoir, 34, 5-18.
Brink, A.H., 1974. Petroleum Geology of Gabon Basin. AAPG Bulletin, 58(2), 216-235. Brun, J.-P. & Fort, X., 2004. Compressional salt tectonics (Angolan margin).
Tectonophysics, 382(3-4), 129-150. Burke, K., 1996. The African plate. South African Journal of Geology, 99(4), 339-409. Burollet, P.F., 1975. Tectonique en radeaux en Angola. Bulletin de la Société
Géologique de France, 17(4), 503-504. Castro, A.C.M., 1987. The northeastern Brazil and Gabon basins; a double rifting
system associated with multiple crustal detachment surfaces. Tectonics, 6(6), 727-738.
Cloetingh, S. & Kooi, H., 1990. Intraplate stresses; a new perspective on QDS and Vail's third-order cycles. In: A. Cross Timothy (Ed.), Quantitative dynamic stratigraphy. Prentice Hall, Englewood Cliffs, NJ, United States, pp. 127-148.
Cobbold, P., Rossello, E. & Vendeville, B., 1989. Some experiments on interacting sedimentation and deformation above salt horizons. Bulletin de la Société Géologique de France, 5(3), 453-460.
Cobbold, P.R., Szatmari, P., Santiago, D.L., Coelho, D. & Rossello, E.A., 1995. Seismic and experimental evidence for thin-skinned horizontal shortening by convergent radial gliding on evaporites, deep-water Santos Basin, Brazil. AAPG Memoir, 65, 305-321.
Contrucci, I., Matias, L., Moulin, M., Géli, L., Klingelhofer, F., Nouzé, H., Aslanian, D., Olivet, J.L., Rehault, J.P. & Sibuet, J.C., 2004. Deep structure of the West African continental margin (Congo, Zaire, Angola), between 5 degrees S and 8 degrees S, from reflection/ refraction seismics and gravity data. Geophysical Journal International, 158(2), 529-553.
Cramez, C. & Jackson, M.P.A., 2000. Superposed deformation straddling the continental-oceanic transition in deep-water Angola. Marine and Petroleum Geology, 17(10), 1095-1109.
Daudré, B. & Cloetingh, S., 1994. Numerical modelling of salt diapirism; influence of the tectonic regime. Tectonophysics, 240(1-4), 59-79.
Davison, I., 1999. Tectonics and hydrocarbon distribution along the Brazilian South Atlantic margin. Geological Society Special Publications, 153, 133-151.
de Matos, R.M.D., 1992. The Northeast Brazilian rift system. Tectonics, 11(4), 766-791.
21

Demercian, S., Szatmari, P. & Cobbold, P.R., 1993. Style and pattern of salt diapirs due to thin-skinned gravitational gliding, Campos and Santos basins, offshore Brazil. Tectonophysics, 228(3-4), 393-433.
Diakese, M., Guiraud, M., Quesne, D., Duarte-Morais, M.L., Amaral, J. & Lang, J., 2000. Preliminary analysis of salt tectonics affecting the Albian carbonate platform of the Angolan Margin (Benguela Basin). In: GeoLuanda 2000 Conference, GeoLuanda 2000, Luanda.
Dingle, R.V., 1999. Walvis Ridge barrier; its influence on palaeoenvironments and source rock generation deduced from ostracod distributions in the early South Atlantic Ocean. Geological Society Special Publications, 153, 293-302.
Dupré, S., 2003. Integrated tectonic study of the South Gabon Margin. Insights on the rifting style from seismic, well and gravity data analysis and numerical modelling. Netherlands Research School of Sedimentary Geology Thesis, Vrije Universiteit, Amsterdam, ISBN 90-9017055-3, 125pp.
Dupré, S., Bertotti, G. & Cloetingh, S., 2003. South Gabon Margin: Tectonic evolution, basin configuration and characteristics of rifting process inferred from multi-data analysis, gravity and forward lithospheric stretching modelling. In: Geophysical Research Abstracts, EGS-AGU-EUG Joint Assembly, Nice, France. 06-11 Avril 2003, pp. 97777.
Dupré, S., Bertotti, G., Cloetingh, S. & Arnesen, L., 2001a. Post-rift evolution of the South Gabon Margin: anomalous patterns and implication for the syn-rift. In: Schriftenreihe der Deutschen Geologischen Gesellschaft, Heft 14. Sven Roth and Andres Rüggeberg, 2001 Margins Meeting, Christian-Albrechts-Universität, Kiel, Germany, pp. 44.
Dupré, S., Bertotti, G., Wheeler, W. & Cloetingh, S., 2001b. Tectonic evolution of the Gabon-Angola Margin based on seismic, well and potential-field data and associated geophysical modelling. In: Geophysical Research Abstracts, XXVI General Assembly European Geophysical Society, Nice, France. 25-30 March 2001, pp. 685.
Duval, B.C., Cramez, C. & Jackson, M.P.A., 1992. Raft tectonics in the Kwanza Basin, Angola. Marine and Petroleum Geology, 9(4), 389-404.
Fort, X., 2002. Processus de la tectonique salifère de la marge Angolaise. PhD thesis, Mémoires de Géosciences, Université de Rennes I, 225pp.
Fort, X., Brun, J.P. & Chauvel, F., 2004. Salt tectonics on the Angolan margin, synsedimentary deformation processes. AAPG Bulletin, 88(11), 1523-1544.
Gladczenko, T.P., Hinz, K., Eldholm, O., Meyer, H., Neben, S. & Skogseid, J., 1997. South Atlantic volcanic margins. Journal of the Geological Society of London, 154(3), 465-470.
Guiraud, R. & Maurin, J.C., 1991. Le Rifting en Afrique au Crétacé inférieur; synthèse structurale, mise en évidence de deux étapes dans la genèse des bassins, relations avec les ouvertures océaniques péri-africaines. Bulletin de la Société Géologique de France, 162(5), 811-823.
Haq, B.U., Hardenbol, J. & Vail, P.R., 1987. Chronology of fluctuating sea levels since the Triassic. Science, 235(4793), 1156-1167.
Jackson, M.P.A., Cramez, C. & Fonck, J.-M., 2000. Role of subaerial volcanic rocks and mantle plumes in creation of South Atlantic margins: implications for salt tectonics and source rocks. Marine and Petroleum Geology, 17(4), 477-498.
Janssen, M.E., Stephenson, R.A. & Cloetingh, S., 1995. Temporal and spatial correlations between changes in plate motions and the evolution of rifted basins in Africa. Geological Society of America Bulletin, 107(11), 1317-1332.
Kampunzu, A.B. & Popoff, M., 1991. Distribution of the main Phanerozoic African rifts and associated magmatism; introductory notes. In: A.B. Kampunzu and R.T. Lubala (Eds), Magmatism in extensional structural settings; the Phanerozoic African Plate. Springer-Verlag, Berlin, Federal Republic of Germany, pp. 2-10.
22

Karner, G.D., Driscoll, N.W., McGinnis, J.P., Brumbaugh, W.D. & Cameron, N.R., 1997. Tectonic significance of syn-rift sediment packages across the Gabon-Cabinda continental margin. Marine and Petroleum Geology, 14(7-8), 973-1000.
Kooi, H. & Cloetingh, S., 1989. Intraplate stresses and the tectono-stratigraphic evolution of the central North Sea. AAPG Memoir, 46, 541-558.
Lavier, L.L., Steckler, M.S. & Brigaud, F., 2001. Climatic and tectonic controls on the Cenozoic evolution of the West African margin. Marine Geology, 178(1-4), 63-80.
Lear, C.H., Elderfield, H. & Wilson, P.A., 2000. Cenozoic deep-sea temperatures and global ice volumes from Mg/Ca in benthic foraminiferal calcite. Science, 287(5451), 269-272.
Lunde, G., Aubert, K., Lauritzen, O. & Lorange, E., 1992. Tertiary uplift of the Kwanza Basin in Angola. Bulletin de la Société Géologique de France, 13, 99-117.
Lundin, E.R., 1992. Thin-skinned extensional tectonics on a salt detachment, northern Kwanza Basin, Angola. Marine and Petroleum Geology, 9(4), 405-411.
Marton, L.G., Tari, G.C. & Lehmann, C.T., 2000. Evolution of the Angolan passive margin, West Africa, with emphasis on post-salt structural styles. Geophysical Monograph, 115, 129-149.
Mascle, J. & Blarez, E., 1987. Evidence for transform margin evolution from the Ivory Coast-Ghana continental margin. Nature, 326(6111), 378-381.
Mauduit, T., 1998. Déformation gravitaire synsédimentaire sur une marge passive: modélisation analogique et application au golfe de Guinée. PhD thesis, Mémoires de Géosciences, Université de Rennes I, 260pp.
Mauduit, T. & Brun, J.P., 1998. Growth fault/ rollover systems; birth, growth, and decay. Journal of Geophysical Research, 103(8), 18,119-18,136.
Mauduit, T., Gaullier, V., Brun, J.P. & Guerin, G., 1997a. On the asymmetry of turtle-back growth anticlines. Marine and Petroleum Geology, 14(7-8), 763-771.
Mauduit, T., Guerin, G., Brun, J.-P. & Lecanu, H., 1997b. Raft tectonics: the effects of basal slope angle and sedimentation rate on progressive extension. Journal of Structural Geology, 19(9), 1219-1230.
Maurin, J.C. & Guiraud, R., 1993. Basement control in the development of the Early Cretaceous West and Central African rift system. Tectonophysics, 228(1-2), 81-95.
Mbina Mounguengui, M., Lang, J., Guiraud, M. & Jocktane, O., 2002. Sedimentary dynamics and structural geology of pre-rift deposits of the interior basin of Gabon. Journal of African Earth Sciences, 35(2), 315-329.
McKenzie, D., 1978. Some remarks on the development of sedimentary basins. Earth and Planetary Science Letters, 40(1), 25-32.
Meyers, J.B., Rosendahl, B.R., Groschel, B.H., Austin Jr, J.A. & Rona, P.A., 1996. Deep penetrating MCS imaging of the rift-to-drift transition, offshore Douala and North Gabon basins, West Africa. Marine and Petroleum Geology, 13(7), 791-835.
Moulin, M., Aslanian, D., Olivet, J.L., Contrucci, I., Matias, L., Géli, L., Klingelhoefer, F., Nouzé, H., Rehault, J.P., and Unternehr, P., 2005. Geological constraints on the evolution of the Angolan margin based on reflection and refraction seismic data (ZaiAngo Project). Geophysical Journal International, 162(3), 793-810.
Nilsen, K.T., Vendeville, B.C. & Johansen, J.T., 1995. Influence of regional tectonics on halokinesis in the Nordkapp Basin, Barents Sea. AAPG Memoir, 65, 413-436.
Nürnberg, D. & Müller, R.D., 1991. The tectonic evolution of the South Atlantic from Late Jurassic to present. Tectonophysics, 191(1-2), 27-53.
23

Popoff, M., 1988. Du Gondwana à l'Atlantique sud; les connexions du fossé de la Bénoué, avec les bassins du nord-est brésilien jusqu'à l'ouverture du golfe de Guinée au Crétacé inférieur. Journal of African Earth Sciences, 7(2), 409-431.
Rabinowitz, P.D. & LaBrecque, J.L., 1979. The Mesozoic South Atlantic Ocean and evolution of its continental margins. Journal of Geophysical Research, 84, 5973-6002.
Rasmussen, E.S., 1997. Depositional evolution and sequence stratigraphy of the shelf and slope area off South Gabon, West Africa. Journal of Sedimentary Research, 67(4), 715-724.
Reemst, P., 1995. Tectonic modelling of rifted continental margins. Basin evolution and tectono-magmatic development of the Norwegian and NW Australian margin. PhD thesis, Vrije Universiteit, Amsterdam, 183pp.
Reyre, D., 1984. Evolution géologique et caractères pétroliers d'une marge passive: cas du bassin du Bas Congo-Gabon. Bulletin des Centres de Recherches Exploration Production Elf Aquitaine, 8(2), 303-332.
Rosendahl, B.R. & Groschel, B.H., 2000. Architecture of the continental margin in the Gulf of Guinea as revealed by reprocessed deep-imaging seismic data. Geophysical Monograph, 155, 85-103.
Rosendahl, B.R., Groschel, B.H., Meyers, J. & Kaczmarick, K., 1991. Deep seismic reflection study of a passive margin, southeastern Gulf of Guinea. Geology, 19(4), 291-295.
Rouby, D., Raillard, S., Guillocheau, F., Bouroullec, R. & Nalpas, T., 2002. Kinematics of a growth fault/raft system on the West African margin using 3-D restoration. Journal of Structural Geology, 24(4), 783-796.
Sage, L. & Letouzey, J., 1990. Convergence of the African and Eurasian Plate in the eastern Mediterranean. Petroleum and tectonics in mobile belts; proceedings of the IFP exploration and production research conference, 49-68.
Sclater, J.G. & Christie, P.A.F., 1980. Continental stretching; an explanation of the post-Mid-Cretaceous subsidence of the central North Sea basin. Journal of Geophysical Research, 85, 3711-3739.
Seranne, M., Seguret, M. & Fauchier, M., 1992. Seismic super-units and post-rift evolution of the continental passive margin of southern Gabon. Bulletin de la Société Géologique de France, 163(2), 135-146.
Seyve, C., Brandao, M., Mougamba, R. & Massala, A., 2000. The Oligocene great unconformity in Western Africa. In: GeoLuanda 2000 Abstracts, GeoLuanda 2000, Luanda, pp. 127.
Smith, W.H.F. & Sandwell, D.T., 1997. Global sea floor topography from satellite altimetry and ship depth soundings. Science, 277(5334), 1956-1962.
Spathopoulos, F., 1996. An insight on salt tectonics in the Angola Basin, South Atlantic. Geological Society Special Publications, 100, 153-174.
Teisserenc, P. & Villemin, J., 1990. Sedimentary basin of Gabon; geology and oil systems. AAPG Memoir, 48, 117-199.
Uchupi, E. & Emery, K.O., 1991. Pangaean divergent margins; historical perspective. Marine Geology, 102(1-4), 1-28.
Vendeville, B. & Cobbold, P.R., 1987. Glissements gravitaires synsédimentaires et failles normales listriques; modèles expérimentaux. Comptes Rendus de l'Académie des Sciences, 305(16), 1313-1318.
Vendeville, B., Cobbold, P.R., Davy, P., Brun, J.P. & Choukroune, P., 1987. Physical models of extensional tectonics at various scales. Geological Society Special Publications, 28, 95-107.
Vendeville, B.C. & Jackson, M.P.A., 1992a. The fall of diapirs during thin-skinned extension. Marine and Petroleum Geology, 9(4), 354-371.
Vendeville, B.C. & Jackson, M.P.A., 1992b. The rise of diapirs during thin-skinned extension. Marine and Petroleum Geology, 9(4), 331-353.
24

Walgenwitz, F., Pagel, M., Meyer, A., Maluski, H. & Monie, P., 1990. Thermo-chronological approach to reservoir diagenesis in the offshore Angola Basin; a fluid inclusion, 40Ar- 39Ar and K-Ar investigation. AAPG Bulletin, 74(5), 547-563.
Walgenwitz, F., Richert, J.P. & Charpentier, P., 1992. Southwest African Plate margin; thermal history and geodynamical implications. In: C.W. Poag and P.C. de Graciansky (Eds), Geologic evolution of Atlantic continental rises. Van Nostrand Reinhold, New York, NY, United States, pp. 20-45.
Worrall, D.M. & Snelson, S., 1989. Evolution of the northern Gulf of Mexico, with emphasis on Cenozoic growth faulting and the role of salt. In: W. Bally Albert and R. Palmer Allison (Eds), The geology of North America; an overview. Geological Society of America, Boulder, CO, United States, pp. 97-138.
Wu, S., Bally, A.W. & Cramez, C., 1990. Allochthonous salt, structure and stratigraphy of the north-eastern Gulf of Mexico; Part II, Structure. Marine and Petroleum Geology, 7(4), 334-370.
Ziegler, P.A. & Cloetingh, S., 2004. Dynamic processes controlling evolution of rifted basins. Earth-Science Reviews, 64(1-2), 1-50.
25

Tables
Table 1. Velocity database with indications of the initial velocity (V0) and the rate of velocity change (k) (see Equation 1).
Table 2. Density values and porosity parameters used for the backstripping calculations.
Geological units Depth coefficient c0 (m-1) Surface porosity 0
Cap Lopez to Akosso gps 0.39 0.56 Azingo Fm 0.51 0.36 Namina Fm 0.39 0.56 Ezanga Fm 0.00 0.00 Kissenda to Vembo-Gamba fms 0.39 0.56
Table 3. Porosity values used for decompaction adapted from Sclater & Christie (1980). The porosity decreases exponentially with depth (Equation 4), and is defined by one expression for the entire depth interval of a geological unit.
26

Figure captions
Figure 1 The three major tectono-sedimentary South Atlantic domains with the location of the intracontinental and marginal basins in relation to Gondwana mega-discontinuities during the opening of the South Atlantic Ocean, modified after Popoff (1988). Reconstruction at ~110 Ma, following the magnetic anomaly M0 during the Cretaceous Quiet Period, after the parameters of Rabinowitz & LaBrecque (1979). Sedimentary basins associated with the opening of the South Atlantic and located north of the Walvis Ridge-Rio Grande Rise complex: 1. Ivory Coast, 2. Barreirinhas, 3. Benue, 4. Potiguar, 5. Rio de Peixe, 6. Arripe, 7. Cameroon, 8. Sergipe-Alagoas (north) and Jacuípe (south), 9. Recôncavo-Tucano-Jatobá (from south to north), 10. North and South Gabon, 11. Lower Congo, 12. Espirito Santo, 13. Kwanza, Benguela, Namibe, Mocamedes (from north to south), 14. Campos, 15. Santos, 16. Paraná. Figure 2 Present-day configuration of the South Atlantic Ocean with sea floor topography derived from satellite data (Smith & Sandwell, 1997). Box shows study area. Figure 3 Simplified geological map of the studied area along the southwestern African coast focus on the South Gabon Basin and modified from Guiraud & Maurin (1991); Karner et al. (1997); Lavier et al. (2001); Seranne et al. (1992) and Teisserenc & Villemin (1990). Locations of the seismic lines and wells, industry data provided by Norsk Hydro are indicated. Offshore shallow reflection seismic lines stretch from the coast to the oceanic crust over 80, 49 and 47 km for lines 1, 2 and 3 respectively. The associated regional profile composed of these three lines is located in the external part of the fan, ~270 km from the mouth of the Congo River. Wells are mainly located on the continental shelf. Isobaths from 0 to 4000 m have been reported (Smith & Sandwell, 1997). Inset of the figure corresponds to the present-day plate configuration with localisation of the Walvis Ridge. Figure 4 Chronostratigraphic chart of the South Gabon Basin based on high resolution stratigraphy (confidential data) with time scale from Haq et al., (1987), the megasequences (MS) with the associated depositional environments, and the major unconformities. Initiation of rifting occurred in Early Cretaceous (~144 Ma) and led to the onset of oceanic spreading associated with the magnetic anomaly M0 (~118 Ma) (Guiraud & Maurin, 1991; Reyre, 1984; Teisserenc & Villemin, 1990). Pre-rift sediments are found only in the north, in the Interior Basin, which is separated from the offshore Atlantic Basin by the Lambaréné Horst (Fig. 3) (Mbina Mounguengui et al., 2002; Teisserenc & Villemin, 1990). The post-rift period is characterized by major erosional unconformities during Tertiary time. Figure 5 Eastern line (1). Reflection seismic line (4 s TWT of penetration) in the South Gabon Basin running in E-NE W-SW direction, along a distance of 80 km, from the near-shore area towards the ocean, and including the continental shelf (location in Fig. 3). The bathymetry along the profile varies from 0 to 1500 m. At the location of well G2, the bases of the Gamba (G) and Dentale (D) formations are indicated (Fig. 4). Along this line, the Madiela sequence corresponds to the Azingo Formation, i.e. to carbonate platform deposits (see text for explanation). See Fig. 6 for the legend. Figure 6 Middle line (2). Reflection seismic line (4 s TWT of penetration) in the South Gabon Basin running in NE-SW direction, along a distance of 49 km, in the deep area with water depths varying from 700 to 2800 m (location in Fig. 3). Along this line, the Madiela sequence corresponds to the basinal facies of the Namina Formation (see text for explanation).
27

28
Figure 7 Western line (3). Reflection seismic line (4 s TWT of penetration) in the South Gabon Basin running in E-NE W-SW direction, along a distance of 47 km, in the ultra-deep area with water depths varying from 2900 to 3500 m (location in Fig. 3). The profiles 2 and 3 are ~6.5 km apart from each other. See Fig. 6 for the legend. Figure 8 South Gabon profiles based on depth-converted seismic lines a) from line 1 (Fig. 5), b) from line 2 (Fig. 6), and c) from line 3 (Fig. 7) with a vertical exaggeration of 2. F corresponds to the flexure of the sea bottom. See Fig. 3 for location. Figure 9 Paleowater depth (wd) profile (T. Enoksen and A. Lønøy, personal communications), tectonic (tect) and basement subsidence (bast) curves derived from backstripping for 4 proximal wells located in the vicinity of the regional seismic profile. Well G1 (Fig. 9a) is situated onshore in the continuity of the seismic profile (Fig. 3). The proximal well of Fig. 9b lies at water depth < 100 metres. Figs. 9c and d correspond to locations with ~100 metres water depths. Well G2 (Fig. 9d) lies on the shelf and traverses line 1 (Fig. 8a). Exact well locations are not indicated due to data confidentiality (see Fig. 3). Subsidence calculations with and without paleowater depths are represented by thick and thin lines respectively. Basement subsidence rates values in m/Myr (including paleowater depths in the calculations) are indicated for the syn-rift (red) and early post-rift (orange) periods. ‘Late Jur.’ stands for Late Jurassic. Formation and group abbreviations: G = Gamba/Vembo formations, E = Ezanga Formation, M = Madiela Group, C = Cap Lopez Group, A = Azilé to Anguille groups, P to A = Pointe Clairette to Akosso groups (Fig. 4). Circle corresponds to the age of the subcrop sediments. Figure 10 a, b, c) Paleowater depth (wd) profile (T. Enoksen and A. Lønøy, personal communications), tectonic (tect) and basement (bast) subsidence curves derived from backstripping for 3 proximal wells located north of the regional seismic profile (50 to 200 km away). Present-day bathymetry corresponds to ~50 metres. See Fig. 9 for the legend. Exact well locations are not indicated due to data confidentiality (see Fig. 3). Figure 11 Present-day offshore South Gabon regional cross section based on the gathering and the depth conversion of the three seismic lines presented in Figs. 5, 6, 7 and 8.