technology validation of coatings deposition onto the
TRANSCRIPT

213
Technology validation of coatings deposition
onto the brass substrate
A.D. Dobrzańska-Danikiewicz*, K. Lukaszkowicz
Faculty of Mechanical Engineering, Silesian University of Technology,
ul. Konarskiego 18a, 44-100 Gliwice, Poland
* Corresponding author: E-mail address: [email protected]
Abstract Purpose: The purpose of this chapter is to evaluate strategic development perspectives
of manufacturing metallic-ceramic coatings in the process of physical vapour deposition
(PVD) on the CuZn40Pb2 brass substrate. The amount of layers applied to the substrate was
adopted as the criterion for technology division, thus obtaining three technology groups for
foresight research.
Design/methodology/approach: The carried out foresight-materials science research included
creating a dendrological matrix of technology value, a meteorological matrix of environment
influence, a matrix of strategies for technologies, laying out strategic development tracks,
carrying out materials science experiments which test the mechanical and tribological
properties and the resistance to corrosion and erosion of brass covered with a varied number
of layers applied using the method of reactive magnetron evaporation, as well as preparing
technology roadmaps.
Findings: High potential and attractiveness were shown of the analysed technologies against
the environment, as well as a promising improvement of mechanical and tribological
properties and an increase of resistance to material corrosion and erosion as a result
of covering with PVD coatings.
Research limitations/implications: Research pertaining to covering the brass substrate with
PVD coatings is part of a bigger research project aimed at selecting, researching and
characterizing priority innovative material surface engineering technologies.
Practical implications: The presented results of experimental materials science research prove
the significant positive impact of covering with PVD coatings on the structure and mechanical
7

Open Access Library Volume 6 2011
214 A.D. Dobrzańska-Danikiewicz, K. Lukaszkowicz
properties, as well as the resistance to corrosion, erosion and abrasive wear of brass which
leads to the justification of their including into the set of priority innovative technologies
recommended for application in industrial practice, including in small and medium-size
companies.
Originality/value: The advantage of the chapter is the specification of the significance of the
technology involving covering the brass substrate with mono- and multilayer PVD coatings
against the environment, together with the recommended strategies of conduct, strategic
development tracks and roadmaps of these technologies, taking into account the impact of the
processes of applying these coatings onto the structure and the improvement of the properties
of the tested surface layers.
Keywords: Manufacturing and processing; Thin & Thick Coatings; Brass substrate;
Foresight; Technology Roadmapping
This chapter has been also published as: A.D. Dobrzańska-Danikiewicz, K. Lukaszkowicz, Technology validation of coatings deposition onto the
brass substrate, Archives of Materials Science Engineering 46/1 (2010) 5-38.
1. Introduction
In accordance with the definition of the Organization for Economic Co-Operation and
Development (OECD), knowledge-based economy is based on creating, distribution and the
practical application of knowledge and information [1]. This economy promotes companies,
including small and medium-size ones, which are innovative, educational and informational-
communicative systems, consciously managing knowledge as a strategic resource, taking into
account the impact of the micro- and macroenvironment. The innovation of the system
is expressed in a constant search and promotion of new technologies in all areas of the
company's functioning in order to obtain a specific profit. A company which is an educational
system puts emphasis especially on the acquisition and education of employees hired in the
research and development field (R+D). On the other hand, the information-communicative
system constitutes a basis for providing knowledge to employees by creating safe IT networks

Materials surface engineering development trends
Technology validation of coatings deposition onto the brass substrate 215
and systems and by communicating with the state and European administration. Innovation,
education and an effective flow of information at the company level are the main building
blocks of an economy based on knowledge and economy competitiveness on a country scale.
Decisive for the development of a knowledge-based economy is the development of those
economy sectors which are directly related to the development of science and the processing
of information as part of the so-called high technology (hi-tech). In this context it seems critical
to direct scientific research to the most promising scientific fields and branches which may
have large influence on the quick civilisation-economic development of the country based on an
IT community. Moreover, attention should be drawn to providing the possibility of a rational
practical use of the conducted studies and of creating budgetary preferences for them.
The realisation of such defined goals and targets is possible with the use of the e-foresight
methodology. E-foresight involves conducting foresight research aimed at selecting priority
innovative technologies and strategic development directions for the research field, with the use
of the Internet [2], referring to already known and commonly used notions [3, 4] of e-management,
e-business, e-trade, e-banking, e-logistics, e-services, e-administration and e-education which
always mean conducting specified activities with the use of computer networks. The proposed
approach uses the synergy effect and eliminates the unfavourable psychosocial phenomenon
called the show-off effect, meaning that during a direct meeting which serves the exchange
of views on a specific subject, people are mainly directed at presenting themselves in the best
light possible, and not at sharing their knowledge. For the realisation of technological e-foresight,
the Computer Aided Foresight Integrated Research Management (CA FIRM) methodology was
created [2, 5-8]. This methodology which organizes, improves and modernizes the actual
process of foresight research, may be used in practice thanks to working out a concept of
functioning in cyber-reality – the Virtual Organisation for Foresight Integrated Research
Management (VO FIRM). The following IT tools enable the realisation of such defined goals
and targets from the technical angle: the Web Platform for Foresight Integrated Research
Management (WP FIRM) and the Neural Networks for Foresight Integrated Research
Management (NN FIRM).
The challenges lying ahead of the contemporary economy necessitate reductions in energy
consumption and material consumption as a prerequisite for sustainable development and
reasonable natural resources management. In the majority of cases the goals are achievable
though replacing the traditional materials with those having higher proper strength or better
Open Access Library Volume 6 2011
216 A.D. Dobrzańska-Danikiewicz, K. Lukaszkowicz
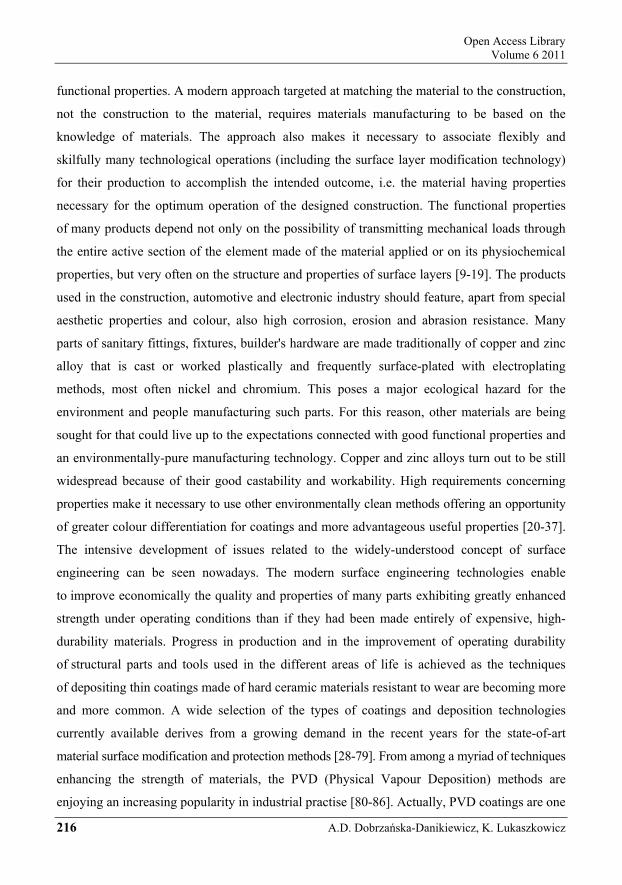
functional properties. A modern approach targeted at matching the material to the construction,
not the construction to the material, requires materials manufacturing to be based on the
knowledge of materials. The approach also makes it necessary to associate flexibly and
skilfully many technological operations (including the surface layer modification technology)
for their production to accomplish the intended outcome, i.e. the material having properties
necessary for the optimum operation of the designed construction. The functional properties
of many products depend not only on the possibility of transmitting mechanical loads through
the entire active section of the element made of the material applied or on its physiochemical
properties, but very often on the structure and properties of surface layers [9-19]. The products
used in the construction, automotive and electronic industry should feature, apart from special
aesthetic properties and colour, also high corrosion, erosion and abrasion resistance. Many
parts of sanitary fittings, fixtures, builder's hardware are made traditionally of copper and zinc
alloy that is cast or worked plastically and frequently surface-plated with electroplating
methods, most often nickel and chromium. This poses a major ecological hazard for the
environment and people manufacturing such parts. For this reason, other materials are being
sought for that could live up to the expectations connected with good functional properties and
an environmentally-pure manufacturing technology. Copper and zinc alloys turn out to be still
widespread because of their good castability and workability. High requirements concerning
properties make it necessary to use other environmentally clean methods offering an opportunity
of greater colour differentiation for coatings and more advantageous useful properties [20-37].
The intensive development of issues related to the widely-understood concept of surface
engineering can be seen nowadays. The modern surface engineering technologies enable
to improve economically the quality and properties of many parts exhibiting greatly enhanced
strength under operating conditions than if they had been made entirely of expensive, high-
durability materials. Progress in production and in the improvement of operating durability
of structural parts and tools used in the different areas of life is achieved as the techniques
of depositing thin coatings made of hard ceramic materials resistant to wear are becoming more
and more common. A wide selection of the types of coatings and deposition technologies
currently available derives from a growing demand in the recent years for the state-of-art
material surface modification and protection methods [28-79]. From among a myriad of techniques
enhancing the strength of materials, the PVD (Physical Vapour Deposition) methods are
enjoying an increasing popularity in industrial practise [80-86]. Actually, PVD coatings are one

Materials surface engineering development trends
Technology validation of coatings deposition onto the brass substrate 217
from the most interesting and intensively developed technologies of protection and
modification of product surface. It takes pace, because they give possibility of creation
of materials with unique physiochemical properties, such as: extremely high hardness [87-89],
high corrosion resistance [90, 91], high oxidation resistance in high temperature [92, 93],
as well as high resistance to abrasive and erosion wear [94-96]. Thin, hard PVD coatings on a soft
substrate prove to be a beneficial material combination from the tribological perspective. They
can be employed in particular for abrasive or erosive destruction by improving resistance
to scratches or cracks formed in contact with hard materials. The only limitation for using hard
coatings on a soft base are high stresses formed in the coatings themselves and at the substrate
material – coating interface.
The favourable properties of copper and zinc alloys, together with the advantages of
physical vapour deposition constituted the basis for performing a series of interdisciplinary
foresight-materials science research in order to specify the value, attractiveness and potential of
the technology of applying hard PVD coatings on the soft brass substrate against the micro-
and macroenvironment. The carried out research involved also working out recommended
strategies of conduct, setting strategic development tracks and preparing technology roadmaps
of analysed technology groups, with special consideration to mechanical and tribological
properties and the resistance to corrosion of a material covered with a varied number of layers
applied to the brass substrate using the PVD technology. Experimental research were
performed onto the CuZn40Pb2 brass substrate, to which layers of Ti/CrN, Ti/TiAlN, and
Mo/TiAlN were applied, under suitable pressure in the amount of one, fifteen and one hundred
and fifty, respectively. The research of coating microstructures was performed using
a metallographic, as well as a scanning and transmission electron microscope. The exploitation
properties of the created coatings were determined based on an erosion test. Tests of the
electrochemical corrosion of coatings were performed in a tri-electrode chamber in a 1-molar
solution of HCl.
Foresight-materials science research carried out as part of this chapter constitute a fragment
of broader individual actions aimed at selecting a set of priority innovative technologies
of material surface engineering. The overriding aim of these large-scale research is to generate
a set of priority innovative surface engineering technologies which contribute to the statistical
quality increase of technologies applied in industrial companies, stimulating sustainable
development and strengthening knowledge-based economy.

Open Access Library Volume 6 2011
218 A.D. Dobrzańska-Danikiewicz, K. Lukaszkowicz
2. Research methodology
The conducted research are interdisciplinary and the used researching methodology pertains
mainly to technology foresight [97] being an element of a field called organisation and
management and to surface engineering included in a more broadly understood material
engineering. At certain stages of the conducted studies, also methods were used which come
from artificial intelligence, statistics, IT technology, construction and exploitation of machines,
as well as strategic [98], operational [99] and quality [100] management.
According to the adopted methodology, the carried out research include: selecting
technology groups for experimental-comparative research, collecting expert opinions, carrying
out a multi-criteria analysis and marking its results on the dendrological and meteorological
matrix, determining strategies for technologies preceded by rescaling and objectivising
research results using formulated mathematical relations, setting strategic development tracks
for technologies, carrying out a series of specialist materials science experiments in
experienced team using a specialist diagnostic-measuring apparatus and the creation of
technology roadmaps. In accordance with the applied methodology of foresight-materials
science research, several possibilities of homogenous groups should be singled out from the
analysed technologies in order to subject them to planned experimental-comparative nature
research. To determine the objective values of given selected technologies or their groups a
dendrological matrix of value technology is used, and to determine the strength of positive and
negative influence of the environment on a given technology a meteorological matrix of
environment influence is used. The methodological construction of those both matrices refers
to portfolio methods, commonly known in sciences about management, and first of all to BCG
matrix [101]. For the purpose of evaluating technology groups with regard to their values and
environmental influence, a ten-point universal scale of relative states was adopted, in which the
smallest value 1 corresponds to a minimum level, and the highest value 10 is the level of
perfection.
The dendrological matrix of technology value [5] presents graphic results of evaluating
specific technology groups, with special attention paid to the potential constituting the real
objective value of a given technology and to the attractiveness reflecting how a given technology
is subjectively perceived among its potential users. The potential of a given technology group

Materials surface engineering development trends
Technology validation of coatings deposition onto the brass substrate 219
expressed through a ten-point universal scale of relative states, marked on the horizontal scale
of the dendrological matrix is the result of a multi-criteria analysis carried out based on an expert
opinions. On the vertical scale of the dendrological matrix the level of attractiveness was marked
of a given technology group which is the mean weighed expert opinions based on detailed
criteria. Depending on the type of potential and level of attractiveness determined as part of the
expert opinions, a given technology may be placed in one of the quarters of the matrix. The
quarters distinguished in the dendrological matrix of technology value are presented in Table 1.
Table 1. The quarters of the dendrological matrix of technology value
Factors Potential Low High
Attractiveness
High
A quaking cypress which is technology with a limited potential, but
highly attractive, what causes that a success of technology is possible
A wide-stretching oak which corresponds to the best possible situation in which the
analysed technology has both a huge potential and huge attractiveness, which is
a guarantee of a future success
Low
A sparing aspen which is technology with a limited potential and limited attractiveness in the range, which a
future success is unlikely
A rooted dwarf mountain pine which is technology with limited attractiveness, but a high potential, so that its future success is
possible
The meteorological matrix of environment influence [5] presents graphic results
of evaluating the impact of external factors on specific groups of technologies which had been
divided into difficulties with a negative impact and chances which positively influence the
analysed technologies. The researching of expert opinions on the subject of positive and
negative factors which influence specific technologies was carried out based on a survey
comprising several dozens of questions pertaining to the micro- and macroenvironment in strictly
defined proportions. External difficulties expressed with the use of a ten-point universal scale
of relative states (from 1 to 10), which are the result of a multi-criteria analysis conducted
based on the expert opinions, have been placed on the horizontal scale of the meteorological
matrix. On the other hand, chances, i.e. positive environment factors being a mean weighed
expert opinions based on detailed criteria, were placed on the vertical scale. Depending on the
level of influence of positive and negative environment factors on the analysed technology,
determined as part of the expert opinions on a ten-point scale, it is placed in one of the matrix
quarters. The quarters distinguished in the meteorological matrix of environment influence are
presented in Table 2.

Open Access Library Volume 6 2011
220 A.D. Dobrzańska-Danikiewicz, K. Lukaszkowicz
Table 2. The quarters of the meteorological matrix of environment influence
Factors Difficulties A small number A large number
Chances
A large number
Sunny spring being the best option denoting friendly environment with
lots of opportunities and a little number of difficulties, which means that the
success of given technology is guaranteed
Hot summer corresponding to a situation in which the environment brings a lot of
opportunities, which, however, are accompanied by many difficulties,
meaning that the success of technology in the given circumstances is possible, but is a
subject to the risk
A small number
Rainy autumn corresponding to the neutral position, in which for given
technology traps do not wait, but also the environment does not give too
many opportunities
Frosty winter corresponding to the worst possible situation in which the environment brings a large number of problems and few opportunities, which means that success in
a given environment is difficult or impossible to achieve
The research results presented in a graphical form using a dendrological matrix
of technology value and a meteorological matrix of environment influence were put on a matrix
of strategy for technologies consisting of sixteen fields corresponding to each set of versions
resulting from the combination of the types of technology and the types of environments.
To facilitate the transfer of specific numeric values from the dendrological matrix [2x2] and the
meteorological matrix [2x2] to the matrix of strategies for technologies with the dimensions
of [4x4], mathematical relations were formulated which enable the rescaling and objectivising
of research results and, based on them, a short computer program was created to enable a quick
calculation of the searched values and their placing on the chart. Thus, the following notions
were introduced: the relative value of technology Vn and the relative value of environment
influence En and mathematical dependence allowing to graduate and make objective research
results were introduced [5, 8].
The strategic development tracks for different technologies/ groups of technologies in the
next step of research were outworked. These strategic development tracks forecast given
technology development successively in: 2015, 2020, 2025 and 2030 in three versions:
optimistic, pessimistic and most possible ones, followed by their visualisation against a back-
ground of a matrix of strategy for technology.
In order to precise the value of the potential and attractiveness of PVD coatings deposited
onto the brass substrate a series of materials science research using specialised diagnostic
and measurement equipment were carried out. The research were made on CuZn40Pb2 copper-
zinc alloy samples plated with hard coatings in the PVD process with the chemical composition

Materials surface engineering development trends
Technology validation of coatings deposition onto the brass substrate 221
presented in Table 3. The copper-zinc alloy samples were subjected to mechanical grinding and
polishing to ensure the appropriate quality of the sample surface. The methods commonly used
in the process of preparing metallographic specimens using Struers equipment were applied
during polishing. A diamond abradant with a varied grain size ending with a 1 µm grain was
used. The samples, immediately prior to the coating deposition process, were cleaned
chemically using a multi-stage washing and rinsing process in washing and degreasing baths,
and then they were ion-etched in the chamber of the coating deposition equipment in a pure
argon atmosphere in order to clean the coated surfaces and to activate them for 20 min. The
200×100×6 mm water-cooled discs containing pure metals (Cr, Ti, Mo, Zr) and 50% Ti – 50% Al
alloys being the substrates of the phases deposited on the charge were used for applying coatings.
Current density for both megatons was determined approximately as 0.01 A/cm2. The coatings
were deposited in the atmosphere of inert gas (argon) or/and reactive gas (nitride) being supplied
continuously to the working chamber. The distance between each of the discs and the coated sam-
ples is 65 mm. The type of coating, current and voltage conditions and the values of pressures pre-
vailing in the equipment chamber during the coating deposition process are presented in Table 4.
Table 3. Chemical composition of the CuZn40Pb2
Chemical composition, %
Type Alloy components Allowable concentration of pollutants Cu Pb Zn Fe Sn Al Ni other
CuZn40Pb2 56.0-60.0 1.0-3.5 rest 0.5 0.5 0.1 0.5 0.2
Table 4. Deposition parameters of the coating
Coating Substrate bias voltage, V
Working pressure, Pa
Partial pressure, Pa Number of layers nitrogen argon
Ti/CrN×1 –50
0.58 0a. 0.15b 0.31 1 Ti/CrN×15 0.39 0a. 0.15b 0.31 15 Ti/CrN×150 0.46 0a. 0.15b 0.31 150
Ti/ZrN×1 – 50
0.34 0a. 0.10b 0.29 1 Ti/ZrN×15 0.29 0a. 0.10b 0.29 15
Ti/ZrN×150 0.31 0a. 0.10b 0.29 150 Ti/TiAlN×1
– 40 0.40 0a. 0.10b 0.38 1
Ti/TiAlN×15 0.41 0a. 0.10b 0.38 15 Ti/TiAlN×150 0.41 0a. 0.10b 0.38 150 Mo/TiAlN×1
– 60 0.49 0a. 0.11b 0.45 1
Mo/TiAlN×15 0.46 0a. 0.11b 0.45 15 Mo/TiAlN×150 0.50 0a. 0.11b 0.45 150
a during metallic layers deposition b during ceramic layers deposition During deposition the substrate temperature was always 300˚C

Open Access Library Volume 6 2011
222 A.D. Dobrzańska-Danikiewicz, K. Lukaszkowicz
The metallographic research were carried out with an MEF4A Leica metallographic
microscope using a Leica-Qwin computer-aided image analysis system on copper-zinc samples
with coatings deposited on their surface. The specimens were prepared using Struers
equipment and then etched in an aqueous iron chloride solution (10 g of iron chloride, 30 ml
of hydrochloric acid, 100 ml of distilled water) to develop the structure. The structure of the
samples produced was observed at lateral fractures with an XL-30 scanning electron
microscope by Philips. Secondary electrons detection was used for creating the images of the
fractures with the accelerating voltage of 20 kV. The samples with the cut notch were cooled
in liquid nitride before breaking to eliminate a plastic deformation and ensure the brittle character
of the fracture being created. The phase composition of the researched coatings was determined
using a Dron 2.0 diffractometer, and filtered Kα1 X-ray radiation was used for stepwise recording
with the wave length of λ = 1.79021 nm coming from a lamp with a 35 kV cobalt tube with 8 mA
filament current intensity. The measurement was made within the angle range of 2θ within
35 to 100°. An X-ray XRD7 Seifert-FPM diffractometer fitted with a texture attachment was
used for evaluating the texture of coatings. The X-ray radiation of a 35 kV Co Kα cobalt tube
with 40 mV current intensity was used. The texture of the researched coatings was assessed
with the inverse pole figures method.
Internal stresses within the coatings were assessed with the spacing of reflections coming
from the planes of crystallographic lattices of the phases forming part of the coatings produced
on X-ray diffraction photographs and the Young's modulus values for the respective coatings.
Internal stresses σ were determined using the following equation:
o
od
ddE −⋅−=
νσ
2 (1)
where:
E –Young's modulus,
ν – Poisson's constant,
d – lattice parameter with internal stresses determined with an X-ray diffraction
photograph,
do – lattice parameter without internal stresses (table value).
The thickness of the coatings produced was measured with a "kalotest" method consisting
of measuring the characteristic sizes of a crater formed on the surface of the researched sample
with the coating. The measurements were made with a custom-designed device. In addition,

Materials surface engineering development trends
Technology validation of coatings deposition onto the brass substrate 223
to verify the results obtained, the depth of the coatings was measured with a scanning electron
microscope at the lateral fractures to their free surface.
The qualitative and quantitative X-ray micro-analysis and the surface distribution analysis
of alloy elements in the samples and of the coatings deposited onto their surface was performed
at the lateral fractures with a JEOL JCXA 733 X-ray microanalyser with an EDS LINK ISIS
X-ray scattered radiation spectrometer by Oxford with the accelerating voltage of 20 kV.
Variations in the chemical concentration of the coating components in the perpendicular
direction to the coating surface and concentration changes in the transient zone between the
coating and the substrate material were evaluated based on research with a GDOS-75 QDP
glow discharge optical spectrometer by Leco Instruments. The following working conditions
of the spectrometer's Grimm lamp were determined in the research:
• inner lamp diameter – 4 mm;
• lamp supply voltage – 700 V;
• lamp current – 20 mA;
• working pressure – 100 Pa;
• analysis duration – 400 s.
A Paschen–Runge continuous simultaneous spectrometer with the focal point of 750 mm
and the holographic lattice with 2400 lines per millimetre was used in this device. The maximum
depth of the chemical composition analysis is 10 µm.
The hardness tests of the deposited coatings hardness were conducted with the Vickers
method consisting of measuring the depth of indention that usually does not exceed the decimals
of micrometre, and the set pressure does not exceed 0.05 N, which eliminates the impact of the
substrate material on the hardness of the coating. The hardness test with the Vickers method
was performed with nano-indenting made with the Shimadzu DUH 202 nanohardness tester.
Rigidity S after unloading the sample was calculated to determine Young's modulus using
Hardness 4.2 software bundled with the DUH 202 nanohardness tester according to the
following formula:
kr AEdhdPS ⋅⋅⋅==
πβ 2 (2)
where:
β – the constant resulting from the indenter geometry;
Er – reduced Young's modulus, kN/mm2;
Ak – contact area, µm2.

Open Access Library Volume 6 2011
224 A.D. Dobrzańska-Danikiewicz, K. Lukaszkowicz
and a reduced Young's modulus according to the formula:
s
s
i
i
r EEE
22 111 νν −+
−= (3)
where:
Ei – Young's modulus for indenter, kN/mm2;
Es – Young's modulus for sample, kN/mm2;
νi – Poisson constant for indenter;
νs – Poisson constant for sample.
The adhesion of the coatings to the substrate material was examined with a scratch test used
commonly for coatings produced in the processes of physical deposition from the gas phase.
The tests were made with a computer-controlled device – Sebastian 5A (Quad Group) fitted
with an acoustic detector under the following test conditions:
• load increase rate (dL/dt) – 100 N/min;
• indenter movement rate (dx/dt) – 10 mm/min.
The smallest force at which the coating is damaged, referred to as the critical load LC2, was
determined based on the decrease of the acoustic emission value recorded during the
measurement and formed at the indenter – tested sample interface. The character of the damage
formed was assessed based on observations with a DSM-40 scanning electron microscope
by Opton and with a MEF 4A Leica light microscope.
Surface roughness for the polished samples without coatings and with coatings was
measured in two mutually perpendicular directions with a Surftec 3+ profilometer by RankTaylor
Hobson. The measurement length is l = 0.25 mm, and the measurement accuracy 0.01. The Ra
parameter acc. to PN – EN ISO 4287 was adopted as a value describing surface roughness.
Abrasive wear resistance tests with the pin-on-disc method were carried out with the CSEM
High Temperature Tribometer. A 6 mm Al2O3 ball was used as a counter-sample. The tests
were made at a room temperature under the following test conditions:
• pressure force FN – 5 N;
• movement speed v – 40 cm/s;
• radius r – 10 mm.
A friction coefficient for the researched coatings was determined with a CSEM High
Temperature Tribometer. A 100Cr6 steel penetrator with the rounding diameter of 1 mm was

Materials surface engineering development trends
Technology validation of coatings deposition onto the brass substrate 225
used as a counter-sample. The research were made at a room temperature under the following
test conditions:
• pressure force FN – 1 N,
• friction path s – 10 mm,
• movement speed v – 10 mm/s.
The operating properties of the coatings produced were determined with an erosion test
with the Falex Air Jet Eroder by Falex Corporation, representing the air jet type devices, where
the powder erodent leaving the nozzle at the set pressure is impacting the tested sample surface
positioned at the set angle against the nozzle. The tests were carried out under the following
conditions:
• nozzle pressure – 270 kPa;
• impact angle – the angle between the sample surface and the nozzle – 90°;
• erodent flow rate – 2 g/min.;
• distance between the sample surface and the nozzle – 20 mm;
• minimum test duration – 0.1 s.
Powder was used as an erodent with a commercial name Dynablast™ manufactured
by Norton company with the following components: Al2O3 (95.8%), TiO2 (2.6%), SiO2 (1%),
Fe2O3 (0.2%), MgO (0.2%), ZrO2 (0.1%), other 0.1% being alkali. The average erodent grain
size is 70 mm, and Knoop hardness is 21.6 GPa. An additional EDS X-ray analysis was made
at 0.1 s intervals (0.2 s for some coatings) to identify an erosion rate to determine if the lines
representing alloy elements forming part of the substrate are present in the X-ray radiation
energy spectrum produced coming from the craters formed. If such lines appear, this means
that the coating is damaged. Besides, a Superprobe 733 electron scanning microscope by JEOL
coupled with a computer image analyser was used to evaluate the degree of coating perforation
caused by the powder erodent. The perforation degree was evaluated in such a way that the size
of the exposed substrate area during the elementary research step was determined or its multi-
plication was determined using the natural difference between the coating and substrate colour
exposed with specific magnification constant for all the samples covering the entire crater area
considered as 100%. Erosion resistance is higher the smaller is the share of the coating
removed within the set test time.
The research of electrochemical corrosion of the coatings applied were made with
a standard laboratory device for the quantitative corrosion test of material properties – a three-
Open Access Library Volume 6 2011
226 A.D. Dobrzańska-Danikiewicz, K. Lukaszkowicz
electrode chamber in a 1-mole HCl solution with regard to a platinum electrode and calomel
electrode. The tests were made with a PGP 201 Potentiostat/Galvanostat device. The following
tests were made:
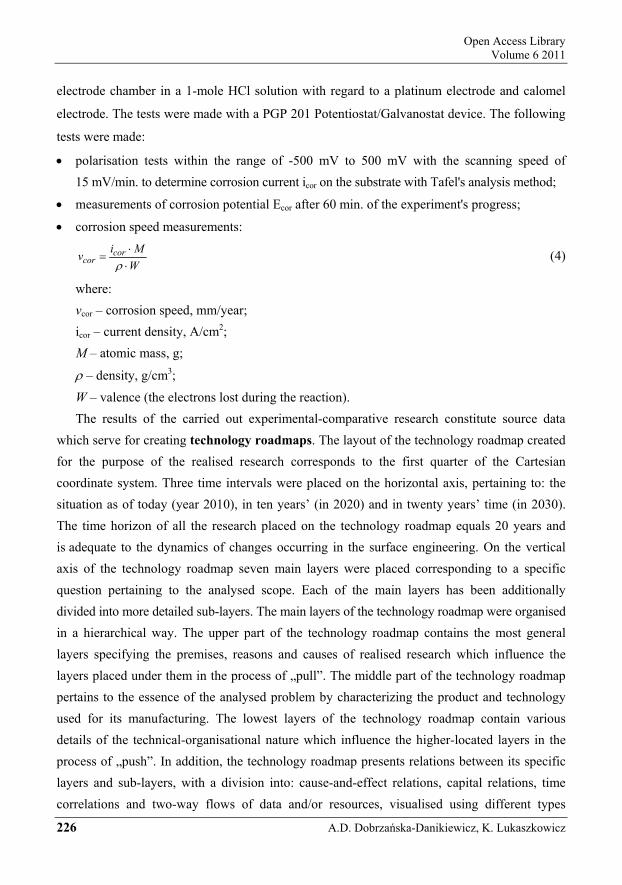
• polarisation tests within the range of -500 mV to 500 mV with the scanning speed of 15 mV/min. to determine corrosion current icor on the substrate with Tafel's analysis method;
• measurements of corrosion potential Ecor after 60 min. of the experiment's progress;
• corrosion speed measurements:
WMiv cor
cor ⋅⋅
=ρ
(4)
where: vcor – corrosion speed, mm/year; icor – current density, A/cm2; M – atomic mass, g;
ρ – density, g/cm3;
W – valence (the electrons lost during the reaction). The results of the carried out experimental-comparative research constitute source data
which serve for creating technology roadmaps. The layout of the technology roadmap created for the purpose of the realised research corresponds to the first quarter of the Cartesian coordinate system. Three time intervals were placed on the horizontal axis, pertaining to: the situation as of today (year 2010), in ten years’ (in 2020) and in twenty years’ time (in 2030). The time horizon of all the research placed on the technology roadmap equals 20 years and is adequate to the dynamics of changes occurring in the surface engineering. On the vertical axis of the technology roadmap seven main layers were placed corresponding to a specific question pertaining to the analysed scope. Each of the main layers has been additionally divided into more detailed sub-layers. The main layers of the technology roadmap were organised in a hierarchical way. The upper part of the technology roadmap contains the most general layers specifying the premises, reasons and causes of realised research which influence the layers placed under them in the process of „pull”. The middle part of the technology roadmap pertains to the essence of the analysed problem by characterizing the product and technology used for its manufacturing. The lowest layers of the technology roadmap contain various details of the technical-organisational nature which influence the higher-located layers in the process of „push”. In addition, the technology roadmap presents relations between its specific layers and sub-layers, with a division into: cause-and-effect relations, capital relations, time correlations and two-way flows of data and/or resources, visualised using different types

Materials surface engineering development trends
Technology validation of coatings deposition onto the brass substrate 227
of arrows. The technology roadmap is a universal tool which enables presenting, in a unified and clear format, different types of internal and external factors directly and indirectly characterizing a given technology, taking into account the ways of influence, interdependencies and the change of specific factors over time. When needed, the technology roadmap may be supplemented and expanded by additional sub-layers, adapting it, e.g. to the specificity of the carried out scientific-research studies, the requirements of a given industrial field or the size of a company.
This chapter presents results of research which include especially the evaluation of the
potential and attractiveness of the analysed technologies against the micro- and macroenvi-
ronment. This evaluation was performed based on the opinions of key experts expressed on a ten-
point universal scale of relative states; next, a recommended strategy was formulated of conduct
with a given technology, together with the anticipated strategic development tracks (sub-
chapter 3). Sub-chapter 4 of the chapter contains the results of materials science research which
test the microstructure, phase composition and texture, erosion resistance and tribological
properties, as well as the resistance to corrosion of monolayer and multilayer coatings applied
to the CuZn40Pb2 brass substrate via the PVD technology using the reactive magnetron
evaporation method. Based on the results of conducted experimental-comparative research,
technology roadmaps were created which present, in a unified and clear format, different types
of internal and external factors that directly and indirectly characterize the specific
technologies, taking into account the manners of influence, interconnections and the change of
specific factors over time, which was presented in sub-chapter 5 of the chapter.
3. Determined technology values and strategic development
tracks
Adopting as the division criterion the number of layers which compose the analysed PVD
coating, three homogenous groups were selected among the analysed technologies in order to
conduct experimental-comparative works. They include:
(A) The production of metallic/ceramic monolayer coatings by means of a physical vapour
deposition process onto the CuZn40Pb2 brass substrate,
(B) The production of metallic/ceramic multilayer (in the amount 15) coatings by means
of a physical vapour deposition process onto the CuZn40Pb2 brass substrate,

Open Access Library Volume 6 2011
228 A.D. Dobrza ska-Danikiewicz, K. Lukaszkowicz
(C) The production of metallic/ceramic multilayer (in the amount 150) coatings by means of a physical vapour deposition process onto the CuZn40Pb2 brass substrate.
The analysed technology groups were evaluated by key experts in terms of their attractiveness and potential, using a ten-point universal scale of relative states. Using a multi-criteria analysis, the mean weighed value was calculated from the analysed detailed criteria selected as part of the attractiveness and potential, and the result obtained for specific technology groups was placed on the dendrological matrix of technology value (Fig. 1). As a result of the carried out analysis, all technology groups were qualified to the most promising quarter of the matrix – the wide-stretching oak which includes technologies of a high potential and large attractiveness. The best result was obtained by the technology group C (7.50, 8.50), involving covering with multilayer (in the amount 150) PVD coatings; a slightly worse result was obtained by the technology group A (7.00, 8.00), involving covering with monolayer PVD coatings; the worst result was obtained by the technology group B (6.60, 7.60), involving covering with multilayer (in the amount 15) PVD coatings.
Figure 1. The dendrological matrix of technology value for production of metallic/ceramic coatings by physical vapour deposition process onto the CuZn40Pb2 brass substrate with:
(A) monolayer, (B) fifteen layers, (C) one hundred fifty layers

Materials surface engineering development trends
Technology validation of coatings deposition onto the brass substrate 229
The meteorological matrix of environment influence is a tool which serves the positive and
negative evaluation of environmental impact on the specific technology groups. The results
of the multi-criteria analysis performed on the expert opinions obtained during surveying were
charted onto the meteorological matrix (Fig. 2). The survey used for conducting research
contains several dozens of questions pertaining to the power of positive and negative influence
of the micro- and macroenvironment on technologies in strictly determined proportions.
The conducted research indicates that in the case of all technology groups subjected to research,
the environment is very favourable, bringing many chances and a small amount of difficulties.
An illustration of such a state of things is placing all the analysed technology groups in the
quarter corresponding to sunny spring, which bodes well for their development. Again, the
highest mark was obtained by the technology group marked as C (3.52, 7.42); a slightly lower
mark was obtained by technology group A (3.97, 7.22), while the lowest mark – by technology
group B (4.36, 6.35).
Figure 2. The meteorological matrix of environment influence for production
of metallic/ceramic coatings by physical vapour deposition process onto the CuZn40Pb2 brass substrate with: (A) monolayer, (B) fifteen layers, (C) one hundred fifty layers

Open Access Library Volume 6 2011
230 A.D. Dobrzańska-Danikiewicz, K. Lukaszkowicz
At the next stage of research works the results of research presented in graphic form using
the dendrological matrix of technology value and the meteorological matrix of environment
influence have been placed on the matrix of strategies for technologies. (Fig. 3). This matrix
shows the graphical location of specific groups of technologies of applying coatings with a varied
number of layers onto the brass substrate using the reactive and magnetron evaporation, taking
into account their value and impact on the environment, indicating a suitable strategy of conduct.
Transferring specific numeric values from the dendrological meteorological matrices onto the
matrix of strategies for technologies, of different dimensions, took place using the formulated
mathematical dependencies and a simple computer program based on them which allowed for
rescaling and objectivizing the research results […]. In the case of all the analysed well-
promising technology groups, the use of the strategy of oak in spring is recommended. This
strategy involves developing, strengthening and implementing an attractive technology of a high
potential in industrial practice in order to achieve spectacular success.
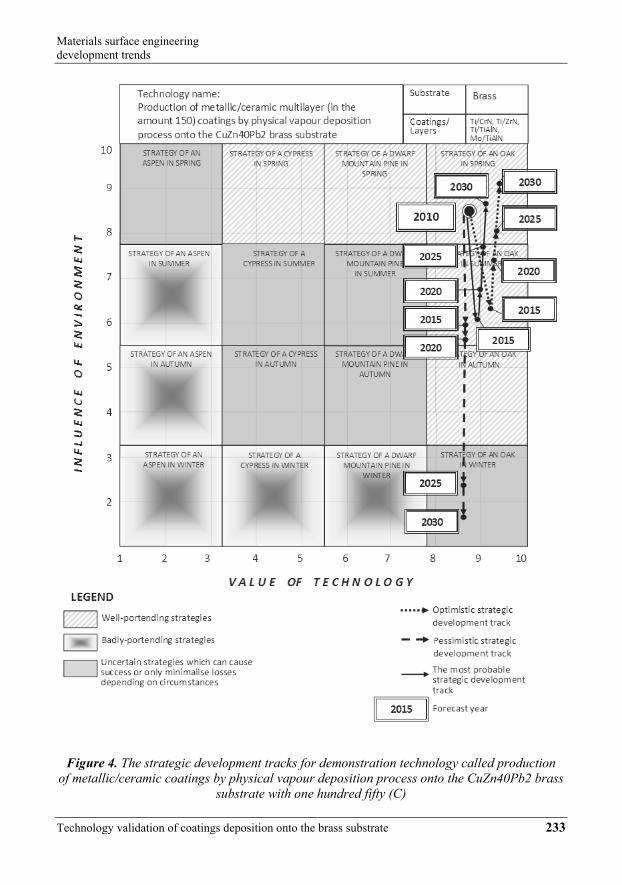
The next stage of research involves the specification of strategic development tracks, based
on expert opinions, for specific technologies/technology groups, constituting their development
forecast in 2015, 2020, 2025 and 2030 in three variants: optimistic, pessimistic and the most
probable, and then visualizing them against a matrix of strategies for technologies. The
representative graphic example of a matrix of strategies for technologies with charted strategic
development tracks in three variants for covering the brass substrate with multilayer (in the
amount of 150) PVD coatings was presented in Figure 4. The most probable strategic
development track for this technology group assumes the change of environmental conditions
from friendly spring to risky summer, with a simultaneous maintenance of the technology's
high attractiveness and strengthening an already high potential, characteristic for a wide-
stretching oak. It is anticipated that in the next years the negative environment factors will be
slowly neutralised and the analysed technology group will again enter the field of oak in
spring, for which the suitable conduct is the development, strengthening and implementation of
an attractive technology with a high potential in industrial practice in order to achieve
spectacular success.
The optimistic development track of the technology of applying multilayer (in the amount
of 150) PVD coatings on the brass substrate assumes that, despite a temporary (in 2015-2020)
appearance of numerous difficulties in the environment, it will be possible to make use of the
simultaneously appearing chances and that they will, in the future, determine the development

Materials surface engineering development trends
Technology validation of coatings deposition onto the brass substrate 231
Figure 3. The matrix of strategies for technologies called production of metallic/ceramic coatings by physical vapour deposition process onto the CuZn40Pb2 brass substrate with:
(A) monolayer, (B) fifteen layers, (C) one hundred fifty layers
of this technology group ensuring its return to the friendly area of sunny spring already in 2025;
this, in connection with the technology's high attractiveness and strengthened potential, will
ensure the achievement of spectacular success. The pessimistic variant expressed through the

Open Access Library Volume 6 2011
232 A.D. Dobrzańska-Danikiewicz, K. Lukaszkowicz
third determined strategic development track of the technology group anticipates the deepening
of the crisis in the world and, because of this, an unfavourably developing political and
economical situation which will contribute to the appearance of an increasingly larger number
of difficulties in the group is attractive and has high potential which should become an environ-
ment (2015-2020) and a smaller amount of chances, which in 2025-2030 will lead to the
necessity of functioning in the unfavourable conditions of frosty winter. The analysed technology
bargaining chip in the highly unfavourable environment conditions. The recommended conduct
is waiting through the difficulties and sustenance on the market at all costs, connected with the
intensification of the search for new markets, customer groups and new products which are
possible to manufacture using a given technology.
Table 5 contains numerical values which are the result of all the conducted research carried
out for the three analysed technology groups, corresponding to different amounts of layers which
constitute the applied PVD coating. The relatively small differences between the specific
analysed technology groups on a macro scale decide on the highly coincident direction of the
applied strategic development tracks, together with the appearing slight divergences.
Table 5. Strategic development tracks of production of metallic/ceramic coatings by physical
vapour deposition process onto the CuZn40Pb2 brass substrate. Types of strategic development tracks: (O) – optimistic, (P) – pessimistic; (MP) – the most probable
No. Technology name Steady state 2010
Type of strategic
development tracks
Years
2015 2020 2025 2030
1.
Production of metallic/ceramic monolayer coatings by physical vapour deposition process onto the CuZn40Pb2 brass substrate
Strategy of an oak in spring A (8.6,
8.3)
(O) (9.1, 6.0)
(9.1, 7.0)
(9.2, 7.6)
(9.3, 8.7)
(P) (8.6, 5.8)
(8.6, 5.6)
(8.7, 2.1)
(8.7, 1.4)
(MP) (8.7, 5.9)
(8.8, 6.3)
(8.9, 7.2)
(9.0, 8.1)
2.
Production of metallic/ceramic multilayer (in the amount 15) coatings by physical vapour deposition process onto the CuZn40Pb2 brass substrate
Strategy of an oak in spring B (8.4,
8.1)
(O) (8.5, 5.8)
(8.6, 6.7)
(8.8, 7.2)
(8.9, 8.4)
(P) (8.4, 5.6)
(8.4, 2.6)
(8.4, 2.0)
(8.5, 1.2)
(MP) (8.4, 5.8)
(8.4, 6.1)
(8.5, 6.9)
(8.6, 7.7)
3.
Production of metallic/ceramic multilayer (in the amount 150)
coatings by physical vapour deposition process onto the CuZn40Pb2 brass substrate
Strategy of an oak in spring C (8.8,
8.5)
(O) (9.3, 6.3)
(9.3, 7.4)
(9.4, 8.1)
(9.5, 9.1)
(P) (8.8, 5.9)
(8.8, 5.7)
(8.8, 2.4)
(8.8, 1.7)
(MP) (8.9, 6.1)
(9.0, 6.7)
(9.1, 7.7)
(9.2, 8.6)
Materials surface engineering development trends
Technology validation of coatings deposition onto the brass substrate 233
Figure 4. The strategic development tracks for demonstration technology called production of metallic/ceramic coatings by physical vapour deposition process onto the CuZn40Pb2 brass
substrate with one hundred fifty (C)

Open Access Library Volume 6 2011
234 A.D. Dobrzańska-Danikiewicz, K. Lukaszkowicz
4. Received results of materials science research
4.1. Coatings structure
It was confirmed based on the metallographic tests made with a light microscope that the
tested coatings were deposited with the PVD technique of reactive magnetron atomisation onto
a dual-phase substrate (α+β) of CuZn40Pb2 copper-zinc alloy. The coatings are characterised
by the same thickness within their entire area and adhere tightly to the substrate. The dual-
phase structure of CuZn40Pb2 alloy shown on the photos consists of phase α (light grains),
phase β (dark grains) and of fine, uniformly distributed Pb precipitates (Figs. 5-7).
Figure 5. Mo/TiAlN×1 coating deposited onto the CuZn40Pb2 substrate
The fractographic tests of fractures in the tested coatings made with an electron scanning
microscope confirm the previous claim that the coatings are deposited correctly (Figs. 8-10).
The coatings have a compact structure without visible stratifications and defects. A column
structure is clearly visible for monolayer coatings (Fig. 8). The fractures of multilayer coatings
viewed with a scanning microscope show there is no column structure. The fact that 15 alternate

Materials surface engineering development trends
Technology validation of coatings deposition onto the brass substrate 235
layers for multilayer coatings were applied is confirmed (Fig. 9). The coatings consisting of 150
layers, due to the small thickness of each of the coatings applied, cannot be viewed.
Figure 6. Mo/TiAlN×15 coating deposited onto the CuZn40Pb2 substrate
Figure 7. Mo/TiAlN×150 coating deposited onto the CuZn40Pb2 substrate

Open Access Library Volume 6 2011
236 A.D. Dobrzańska-Danikiewicz, K. Lukaszkowicz
Figure 8. Fracture of the Ti/TiAlN×1 coating deposited onto the CuZn40Pb2 brass substrate
Figure 9. Fracture of the Ti/TiAlN×15 coating deposited onto the CuZn40Pb2 brass substrate
The surface morphology of the coatings produced on the copper-zinc alloy substrate is char-
acterised by a high inhomogeneity because numerous bead- or ball-shaped particles are present
at the surface (Figs. 11-13) which results from the concept of the PVD coating deposition

Materials surface engineering development trends
Technology validation of coatings deposition onto the brass substrate 237
process applied. This is caused by the presence of metallic droplets in plasma of metal
atomised from a magnetron disc that take part in producing the coating. The size of droplet-
shaped particles varies and starts with several decimals of micrometer to approx. 4 µm. Double
particles and agglomerates formed of several combined particles can also be observed apart
from single droplets. Local cracks in the coating are seen if large clusters of solidified particles
are formed. Hollows were also observed in the surface of coatings where droplet-shaped
particles are deposited that next drop out during a cooling operation after ending the coatings
deposition process (Fig. 12).
Figure 10. Fracture of the Ti/TiAlN×150 coating deposited onto the CuZn40Pb2 brass substrate
The droplets chemical composition tests carried out with an EDS X-ray scattered radiation
energy spectrometer reveal that they are formed with pure metals (Ti, Cr, TiAl, Zr, Mo) depending
on the coating type. This allows to conclude that these are liquid metal droplets released from
a magnetron disc, which are deposited and solidify on the substrate surface. Therefore, different thermal properties (thermal expansion coefficient, heat conductance coefficient) of the particles
formed with pure metals and coatings may be decisive for local cracks at the particle-coating
interface and for them being dropped out after the end of the process. Oval or elongated-like
particles also occur apart from droplet- or ball-shaped particles, which may be caused by the fact
they are spattered against the surface in the coating deposition process.

Open Access Library Volume 6 2011
238 A.D. Dobrzańska-Danikiewicz, K. Lukaszkowicz
Figure 11. Topography of the Ti/ZrN×1 coating surface deposited onto the CuZn40Pb2 brass substrate
Figure 12. Topography of the Ti/ZrN×15 coating surface deposited onto the CuZn40Pb2 brass substrate

Materials surface engineering development trends
Technology validation of coatings deposition onto the brass substrate 239
Figure 13. Topography of the Ti/ZrN×150 coating surface deposited onto the CuZn40Pb2 brass substrate
It was found based on the tests of thin foils produced from coatings (Fig. 14) that the
coatings are composed of fine crystallites. While making observations in a light field and dark
field the average size was estimated to be ca. 50-120 nm according to the coating type.
The dark field image was created from reflexes 111.
4.2. Coatings phase and chemical composition
It was determined with the methods of X-ray qualitative phase analysis that CrN phases
for Ti/CrN coatings; ZrN for Ti/ZrN coatings; TiAlN for Ti/TiAlN coatings and Mo for
Mo/TiAlN coatings show a privileged crystallographic orientation. The diffraction lines
of TiAlN phase are moved to higher deflection angles as compared to the TiN phase. This
is caused by a lower parameter of the network with an NaCl structure typical for TiN with
0.423 nm to 0.418 nm as Ti atoms (r = 0.146 nm) in the network are replaced with Al atoms
(r = 0.143 nm).

Open Access Library Volume 6 2011
240 A.D. Dobrzańska-Danikiewicz, K. Lukaszkowicz
a) b)
c) d)
000
111
200
220
311
222
400
331
CrN
Figure 14. Structure of the thin foil from the Ti/CrN×1 coating deposited onto CuZn40Pb2 brass substrate, a) light field, b) dark field from the 111 reflex, c) diffraction pattern from the
area as in a, d) solution of the diffraction pattern
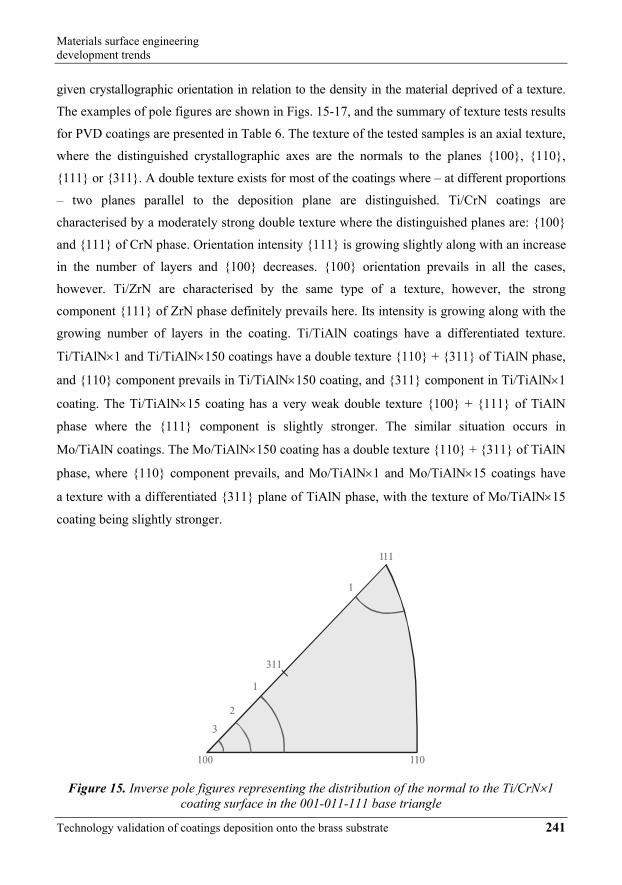
The analysis of the tested coatings' texture was carried out with the inverse pole figures
method. The texture of the coatings was found to be of axial nature, but the distinguished axis
is deflected to the normal in relation to the surface of layers even by several degrees.
The diffraction lines of the deposited nitride layers are, however, often very weak. Sometimes
they partially overlap with the lines coming from the substrate. For this reason, to be able
to present uniformly the texture of the tested coatings, the textures were not analysed with
simple pole figures for the sake of inverse pole figures presenting the distribution of the normal
to the surface of layers in the basic triangle 100-110-111. The intensities of the
following diffraction lines were analysed: 111, 200, 220 and 311. Intensity growth for
any of the lines corresponds to the existence of the distinguished crystallographic plane
corresponding to this line. For data to be fully comparable, pole figures were made as quantitative
figures, where level line figures are described as multiple normal densities corresponding to the
Materials surface engineering development trends
Technology validation of coatings deposition onto the brass substrate 241
given crystallographic orientation in relation to the density in the material deprived of a texture.
The examples of pole figures are shown in Figs. 15-17, and the summary of texture tests results
for PVD coatings are presented in Table 6. The texture of the tested samples is an axial texture,
where the distinguished crystallographic axes are the normals to the planes 100, 110,
111 or 311. A double texture exists for most of the coatings where – at different proportions
– two planes parallel to the deposition plane are distinguished. Ti/CrN coatings are
characterised by a moderately strong double texture where the distinguished planes are: 100
and 111 of CrN phase. Orientation intensity 111 is growing slightly along with an increase
in the number of layers and 100 decreases. 100 orientation prevails in all the cases,
however. Ti/ZrN are characterised by the same type of a texture, however, the strong
component 111 of ZrN phase definitely prevails here. Its intensity is growing along with the
growing number of layers in the coating. Ti/TiAlN coatings have a differentiated texture.
Ti/TiAlN×1 and Ti/TiAlN×150 coatings have a double texture 110 + 311 of TiAlN phase,
and 110 component prevails in Ti/TiAlN×150 coating, and 311 component in Ti/TiAlN×1
coating. The Ti/TiAlN×15 coating has a very weak double texture 100 + 111 of TiAlN
phase where the 111 component is slightly stronger. The similar situation occurs in
Mo/TiAlN coatings. The Mo/TiAlN×150 coating has a double texture 110 + 311 of TiAlN
phase, where 110 component prevails, and Mo/TiAlN×1 and Mo/TiAlN×15 coatings have
a texture with a differentiated 311 plane of TiAlN phase, with the texture of Mo/TiAlN×15
coating being slightly stronger.
Figure 15. Inverse pole figures representing the distribution of the normal to the Ti/CrN×1 coating surface in the 001-011-111 base triangle
Open Access Library Volume 6 2011
242 A.D. Dobrzańska-Danikiewicz, K. Lukaszkowicz
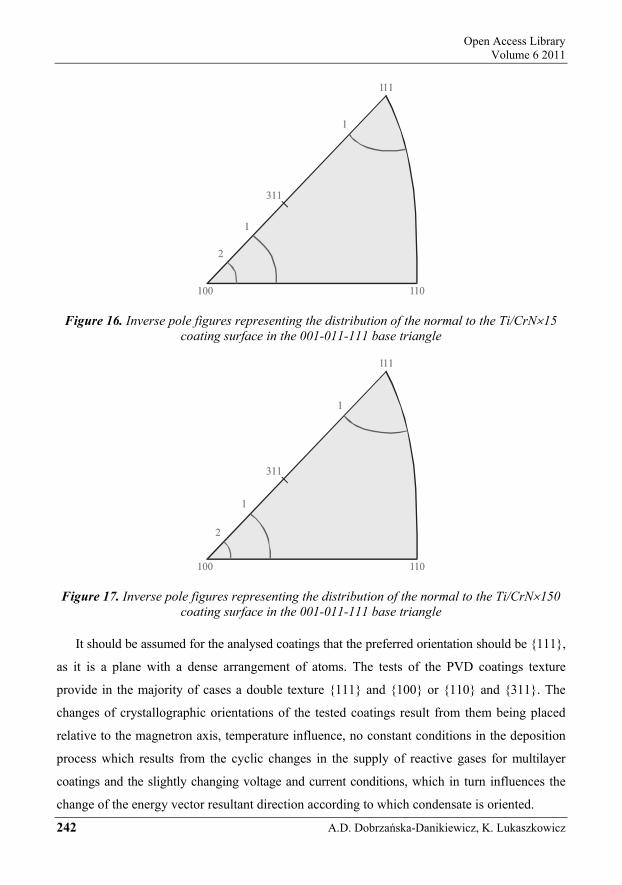
Figure 16. Inverse pole figures representing the distribution of the normal to the Ti/CrN×15 coating surface in the 001-011-111 base triangle
Figure 17. Inverse pole figures representing the distribution of the normal to the Ti/CrN×150 coating surface in the 001-011-111 base triangle
It should be assumed for the analysed coatings that the preferred orientation should be 111,
as it is a plane with a dense arrangement of atoms. The tests of the PVD coatings texture
provide in the majority of cases a double texture 111 and 100 or 110 and 311. The
changes of crystallographic orientations of the tested coatings result from them being placed
relative to the magnetron axis, temperature influence, no constant conditions in the deposition
process which results from the cyclic changes in the supply of reactive gases for multilayer
coatings and the slightly changing voltage and current conditions, which in turn influences the
change of the energy vector resultant direction according to which condensate is oriented.

Materials surface engineering development trends
Technology validation of coatings deposition onto the brass substrate 243
Table 6. Summary results of the coatings textures
Coating Texturing level of the coatings referring to the discriminated plane
100 110 111 311
Ti/CrN×1 3 – 1 –
Ti/CrN×15 2 – 1 –
Ti/CrN×150 2 – 1 –
Ti/ZrN×1 1 – 8 –
Ti/ZrN×15 1 – 8 –
Ti/ZrN×150 1 – 16 –
Ti/TiAlN×1 – 2 – 3
Ti/TiAlN×15 1 – 2 –
Ti/TiAlN×150 – 3 – 1
Mo/TiAlN×1 – – – 2
Mo/TiAlN×15 – – – 2
Mo/TiAlN×150 – 3 – 1
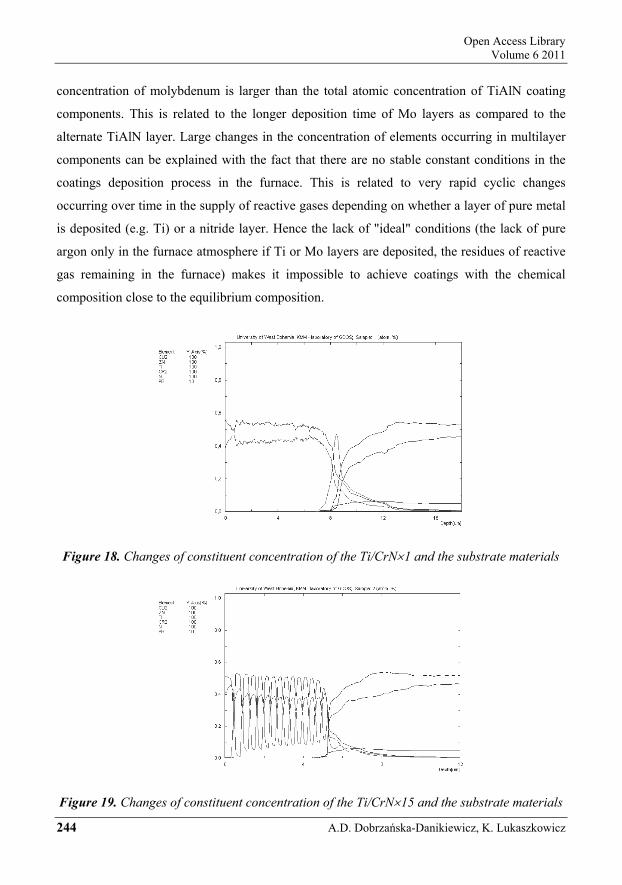
Changes to the concentration of the coatings components and the substrate material
according to the number of layers deposited were made in a glow discharge optical
spectrometer (GDOS). For Ti/CrN×1 (Fig. 18) and Ti/CrN×15 (Fig. 19) coatings, the percentage
atomic concentration of nitride is smaller by approx. 10-15% than the atomic concentration
of chromium forming the nitride layer. The nitride and chromium concentration in the
Ti/CrN×150 (Fig. 20) coating decreases relative to the maximum concentration of, respectively,
the area of 45% and 35%, in atomic terms, to approx. 35% and 25% at the depth of 2 µm,
whereas the titanium concentration increases from 20% at the area up to approx. 40% at the
depth of 2 µm. The decisive reason for such distribution of concentrations for the analysed
elements is the impact of the coating deposition conditions. A varying concentration of the
elements forming Ti/CrN coatings signifies its chemical inhomogeneity. The chemical
composition of Ti/ZrN coatings (Figs. 21-23) also deviates from the equilibrium composition.
Nitride concentration is regularly decreasing to the maximum level, depending on the number
of layers in the coating at the surface of 55-75%, in atomic terms, of 40-60% at the depth of
approx. 1 µm, and the Zr concentration is rising from 25-45% at the surface up to 40-60% at
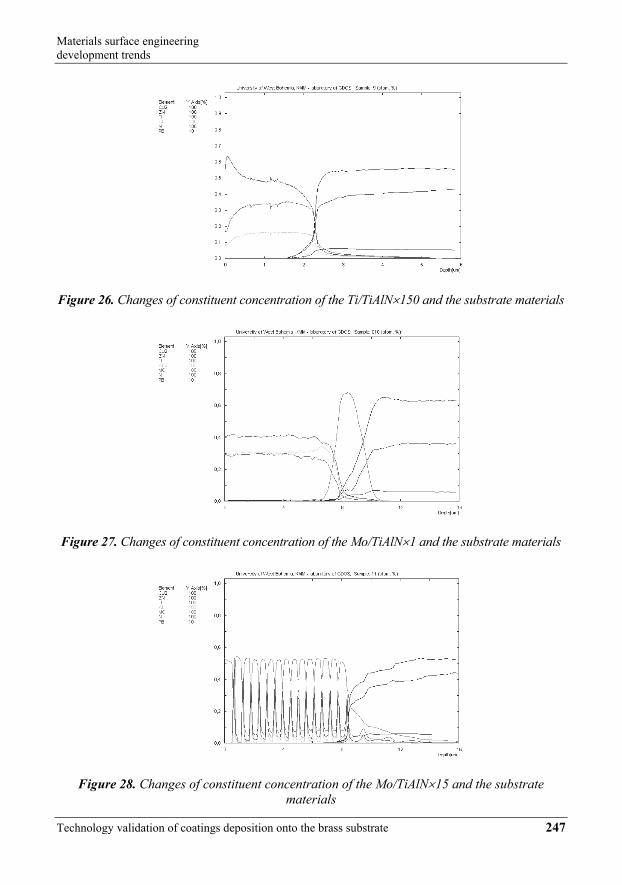
the depth of approx. 1 µm. The similar situation occurs for Ti/TiAlN coatings (Figs. 24-26)
where variations in the concentration of elements for pure metals Ti and Al forming the coating
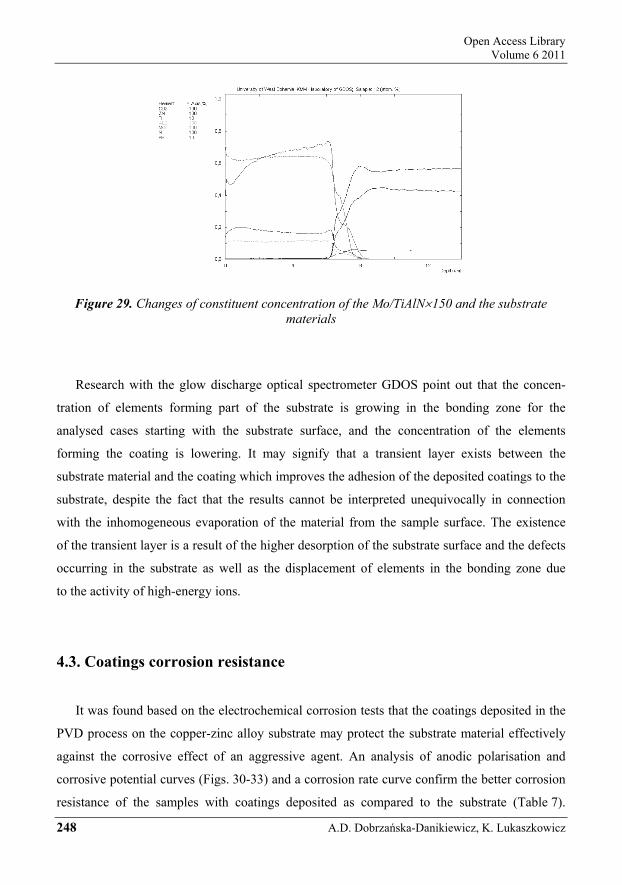
and of nitride are considerable. In case of Mo/TiAlN coatings (Figs. 27-29), the atomic
Open Access Library Volume 6 2011
244 A.D. Dobrzańska-Danikiewicz, K. Lukaszkowicz
concentration of molybdenum is larger than the total atomic concentration of TiAlN coating
components. This is related to the longer deposition time of Mo layers as compared to the
alternate TiAlN layer. Large changes in the concentration of elements occurring in multilayer
components can be explained with the fact that there are no stable constant conditions in the
coatings deposition process in the furnace. This is related to very rapid cyclic changes
occurring over time in the supply of reactive gases depending on whether a layer of pure metal
is deposited (e.g. Ti) or a nitride layer. Hence the lack of "ideal" conditions (the lack of pure
argon only in the furnace atmosphere if Ti or Mo layers are deposited, the residues of reactive
gas remaining in the furnace) makes it impossible to achieve coatings with the chemical
composition close to the equilibrium composition.
Figure 18. Changes of constituent concentration of the Ti/CrN×1 and the substrate materials
Figure 19. Changes of constituent concentration of the Ti/CrN×15 and the substrate materials

Materials surface engineering development trends
Technology validation of coatings deposition onto the brass substrate 245
Figure 20. Changes of constituent concentration of the Ti/CrN×150 and the substrate materials
Figure 21. Changes of constituent concentration of the Ti/ZrN×1 and the substrate materials
Figure 22. Changes of constituent concentration of the Ti/ZrN×15 and the substrate materials

Open Access Library Volume 6 2011
246 A.D. Dobrzańska-Danikiewicz, K. Lukaszkowicz
Figure 23. Changes of constituent concentration of the Ti/ZrN×150 and the substrate materials
Figure 24. Changes of constituent concentration of the Ti/TiAlN×1 and the substrate materials
Figure 25. Changes of constituent concentration of the Ti/TiAlN×15 and the substrate materials
Materials surface engineering development trends
Technology validation of coatings deposition onto the brass substrate 247
Figure 26. Changes of constituent concentration of the Ti/TiAlN×150 and the substrate materials
Figure 27. Changes of constituent concentration of the Mo/TiAlN×1 and the substrate materials
Figure 28. Changes of constituent concentration of the Mo/TiAlN×15 and the substrate materials
Open Access Library Volume 6 2011
248 A.D. Dobrzańska-Danikiewicz, K. Lukaszkowicz
Figure 29. Changes of constituent concentration of the Mo/TiAlN×150 and the substrate materials
Research with the glow discharge optical spectrometer GDOS point out that the concen-
tration of elements forming part of the substrate is growing in the bonding zone for the
analysed cases starting with the substrate surface, and the concentration of the elements
forming the coating is lowering. It may signify that a transient layer exists between the
substrate material and the coating which improves the adhesion of the deposited coatings to the
substrate, despite the fact that the results cannot be interpreted unequivocally in connection
with the inhomogeneous evaporation of the material from the sample surface. The existence
of the transient layer is a result of the higher desorption of the substrate surface and the defects
occurring in the substrate as well as the displacement of elements in the bonding zone due
to the activity of high-energy ions.
4.3. Coatings corrosion resistance
It was found based on the electrochemical corrosion tests that the coatings deposited in the
PVD process on the copper-zinc alloy substrate may protect the substrate material effectively
against the corrosive effect of an aggressive agent. An analysis of anodic polarisation and
corrosive potential curves (Figs. 30-33) and a corrosion rate curve confirm the better corrosion
resistance of the samples with coatings deposited as compared to the substrate (Table 7).

Materials surface engineering development trends
Technology validation of coatings deposition onto the brass substrate 249
A current density in anodic scanning is always smaller than for an uncoated sample
(12.4 µA/cm2), which pinpoints a good protective effect.
a)
-0,330
-0,310
-0,290
-0,270
-0,250
-0,230
-0,210
-0,190
-0,170
-0,150
0 600 1200 1800 2400 3000 3600
Time [s]
Pote
ntia
l [V
]
Ti/CrN×1
Ti/CrN×15 Ti/CrN×150
b)
-9
-8
-7
-6
-5
-4
-3
-2
-1
0
-1,0 -0,8 -0,6 -0,4 -0,2 0,0 0,2 0,4 0,6
Potential, [V]
Cur
rent
den
sity,
log|
i| a
Ti/CrN×1
Ti/CrN×15Ti/CrN×150
Figure 30. a) Open circuit potential curves, b) potentiodynamic polarisation curves of the Ti/CrN coatings in 1 M HCl solution
The progress of polarisation curves signifies the active quench annealing of the CuZn40Pb2
copper-zinc alloy surface uncoated with any layer. The smallest corrosion current density icor,
thus the smallest anodic quench annealing of coatings and the related best corrosion protection
properties are exhibited, regardless the type, the coatings with 150 and 15 layers. This can be
explained with the fact that the system of multilayer deposition of coatings offers greater
opportunities of preventing the cause of corrosion such as scratches or crevices. Small pores
and cracks in the coating and the difference between a large area of cathode (coating), and
a small area of anode (bottom of pores) is reducing the corrosion protection of coatings.

Open Access Library Volume 6 2011
250 A.D. Dobrzańska-Danikiewicz, K. Lukaszkowicz
a)
-0,400
-0,300
-0,200
-0,100
0,000
0,100
0,200
0,300
0 600 1200 1800 2400 3000 3600
Time, [s]
Pote
ntia
l, [V
]
Ti/TiAlN×15 Ti/TiAlN×150
Ti/TiAlN×1
b)
-9
-8
-7
-6
-5
-4
-3
-2
-1
0
-0,6 -0,4 -0,2 0,0 0,2 0,4 0,6
Potential, [V]
Cur
rent
den
sity,
log|
i| a
Ti/TiAlN×1
Ti/TiAlN×15Ti/TiAlN×150
Figure 31. a) Open circuit potential curves, b) potentiodynamic polarisation curves of the Ti/TiAlN coatings in 1 M HCl solution
The defects and damages occurring on a single coating deposited in the deposition process
can be neutralised or "masked" with the subsequent coating layers being deposited. This way,
the path of the corrosion factor is extended or closed. Hence, with 150 layers, the corrosion
factor needs more time to penetrate through coating defects than for 1 or 15 layers.
The cathodic progress of curves shows that the reactions taking place on the substrate covered
with coatings are being strongly inhibited. The anodic behaviour of the tested configurations
may prove that coatings are porous or damaged. Many of the coatings were subject to anodic
self-passivation, whereas the passive condition takes place within the narrow range
of potential. An increase in anodic current related to transpassivation was observed within the

Materials surface engineering development trends
Technology validation of coatings deposition onto the brass substrate 251
potentials of 0.2-0.4 mV. One can estimate corrosion currents and corrosion rate from the
progress of polarisation curves (Table 7).
a)
-0,250
-0,230
-0,210
-0,190
-0,170
-0,150
-0,130
-0,110
0 600 1200 1800 2400 3000 3600
Time [s]
Pote
ntia
l [V
]
Ti/ZrN×1
Ti/ZrN×150Ti/ZrN×15
b)
-9
-8
-7
-6
-5
-4
-3
-2
-1
0
-0,6 -0,4 -0,2 0,0 0,2 0,4 0,6
Potential, [V]
Cur
rent
den
sity,
log|
i| a
Ti/ZrN×1Ti/ZrN×15Ti/ZrN×150
Figure 32. a) Open circuit potential curves, b) potentiodynamic polarisation curves of the Ti/ZrN coatings in 1 M HCl solution
The tests results for corrosion potential Ecor confirm improved corrosion resistance for
multilayer coatings. Note-worthy is the fact that after 60 minutes of the experiment, the
corrosion potential is clearly rising (from –315 mV to –254 mV) for the copper substrate
uncoated with any coating, therefore it is subject to auto-passivation.
The results of impedance measurements (Table 7) confirm the higher corrosion resistance
of copper-zinc alloy with coatings applied. The load transmission resistance is higher for the
coated samples. This signifies that the coatings act as a diffusion barrier. Multilayer coatings
have the best protection properties which is proved by the results of polarisation tests.

Open Access Library Volume 6 2011
252 A.D. Dobrzańska-Danikiewicz, K. Lukaszkowicz
a)
-0,250
-0,200
-0,150
-0,100
-0,050
0,000
0 600 1200 1800 2400 3000 3600
Time, [s]
Pote
ntia
l, [V
]
TiAlN/Mo×15 TiAlN/Mo×150TiAlN/Mo×1
b)
-8
-7
-6
-5
-4
-3
-2
-1
0
-0,6 -0,4 -0,2 0,0 0,2 0,4 0,6
Potential, [V]
Cur
rent
den
sity,
log
|i| a
Mo/TiAlN×1Mo/TiAlN×15
Mo/TiAlN×150
Figure 33. a) Open circuit potential curves, b) potentiodynamic polarisation curves of the Mo/TiAlN coatings in 1 M HCl solution
Table 7. Summary results of the electrochemical corrosion investigation
Coating Corrosion potential Ecor, mV
Current density icor, µA/cm2
Resistance polarisation Rp, kΩ·cm2
Corrosion rate, mm/year
Ti/CrN×1 - 220 2.2 2.4 0.027 Ti/CrN×15 - 208 1.0 9.2 0.013 Ti/CrN×150 - 202 0.6 7.8 0.008 Ti/ZrN×1 - 238 0.6 7.1 0.008 Ti/ZrN×15 - 211 0.4 12.7 0.005 Ti/ZrN×150 - 191 0.2 12.9 0.003 Ti/TiAlN×1 - 297 5.1 0.58 0.063 Ti/TiAlN×15 - 268 3.4 1.4 0.032 Ti/TiAlN×150 - 243 1.1 1.1 0.014 Mo/TiAlN×1 - 220 5.4 2.9 0.066 Mo/TiAlN×15 - 228 2.1 4.9 0.025 Mo/TiAlN×150 - 194 1.3 4.1 0.015 Substrate - 254 12.4 2.18 0.167

Materials surface engineering development trends
Technology validation of coatings deposition onto the brass substrate 253
Figure 34. Effect of the electrochemical corrosion on the Ti/CrN×15 coating
Figure 35. Effect of the electrochemical corrosion on the Ti/TiAlN×1 coating

Open Access Library Volume 6 2011
254 A.D. Dobrzańska-Danikiewicz, K. Lukaszkowicz
Changes to the colour of coatings and their increased roughness caused by intensive surface
quench annealing was observed during the activity of the aggressive factor. Microscope
observations allow to conclude that the coating damage process due to electrochemical
corrosion progresses in two ways. In the first case, coatings are damaged in numerous locations
and the damage area itself is small (Fig. 34). In the other case, the coatings damaged by the
aggressive factor embrace the large areas of coatings, hence damage appearance changes
or some parts of coatings detach from the substrate material (Fig. 35).
4.4. Coatings mechanical properties
The tested CuZn40Pb2 copper-zinc alloy samples prepared for being deposited by polishing
using a diamond suspension show the roughness of Ra= 0.01 µm. Ra roughness rises
significantly between 0.15-0.29 µm (Table 8) if coatings are deposited. The topography of the
coatings surface described earlier in the chapter undoubtedly contributes to such larger surface
roughness. Those two factors are also crucial for the friction coefficient values within the range
of 0.33-0.52 (Table 9) and fully correlate with the Ra roughness parameter values obtained for
the same coatings.
Table 8. Summary results of the mechanical properties
Coating Hardness, DHV 0.0025
Roughness Ra, µm
Young`s modulus,
GPa
Stiffness, mN/µm
Thickness, µm
Ti/CrN×1 2450 0.19 258 330 5.8 Ti/CrN×15 2350 0.24 235 251 4.5 Ti/CrN×150 1800 0.22 228 216 3.1 Ti/ZrN×1 3100 0.20 291 224 2.1 Ti/ZrN×15 2700 0.19 343 265 1.6 Ti/ZrN×150 2200 0.20 290 253 1.9 Ti/TiAlN×1 2400 0.22 348 274 2.3 Ti/TiAlN×15 2100 0.22 259 253 2.7 Ti/TiAlN×150 1850 0.25 210 195 2.2 Mo/TiAlN×1 2400 0.18 302 236 6.2 Mo/TiAlN×15 2200 0.19 293 226 6.5 Mo/TiAlN×150 2000 0.25 297 250 5.9
Dynamic hardness was determined at the load of 0.025 N. A clear effect of the number
of layers applied onto the substrate on the obtained dynamic hardness values was found

Materials surface engineering development trends
Technology validation of coatings deposition onto the brass substrate 255
(Table 8). Monolayer coatings show the largest hardness. As the number of layers rises, their
hardness lowers. This stems from the larger hardness of a single thick nitride layer, e.g. ZrN
or TiN than from the system of 15 or 150 layers where the properties and hardness on the
alternate metallic (soft) layer and the nitride (hard) layer differ. The value of the elongation
elasticity factor E and of the coating rigidity factor (Table 8) were determined using Hardness
4.2 software fitted with the ultra-microhardness tester and with the relationship between the
load and indenter depth into the tested layer. The rigidity of the tested layers is within 195-330
mN/µm, and Young's modulus for the applied coatings is within 348-210 GPa. Similarly as for
hardness, smaller elongation elasticity values for multilayer coatings can be observed.
The tests of internal stresses existing within coatings were carried out with X-ray analysis
methods. The values obtained (Table 9) indicate that internal compressive (negative) stresses
occur in coatings. Their strength properties grow as a result. Smaller values of internal stresses
in multilayer coatings result from a possibility of reducing them at the subsequent alternate
hard nitride and soft pure metallic layers.
Table 9. Summary results of the mechanical properties
Coating Critical load LC2, N
Friction distance, m (pin-on-disc test)
Friction coefficient, µ
Residual stresses, GPa
Ti/CrN×1 50 100 0.37 -2.6 Ti/CrN×15 48 98 0.47 2.3 Ti/CrN×150 47 24 0.43 -0.1 Ti/ZrN×1 45 16 0.38 -8.9 Ti/ZrN×15 41 10 0.38 -4.7 Ti/ZrN×150 37 7 0.40 -1.6 Ti/TiAlN×1 41 10 0.43 -11.9 Ti/TiAlN×15 40 5 0.42 2.1 Ti/TiAlN×150 38 2.5 0.48 -0.2 Mo/TiAlN×1 48 75 0.35 -1.3 Mo/TiAlN×15 45 16 0.37 -1.3 Mo/TiAlN×150 40 3 0.47 -0.1
The values of the critical load LC2 were determined with the scratch test method with linear
load growth characterising the adhesion of the tested coatings to the substrate material caused
mainly by adhesion and diffusion forces. The summary of tests results is presented in Table 9.
The critical load LC2 was determined as corresponding to a sudden decline in acoustic emission
being the friction coefficient change signal between the diamond indenter and the coating
subject to partial cracking (Figs. 36-38) and based on an optical observation with a light

Open Access Library Volume 6 2011
256 A.D. Dobrzańska-Danikiewicz, K. Lukaszkowicz
microscope. The results obtained allow to conclude that the critical load LC2 at which coatings
are damaged is reduced along with more layers in the coating. An additional thin intermediate
layer in monolayer coatings improves the adhesion of nitride coating to the substrate as it
counteracts the propagation of cracks and reduces stresses within the coating-substrate zone.
For multilayer coatings, the coating is deformed as the indenter presses against the coating
because the softer and more flexible layers deposited with pure metals are more strongly
deformed than the hard nitride layers. Bending stresses are produced that are destroying the
system of alternate hard and soft layers due to cracks in nitride layers subjected to an excessive
deformation. The relatively softer and more flexible pure metal layers are not able to
counteract effectively the wear in contact with other materials, unlike the thick layers.
0
10
20
30
40
50
60
0 1 2 3 4 5
Scratch length [mm]
Loa
d [N
]Fr
ictio
n fo
rce
[N]
0
20
40
60
80
100
Aco
ustic
em
issio
n A
E
Load Friction force AE
Figure 36. Diagram of the dependence of the acoustic emission (AE) and friction force Ft on the load for the Ti/ZrN×1 coating
0
10
20
30
40
50
60
0 1 2 3 4 5 6
Scratch length [mm]
Loa
d [N
]Fr
ictio
n fo
rce
[N]
0
20
40
60
80
100
Aco
ustic
em
issio
n A
E
Load Friction force AE
Figure 37. Diagram of the dependence of the acoustic emission (AE) and friction force Ft on the load for the Ti/ZrN×15 coating

Materials surface engineering development trends
Technology validation of coatings deposition onto the brass substrate 257
0
10
20
30
40
50
0 1 2 3 4
Scratch length [mm]
Loa
d [N
]Fr
ictio
n fo
rce
[N]
0
20
40
60
80
100
Aco
ustic
em
issio
n A
E
Load Friction force AE
Figure 38. Diagram of the dependence of the acoustic emission (AE) and friction force Ft on the load for the Ti/ZrN×15 coating
To determine the nature of damages created during the adhesion test, they were tested with
a scanning electron microscope (Fig. 39).
Figure 39. Characteristic failure of the Ti/CrN×1 coating developed during the scratch test, SEM
In general, the first symptoms of a damaged coating in the majority of the tested coatings
deposited with the PVD technique are arch-like cracks caused by stretching and chipping at the
bottom of the scratch formed during the adhesion test. In few cases, minor chipping occurs

Open Access Library Volume 6 2011
258 A.D. Dobrzańska-Danikiewicz, K. Lukaszkowicz
at the scratch edges. As the load increases, semicircles are developed caused by confermal
cracking leading to delamination and cracks as a result of which local coating delamination
occurs. After an attempt to fracture copper-zinc alloy with coatings deposited made after pre-
cooling in liquid nitrogen, no delamination was identified in any case along the substrate-
coating separation surface, signifying that the coatings adhere well to the substrate. The coatings
are almost completely delaminated at the maximum load, however, in all the examined cases,
which may be caused by a large difference in mechanical and physical properties between the
soft substrate material and the hard coating.
4.5. Coatings tribological properties
Erosion tests were conducted to identify the functional and operating properties of coatings.
Considering the specific properties of the substrate material (relatively soft compared
to coatings), it is impossible to make a standard 3D profile analysis of craters formed in erosion
tests as the erodent indents into the soft substrate at the bottom of the craters. The profile of the
generated damage changes as a result enabling to assess correctly the degree of damaging the
coatings. As the nozzle is positioned perpendicular to the surface of coatings, short intervals
were made between the subsequent test steps. Colour metallography methods applying
a computer image analysis with a scanning electron microscope were utilised to evaluate the
degree of the tested coatings' damage (Fig. 40) by taking advantage of the different colours
of the substrate and coatings (green colour – coating, red – substrate, blue – erodent), what
unfortunately can not be show at black and white pictures.
The observations of coatings damaged in the erosion test with a scanning electron
microscope enable also to determine the percentage of the damaged area in respect of the total
observation field area agreed in a way ensuring that the largest area of the formed crater
is covered, using stereological methods for this purpose. The data shown in Figures 41-44 prove
that the best resistance to the erodent is exhibited by monolayer coatings, especially Ti/CrN×1
coating, where after 1 second of the test only 1.1% of the substrate is exposed by the impacting
erodent particles and the percentage degree of coating damage is approx. 11.5% (percentage
of the exposed substrate + erodent particles driven into the coating and into the substrate material)
as a result of which approx. 88% of the coatings area does not show any damage. In case of the

Materials surface engineering development trends
Technology validation of coatings deposition onto the brass substrate 259
same coating consisting of 15 layers, the percentage share of the coatings area not exhibiting
any damage due to the destructive activity of the erodent after 1 s is 53%, and for 150 layers –
17.5%. This means that over 80% of the coatings area is damaged and its erosion resistance is
over fourfold smaller than a monolayer coating after the same test duration. The perforation
rate for other multilayer coatings is much greater thus compromising their resistance to erosive
damage. For Ti/TiAlN coatings after 0.3 s of the test, depending on the number of layers, the
perforation rate varies within 14-83%, for Ti/ZrN coatings after 0.4 s of the test – 27-78%, and
for Mo/TiAlN coatings, after 0.4 s the perforation rate for coatings is within 35-69%.
Figure 40. Surface of the Ti/ZrN×1 coating in various of the erosion test stages, depending
on the SEM test duration
The subsequent damage process stages can be identified due to the acting erodent particles
by analysing the coatings surface. The erodent, in the initial stage of the erosion test's duration,
when driving into the coating material, causes minor coating damages due to abrasion or cracking
in various locations. The spots occur on the surface where the coating is intact and small areas
0.1 s 0.2 s
0.3 s 0.4 s

Open Access Library Volume 6 2011
260 A.D. Dobrzańska-Danikiewicz, K. Lukaszkowicz
0,11,1 0,2 1,10,1
31,8
4,3
22,428,7
74,457,9
13,7
64,4
01020304050607080
0 0,2 0,4 0,6 0,8 1
Test time period [s]
Coa
ting
perf
orat
ion
exte
nt
[%]
Ti/CrN x 1 Ti/CrN x 15 Ti/CrN x 150
Figure 41. Extent of perforation of the Ti/CrN coatings deposited onto the CuZn40Pb2 substrate depending on the erosion test time period
26,417,114,58,9
0,3
55,144
29
8582,9 83,4
0
20
40
60
80
100
0 0,1 0,2 0,3 0,4 0,5
Test time period [s]
Coa
ting
perf
orat
ion
exte
nt
[%]
Ti/TiAlN x 1 Ti/TiAlN x 15 Ti/TiAlN x 150
Figure 42. Extent of perforation of the Ti/TiAlN coatings deposited onto the CuZn40Pb2 substrate depending on the erosion test time period
2,1
27,718,3
8,922,513,9
42,4 42,6
23,330,1
61,478,2
0
20
40
60
80
100
0 0,1 0,2 0,3 0,4
Test time period, s
Coa
ting
perf
orat
ion
exte
nt
[%]
Ti/ZrN x 1 Ti/ZrN x 15 Ti/ZrN x 150
Figure 43. Extent of perforation of the Ti/ZrN coatings deposited onto the CuZn40Pb2 substrate depending on the erosion test time period
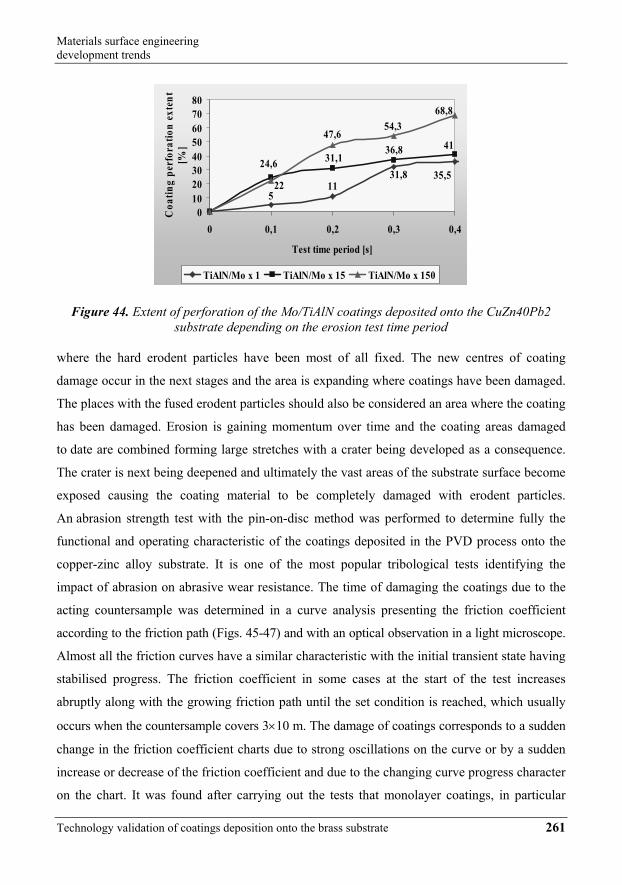
Materials surface engineering development trends
Technology validation of coatings deposition onto the brass substrate 261
511
35,531,8
4136,831,124,6
22
47,654,3
68,8
01020304050607080
0 0,1 0,2 0,3 0,4
Test time period [s]
Coa
ting
perf
orat
ion
exte
nt
[%]
TiAlN/Mo x 1 TiAlN/Mo x 15 TiAlN/Mo x 150
Figure 44. Extent of perforation of the Mo/TiAlN coatings deposited onto the CuZn40Pb2
substrate depending on the erosion test time period
where the hard erodent particles have been most of all fixed. The new centres of coating
damage occur in the next stages and the area is expanding where coatings have been damaged.
The places with the fused erodent particles should also be considered an area where the coating
has been damaged. Erosion is gaining momentum over time and the coating areas damaged
to date are combined forming large stretches with a crater being developed as a consequence.
The crater is next being deepened and ultimately the vast areas of the substrate surface become
exposed causing the coating material to be completely damaged with erodent particles.
An abrasion strength test with the pin-on-disc method was performed to determine fully the
functional and operating characteristic of the coatings deposited in the PVD process onto the
copper-zinc alloy substrate. It is one of the most popular tribological tests identifying the
impact of abrasion on abrasive wear resistance. The time of damaging the coatings due to the
acting countersample was determined in a curve analysis presenting the friction coefficient
according to the friction path (Figs. 45-47) and with an optical observation in a light microscope.
Almost all the friction curves have a similar characteristic with the initial transient state having
stabilised progress. The friction coefficient in some cases at the start of the test increases
abruptly along with the growing friction path until the set condition is reached, which usually
occurs when the countersample covers 3×10 m. The damage of coatings corresponds to a sudden
change in the friction coefficient charts due to strong oscillations on the curve or by a sudden
increase or decrease of the friction coefficient and due to the changing curve progress character
on the chart. It was found after carrying out the tests that monolayer coatings, in particular

Open Access Library Volume 6 2011
262 A.D. Dobrzańska-Danikiewicz, K. Lukaszkowicz
Ti/CrN×1, have the largest path after which coatings are damaged due to friction by the
countersample and this is consistent with the results obtained after making erosion tests
(Table 9). Similar as in that case, the smallest resistance to abrasive wear was found for
multilayer coatings, with, accordingly, 150 and 15 layers. The system of alternate, very thin
hard nitride layers and soft layers deposited with pure metals does not secure sufficient wear
protection, as contrary to monolayer coatings where a single, thick nitride layer represents
good protection for various functional materials during the alternate activity of the abrading
elements in a relative motion.
0,000,100,200,300,400,500,600,700,800,901,00
0 200 400 600 800 1000
Friction path [m]
Fric
tion
coef
ficie
nt µ
Figure 45. Plot of the friction coefficient depending on friction path for the pin-on-disc of the Ti/CrN×1 coating
0,000,100,200,300,400,500,600,700,800,90
0 200 400 600 800 1000
Friction path [m]
Fric
tion
coef
ficie
nt µ
Figure 46. Plot of the friction coefficient depending on friction path for the pin-on-disc of the Ti/CrN×15 coating

Materials surface engineering development trends
Technology validation of coatings deposition onto the brass substrate 263
0,000,100,200,300,400,500,600,700,800,901,00
0 100 200 300
Friction path [m]
Fric
tion
coef
ficie
nt µ
Figure 47. Plot of the friction coefficient depending on friction path for the pin-on-disc of the Ti/CrN×150 coating
5. Outworked technology roadmaps
A series of roadmaps of the analysed groups of technology were created on the basis
of achieved results of experimental and comparative research. A representative roadmap
prepared for production of metallic/ceramic multilayer (in the amount 150) coatings by physical
vapour deposition process onto the CuZn40Pb2 brass substrate in Table 10 is shown.
The horizontal axis of a roadmap corresponds to time intervals, and the vertical axis to seven
layers called as following: time, conceptual, product, technological, spatial, staff and quantitative.
The upper layers were divided into more sublayers arranged hierarchically detailed starting
from the upper ones being the most general one determining premises, causes and reasons
of the realised actions through the middle ones characterizing a product and technology
in lower layers of the technology precising an organisational and technical details at the end.
Technology roadmaps are a very comfortable and practical tool of comparative analysis which
facilitates the selection of technologies according to the selected criterion, and when
supplemented by operation sheets with precise technological details – they enable the
implementation of a given technology in industrial practice. A very large significance
of technology roadmaps is their flexibility which enables their supplementing and expanding
by new sub-layers depending on the arising needs. On the basis of data contained in given

Open Access Library Volume 6 2011
264 A.D. Dobrzańska-Danikiewicz, K. Lukaszkowicz
roadmaps prepared for all the analysed groups of technology the summary was outworked,
which is presented in Table 11.
Tabl
e 10
. Dem
onst
ratin
g te
chno
logy
road
map
ping
for p
rodu
ctio
n of
met
allic
/cer
amic
mul
tilay
er (n
umbe
r of l
ayer
s 15
0) c
oatin
gs b
y ph
ysic
al v
apou
r dep
ositi
on p
roce
ss o
nto
the
CuZ
n40P
b2 b
rass
subs
trat
e

Materials surface engineering development trends
Technology validation of coatings deposition onto the brass substrate 265
Table 11. Selected main source data used for preparation of roadmaps for production of metallic/ceramic coatings by physical vapour deposition process onto the CuZn40Pb2 brass
substrate with: (A) monolayer, (B) fifteen layers, (C) one hundred fifty layers
No. Analysed factor Time interval
Analysed technology
A B C
1.
All-society and
economic perspectives
1st trend
2010 Creating scenarios of future events 2020 Development of priority innovation technologies 2030 Statistically high quality of technologies
2nd trend
2010 Creating the Book of information cards concerning future technologies
2020 Using chances and avoiding difficulties 2030 Sustainable development
3rd trend
2010 Development of information society and intellectual capital
2020 Cooperation to increase innovativeness and competitiveness of economy and intellectual capital
2030 Knowledge-based economy
2. Strategy for technology
2010 Strategy of an oak in spring
Strategy of an oak in spring
Strategy of an oak in spring
2020 Strategy of an oak in summer
Strategy of an oak in summer
Strategy of an oak in summer
2030 Strategy of an oak in spring
Strategy of an oak in spring
Strategy of an oak in spring
3. Environment influence 2010 Sunny spring
4. Technology value 2010 Wide-stretching oak
5. Product
2010
Tools and machine parts working in the conditions of higher
mechanical and thermal loads (e.g. matrices for plastic
working)
Tools and machine parts working in the conditions of higher mechanical, thermal and corrosion loads
Tools and machine parts working in the conditions of higher
corrosion loads
2020
Ultra thin layers for electronics and optoelectronics,
photovoltaic equipment
Ultra thin layers for electronics and optoelectronics,
photovoltaic equipment
Ultra thin layers for electronics and optoelectronics,
photovoltaic equipment
2030
Artificial organs in clinical and
experimental medicine,
photovoltaic equipment
Artificial organs in clinical and
experimental medicine,
photovoltaic equipment
Artificial organs in clinical and
experimental medicine, intelligent materials,
6. Product quality at the background of
foreign competitors
2010 Quite high (7) Quite high (7) Quite high (7)
2020 High (8) High (8) High (8) 2030 Very high (9) Very high (9) Very high (9)
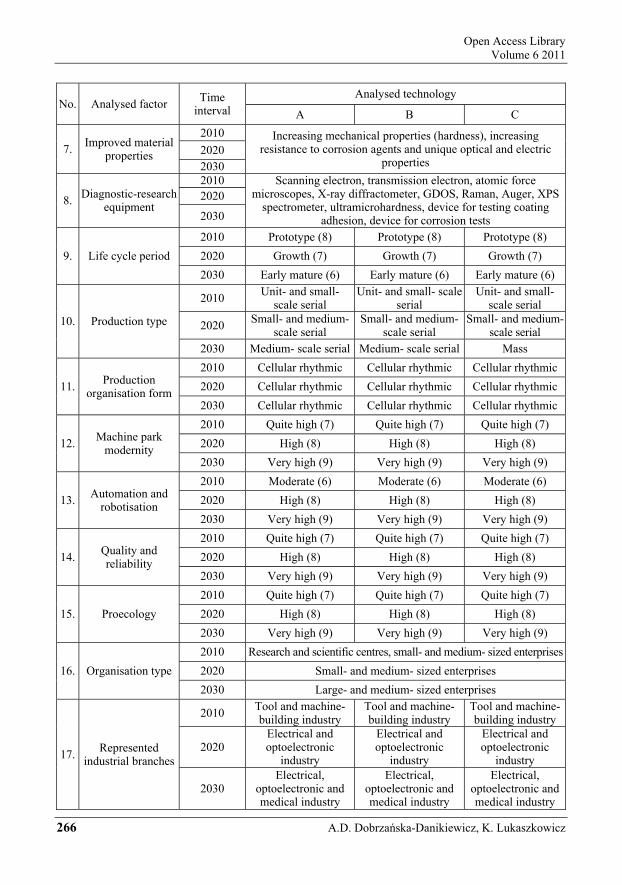
Open Access Library Volume 6 2011
266 A.D. Dobrzańska-Danikiewicz, K. Lukaszkowicz
No. Analysed factor Time interval
Analysed technology
A B C
7. Improved material properties
2010 Increasing mechanical properties (hardness), increasing resistance to corrosion agents and unique optical and electric
properties 2020 2030
8. Diagnostic-research equipment
2010 Scanning electron, transmission electron, atomic force microscopes, X-ray diffractometer, GDOS, Raman, Auger, XPS
spectrometer, ultramicrohardness, device for testing coating adhesion, device for corrosion tests
2020
2030
9. Life cycle period 2010 Prototype (8) Prototype (8) Prototype (8) 2020 Growth (7) Growth (7) Growth (7) 2030 Early mature (6) Early mature (6) Early mature (6)
10. Production type
2010 Unit- and small-scale serial
Unit- and small- scale serial
Unit- and small- scale serial
2020 Small- and medium-scale serial
Small- and medium-scale serial
Small- and medium- scale serial
2030 Medium- scale serial Medium- scale serial Mass
11. Production organisation form
2010 Cellular rhythmic Cellular rhythmic Cellular rhythmic 2020 Cellular rhythmic Cellular rhythmic Cellular rhythmic 2030 Cellular rhythmic Cellular rhythmic Cellular rhythmic
12. Machine park modernity
2010 Quite high (7) Quite high (7) Quite high (7) 2020 High (8) High (8) High (8) 2030 Very high (9) Very high (9) Very high (9)
13. Automation and robotisation
2010 Moderate (6) Moderate (6) Moderate (6) 2020 High (8) High (8) High (8) 2030 Very high (9) Very high (9) Very high (9)
14. Quality and reliability
2010 Quite high (7) Quite high (7) Quite high (7) 2020 High (8) High (8) High (8) 2030 Very high (9) Very high (9) Very high (9)
15. Proecology 2010 Quite high (7) Quite high (7) Quite high (7) 2020 High (8) High (8) High (8) 2030 Very high (9) Very high (9) Very high (9)
16. Organisation type 2010 Research and scientific centres, small- and medium- sized enterprises 2020 Small- and medium- sized enterprises 2030 Large- and medium- sized enterprises
17. Represented industrial branches
2010 Tool and machine-building industry
Tool and machine-building industry
Tool and machine-building industry
2020 Electrical and optoelectronic
industry
Electrical and optoelectronic
industry
Electrical and optoelectronic
industry
2030 Electrical,
optoelectronic and medical industry
Electrical, optoelectronic and medical industry
Electrical, optoelectronic and medical industry
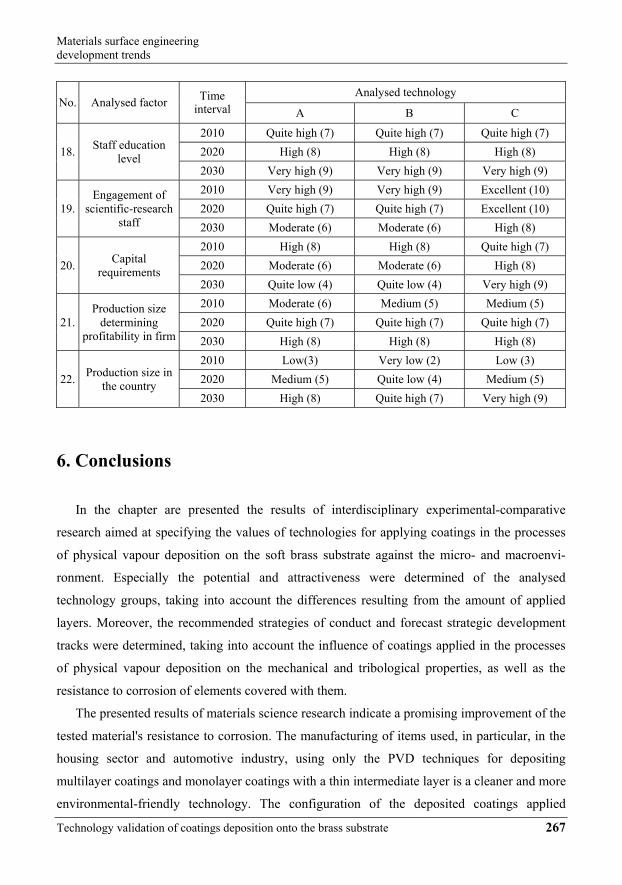
Materials surface engineering development trends
Technology validation of coatings deposition onto the brass substrate 267
No. Analysed factor Time interval
Analysed technology
A B C
18. Staff education level
2010 Quite high (7) Quite high (7) Quite high (7) 2020 High (8) High (8) High (8) 2030 Very high (9) Very high (9) Very high (9)
19. Engagement of
scientific-research staff
2010 Very high (9) Very high (9) Excellent (10) 2020 Quite high (7) Quite high (7) Excellent (10) 2030 Moderate (6) Moderate (6) High (8)
20. Capital requirements
2010 High (8) High (8) Quite high (7) 2020 Moderate (6) Moderate (6) High (8) 2030 Quite low (4) Quite low (4) Very high (9)
21. Production size
determining profitability in firm
2010 Moderate (6) Medium (5) Medium (5) 2020 Quite high (7) Quite high (7) Quite high (7) 2030 High (8) High (8) High (8)
22. Production size in the country
2010 Low(3) Very low (2) Low (3) 2020 Medium (5) Quite low (4) Medium (5) 2030 High (8) Quite high (7) Very high (9)
6. Conclusions
In the chapter are presented the results of interdisciplinary experimental-comparative
research aimed at specifying the values of technologies for applying coatings in the processes
of physical vapour deposition on the soft brass substrate against the micro- and macroenvi-
ronment. Especially the potential and attractiveness were determined of the analysed
technology groups, taking into account the differences resulting from the amount of applied
layers. Moreover, the recommended strategies of conduct and forecast strategic development
tracks were determined, taking into account the influence of coatings applied in the processes
of physical vapour deposition on the mechanical and tribological properties, as well as the
resistance to corrosion of elements covered with them.
The presented results of materials science research indicate a promising improvement of the
tested material's resistance to corrosion. The manufacturing of items used, in particular, in the
housing sector and automotive industry, using only the PVD techniques for depositing
multilayer coatings and monolayer coatings with a thin intermediate layer is a cleaner and more
environmental-friendly technology. The configuration of the deposited coatings applied

Open Access Library Volume 6 2011
268 A.D. Dobrzańska-Danikiewicz, K. Lukaszkowicz
ensures also very good adhesion to the substrate, the desired, very high corrosion resistance,
the required resistance to abrasive wear and small roughness combined with a high gloss
expected for aesthetic reasons. The solution proposed allows to eliminate completely the highly
harmful electroplating processes, beneficial for the improved staff working conditions and
eliminating completely a hazard for the staff's health and life. Moreover, any problems related
to the management of electroplating wastes are eliminated thus reducing considerably the
manufacturing costs.
The corrosion current density – corrosion rate has been determined by analysing anodic
polarisation curves. The curve confirms the better corrosion resistance of samples with
coatings deposited with the PVD technique as compared to the sample not coated with copper
and zinc alloy (12.4 µA/cm2). The value of the corrosion current density for Ti/ZrN×150,
Ti/ZrN×15 coating and Ti/CrN×150 coating deposited in the PVD process is within
0.2-0.6 µA/cm2, which implies the good anticorrosive properties of PVD coatings, especially
multilayer coatings. The results of the testes show that growth in the number of layers
in a coating decreases the current density values reducing the corrosion rate. The results
of impedance measurements show that the resistance of load transmission is higher for samples
with coatings deposited, signifying that they fulfil their role as a diffusion barrier. It is important to compare the properties of coatings in operating conditions. The greatest
resistance to the erodent's activity is exhibited by monolayer coatings, especially Ti/CrN×1.
The erosive resistance of monolayer coatings is approx. 4 times higher than of multilayer
coatings. This most likely stems from the fact that the alternate soft layers of pure titanium
are present. The number of layers in a coating is decisive for the density of the places where
the erosion damage is initiated.
The hard PVD coatings deposited by reactive magnetron sputtering method demonstrate
structure composed of fine crystallites. Examinations of the PVD coating textures reveal that
in most cases they have the binary textures 111 and 100 or 110 and 311. The optimum
mechanical properties and abrasion wear resistance were obtained for monolayers, whereas
increase of the number of layers to 15 or 150 results in reducing their life four times. It was
found out that coatings deposited by PVD method on the brass substrate improve significantly
its corrosion resistance. By employing PVD techniques for depositing coatings, the mechanical
and useful properties of the parts coated with them can be improved. Depending on the
expected functional properties, multilayer coatings can be used largely enhancing corrosion

Materials surface engineering development trends
Technology validation of coatings deposition onto the brass substrate 269
resistance or hard monolayer coatings resistant to abrasive wear and erosion. The work shows
that a "universal" coating cannot be accomplished and the analysis of operating conditions
for coatings have the main effect on its selection and use.
The final action closing the experimental-comparative works was to create a series of tech-
nology roadmaps of the analysed technology groups. The creation and use of this tool allows
for presenting, in a uniform and clear format, various types of factors which directly and
indirectly characterize given groups of technologies together with the forecast and perspectives
of their development in different time intervals of the adopted time horizon. Technology
roadmaps function as a tool of comparative analysis, facilitating the selection of the best
technology in terms of the specified selected criterion, and when supplemented by operation
sheets with precise technological details – they enable the implementation of a selected
technology in industrial practice.
Analysing given research results man should say that the manufacturing of items used,
in particular, in the housing sector and automotive industry, using only the PVD techniques for
depositing multilayer coatings and monolayer coatings with a thin intermediate layer is a cleaner
and more environmental-friendly technology. The configuration of the deposited coatings
applied ensures also very good adhesion to the substrate, the desired, very high corrosion
resistance, the required resistance to abrasive wear and small roughness combined with a high
gloss expected for aesthetic reasons. The solution proposed allows to eliminate completely the
highly harmful electroplating processes, beneficial for the improved staff working conditions
and eliminating completely a hazard for the staff's health and life. Moreover, any problems
related to the management of electroplating wastes are eliminated thus reducing considerably
the manufacturing costs.
The technology of physical deposition from the gas phase presented in this work does not
constitute the pool of "popular" methods, but the technologies most prospective for the world
economy taking into account global trends, development tendencies as well as limitations
related to the substrate material, the expected properties of the coatings produced or costs.
The positive aspects connected with the attractiveness of the technology and a large potential
and a future strategy for Poland should be regarded as the opportunity to achieve synergies
in combination with other technologies (rapid development of hybrid technologies should
be seen in the coming years), the power of positive effect for the natural environment, strategic
importance of the technology for domestic and international economy, share in GDP generation,

Open Access Library Volume 6 2011
270 A.D. Dobrzańska-Danikiewicz, K. Lukaszkowicz
creation of jobs, deployment of the technology in the small and medium-sized enterprises sector
and its impact on enterprise competition and development opportunities in the research area.
The forecast directions of the future development of PVD technologies anticipate the use
of process temperatures close to 600ºC aimed at increasing the adhesion of the coating to the
substrate material by obtaining a partially diffuse connection. It is anticipated that the future
lies in intelligent and hybrid nanostructural coatings (including nanocomposites). Big hopes are
also put on the use of modulated multilayer coatings with a large number of single layers.
Special attention should be paid to coatings constructed from a small number of single layers
whose concept is based on the disturbance of the column growth of crystals during their
deposition in the PVD process; coatings with a large number of non-isostructural layers, as well as coatings with a large number of isostructural layers, so-called superstructures.
Summing up, it should be underlined that the foresight- materials science research described
in this chapter are a fragment of broader individual actions [102-107] aimed at selecting,
researching, characterizing and determining strategic development perspectives of priority
innovative material surface engineering technologies in the process of technological e-foresight.
References
1. Organization for Economic Co-operation and Development OECD, The Knowledge-Based
Economy, Paris, 1999.
2. A.D. Dobrzańska-Danikiewicz, E-foresight of materials surface engineering, Archives of Materials Science and Engineering 44/1 (2010) 43-50.
3. J. Kisielnicki, MIS. Management Information Systems, Placet, Warsaw, 2008 (in Polish).
4. M. Hasan, E. Harris, Entrepreneurship and innovation in e-commerce, Journal of Achievements
in Materials and Manufacturing Engineering 32/1 (2009) 92-97.
5. A.D. Dobrzańska-Danikiewicz, Foresight methods for technology validation, roadmapping and
development in the surface engineering area, Archives of Materials Science Engineering 44/2
(2010) 69-86. 6. A.D. Dobrzańska-Danikiewicz, The methodological fundaments of development state analysis of
surface engineering technologies, Journal of Achievements in Materials and Manufacturing
Engineering 40/2 (2010) 203-210.
7. A.D. Dobrzańska-Danikiewicz, Main assumption of the foresight of surface properties formation
leading technologies of engineering materials and biomaterials, Journal of Achievements in Materials
and Manufacturing Engineering 34/2 (2009) 165-171.

Materials surface engineering development trends
Technology validation of coatings deposition onto the brass substrate 271
8. A.D. Dobrzańska-Danikiewicz, Computer Integrated Foresight Research Methodology in Surface
Engineering Area, work in progress.
9. L.A. Dobrzański, Fundamentals of Materials Science and Metallurgy. Engineering Materials with
fundamentals of Materials Design, WNT, Warsaw, 2006 (in Polish).
10. K. Lukaszkowicz, L.A. Dobrzański, A. Zarychta, Erosion resistance and tribological properties
of coatings deposited by reactive magnetron sputtering method onto the brass substrate, Journal
of Materials Processing Technology 157-158 (2004) 380-387.
11. L.A. Dobrzański, A.D. Dobrzańska-Danikiewicz (eds.), Report from the realisation of 2nd task
„Analysis of the existing situation in terms of the development of technologies and social-economic
conditions” with regard to the FORSURF project entitled Foresight of surface properties formation
leading technologies of engineering materials and biomaterials, International OCSCO World Press,
Gliwice, 2010 (in Polish).
12. L.A. Dobrzański, Shaping the structure and properties of engineering and biomedical material
surfaces, International OCSCO World Press, Gliwice, 2009 (in Polish).
13. H. Dybiec, Submicrostructural aluminium alloys, AGH University Science-Didactic Publications,
Cracow, 2008 (in Polish).
14. Z. Rdzawski, Alloyed Cooper, Silesian University of Technology Publishing, Gliwice, 2009 (in Polish).
15. I.P. Jain, G. Agarwal, Ion beam induced surface and interface engineering, Surface Science Report
66 (2011) 77-172.
16. H. Garbacz, P. Wieciński, M. Ossowski, M.G. Ortore, T. Wierzchoń, K.J. Kurzydłowski, Surface
engineering techniques used for improving the mechanical and tribological properties of the
Ti6A14V alloy, Surface and Coatings Technology 202 (2008) 2453-2457.
17. W. Kwaśny, Predicting properties of PVD and CVD coatings based on fractal quantities describing
their surface, Journal of Achievements in Materials and Manufacturing Engineering 37/2 (2009)
125-192.
18. P. Podsiadlo, G.W. Stachowiak, Fast classification of engineering surface without surface parameters,
Tribology International 39 (2006) 1624-1633.
19. C. Donnet, A. Erdemir, Solid lubricant coating: recent development and future trends, Tribology
Letters 17 (2004) 389-397.
20. X. Mou, K. Peng, J. Zeng, L. Shaw, K.W. Qian, The influence of the equivalent strain on the
microstructure and hardness of H62 brass subjected to multi-cycle constrained groove pressing,
Journal of Materials Processing Technology 211 (2011) 590-596.
21. L. Yohai, M. Vazquez, M.B. Valcarce, Brass corrosion in tap water distribution system inhibited
by posphate ions, Corrosion Science 53 (2011) 1130-1136.
22. S. Li, H. Imai, H. Atsumi, K. Kondoh, Contribution of Ti addition to characteristic of extruded
Cu40Zn brass alloy prepared by powder metallurgy, Materials and Design 32 (2011) 192-197.
Open Access Library Volume 6 2011
272 A.D. Dobrzańska-Danikiewicz, K. Lukaszkowicz
23. R. Garg, S. Ranganathan, S. Satyam, Effect of mode of rolling on development of texture and micro-
structure in two-phase (α+β) brass, Materials Science and Engineering A 527 (2010) 4582-4592.
24. E.V. Kuzmina, L.M. Zheleznyak, V.L. Bushuev, S.V. Fomin, Setting up the production of shape
made of leaded brasses for parts of standard locks, Metallurgist 54 (2010) 248-251.
25. C. Mapelli, A. Gruttaduaria, M. Bellogini, Analysis of the factors involved in failure of a brass
sleeve mounted on an electro-valve, Engineering Failure Analysis 17 (2010) 431-439.
26. M. Uchidate, H. Liu, A. Iwabuchi, K. Yamamoto, Effect of water environment on tribological
properties of DLC rubbed against brass, Wear 267 (2009) 1589-1594.
27. N.A. Sakharova, J.V. Fernandes, M.F. Vieira, Strain path and work-hardening bahavior of brass,
Materials Science and Engineering 507 (2009) 15-22.
28. S. Jonas, S. Kluska, E. Drągalska, E. Walasek, A. Czyżewska, G. Krupa, Infiltration of porous
materials using the CVI method, Materials Engineering 6 (2008)760-763.
29. M. Blicharski, Surface engineering, WNT, Warsaw, 2009 (in Polish).
30. Group work, Electroplater's manual, WNT, Warsaw, 2002 (in Polish).
31. J. Wang, K. de Groot, C. van Blitterswijk, J. de Boer, Electrolytic deposition of lithium into calcium
phosphate coatings, Dental Materials 52 (2009) 353-359.
32. M.-J. Jiao, X.-X. Wang, Electrolytic deposition of magnesium-substituted hydroxyapatite crystals
on titanium substrate, Materials Letter 63 (2009) 2286-2289.
33. T. Paulmier, J.M. Bell, P.M. Fredericks, Plasma electrolytic deposition of titanium dioxide nanorods
and nano-particles, Journal of Materials Processing Technology 208 (20008) 117-123.
34. C. Mansilla, Structure, microstructure and optical properties of cerium oxide thin films prepared
by electron beam evaporation assisted with ion beams, Solid State Sciences 11 (2009) 1456-1464.
35. T.L. Wang, B.X. Liu, Glass forming ability of the Fe-Zr-Cu system studied by thermodynamic
calculation and ion beam mixing, Journal of Alloys and Compounds 481 (2009) 156-160.
36. Y. Batra, D. Kabiraj, S. Kumar, D. Kanjilal, Ion beam induced modification in GeOx thin films:
A phase separation study, Surface and Coatings Technology 203 (2009) 2415-2417.
37. H. Dong, T. Bell, State-of-the-art overview: ion beam surface modification of polymers towards
improving tribological properties, Surface and Coatings Technology 111 (1999) 29-40.
38. D. Bieliński, P. Lipiński, L. Ślusarski, J. Grams, T. Paryjczak, J. Jagielski, A. Turos, N. Madi,
Surface layer modification of ion bombarded HDPE, Surface Science 564 (2004) 179-186.
39. D.M. Bieliński, P. Lipiński, J. Jagielski, W. Okrój, L. Klimek, Selected examples of modifying the
polymer substrate by means of ion bombardment, Materials Engineering 6 (2006) 1337-1342 (in Polish).
40. E. Knystautas (ed.), Engineering Thin Films and Nanostructures with Ion Beams, Taylors & Francis,
BocaRaton – London – New York – Singapore, 2005.
41. S.D. Zilio, G.D. Giustina, G. Brustain, M. Tormen, Microlens arrays on large area UV transparent
hybrid sol-gel materials for optical tools, Microelectronic Engineering 87 (2010) 1143-1146.

Materials surface engineering development trends
Technology validation of coatings deposition onto the brass substrate 273
42. J.F. Pollock, K.E. Healy, Mechanical and swelling characterization of poly (N-isopropyl acrylamide-
co-methoxy poly(ethylen glycol) methacrylate) sol-gels, Acta Biomaterialia 6 (2010) 1307-1318.
43. J.J. Livage, Sol-gel process, Current Opinion in Solid State and Materials Science 2 (1997) 132-138.
44. M. Krissanasaeranee, P. Supaphol, S. Wongkasemjit, Preparation of poly(vinyl alcohol)/tin
glycolate composite fibers by combined sol-gel/electrospinning techniques and their conversion
to ultrafine tin oxide fibers, Materials Chemistry and Physics 119 (2010) 175-181.
45. I. Piwoński, K. Soliwoda, The effect of ceramic nanoparticles on tribological properties of alumina
sol-gel thin coatings, Ceramics International 36 (2010) 47-54.
46. K. Yao, W. Zhu, Barium titane glass-ceramic thin films integrated high-dielectric media, Thin Solid
Films 408 (2002) 11-14.
47. B. Pietrzyk, Calcium-phosphate coating produced using a sol-gel method, Materials Engineering
6 (2008) 664-666.
48. J.D. Wrigth, J.M. Sommerdijk, Sol-Gel materials, Chemistry and Applications, Gordon and Breach
Science Publishers, 2001.
49. C. Mai, H. Militz, Modification of wood with silicon compounds. Inorganic silicon compounds and
sol-gel systems: a review, Wood Science Technology 37 (2004) 339-348.
50. J. Livage, D. Ganguli, Sol gel electrochromic coatings and devices: A review, Solar Energy
Materials and Solar Cells 68 (2001) 365-381.
51. D. Chen, Anti-reflection (AR) coatings made by sol-gel processes: A review, Solar Energy
Materials and Solar Cells 68 (2001) 313-336.
52. J. Jeleńkowski, T. Borowski, T. Babul, Changes in the indirect sphere during detonation spraying,
Materials Engineering 6 (2008) 595-598 (in Polish).
53. T. Babul, S. Starev, Detonation spraying of DLC coatings, Materials Engineering 6 (2008) 601-604
(in Polish).
54. W. Żurawski, T. Burakowski, Microstructure of nanostructural carbide coatings applied
supersonically, Materials Engineering 6 (2008) 608-610 (in Polish).
55. C. Senderowski, Z. Bojar, K. Szymański, B. Formanek, Research of the structure and properties of
multilayer coatings type NiAl/FeAl and NiCr/FeAl deposited using the HVOF method, Materials
Engineering 6 (2008) 611-614 (in Polish).
56. W. Żórawski, Properties of coatings sprayed thermally, Materials Engineering 6 (2008) 619-623
(in Polish).
57. S. Morel, Intensification of taking over heat through walls sprayed with coatings of a high
absorption and thermal conduction capability, Materials Engineering 6 (2008) 624-627 (in Polish).
58. A. Dudek, I. Przerada, Z. Bałaga, S. Morel, Crystallization of plasmically sprayed hydroxyapatite
coating, Materials Engineering 6 (2008) 628-631 (in Polish).

Open Access Library Volume 6 2011
274 A.D. Dobrzańska-Danikiewicz, K. Lukaszkowicz
59. A. Dudek, Characteristics of plasmically sprayed NiCrBSi coating, Materials Engineering 6 (2008)
632-636 (in Polish).
60. A. Pawłowski, W. Wołczyński, L. Górski, Morphology of thermally processed Al2O3-SiO2 structure
plasmically sprayed on a metallic substrate, Materials Engineering 6 (2008) 637-639 (in Polish).
61. F. Chen, M. Liu, Preparation of yttria-stabilized zirconia (YSZ) films on La0,85Sr0,15MnO3 (LMS)
and LMS-YSZ substrates using an electrophoretic deposition (EPD) process, Journal of the Ceramic
Society 21 (2001) 127-134.
62. M. Zarbov, D. Brandon, N. Cohen, L. Shemesh, Engineering performance in applied EPD: problems
and solutions, Journal of Materials Science 41 (2006) 8115-8112.
63. X. Su, A. Wu, P. Vilarinho, Titanium tellurite thick films prepared by electrophoretic deposition and
their dielectric properties, Scripta Materialia 61 (2009) 536-539.
64. H. Yan, T. Jo, H. Okjuzaki, Synthesis and electrophoretic deposition of highdielectric-constant
SrTiO3 nanoparticles, Colloids and Surfaces A: Physicochemical and Engineering Aspects 346
(2009) 99-105.
65. F. Bozza, R. Polini, E. Traversa, High performance anode-supported intermediate temperature solid
oxide fuel cells (IT-SOFCs) with La0,8Sr0,2Ga0,8Mg0,2O3-δ electrolyte films prepared by electrophoretic
deposition, Electrochemistry Communications 11 (2009) 1680-1683.
66. Y. Wang, L. Xu, N. Jiang, B. Xu, G. Gao, F. Li, Fabrication of plyoxometalate-based nano/micrometer
composite film by electrophoretic deposition method, Journal of Colloid and Interface Science 333
(2009) 771-775.
67. J. Li, I. Zhitomirsky, Electrophoretic deposition of manganese oxide nanofibers, Materials
Chemistry and Physics 112 (2008) 525-530.
68. L. Besra, M. Liu, A review on fundamentals and applications of electrophoretic deposition (EPD),
Progress in Materials Science 52 (2007) 1-61.
69. S. Krąc, Ł. Cieniek, Impact of the laser radiation wavelength on the structure and properties of thin
Bi2O3 layers created by means of the PLD technique, Materials Engineering 6 (2008) 564-571
(in Polish).
70. D. Chrisey, G. K. Hubler (eds.), Pulsed Laser Deposition of Thin Films, John Wiley and Son, 1994.
71. J.C. Miller, R.F. Haglund Jr. (eds.), Laser Ablation and Desorption, Vol. 30, Academic Press, San
Diego, 1998.
72. R. Major, P. Lacki, J.M. Lackner, B. Major, Modeling and structural verification of thin layers
based on titanium nitride obtained on a polymer substrate by means of a laser impulse, Materials
Engineering 5 (2006) 1118-1120 (in Polish).
73. R. Kosydar, M. Kot, S. Zimowski, R. Major, W. Mróz, B. Major, Structure and tribological
properties of layers based on boron nitride, set by means of a laser impulse on a polymer and
metallic substrate, Materials Engineering 5 (2006) 1085-1088 (in Polish).

Materials surface engineering development trends
Technology validation of coatings deposition onto the brass substrate 275
74. T. Burakowski, W. Napadłek, J. Marczak, Ablative Laser Cleaning in Areology – Up-to-date
Condition and Prospects, Materials Engineering 3-4 (2007) 618-621.
75. T. Burakowski, W. Napadłek, J. Marczak, Ablative Laser Cleaning of Constructional Materials and
Machine Elements, Materials Engineering 3-4 (2007) 622-626.
76. A. Bartnik, H. Fiedorowicz, R. Jarocki, J. Kostecki, R. Rakowski, M. Szczurek, Detection of surface
changes of materials caused by intense irradiation with laser-plasma EUV source utilizing scattered
or luminescent radiation excited with the EUV pulses, Applied Physics B 91 (2008) 21-24.
77. A. Bartnik, H. Fiedorowicz, R. Jarocki, J. Kostecki, R. Rakowski, M. Szczurek, EUV emission from
solids illuminated with a laser-plasma EUV source, Applied Physics B 93 (2008) 737-741.
78. A. Bartnik, H. Fiedorowicz, R. Jarocki, J. Kostecki, M. Szczurek, PMMA and FEP surface
modifications induced with EUV pulses in two selected wavelength ranges, Applied Physics A 98
(2010) 61-65.
79. A. Bartnik, H. Fiedorowicz, R. Jarocki, J. Kostecki, A. Szczurek, M. Szczurek, Ablation and surface
modifications of PMMA using a laser-plasma EUV source, Applied Physics B 96 (2009) 727-730.
80. D.-C. Perng, K.-C. Hsu, S.-W. Tsai, J.-B. Yeh, Thermal and electrical properties of PVD Ru(P)
films as Cu diffusion barrier, Microelectronic Engineering 87 (2010) 365-369.
81. G. Tian, X. Bi, Study on the Si penetration into Fe sheets using PVD method and its application
in the fabrication of Fe-6.5 wt.% Si alloys, Surface and Coatings Technology 204 (2010) 1295-1298.
82. J.L. Mo, M.H. Zhu, Sliding tribological behaviors of PVD CrN and AlCrN coatings against Si3N4
ceramic and pure titanium, Wear 267 (2009) 874-881.
83. Y.H. Cheng, T. Browne, B. Heckermann, E.I. Meletis, Mechanical and tribological properties of
nanocomposite TiSiN coatings, Surface and Coatings Technology 204 (2010) 2123-2129.
84. C. Martini, L. Ceschnini, A comparative study of the tribological behaviour of PVD coatings on the
Ti-6Al-4V alloy, Tribology International 44 (2011) 297-308.
85. R.A. Antunes, A.C.D. Rodas, N.B. Lima, O.Z. Higa, I. Costa, Study of the corrosion resistance and
in vitro biocompatibility of PVD TiCN-coated AISI 316L austenitic stainless steel for orthopedic
applications, Surface and Coatings Technology 205 (2011) 2074-2081.
86. M.Y.P. Costa, M.O.H. Ciofii, H.J.C. Voorwald, V.A. Guimaraes, An investigation on slidding wear
behavior of PVD coatings, Tribology International 43 (2010) 2196-2202.
87. S. Veprek, M.G.J. Veprek-Heijman, The formation and role of interfaces in superhard nc-MenN/a-
Si3N4 nanocomposites, Surface and Coatings Technology 201 (2007) 6064-6070.
88. S. Veprek, A. Niederhofer, K. Moto, T. Bolom, H.D. Mannling, P. Nesladek, G. Dollinger,
A. Bergmaier, Composition, nanostructured and origin of the ultrahardness in nc-TiN/a-Si3N4/a- and
nc-TiSi2 nanocomposites with Hv=80 to > 105 GPa, Surface and Coatings Technology 133-134
(2000) 152-159.

Open Access Library Volume 6 2011
276 A.D. Dobrzańska-Danikiewicz, K. Lukaszkowicz
89. C.W. Zou, H.J. Wang, M. Li, Y.F. Yu, C.S. Liu, L.P. Guo, D.J. Fu, Characterization and properties
of TiN-containing amorphous Ti–Si–N nanocomposite coatings prepared by arc assisted middle
frequency magnetron sputtering, Vacuum 84 (2010) 817-822.
90. M. Audronis, A. Leyland, P.J. Kelly, A. Mathews, Composition and structure-property relationships
of chromium - diboride/molybdenum - disulphide PVD nanocomposite hard coatings deposited
by pulsed magnetron sputtering, Applied Physics A 91 (2008) 77-86.
91. K. Lukaszkowicz, J. Sondor, A. Kriz, M. Pancielejko, Structure, mechanical properties and corrosion
resistance of nanocomposite coatings deposited by PVD technology onto the X6CrNiMoTi17-12-2
and X40CrMoV5-1 steel substrates, Journal of Materials Science 45 (2010) 1629-1637.
92. F. Vaz, L. Rebouta, P. Goudeau, J. Pacaud, H. Garem, J.P. Riviere, A. Cavaleiro, E. Alves,
Characterisation of Ti1−xSixNy nanocomposite films, Surface and Coatings Technology 133-134
(2000) 307-313.
93. A.A. Voevodin, J.S. Zabinski, Nanocomposite and nanostructured tribological materials for space
applications, Composites Science and Technology 65 (2005) 741-748.
94. S. Veprek, M.J.G. Veprek-Heijman, Industrial applications of superhard nanocomposite coatings,
Surface and Coatings Technology 202 (2008) 5063-5073.
95. Y.C. Cheng, T. Browne, B. Heckerman, E.I. Meletis, Mechanical and tribological properties of
nanocomposite TiSiN coatings, Surface and Coatings Technology 204 (2010) 2123-2129.
96. K. Polychronopoulou, M.A. Baker, C. Rebholz, J. Neidhardt, M.O. Sullivan, A.E. Reiter,
K. Kanakis, A. Leyland, A. Matthews, C. Mitterer, The nanostructure, wear and corrosion
performance of arc-evaporated CrBxNy nanocomposite coatings, Surface and Coatings Technology
204 (2009) 246-255.
97. L. Georghiou, J.C. Harper, M. Keenan, I. Miles, R. Popper (eds.), The Handbook of Technology
Foresight. Concepts and Practice, Edward Elgar Publishing Ltd., UK, 2008.
98. A. Strategor, Stratégie, struckture, décision, identié. Poitique générale d’enterprise, Interéditions,
Paris, 1991.
99. K. Lisiecka, Systems of Product Quality Management. Analysis and Assessment Methods,
University of Economics Publishing, Katowice, 2009 (in Polish).
100. E. Skrzypek, M. Hofman, Processes Management in an Enterprise. Identification, Measurement,
Improvement, Wolters Kluwer Publishing, Warsaw, 2010 (in Polish).
101. The Boston Consulting Group, The Product Portfolio, Perspectives 66 (1970).
102. FORSURF, Headed by: L.A. Dobrzański, www.forsurf.pl, project in realisation (in Polish).
103. A.D. Dobrzańska-Danikiewicz, Development state analysis of surface engineering technologies, in:
3rd Workshop on foresight of surface properties formation leading technologies of engineering
materials and biomaterials, L.A. Dobrzański, A.D. Dobrzańska-Danikiewicz (eds.), International
OCSCO World Press, Gliwice, 2010 (in Polish).

Materials surface engineering development trends
Technology validation of coatings deposition onto the brass substrate 277
104. A.D. Dobrzańska-Danikiewicz, Goals and methodology of the FORSURF project entitled Foresight
of surface properties formation leading technologies of engineering materials and biomaterials,
in: 2nd Workshop on foresight of surface properties formation leading technologies of engineering
materials and biomaterials, L.A. Dobrzański (ed.), International OCSCO World Press, Gliwice,
2009 (in Polish).
105. L.A. Dobrzański, A.D. Dobrzańska-Danikiewicz, M. Kraszewska, A. Jagiełło, IT methods in goals
and tasks of the FORSURF project entitled Foresight of surface properties formation leading
technologies of engineering materials and biomaterials, in: 2nd Workshop on foresight of surface
properties formation leading technologies of engineering materials and biomaterials,
L.A. Dobrzański (ed.), International OCSCO World Press, Gliwice, 2009 (in Polish).
106. A.D. Dobrzańska-Danikiewicz, Main assumptions of the foresight of surface engineering of
engineering materials and biomaterials, in: 1st Workshop on foresight of surface properties formation
leading technologies of engineering materials and biomaterials, L.A. Dobrzański (ed.), International
OCSCO World Press, Gliwice, 2009.
107. A.D. Dobrzańska-Danikiewicz, T. Tański, S. Malara, J. Domagała-Dubiel, Assessment of strategic
development perspectives of laser treatment of casting magnesium alloys, Archives of Materials
Science Engineering 45/1 (2010) 5-39.