technology report review of burning glass job-ad data
TRANSCRIPT

Technology Report
Review of Burning Glass Job-ad Data
Vicki Lancaster, Ph.D. Principal Scientist
Devika Mahoney-Nair, M.S. Research Scientist
Nathaniel J. Ratcliff, Ph.D. Research Assistant Professor
University of Virginia Biocomplexity Institute and Initiative
Social and Decision Analytics Division
November 22, 2019

1
Table of Contents
Introduction ................................................................................................................................................................ 1
Burning Glass Technology ......................................................................................................................................... 1
Virginia Open Data Open Jobs .................................................................................................................................. 7
Data Profiling ............................................................................................................................................................. 8
Benchmarking Burning Glass Technologies against OD/OJ ................................................................................... 13
Conclusions and Recommendations ....................................................................................................................... 18
Acronyms ................................................................................................................................................................. 20
References .............................................................................................................................................................. 20
APPENDIX A ........................................................................................................................................................... 24
Introduction
Posting and searching online job-ads is ubiquitous in the U.S. labor market for both employers and job seekers. Job seekers who search online job-ads are much more likely to find work and find work faster than those who do not (Faberman & Kudlyak, 2016). In addition, the job-ads posted by employers on corporate websites and online job boards provide a source of opportunity data that has opened up new avenues for research. This technical document evaluates the feasibility of using the real-time labor market information (LMI) collected by Burning Glass Technologies to supplement survey and administrative data collected by federal and state governments. In contrast to designed and administrative data which have varying lag times between collection and dissemination and are often aggregated over broad occupation groups, the real-time job ads collected by Burning Glass Technologies are made available within a day of a job-ad being posted and provide information at a granular level that links employer skill set requirements to detailed occupations in the O*NET-SOC taxonomy1. In this document, the data are evaluated for use in identifying the skill sets necessary for a job in the skilled technical workforce, future work will evaluate the Burning Glass Technologies resume data in defining pathways to skilled technical workforce jobs.
This document reviews the use of the Burning Glass Technologies job-ads in academic research highlighting issues with the data and if the researchers made any attempt to validate the Burning Glass Technologies job-ads data, the validation data sources they used, and their results. It provides the results of profiling and exploratory data analyses, for both the Virginia Burning Glass Technologies job-ads data and the Virginia Open Data/Open Jobs Data2 which is compared to the Burning Glass Technologies job-ads data. The document concludes with recommendations regarding fitness-for-use.
Burning Glass Technology
Background
Burning Glass Technologies3 is a Boston-headquartered labor market analytics firm founded in 1999, that uses artificial intelligence technologies to collect and host a massive repository of workforce and employment data. Burning Glass collects these data primarily for commercial purposes and secondarily for research purposes. The company markets both the data as a product as well as their consulting expertise on labor market questions to
1 The O*NET-SOC taxonomy. O*NET Resource Center. Available at https://www.onetcenter.org/taxonomy.html. (last accessed May 15, 2019) 2 Open Data/Open Jobs https://opendata-cs-vt.github.io/ccars-jobpostings/ (last accessed August 9, 2019) 3 Burning Glass Technologies https://www.burning-glass.com/about/faq/ (last accessed May 15, 2019)

2
customers across a variety of industries, education institutions, local and regional governments, recruiting and staffing agencies, and corporate firms.
Burning Glass Technologies data are collected using a web crawling technique that uses computer programs called spiders to browse approximately 50,000 online job boards, corporate websites, and other places where job ads are posted and extract more than 70 variables per advertisement to create the repository of jobs data (see Appendix B for the Burning Glass Technologies Job-ad Data Dictionary). De-duplication of the job ad is performed once at the website level, to avoid counting the same posting that recurs across multiple days, and once at the aggregate level, to eliminate the same posting advertised on multiple sites. Data has been extracted since 2007 with the exception of 2008 and 2009. Both the algorithms used to identify duplicates and scrape websites are proprietary as well as the website addresses that are scraped.
Review of Academic Literature
This review was done to alert us to issues other researchers had encountered in using the Burning Glass Technologies data for research and how they addressed them. In the end, ten articles met the final screen. The literature review located research articles that used the Burning Glass Technologies job-ads data. Academic data bases that were searched included EconLit, Social Sciences, Web of Knowledge/Web of Social Science and Humanities Library, and Education Research Complete; and the grey literature data bases. The grey literature has been defined by the Luxembourg Convention4 on Grey Literature as “Information produced on all levels of government, academics, business and industry in electronic and print formats not controlled by commercial publishing, i.e. where publishing is not the primary activity of the body.” The grey literature includes technical reports, government documents, working papers, conference proceedings, white papers, institutional repositories, blogs, and newspapers. The search engines, databases, repositories and directories of grey literature resources used for this report included Google Scholar, Registry of Open Access Repositories, and Directory of Open Access Journals. A list of academic references was also provided to us by Burning Glass Technologies. The inclusion criteria for the initial screen were articles that used 2010 to 2019 Burning Glass Technologies U.S. job-ads data and not Burning Glass Technologies dashboards like Labor InsightTM, 57 articles were found in the initial screen. Of the 57 articles, only those that described one or both of their processes and results for data profiling and validation were kept. The focus of the inclusion criteria was on technical issues regarding the fitness-for-use of the data that became apparent after researchers profiled and benchmarked the Burning Glass Technologies data to other data sources for job-ad data such as government surveys or other job-ad aggregators. This review does not discuss the topics and findings of the research using Burning Glass Technologies job-ad data.
We started by looking at what these research articles reported about data profiling. Data profiling is a process for determining both the quality of the data and its fitness-for-use in addressing the research question(s); it evaluates data quality measures like duplicate observations, missing values, values outside the range of the variable, etc. (see the section on Data Profiling for more detail). In the 57 articles that were reviewed, the majority cited the work of Carnevale et al. (2014) when it came to data profiling issues (Table 1). Carnevale et al. (2014) wrote a technical report on assessing the usefulness on online job-ad data. Using 2013 Burning Glass Technologies job-ad data they estimated between 60 to 70 percent of job openings are posted online5. The data profiling issues they reported were missing employer name and education requirement for ~50% of the job-ads; and a bias in the representativeness of the job-ads which favored white collar jobs. A more recent article (Azar et al. 2019a) that used Burning Glass Technologies job-ad data from 2010 until the last quarter of 2016, found that 35.9% of the employer names were missing. It is common for job-ads posted by staffing companies not to disclose the employer. Overall, for variables such as state, city, occupation title, major occupation group (two-digit occupation codes), and skills, Carnevale et al. (2014) found that coding accuracy was greater than 80%. Two other articles (Rothwell 2014; Hershbein & Hollenbeck
4 Library and Learning Commons on the Grey Literature https://bowvalleycollege.libguides.com/grey-literature (last assessed August 10, 2019) 5 Since then, Burning Glass Technologies estimates that share has grown to roughly 85% and states: “The jobs that aren’t online now are usually in small businesses (the classic example being the “help wanted” sign in the restaurant window) and union hiring halls. Lower-income, lower-skill jobs are also less likely to be posted online than higher-skill jobs.” https://www.burning-glass.com/about/faq/ (last accessed May 20, 2019)

3
2015) that reported on data profiling issues using the same variables were in agreement with Carnevale et al. (2014) regardless of the year(s) of job-ads data used in their research (Table 1).
Only one article profiled duplicate observations. An article looking into physician assistant (PA) shortages (Morgan et al. 2017) manually checked for duplicated job-ads and in 40 ads found 3 duplicates; they also found that 23% of the jobs listed as PA were not for a PA job. In this case the PA acronym had numerous interpretations such as the abbreviation for Pennsylvania and professional association. As noted in Burke et al. (2019), Burning Glass Technologies uses the same filtering and de-duplication algorithm across years and applies any improvements to the algorithm retroactively. In the case of Morgan et al. (2017), the dual interpretation of the PA acronym was corrected by Burning Glass Technologies and retroactively applied.
Since Burning Glass Technologies job-ad data only includes vacancies posted on-line, as opposed to federal surveys such as the Job Openings and Labor Turnover Survey (JOLTS) or state surveys which are administered to a representative sample of a target population of employers, understanding the potential biases are essential. There are many sources of potential bias:
1. Whether or not the Burning Glass Technologies job-ads data is representative of the population of all job vacancies in the U.S. at any time point is a function of their crawling policy and the fact that job-ads from certain occupations are less likely to be posted online, for example less-skilled jobs in the construction and service industries.
2. Whether or not the Burning Glass Technologies job-ads data is accurate is a function of the company's algorithm to code and canonicalize the scraped information in the ads and get rid of duplicates.
Table 1. Summary of the Data Profiling Issues Researchers Found with the Burning Glass Technologies Job-ads Data
Reference Data Description /
Years Findings
Azar, Huet-Vaughn, Marinescu, Taska, & Wachter (2019)
Job-ad data (2010-2016 Q4)
Missing Data: 39.5% of the job-ads did not report an employer
Carnevale, Jayasundera, & Repnikov
(2014)
Job-ad data (2013 Q2)
Accuracy: coding for occupation, education, and experience were ≤80% accurate; for fields like state, city, occupation title, major occupation group (two-digit occupation
codes), and skills accuracy is >80% Job Bias: white-collar office jobs (sales & office support, managerial & professional
office, and STEM occupations) make up three out of five online job ads Missing Data: almost half of the online ads do not report an education requirement Education Bias: 30-40% of online job-ads are for workers with some college or an
Associate’s degree; 40-60% are for workers with a high school diploma; 80-90% are for workers with at least a Bachelor’s degree
Rothwell (2014)
Job-ad data (Jan 2013-Mar 2013) Company websites in
metropolitan areas
Missing Data: only 53% of the job-ads provided education requirements (55%), experience requirements (52%), salary (7%)
Hershbein & Hollenbeck (2015) Job-ad data (2010–2013)
Missing Data: only 53% of the job-ads provided education; occupations that cluster at both the extreme high and low ends of the education spectrum are less likely to specify
necessary education in postings
Morgan P, Himmerick KA, Leach B, Dieter P, & Everett C (2017)
Job-ad data (2014)
Duplicates: Burning Glass Technologies only considers a posting to be a duplicate if it is repeated within 2 months; manual targeted search for duplicates among 40 postings
found 3 duplicates (7.5%); and 2 of these were for the same job that had remained posted for > 2 month
Accuracy: BG location field very accurate; physician assistant (PA) job field had significant errors that resulted in 23% of postings not being for a PA job, majority of
these postings were for jobs that had “PA” in the text of the advertisement, such as jobs found in Pennsylvania (abbreviated “PA”) or for legal jobs that often have the suffix of
“PA” (for a type of legal entity called a professional association); some values that Burning Glass Technologies had assigned for the duration of experience required were
found to be inaccurate, jobs that were coded with a small integer (1, 2, 3, and 5) had accuracy >80%, but jobs that had coded for fractions of years or higher integer values
were typically inaccurate
4
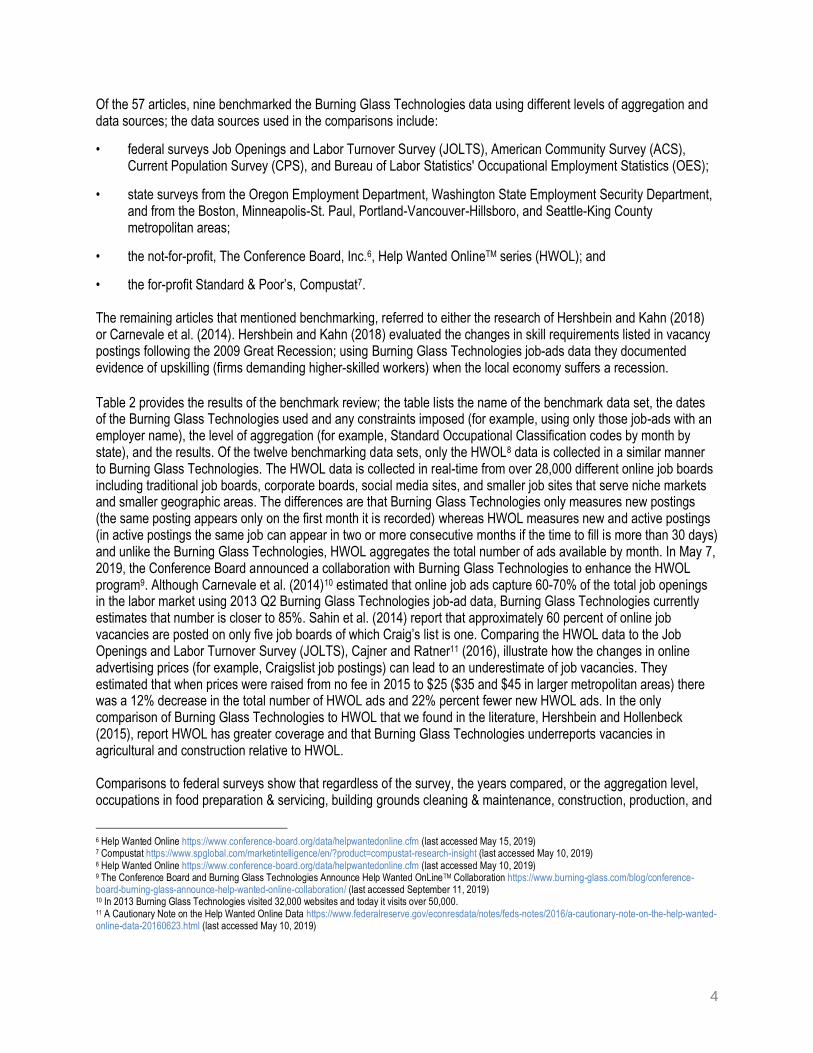
Of the 57 articles, nine benchmarked the Burning Glass Technologies data using different levels of aggregation and data sources; the data sources used in the comparisons include:
• federal surveys Job Openings and Labor Turnover Survey (JOLTS), American Community Survey (ACS), Current Population Survey (CPS), and Bureau of Labor Statistics' Occupational Employment Statistics (OES);
• state surveys from the Oregon Employment Department, Washington State Employment Security Department, and from the Boston, Minneapolis-St. Paul, Portland-Vancouver-Hillsboro, and Seattle-King County metropolitan areas;
• the not-for-profit, The Conference Board, Inc.6, Help Wanted OnlineTM series (HWOL); and
• the for-profit Standard & Poor’s, Compustat7. The remaining articles that mentioned benchmarking, referred to either the research of Hershbein and Kahn (2018) or Carnevale et al. (2014). Hershbein and Kahn (2018) evaluated the changes in skill requirements listed in vacancy postings following the 2009 Great Recession; using Burning Glass Technologies job-ads data they documented evidence of upskilling (firms demanding higher-skilled workers) when the local economy suffers a recession.
Table 2 provides the results of the benchmark review; the table lists the name of the benchmark data set, the dates of the Burning Glass Technologies used and any constraints imposed (for example, using only those job-ads with an employer name), the level of aggregation (for example, Standard Occupational Classification codes by month by state), and the results. Of the twelve benchmarking data sets, only the HWOL8 data is collected in a similar manner to Burning Glass Technologies. The HWOL data is collected in real-time from over 28,000 different online job boards including traditional job boards, corporate boards, social media sites, and smaller job sites that serve niche markets and smaller geographic areas. The differences are that Burning Glass Technologies only measures new postings (the same posting appears only on the first month it is recorded) whereas HWOL measures new and active postings (in active postings the same job can appear in two or more consecutive months if the time to fill is more than 30 days) and unlike the Burning Glass Technologies, HWOL aggregates the total number of ads available by month. In May 7, 2019, the Conference Board announced a collaboration with Burning Glass Technologies to enhance the HWOL program9. Although Carnevale et al. (2014)10 estimated that online job ads capture 60-70% of the total job openings in the labor market using 2013 Q2 Burning Glass Technologies job-ad data, Burning Glass Technologies currently estimates that number is closer to 85%. Sahin et al. (2014) report that approximately 60 percent of online job vacancies are posted on only five job boards of which Craig’s list is one. Comparing the HWOL data to the Job Openings and Labor Turnover Survey (JOLTS), Cajner and Ratner11 (2016), illustrate how the changes in online advertising prices (for example, Craigslist job postings) can lead to an underestimate of job vacancies. They estimated that when prices were raised from no fee in 2015 to $25 ($35 and $45 in larger metropolitan areas) there was a 12% decrease in the total number of HWOL ads and 22% percent fewer new HWOL ads. In the only comparison of Burning Glass Technologies to HWOL that we found in the literature, Hershbein and Hollenbeck (2015), report HWOL has greater coverage and that Burning Glass Technologies underreports vacancies in agricultural and construction relative to HWOL. Comparisons to federal surveys show that regardless of the survey, the years compared, or the aggregation level, occupations in food preparation & servicing, building grounds cleaning & maintenance, construction, production, and
6 Help Wanted Online https://www.conference-board.org/data/helpwantedonline.cfm (last accessed May 15, 2019) 7 Compustat https://www.spglobal.com/marketintelligence/en/?product=compustat-research-insight (last accessed May 10, 2019) 8 Help Wanted Online https://www.conference-board.org/data/helpwantedonline.cfm (last accessed May 10, 2019) 9 The Conference Board and Burning Glass Technologies Announce Help Wanted OnLineTM Collaboration https://www.burning-glass.com/blog/conference-board-burning-glass-announce-help-wanted-online-collaboration/ (last accessed September 11, 2019) 10 In 2013 Burning Glass Technologies visited 32,000 websites and today it visits over 50,000. 11 A Cautionary Note on the Help Wanted Online Data https://www.federalreserve.gov/econresdata/notes/feds-notes/2016/a-cautionary-note-on-the-help-wanted-online-data-20160623.html (last accessed May 10, 2019)
5
transportation & materials moving are all underrepresented in Burning Glass Technologies. Carnevale et al. (2014) aggregated the CPS and Burning Glass Technologies job-ads by education requirements and concluded the Burning Glass Technologies job-ads underrepresent those with some college or Associate’s degree and over represents college graduates. This agrees with Clemens et al. (2018) who in a comparison to OES reported that low wage occupations are underrepresented in Burning Glass Technologies data. Hershbein and Kahn (2018) documented the occupation distributions of Burning Glass Technologies compared to CPS and OES and showed Burning Glass Technologies overrepresented occupations in computer & mathematical, management, business & financial operations, and healthcare practice & technicians. In the case of occupations in computer & mathematics Burning Glass Technologies had over four times the number of CPS and OES; also overrepresented to a lesser extent are occupations in management, healthcare practitioners & technical, business & financial operations. Rothwell (2014) used state survey data from the metropolitan areas, Boston, Minneapolis-St. Paul, Portland-Vancouver-Hillsboro, and Seattle-King County, and came to the same conclusions regarding occupation over- and under- representation as Hershbein and Kahn (2018).
Table 2. Summary of the Data Benchmarking Process Researchers Found with the Burning Glass Technologies Job-ads Data
Comparison Data Set
Reference BGT Data Source
/ Years Aggregation Findings
Compustat
Liu & Wu (2018)
Job-ad data (2007, 2010-2016),
Posting with employer name
NAIC 2-digit industry code (17)
matched Burning Glass Technologies employer names and Compustat names; Burning Glass
Technologies sample represents 65% of Compustat; most underrepresented is Mining &
Logging (43.3%); most over-represented is Retail Trade (79.5)
Hershbein & Kahn (2018)
Job-ad data (2007, 2010-2015)
Firms that posted in the 2010-2015 that
can be matched to at least one job-ad in 2007
Publicly traded companies
matched 41% of Burning Glass Technologies job-ads to Compustat firms
Job Openings and Labor Turnover Survey
(JOLTS)
Hershbein & Kahn (2018)
Job-ad data (2007, 2010-2015)
Major industry groups (15)
health & social assistance, finance & insurance, and education are overrepresented in Burning Glass Technologies; accommodation & food services, public administration/government
and construction are underrepresented; most differences are small in magnitude (not quantified)
Carnevale, Jayasundera, & Repnikov
(2014)
Job-ad data (2013 Q2)
Industry (16)
education services, real estate & rental & leasing, and manufacturing are overrepresented in
Burning Glass Technologies; professional & business services, transportation, warehousing &
utilities are among the most consistently represented industries; job ads in the government
and construction industry are among the most underrepresented; total active online job ads captured each month 60-70% of the total job
openings in the labor market
Mohnen, Berkes, &
Taska (2018)
Job-ad data (2010-2016)
Industry (16) x Years (2010, 2013,
2016)/Quarterly
manufacturing, finance, education, and healthcare are overrepresented in Burning Glass
Technologies; construction, accommodation & food services, government are underrepresented
Hershbein & Hollenbeck
(2015)
Job-ad data (2010–2013)
Postings with listed educational requirements
Standard Occupational Classification (SOC)
2-digit codes (22)
overall trends in volume are similar, although levels vary
American Community Survey (ACS)
Mohnen, Berkes, &
Taska (2018)
Job-ad data (2010-2016)
Standard Occupational Classification (SOC) 2-digit codes (22) x Years (2010, 2013,
2016)/Quarterly
business & financial, computer & mathematical, and healthcare occupations are overrepresented
in Burning Glass Technologies; education, construction, and production
occupations are underrepresented

6
Table 2. Summary of the Data Benchmarking Process Researchers Found with the Burning Glass Technologies Job-ads Data
Comparison Data Set
Reference BGT Data Source
/ Years Aggregation Findings
Papageorgiou (2018)
Job-ad data (Feb 2016-Apr 2016)
Occupation
95.28% of employed workers in the ACS data are working in an occupation in which there is an
MSA job-ad in the Burning Glass Technologies data, suggesting that there are few occupational
opportunities beyond those captured in the Burning Glass Technologies data
Minnesota Job Vacancy Survey
Modestino, Shoag, & Balance (2016)
Job-ad data (2007, 2010, and 2012)
Skills
constructed similar measures of employer skill requirements using an actual survey of employers conducted by the Minnesota Department of Labor
found similar patterns to Burning Glass Technologies
Surveys from Boston, Minneapolis-St. Paul, Portland-Vancouver-
Hillsboro, and Seattle-King County metropolitan areas
Rothwell (2014)
Job-ad data (2010–2013)
Company websites in metropolitan areas
Standard Occupational Classification (SOC) 2-digit codes (22) x Years (2010-2013)
/Quarterly
Burning Glass Technologies overrepresented computer & mathematical occupations (8.9%) and
management & business (1%); BG underrepresented food preparation & serving
occupations (10.1%), sales, and building & grounds cleaning & maintenance both
at (3%)
Oregon Employment Department Survey
Rothwell (2014)
Job-ad data (2013)
Company websites in metropolitan areas
Standard Occupational Classification (SOC)
2-digit codes (22)
correlation between the share of jobs taking 30 or more days to fill and Burning Glass Technologies
median duration was 0.47
Washington State Employment Security Department Survey
Rothwell (2014)
Job-ad data (2013)
Company websites in metropolitan areas
Standard Occupational Classification (SOC)
2-digit codes (22)
similar ranking between vacancy duration; from Seattle survey the 5 hardest to fill occupations were computer & mathematical, architecture &
engineering, health care practitioners & technical, transportation & material moving, and personal
care & service; from Burning Glass Technologies the 6 hardest to fill were education, training, &
library, computer & mathematical, architecture & engineering, management, personal care &
service, and health care
Help-Wanted Online Index (HWOL)
Hershbein & Hollenbeck
(2015)
Job-ad data (2010–2013)
Postings with listed educational requirements
Standard Occupational Classification (SOC) 2-digit codes (22) x
month
HWOL provides more thorough coverage of occupations than Burning Glass Technologies;
Burning Glass Technologies undercounts jobs in agriculture and construction relative to HWOL
Bureau of Labor Statistics' Occupational Employment
Statistics (OES)
Clemens, Kahn, & Meer
(2018)
Job-ad data (2011–2016)
Postings with employer name and low wage jobs
Standard Occupational Classification (SOC)
4-digit codes x month x state
Compared Burning Glass Technologies and OES occupation shares over 6 years, low wages
occupations are underrepresented in Burning Glass Technologies; few changes in the difference between the two occupation
distributions overtime
Hershbein & Kahn (2018)
Job-ad data (2007, 2010-2015)
Major occupation groups (22) using 2-digit Standard
Occupational Classification codes
BG has a 4x the number of computer & mathematical occupations; management,
healthcare practitioners & technical, business & financial operations, are overrepresented to
lesser degrees; underrepresented in transportation & material moving, food
preparation & serving related, production, and construction & extraction
Current Population Survey (CPS)
Hershbein & Kahn (2018)
Job-ad data (2007, 2010-2015)
Major occupation groups (22) using 2-digit Standard
Occupational Classification codes
Burning Glass Technologies has a 4x the number of computer & mathematical jobs; management, healthcare practitioners & technical, business &
financial operations, are overrepresented to lesser degrees; underrepresented in
transportation & material moving, food preparation & serving related, production, and
construction & extraction; changes in representativeness remained small over time
(2007-2015) tendency to move in the direction of closer representativeness (not quantified)
Carnevale, Jayasundera, & Repnikov
(2014)
Job-ad data (2013 Q2)
Education (4)
BG job-ads underrepresent those with some college or Associate’s degree and over
represents college graduates

7
Virginia Open Data Open Jobs
Background
Our data discovery process located a pilot project initiated by the Commonwealth Center for Advanced Research and Statistics (CCARS) to create an open real-time data set of advertised job-ads in Virginia. This was an initiative by former Gov. Terry McAuliffe which established the (CCARS) to improve labor market, workforce, and education data. The intended use of these data was to create applications that could “help connect Virginians to job opportunities, offer insights into the needs of employers by occupation, skills, or education requirements, or create predictive models to help Virginia determine its future needs for talent!” The pilot project is no longer operating, the last posting of job-ads was in July 2017.
The comparison data set that was chosen for this study is Open Data Open Jobs (OD/OJ) collected by the Commonwealth Center for Advanced Research and Statistics because it was collected in a similar manner as the Burning Glass Technologies job-ad data but only for vacancies within Virginia. Another difference includes the fact that CCARS only scraped government websites. Although the OD/OJ data were collected over the time period June 2010 to June 2017, daily web scraping only occurred in the later months. Therefore, comparison between the Burning Glass Technologies and OD/OJ data is limited to job-ads in Virginia for the month of June 2017. Based on our literature review, this is the only validation of the Burning Glass Technologies job-ads data at the level of the job-ads, all other validations are based on aggregated data.
Unlike the Burning Glass Technologies job-ad technology which browses approximately 50,000 online “job boards, corporate websites, and other places where job ads are posted” the OD/OJ job-ad data were constructed from only three websites. The OD/OJ website acknowledged that the job-ads they collected did not cover all job openings in Virginia advertised online. The websites that were included in the OD/OJ job-ad data are:
1. A daily feed of jobs from the National Labor Exchange12 (NLx) made available by the DirectEmployers Association, Inc.13;
2. Job-ads in the Virginia Workforce Connection14 made available by the Virginia Employment Commission; and
3. A feed of schema tagged jobs available through an open API built by Devis for the Veterans Job Bank15.
All three are aggregators of job-ads. NLx is an electronic labor-exchange network, that collects job openings found on only three sources, over 25,000 corporate career websites, 50 state workforce agency job banks plus Puerto Rico, Guam, and the District of Columbia, and the federal job portal usajobs.gov. Unlike Burning Glass Technologies, NLx does not index third party sites or job boards. The indexed NLx employer community includes both DirectEmployers member companies and nonmembers who would like their jobs to appear in the NLx. The job feeds on NLx are refreshed daily, the previous day's file eliminated and replaced with a new one. No information was found on the how the Virginia Workforce Connection aggregates job-ads. The Veterans Job Bank is maintained by the National Resource Directory and federal government website that provides Veterans and transitioning Service Members with a central, online source to search for job opportunities and helps employers find qualified Veterans to fill vacancies. When last accessed on July 25th it appears the Veterans Job Bank is no longer functional.
12 National Labor Exchange https://usnlx.com/ (last accessed June 12, 2019) 13 “DirectEmployers is a nonprofit Member-owned and -managed association formed in 2001 by 14 leading Fortune 500 companies searching for a way to reduce recruiting costs, while regaining ownership of their recruitment brand.” https://directemployers.org/ (last accessed June 12, 2019) 14 Virginia Workforce Connection https://www.vawc.virginia.gov/vosnet/Default.aspx (last accessed June 11, 2019) 15 Veterans Job Bank https://nrd.gov/nrdLandingPage?term=veterans%20job%20bank (last accessed July 25, 2019)

8
The OD/OJ combined the job-ads from the three sites into a single data set by:
• mapping job-ads from all three sources to the job-posting schema standard;
• enriching job-ads with average wage data from the Georgetown University’s Center for Education and the Workforce;
• canonicalizing job titles with assistance from Glassdoor; and
• de-duplicating the data using an algorithm to identify identical job postings.
Data Profiling
Introduction
The SDAD data profiling starts with a determination of both the quality of the data and its fitness-for-use to the project at hand. An important feature of the data profiling process is that discovered issues are only described and not actually “fixed”. The appropriate fix will depend upon the specific needs of the research. If the prescribed "fix" is not appropriate, or even possible there would be no need for any action and attempting a fix at this stage could result in wasted time and effort. The data profiling metrics are described below.
• Completeness - completeness is a variable metric, the metric is a percentage, the number of observations that have values compared to the number of observations that “should” have values (NA (not available) are not counted as a value).
• Value validity - value validity is a variable metric, data elements with proper values have value validity; the metric is the percentage of data elements whose attributes possess values within the range expected for a legitimate entry (NAs are considered a valid value).
• Consistency - consistency is a variable metric, it is the degree of logical agreement between variable values. The rules that specify the logical relationships between the entity values are called dependency constraints. A simple example of a dependency constraint violation would be a location disagreement, a zip-code that does not agree with a state code.
• Uniqueness - uniqueness is a variable metric, it is the number of unique valid values that have been entered for a variable (NAs are not counted as unique values).
• Duplication - duplication is a data set metric, it is the degree of replication of distinct observations per observation unit type; the metric is the percentage of observations in a data set that are duplicated.
Burning Glass Technologies Job-Ad Data Description
The Social and Decision Analytics Division purchased the Burning Glass Technologies job-ad data for the years 2007, 2010-2017 after an extensive data discovery and evaluation process. Burning Glass Technologies is the only vendor who sells databases of individual job postings and resumes for research purposes. While other vendors maintain their own resume databases, products sold are typically dashboards intended for use by job recruiters or the data is aggregated prior to delivery. Burning Glass Technologies places significant effort into the maintenance of individual records in these databases, including de-duplication of job postings and resumes, de-identification of individual resumes, and extraction of key terms. In addition, variables are linked to standard codes in the industry (e.g., occupation codes, industry codes) and they have developed their own hierarchy of skill taxonomy variables.
Burning Glass Technologies job-ad data contains six separate data sets that can be linked by a unique job-ad identifier:
1. Main - the base table, contains 54 columns of job descriptors such as the Burning Glass Technologies Job ID, date the posting was spidered, industry classifications, educational requirements, etc.;

9
2. Certifications - a related table of certifications associated with the job (there is a row for each certificate, the 4 columns contain the Burning Glass Technologies Job ID, date the posting was spidered, minimum annual salary, and certification);
3. CIP - a related table of Classification of Instructional Program (CIP) codes for the field of study (there is a row for each CIP code, the 4 columns contain the Burning Glass Technologies Job ID, date the posting was spidered, minimum annual salary, and CIP code);
4. Degree - a related table indicating level of study (there is a row for each degree, the 4 columns contain the Burning Glass Technologies Job ID, date the posting was spidered, minimum annual salary, and degree);
5. Major - a related table indicating field of study using plain-text description (there is a row for each major, the 4 columns contain the Burning Glass Technologies Job ID, date the posting was spidered, salary, and standardized major);
6. Skill - a related table of skills associated with the job (there is a row for each skill, 9 columns contain the BGT Job ID, date the posting was spidered, minimum annual salary, skill, skill cluster, skill cluster family, is skill specialize?, is baseline skill?, is software skill?).
The full list of variables and descriptions are provided in the BGT Data Dictionary which is provided upon purchase on the data.
Burning Glass Technologies Job-ad Data Profiling Results
This section describes of the results of the Burning Glass Technologies data profiling, The following sixteen variables are profiled; the variables from the main file were selected since they align with a comparison data set described in the next section; and the variables from the skill files were chosen since the Burning Glass Technologies skills variables will be important to our future research in identifying pathways to the skilled technical workforce.
Thirteen of the variables used in the profiling are from the main file:
• bgtjobid - job identifier
• jobdate - the date the job was posted
• occfam - the major occupation family code of the job posting
• occfamname - the industry corresponding with the major occupation code
• employer - the name of the hiring company
• city - the city where the job is located
• state - the state where the job is located
• county - the county where the job is located
• fipsstate - the fipsstate code where the job is located
• fipscounty - the fipscounty code where the job is located
• fips - the whole fips code where the job is located
• lat - the latitude where the job is located
• lon - the longitude where the job is located
Three variables used in the profiling are from the skills file:
• skill - skills is a canonicalized version of a skill listed in the posting to enable improved search and categorization
• skillcluster - groupings of skills that have similar functionality, can be trained together, and/or frequently appear together in job postings
• skillclusterfamily - the most general layer of the Burning Glass Technologies skill taxonomy; each skill and skill cluster belong to exactly one family
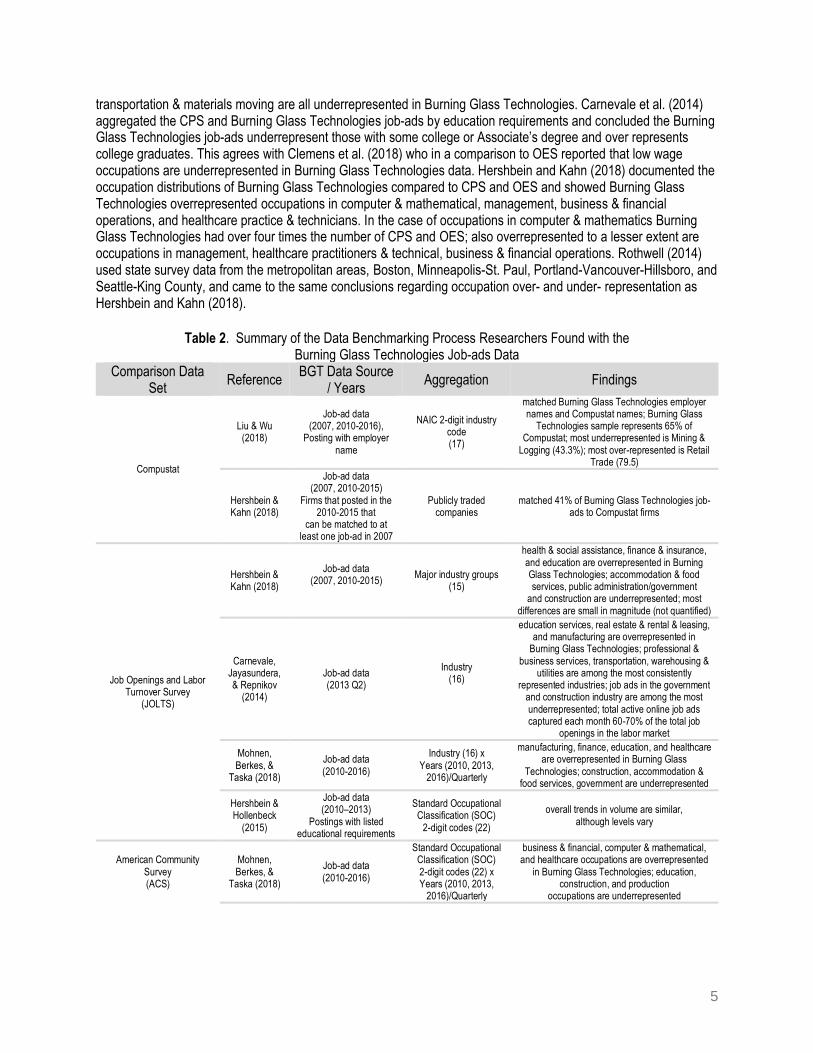
The results of the Burning Glass Technologies data profiling are displayed in Table 3.

10
The two variables with the largest number of missing values are skillcluster and skillclusterfamily; these variables are part of the Burning Glass Technologies skill taxonomy. Skill clusters are groupings of skills that have similar functionality for example, Microsoft Office and Microsoft PowerPoint are skills that are in the Microsoft Office and Productivity Tools skill cluster. Skill cluster families are the most general layer of the Burning Glass Technologies skill taxonomy; for example, the skill cluster Microsoft Office and Productivity Tools is in the Information Technology skill cluster family, along with other skill clusters such as Technical Support, Basic Computer Knowledge, and Enterprise Resource Planning (ERP). Each skill and skill cluster belong to exactly one family. There are 10,631 unique skills in the 2017 Virginia job-ad data, of those, 6,464 (60.8%) have been assigned to a skill cluster and skill cluster family. Every skill, regardless of whether or not it has a complete Burning Glass Technologies skill hierarchy designation, is categorized into one of the two Burning Glass Technologies categories, baseline skill or specialized skill. Burning Glass Technologies uses baseline or foundational skills and specialized or technical skills in lieu of the commonly used paradigm of hard and soft skills16. Baseline skills are those that are in high demand by almost all employers; skills demanded across multiple occupations that are not typically taught in training classes are baseline skills. Baselines skills are not just people skills such communication and troubleshooting, but also knowledge of specific software packages like Microsoft Word and Excel and foreign languages (25 different languages listed). According to Burning Glass Technologies even in the most technical career areas (such as IT, Healthcare, and Engineering) at least a quarter of the skills demanded by employers are baseline skills. Baseline skills include many soft skills, but also skills like Microsoft Word and Excel since even thought people can be formally taught to use these software packages, most learn to use them on their own. Burning Glass Technologies defines technical skills as those that can both be taught and are specific to a particular occupation or industry. For example, software programs ranging from Adobe Photoshop to RStudio may be either self-taught or learned in a formal setting, but the demand for these skills is limited to specific occupations and industries. The top ten baseline and technical skills as a percentage of the 2017 VA job-ads are displayed in Table 4. The variable with the second largest number of missing values is employer, 21.3%. This is attributed to staffing companies that do not or are not allowed to disclose the name of the employer.
16 The Human Factor https://www.burning-glass.com/wp-content/uploads/Human_Factor_Baseline_Skills_FINAL.pdf (last accessed August 10, 2019)
11
Table 3. Data Profiling for Select Variables from the Burning Glass Technologies Main and Skill Data Files Main Data File: N=63,610 July 2017 Virginia (only) Variable Completeness
N / % Value Validity
N / % Uniqueness*
N bgtjobid 63,610 / 100% 63,610 / 100% 63,610
jobdate 63,610 / 100% 63,610 / 100% 31
occfam 61,462 / 96.62% 63,610 / 100% 23
occfamname 61,462 / 96.62% 63,610 / 100% 23
employer 50,064 / 78.70% Not Checking** 6,308
city 63,158 / 99.29% 63,610 / 100% 798
state 63,610 / 100% 63,610 / 100% 1
county 63,158 / 99.29% 63,610 / 100% 132
fipsstate 63,610 / 100% 63,610 / 100% 1
fipscounty 63,158 / 99.29% 63,610 / 100% 131
fips 63,158 / 99.29% 63,610 / 100% 131
lat 63,180 / 99.32% 63,610 / 100% 951
lon 63,180 / 99.32% 63,610 / 100% 988
Skills Data File: N=639,364 July 2017 Virginia (only) skill 63,5078 / 99.33% 639,364 / 100% 7,548
skillcluster 46,3878 / 72.55% 639,364 / 100% 610
skillclusterfamily 46,3878 / 72.55% 639,364 / 100% 28 *Excludes NA **The employer value validity will be evaluated when it is being considered for use in analysis. It is not evaluated here since it is not one of the variables used in the comparison to the OD/OJ data.
Table 4. Top 10 Burning Glass Technologies (BGT) Baseline & Specialized as a Percentage of the Number* of VA Job-ads for 2017
BGT Baseline Skills Percent BGT Specialized Skills Percent Communication Skills 28.52 Customer Service 15.65
Planning 12.30 Teamwork / Collaboration 13.63
Writing 11.29 Scheduling 10.67
Problem Solving 11.07 Sales 9.68
Organizational Skill 10.97 Budgeting 7.38
Research 10.70 Project Management 7.28
Microsoft Office 10.69 Customer Contact 6.35
Microsoft Excel 10.55 Retail Industry Knowledge 5.56
Physical Abilities 9.52 Repair 5.22
Detail-Oriented 8.73 SQL 4.70 *Number of Job-ads = 699,754
Consistency was evaluated by checking to see that the city, county, fipscounty, and fips values were all located in the state of Virginia. Excluding missing values (blank or null values) all values for city, county, fipscounty, and fips are consistent with values for the state of Virginia. Duplication was evaluated in the Main data file only. Duplication was evaluated by counting the number of observations (rows) with the same value for all variables except the unique id,

12
bgtjobid. When duplicates were evaluated using the 13 variables listed in Table 3, there were 18,431 duplicates (71.02% unduplicated); when all 52 variables are included there were no duplicates.
OD/OJ Job-ad Data Description
The OD/OJ job-ads data is a single data set with nine variables:
• rawdata_id - unique job identifier
• jobLocation_geo_latitude - the latitude where the job is located
• jobLocation_geo_longitude - the longitude where the job is located
• normalizedTitle_onetCode - the major occupation family code of the job posting
• normalizedTitle_onetName - the industry corresponding with the major occupation code
• datePosted - the date the job was posted
• experienceRequirements - text string that can include education and skill requirements, years of experience
• jobDescription - text string that can include responsibilities and skill requirements
• hiringOrg - name of the hiring organization
OD/OJ Job-ad Data Profiling Results
This section describes of the results of the OD/OJ data profiling, the results are displayed in Table 5.
Consistency was evaluated by plotting the latitudes and longitudes to see if the job location was in Virginia. Only three jobs were located outside Virginia; these job-ads were removed. Duplication was evaluated by counting the number of observations (rows) with the same value for all variables except the unique identifier, rawdata_id. When duplicates were evaluated using the seven remaining variables listed in Table 4, there were 3,032 duplicates (93.67% unduplicated). Duplicate observations were retained to account for the possibility of multiple openings for the same position and same employer, supported by evidence discovered during the data exploration process.
• All the duplicates have an employer and a job description, often a very detailed one.
Table 5. Data Profiling for Open Data Open Job Variables N=47,908 July 2017 Virginia (only)
Variable Completeness
N / % Value Validity
N / % Uniqueness*
N
rawdata_id 47,908 / 100% 47,908 / 100% 47,908
jobLocation_geo_latitude 47,807 / 99.79% 47,908 / 100% 126
jobLocation_geo_longitude 47,807 / 99.79% 47,908 / 100% 126
normalizedTitle_onetCode 39,639 / 82.74% 47,908 / 100% 384
normalizedTitle_onetName 39,639 / 82.74% 47,908 / 100% 384
datePosted 47,908 / 100% 47,908 / 100% 28
experienceRequirements 5,313 / 11.09% 47,908 / 100% 2,933
jobDescription 47,905 / 99.99% 47,908 / 100% 41,522
hiringOrg 47,896 / 99.97% Not Checking** 1,400 *Excludes NA **The employer value validity will be evaluated when it is being considered for use in analysis. It is not evaluated here since it is not one of the variables used in the comparison to the Burning Glass Technologies data.

13
• Half of the duplicates have an O*NET code for truck drivers. A sixth of the duplicates are missing O*NET codes, but the job description either includes the title or provides a detailed description of the position. The next two most common titles are general operations managers and wholesale sales representatives.
Due to the closure of the Virginia Open Jobs program, it may prove difficult to definitively draw conclusions about the duplicates one way or another. However, the rich detail of employer and job description information and the pattern of lower-level operations and sales positions supports the inclusion of these positions as multiple ‘real’ positions and not duplicates of existing positions.
Benchmarking Burning Glass Technologies against OD/OJ
Region Comparisons
Job-ads from July 2017 were used for the Burning Glass Technologies and OD/OJ comparisons. Comparisons between the Burning Glass Technologies and OD/OJ job-ads were made by aggregating the data by the 23 major occupations groups and the nine economic regions of Virginia as designated by GO Virginia17. GO Virginia is a bipartisan, business-led economic development initiative that established nine regional boundaries based on their priority industry clusters. The thought is aggregating by different industry clusters might help identify any occupation biases in the Burning Glass Technologies web scraping process. The locations of the nine economic regions are displayed in Figure 1 and the number of Burning Glass Technologies and OD/OJ job-ads by region is displayed Table 5.
The number of job-ads that could be placed in a region is 63,180 (99.32%) for Burning Glass Technologies and 47,807 (99.79%) for OD/OJ. The total number of job-ads for the month of July 2017 is 24% higher for Burning Glass Technologies; this was expected since Burning Glass Technologies scraps approximately 50,000 websites and OD/OJ only three, but the three sites are aggregators of job-ads (Table 5). Despite the difference in the number of job-ads, the nine regions have similar trends (Pearson correlation coefficient = 0.996). The largest difference in job-ads between Burning Glass Technologies and OD/OJ are in Region 7 (Northern VA Regional Council) where Burning Glass Technologies had 28,690 ads and OD/OJ 20,745. Only one region had more OD/OJ job-ads than BGT, Region 2 (VA Tech Economic Development, BGT = 3,688, OD/OJ = 41,41). Due to the large difference in the number of job-ads, the counts were normalized by the total before making further comparisons. The number of job-ads by counties and cities within a region are displayed in Appendix A.
17 Virginia Initiative for Growth and Opportunity https://govirginia.org/ (last accessed June 12, 2019)
Figure 1. Go Virginia Economic Regions

14
Figure 2 compares the two methods for collecting job-ads over the nine regions. Figure 2A displays the percentage of jobs-ads by region plotting BGT against OD/OJ. The points cluster along the line of equality and indication the trends across the regions are nearly identical.
Figure 2B compares the two methods by plotting the percentage average against the percentage difference (%BGT –%OD/OJ). In this plot it is easier to assess the magnitude of disagreement by visualizing the variability as a function of the average. There is no clear association between the magnitude of the average and the magnitude of the
variability. The difference varies between 3% from the zero line of no difference. OD/OJ has a larger percentage of job-ads in Regions 1, 2, 3, and 5 which are all located in southern Virginia. The two regions with the greatest difference are 2 and 7.
Occupation Family Comparisons
The number of job-ads that could be classified into an occupation family is 61,462 (96.62%) for Burning Glass Technologies and 39,639 (82.74%) for OD/OJ. It is not clear how this might bias the comparison. Despite this, the percentage of job-ads in the 23 occupation families have similar trends (Pearson correlation coefficient = 0.756). The largest difference in occupation families are in Computer and Mathematical job-ads (BGT – OD/OJ = 7,616) where
Table 6. Burning Glass Technologies (BGT) and OD/OJ Comparison by GO Virginia Region
Region #. Region Name BGT N / %
OD/OJ N / %
1. UVA Wise 1,204 / 1.9 1,132 / 2.4
2. VA Tech Economic Development 3,688 / 6.0 4,141 / 8.7
3. Southside Planning District Commission 1,547 / 2.5 1,509 / 3.2
4. GROW Capital Jobs Foundation 9,071 / 14.7 6,914 / 14.5
5. Reinvent Hampton Roads 10,126 / 16.4 8,350 / 17.5
6. George Washington Regional Commission 2,168 / 3.5 1,193 / 2.5
7. Northern VA Regional Council 28,690 / 46.4 28,690 / 46.4
8. Northern Shenandoah Valley Regional Commission 2,565 / 4.1 1,964 / 4.1
9. Central VA Partnership for Economic Development 2,807 / 4.5 1,859 / 3.9
Total 63,180 47,807
Figure 2. Burning Glass Technologies and OD/OJ Job-ad Comparisons by Region

15
Burning Glass Technologies has 12,947 ads and OD/OJ 5,331; Healthcare Practitioners and Technical job-ads (BGT – OD/OJ = 4,503) where Burning Glass Technologies has 7781 ads and OD/OJ 3,278; and Sales and Related job-ads (BGT – OD/OJ = 4,095) where Burning Glass Technologies has 5,,811 ads and OD/OJ 1,716. Based on the literature review it is not unexpected that Burning Glass Technologies has an more Computer and Mathematical and Healthcare Practitioners and Technical job-ads (Hershbein & Kahn 2018; Mohnen et al. 2018; Rothwell 2014). The one occupation family where OD/OJ has more ads is the Management occupation family, (BGT – OD/OJ = –3,361), BGT has 6,450 ads and OD/OJ 9,811. This is unexpected since researchers have reported Burning Glass Technologies over represents jobs in the Management occupation family (Carnevale et al. 2014; Rothwell 2014; Hershbein & Kahn 2018).
Unlike using latitude and longitude to assign a job-ad to a region, there is a greater chance for error when assigning a job-ad to an occupation category. Errors can occur in normalizing the job title which can account for some of the differences between the two methods.
Table 7. BGT OD/OJ Comparison by Major Occupation Group
Occupation Family #. Occupation Family Name BGT N / %
OD/OJ N / %
11. Management 6,450 / 10.5 9,811 / 24.8
13. Business and Financial 5,041 / 8.2 5,737 / 14.5
15. Computer and Mathematical 12,947 / 21.2 5,331 / 13.4
17. Architecture and Engineering 1,852 / 3.0 2,006 / 5.1
19. Life, Physical, and Social Science 623 / 1.0 220 / 0.6
21. Community and Social Service 604 / 1.0 191 / 0.5
23. Legal 291 / 0.5 88 / 0.2
25. Education, Training, and Library 1,121 / 1.8 571 / 1.4
27. Arts, Design, Entertainment, Sports, and Media 1,380 / 2.2 880 / 2.2
29. Healthcare Practitioners and Technical 7,781 / 12.7 3,278 / 8.3
31. Healthcare Support Occupations 981 / 1.6 416 / 1.0
33. Protective Service 874 / 1.4 516 / 1.3
35. Food Preparation and Serving Related 1,527 / 2.5 593 / 1.5
37. Building & Grounds Cleaning and Maintenance 579 / 0.9 243 / 0.6
39. Personal Care and Service 491 / 0.8 130 / 0.6
41. Sales and Related 5,811 / 9.5 1,716 / 4.3
43. Office and Administrative Support 5,087 / 8.3 2,861 / 7.2
45. Farming, Fishing, and Forestry 34 / 0.1 0 / 0.0
47. Construction and Extraction 611 / 1.0 306 / 0.8
49. Installation, Maintenance, and Repair 1,581 / 2.6 1,112 / 2.8
51. Production 1,087 / 1.8 397 / 1.0
53. Transportation and Material Moving 4,602 / 7.5 3,236 / 8.2
55. Military Specific 107 / 0.2 0 / 0.0
Total 61,462 39,639

16
Figure 3 compares the two methods for collecting job-ads for the 23 occupations families. Figure 3A displays the percentage of jobs by occupation family plotting Burning Glass Technologies against OD/OJ. The points cluster along the line of equality for the smaller values and move away from the line for the larger values.
Figure 3B compares the two methods by plotting the percentage average against the percentage difference (%BGT – %OD/OJ). In this plot it is easier to assess the magnitude of disagreement by visualizing the variability as a function of the average. The differences vary from a low of –15% to +7%. The magnitude of the difference increases as the average increases and indication of an association. The largest difference is the over representation of
management job- ads in OD/OJ and to a lesser extent computer job-ads in Burning Glass Technologies.
A heat map was constructed to look for trends in the percentage difference (%BGT – %OD/OJ) in the 207region by occupation family combinations (Figure 4). The percentage of job-ads in the 207 combinations have similar trends (Pearson correlation coefficient = 0.828). 93.72% of the differences are within ±1, leaving thirteen combinations.
Figure 3. Burning Glass Technologies and OD/OJ Job-ad Comparisons by Occupation Family

17
Seven of the thirteen are in the Northern VA Regional Council the region with the largest number of employed, the other three regions are Reinvent Hampton Roads, GROW Capital Jobs Foundation, and VA Tech Economic Development which have the 2nd, 3rd, and 4th largest number of employed. Based on the literature review it was expected Burning Glass Technologies job-ads would over represent the Computer and Mathematical occupation family; this occurred in Northern VA Regional Council (7) and GROW Capital Jobs Foundation (4). All of the combinations where %OD/OJ > %BGT occur in the Management occupation family (4 occurrences), Business and Financial (2), and Architecture and Engineering (1) occupations. All of the combinations where %BGT > %OD/OJ occur in the Computer and Mathematical (2 occurrences), Healthcare Practitioners and Technical (1), Sales and Related (2), and Office and Administrative Support (1).
Management
Business & Financial
Computer & Mathematical
Architecture & Engineering
Life, Physical, & Social Science
Community & Social Science
Legal
Education, Training, & Library
Arts, Design, Entertainment, Sports, & Media
Healthcare Practitioners & Technical
Healthcare Support Occupations
Protective Service
Food Preparation & Service Related
Building & Grounds Cleaning & Maintenance
Personal Care & Service
Sales & Related
Office & Administrative
Farming, Fishing, & Forestry
Construction & Extraction
Installation, Maintenance, & Repair
Production
Transportation & Material Moving
Military Specific
1 2 3 4 5 6 7 8 9
Minimum
−6%
−4%
−2%
0%
2%
4%
6%
Maximum
(%BGT − %ODOJ) for Region x Occupation Family Combinations
Figure 4. Heat Map of the (%BGT – %OD/OJ) for the Region by Occupation Family Combinations

18
Conclusions and Recommendations
Burning Glass Technologies’ Virginia job-ad data was benchmarked against job-ad data collected in a similar manner by CCARS for July 2017; this was the last month CCARS web scraped job-ad data and is the most complete OD/OJ data based on our data profiling of the other months and years. Both Burning Glass Technologies and CCARS constructed their job-ad data tables from web scraped information but they used different websites; CCARS only scraped three government websites whereas Burning Glass Technologies scraped government and non-government websites. In addition, CCARS acknowledges that their job-ad data does not capture all job-ads in Virginia. Despite this, the Burning Glass Technologies and OD/OJ align across locations (r = 0.996) and occupation families (r = 0.756). This difference between the two categories could be an indication of the error involved in taking scraped information and transforming/canonicalizing it into a useable data format; there is less error in assigning a place of employment to a latitude and longitude than determining the occupation family from a job title. Even when the comparison across the 207 geographic location by occupation family combinations was made the percentage difference was less than ±1% for 194 (93.72%) of the combinations. Seven of the thirteen combinations outside this range are in Region 7, Northern VA Regional Council, which has the largest population (> 2.5 million) and number of jobs (> 1.3 million)18 within the nine regions. Three of the remaining combinations involve the Management occupation family where the OD/OJ had more job-ads than Burning Glass Technologies in all nine regions; in particular Regions 2, 4, 5, and 7 the four regions with the largest population and number of jobs. It is not clear why the OD/OJ has more job-ads in this occupation family, whether it is error in the scraping and assignment process or can be attributed to the differences in the websites being scraped. Our analyses showed that Burning Glass Technologies job-ad data over-represents postings in the Computer & Mathematical and Healthcare Practitioners & Technical occupation families (Figure 3) which is consistent with the findings of other researchers. The over-representation in Computer & Mathematical jobs in Region 7 aligns with the revealed comparative advantage (RCA)19 of these occupations in Region 7 (cities Alexandria, Fairfax, Falls Church, Manassas, and Manassas Park; and the counties of Arlington, Fairfax, Loudoun, and Prince William) which ranges from 1.73 to 3.88 (a value >1 indicates an advantage). It may also be attributable to the fact that not all openings are posted online reflect an actual vacancy and that anecdotal evidence suggests a small share of the ads in information technology occupations are used to collect information about the potential applicant pool (Carnevale et al. 2014).
With regard to benchmarking against government surveys, the findings across researchers is consistent: trends across occupations and years are similar to those in surveys; business & financial, computer & mathematical, and healthcare occupations are overrepresented in Burning Glass Technologies; and construction, public administration & government, mining & logging, and accommodation & food services are underrepresented. In most cases the discrepancies were not quantified, when they were, the percentage differences were less than ten. The fact that the number of employers posting job-ads online and the number of websites Burning Glass Technologies scrapes is increasing implies benchmarking should be an ongoing process in order to accurately document any biases in a changing landscape.
With regard to the fitness-for-use, to our knowledge there has not been any research on the STW that used online job postings. The concern is that since these jobs do not require a college degree and it has been reported that online job-ads are biased toward college graduates (Carnevale et al. 2014; Rothwell 2014; Hershbein & Hollenbeck 2015) STW jobs maybe underrepresented in online job-ads. Since JOLTS does not provide a breakdown by education, quantifying the bias against a survey is not possible. On average the completeness of the minimum education requirement variable is ~50 percent. Carnevale et al. (2014) used imputation methodologies to provide estimates for missing values; they concluded 40 to 60 percent of job openings for workers with a high school diploma and 30 to 40 percent of job openings for workers with some college or an Associate’s degree are posted online. We recommend that additional methods for estimating the minimum education requirement be evaluated. In our work with the resume data we were able to derive a binary variable, below a Bachelor’s degree / Bachelor’s degree or
18 Virginia Initiative for Growth & Opportunity Region 7 at-a-glance https://govirginia.org/regions/seven/ (last accessed August 14, 2019) 19 DataUSA: Revealed Comparative Advantage “… a calculation used to determine what is special or unique about a certain location/occupation or location/industry combination.” https://datausa.io/about/glossary/ (last accessed November 20, 2019)

19
above, by using related variables to increase the completeness of the minimum education variable from <50 percent to 79 percent; this should be explored with the job-ad data.
Aligning the Burning Glass Technologies data, their data dictionary, and online publications, provides insight into the definitions of the Burning Glass Technologies derived variables (for example, the skill taxonomy hierarchy, baseline, specialized, and software skills) which are an invaluable resource for understanding the skill demands of employers. The Burning Glass Technologies job-ad data in combination with their publications and the publications of non-profits, academic institutions, and government agencies that use their job-ad data for research, provide information on the non-degree credential landscape which is not available in designed and administrative data sources. At present there are no federal or state surveys or administrative data sources that approach the comprehensiveness of the Burning Glass Technologies job-ad20. These data address data gaps in:
1. The types of skills used on the job in STW occupations that require training beyond the high school level but not at the bachelor’s level or higher.
2. The specialized skills and non-degree credentials demanded by employers for entry level STW jobs.
3. The baseline or soft skills demanded by employers.
4. The job-ad data can be linked with Burning Glass Technologies resume data by location (for example, MSA, county, state) to provide information on the skills that are demanded by employers that are not available in the current STW workforce.
Recommended Citation:
Lancaster VA, Mahoney-Mair D, Ratcliff NJ. (2019). Review of Burning Glass Job-ad Data. Proceedings of the Biocomplexity Institute, Technical Report TR# 2021-013.
20 Leventoff, Jenna, “Measuring non-Degree Credential Attainment: 50-State Scan,” Workforce Data Quality Campaign, May 2018, https://www.nationalskillscoalition.org/resources/publications/file/Measuring-Non-Degree-Credential-Attainment-50-State-Scan.pdf. (last accessed August 14, 2019)
20
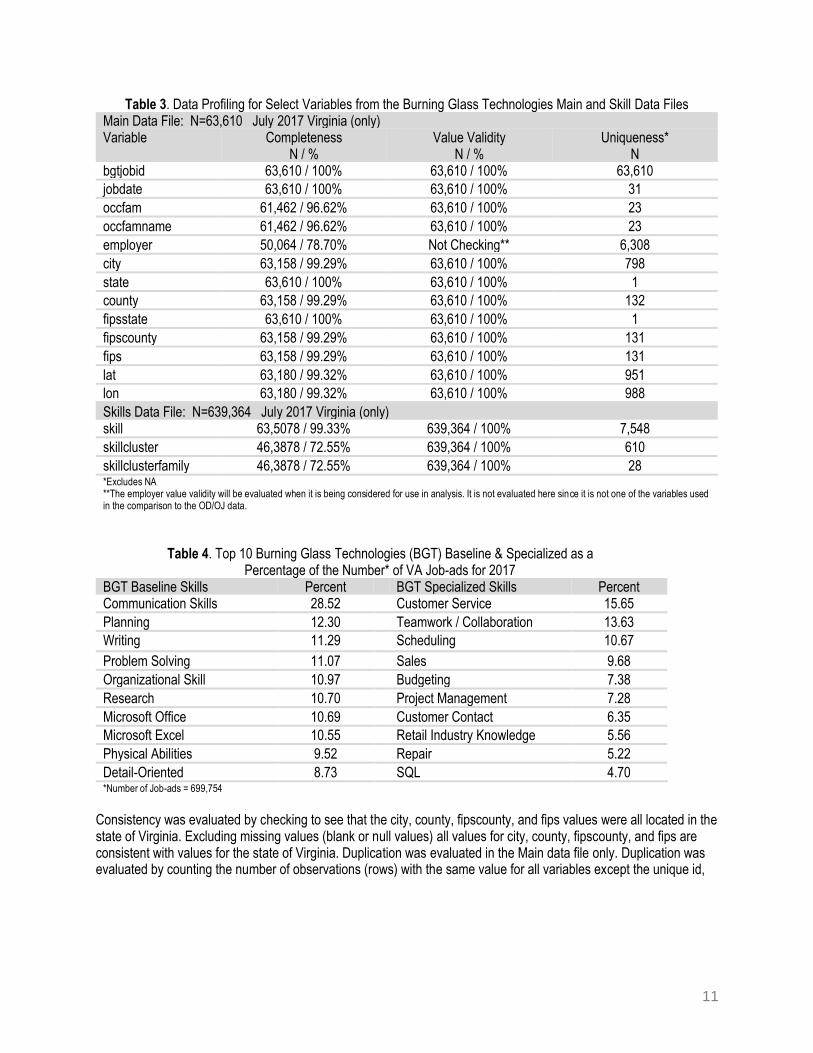
Acronyms ACS American Community Survey BGT Burning Glass Technologies CIP Classification of Instructional Program CCARS Commonwealth Center for Advanced Research and Statistics CPS Current Population Survey ERP Enterprise Resource Planning HWOL Help Wanted Online Index JOLTS Job Openings and Labor Turnover Survey LMI Labor Market Information NLx National Labor Exchange OES Occupational Employment Statistics O*NET Occupational Information Network OD/OJ Open Data/Open Jobs Data PA Physician Assistant RCA Revealed Comparative Advantage SDAD Social Decision Analytics Division SOC Standard Occupational Classification STW Skilled Technical Workforce
References
Azar, José A., Emiliano Huet-Vaughn, Ioana Marinescu, Bledi Taska, and Till von Wachter. 2019a. “Labor Market Concentration and Minimum Wage Employment Effects.” National Bureau of Economic Research Working Paper 26101. [LINK]
Azar, José A., Ioana Marinescu, Marshall I. Steinbaum, and Bledi Taska. 2019b. "Concentration in US Labor Markets: Evidence from Online Vacancy Data," National Bureau of Economic Research Working Paper 24395. [LINK]
Beblavý, Miroslav, Brian Fabo, and Karolien Lenaerts. December 2016a. "Demand for Digital Skills in the US Labour Market: The IT Skills Pyramid.” CEPS Special Report No. 154. [LINK]
Beblavý, Miroslav, Brian Fabo, and Karolien Lenaerts. March 2016b. "Skills Requirements for the 30 Most-Frequently Advertised Occupations in the United States: An Analysis Based on Online Vacancy Data." CEPS Special Report No. 132. [LINK]
Ben-Ner, Avner, Bledi Taska, and Ainhoa Urtasun. May 24, 2019. “Tasks and Skills in Additive versus Traditional
Manufacturing: A First Look at Evidence from Job Vacancies.” Working Paper, Minnesota University [LINK]
Bidwell, Matthew J. 2016. "Unpacking Human Capital: Exploring the Role of Experience and Education in Shaping Access to Jobs." Academy of Management Proceedings, Vol. 2016, No. 1, p. 12359.
Bloesch, Justin and Bledi Taska. June 26, 2019. “Which Workers' Wages Track Productivity? The Role of Position
Specificity and On-the-Job Search.” Working Paper, Harvard University [LINK]
Börner, Katy, Olga Scrivner, Mike Gallant, Shutian Ma, Xiaozhong Liu, Keith Chewning, Lingfei Wu, and James A.
Evans. 2018. "Skill discrepancies between research, education, and jobs reveal the critical need to supply soft skills
for the data economy." Proceedings of the National Academy of Sciences 115(50), 12630-12637. [LINK]
Braxton, Carter J. and Bledi Taska. 2019. "Technology Adoption and the Consequences of Job Loss." Working
Paper, Minnesota University [LINK]

21
Brown, Phillip and Manuel Souto-Otero. 2018. "The end of the credential society? An analysis of the relationship between education and the labour market using big data." Journal of Education Policy (2018): 1-24. [LINK]
Brynjolfsson, Erik, Sebastian Steffen, Daniela Scur, Martin Fleming, Wyatt Clarke, Subhro Das, Phai
Phongthiengtham, and Daniel Rock. 2018. "The Rate of New Task Creation in the U.S. Economy." Part of the MIT-
IBM Watson AI Lab. [LINK]
Burke A. Mary, Alicia S. Modestino, Shahriar Sadighi, Sederberg Rachel, and Bledi Taska. June 2019. "No Longer Qualified? Changes in the Supply and Demand for Skills within Occupations." Working Paper, Federal Reserve Bank of Boston. [LINK]
Cajner, Tomaz and David Ratner. June 23, 2016. “A Cautionary Note on the Help Wanted Online Data.” FEDS Notes. Washington: Board of Governors of the Federal Reserve System. [LINK]
Campello, Murillo, Janet Gao, and Qiping Xu. July 1, 2019. "Local Taxes and the Demand for Skilled Labor: Evidence from Job Postings." Available at SSRN 3392975. [LINK]
Cardenas-Navia, Isabel and Brain Fitzgerald. 2019. “The digital dilemma: Winning and losing strategies in the digital talent race.” Industry and Higher Education, Vol. 33(3): 214-217. [LINK]
Carnevale Anthony, Tamara Jayasundera, and Dmitri Repnikov. 2015. "State Online College Job Market: Ranking the States” Georgetown University Center on Education and the Workforce. [LINK]
Carnevale Anthony, Tamara Jayasundera, and Dmitri Repnikov. 2014. “Understanding Online Job Ads Data” Georgetown University Center on Education and the Workforce. [LINK]
Clemens, Jeffrey, Lisa B. Kahn, and Jonathan Meer. September 3, 2018. “Dropouts Need Not Apply: The Minimum Wage and Skill Upgrading.” Working Paper Rochester University. [LINK]
Deming, David, and Lisa B. Kahn. 2018. "Skill Requirements across Firms and Labor Markets: Evidence from Job Postings for Professionals." Journal of Labor Economics 36, no. S1, S337-S369. [LINK]
Deming, David J., and Kadeem L. Noray. 2018. "STEM Careers and Technological Change." National Bureau of Economic Research Working Paper No. 25065. [LINK]
Dillender, Marcus and Eliza Forsythe. 2019. "Computerization of White-Collar Jobs." Upjohn Institute Working Paper,
19-310. Kalamazoo, MI: W. E. Upjohn Institute for Employment Research. [LINK]
Djumalieva, Jyldyz, Antonio Lima, and Cath Sleeman. March 2018. “Classifying Occupations According to Their Skill Requirements in Job Advertisements.” Economic Statistics Centre of Excellence, ESCoE Discussion Paper ISSN 2515-4664. [LINK]
Djumalieva, Jyldyz, and Cath Sleeman. "An Open and Data-driven Taxonomy of Skills Extracted from Online Job Adverts." Developing Skills in a Changing World of Work: Concepts, Measurement and Data Applied in Regional and Local Labour Market Monitoring Across Europe (2018): 425. [LINK]
Dorrer, John. 2014. "Do We Have the Workforce Skills for Maine’s Innovation Economy?" Maine Policy Review 23.1: 65-74. [LINK]
Faberman, R. Jason and Marianna Kudlyak. January 2016. “What does online job search tell us about the labor market.” Economic Perspectives, Federal Reserve Bank of Chicago. [LINK]
Fee, Kyle, Keith Wardrip, and Lisa Nelson. April 2019. "Opportunity Occupations Revisited. Exploring Employment
for Sub-Baccalaureate Workers Across Metro Areas and Over Time." Special Report of the Federal Reserve Banks
of Philadelphia, and Cleveland. [LINK]
Felten, Edward W., Manav Raj, and Robert Seamans. September 8, 2019. "The Variable Impact of Artificial
Intelligence on Labor: The Role of Complementary Skills and Technologies." Available at SSRN 3368605. [LINK]

22
Fuller, Joseph B., Jennifer Burrowes, Manjari Raman, Dan Restuccia, and Alexis Young. November 2014. "Bridge the Gap: Rebuilding America's Middle Skills." Report, U.S. Competitiveness Project, Harvard Business School. [LINK]
Goldfarb, Avi, Bledi Taska, and Florenta Teodoridis. 2019a. "Could Machine Learning Be a General-Purpose
Technology? Evidence from Online Job Postings?" Working Paper. [LINK]
Goldfarb, Avi, Bledi Taska, and Florenta Teodoridis. 2019b. "Machine Learning in Healthcare: Invention of a Method
of Invention, General Purpose Technology, or Both?" Working Paper. [LINK]
Grinis, Inna. 2019. "The STEM Requirements of “Non-STEM” Jobs: Evidence from UK Online Vacancy Postings." Economics of Education Review, Vol. 70: 144-158. [LINK]
Hazell, Jonathon and Bledi Taska. 2018. "Posted Wage Rigidity." Massachusetts Institute of Technology, Department of Economics. [LINK]
Hershbein, Brad, and Lisa B. Kahn. 2018a. "Do recessions accelerate routine-biased technological change? Evidence from vacancy postings." American Economic Review 108(7): 1737-72. [LINK]
Hershbein, Brad, and Claudia Macaluso. July 30, 2018b. "Labor Market Concentration and the Demand for Skills." [LINK]
Hershbein, Brad, and Kevin Hollenbeck. 2015. "Refining Workforce Education Supply and Demand Analysis: Final Report." Upjohn Institute Technical Report No. 15-031. Kalamazoo, MI: W.E. Upjohn Institute for Employment Research. [LINK]
Javorcik, Beata, Layla O'Kane, Benjamin Kett, and Katherine Stapleton. 2019. "The Brexit Vote and Labour Demand:
Evidence from Online Job Postings." Oxford University, Department of Economics, Number 878. [LINK]
Kuhn, Peter, Philip Luck, and Hani Mansour. 2018. "Offshoring and the Demand for Skills." Working Paper, University of Colorado Denver. [LINK]
Kwan, Alan and Liu, Yukun. March 19, 2018. “Labor Market Power and Firm Financial Flexibility.” Available at SSRN: [LINK]
Leigh, Nancey Green, Heonyeong Lee, and Benjamin Kraft. 2019. "Do Robots Increase Wages?" [LINK]
Liu, Yukun and Wu X. October 1, 2018. “Labor Market Competitor Network and the Transmission of Shocks.” Paris December 2018 Finance Meeting EUROFIDAI - AFFI. Available at SSRN: [LINK]
Markow, Will and Vasil I. Yanesov. August 17, 2018. "The Geography of Labor Demand during the Great Recession." Immigration Policy Lab, Stanford University; Goldman School of Public Policy, University of California, Berkeley and IZA (the Institute for the Study of Labor). [LINK]
Modestino, Alicia Sasser, Daniel Shoag, and Joshua Ballance. "Downskilling: changes in employer skill requirements over the business cycle." Labour Economics Vol. 41 (2016). [LINK]
Modestino, Alicia Sasser, Daniel Shoag, and Joshua Ballance. 2019. “Upskilling: Do employers demand greater skill when skilled workers are plentiful?” Forthcoming Review of Economics and Statistics. [LINK]
Morgan, Perri, Brandi Leach, Kristine Himmerick, and Christine Everett. 2018. "Job openings for PAs by specialty." Journal of the American Academy of Pas, Vol. 31, No. 1: 45-47. [LINK]
Morgan, Perri, Kristine A. Himmerick, Brandi Leach, Patricia Dieter, and Christine Everett. 2017. "Scarcity of primary care positions may divert physician assistants into specialty practice." Medical Care Research and Review 74, No. 1: 109-122. [LINK]
Murciano-Goroff, Raviv. “Missing Women in Tech: The Labor Market for Highly Skilled Software Engineers.” Mimeo Stanford University (2018) [LINK]

23
Papageorgiou, Theodore. March 2018. "Worker Sorting and Agglomeration Economies." Department of Economics,
McGill University. [LINK]
Tambe, Prasanna. 2018. "From data to decisions: Domain knowledge and the machine learning workforce." NBER Economics of AI Conference [LINK]
Rothwell, Jonathan. 2014. "Still Searching: Job Vacancies and STEM Skills." Metropolitan Policy Program, Brookings Institution. [LINK]
Aysegul Sahin, Joseph Song, Giorgio Topa, and Giovanni L. Violante. August 2012. “Mismatch Unemployment.” Staff Reports 566, Federal Reserve Bank of New York, revised 01 Jun 2013. [LINK]
Schubert, Gregor, Anna Stansbury, and Bledi Taska. June 2019. "Getting labor markets right: outside options and occupational mobility." Working Paper, Harvard University [LINK]
Scrivner, Olga, Thuy Nguyen, Kosali Simon, Esme Middaugh, Bledi Taska, and Katy Borner. 2019. “Hiring in the
substance use disorder treatment workforce during the first five years of Medicaid expansion.” Submitted to PLOS
Medicine.
Shoag, Daniel and Robert Clifford. 2016a. "No More Credit Score" Employer Credit Check Banks and Signal Substitution. (2016) Working Paper Harvard University. [LINK]
Shoag, Daniel, and Stan Veuger. March 2016. "No Woman No Crime: Ban the Box, Employment, and Upskilling." Faculty Research Working Paper series, Harvard University. [LINK]
Spiezia, Vincenzo. 2016. “New Skills for the Digital Economy: Measuring the Demand for ICT Skills at Work.” OECD, Directorate for Science, Technology, and Innovation; Committee on Digital Economy. [LINK]
Templin, Thomas, and Lesley Hirsch. 2013. “Do Online Job Ads Predict Hiring?” New York: New York City Labor Market Information Services. [LINK]
Wardrip, Keith, Kyle Fee, Lisa Nelson, and Stuart T. Andreason. September 2015. "Identifying Opportunity Occupations in the Nation's Largest Metropolitan Areas." Special Report of the Federal Reserve Banks of Philadelphia, Cleveland, and Atlanta. [LINK]
Wardrip, Keith, Stuart T. Andreason, and Mels De Zeeuw. 2017. "Uneven Opportunity: Exploring Employers'
Educational. Preferences for Middle-Skills Jobs." Special Report of the Federal Reserve Banks of Philadelphia and
Atlanta. [LINK]

24
APPENDIX A
Job-ad Counts by Economic Region & County (OD/OJ > Burning Glass Technologies bolded)
Region Region Name County BGT OD/OJ
1 UVA Wise Bland County 15 11
1 UVA Wise Bristol city 119 434
1 UVA Wise Buchanan County 48 15
1 UVA Wise Carroll County 49 15
1 UVA Wise Dickenson County 30 13
1 UVA Wise Galax city 76 67
1 UVA Wise Grayson County 27 15
1 UVA Wise Lee County 60 22
1 UVA Wise Norton city 34 34
1 UVA Wise Russell County 51 45
1 UVA Wise Scott County 57 24
1 UVA Wise Smyth County 103 39
1 UVA Wise Tazewell County 196 149
1 UVA Wise Washington County 51 87
1 UVA Wise Wise County 108 103
1 UVA Wise Wythe County 180 59
2 VT Economic Development Alleghany County 54 58
2 VT Economic Development Amherst County 63 31
2 VT Economic Development Appomattox County 27 10
2 VT Economic Development Bedford County 176 103
2 VT Economic Development Botetourt County 114 31
2 VT Economic Development Campbell County 95 73
2 VT Economic Development Craig County 16 NA
2 VT Economic Development Floyd County 30 6
2 VT Economic Development Franklin County 179 92
2 VT Economic Development Giles County 51 29
2 VT Economic Development Lynchburg city 22 780
2 VT Economic Development Montgomery County 656 788
2 VT Economic Development Pulaski County 219 676
2 VT Economic Development Radford city 1 NA
2 VT Economic Development Roanoke city 1574 1264
2 VT Economic Development Roanoke County 47 18
2 VT Economic Development Salem city 364 182
3 Southside Planning District Commission Amelia County 20 9
3 Southside Planning District Commission Brunswick County 58 17
3 Southside Planning District Commission Buckingham County 27 19

25
Region Region Name County BGT OD/OJ
3 Southside Planning District Commission Charlotte County 63 NA
3 Southside Planning District Commission Cumberland County 11 7
3 Southside Planning District Commission Danville city 463 527
3 Southside Planning District Commission Halifax County 119 407
3 Southside Planning District Commission Henry County 77 43
3 Southside Planning District Commission Lunenburg County 27 16
3 Southside Planning District Commission Martinsville city 219 149
3 Southside Planning District Commission Mecklenburg County 162 121
3 Southside Planning District Commission Nottoway County 62 116
3 Southside Planning District Commission Patrick County 37 7
3 Southside Planning District Commission Pittsylvania County 72 40
3 Southside Planning District Commission Prince Edward County 130 31
4 GROW Capital Jobs Foundation Charles City County 11 NA
4 GROW Capital Jobs Foundation Chesterfield County 560 440
4 GROW Capital Jobs Foundation Dinwiddie County 463 74
4 GROW Capital Jobs Foundation Emporia city 58 114
4 GROW Capital Jobs Foundation Goochland County 207 90
4 GROW Capital Jobs Foundation Greensville County 25 5
4 GROW Capital Jobs Foundation Hanover County 438 271
4 GROW Capital Jobs Foundation Henrico County 707 463
4 GROW Capital Jobs Foundation Hopewell city 110 56
4 GROW Capital Jobs Foundation New Kent County 95 12
4 GROW Capital Jobs Foundation Petersburg city 8 276
4 GROW Capital Jobs Foundation Powhatan County 44 90
4 GROW Capital Jobs Foundation Prince George County 158 132
4 GROW Capital Jobs Foundation Richmond city 6129 4759
4 GROW Capital Jobs Foundation Surry County 29 17
4 GROW Capital Jobs Foundation Sussex County 29 37
5 Reinvent Hampton Roads Accomack County 246 206
5 Reinvent Hampton Roads Chesapeake city 1201 1131
5 Reinvent Hampton Roads Franklin city 86 176
5 Reinvent Hampton Roads Hampton city 87 610
5 Reinvent Hampton Roads Isle of Wight County 90 402
5 Reinvent Hampton Roads James City County 427 11
5 Reinvent Hampton Roads Newport News city 2104 1777
5 Reinvent Hampton Roads Norfolk city 2358 1230
5 Reinvent Hampton Roads Northampton County 58 14
5 Reinvent Hampton Roads Poquoson city 24 5

26
Region Region Name County BGT OD/OJ
5 Reinvent Hampton Roads Portsmouth city 447 421
5 Reinvent Hampton Roads Southampton County 46 12
5 Reinvent Hampton Roads Suffolk city 328 235
5 Reinvent Hampton Roads Virginia Beach city 2482 1656
5 Reinvent Hampton Roads Williamsburg city 58 387
5 Reinvent Hampton Roads York County 84 77
6 George Washington Regional Commission Caroline County 75 36
6 George Washington Regional Commission Essex County 77 19
6 George Washington Regional Commission Fredericksburg city 891 511
6 George Washington Regional Commission Gloucester County 105 85
6 George Washington Regional Commission King and Queen County 277 5
6 George Washington Regional Commission King George County 73 156
6 George Washington Regional Commission King William County 47 26
6 George Washington Regional Commission Lancaster County 42 27
6 George Washington Regional Commission Mathews County 79 8
6 George Washington Regional Commission Middlesex County 40 21
6 George Washington Regional Commission Northumberland County 28 16
6 George Washington Regional Commission Richmond County 23 9
6 George Washington Regional Commission Spotsylvania County 49 31
6 George Washington Regional Commission Stafford County 307 227
6 George Washington Regional Commission Westmoreland County 55 16
7 Northern Virginia Regional Council Alexandria city 2422 NA
7 Northern Virginia Regional Council Arlington County 4637 3053
7 Northern Virginia Regional Council Fairfax County 15986 11162
7 Northern Virginia Regional Council Falls Church city 28 1084
7 Northern Virginia Regional Council Loudoun County 3782 2655
7 Northern Virginia Regional Council Manassas city 582 436
7 Northern Virginia Regional Council Manassas Park city 14 NA
7 Northern Virginia Regional Council Prince William County 1239 1216
8 Northern Shenandoah Valley Regional Commission Augusta County 250 98
8 Northern Shenandoah Valley Regional Commission Bath County 55 18
8 Northern Shenandoah Valley Regional Commission Buena Vista city 21 7
8 Northern Shenandoah Valley Regional Commission Clarke County 86 48
8 Northern Shenandoah Valley Regional Commission Frederick County 102 25
8 Northern Shenandoah Valley Regional Commission Harrisonburg city 446 260
8 Northern Shenandoah Valley Regional Commission Highland County 16 26
8 Northern Shenandoah Valley Regional Commission Lexington city 86 74
8 Northern Shenandoah Valley Regional Commission Page County 105 54

27
Region Region Name County BGT OD/OJ
8 Northern Shenandoah Valley Regional Commission Rockbridge County 40 14
8 Northern Shenandoah Valley Regional Commission Rockingham County 261 110
8 Northern Shenandoah Valley Regional Commission Shenandoah County 171 163
8 Northern Shenandoah Valley Regional Commission Staunton city 127 184
8 Northern Shenandoah Valley Regional Commission Warren County 135 98
8 Northern Shenandoah Valley Regional Commission Waynesboro city 138 96
8 Northern Shenandoah Valley Regional Commission Winchester city 526 689
9 Central Virginia Partnership for Economic Development Albemarle County 87 13
9 Central Virginia Partnership for Economic Development Charlottesville city 1320 946
9 Central Virginia Partnership for Economic Development Culpeper County 214 175
9 Central Virginia Partnership for Economic Development Fauquier County 447 235
9 Central Virginia Partnership for Economic Development Fluvanna County 57 367
9 Central Virginia Partnership for Economic Development Greene County 48 26
9 Central Virginia Partnership for Economic Development Louisa County 99 32
9 Central Virginia Partnership for Economic Development Madison County 64 11
9 Central Virginia Partnership for Economic Development Nelson County 54 6
9 Central Virginia Partnership for Economic Development Orange County 71 27
9 Central Virginia Partnership for Economic Development Rappahannock County 346 21
NA NA NA 1314 NA