technology report: anaerobic lagoon and sprayfield
TRANSCRIPT

July 2005 (update of October 2004 version)
Cost and Returns Analysis of Manure Management Systems Evaluated in 2004 under the North Carolina Attorney General Agreements with Smithfield Foods, Premium Standard Farms, and Front Line Farmers TECHNOLOGY REPORT: ANAEROBIC LAGOON AND SPRAYFIELD
Prepared as part of the Full Economic Assessment of Alternative Swine Waste Management Systems under the Agreement Between the North Carolina Attorney General and Smithfield Foods Prepared for: C. M. (Mike) Williams Animal and Poultry Waste Management Center North Carolina State University Campus Box 7609 Room 134 Scott Hall 2711 Founder’s Drive Raleigh, NC 27695-7608
Prepared by: Task 1 Team Agricultural and Resource Economics North Carolina State University
Technical Point of Contact: Administrative Point of Contact: Dr. Kelly Zering (Task 1 Team Leader) Dr. Michael Wohlgenant North Carolina State University (Project Coordinator) Department of Agricultural North Carolina State University and Resource Economics Department of Agricultural 3313 Nelson Hall and Resource Economics Campus Box 8109 3310 Nelson Hall Raleigh, NC 27695-8109 Campus Box 8109 Tel: 919-515-6089 Raleigh, NC 27695-8109 Fax: 919-515-6268 Tel: 919-515-4673 Email: [email protected] Fax: 919-515-6268 Email: [email protected]

Table of Contents Summary of Results ...................................................................................................................... 1
Sensitivity Analysis……………………………………………………………………...………..2
Breakeven Analysis on By-product Prices……………………………………………….……...2
1. Overview of the Anaerobic Lagoon and Spray Field Technology ........................................ 3 1.1 Introduction ........................................................................................................................3
1.2 System Description ...............................................................................................................3 2. Lagoon Sizing and Construction ............................................................................................ 5 3. Construction Costs of Lagoons................................................................................................. 7
3.1 Excavation Costs.................................................................................................................7
3.2 Liner Costs ...........................................................................................................................7 3.2.1 Clay Liner Cost............................................................................................................. 7 3.2.2 Plastic Liner Cost ......................................................................................................... 8
3.3 Return to Barns ..................................................................................................................8
3.4 Additional Costs .................................................................................................................8
3.5 Annualizing Construction Costs .......................................................................................9 4. Cost Modeling .......................................................................................................................... 9
4.1. Overview of Cost Modeling for Baseline System (Tables AL.1-AL.22).......................9
4.2 Standardized Costs for Baseline System at a 4,320-Head Feeder-to-Finish Farm with a Flush System (Tables AL.1-AL.5) ..............................................................9
4.3 Standardized Costs for Baseline System at a 4,320-Head Feeder-to-Finish Farm with a Pit-Recharge System (Tables AL.6-AL.10) .............................................10
4.4 Standardized Costs for Baseline System at an 8,800-Head Feeder-to-Finish Farm with Flush System (Tables AL.11-AL.15)...........................................................11
4.5 Standardized Costs for Baseline System at a 4,000-Sow Farrow-to-Wean Farm with Flush System (Tables AL.16-AL.20)...........................................................11
4.6. Extrapolation of Lagoon and Sprayfield System Per Unit Costs to Other Farm Types and Sizes (Tables AL.21-AL.22) ...............................................................12
4.7 Cost of Lagoon and Sprayfield System as Built in 1992...............................................12 5. Summary .................................................................................................................................. 12 References…..................................................................................................................................13

Summary of Results New System Cost per 1,000 pounds Steady State Live Weight per year: $86.81 Standardized Feeder-to-Finish Farm with 4,320 head (Tables AL.6- AL.10) 10-Year Amortization, Pit-Recharge, N-limited Irrigation onto Forages Includes: Lagoon: $ 66.03 / 1,000 lbs. SSLW / Yr. Return to Barns: $ 3.18 / 1,000 lbs. SSLW / Yr. Land Application: $ 17.61 / 1,000 lbs. SSLW / Yr. Range: Across Farm Sizes and Types (Pit-Recharge): $43.24 To $189.07 / 1,000 lbs. SSLW / Yr. Across Farm Sizes and Types (Flush): $43.32 To $190.84 / 1,000 lbs. SSLW / Yr. Confidence in Estimates: Medium to Medium-Low Based on a model using approximated current prices and standardized manure
parameters. Few systems built since 1997 on which to base cost estimates. Costs by Category: Direct Construction: $ 36.13 / 1,000 lbs. SSLW / Yr. Contractor Overhead: $ 15.39 / 1,000 lbs. SSLW / Yr. Total Operating: $ 17.68 / 1,000 lbs. SSLW / Yr. Land Application: $ 17.61 / 1,000 lbs. SSLW / Yr.
1

Sensitivity Analysis Effect of Expected Economic Life, Interest Rate, and Overhead Rate on Predicted Annualized Construction and Overhead Cost ($ / 1,000 lbs. SSLW)
Overhead Rate Capital Recovery Factor (CRF) 20 % 43.1 %
Low-Cost Projection (15-year economic life, 6 % interest rate)
0.1030
$30.09
$35.78
Actual Cost Projection (10-year economic life, 8 % interest rate)
0.1490
$43.28
$51.52*
High-Cost Projection (7-year economic life, 10 % interest rate)
0.2054
$59.43
$70.79
* This predicted cost was estimated using the assumptions that are applied throughout the report—10-year maximum expected economic life, 8 % interest rate, and 43.1 % overhead rate. Effect of Electricity Price on Predicted Annual Operating Cost ($ / 1,000 lbs. SSLW)
Electricity Price ($ / kWh) Predicted Annual Operating Cost ($ / 1,000 lbs. SSLW)
Low-Cost Electricity ($0.06 / kWh) $17.61 Actual Cost of Electricity ($0.08 / kWh) $17.68* High-Cost Electricity ($0.10 / kWh) $17.74 * This predicted cost was estimated using the assumption that is applied throughout the report--$0.08 / kWh. The sensitivity of predicted costs and returns to a few critical assumptions is illustrated above by recalculating annualized construction and overhead cost with lower and higher values for amortization rate (cost recovery factor) and for overhead rate. The number in bold face $51.52 is the actual predicted 2004 construction and overhead cost for the anaerobic lagoon and sprayfield system on a 4,320 head feeder to finish farm with pit recharge and nitrogen limited land application to forage. Numbers are recalculated using two overhead rates: 20% and 43.1%, and three combinations of interest rate and maximum expected economic life: 15 year life and 6% interest rate, 10 year life and 8% interest rate, and 7 year life and 10% interest rate. The range of selected parameter values has a significant effect on the predicted value of annual construction and overhead costs. Similarly, predicted annual operating costs of the anaerobic lagoon and sprayfield are recalculated using higher and lower prices for electricity. The 25% increase or decrease in electricity price has little effect on the predicted annual cost reflecting limited use of electricity. Note that the sensitivity analysis is not intended to propose alternative costs and returns estimates. It is solely intended to illustrate the sensitivity of the results to changes in parameter values. Break-even Analysis on By-product Prices Breakeven analysis is conducted for systems that produce potentially marketable by-products in order to determine the by-product price required to cover the cost of the system. The anaerobic lagoon system produces only liquid lagoon effluent and anaerobic lagoon sludge so no breakeven analysis is conducted for this system.
2

1. Overview of the Anaerobic Lagoon and Spray Field Technology 1.1 Introduction This section describes the design and approximated 2004 cost of building and operating swine manure management technology currently used in North Carolina: anaerobic lagoon and sprayfield systems. This 2004 economic analysis of the anaerobic lagoon and sprayfield technology meets a requirement of the Agreement. An important function of this model is to provide standardized baseline values for selected manure volume and composition parameters and for the existing costs that may be affected by alternative technologies (such as the cost of land applying liquid effluent). 1.2 System Description The most efficient and effective swine manure management plans evolve from a “total system plan” perspective beginning with site selection (Barker). Production facilities should be located near the center of a tract of land that is large enough to allow manure to be applied at agronomic rates. Agronomic rates are determined by the nutrient composition of the applied effluent as well as the type of crop that is being fertilized and reasonable yield expectations (RYE) for that crop. Buildings should be constructed on flat, elevated areas possibly using earth fill that has been excavated from the lagoon. By elevating the buildings several feet above the ground, surface drainage can be routed away from them and manure can flow via gravity to the lagoon (Barker, Swine Production Facility Manure Management: Pit Recharge- Lagoon Treatment). North Carolina swine production facilities use one of two primary methods to remove manure, spilled water and spilled feed from the buildings to the lagoon: the pit-recharge system or the underfloor flush system. Each will be briefly discussed in turn. See Section 4 of the 2004 cost and returns Summary report for further discussion of these manure removal systems. The pit-recharge system involves collecting swine manure that falls through a slatted floor into a concrete pit located under the pigs. This pit is then periodically drained by removing a plug and allowing gravity to carry the liquid to a lagoon. Upon being drained, the plug is put back in place and the pit is recharged with recycled lagoon liquid. A recycle pump is used to transport lagoon liquid back to the pit buildings. Pits should be drained and recharged at least once per week (Barker, Swine Production Facility Manure management: Pit Recharge- Lagoon Treatment). Underfloor flush systems collect manure in concrete gutters or shallow pits after it falls through slatted floors. Manure is then flushed from the underfloor collection areas by using recycled lagoon liquid. As in the pit recharge system, the lagoon liquid is transported back to the main buildings by using a recycle pump. The liquid is stored in a flush tank (adjacent to the end of the building) until it is released into the flush gutters. The underfloor gutters are generally flushed 4 to 6 times per day to prevent solid swine manure from settling (Barker, Swine Production Facility Manure Management: Underfloor Flush- Lagoon Treatment). For more information on flushing discharge rates and tank capacities, see Barker, Driggers, and Sneed’s “Design Criteria For Swine Waste
3

Flushing Systems.” This source also provides information on the recycling pumps used in both the pit recharge and underfloor flush systems. Whether a North Carolina swine farm uses a pit-recharge or an underfloor flush system, the resulting manure is transported to an anaerobic lagoon. Because anaerobic lagoons are designed to maintain no dissolved oxygen, they are deeper and require less surface area than aerobic (facultative) lagoons. To minimize groundwater contamination, most lagoons are built on soils of low permeability or soils which seal through biological action or sedimentation. Low permeable clay liners or plastic liners are required where the soils on site are too permeable. The liquid capacity for an anaerobic lagoon includes the appropriate design treatment capacity (a function of the number and size of swine and their manure production), storage for accumulated sludge, and temporary storage for rainfall and wastewater accumulation. Additionally, the lagoon is required to provide storage for a 25-year, 24-hour rainfall (5 to 8.75 inches in North Carolina) as well as a period of chronic rainfall (in practice, a depth similar to the 24 hour 25 year storm depth). Wastewater storage may be designed for at least 180 days accumulation. In order to control odor and maintain a water quality suitable for flushing/recharging, North Carolina recommendations state that a ratio of two cubic feet of liquid volume per pound of live animal weight should be maintained in anaerobic lagoons (Barker, Lagoon Design…). New lagoons should be filled at least half full with water prior to manure loading in order to nurture bacteria establishment that will aid in anaerobic digestion. Within 2-3 years of startup, lagoons are generally filled to capacity due to added manure volume and rainfall less evaporation (annual moisture surpluses range from 8 to 18 inches in North Carolina). Upon reaching capacity, excess liquids must be routinely applied to grasslands, croplands, or woodlands (the spray field). Following flushing/recharging and anaerobic lagoon digestion, the third step in North Carolina’s current swine manure management system involves land application to sprayfields (Barker, Lagoon Design …). Lagoon liquids must be land applied at rates within the soil infiltration capacity and the fertilizer requirement of the vegetation. Land applying lagoon liquid begins before or when the maximum temporary wastewater storage level has been reached. The liquid level should not be pumped below the design treatment level to ensure an adequate volume for optimum anaerobic bacterial digestion. Some North Carolina farms use a solid set sprinkler system to irrigate lagoon effluent onto forage sprayfields. Sprinkler nozzles ranging from ¼-inch to ½- to ¾-inch can be used depending on the solids content of the effluent. The most common irrigation method is a hose reel and traveling gun-type sprinkler with a ¾- to 2-inch nozzle diameter for lagoon effluent and low solids liquid sludge (Barker, Lagoon Design…). Some large farms have also employed traveling overhead irrigation systems. Sludge removal is also an important consideration in lagoon maintenance and swine manure management. Even in lagoons with good rates of anaerobic bacterial digestion, significant amounts of sludge can accumulate (see Appendices A and D of the 2004 Cost and Returns Report). Because sludge has higher nutrient levels than lagoon liquids, excessive accumulation of sludge can significantly diminish the treatment capacity of
4

lagoons. Sludge can be mixed with lagoon liquid before being land-applied with an irrigation system. It can also be pumped into a manure slurry spreader for field spreading or dredged and hauled before being applied directly to cropland by spreaders equipped to handle slurries (Barker, Lagoon Design …). 2. Lagoon Sizing and Construction Construction of an anaerobic lagoon requires excavation of a pit according to National Resources Conversation Service (NRCS) specifications. The lagoon dimensions vary with farm size and type, and costs can vary significantly across soil types. Farms with sandy soils require a clay, bentonite, or plastic liner to prevent groundwater contamination. The liner can significantly increase costs. According to NRCS standard 359, a treatment lagoon is defined as an impoundment made by excavation or earthfill for biological treatment of animal or other agricultural waste. Its dimensions are determined by a minimum depth requirement and by the volume necessary for the number and type of pigs it will serve (see Appendix F). Sludge volume is designed to hold expected sludge accumulation over a five year period. The design treatment volume is a minimum amount of volume and depth necessary for the targeted degree of anaerobic treatment to occur. Sludge storage volume and treatment volume are derived from NRCS estimates of sludge accumulation, volatile solids loading rate, and average hydraulic retention time required for the targeted degree of anaerobic treatment (See Appendix A). Temporary storage volume is designed to be consistent with the planned pumping interval included in the manure management plan and the expected daily accumulation of manure, urine, spilled water, and precipitation less evaporation. The NRCS recommendation is that temporary volume should be sufficient to accommodate expected liquid accumulation for a period of 180 days. NRCS expresses sludge volume and minimum treatment volume in cubic feet per pound of steady state live weight (SSLW) while temporary storage is stated in gallons per day per head or sow (Table AL.1). Lagoons can take on a variety of shapes. This model assumes a rectangular trapezoid with a selected depth (NRCS specifications require depth to be greater than 6 feet (NRCSa,b)), a side slope of 1/3 (for every foot of depth the top length increases by 3 feet on each side; NRCS specification require this slope to be less than 1 (NRCSa,b))., and a selected ratio of base length (BL) to base width (BW) of γ (γ = base length/base width). The lagoon total manure volume (sum of design treatment volume, sludge storage, and temporary liquid volume) can be expressed by the following equation: (1) MV = γ{BW}2(D) + (1+γ)(3){D2}{BW} + (12)(D3). Once the total volume is determined from regulatory standards and lagoon depth D is selected, equation (2) can be solved for base width (BW), γ can be used to solve base length (BL), and top width and length can be found using side slope. Emergency storage depth is added to anaerobic lagoon design to accommodate accumulations during single large storms (the 25 year 24 hour storm) and during longer periods of heavy precipitation (heavy or chronic rainfall). Net precipitation less evaporation varies widely across years
5

and counties. For instance, the average precipitation and evaporation at a monitoring station in Duplin County for the period of 1994-2002 was 52.2 and 49.88 inches and the average net precipitation less evaporation was 2.3 inches indicating that most of the rainfall evaporated. Yearly precipitation minus evaporation measurements ranged from negative 10.5 inches in 2000 to positive 23.12 inches in 1999. Schwabe (2001) estimated that the average annual rainfall minus average annual evaporation for North Carolina is approximately 10 inches. NRCS standards recommend that the heavy or chronic rainfall factor must be at least equal to the 25-year, 24-hour storm depth. In eastern North Carolina 25-year, 24-hour storm is set at seven inches. Following Schwabe (2001), this model incorporates 36 inches of additional depth including 24 inches of emergency storage and 12 inches of structural freeboard. Including additional depth A, total lagoon volume V, including emergency storage (heavy rainfall and 25-year, 24-hour storm) and freeboard volumes can be expressed as: (2) V = γ{BW}2(D+A) + (1+γ)(3){[D+A]2}{BW} + (12)([D+A]3), where base width (BW) is previously determined from equation (1) and the new top widths and lengths (the length of each lagoon side after additional volume is added) are: (3) TTW = BW + (2)(3)[D+A] and (4) TTL = BL+(2)(3)[D+A]. Lagoons can take on a myriad of shapes. The model presented here assumes a rectangle trapezoid with an assumed depth of the sludge storage and treatment volume. NRCS specifications require depth to be greater than 6 feet (NRCSc). A side slope of 1/3 (for every foot of height the top length increases by 3 feet on each side) is assumed. NRCS specifications require this slope to be less than 1 (NRCSc) and a particular ratio of base length (BL) to base width (BW) of γ (γ = base length/base width). It is common for lagoons to take a rectangular shape. A reasonable assumption for γ is two. A lagoon perimeter is assumed. Roka assumes land within 20 feet of the lagoon is planted in grass and acts as a barrier between the lagoon and farm activities. This model assumes a barrier extending P feet from each side of the lagoon. The total area taken up by the lagoon (including the lagoon and grass perimeter) is (5) AREA=(TTL +2*P)(TTW+2*P) and the area planted in grass is (6) AREA IN GRASS = (TTL +2*P)(tTW+2*P) - (TTL)(TTW). Once the lagoon dimensions are specified, construction cost of the lagoon can be calculated.
6

3. Construction Costs of Lagoons 3.1 Excavation Costs Excavation cost is usually expressed in dollars per cubic yard. Cost estimates that we have obtained from AG/SF/PSF/Frontline experiments, literature and personal communications with industry experts suggest that per cubic yard costs vary from $1.00 to $3.50 (Roka; ED; Schwabe; Elkin; NRCSd). If the amount excavated is less than 1,000 cubic yards per cubic feet charges can be as high as $6 per cubic yard. We specify excavation price ($ / cubic yard) as a function of total excavation volume with the price decreasing at a decreasing rate as the volume increases (see Appendix A). We find that excavation prices have risen significantly with fuel prices in the last few years. The whole volume calculated in equation (1) is rarely excavated. Instead, making use of existing land features and using excavated soil to build a berm reduces the total volume to be excavated. Previous studies assumed 75% (Schwabe, Roka) or 80% (ED) excavated. Others cite 70% as an upper bound (Simmons). We assume that 70 percent of total lagoon volume is excavated. This value is expected to vary from one farm to the next. Multiplying lagoon volume by percent requiring excavation times the excavation price yields the total excavation costs. 3.2 Liner Costs 3.2.1 Clay Liner Cost Most lagoons now must have a liner, unless the soil is naturally high in clay and low in permeability. Three liner types-- clay, bentonite, and plastic-- are used in NC. When there is sufficient clay on-site, a clay liner is the least expensive to install. For some other sites, all clay or bentonite must be imported or a plastic liner must be installed. Usually, the only variable influencing the choice of liner is the cost. However, recent environmental concerns have induced some swine farms to install plastic liners on almost all new lagoons (Elkin). This model calculates costs of clay and plastic liners. Clay liners are constructed by surrounding the lagoon with a 1.5-foot thick clay wall, where the 1.5 foot measurement is made perpendicular to the lagoon wall’s slope. Clay liner costs are computed by calculating the volume of clay needed and multiplying it by a per-cubic yard charge. Clay volume needed for the lagoon is calculated as a difference between the total volume including liner minus volume without liner plus 15% to account for compacting of clay (Elkin). Multiplying this volume by the percent clay requiring importing and the per-cubic-yard charge yields the clay liner costs. Environmental Defense (ED) cites an estimate of $4.40 / yd3 but Elkin suggests it has recently trended toward the $5.00-$5.50 / yd3 range. Estimates seen in literature are as high as $6.00 / yd3 (NRCSe). Since clay liner costs are relatively high, lagoon construction costs will vary significantly across farms that do and do not require a clay liner. This model assumes that 50% of clay was imported at $5 per cubic yard. This charge is also expected to vary substantially from one farm to the next.
7

3.2.2 Plastic Liner Cost Plastic liner costs are specified on a per square foot basis, where the square feet refer to total lagoon ground area including base and sides. An extra 8% should be included for anchoring (Elkin). All things considered, the total surface-ground area to be covered with a plastic liner is: (7) PLASTIC LINER AREA
= [γ(BW)2 + (2+2γ)(BW)(101/2)(D+A) + 12(101/2)(D+A)2](1.08) The installation of the liner results in several costs. First is the fixed initialization fee that is about $4,000 per farm. If more than one lagoon is being lined on the same farm, this cost can be divided evenly among both lagoons. This cost will also decrease if multiple farms in the same general location are being lined. Then, there is a $0.32 per square foot charge that can be multiplied by the plastic liner area. (Liner material costs vary with material, thickness, natural gas prices, and other factors.) For each barn with a pit-recharge system, a pipe must penetrate the liner to dump wastewater into the lagoon, which costs $300 per penetration. The number of penetrations doubles for flush systems. There is also one penetration for a staff gauge. A non-slide surface is also needed so that if someone falls into the lagoon there is a non-slippery surface on which they can crawl out, which costs $1,380 per lagoon. Plastic liners are typically more expensive than clay liners, but the cost of a clay liner depends on its on-farm availability and percentage imported and price. Our model predicts that average clay liner cost is 70% of the cost of plastic liner if 100% of the clay is imported. 3.3 Return to Barns Recycled effluent from the lagoon is used to clean barns. The model assumes that the effluent is pumped with a 5-HP submersible pump which is capable of pumping 250 gallons per minute. Daily volume pumped depends on the evacuation system used. It is typically about 50% higher for barns equipped with the flush system. A charge of $1,000 per barn was added to account for cost of piping to barns from the lagoon. 3.4 Additional Costs Before a lagoon is built, the area must undergo a geological investigation which is priced on a per acre of lagoon basis. Also, the dikes must be disked, seeded, and mulched (DSM). The Environmental Protection Agency suggests that geological investigation costs $1,180 per acre (EPA) and DSM costs from the constructed wetlands site were $1,003 per acre. Other overhead costs are mobilization, bonds, engineering design, contractor services and startup, contractor overhead and profits, and contingencies. These costs are applied uniformly as a percentage of direct construction costs. The exact percents are shown in Appendix A. In the past, NRCS, the North Carolina Cooperative Extension Service, and other agencies may have provided without charge some of the services included in these overhead costs. We assume that these very significant costs are borne entirely by the farm owner unless otherwise specified.
8

3.5 Annualizing Construction Costs Let the expected economic (actually used) life of a lagoon in years be denoted as “T” and assume the rate of return on the next best alternative investment (or debt reduction) is “r”, which is often assumed to be 8 % (ED, Roka, Schwabe). Total construction costs can be converted to an annual cost by multiplying by the amortization or Capital Recovery Factor (CRF). (8) CRF = r/[1-(1+r)-T] (9) ANNUALIZED CONSTRUCTION COST = CRF*CONSTRUCTION COST
= { r/[1-(1+r)-T]]}*C In concurrence with the AG/SF/PSF/Frontline Farmers Agreements, maximum useful life of a technology (T) is 10 years. Substituting T=10 and r=0.08 into equation (8), CRF can be calculated equal to 0.149. 4. Cost Modeling 4.1. Overview of Cost Modeling for Baseline System (Tables AL.1-AL.22) Estimates of costs that would occur on standard (representative) North Carolina farms were calculated for the lagoon and sprayfield technology. These costs are presented in Tables AL.1-AL.5 for a 4,320-head feeder-to-finish facility using a flush system of manure removal. Tables AL.6-AL.10 present the costs associated with a standard North Carolina feeder-to-finish operation with a head capacity of 4,320 using a pit-recharge system of manure removal. A representative NC 8,800-head feeder-to-finish facility with a flush manure removal system is detailed in Tables AL.11-AL.15. The final standard NC farm that is described in this report is a 4,000-sow farrow-to-wean operation using a flush system of manure removal. Tables AL.16-AL.20 detail the costs associated with using the lagoon technology at the 4,000-sow facility. Tables AL.21 and AL.22 extrapolate costs of the lagoon technology to other representative farm sizes and types for all DWQ permitted farms and for Smithfield Foods/Premium Standard Farms owned operations only, respectively. All representative North Carolina farms were assumed to have clay-lined lagoons. Of the clay needed for the liner, 50% was assumed to be available on-site for a standard NC farm. For the anaerobic lagoon and sprayfield technology as modeled on all representative farms, phosphorus-based land applications were more costly than nitrogen-based land applications. Also, land application to forages was more costly than land application to row crops. Accordingly, regardless of type/size of farm modeled, nitrogen-based application to row crops was the least expensive application scenario, while phosphorus-based application to row crops was the most expensive application scenario. 4.2 Standardized Costs for Baseline System at a 4,320-Head Feeder-to-Finish Farm
with a Flush System (Tables AL.1-AL.5) Tables AL.1- AL.5 provide estimates of the cost of constructing and operating the baseline technology on a standard (representative) North Carolina farm. The
9

representative farm modeled is a 4,320-head feeder-to-finish facility using a flush system for manure removal. Table AL.1 provides total annualized and per unit ($ / 1,000 lbs. SSLW) costs for the standardized retrofit with lagoon and sprayfield technology. The standardized incremental (per unit) costs range from $82.47 (nitrogen-based application to row crops) to $92.96 (phosphorus-based application to row crops) for each of the four land application scenarios, with an average of $86.69. Tables AL.2-AL.4 summarize the costs associated with the baseline technology’s unit processes. Specifically, Table AL.2 details the costs of the lagoon, Table AL.3 shows the costs of a return system to the barns, and Table AL.4 summarizes the costs associated with each of four land application scenarios of lagoon effluent. Table AL.1 also summarizes the total costs associated with the standardized anaerobic lagoon and sprayfield technology for a 4,320-head finishing facility with a flush system (summing the unit processes reported in Tables AL.2-AL.3). Total construction costs are estimated at $200,039.01, while total operating costs are reported as $10,352.29. Total annualized costs before land application are estimated at $40,403.01 for this representative farm size and type. Table AL.5 provides an estimated mass balance of nutrients for this representative NC farm. The numbers in Table AL.5 are necessary in order to calculate the land application costs in Table AL.4 and, ultimately, the total annualized and per unit costs reported in Table AL.1. 4.3 Standardized Costs for Baseline System at a 4,320-Head Feeder-to-Finish Farm
with a Pit-Recharge System (Tables AL.6-AL.10) Tables AL.6- AL.10 provide estimates of the cost of constructing and operating the lagoon and sprayfield technology on a standard (representative) 4,320-head feeder-to-finish farm in North Carolina with a pit-recharge system for manure removal. The type of manure removal system used is the only difference between the farm modeled in Tables AL.6-AL.10 versus the one modeled in Tables AL.1-AL.5. Table AL.6 provides total annualized and per unit ($ / 1,000 lbs. SSLW) costs for the standardized lagoon technology. The standardized incremental (per unit) costs range from $82.40 (nitrogen-based application to row crops) to $92.88 (phosphorus-based application to forages) for each of the four land application scenarios, with an average incremental cost of $86.61. Using a pit-recharge system of manure removal is about $0.08 / 1,000 lbs. SSLW less costly than using a flush system for the baseline technology on a standardized 4,320-head finishing farm. This small cost savings is realized by lower electrical power costs for the pit-recharge return to barns system. Tables AL.7-AL.9 detail the costs of individual unit processes in this standardized model. The set of unit processes and components are identical to those in Tables AL.2-AL.4. Changes in recycled liquid volume in the pit-recharge system versus the flush system cause some cost estimates to change between the two sets of tables. Table AL.6 summarizes the total costs associated with the standardized baseline technology for a 4,320-head finishing facility with a pit-recharge system (summing the unit processes detailed in Tables AL.7-AL.8). Total construction costs are estimated at $200,039.01, while total operating costs are reported as $10,309.45. Total annualized costs before land application are estimated at $40,360.17 for this representative farm size and type. Table AL.10 provides an estimated mass balance of nutrients for the representative farm modeled in these tables.
10

4.4 Standardized Costs for Baseline System at an 8,800-Head Feeder-to-Finish Farm with Flush System (Tables AL.11-AL.15)
Tables AL.11- AL.15 provide estimates of the cost of constructing and operating the baseline technology on a standard (representative) 8,800-head feeder-to-finish farm in North Carolina with a flush system for manure removal. Table AL.11 provides total annualized and per unit ($ / 1,000 lbs. SSLW) costs for the standardized lagoon and sprayfield technology. The standardized incremental (per unit) costs for the 8,800-head finishing facility range from $67.15 (nitrogen-based application to row crops) to $76.94 (phosphorus-based application to forages) across the four scenarios, with an average incremental cost of $70.85. Compared to the 4,320-head finishing facility using a flush system, the average incremental costs of this 8,800-head farm are about 18 % less costly. Based on this finding, the model suggests that economies of scale are present for the baseline technology. Specifically, significant economies of scale are present in both the lagoon and return to barns system. Tables AL.12-AL.14 detail the costs of individual unit processes in this standardized model. The set of unit processes and components are identical to those in Tables AL.2-AL.4 (as well as Tables AL.7-AL.9). Table AL.11 summarizes the total costs associated with the standardized lagoon technology for an 8,800-head finishing facility using a flush system of manure removal. Total construction costs are estimated at $330,776.59, while total operating costs are reported as $19,702.63. Total annualized costs before land application are estimated at $69,237.10 for this representative farm size and type. While these total construction costs are higher than in the standardized 4,320-head model, the per unit capacity costs are lower. That is because the 8,800-head facility contains 1,188,000 pounds of steady-state live weight (SSLW) as compared to the 583,200 pounds of SSLW housed in the 4,320-head facility. Table AL.15 provides an estimated mass balance of nutrients for the representative farm modeled in these tables. 4.5 Standardized Costs for Baseline System at a 4,000-Sow Farrow-to-Wean Farm
with Flush System (Tables AL.16-AL.20) Tables AL.16- AL.20 provide estimates intended to reflect the construction and operating costs of retrofitting the lagoon technology onto a standard (representative) North Carolina farm. As seen in Table AL.16’s assumptions, the representative farm chosen is a 4,000-sow farrow-to-wean operation using a flush system for manure removal. This representative farm contains 1,732,000 pounds of SSLW—the largest of any standard farm modeled for the lagoon and sprayfield technology. Table AL.16 also provides total annualized and per unit ($ / 1,000 lbs. SSLW) costs for the standardized lagoon technology. The standardized incremental (per unit) costs range from $50.46 (nitrogen-based application to row crops) to $61.37 (phosphorus-based application to forages) / 1,000 lbs. SSLW / year across the four land application scenarios. The average incremental cost for this model is $54.43. Tables AL.17-AL.19 detail the costs of individual unit processes in this standardized model. The set of unit processes and components are identical to those seen in Tables AL.12-AL.14 (as well as Tables AL.2-AL.4 and AL.7-AL.9)—only some of the costs will change between the two sets of tables. Table AL.16 summarizes the total costs associated with the standardized lagoon technology for a 4,000-sow farrow-to-wean operation (summing the unit processes
11

described in Tables AL.17-AL.18). Total construction costs are estimated at $339,721.14, while total operating costs are reported as $24,724.83. Total annualized costs before land application are estimated at $75,592.31 for this representative farm size and type. Table AL.20 provides an estimated mass balance of nutrients for the 4,000-sow farrow-to-wean operation modeled for the lagoon technology. 4.6. Extrapolation of Lagoon and Sprayfield System Per Unit Costs to Other Farm
Types and Sizes (Tables AL.21-AL.22) Table AL.21 summarizes per unit costs ($ / 1,000 lbs. SSLW) of the lagoon technology for each of the 25 size of farm / type of operation combinations. This table uses the representative farm size for a permitted North Carolina farm within a size / type combination. Incremental (per unit) costs are shown for both pit-recharge and flush systems and costs in Table AL.21 assume a nitrogen-based land application to forages is utilized. Table AL.22 is analogous to Table AL.21, but uses Smithfield Foods/Premium Standard Farms (SF/PSF) owned operations only. Incremental costs are again shown for both pit-recharge and flush systems. To calculate the incremental costs seen in Table AL.22, the representative SF/PSF farm size is used for each size / type combination. Like in Table AL.21, the costs in Table AL.22 assume that a nitrogen-based land application to forages is chosen. As seen in Tables AL.21 and AL.22, per unit costs will decrease as the size of the farm increases as the lagoon technology demonstrates economies of scale for all types of operations. Both the lagoon and the return to barns system contribute significantly to the economies of scale demonstrated by this technology. 4.7 Cost of Lagoon and Sprayfield System as Built in 1992 In this section, an alternative cost model is presented which approximates the cost of constructing and operating a lagoon-sprayfield system in early nineties. The 4,320-head finishing operation was selected to illustrate the difference between the cost of operation in 2004 and 1992. The difference between important cost assumptions in 2004 and 1992 is presented in Table AL.22. The overall increase in cost is mainly due to the increase in excavation cost (increase from $1 per cubic yard to $2.49 per cubic yard from 1992 to 2004). Table AL.23 details cost differences for individual lagoon-sprayfield components. The model predicts an annualized cost of $38.01 per 1,000 lbs. of SSLW in 1992, while the cost increased to $86.81 per 1,000 lbs. of SSLW in 2004. 5. Summary The primary function of the lagoon system physical model and costs and returns model is to establish the value of benefits that alternative manure management systems might create. Examples of benefits may include reduced liquid volume to be irrigated, reduced sludge accumulation and subsequent removal cost, and reduced nutrient accumulation to be land applied resulting in a smaller area in sprayfield. Most of the costs of the lagoon and spray field system are fixed costs and thus ‘sunk’ costs on existing farms in North Carolina. Note that the assumed overhead costs in the model added significantly to the overall construction cost. Note also that the prices assumed for 2004 are significantly higher than those reported in the past. Finally, note that actual costs for building and operating a similar system today will vary widely from farm to farm and through time.
12

References Barker, James C. Design Criteria For Swine Waste Flushing Systems. North Carolina Cooperative Extension Service. Publication Number: EBAE 080-81. March, 1996. Barker, James C. Lagoon Design and Management For Livestock Waste and Storage. North Carolina Cooperative Extension Service. Publication Number: EBAE 103-83. March, 1996. Barker, James C. Swine Production Facility Manure Management: Pit Recharge- Lagoon Treatment. North Carolina Cooperative Extension Service. Publication Number: EBAE 128-88. March, 1996. Barker, James C. Swine Production Facility Manure Management: Underfloor Flush- Lagoon Treatment. North Carolina Cooperative Extension Service. Publication Number: EBAE 129-88. March, 1996. Barker, James C., L. Bynum Driggers, and Ronald E. Sneed. Design Criteria For Swine Waste Flushing Systems. Noth Carolina Cooperative Extension Service. Publication Number: EBAE 080-81. March, 1996. (ED) Environmental Defense. 2001. Personal Communication. May, 2001. (EPA) United States Environmental Protection Agency. Manual. Constructed Wetlands Treatment of Municipal Wastewaters. Office of Research and Development. EPA/625/R-99/010. September 2000. Available at http://www.epa.gov/ORD.NRMRL. Elkin, Dave. Murphy-Brown Farms. Director of Engineering. Personal Communication. 2002. Green, Jr., J.T., and J.P. Mueller. Managing Pastures Receiving Swine Wastes. Carolina Cooperative Extension Service. Publication Number: WQWM-89. March, 1996. (NRCSa) National Resource Conservation Service. Natural Resource Conservation Service Practice Standard. Waste Utilization (Acre) Code 633. Made available by North Carolina National Resource Conservation Engineer Henry Gibson. (NRCSb) National Resource Conservation Service. Natural Resource Conservation Service Practice Standard. Waste Treatment Lagoon Practice Standard Code 359. Available at http://www.nc.nrcs.usda.gov/Programs/Standards/359.pdf. (NRCSc) National Resource Conservation Service. Agricultural Waste Management System Component Design. Part 651. Chapter Ten. (NRCSd) National Resource Conservation Service. North Carolina Agricultural Cost Share Program. Average Cost for Program Years 2003-2005.
13

North Carolina Agricultural Statistics. Issued by: North Carolina Department of Agriculture and Consumer Services and National Agricultural Statistics Service. 2003. Roka, Fritz Michael. “An Economic Analysis Of Joint Production Relationships Between Pork And Swine Manure: Should Manure Be Flushed Or Bottled?” Dissertation. North Carolina State University. 1993. Schwabe, A. Kurt. “Nonpoint Source Pollution, Uniform Control Strategies, and the Neuse River Basin.” Review of Agricultural Economics. 23:2(Fall/Winter 2001a):333-351. Schwabe, A. Kurt. Assistant Professor of Resource and Environmental Economics. June 2001b. Personal Communication. Simmons, Gus. Agricultural Engineer. Cavanaugh and Associates. July, 2001. These cites represent opinions of an engineer, not official statements from Cavanaugh and Associates. Personal Communication. Zublena and Barker. Soil Facts. Nutrient Removal by Crops in North Carolina. Available at: http://www.soil.ncsu.edu/publications/Soilfacts/AG-439-16.
14

Table AL.1: Lagoon and Sprayfield Assumptions and Total Annualized Costs—Standardized Quantities and Prices (4,320-Head Feeder-Finish with Flush System)
Number of Animals 4,320 Type of Operation Feeder-Finish Barn Cleaning System Flush System Liner Clay Clay available on Farm 50.00% Annualized Cost ($ / Year) Forages Row Crops Total Annualized Cost If Nitrogen-Based Application $ 50,671.12 $ 48,098.47 If Phosphorus-Based Application $ 54,213.03 $ 49,242.92 Per Unit Cost ($ / 1,000 lbs. of SSLW) Forages Row Crops Total Annualized Cost per Unit If Nitrogen-Based Application $ 86.88 $ 82.47 If Phosphorus-Based Application $ 92.96 $ 84.44
Note: Daily volume discharged from barns is 33,505 gallons / day including recharge liquid. SSLW equals 583,200 pounds.
TOTAL CONSTRUCTION COST $ 200,039.01 TOTAL OPERATING COST INCLUDING ROYALTIES $ 10,352.29 TOTAL ANNUALIZED COSTS WITHOUT LAND APPLICATION $ 40,403.01
15

Table AL.2: 2004 Lagoon Costs—Standardized Quantities and Prices (4,320-Head Feeder-Finish with Flush System)
Component Total Cost Annualized Cost Lagoon Excavation $ 104,338.82 $ 15,549.56 Liner $ 22,710.94 $ 3,384.60 Geological Investigation $ 3,327.29 $ 495.86 Disc, Seed, and Mulch Dikes $ 3,412.60 $ 508.58 Contractor & Engineering Services & Overhead $ 57,663.34 $ 8,593.54 Total Construction Costs $ 191,453.01 $ 28,532.14 Annual Opportunity Cost of Land $ 204.76 Sludge Removal Cost $ 6,550.13 Maintenance Cost $ 2,541.00 Property Taxes $ 679.66 Total Annual Operating Costs $ 9,975.54 TOTAL ANNUALIZED COST OF LAGOON $ 38,507.68
Table AL.3: Baseline Return to Barns Costs—Standardized Quantities and Prices
(4,320-Head Feeder-Finish with Flush System) Component Total Cost Annualized Cost
Piping $ 5,000.00 $ 745.15 Pumps $ 1,000.00 $ 388.03 Contractor & Engineering Services & Overhead $ 2,586.00 $ 385.39 Total Construction Cost $ 8,586.00 $ 1,518.57 Electric Power Cost $ 196.27 Maintenance Cost $ 150.00 Property Taxes $ 30.48 Total Operating Costs $ 376.75 TOTAL ANNUALIZED COST OF RETURN TO BARNS $ 1,895.33
16

17
Table AL.4: Baseline 2004 Sprayfield Costs for Four Land Application Scenarios—Standardized Quantities and Prices (4,320-Head Feeder-Finish with Flush System)
Annual Cost of Applying Lagoon Effluent Forages Row Crops If Nitrogen-Based Application $ 10,268.12 $ 7,695.46 If Phosphorus-Based Application $ 13,810.03 $ 8,839.91 Acres Need for Assimilation Forages Row Crops If Nitrogen-Based Application 33.24 107.74 If Phosphorus-Based Application 57.48 157.12 Opportunity Cost of Land Forages Row Crops If Nitrogen-Based Application $ 1,994.48 - If Phosphorus-Based Application $ 3,448.70 - Irrigation Costs Forages Row Crops If Nitrogen-Based Application $ 8,273.63 $ 9,992.29 If Phosphorus-Based Application $ 8,320.90 $ 12,072.15 Savings From Not Having To Buy Fertilizer Forages Row Crops If Nitrogen-Based Application - $ (2,296.83)If Phosphorus-Based Application - $ (3,232.24)Extra Fertilizer Purchase Costs Forages Row Crops If Nitrogen-Based Application - - If Phosphorus-Based Application $ 2,040.43 - Note: 4,446,995 gallons / year of effluent modeled to be land applied Table AL.5: Baseline Summary and Mass Balance of Generated and Land Applied
Nutrients—Standardized Quantities and Prices (4,320-Head Feeder-Finish with Flush System)
Nutrient Balance
Nitrogen (lbs. / year)
Phosphorus (lbs. / year)
Potassium (lbs. / year)
Generated At Barn 87,436.80 25,056.00 42,984.00 Applied to Land in Lagoon Effluent 19,299.96 2,846.08 21,656.87 Accumulated in Sludge 10,196.67 9,807.09 1,623.63 Nutrients Unaccounted For 57,940.17 12,402.83 19,703.50 Percent Removed in Lagoon Effluent Application 22.07 % 11.36 % 50.38 % Percent Unaccounted For 66.27 % 49.50 % 45.84 %

Table AL.6: Lagoon and Spray Field Assumptions and Total Annualized Costs—Standardized Quantities and Prices (4,320-Head Feeder-Finish with Pit-Recharge System)
Number of Animals 4,320 Type of Operation Feeder-Finish Barn Cleaning System Pit-Recharge System Liner Clay Clay available on Farm 50.00% Annualized Cost ($ / Year) Forages Row Crops Total Annualized Cost If Nitrogen-Based Application $ 50,628.29 $ 48,055.63 If Phosphorus-Based Application $ 54,170.19 $ 49,200.08 Per Unit Cost ($ / 1,000 lbs. of SSLW) Forages Row Crops Total Annualized Cost per Unit If Nitrogen-Based Application $ 86.81 $ 82.40 If Phosphorus-Based Application $ 92.88 $ 84.36
Note: Daily volume discharged from barns is 28,361 gallons / day including recharge liquid. SSLW equals 583,200 pounds.
TOTAL CONSTRUCTION COST $ 200,039.01 TOTAL OPERATING COST INCLUDING ROYALTIES $ 10,309.45 TOTAL ANNUALIZED COSTS WITHOUT LAND APPLICATION $ 40,360.17
18

Table AL.7: 2004 Lagoon Costs—Standardized Quantities and Prices (4,320-Head Feeder-Finish with Pit-Recharge System)
Component Total Cost Annualized Cost Lagoon Excavation $ 104,338.82 $ 15,549.56 Liner $ 22,710.94 $ 3,384.60 Geological Investigation $ 3,327.29 $ 495.86 Disc, Seed, and Mulch Dikes $ 3,412.60 $ 508.58 Contractor & Engineering Services & Overhead $ 57,663.34 $ 8,593.54 Total Construction Costs $ 191,453.01 $ 28,532.14 Annual Opportunity Cost of Land $ 204.76 Sludge Removal Cost $ 6,550.13 Maintenance Cost $ 2,541.00 Property Taxes $ 679.66 Total Annual Operating Costs $ 9,975.54 TOTAL ANNUALIZED COST OF LAGOON $ 38,507.68
Table AL.8: Baseline Return to Barns Costs—Standardized Quantities and Prices
(4,320-Head Feeder-Finish with Pit-Recharge System) Component Total Cost Annualized Cost
Piping $ 5,000.00 $ 745.15 Pumps $ 1,000.00 $ 388.03 Contractor & Engineering Services & Overhead $ 2,586.00 $ 385.39 Total Construction Cost $ 8,586.00 $ 1,518.57 Electric Power Cost $ 153.44 Maintenance Cost $ 150.00 Property Taxes $ 30.48 Total Operating Costs $ 333.92 TOTAL ANNUALIZED COST OF RETURN TO BARNS $ 1,852.49
19

Table AL.9: Baseline 2004 Sprayfield Costs for Four Land Application Scenarios—Standardized Quantities and Prices (4,320-Head Feeder-Finish with Pit-Recharge System)
Annual Cost of Applying Lagoon Effluent Forages Row Crops If Nitrogen-Based Application $ 10,268.12 $ 7,695.46 If Phosphorus-Based Application $ 13,810.03 $ 8,839.91 Acres Need for Assimilation Forages Row Crops If Nitrogen-Based Application 33.24 107.74 If Phosphorus-Based Application 57.48 157.12 Opportunity Cost of Land Forages Row Crops If Nitrogen-Based Application $ 1,994.48 - If Phosphorus-Based Application $ 3,448.70 - Irrigation Costs Forages Row Crops If Nitrogen-Based Application $ 8,273.63 $ 9,992.29 If Phosphorus-Based Application $ 8,320.90 $ 12,072.15 Savings From Not Having To Buy Fertilizer Forages Row Crops If Nitrogen-Based Application - $ (2,296.83)If Phosphorus-Based Application - $ (3,232.24)Extra Fertilizer Purchase Costs Forages Row Crops If Nitrogen-Based Application - - If Phosphorus-Based Application $ 2,040.43 - Note: 4,446,995 gallons / year of effluent modeled to be land applied Table AL.10: Baseline Summary and Mass Balance of Generated and Land Applied
Nutrients—Standardized Quantities and Prices (4,320-Head Feeder-Finish with Pit-Recharge System)
Nutrient Balance
Nitrogen (lbs. / year)
Phosphorus (lbs. / year)
Potassium (lbs. / year)
Generated At Barn 87,436.80 25,056.00 42,984.00 Applied to Land in Lagoon Effluent 19,299.96 2,846.08 21,656.87 Accumulated in Sludge 10,196.67 9,807.09 1,623.63 Nutrients Unaccounted For 57,940.17 12,402.83 19,703.50 Percent Removed in Lagoon Effluent Application 22.07 % 11.36 % 50.38 % Percent Unaccounted For 66.27 % 49.50 % 45.84 %
20

Table AL.11: 2004 Assumptions and Total Annualized Costs—Standardized Quantities and Prices (8,800-Head Feeder-Finish with Flush System)
Number of Animals 8,800 Type of Operation Feeder-Finish Barn Cleaning System Flush System Liner Clay Clay available on Farm 50.00% Annualized Cost ($ / Year) Forages Row Crops Total Annualized Cost If Nitrogen-Based Application $ 83,136.03 $ 79,775.69 If Phosphorus-Based Application $ 91,403.71 $ 82,343.02 Per Unit Cost ($ / 1,000 lbs. of SSLW) Forages Row Crops Total Annualized Cost per Unit If Nitrogen-Based Application $ 69.98 $ 67.15 If Phosphorus-Based Application $ 76.94 $ 69.31
Note: Daily volume discharged from barns is 68,251 gallons / day including recharge liquid. SSLW equals 1,188,000 pounds.
TOTAL CONSTRUCTION COST $ 330,776.59 TOTAL OPERATING COST INCLUDING ROYALTIES $ 19,702.63 TOTAL ANNUALIZED COSTS WITHOUT LAND APPLICATION $ 69,237.10
21

Table AL.12: 2004 Lagoon Costs—Standardized Quantities and Prices (8,800-Head Feeder-Finish with Flush System)
Component Total Cost Annualized Cost Lagoon Excavation $ 163,580.69 $ 24,378.35 Liner $ 43,786.61 $ 6,525.50 Geological Investigation $ 6,310.77 $ 940.49 Disc, Seed, and Mulch Dikes $ 6,472.59 $ 964.61 Contractor & Engineering Services & Overhead $ 94,884.93 $ 14,140.65 Total Construction Costs $ 315,035.59 $ 46,949.59 Annual Opportunity Cost of Land $ 388.36 Sludge Removal Cost $ 13,342.85 Maintenance Cost $ 4,147.35 Property Taxes $ 1,118.38 Total Annual Operating Costs $ 18,996.93 TOTAL ANNUALIZED COST OF LAGOON $ 65,946.52
Table AL.13: Baseline 2004 Return to Barns Costs—Standardized Quantities and
Prices (8,800-Head Feeder-Finish with Flush System) Component Total Cost Annualized Cost
Piping $ 10,000.00 $ 1,490.29 Pumps $ 1,000.00 $ 388.03 Contractor & Engineering Services & Overhead $ 4,741.00 $ 706.55 Total Construction Cost $ 15,741.00 $ 2,584.88 Electric Power Cost $ 399.82 Maintenance Cost $ 250.00 Property Taxes $ 55.88 Total Operating Costs $ 705.70 TOTAL ANNUALIZED COST OF RETURN TO BARNS $ 3,290.58
22

Table AL.14: Baseline 2004 Sprayfield Costs for Four Land Application Scenarios—Standardized Quantities and Prices (8,800-Head Feeder-Finish with Flush System)
Annual Cost of Applying Lagoon Effluent Forages Row Crops If Nitrogen-Based Application $ 13,898.93 $ 10,538.60 If Phosphorus-Based Application $ 22,166.61 $ 13,105.92 Acres Need for Assimilation Forages Row Crops If Nitrogen-Based Application 67.10 217.48 If Phosphorus-Based Application 116.03 317.17 Opportunity Cost of Land Forages Row Crops If Nitrogen-Based Application $ 4,026.17 - If Phosphorus-Based Application $ 6,961.72 - Irrigation Costs Forages Row Crops If Nitrogen-Based Application $ 9,872.76 $ 15,175.11 If Phosphorus-Based Application $ 11,085.98 $ 19,630.70 Savings From Not Having To Buy Fertilizer Forages Row Crops If Nitrogen-Based Application - $ (4,636.51)If Phosphorus-Based Application - $ (6,524.78)Extra Fertilizer Purchase Costs Forages Row Crops If Nitrogen-Based Application - - If Phosphorus-Based Application $ 4,118.92 - Note: 8,976,943 gallons / year of effluent modeled to be land applied Table AL.15: Baseline Summary and Mass Balance of Generated and Land Applied
Nutrients—Standardized Quantities and Prices (8,800-Head Feeder-Finish with Flush System)
Nutrient Balance
Nitrogen (lbs. / year)
Phosphorus (lbs. / year)
Potassium (lbs. / year)
Generated At Barn 178,112.00 51,040.00 87,560.00 Applied to Land in Lagoon Effluent 38,959.93 5,745.24 43,717.71 Accumulated in Sludge 20,770.99 19,977.41 3,307.39 Nutrients Unaccounted For 118,381.08 25,317.35 40,534.90 Percent Removed in Lagoon Effluent Application 21.87 % 11.26 % 49.93 % Percent Unaccounted For 66.46 % 49.60 % 46.29 %
23

Table AL.16: 2004 Assumptions and Total Annualized Costs—Standardized Quantities and Prices (4,000-Sow Farrow-Wean with Flush System)
Number of Animals 4,000 Type of Operation Farrow-Wean Barn Cleaning System Flush System Liner Clay Clay available on Farm 50.00% Annualized Cost ($ / Year) Forages Row Crops Total Annualized Cost If Nitrogen-Based Application $ 91,358.96 $ 87,395.48 If Phosphorus-Based Application $ 106,284.47 $ 92,001.67 Per Unit Cost ($ / 1,000 lbs. of SSLW) Forages Row Crops Total Annualized Cost per Unit If Nitrogen-Based Application $ 52.75 $ 50.46 If Phosphorus-Based Application $ 61.37 $ 53.12
Note: Daily volume discharged from barns is 158,582 gallons / day including recharge liquid. SSLW equals 1,732,000 pounds.
TOTAL CONSTRUCTION COST $ 339,721.14 TOTAL OPERATING COST INCLUDING ROYALTIES $ 24,724.83 TOTAL ANNUALIZED COSTS WITHOUT LAND APPLICATION $ 75,592.31
24

Table AL.17: 2004 Lagoon Costs—Standardized Quantities and Prices (4,000-Sow Farrow-Wean with Flush System)
Component Total Cost Annualized Cost Lagoon Excavation $ 169,755.17 $ 25,298.53 Liner $ 46,244.94 $ 6,891.86 Geological Investigation $ 6,615.74 $ 985.94 Disc, Seed, and Mulch Dikes $ 6,785.37 $ 1,011.22 Contractor & Engineering Services & Overhead $ 98,871.92 $ 14,734.83 Total Construction Costs $ 328,273.14 $ 48,922.38 Annual Opportunity Cost of Land $ 407.12 Sludge Removal Cost $ 17,520.91 Maintenance Cost $ 4,320.00 Property Taxes $ 1,165.37 Total Annual Operating Costs $ 23,413.41 TOTAL ANNUALIZED COST OF LAGOON $ 72,335.79
Table AL.18: Baseline Return to Barns Costs—Standardized Quantities and Prices
(4,000-Sow Farrow-Wean with Flush System) Component Total Cost Annualized Cost
Piping $ 7,000.00 $ 1,043.21 Pumps $ 1,000.00 $ 388.03 Contractor & Engineering Services & Overhead $ 3,448.00 $ 513.85 Total Construction Cost $ 11,448.00 $ 1,945.09 Electric Power Cost $ 1,080.78 Maintenance Cost $ 190.00 Property Taxes $ 40.64 Total Operating Costs $ 1,311.43 TOTAL ANNUALIZED COST OF RETURN TO BARNS $ 3,256.52
25

Table AL.19: Baseline 2004 Sprayfield Costs for Four Land Application Scenarios—Standardized Quantities and Prices (4,000-Sow Farrow-Wean with Flush System)
Annual Cost of Applying Lagoon Effluent Forages Row Crops If Nitrogen-Based Application $ 15,766.65 $ 11,803.18 If Phosphorus-Based Application $ 30,692.17 $ 16,409.36 Acres Need for Assimilation Forages Row Crops If Nitrogen-Based Application 81.71 264.84 If Phosphorus-Based Application 160.10 437.65 Opportunity Cost of Land Forages Row Crops If Nitrogen-Based Application $ 4,902.84 - If Phosphorus-Based Application $ 9,606.06 - Irrigation Costs Forages Row Crops If Nitrogen-Based Application $ 10,863.81 $ 17,504.35 If Phosphorus-Based Application $ 13,144.16 $ 25,311.72 Savings From Not Having To Buy Fertilizer Forages Row Crops If Nitrogen-Based Application - $ (5,701.18)If Phosphorus-Based Application - $ (8,902.36)Extra Fertilizer Purchase Costs Forages Row Crops If Nitrogen-Based Application - - If Phosphorus-Based Application $ 7,941.96 - Note: 12,196,173 gallons / year of effluent modeled to be land applied Table AL.20: Baseline Summary and Mass Balance of Generated and Land Applied
Nutrients—Standardized Quantities and Prices (4,000-Sow Farrow-Wean with Flush System)
Nutrient Balance
Nitrogen (lbs. / year)
Phosphorus (lbs. / year)
Potassium (lbs. / year)
Generated At Barn 117,000.00 37,040.00 77,000.00 Applied to Land in Lagoon Effluent 47,443.11 7,927.51 43,784.26 Accumulated in Sludge 21,334.56 20,779.20 3,307.20 Nutrients Unaccounted For 48,222.33 8,333.29 29,908.54 Percent Removed in Lagoon Effluent Application 40.55 % 21.40 % 56.86 % Percent Unaccounted For 41.22 % 22.50 % 38.84 %
26

Table AL.21: $ / 1,000 Pounds of Steady-State Live Weight (SSLW) for DWQ Permitted Representative Type of Operation / Size of Farm Combinations—2004 Anaerobic Lagoon and Sprayfield System
Size of Farm (1,000 pounds SSLW)
0-500 500-1,000 1,000-1,500
1,500-2,000
> 2,000
Type of Operation Farrow-wean Rep. # of sows 752 1,540 2,400 4,000 6,000 Pit-recharge system $88.84 $70.31 $61.62 $52.67 $45.70 Flush system $88.91 $70.38 $61.69 $52.75 $45.77 Farrow-feeder Rep. # of sows 500 1,200 2,000 3,600 5,500 Pit-recharge system $96.64 $71.71 $61.75 $51.16 $44.09 Flush system $96.94 $72.02 $62.06 $51.60 $44.49 Farrow-finish Rep. # of sows 150 500 1,000 1,200 2,000 Pit-recharge system $120.26 $80.67 $64.50 $60.34 $49.92 Flush system $120.42 $80.83 $64.66 $60.50 $50.17 Wean-feeder Rep. head capacity 3,840 20,000 N/A N/A N/A Pit-recharge system $159.13 $86.53 N/A N/A N/A Flush system $160.89 $88.72 N/A N/A N/A Feeder-finish Rep. head capacity 2,448 5,280 8,800 12,240 17,136 Pit-recharge system $103.12 $81.85 $69.91 $62.27 $54.79 Flush system $103.19 $81.92 $69.98 $62.35 $54.87
27
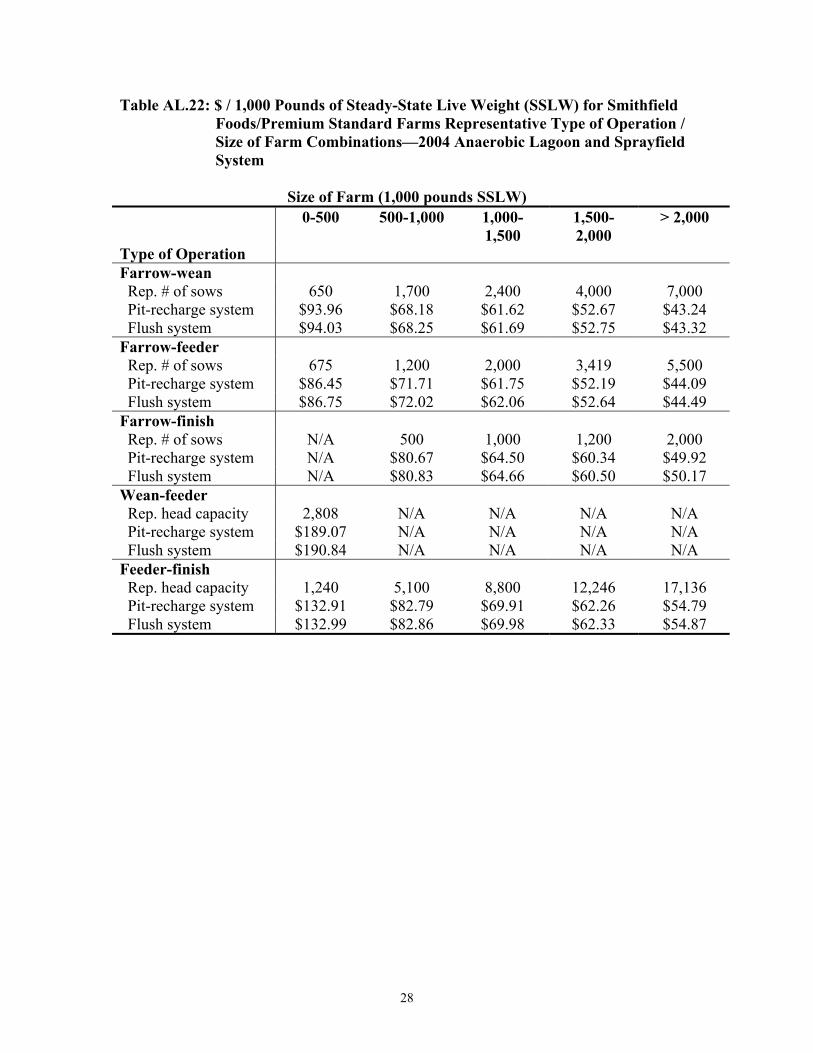
Table AL.22: $ / 1,000 Pounds of Steady-State Live Weight (SSLW) for Smithfield Foods/Premium Standard Farms Representative Type of Operation / Size of Farm Combinations—2004 Anaerobic Lagoon and Sprayfield System
Size of Farm (1,000 pounds SSLW)
0-500 500-1,000 1,000-1,500
1,500-2,000
> 2,000
Type of Operation Farrow-wean Rep. # of sows 650 1,700 2,400 4,000 7,000 Pit-recharge system $93.96 $68.18 $61.62 $52.67 $43.24 Flush system $94.03 $68.25 $61.69 $52.75 $43.32 Farrow-feeder Rep. # of sows 675 1,200 2,000 3,419 5,500 Pit-recharge system $86.45 $71.71 $61.75 $52.19 $44.09 Flush system $86.75 $72.02 $62.06 $52.64 $44.49 Farrow-finish Rep. # of sows N/A 500 1,000 1,200 2,000 Pit-recharge system N/A $80.67 $64.50 $60.34 $49.92 Flush system N/A $80.83 $64.66 $60.50 $50.17 Wean-feeder Rep. head capacity 2,808 N/A N/A N/A N/A Pit-recharge system $189.07 N/A N/A N/A N/A Flush system $190.84 N/A N/A N/A N/A Feeder-finish Rep. head capacity 1,240 5,100 8,800 12,246 17,136 Pit-recharge system $132.91 $82.79 $69.91 $62.26 $54.79 Flush system $132.99 $82.86 $69.98 $62.33 $54.87
28

29
Table AL.22: Changes in Selected Assumptions between 2004 and 1992 Assumption 2004 Estimate 1992 Estimate Unit Excavation $2.59 $1.00 $ / Cubic Yard Clay $5.00 $3.50 $ / Cubic Yard Overhead 43.1 20.0 %
Sludge Accumulation 50% of 2004
Estimate Expected Economic Life 10 15 Years Table AL.23. Comparison of Lagoon-Sprayfield System Cost between 2004 and
1992 (4,320-Head Feeder – Finish, Pit-Recharge System, Nitrogen-Based Application to Forages)
2004 Estimate
(Annualized over 10 Years) 1992 Estimate
(Annualized over 15 Years) Total Annualized Cost ($ / 1,000 lbs. of SSLW) $86.81 $38.80 Lagoon Excavation Cost $15,549.56 $4,360.89 Liner $3,384.60 $1,803.51 Miscellaneous Construction $1,004.44 $601.09 Sludge Removal Cost $6,550.13 $3,595.16 Other Operating and Maintenance Cost $3,425.54 $,1506.73 Return to Barns Piping and Pumps $1,105.50 $720.99 Operating Cost $333.92 $287.45 Sprayfield Land Application of Effluent $10,268.12 $8,292.96 Overhead Contractor and Engineering Services and Overhead
$8,978.93
$1,460.12