technology readiness level approach for the … valentin heller_files/heller_technology... ·...
TRANSCRIPT

1
Technology Readiness Level approach for
the development of WECs
Fluid Mechanics Section, Department of Civil and Environmental Engineering
Dr Valentin Heller
4th CoastLab Teaching School, Wave and Tidal Energy, Porto, 17-20th January 2012
Content
• Introduction
• Overview TRL approach
• Funding
• Phases 1-3 in laboratory
• Phases 3-5 at sea
• Conclusions
Lecture gives overview of TRL approach and covers some selected to-
pics of wave energy conversion at various levels following Heller (2012)
2

2
Introduction
The TRL approach was established by the US space agency NASA and is now widely
used by many engineering research establishments to describe the advancement in
the development of a technology
The TRL approach was proposed to provide a structured 5 main test phase program-
me to develop buoyant type wave energy converters by HMRC (2003) with the aim to
mitigate technical and fiscal risk
This 5 phase structured programme is now adopted in many publications (e.g. Holmes
2009, IEE 2009, Heller 2012)
Even though the TRL approach is restricted to buoyant type WECs, it may provide a
good base to classify the advancement of all WEC devices
What is a Technology Readiness Level TRL?
3
Overview TRL approach
Short version from Holmes (2009), for long version see HMRC (2003)
Overview 5 test phases of TRL for WECs
4
• Some devices may be able to exclude a phase
• Some devices had to go back to a lower phase (expensive and time consuming)
• It addresses technical aspects and excludes others such as resource investigation etc.

3
Overview TRL approach
Phase 1
Validation model
• Initial proof of concept at scale 1:25-100
• Simple idealised models with model PTO tested in regular waves (concept)
• Performance and response are then tested in irregular waves (generic spectra,
performance) and optimised with parameter variations (optimisation)
• Development of mathematical models 5
Oceanlinx, Laboratory
HMRC, Ireland
Overview TRL approach
Phase 2
Design model
• New/modified model at 1:10-25 with extended measurement array
• Larger set of physical parameters measured with more realistic PTO
• Tests in short-crested seas and different wave propagation directions (validate
moorings) and early survival tests (extreme motions and loadings)
• Bench testing of PTO system can also begin
6
Manchester Bobber
Laboratory, Manchester

4
Overview TRL approach
Phase 3
Process model
• Bridges end of laboratory tests and beginning of sea trials at a benign site
• Tests either in large wave basin or at benign site
• Scale 1:3-10 enables actual components (PTO, mooring) to be included
• Tests in specific seasons at outdoor site (scaled wave conditions, safety)
• Extended PTO bench testing should be considered
• Mathematical predictions should move from frequency into time domain modelling 7
WaveBob, benign site
Galway Bay, Ireland
Overview TRL approach
Phase 4
Prototype device
• By now, realistic performance data should be available, together with accurate
manufacturing and construction costs
• Scale 1:1-2
• All operation components must be (scaled) units of final components
• Tests do not have to take place in the actual array site
• Grid connection not essential at beginning, but should be considered towards the end 8
Archimedes Wave Swing
Aguçadoura, Portugal

5
Overview TRL approach
Phase 5
Demonstration device
• Full-size WEC is built or relocated to projected WEC park
• Grid connection and electricity sale must be part of the package
• Tests with isolated device possible, but better a small array configuration (economic
reasons)
9
Pelamis array
Aguçadoura, Portugal
Overview TRL approach
WEC classification of European Marine Energy Centre EMEC, Scotland
10
Attenuator Point Absorber Oscillating Wave Surge Converter
Overtopping Device Submerged Pressure Differential Oscillating Water Column
Others (e.g. Anaconda)

6
Overview TRL approach
Heller (2010)
Some WECs as a function of classification of EMEC and highest
reached TRL by early 2010 (some devices moved to other phase by now)
11
• Only Pelamis
(and Mutriku by
now) in phase 5
• Large variety of
device concepts
in phase 4
• Many point ab-
sorbers are in
phase 3
• Some devices (*)
are at lower pha-
se than shown
Overview TRL approach
Some WECs as a function of the developers country and their highest
reached TRL by early 2010 (some devices moved to other phase by now)
Heller (2010)
12
• Others includes Sweden, Portugal, Finland, The Netherlands and Greece
• UK is leading WEC developer followed by Denmark
• Developer’s reaching phase 3 originate from many countries (global activity)

7
Funding
Funding opportunities with focus on the UK
13
Funding
Funding sources
• EPSRC (Engineering and Physical Sciences Research Council): EPSRC with
partners fund research into marine energy mainly through the SuperGen Marine
consortium and is an important funding source for academia
• Carbon Trust: It seeks to accelerate the move to a low-carbon economy (reduc-
tion of emissions, development of low-carbon technologies) and is running a £3.5m
Marine Energy Accelerator investing in marine energy projects
• Technology Strategy Board (TSB): It invests in projects and in sharing know-
ledge. Historically, it invested in the order of £100K per early-stage marine energy
project. It funded in 2011 three marine energy device developers with over £2.5m
for R&D of their full-scale devices
• European Commission (EC): The EC has been supporting projects such as
FO/P1, SSG, WaveBob, Wave Dragon or WaveRoller
• Marine Renewables Proving Fund (MRPF): It aims to accelerate leading marine
devices to qualify for the UK government’s existing Marine Renewables Deploy-
ment Fund (MRDF) scheme with a £22m initiative (up to 60% of project costs with
maximum of £6m per device) 14

8
Funding
Funding sources
• Environmental Transformation Fund (ETF): Provides funds for low-carbon
energy and energy-efficiency technologies; £50m of this fund is in MRDF including
a £42m wave and tidal energy demonstration scheme (up to 25% of capital cost,
maximum £5m per project); devices must be grid-connected and tested at sea for 3
months continuously or for 6 months within 12 months
• Energy Technologies Institute (ETI): Both the private (EdF, Shell, BP, E.On,
Rolls-Royce and Caterpillar) and the public (UK government) sector spend £300m
each to accelerate the deployment of low-carbon energy systems, including a
marine energy program of about £10m each to a small number of projects
• The Saltier Price: Announced in April 2008, it offers £10m for an advance in clean
energy; open globally for WECs and TECs, but winner must deliver an advance
relevant to Scotland and device can be deployed within 2-5 years
• Wave and Tidal Energy Scheme (WATES): Supports nine Scottish WEC and TEC
developers since 2006 with £13.5m (currently no more funding available)
15
Funding
Further (non-fiscal) support
Include training, knowledge exchange, networking, generic research, establishment of
protocols and guidelines, infrastructure etc.
SuperGen Marine (EPSRC): Research, doctorates and training courses
European Commission:
• WaveTrain2 (2008-12): Training for 16-20 students
• CORES (2008-11): 13 partners worked on critical components required for OWCs
• EquiMar (2008-11): 24 partners worked on guidelines and recommendations for development of
WECs/TECs in all phases
• Waveplam (2007-10): 8 partners worked on nontechnical barriers influencing the growth of a
wave energy industry with cross-border information and the establishment of networking links
Test centres:
• NaREC (National centre for the advancement of renewable energies), UK: Large scale facilities
• EMEC (European Marine Energy Centre), Orkney, Scotland: Sea berths and infrastructure to
grid-connect and test devices in ocean at test phase 4
• Wave Hub, Southwest England, and Biscay Marine Energy Platform (BIMEP), Spain:
Infrastructure and subsea connections to plug in devices in phase 5 offshore
16

9
Phases 1-3 in laboratory
Phases 1, 2 and 3 (if taking place in laboratory); controllable
17
Phases 1-3 in laboratory
Some important points to consider in Phases 1-3
18
Model-prototype similarity (scale effects)
Test facilities Towing tank (2D) Wave generation Flap-type wavemaker
Wave flume (2D) Piston-type wavemaker
Wave basin (3D) Absorbing or non-absorbing
Wave absorption Reflections Model design Model material (scaling)
Active beach Mooring
Passive beach Power take-off (model PTO)
Measurements What to measure
Sensor in water (waterproof)
Intrusive or non-intrusive
Device testing Regular waves (linear or non-linear)
Irregular waves (which spectra)
Extreme waves

10
Phases 1-3 in laboratory
Model design: model PTO
19
The PTO needs to be included in the model not only to measure power, but also to
correctly model the effect of the PTO on a WEC (it behaves differently without PTO).
Definitions of power
Linear mechanical system: Mechanical power (W) = force (N) × velocity (m/s)
Hydraulic PTO: Fluid power (W) = flow rate (m3/s) × pressure (N/m2)
OWC system: Air power (W) = flow rate (m3/s) × pressure drop (N/m2)
Overtopping system: Water power (W) = fluid density (kg/m3) × gravitational
acceleration (m/s2) × flow rate (m3/s) ×
head difference (m)
Rotary mechanical system: Shaft power (W) = shaft torque (Nm) × angular velocity (1/s)
→ Model can, or often has to (scale effects), apply other PTO than full-scale device
Phases 1-3 in laboratory
Model design: selection of model PTOs of Anaconda
20
Linear, tuneable (air power)
Artists impression full-scale PTO (water power)
PTO in model at 1:25 (Checkmate SeaEnergy)
Actuator (mechanical power)
Model PTOs at University of Southampton
2400
capillary
tubes
Piston with
pressure
transducer

11
Phases 1-3 in laboratory
Measurement systems
21
Water surface elevation:
• Incident, reflected, radiated, transmitted waves
• Overtopping basin
• Velocity of an Oscillating Water Column OWC
Fluid velocity:
• OWC
• Large-scale turbulent structures
• Cavitation
Coherent turbulent structures:
• Reduction of losses (improve streamlines)
LIMPET OWC
Water vortex
Phases 1-3 in laboratory
Measurement systems
22
Flow rate:
• Overtopping device
• Flow between high to low pressure tank
Force/pressure:
• Power
• Hull or mooring
• Dimensioning structure in which WEC is integrated
Movement analysis (body motion):
• Optimisation of performance
• Investigation of radiation problem
Wave Dragon (overtopping device)
WECA (submerged pressure differential)
12
Phases 1-3 in laboratory
Measurement systems
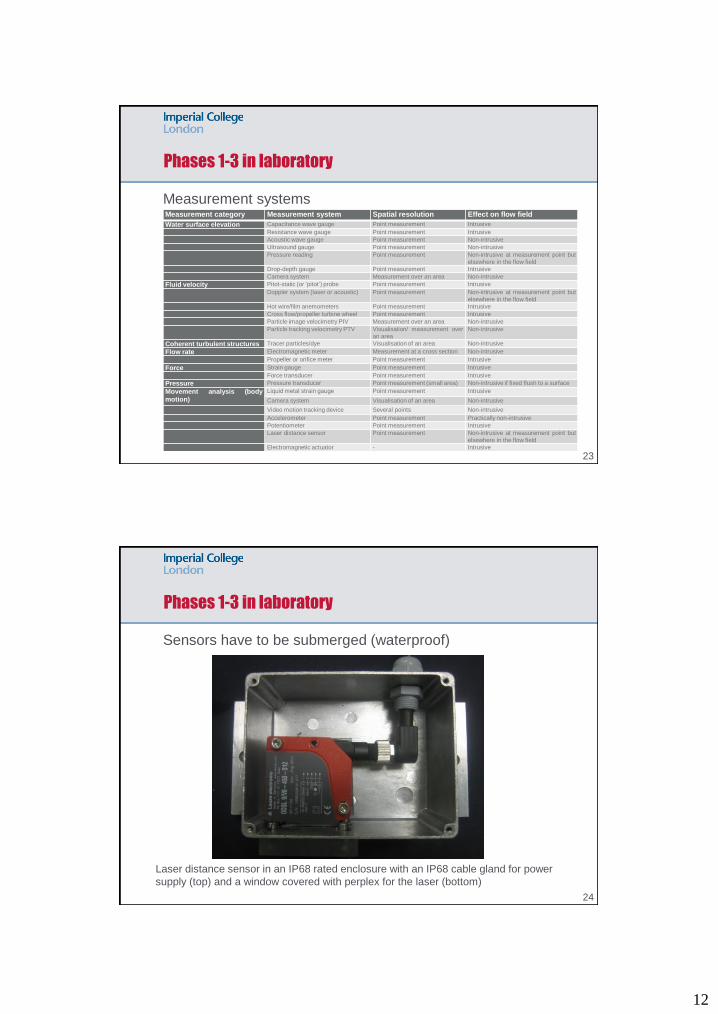
23
Measurement category Measurement system Spatial resolution Effect on flow field
Water surface elevation Capacitance wave gauge Point measurement Intrusive Resistance wave gauge Point measurement Intrusive Acoustic wave gauge Point measurement Non-intrusive Ultrasound gauge Point measurement Non-intrusive Pressure reading Point measurement Non-intrusive at measurement point but
elsewhere in the flow field Drop-depth gauge Point measurement Intrusive Camera system Measurement over an area Non-intrusive
Fluid velocity Pitot-static (or ‘pitot’) probe Point measurement Intrusive Doppler system (laser or acoustic) Point measurement Non-intrusive at measurement point but
elsewhere in the flow field Hot wire/film anemometers Point measurement Intrusive Cross flow/propeller turbine wheel Point measurement Intrusive Particle image velocimetry PIV Measurement over an area Non-intrusive Particle tracking velocimetry PTV Visualisation/ measurement over
an area
Non-intrusive
Coherent turbulent structures Tracer particles/dye Visualisation of an area Non-intrusive
Flow rate Electromagnetic meter Measurement at a cross section Non-intrusive
Propeller or orifice meter Point measurement Intrusive
Force Strain gauge Point measurement Intrusive Force transducer Point measurement Intrusive
Pressure Pressure transducer Point measurement (small area) Non-intrusive if fixed flush to a surface
Movement analysis (body motion)
Liquid metal strain gauge Point measurement Intrusive
Camera system Visualisation of an area Non-intrusive
Video motion tracking device Several points Non-intrusive Accelerometer Point measurement Practically non-intrusive Potentiometer Point measurement Intrusive Laser distance sensor Point measurement Non-intrusive at measurement point but
elsewhere in the flow field Electromagnetic actuator - Intrusive
Phases 1-3 in laboratory
Sensors have to be submerged (waterproof)
24
Laser distance sensor in an IP68 rated enclosure with an IP68 cable gland for power
supply (top) and a window covered with perplex for the laser (bottom)

13
Phases 3-5 at sea
Phases 3 (if taking place at sea), 4 and 5; not controllable
25
Phases 3-5 at sea
Some important points to consider in phases 3-5
26
Location
Wave energy resource
• Significant wave height, period and directionality
• Extreme waves (survivability, storm protection mode)
Environmental impact
Measurement system (redundancy)
Cost efficiency
Operation and maintenance (on device or in harbour)
Reliability (redundancy)
Grid Connection
Interaction effects in arrays
• A device in an array may generated more power then isolated
• Different incident power on devices in array
Planned 10 MW wave farm in Sweden
with 420 Direct Drive Linear Generators

14
Phases 3-5 at sea
Requirements for test location
27
• Favourable energy resource (scaled in TRL 3)
• Known wave resource and environmental data (wind, bathymetry, seabed
properties) and pre-deployed wave measurement instruments
• Proximity between shore and national grid
• Small distance between the 50 m contour and the shoreline (avoid long cables)
• Access to harbours and shipyards (O&M, safety)
• Simplified regulations and licensing procedures
• One or more offshore connection points
• Monitoring facilities related to the device itself and the environment
• Potential to be extended to test site for small array
• Good accessibility
• Out of the region of major shipping lanes, fishing areas and military training sites
→ Most problems solved if tests take place at a test centre (EMEC, Wave Hub, BIMEP)
Phases 3-5 at sea
Some WECs tested in phase 3 at benign sea sites
28
Wavestart at Nissum Bredning, Denmark Wave Dragon at Nissum Bredning, DM
Ceto at Fremantle, Australia OE Buoy at Galway Bay, Ireland

15
Phases 3-5 at sea
Some WECs in phase 4
29
Pelamis at EMEC, Scotland Oyster at EMEC, Scotland PowerBuoy, Hawaii, USA
Device Year of tests Location Rated power LIMPET OWC 2000-2007 Islay, Scotland 500 kW
Ceto 2011 Garden Island, Australia 200 kW Mighty Whale 1998 Nansei Town, Japan 120 kW
EU Pilot Plant 1999 Pico Island, Azores 400 kW
AWS 2004 Aguçadoura, Portugal 2 MW
Pelamis 2004-2007; 2010-2011 EMEC, Scotland 750 kW
Direct Drive Linear Generator 2005 Lysekil, Sweden 10 × 10 kW
OWES 2005-2006 Port Kembla, Australia 500 kW
WavePlane 2008 Hanstholm, Denmark 100 kW
Oyster 2009-2011 EMEC, Scotland 300 kW
PowerBuoy 2009-2010 Hawaii, USA 40 kW
2011 Invergordon, Scotland 150 kW WaveRoller 2007-2008 Peniche, Portugal 2 × 15 kW
Phases 3-5 at sea
First WEC arrays
3 Pelamis devices
Aguçadoura, Portugal in 2008
First wave farm
Total rated power 2.25 MW
→ Many further farms are under development or planned
30
16 oscillating water columns
Mutriku, Spain in 2011, integrated in breakwater
First commercial project
Total rated power 296 kW

16
Phases 3-5 at sea: Multi MW test sites
Wave Hub in Cornwall, England
• Provides infrastructure for up
to four wave farms with sim-
plified licensing procedure
• Subsea connections available
• Produce up to 20 MW in total
• 8 km2 area of sea
• 25-years lease
Confirmed devices:
- Fred Olsen Ltd (B1)
- Ocean Power Tech-
nologies Ltd (PB150)
- WestWave (Pelamis)
31
Artists impression of Wave Hub
Phases 3-5 at sea: Multi MW test sites
Biscay Marine Energy Platform BIMEP, North Spain
• Provides infrastructure for four wave farms
• Subsea connections are provided and it should produce up to 20 MW
• 2 × 4 km2 area of sea in 50 - 90 m deep water
32 Artists impression of BIMEP

17
Conclusions
• The technology readiness level TRL approach concentrates on
technical aspects and helps to mitigate technical and fiscal risk
• The TRL approach is also a convenient way to assess the
advancement of WECs
• Many devices are under investigation at full scale and first arrays
are being tested or planned and seem commercially feasible
• The support for wave energy conversion from Governmental
Agencies, Research Councils and the European Commission is
substantial despite the economic problems
• An overview about the current state of wave energy conversion
was given
33
References
Heller, V. (2010). Leading wave power devices. Internal report, Energy and Climate
Change Division, University of Southampton, Southampton.
Heller, V. (2012). Development of wave devices from initial conception to
commercial demonstration. In: Ocean Energy, Bahaj, A.S. (Ed.), Elsevier (in
press).
HMRC (2003). Ocean energy: Development & Evaluation Protocol. Part 1: Wave
Power. HMRC, Cork.
Holmes, B. (2009). Tank testing of wave energy conversion systems. Marine
renewable energy guides. EMEC, Orkney.
IEE (2009). State of the art analysis - A cautiously optimistic review of the technical
status of wave energy technology. Report of Waveplam, Intelligent Energy Europe,
Brussels.
34