technology pathways in decarbonisation scenarios today one cannot have complete knowledge of all...
TRANSCRIPT

asset J u l y , 2 0 1 8
The ASSET project is funded by the European Commission
This publication reflects only the views of its authors, and the European Commission cannot be held responsible for its content.
Technology pathways in decarbonisation scenarios
Project
managers
Alessia De Vita (E3Modelling), Izabela Kielichowska (Ecofys), Pavla Mandatowa
(Tractebel)
Co-authors Prof. P. Capros, E. Dimopoulou, S. Evangelopoulou, T. Fotiou, M. Kannavou, P. Siskos,
G. Zazias (E3Modelling)
Louise De Vos, Ali Dadkhah, Guillaume Dekelver (Tractebel) Legal Notice: This study was ordered and paid for by the European Commission, Directorate-General for Energy,
Contract no. ENER/C2/2016-489/SI2.742171. The information and views set out in this Study are those
of the author(s) and do not necessarily reflect the official opinion of the Commission. The Commission
does not guarantee the accuracy of the data included in his study. Neither the Commission nor any
person acting on the Commission’s behalf may be held responsible for the use which may be made of the
information contained therein.
asset J u l y , 2 0 1 8
P A G E | 2/62
ABOUT ASSET
ASSET (Advanced System Studies for Energy Transition) is an EU funded project, which aims at providing
studies in support to EU policymaking, including for research and innovation. Topics of the studies will
include aspects such as consumers, demand-response, smart meters, smart grids, storage, etc., not only in
terms of technologies but also in terms of regulations, market design and business models. Connections
with other networks such as gas (e.g. security of supply) and heat (e.g. district heating, heating and cooling)
as well as synergies between these networks are among the topics to study. The rest of the effort will deal
with heating and cooling, energy efficiency in houses, buildings and cities and associated smart energy
systems, as well as use of biomass for energy applications, etc. Foresight of the EU energy system at
horizons 2030, 2050 can also be of interests.
The ASSET project will run for 36 months (2017-2019) and is implemented by a Consortium led by Tractebel
with Ecofys and E3-Modelling as partners.
asset J u l y , 2 0 1 8
P A G E | 3/62
TABLE OF CONTENT
About ASSET ............................................................................................................... 2
Table of Content ........................................................................................................ 3
1 Introduction ......................................................................................................... 4
2 Goal of the study .................................................................................................. 5
3 Approach ............................................................................................................. 5
4 Decarbonisation technologies .............................................................................. 6
5 Presentation of data to stakeholders ................................................................. 15
6 List of stakeholders ............................................................................................ 15
7 Stakeholder data review process and responses ................................................ 20
7.1 Bilateral stakeholder consultation organised by the Consortium ................................................... 20
7.2 Stakeholders that provided information directly to the Commission ............................................. 22
8 REPORT FROM THE WORKSHOP ON 16 MAY 2018 ........................................................ 23
9 FINAL DATA SET ...................................................................................................... 33
10 APPENDIXES .................................................................................................... 54
Appendix 1: Survey template ................................................................................... 54
Worksheet 1: Guidance ............................................................................................................................... 54
Worksheet 2: Introduction .......................................................................................................................... 55
Worksheet 3: Technology data overview .................................................................................................... 55
Worksheet 4: Additional information ......................................................................................................... 56
Worksheet 5: All technology categories - for information only .................................................................. 57
Appendix 2: Literature review list ............................................................................ 58

asset J u l y , 2 0 1 8
P A G E | 4/62
1 INTRODUCTION The European Commission is working, among others, with the PRIMES model (operated by Energy Economy
Environment Modelling Lab - E3M) to deliver the scenarios that illustrate the potential impact of energy
and climate policies, long-term targets and decarbonisation pathways on the operation of the European
energy system.
Modelling scenarios for development of the energy system is highly dependent on the assumptions. An
essential input to any modelling exercise, and one which has a high influence on modelling results, are
assumptions about the development of technologies - both in terms of performance and costs. While these
assumptions have been traditionally developed by the modelling consultants (E3M), based on a broad and
rigorous literature review, the Commission is increasingly seeking a review of these technologies by
industrial stakeholders to make them even more robust and representative of the current projects as well
as experts’ and stakeholders’ expectations.
The definition of technologies and their developments far into the future (PRIMES model has currently the
time-horizon up to 2070) is a complex exercise.
While today one cannot have complete knowledge of all technologies that will be deployed on the pathway
towards decarbonisation of the energy system, we have already some indication of the technologies that
are currently being developed, their current costs and performance as well as their likely evolution in the
future. Private companies and public authorities have already made investments in research and
demonstration projects as well as, in some case, full-scale industrial activities on these technologies.
Some of the novel technologies currently considered as viable options for full decarbonisation relate to
synthetic fuels/e-fuels (CH4 and more complex hydrocarbons as well as H2 produced from (increasingly
decarbonised) electricity), networks and refuelling stations necessary for their distribution as well as
storage options. For synthetic fuels, conversion technologies have to be carefully considered starting with
CO2 capturing, H2 production, methanation or processes for production of even more complex
hydrocarbons suitable for use in transport.
Mapping of these technologies and, more importantly, knowledge about their current and future cost and
performance – while obviously subject to many uncertainties – are crucial for envisaging decarbonisation
pathways.
The revised, draft version (compared to the latest set underpinning the Reference scenario 20161) of
assumptions was compiled by E3M in early 2018, through extensive literature research – see Appendix 2.
1 Please see: https://ec.europa.eu/energy/sites/ener/files/documents/ref2016_report_final-web.pdf.

asset J u l y , 2 0 1 8
P A G E | 5/62
2 GOAL OF THE STUDY The purpose of this study was to ensure robustness and representativeness of the technology assumptions
by reaching out to relevant experts, industry representatives and stakeholders, who are in possession of
the most recent data in the different sectors.
The study thus undertook to confirm and - if necessary - adjust the assumptions for PRIMES modelling for
the technologies relevant for long term (decarbonisation) pathways in the EU that have been compiled by
E3M (both in terms of technology pathways selected and costs). This objective was achieved by identifying
and reaching out to relevant experts, industry representatives and stakeholders and using internal
expertise.
3 APPROACH A 3-step approach was followed, leading to the final deliverables, as presented in Figure 1.
Figure 1: Study approach
Phase I
In the first phase, the technologies were grouped into several categories. Next, the list of key potential
stakeholders to be interviewed in Phase II was identified and consultants grouped these stakeholders in
major categories, following the technologies subject to the review.
Phase II
In phase II, consultants developed a form, which they populated with selected data, tailor-made l for each
stakeholder. Supported with a letter from the European Commission, they reached out to stakeholders on
bilateral basis, requesting them to review the provided selected data. They also invited the stakeholders to
extend the list of the reviewed data, depending on their expertise.
The process included:
a. Sending the forms, tailor-made for each stakeholder
b. Two reminder-rounds, when necessary

asset J u l y , 2 0 1 8
P A G E | 6/62
c. Working level support and consultation to reviewers by phone and email. In several cases,
consultants also organised phone conferences to clarify more complex questions on the specifics of
the PRIMES model and technology assumptions presentation.
d. Receiving the reviews and discussing them with the modelling team.
The stakeholder review process peaked ahead of the stakeholder consultation workshop, organised by the
Commission on 16th May 2018. Some bilateral exchanges continued also after the workshop.
Phase III
In the third phase, all the data received by the stakeholders was checked and reviewed again by the
modelling team with available literature and complemented with further desk-top research, where
necessary.
The reviewed assumptions were presented to the European Commission for final review and assessment.
Upon agreement with the EC, the modified data was then introduced into the PRIMES model.
4 DECARBONISATION TECHNOLOGIES The decarbonisation technologies, subject to the review were divided in five categories:
Domestic appliances and equipment
Renovation costs
Industry
Power and heat
New fuels
The complete overview of the technologies is presented below.

asset J u l y , 2 0 1 8
P A G E | 7/62
Table 1: Summary overview of technologies
Category
Domestic appliances and equipment
Renovation costs Industry Power and heat Novel technologies
1. Residential 1.1. Electric appliances
1.1.1. Dryers 1.1.2. Dishwashers 1.1.3. Refrigerators 1.1.4. Washing
machines 1.1.5. Lighting
1.2. Cooking 1.2.1. Cooker
1.3. Space heating 1.3.1. Boilers gas 1.3.2. Boilers
condensing gas
1.3.3. Boilers oil 1.3.4. Boilers
condensing oil
1.3.5. Wood stoves or Boiler pellets
1.3.6. Heat Pump Air
1.3.7. Heat Pump Hydro
1.3.8. Heat Pump
1. Light renovation (light windows)
2. Light renovation (med. windows)
3. Light renovation (med. windows, light wall)
4. Light renovation (med. windows, light wall/roof)
5. Medium renovation (med. windows, med. wall/roof/basement)
6. Medium renovation (med. windows, med. wall/roof/basement)
7. Deep renovation (deep. windows, med. wall/roof/basement)
8. Deep renovation (deep. windows, deep wall/roof/basement)
9. For four difference climatic zones: north, south, centre-west and east
1. Horizontal processes 1.1. Motors large scale 1.2. Motors midsize 1.3. Motors small 1.4. Cooling
refrigeration 1.5. Lighting 1.6. Air conditioning
2. Glass annealing 2.1. Glass annealing
(electric) 2.2. Glass annealing
new glass thermal (solids)
2.3. Glass annealing new glass thermal (fuels)
2.4. Glass annealing recycled glass thermal (fuels)
3. Iron and Steel basic processing 3.1. Electric Arc (Iron
and steel) 3.2. Blast furnace (Iron
and steel) solids 4. Direct heat
1. Steam turbines 1.1. Steam Turbine
Coal Conventional 1.2. Steam Turbine
Lignite Conventional
1.3. Steam Turbine Coal Supercritical
1.4. Steam Turbine Lignite Supercritical
1.5. Fluidized Bed Combustion Coal
1.6. Fluidized Bed Combustion Lignite
1.7. Integrated Gasification Combined Cycle Coal
2. Gas turbines 2.1. Gas Turbine
Combined Cycle Gas Conventional
2.2. Gas Turbine Combined Cycle Gas Advanced
2.3. Steam Turbine
1. Hydrogen
1.1. Hydrogen from
natural gas steam
reforming
centralised - Large
Scale (per 1 kW or
1 MWh H2 HHV)
1.2. Hydrogen from
natural gas steam
reforming
centralised - Large
Scale with CCU(per
1 kW or 1 MWh H2
HHV)
1.3. Hydrogen from
natural gas steam
reforming de-
centralised -
Medium Scale (per
1 kW or 1 MWh H2
HHV)
1.4. Hydrogen from
low temperature
water electrolysis
PEM centralised -
Large Scale (per 1

asset J u l y , 2 0 1 8
P A G E | 8/62
Geothermal
1.3.9. Heat Pump Gas
1.3.10. Electric Resistance
1.3.11. Gas individual
1.3.12. Solar Thermal
1.3.13. CHP ICE 1.3.14. CHP micro
CCGT 1.3.15. CHP FC 1.3.16. District
heating 1.4. Water heating
1.4.1. Water heating boiler (diesel)
1.4.2. Water heating boiler (electricity)
1.4.3. Water heating boiler (natural gas)
1.4.4. Solar collector
1.4.5. Water heating heat pump
1.4.6. Water heating boiler (heat)
4.1. Direct heat use in food and other industries - electric
4.2. Direct heat use in food and other industries - fuels
5. Drying and separating 5.1. Drying and
separating fuels(cement)
5.2. Drying and separating electric
5.3. Drying and separating thermal
6. Furnaces 6.1. Electric furnace
(ALS, COP ZNC) 6.2. Electric furnace
(ALP) 7. Electric processes
7.1. Electric process in IS
7.2. Electric process in Fertilisers
7.3. Electric process in Petrochemical
7.4. Electric process in inorganic chemicals
7.5. Electric process in low energy chemicals
7.6. Electric process in paper and pulp
Fuel Oil Conventional
2.4. Gas turbine with heat recovery
2.5. Very small-scale Gas Plant
3. CCS 3.1. Pulverised Lignite
Supercritical CCS post combustion
3.2. Integrated Gasification Coal CCS pre- combustion
3.3. Integrated Gasification Lignite CCS pre- combustion
3.4. Pulverised Coal Supercritical CCS oxyfuel
3.5. Pulverised Lignite Supercritical CCS oxyfuel
3.6. Gas combined cycle CCS post combustion
3.7. Gas combined cycle CCS oxyfuel
4. Biomass 4.1. Steam Turbine
Biomass Solid Conventional
4.2. Biogas Plant with
kW or 1 MWh H2
HHV)
1.5. Hydrogen from
low temperature
water electrolysis
PEM de-
centralised at a
refuelling station
(per 1 kW or 1
MWh H2 HHV)
1.6. Hydrogen from
low temperature
water electrolysis
Alkaline
centralised - Large
Scale (per 1 kW or
1 MWh H2 HHV)
1.7. Hydrogen from
low temperature
water electrolysis
Alkaline de-
centralised at a
refuelling station
(per 1 kW or 1
MWh H2 HHV)
1.8. Hydrogen from
low temperature
water electrolysis
SOEC centralised
(per 1 kW or 1
MWh H2 HHV)
1.9. Hydrogen from

asset J u l y , 2 0 1 8
P A G E | 9/62
1.5. Air conditioning
1.5.1. Electric Air-conditioning
1.5.2. Electric Air-conditioning central
2. Service 2.1. Electric appliances
2.1.1. Office lighting
2.2. Space heating 2.2.1. Large scale
Boilers 2.2.2. Large scale
Boilers condensing
2.2.3. Large scale Heat Pumps
2.2.4. District heating
2.3. Air conditioning 2.3.1. Air-
conditioning (electricity)
2.3.2. Air-conditioning (natural gas)
2.3.3. Air-conditioning (heat)
8. Electric refining 8.1. Paper and pulp
electric refining 9. Foundries (non-ferrous
alloys) 9.1. Electric foundries 9.2. Foundries (non-
ferrous alloys) -fuels
9.3. Thermal foundries 10. Kilns
10.1. Electric kilns for copper
10.2. Kilns for other non-ferrous (fuels)
10.3. Kilns cement (fuels)
10.4. Electric kilns (ceramics)
10.5. Kilns materials (fuels)
10.6. Tunnel kiln (ceramics)
11. Thermal processes 11.1. Fertilisers
thermal process 11.2. Petrochemical
thermal process 11.3. Inorganic
chemistry thermal process
11.4. Low energy chemistry thermal process
Heat recovery 4.3. Small Waste
burning plant 4.4. Biomass
Gasification CC 4.5. MBW incinerator
CHP 5. Nuclear
5.1. Nuclear III gen. (incl. economies of scale)
5.2. Nuclear III gen. (no economies of scale)
6. Fuel cells 6.1. Fuel Cell Gas (large
scale) 6.2. Fuel Cell Gas
(small scale) 7. Wind onshore
7.1. Wind onshore-Low 7.2. Wind onshore-
Medium 7.3. Wind onshore-
high 7.4. Wind onshore-
very high 7.5. Wind small scale
rooftop 8. Wind offshore
8.1. Wind offshore - low potential
8.2. Wind offshore - medium potential
low temperature
water electrolysis
SOEC de-
centralised at a
refuelling station
(per 1 kW or 1
MWh H2 HHV)
2. Conversion
technologies
2.1. Methanation (per
1 kW or 1 MWh
CH4 HHV)
2.2. CH4 Liquefaction
plant (per 1 kW or
1 MWh gas HHV)
2.3. Gas Liquefaction
plant (per 1 kW or
1 MWh gas HHV)
2.4. Regasification
Plant including
LNG storage (per 1
kW or 1 MWh gas
HHV)
2.5. Power to liquid via
the methanol
route (per 1 kW or
1 MWh CH4 HHV)
2.6. Power to liquid via
the Fischer
Tropsch route (per
1 kW or 1 MWh
CH4 HHV)

asset J u l y , 2 0 1 8
P A G E | 10/62
8.3. Wind offshore -
high potential 8.4. Wind offshore -
very high (remote) 9. PV
9.1. Solar PV low potential
9.2. Solar PV medium potential
9.3. Solar PV high potential
9.4. Solar PV very high potential
9.5. Solar PV small scale rooftop
9.6. Solar Thermal with 8 hours storage
10. Tidal and waves 11. Hydro
11.1. Lakes 11.2. Run of river
12. Geothermal 12.1. Geothermal High
Enthalpy 12.2. Geothermal
Medium Enthalpy 13. Electric boilers 14. District heating
14.1. District heating Boilers Gas
14.2. District heating Boilers Fuel Oil
14.3. District heating Boilers Biomass
2.7. Power to liquid via
High temperature
co-electrolysis and
Fischer Tropsch
(per 1 kW or 1
MWh CH4 HHV)
2.8. Capture CO2 from
air (Absorption
technology) (per 1
tCO2)
2.9. Capture CO2 from
air (Adsorption
technology) (per 1
tCO2)
2.10. CO2
Liquefaction plant
(per 1 ton CO2)
3. Refuelling technologies
3.1. H2 compression
station (per 1 kW
or 1 MWh H2
HHV)
3.2. Hydrogen
Liquefaction plant
(per 1 kW or 1
MWh H2 HHV)
3.3. H2 liquid to gas
refuelling station
(per 1 kW or 1
MWh H2 HHV)
3.4. H2 refuelling
station Small (per

asset J u l y , 2 0 1 8
P A G E | 11/62
14.4. District heating
Boilers Coal 14.5. District heating
Boilers Lignite 14.6. MBW incinerator
district heating 14.7. District Heating
Electricity 14.8. District Heating
Geothermal 14.9. District Heating
Heat Pump 14.10. District Heating
Solar 15. Industrial power
generation 15.1. Industrial Boilers
Coal 15.2. Industrial Boilers
Lignite 15.3. Industrial Boilers
Gas 15.4. Industrial Boilers
Fuel Oil 15.5. Industrial Boilers
Biomass
1 kW or 1 MWh H2
HHV)
3.5. H2 refuelling
station Medium
(per 1 kW or 1
MWh H2 HHV)
3.6. H2 refuelling
station Large (per
1 kW or 1 MWh H2
HHV)
3.7. ELC recharging
points - Semi Fast
recharging (per 1
kW or 1 MWh ELC)
3.8. ELC recharging
points - Fast
recharging (per 1
kW or 1 MWh ELC)
3.9. CNG compression
station (per 1 kW
or 1 MWh gas
HHV)
3.10. CNG
refuelling station
(per 1 kW or 1
MWh gas HHV)
3.11. LNG
refuelling station
(per 1 kW or 1
MWh gas HHV)
4. Distribution
technologies

asset J u l y , 2 0 1 8
P A G E | 12/62
4.1. NGS Transmission
Network (per
MWh ) (per MWh
)
4.2. NGS Distribution
Network (per
MWh)
4.3. H2 pipeline 60bar
(per MWh H2
HHV)
4.4. H2 pipeline 10 bar
(per MWh H2
HHV)
5. CO2 transmission
network
5.1.
6. Hydrogen transport
6.1. Road transport of
liquid H2
6.2. Road transport of
gaseous H2
7. Storage technologies
7.1. Compressed Air
Energy Storage
(per 1 kW or 1
MWh electricity)
7.2. Flywheel (per 1
kW or 1 MWh
electricity)
7.3. Large-scale
batteries (per 1
kW or 1 MWh

asset J u l y , 2 0 1 8
P A G E | 13/62
electricity)
7.4. Small-scale
batteries (per 1
kW or 1 MWh
electricity)
7.5. Pumping (per 1
kW or 1 MWh
electricity)
7.6. Underground
Hydrogen Storage
(per 1 kW or 1
MWh H2)
7.7. Pressurised tanks -
Hydrogen storage
(per 1 kW or 1
MWh H2)
7.8. Liquid Hydrogen
Storage -
Cryogenic Storage
(per 1 kW or 1
MWh H2)
7.9. Metal Hydrides -
Hydrogen Storage
(per 1 kW or 1
MWh H2)
7.10. Thermal
Storage
Technology (per 1
kW or 1 MWh
Heat)
7.11. LNG
Storage Gas (per 1

asset J u l y , 2 0 1 8
P A G E | 14/62
kW or 1 MWh Gas)
7.12. Undergrou
nd NGS Storage
(per 1 kW or 1
MWh Gas)
8. Liquid CO2 storage tank

asset J u l y , 2 0 1 8
P A G E | 15/62
5 PRESENTATION OF DATA TO STAKEHOLDERS A template for data survey presented to stakeholders on bilateral basis was established in the Phase II of
the study. It consisted of the following worksheets:
Guidance: instructions how to use the form
Introduction: basic information about the reviewer organisation and technology category reviewed
Technology data overview: specific set of data to be reviewed
Additional information: further information which the reviewer would like to provide
All technology categories: the overview of all technologies to be reviewed - for information only
The data survey template is presented in Appendix 1: Survey template.
6 LIST OF STAKEHOLDERS Consultants agreed with the Commission to contact maximum 100 key stakeholders on bilateral basis. The
list of key stakeholders was established in early April and once consolidated 94 organisations were indeed
to be contacted on bilateral basis, as presented in Table 2.
Furthermore, the European Commission directly approached over 300 stakeholders with a request to
review the datasets alongside the invitation to the workshop on 16th May.
The complete overview of stakeholders contacted on bilateral basis is presented below.

asset J u l y , 2 0 1 8
P A G E | 16/62
Table 2: List of stakeholders requested for reviewing the data
Organization Type of technology
Domestic Renovation costs Industry Power and heat Novel technologies
1. Abengoa X
2. AEBIOM X
3. AFHYPAC X
4. Agora Energiewende X X
5. Air Liquide X
6. AkuoEnergy X
7. AkzoNobel X
8. Alstom X
9. Arcellor Mittal X
10. Association of the European Heating Industry
X
11. Audi X
12. Bosch X
13. BP X
14. CEA X
15. Coalition for Energy Savings
X X
16. COGEN Europe X
17. Covestro X
18. Credit Suisse X
19. DCP Fuel Cell PowerTrain
X
20. E.ON X
21. EASE X
22. ECN X
23. EDF X
24. EDSO X
25. EERA X
26. EIT InnoEnergy X X X X X

asset J u l y , 2 0 1 8
P A G E | 17/62
Organization Type of technology
Domestic Renovation costs Industry Power and heat Novel technologies
27. ENAGAS X
28. ENEA X
29. ENEL X
30. Energinet X
31. Engie Research X
32. ENTSO-E X
33. ERTAC/BMW X
34. ESTELA X
35. ESTIF X
36. ETIP X
37. Eurelectric X
38. Eurima X
39. EUROBAT X
40. Eurogas X
41. European Biogas Association
X
42. European Climate Foundation
X
43. European Council for an Energy Efficient Economy
X X X
44. European Heat Pump Association
X
45. European Steel Technology Platform
X
46. FCH Platform X
47. Fertilizers Europe X
48. Fiat X
49. Friends of the Super grid
X
50. Fuel Cells and X

asset J u l y , 2 0 1 8
P A G E | 18/62
Organization Type of technology
Domestic Renovation costs Industry Power and heat Novel technologies
Hydrogen Joint Undertaking (FCH JU)
51. Fuels Europe X
52. Gas Connect Austria X
53. GasUnie X
54. GEODE X
55. GERG X
56. Glen Dimplex X
57. GRT Gas X
58. HKS X
59. Hydrogen Europe X
60. Hydrogenics X
61. HyEnergy X
62. IEA Renewable Industry Advisory Board
X
63. IRENA X
64. KIC InnoEnergy - Smart grids and Storage
X
65. Lanzatech X
66. Michelin X
67. Mitsubishi Hitachi Power systems
X
68. Nawa technologies X
69. NEK X
70. NEL Hydrogen X
71. NGVA Europe X
72. NOW X
73. Ocean Energy Europe X
74. OCI Nitrogen X

asset J u l y , 2 0 1 8
P A G E | 19/62
Organization Type of technology
Domestic Renovation costs Industry Power and heat Novel technologies
75. Port of Rotterdam X
76. Red Electridad Espania
X
77. SAFT Groupe X
78. Salzgitter Flachstahl X
79. Shell X
80. Siemens X
81. SmartEn X
82. Solar Heat Europe X
83. Solar Power Europe X
84. Sunfire X
85. Symbio X
86. TERNA X
87. Total X
88. Transelectrica X
89. Uniper Energy X
90. Vattenfall X
91. VERBUND Solutions GmbH
X
92. Wind Europe X
93. Yara International X
94. Zinium X

asset J u l y , 2 0 1 8
P A G E | 20/62
7 STAKEHOLDER DATA REVIEW PROCESS AND RESPONSES
7.1 Bilateral stakeholder consultation organised by the Consortium Out of the 94 agreed organisations, the consultants contacted 92. In two cases, the actual contact details of
the key expert could not be identified in due time.
All 92 organisations were approached by email in the period 09-17.04.2018. Reminders were sent between
24-26.04.2018.
Most stakeholders requested, both by email and over the phone, some clarification of the data provided to
be able to clearly understand the data presented for the review. In some cases, short teleconferences were
held to discuss the needs of PRIMES and recommendations for modellers.
29 organisations provided feedback, including the proposals for revision of technology costs. The
organisations who provided their reviews were:
1. AEBIOM
2. Agora Energiewende
3. Air Liquide
4. Association of the European Heating Industry
5. Coalition for Energy Savings
6. COGEN Europe
7. EASE
8. ECN
9. ESTELA
10. Eurelectric
11. European Biogas Association
12. European Climate Foundation
13. European Heat Pump Association
14. Fuel Cells and Hydrogen Joint Undertaking
15. Hydrogen Europe
16. IRENA
17. KIC Innogy
18. Lanzatech
19. Mitsubishi Hitachi Power
20. NEL Hydrogen
21. NOW
22. OCE Nitrogen
23. Ocean Energy Europe
24. Siemens
25. SmartEn
26. Solar Heat Europe
27. Solar Power Europe
28. Sunfire
29. Vattenfall

asset J u l y , 2 0 1 8
P A G E | 21/62
Figure 2 summarizes the level of engagement from stakeholders.
Figure 2: Summary of stakeholder engagement in the process
In four cases, the stakeholders expressed their interest to review a broader scope of data than originally
requested and provided a broad scope of reviews, covering the full range of technologies under the review.
The key element of the bilateral stakeholder consultation was the stakeholders' request to clarify the
technology developments as presented in PRIMES draft assumptions, especially for novel technologies.
Some 100 requests for clarifications were made by the 93 stakeholders and there were 56 requests
regarding novel technologies parameters, followed by 36 category specific responses from the 29
reviewers.
Figure 3 presents the detailed split of requested clarification and the subsequently obtained reviews.
Figure 3: Overview of requested – and obtained category-specific reviews
asset J u l y , 2 0 1 8
P A G E | 22/62
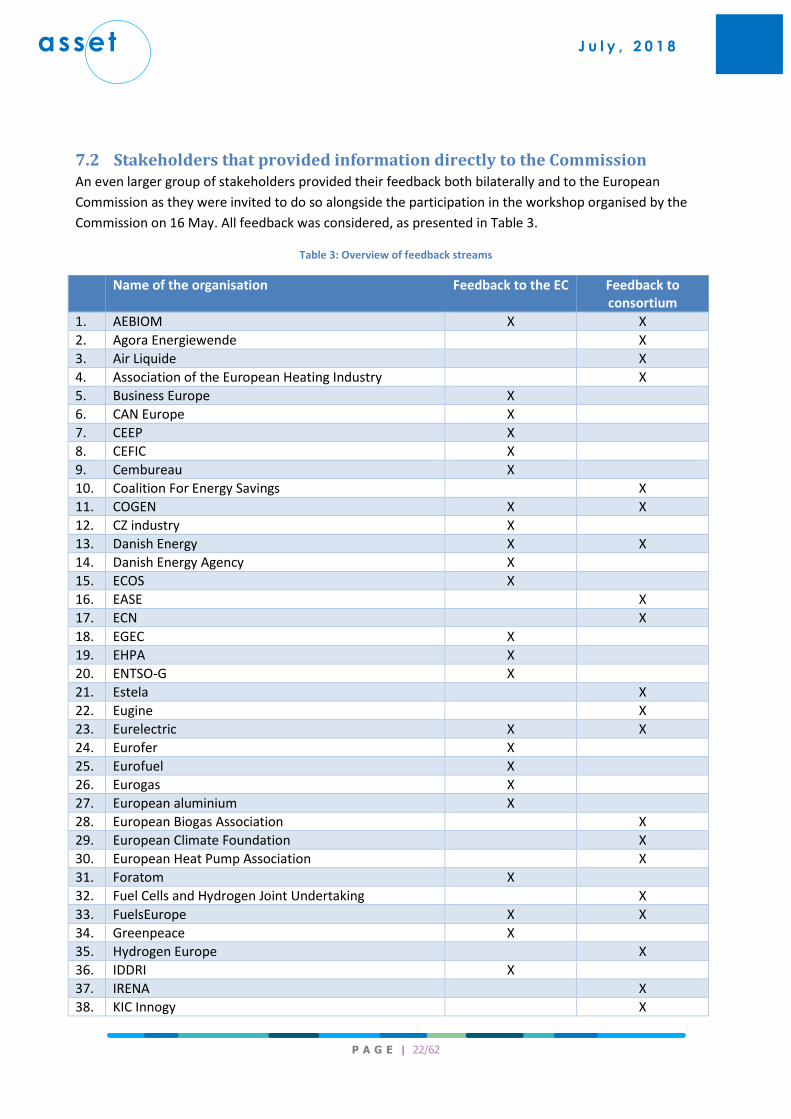
7.2 Stakeholders that provided information directly to the Commission An even larger group of stakeholders provided their feedback both bilaterally and to the European
Commission as they were invited to do so alongside the participation in the workshop organised by the
Commission on 16 May. All feedback was considered, as presented in Table 3.
Table 3: Overview of feedback streams
Name of the organisation Feedback to the EC Feedback to consortium
1. AEBIOM X X
2. Agora Energiewende X
3. Air Liquide X
4. Association of the European Heating Industry X
5. Business Europe X
6. CAN Europe X
7. CEEP X
8. CEFIC X
9. Cembureau X
10. Coalition For Energy Savings X
11. COGEN X X
12. CZ industry X
13. Danish Energy X X
14. Danish Energy Agency X
15. ECOS X
16. EASE X
17. ECN X
18. EGEC X
19. EHPA X
20. ENTSO-G X
21. Estela X
22. Eugine X
23. Eurelectric X X
24. Eurofer X
25. Eurofuel X
26. Eurogas X
27. European aluminium X
28. European Biogas Association X
29. European Climate Foundation X
30. European Heat Pump Association X
31. Foratom X
32. Fuel Cells and Hydrogen Joint Undertaking X
33. FuelsEurope X X
34. Greenpeace X
35. Hydrogen Europe X
36. IDDRI X
37. IRENA X
38. KIC Innogy X

asset J u l y , 2 0 1 8
P A G E | 23/62
39. Lanzatech X
40. Mitsubishi Hitachi Power X
41. NEL Hydrogen X
42. NOW X
43. OCE Nitrogen X
44. Ocean energy X X
45. Siemens X
46. Smart En X
47. Solar Heat Europe X
48. Solar Power Europe X
49. Sunfire X
50. Vattenfall X
51. Windeurope X
52. WWF X
8 REPORT FROM THE WORKSHOP ON 16 MAY 2018 The meeting was organised by the Commission as part of the study and in order to increase the stakeholder outreach.
In the opening remarks, the Commission explained the project that is led by ASSET consortium and consists of three phases:
1) Bilateral outreach to some 100 stakeholders, selected by consultants, in order to obtain their feedback on draft technology assumptions.
2) The meeting held on 16/5 (and the written feedback the Commission solicited prior to the meeting), which was an opportunity to engage with a large group of stakeholders interested in such exchanges (invitations to over 300 stakeholders were sent and additional stakeholders were also invited to join).
3) Finalisation of the technology assumptions by modellers and the Commission, taking into account all bilateral exchanges, written comments and feedback and discussions on 16/5.
Importantly, the project itself is the final phase of preparation of technology assumptions. PRIMES modelling experts from E3M explained during the meeting the broad and rigorous literature review and the methodology of establishment of the cost curves, which is the standard academic approach in such a work.
The Commission welcomed high level of participation and interest in modelling inputs and acknowledged that stakeholders have significant expertise that can be shared with the Commission and that can be useful input into modelling. The Commission wanted the meeting to be an opportunity to have a discussion about technology assumptions used in model PRIMES and to obtain a clearer picture of technology developments as expected by stakeholders. Enhanced exchanges around modelling aspects were meant to be an opportunity to learn from each other. Many stakeholders congratulated the Commission on the initiative to increase transparency around Commission modelling. PRIMES experts were grateful for feedback that reflects the most recent information about state of development and prospects of technologies (otherwise difficult to obtain from academic literature).
The Commission also stressed that this is a technical meeting aimed to discuss the specific topic of technology assumptions in PRIMES. Still some related questions were raised notably concerning the

asset J u l y , 2 0 1 8
P A G E | 24/62
Commission's Long Term Strategy (scheduled for adoption in November), the scenarios that the Commission plans to develop and their level of ambition. The Commission referred to the upcoming public consultation on the Long Term Strategy where stakeholders should bring all relevant expertise and debate the level of ambition as well as pathways.
***
The event was divided into three sessions dedicated to clusters of technologies:
(1) technologies related to synthetic fuels, Carbon Capture and Storage, sector coupling and storage
(2) renewable technologies in power generation and nuclear power generation
(3) technologies related to energy efficiency in buildings, appliances and industry
Each of the sessions was started by short explanations by ECOFYS/Tractebel of the process of bilateral contact with stakeholders. It was explained that 100 stakeholders were selected by consultants (based on their expert knowledge). In total 95 stakeholders were contacted, 28 stakeholders provided 33 reviews on technology assumptions. A lot of the bilateral exchanges required also additional explanations which were provided by the PRIMES experts especially in terms of methodology and precise meaning of different categories.
The Commission explained that over 300 stakeholders were invited to the meeting; that all additional stakeholders who signalled their wish to participate were invited and if there was an omission, an additional week was allowed for questions/comments.
The presentation from the PRIMES team was partly common and partly adapted to specific technologies and relevant modelling parts discussed at each session. In the first part, PRIMES team was explaining the model, its structure combining the micro-economic foundations with engineering representation, mathematical foundations, typical inputs and outputs as well as issues it can cover. The difference between PRIMES and bottom-up models was explained. The modellers stressed that the model is not a forecasting tool but can answer "what if" questions, i.e. how the energy system will develop assuming given technology prospects, global fossil fuels prices and macro-economic developments, and is well suited to simulate medium/long term transitions, less for short term changes. The other part of the presentation was tailored to the specific technologies discussed at each session listing the literature sources that were the main references, explaining the technology definitions and categories reported, as well as explaining the relevant module of PRIMES in more detail. It was stressed that while indeed technologies often come already today in rich variations, they necessarily have to be aggregated/simplified as models as such are by definition a simplified version of the real life. Also technologies that are expected to have little penetration of the market or on which literature has only scarce information are often omitted for simplification reasons.
Modellers explained that in the table with draft assumptions units of measurement can be different from those most commonly used and, for example, expressing costs in EUR/kWh was only used for illustrative purposes. Importantly the EUR/kWh (produced or stored – LCOE or LCOS) which are reported in the circulated file on assumptions are illustrative only as model calculates such metrics dynamically (notably taking into account dynamic projections of fuels costs and utilisation factors); they are endogenous and differ for each scenario. It was also explained that overnight investment costs (CAPEX) are the costs of constructing a project if no interest was incurred during construction, as if the project was completed "overnight”. In the session-specific parts of the presentation modellers explained the technologies

asset J u l y , 2 0 1 8
P A G E | 25/62
concerned and parts of PRIMES model which are relevant, as well as providing the clarifications to most frequent questions received during the written consultation.
***
In the Q&A session, the following issues were discussed and clarified:
Electricity price for e-fuels (synthetic fuels produced with electricity): the electricity price considered as cost element in e-fuels production is the electricity price paid by heavy industry not the whole-sale prices; these are endogenous in the model and are scenario dependent. On the supply side, different generation costs for different technologies are derived.
Power-to-Gas (PtG) generation possibilities: Several options/streams are considered in the model (SMR with CCS, electrolysis and methanation, different sources of CO2 sources (but not from fossil fuels)). Heat recovery within the process of e-fuel production is considered, however excess heat production is not considered to be used. It was stressed again that LCOE is only illustrative as it will be changing e.g. alongside electricity prices. Therefore, comments should focus on more concrete elements of technology assumptions like CAPEX.
Full costs of PtG: Impact on infrastructure of the higher use of e-fuels is considered in the model. While costs of electrolysers/steam reformers are not directly reported they are included in system-wide analysis, and are visible e.g. in increased fuels prices for consumers, which may therefore decide to increase or decrease the quantities used.
Types of gas, its storage and network representation: Natural gas is well represented in PRIMES but also all types of renewable gases. A number of types of storages is represented in PRIMES (hydro, batteries, e-fuels, heat as well as classical gas storage). Both natural gas and H2 network is considered although both transmission and distribution only via parametrisation (PRIMES is not a spatial model). The refurbishment option to allow carrying higher amounts of hydrogen in the existing network is also considered in the model. PRIMES has a gas module (PRIMES gas supply) allowing for more modelling results, e.g. sources of imports but it is not run as a part of standard PRIMES modelling suite. The question was raised about reflecting the European legislation imposing requirement of readiness for extreme weather conditions (i.e. preparedness for "one in 20 years" type of extreme conditions - referring to gas availability). Currently this is not reflected in PRIMES.
However, the system reliability constraints for the electricity system are fully respected. Currently the legislation applies only to gas storage availability, however it has not yet been applied to the electricity system in view of high levels of heating being dependent on electricity. Such an option could however be modelled in PRIMES - if required - as a sensitivity. The use of backup systems for heating are already now considered in the modelling (i.e. use of gas boilers or electrical resistance type of equipment together with heat pumps for a certain number of hours a year, simulating the drop of temperatures).
Electricity markets representation and possibility to reflect "excess" electricity production: Hourly resolution of the electricity market is now part of standard PRIMES model run as it was implemented for the analytical work underpinning Market Design Initiative proposals (Unit commitment module). The approach to consider only "excess" (i.e. once demand is covered) electricity supply as the one that qualifies for storage and production of e-fuels is, however, overly simplified. The decision to store electricity or produce e-fuels depends on many factors: balancing needs, the market prices of storage and electricity as well as final demand for e-fuels.

asset J u l y , 2 0 1 8
P A G E | 26/62
Assumptions on bio-energy: PRIMES has a biomass module (PRIMES biomass supply) which is part of standard model run and which defines dynamically the supply (taking into account global availability of feedstock according to current knowledge – based on interactions with the GLOBIOM team at IIASA and the CAPRI team at Eurocare- and demand for bio-energy projected by the main PRIMES model). The model then defines which feedstock provides the bio-energy supply and at which cost.
2nd generation/advanced biofuels (as defined by the ILUC Directive) are represented with high granularity with 35 conversion chains (pyrolysis is an option but cellulosic sources are predominant). The costs of feedstock are not consulted as a part of this project.2
Biomass boilers for industrial use are also represented in PRIMES.
Different GHG emissions reduction levels and construction of scenarios: PRIMES can model different levels of GHG reductions that are constraints for the scenarios – both consistent with the ambition of limiting the temperature change to 2°C and the aspirational goal of Paris for 1.5°C. Together with the GAINS model that covers also non-CO2 emissions and the knowledge of land use from GLOBIOM, all GHG emissions and sinks from the EU economy are modelled. For a given level of GHG emissions reduction (at a given time horizon), PRIMES can produce an “infinite” number of pathways of how to achieve the given target. Such pathways will vary in terms of policies pursued, technology developments and, as a consequence, costs. It is possible to construct the scenarios where the predominant energy carrier would be H2 or electricity. Still the model provides a realistic representation and the change is progressive, taking into account the vintages representation whereas equipment gets replaced progressively. More "ambitious" scenarios can be also developed reflecting premature scrapping of equipment but this would most likely lead to higher cost. PRIMES model can also be used to perform sensitivity analysis (e.g. assuming different prospects of technology development) and can present ranges/absolute numbers.
Demand side response: such measures are represented in PRIMES but implicitly by modifying the demand curve (smoothening "peaks" and "valleys") and thus influencing energy costs. PRIMES cannot, however, capture explicit investments into such services.
Costs representation: Investments and entire system costs are reported for the entire EU-28 and country by country. Taxes and subsidies are an important component of cost calculation. For the past, they are obtained from energy taxation tables from TAXUD as well as from the process of MS consultation in the preparation of the Reference scenario. For the future, they are assumed to continue unchanged in real terms throughout projection period – this is an assumption, however, that could be changed if required, as taxation is an exogenous input to the model.
National costs of technologies are sometimes applicable e.g. for buildings but not for technologies that have harmonised performance/costs at EU (or even sometimes global) level such as PVs.
Technologies that have CCS aspect (e.g. gas turbines with CCS) include cost of carbon storage and transport, albeit there is currently a simplification that only transport (and thus storage) within each country is assumed.
2 Costs and availability of feedstock are regularly consulted with the EUCLIMIT consortium (www.euclimit.eu) with the
CAPRI and GLOBIOM teams. Also recently E3M has participated in a study specifically on advanced biofuels in which the Costs and availability of feedstock where updated (https://publications.europa.eu/en/publication-detail/-/publication/448fdae2-00bc-11e8-b8f5-01aa75ed71a1/language-en )

asset J u l y , 2 0 1 8
P A G E | 27/62
Technologies that have a need for transmission (remote RES in power generation) also have these costs added to their capital costs.
The wind and solar potentials reflect wind velocity and solar irradiation, as well as spatial limitations to the extent possible in PRIMES and have impact on costs. Resource potential classes, referring to different resource intensities, are then coupled with cheaper/more expensive equipment that is suitable to the resource intensity for each class.
Life-cycle assessment is not performed; only investment and operation costs are accounted for, as well as emissions in use. In addition to CAPEX, in the system costs the financing costs are reflected. PRIMES considers converging financing conditions across MS – again this is an assumption for the model which could be modified.
Storage: Different technologies of storage are considered (see above) and their use: ancillary services, reserve and seasonal storage. PRIMES uses a fully-fledged unit commitment algorithm, taking into account all the technical constraints of the power plants (cyclic operation, technical minimums) and the system requirements for each type of reserve and balancing. Storage in the form of e-fuels (Hydrogen, gas, liquids) is well represented in the model: batteries are also represented in the model (large and small) to capture the different storage characteristics linked to battery size and type. Importantly, remuneration of storage is not aimed at storage itself but at operation of the entire power system - on the assumption that well-operating market will find a way to finance storage. It was also explained that batteries costs reported in the assumption file circulated referred to stationary uses. Batteries for mobile uses are part of transport assumptions. Transport assumptions were not consulted as part of ASSET project as the Commission has consulted them extensively for the purpose of the recent Mobility packages and the report with relevant assumption is now publicly available3.
Hydrogen: Both electrolysers and steam reformers are represented albeit the latter (if not equipped with CCS) will be increasingly less competitive in scenarios with increasing (ETS) carbon prices. Different gas pressures alongside sizes of refuelling stations are represented in PRIMES. The transmission and decompression stages are considered and reflected in the costs. Both decentralised (local electrolysers) and centralised (with networks carrying H2) infrastructure can be assumed and its respective costs are accounted for and fully passed through to energy costs. Electricity for electrolysers operation can come from dedicated capacity or from the grid.
H2 (if such a pathway is pursued) will not only be produced when prices are low, an equally strong driver is the demand for H2 notably in the industry (that in certain scenarios can be very high). For finding the market equilibrium price of H2 (and any other energy carrier) PRIMES performs iterations of simultaneous decisions in order to find the market equilibrium.
Sector coupling: it can be well reflected in PRIMES. The complexity of sector coupling is that transformation of one sector is heavily dependent on the other (e.g. gas decarbonisation, if to be achieved via e-fuels, requires decarbonisation of electricity generation), therefore a system-wide model such as PRIMES is very well placed for this kind of analysis.
3Please see:
https://ec.europa.eu/clima/sites/clima/files/transport/vehicles/docs/ldv_co2_technologies_and_costs_to_2030_en.pdf

asset J u l y , 2 0 1 8
P A G E | 28/62
Prices projections: both electricity prices and CO2 prices are fully endogenous and result from interaction of all sectors. CO2 prices and the carbon allowance market follow the requirements of the ETS legislation. Conversely, global fossil fuel price projections are an output of another model of E3M (Prometheus) and exogenous for the PRIMES model.
Wind: the question was raised how the link between CAPEX and capacity factor (CF) could be better reflected because currently PRIMES associates high CAPEX with high CF but there could also be lower cost in exploiting high resources (where CF is high). In the feedback received during the consultation phase, it has been pointed out by multiple stakeholders that costs should be higher in the case of onshore installations for very low potential sites and lower for very high potential sites, as the former require plants with larger blades in order to maximise the use of limited resource, and the latter need stronger foundations.
It was indicated that the capacity factors shown in the assumptions are taken into perspective together with the potential of the available potential classes, i.e. even though the low potential class for wind have very low CF, these zones have very limited potential – implying that there are relative few areas in Europe classified in this very low potential area. Therefore, the model utilises in most cases areas with high or very high availability of wind, thus it is the CF of these two classes that is used by the model mostly. In general, CF were criticised as too low (also for the high/very high classes) and PRIMES team agreed to review these assumptions. The need for better labelling of technologies was underlined (identifying notably the floating and fixed bottom technologies). It was explained that offshore CAPEX cost reflect the electricity connection which is important especially for remote locations.
On-site generation: such possibility is important for big industrial players and is reflected in PRIMES model, which splits between utility and industrial applications.
Nuclear: Nuclear CAPEX was discussed in light of recently announced costs (e.g. Hinckley Point C reactors) that are much higher than draft assumptions and opinion of nuclear industry expecting lower costs. It was stressed that the development of nuclear depends not only on the cost of equipment but also on the costs resulting from safety regulations, national legislation and public perception and that assumptions are made for development of European technology in Europe (different from global trends). It was suggested to reflect the learning effects for Generation III reactors considering economies of scale as well as addition, in technology menu, of second generation Small Modular Reactors.
PRIMES already reflects lower costs for Lifetime Operation extensions. For nuclear sites, the PRIMES modelling team has undertaken an analysis to verify where life time extension and brownfield investments are possible.
Back-up capacity for renewables: the requirements of back-up capacity in power generation that increase alongside higher variable renewables penetration are reflected in PRIMES. These requirements are likely to increase with higher demand for electricity coming from transport/heating and even higher deployment of variable renewables. Back-up capacity is represented for peak demand, ancillary services and necessary reserve requirements. PRIMES also reflects that inter-connections contribute to stability of the system. The unit commitment simulator runs all EU countries simultaneously, thus resulting to the optimal allocation of interconnector capacities using flow-based allocation.
Ocean and hydro energy: Further differentiation of technology would be needed for ocean energy, but currently PRIMES represents the technology in aggregated manner only. For hydro, hydro- pumping (for storage), lakes and run of the river are differentiated.

asset J u l y , 2 0 1 8
P A G E | 29/62
Electricity interconnections: PRIMES reflects commissioning of interconnectors as currently scheduled by ENTSO-E. The main operating mode of PRIMES is perfectly functioning internal market and thus flow-based allocation of interconnection. Utilisation of interconnections is endogenous in the model. Imperfect functioning of markets can also be represented in PRIMES and has been already performed as input to Commission's Impact Assessments.
Engine-based power plants: are represented in PRIMES.
Extreme weather conditions: are not standard consideration in PRIMES beyond what is required by the EU/national legislation (see the preparedness requirement for gas sector described above).
Further transparency of the modelling input: a lot of criticism in the past concerned demand-side technologies and solutions. The current project is a steep improvement (notably concerning costs of renovations) – it is also reminded that a new module has been recently developed in order to better reflect the residential and services. Further work is needed and stakeholders voiced interest in seeing also the databases and reviewing them. It is important that experts can have their questions answered by modelling experts in order to better understand the end result. However, it was also stressed that consistent data on the residential and particularly the services sector for all MS, is much more difficult to obtain.
Consistency with eco-design: Eco-design preparatory studies are considered in preparation of technology assumptions, but product categories do not always fully match. There were some reporting bugs in the draft assumption file circulated, including a problem with the unit of measurement for lighting. The revised assumptions have been fully checked again with eco-design legislation and modified accordingly. Related to lighting there was a problem of unit of measurement in the file sent for consultation, this has been corrected in the final file. The methodology for deriving technology progress in the future was explained as well as how "ultimate" status for technology is established (i.e. the floor costs) and the difficulty of doing the latter for the immature technologies. It was also explained that costs are sometimes reported per household rather than unit of appliances as this is more practical for the model – however, for the appliances the units have been adjusted. Labour costs for installing equipment are part of equipment costs. Potential for smart appliances is currently considered only implicitly (smoothening load curve).
Renovations costs: PRIMES has information on national costs from different projects (e.g. ENTRANZE) but as data is not covering all MS, it was necessary to create groups of similar countries. Renovation costs shown do not cover the costs such as scaffolding or other preparatory works which indeed are real life costs and are included in PRIMES. PRIMES differentiates between income groups in terms of their disposable income and thus willingness to conduct renovations. The standards that come from EPBD implementation are reflected. The model does not aim to capture best practices but have figures representative of the practice across the EU
Industry: Currently the PRIMES technology assumptions are expressed per kW of useful energy required in production whereas industry would prefer to convert it into purchasing costs per unit of industrial output. Such a conversion can be done.
Heat pumps: PRIMES numbers are within the range but at the upper bounds particularly in the short term and PRIMES team would like to re-consider them. Hybrid technologies are currently not within the modelling scope, nevertheless back-up systems are considered when necessary (e.g. air source heat pumps with a gas heater). It is difficult to capture seasonal efficiency and variation in outside temperature. For air-source heat-pumps which are the most affected by outside temperatures, regional efficiencies are considered in PRIMES, and they generally are installed with back-up systems. PRIMES team use FEC not PEC (ex-post calculation is possible).

asset J u l y , 2 0 1 8
P A G E | 30/62
Solar thermal collectors: PRIMES represents them. The efficiency is calculated as per kWh thermal output (heat) divided by kWh thermal input (which is captured from the sun in the solar thermal collector). This is nevertheless adjusted on a country by country level, considering the average intensity of solar irradiation in each Member State.
***
In the concluding remarks, the Commission thanked all participants in the meeting as well as those who engaged in bilateral exchanges stressing that it was a very useful exercise for the Commission striving for the best modelling tools and inputs and therefore, the most robust results of modelling. Next steps were explained:
(1) circulation of presentations from the meeting in the next days and
(2) publication of the final report from the project that will also feature final version of technology assumptions (as soon as technology assumptions can be finalised considering some feedback received only during the meeting and the need for further bilateral exchanges).

asset J u l y , 2 0 1 8
P A G E | 31/62
List of stakeholders who participated in the workshop (based on registrations) is presented in the table below.
Table 4: Stakeholders who participated in the workshop on 16 May 2018
1. AEBIOM
2. Amprion
3. APPLiA
4. Aurubis Belgium / ECI / Eurometaux
5. BASF SE
6. BDR THERMEA
7. Bruegel
8. BUSINESSEUROPE
9. CEDEC
10. CEEP
11. CEFIC
12. CEMBUREAU, the European Cement Association
13. CEPI
14. Cerame-Unie
15. CEZ
16. Chance for Buildings
17. Climate Action Network (CAN) Europe
18. CMI Energy
19. COGEN
20. E.V.V.E.
21. ECOS
22. EDP - ENERGIAS DE PORTUGAL
23. EGEC-geothermal
24. ENTSOG
25. EPPSA
26. ESTELA
27. EUGINE - European Engine Power Plants Association
28. EURELECTRIC
29. Eurima
30. EUROFUEL / INFORMAZOUT
31. Eurogas
32. EUROHEAT & POWER
33. EUROMETAUX
34. EuropaInsights
35. European Aluminium
36. European Copper Institute
37. European Environmental Bureau
38. European Heating Industry (EHI)
39. European Steel Association (EUROFER)

asset J u l y , 2 0 1 8
P A G E | 32/62
40. FECER - CEC
41. Federation of Austrian Industries (IV)
42. Federation of German Industries (BDI)
43. Fern
44. FORATOM
45. Fraunhofer ISI
46. FuelsEurope
47. GAS NATURAL FENOSA
48. GdW
49.
German Chemical Industry Association (VCI)
50. Glass for Europe
51. Global CCS Institute
52. Greenpeace
53. Heinrich Böll Foundation
54. Hydrogen Europe
55. IBTC
56. Interel EU (on behalf of ChargePoint)
57. International Union of Property Owners
58. MaREI UCC
59. MHPSE
60. Ocean Energy Europe
61. OpenExp
62. Prognos AG
63. Renewables Grid Initiative
64. Robert Bosch GmbH
65. ROCKWOOL International
66. Saint-Gobain
67. smartEn
68. Solar Heat Europe
69. SolarPower Europe
70. The Coalition for Energy Savings
71.
The European Association for Storage of Energy - EASE a.i.s.b.l.
72. Thüga Aktiengesellschaft
73. thyssenkrupp AG
74. TOTAL
75. Tractebel
76. Transport & Environment

asset J u l y , 2 0 1 8
P A G E | 33/62
77. UN Environment - Finance Initiaitve
78. Valmet Technologies
79. VDMA
80. Veolia
81. Wind Europe
82. WirtschaftsVereinigung Metalle e.V.
83. WWF
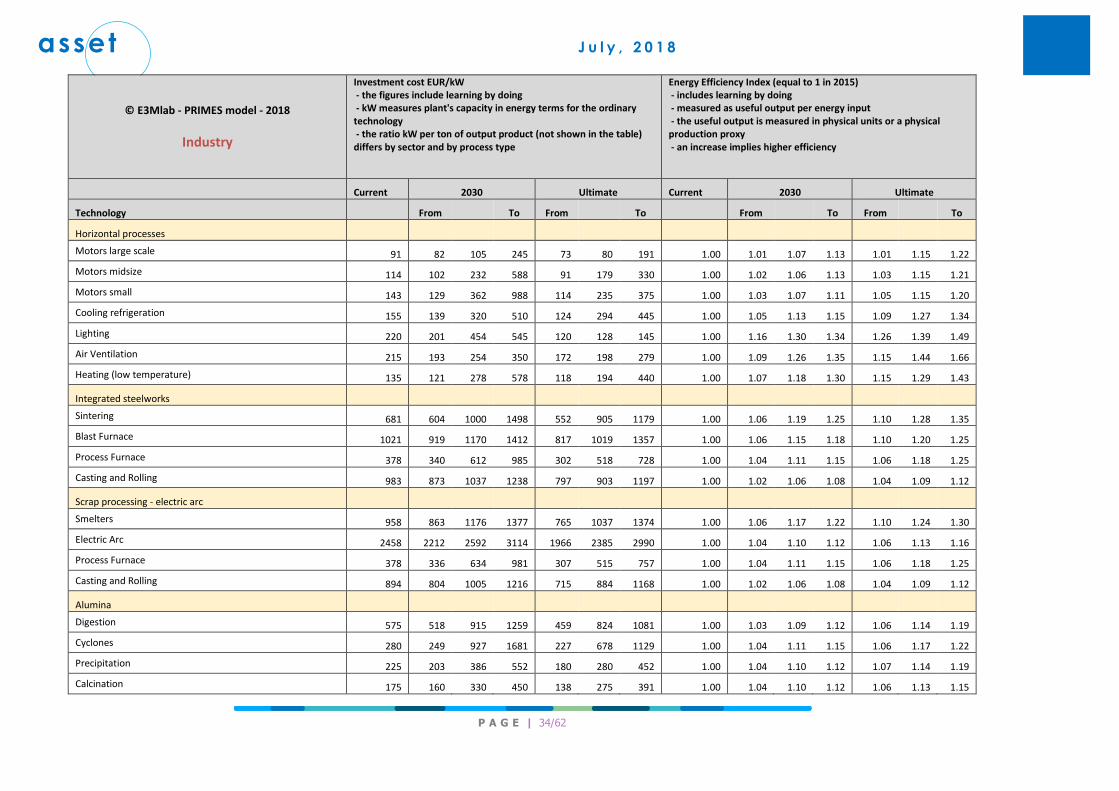
9 FINAL DATA SET The final data set of PRIMES technology assumptions was modified based on the comments received and
additional literature review. The final data set was internally reviewed and established in agreement with
the European Commission and is presented in the next pages.
asset J u l y , 2 0 1 8
P A G E | 34/62
© E3Mlab - PRIMES model - 2018
Industry
Investment cost EUR/kW - the figures include learning by doing - kW measures plant's capacity in energy terms for the ordinary technology - the ratio kW per ton of output product (not shown in the table) differs by sector and by process type
Energy Efficiency Index (equal to 1 in 2015) - includes learning by doing - measured as useful output per energy input - the useful output is measured in physical units or a physical production proxy - an increase implies higher efficiency
Current 2030 Ultimate Current 2030 Ultimate
Technology From To From To From To From To
Horizontal processes
Motors large scale 91 82 105 245 73 80 191 1.00 1.01 1.07 1.13 1.01 1.15 1.22
Motors midsize 114 102 232 588 91 179 330 1.00 1.02 1.06 1.13 1.03 1.15 1.21
Motors small 143 129 362 988 114 235 375 1.00 1.03 1.07 1.11 1.05 1.15 1.20
Cooling refrigeration 155 139 320 510 124 294 445 1.00 1.05 1.13 1.15 1.09 1.27 1.34
Lighting 220 201 454 545 120 128 145 1.00 1.16 1.30 1.34 1.26 1.39 1.49
Air Ventilation 215 193 254 350 172 198 279 1.00 1.09 1.26 1.35 1.15 1.44 1.66
Heating (low temperature) 135 121 278 578 118 194 440 1.00 1.07 1.18 1.30 1.15 1.29 1.43
Integrated steelworks
Sintering 681 604 1000 1498 552 905 1179 1.00 1.06 1.19 1.25 1.10 1.28 1.35
Blast Furnace 1021 919 1170 1412 817 1019 1357 1.00 1.06 1.15 1.18 1.10 1.20 1.25
Process Furnace 378 340 612 985 302 518 728 1.00 1.04 1.11 1.15 1.06 1.18 1.25
Casting and Rolling 983 873 1037 1238 797 903 1197 1.00 1.02 1.06 1.08 1.04 1.09 1.12
Scrap processing - electric arc
Smelters 958 863 1176 1377 765 1037 1374 1.00 1.06 1.17 1.22 1.10 1.24 1.30
Electric Arc 2458 2212 2592 3114 1966 2385 2990 1.00 1.04 1.10 1.12 1.06 1.13 1.16
Process Furnace 378 336 634 981 307 515 757 1.00 1.04 1.11 1.15 1.06 1.18 1.25
Casting and Rolling 894 804 1005 1216 715 884 1168 1.00 1.02 1.06 1.08 1.04 1.09 1.12
Alumina
Digestion 575 518 915 1259 459 824 1081 1.00 1.03 1.09 1.12 1.06 1.14 1.19
Cyclones 280 249 927 1681 227 678 1129 1.00 1.04 1.11 1.15 1.06 1.17 1.22
Precipitation 225 203 386 552 180 280 452 1.00 1.04 1.10 1.12 1.07 1.14 1.19
Calcination 175 160 330 450 138 275 391 1.00 1.04 1.10 1.12 1.06 1.13 1.15

asset J u l y , 2 0 1 8
P A G E | 35/62
© E3Mlab - PRIMES model - 2018
Industry
Investment cost EUR/kW - the figures include learning by doing - kW measures plant's capacity in energy terms for the ordinary technology - the ratio kW per ton of output product (not shown in the table) differs by sector and by process type
Energy Efficiency Index (equal to 1 in 2015) - includes learning by doing - measured as useful output per energy input - the useful output is measured in physical units or a physical production proxy - an increase implies higher efficiency
Current 2030 Ultimate Current 2030 Ultimate
Technology From To From To From To From To
Primary Aluminium
Alumina refining 391 347 716 1247 317 549 860 1.00 1.03 1.09 1.12 1.04 1.14 1.20
Smelting 534 481 1978 3457 427 1875 3048 1.00 1.05 1.15 1.20 1.08 1.21 1.25
Casting and Rolling 670 603 750 883 536 660 874 1.00 1.02 1.06 1.08 1.04 1.09 1.12
Primary Copper
Pyrometallurgy 1820 1640 2189 2563 1454 1926 2562 1.00 1.05 1.13 1.16 1.09 1.18 1.22
Fire refining 790 711 878 1015 632 724 960 1.00 1.04 1.10 1.12 1.07 1.14 1.18
Electrorefining 2178 1986 2615 3205 1719 2321 3069 1.00 1.03 1.09 1.12 1.06 1.14 1.20
Secondary Aluminium
Srap processing 293 260 654 1074 238 545 881 1.00 1.03 1.09 1.11 1.05 1.13 1.18
Melting Refining 567 511 945 1401 453 859 1147 1.00 1.03 1.09 1.12 1.04 1.13 1.16
Casting and Rolling 421 379 571 834 337 548 822 1.00 1.02 1.06 1.08 1.03 1.09 1.12
Ferro-alloys
Pyrometallurgy 874 786 1187 1645 699 985 1531 1.00 1.05 1.13 1.16 1.09 1.18 1.22
Fire refining 771 703 1127 1548 609 872 1368 1.00 1.04 1.10 1.12 1.07 1.14 1.18
Electrorefining 1512 1361 1722 2300 1210 1525 2176 1.00 1.03 1.09 1.12 1.06 1.14 1.20
Casting and Rolling 655 582 908 1203 531 820 1042 1.00 1.02 1.07 1.09 1.03 1.10 1.12
Fertilizers
Electric Processes 810 729 1187 1558 648 987 1308 1.00 1.03 1.08 1.10 1.05 1.12 1.15
Steam 136 121 447 797 110 345 676 1.00 1.03 1.08 1.10 1.04 1.12 1.16
Thermal Processes 333 295 875 1457 270 751 1154 1.00 1.04 1.15 1.22 1.07 1.24 1.30
Petrochemicals
Electric Processes 845 761 1137 1587 676 1021 1337 1.00 1.03 1.08 1.10 1.05 1.12 1.15

asset J u l y , 2 0 1 8
P A G E | 36/62
© E3Mlab - PRIMES model - 2018
Industry
Investment cost EUR/kW - the figures include learning by doing - kW measures plant's capacity in energy terms for the ordinary technology - the ratio kW per ton of output product (not shown in the table) differs by sector and by process type
Energy Efficiency Index (equal to 1 in 2015) - includes learning by doing - measured as useful output per energy input - the useful output is measured in physical units or a physical production proxy - an increase implies higher efficiency
Current 2030 Ultimate Current 2030 Ultimate
Technology From To From To From To From To
Steam 136 123 410 874 109 394 664 1.00 1.03 1.08 1.10 1.04 1.12 1.16
Thermal Processes 423 381 818 1498 339 798 1407 1.00 1.05 1.16 1.22 1.09 1.24 1.30
Inorganic and basic chemicals
Electric Processes 681 613 953 1428 544 862 1128 1.00 1.02 1.07 1.10 1.03 1.11 1.12
High Enthlapy Heat 136 121 748 1317 110 345 672 1.00 1.03 1.08 1.10 1.04 1.12 1.16
Thermal Processes 333 299 748 1317 266 697 1297 1.00 1.05 1.16 1.22 1.09 1.24 1.30
Pulp
Pulping 635 572 945 1281 508 774 1115 1.00 1.04 1.10 1.13 1.07 1.14 1.18
Refining bleaching 529 476 835 1183 423 725 1029 1.00 1.04 1.10 1.12 1.06 1.14 1.19
Drying and Separation 857 761 1159 1789 695 1005 1677 1.00 1.05 1.14 1.18 1.09 1.20 1.25
Papermaking 571 514 1274 2016 457 1179 1670 1.00 1.05 1.15 1.20 1.09 1.23 1.33
Paper making
Pulping 529 476 846 1105 423 666 1054 1.00 1.03 1.08 1.10 1.06 1.11 1.16
Refining bleaching 287 262 603 978 227 554 853 1.00 1.04 1.10 1.12 1.06 1.14 1.17
Drying and Separation 514 463 850 1245 411 768 1003 1.00 1.05 1.14 1.18 1.09 1.20 1.25
Cement
Milling 308 281 529 853 243 413 639 1.00 1.03 1.06 1.07 1.04 1.08 1.10
Prehating Drying 190 169 330 845 154 303 632 1.00 1.02 1.05 1.11 1.04 1.10 1.15
Cement Kiln 373 336 587 918 299 399 776 1.00 1.03 1.06 1.08 1.05 1.09 1.12
Grinding 385 342 795 1260 312 592 879 1.00 1.03 1.08 1.10 1.06 1.12 1.15
Basic Glass
Batch 350 315 646 1235 280 488 766 1.00 1.04 1.09 1.12 1.06 1.15 1.22
Melting Glass 420 373 508 778 341 433 595 1.00 1.03 1.07 1.10 1.04 1.13 1.19

asset J u l y , 2 0 1 8
P A G E | 37/62
© E3Mlab - PRIMES model - 2018
Industry
Investment cost EUR/kW - the figures include learning by doing - kW measures plant's capacity in energy terms for the ordinary technology - the ratio kW per ton of output product (not shown in the table) differs by sector and by process type
Energy Efficiency Index (equal to 1 in 2015) - includes learning by doing - measured as useful output per energy input - the useful output is measured in physical units or a physical production proxy - an increase implies higher efficiency
Current 2030 Ultimate Current 2030 Ultimate
Technology From To From To From To From To
Forehearth 420 378 673 1188 336 549 797 1.00 1.03 1.10 1.13 1.06 1.16 1.22
Annealing 580 522 704 938 464 627 825 1.00 1.02 1.07 1.10 1.04 1.11 1.16
Ceramics
Milling Calcinating 821 729 916 1158 666 803 1059 1.00 1.03 1.07 1.09 1.04 1.10 1.12
Drying and Separation 205 184 364 582 164 299 432 1.00 1.04 1.11 1.14 1.06 1.16 1.21
Firing 350 315 588 1014 280 457 701 1.00 1.03 1.10 1.13 1.06 1.16 1.22
Treatment 327 294 439 672 261 397 516 1.00 1.02 1.07 1.10 1.04 1.11 1.16
Other non metallic minerals
Drying 158 143 383 693 127 232 453 1.00 1.05 1.10 1.13 1.09 1.15 1.22
Milling 293 264 459 782 234 349 543 1.00 1.03 1.08 1.10 1.05 1.13 1.19
Kiln 360 324 463 682 288 352 533 1.00 1.05 1.08 1.10 1.07 1.12 1.19
Grinding 293 268 438 619 232 349 518 1.00 1.03 1.09 1.11 1.06 1.12 1.17
Food drink and tobacco
Refrigeration 232 209 758 1454 186 542 813 1.00 1.05 1.19 1.27 1.09 1.29 1.34
Drying and Separation 590 538 1548 2712 466 875 1467 1.00 1.11 1.28 1.39 1.18 1.45 1.67
Steam 227 201 560 1094 184 459 732 1.00 1.02 1.07 1.10 1.04 1.12 1.15
Direct Heat 681 613 790 1225 544 635 912 1.00 1.04 1.09 1.12 1.07 1.15 1.22
Textiles and leather
Machinery 643 586 1406 2166 507 986 1247 1.00 1.03 1.09 1.12 1.06 1.13 1.15
Steam processing 681 613 911 1364 544 825 1151 1.00 1.02 1.07 1.10 1.04 1.12 1.16
Drying 735 662 1247 1795 587 1011 1477 1.00 1.05 1.12 1.15 1.09 1.18 1.25
Finishing 635 564 1138 1822 515 867 1346 1.00 1.03 1.08 1.10 1.06 1.12 1.17
Engineering and equipment industry

asset J u l y , 2 0 1 8
P A G E | 38/62
© E3Mlab - PRIMES model - 2018
Industry
Investment cost EUR/kW - the figures include learning by doing - kW measures plant's capacity in energy terms for the ordinary technology - the ratio kW per ton of output product (not shown in the table) differs by sector and by process type
Energy Efficiency Index (equal to 1 in 2015) - includes learning by doing - measured as useful output per energy input - the useful output is measured in physical units or a physical production proxy - an increase implies higher efficiency
Current 2030 Ultimate Current 2030 Ultimate
Technology From To From To From To From To
Refrigeration 232 209 488 781 186 448 679 1.00 1.05 1.19 1.27 1.09 1.28 1.34
Machinery 643 579 1417 2132 514 1005 1521 1.00 1.03 1.09 1.12 1.06 1.13 1.15
Steam processing 635 572 902 1202 508 746 1011 1.00 1.02 1.06 1.08 1.04 1.09 1.12
Foundries 718 638 800 1038 582 703 924 1.00 1.03 1.07 1.09 1.05 1.10 1.12
Other industries
Machinery 643 571 1346 2050 521 946 1241 1.00 1.03 1.09 1.12 1.06 1.13 1.27
Steam processing 227 204 617 1096 181 459 761 1.00 1.02 1.07 1.10 1.04 1.12 1.16
Drying Wood Rubber Plastics 650 593 954 1280 513 859 1110 1.00 1.03 1.09 1.12 1.06 1.14 1.18
Refrigeration 232 209 855 1559 186 543 790 1.00 1.05 1.19 1.27 1.09 1.29 1.34
Fire heaters 681 613 743 1246 544 712 1066 1.00 1.02 1.06 1.10 1.04 1.11 1.14
Notes
a) The model has a more detailed representation of the technology possibilities than shown in the table. For every item, the model considers a range of seven technology categories, ordered from an ordinary
up to an advanced and a future category. The technical and economic characteristics of eaxh technology category change over time as a result of learning by doing and economies of scale in industrial
production. Not all technology categories are considered as fully mature from a user's perspective, but in general the users' acceptance of advanced technology categories increases over time. Policy
assumptions may drive acceleration of learning-by-doing and users' acceptance in the context of a scenario. An advanced technology category is more efficient than an ordinary one and in general more
expensive to purchase at a given point in time. However, depending on the learning potential of a technology it is possible that an advanced technology becomes cheaper than ordinary technology in the long-
term and still more efficient. For currently mature technologies this is generally unlikely to happen.
In the table above, which shows a summary of the model's data, there is matching between purchasing costs and efficiency rates over time.
b) The first column of the data refers to an estimation of current costs and efficiencies. The second column refers to a technology category which is the most cost-efficient in the medium term, as the more
efficient technologies are not yet fully mature. The third column refers to the ultimate possibilities of the most advanced technology, as included in the model's dataset.

asset J u l y , 2 0 1 8
P A G E | 39/62
© E3Mlab - PRIMES model - 2018
Domestic
Purchasing cost Efficiency
Current 2030 Ultimate Current 2030 Ultimate
From To From To From To From To
in EUR/appl kWh/appliance
Electric Appliances
Dryers 554 495 685 803 387 680 791 316 280 226 214 272 175 144
Dishwashers 489 470 543 765 436 539 753 249 235 214 185 232 200 133
Refrigerators and freezers 574 547 733 867 496 728 854 219 215 171 152 210 115 72
Washing machines 585 539 604 795 454 538 783 212 198 176 144 195 155 84
in EUR/appl kWh/Household
Lighting 5 4 6 11 2 5 11 43 38 31 25 37 26 14
Current 2030 Ultimate Current 2030 Ultimate
From To From To From To From To
Technology in EUR/kW %
Cooking
Cooker, oven and hobs (electric) 183 171 187 260 150 180 231 0.79 0.80 0.82 0.87 0.80 0.87 0.93
Cooker, oven and hobs (gas) 191 179 195 258 157 188 240 0.42 0.42 0.44 0.45 0.43 0.46 0.47
Space Heating
Boilers Gas 157 154 180 220 148 179 217 0.79 0.81 0.85 0.87 0.81 0.89 0.94
Boilers condensing Gas 195 191 224 273 171 210 237 0.87 0.89 0.93 0.96 0.90 0.98 1.03
Boilers Oil 162 158 185 226 153 174 223 0.77 0.79 0.83 0.85 0.79 0.87 0.94
Boilers condensing Oil 201 196 230 281 176 216 244 0.85 0.87 0.92 0.94 0.88 0.97 1.02
Wood stoves or Boiler pellets 410 401 471 610 373 442 590 0.72 0.74 0.77 0.79 0.74 0.79 0.81
Heat Pump Air
in South Countries 2.65 2.86 3.29 3.58 2.88 4.19 4.90
in Middle South countries 2.38 2.56 2.95 3.21 2.58 3.75 4.39
in Middle North countries 784 603 835 1080 267 673 1030 2.17 2.33 2.69 2.93 2.35 3.42 4.00
in North countries 1.98 2.13 2.45 2.67 2.14 3.12 3.65
Heat Pump Water 1036 847 1104 1428 487 960 1287 3.30 3.55 4.10 4.52 3.58 4.98 5.73
Heat Pump Ground 1695 1385 1805 2335 1203 1570 1774 3.60 3.88 4.47 4.93 3.90 5.43 5.94
Heat Pump Gas 1176 904 1194 1512 400 942 1339 1.30 1.40 1.61 1.78 1.41 1.96 2.14
Electric Resistance (e.g. convectors) 60 60 76 80 60 69 79 0.99 0.99 1.00 1.00 0.99 1.00 1.00
Gas individual (autonomous heater) 134 133 168 221 132 161 218 0.82 0.87 0.91 0.93 0.88 0.95 1.03
Solar Thermal 1250 1158 1383 1635 955 1200 1347 0.58 0.59 0.61 0.62 0.60 0.63 0.65
CHP ICE 2800 2345 2840 3145 1945 2450 2975 0.65 0.66 0.68 0.69 0.66 0.70 0.71

asset J u l y , 2 0 1 8
P A G E | 40/62
© E3Mlab - PRIMES model - 2018
Domestic
Purchasing cost Efficiency
Current 2030 Ultimate Current 2030 Ultimate
From To From To From To From To
Technology in EUR/kW %
CHP micro CCGT 4000 3631 4208 4825 2945 3825 4232 0.60 0.63 0.66 0.69 0.63 0.72 0.75
CHP Fuel Cell 10000 8456 9945 11467 3502 4576 5600 0.65 0.69 0.71 0.73 0.71 0.73 0.75
District heating 91 88 107 133 83 100 131 0.72 0.73 0.74 0.75 0.74 0.76 0.78
Water Heating
Water heating boiler (diesel) 342 334 392 479 323 390 492 0.70 0.72 0.75 0.77 0.72 0.77 0.80
Water heating boiler (electricity) 110 109 122 149 92 110 140 0.90 0.91 0.93 0.95 0.92 0.96 0.99
Water heating boiler (natural gas) 188 183 224 264 174 207 260 0.77 0.81 0.86 0.88 0.82 0.90 0.99
Solar collector 254 240 290 343 215 288 338 0.58 0.59 0.61 0.63 0.60 0.63 0.65
Water heating heat pump 318 311 352 382 298 300 319 2.40 2.60 2.88 3.01 2.64 3.08 3.60
Water heating combined with district heating 85 82 94 117 68 76 92 0.72 0.73 0.74 0.75 0.74 0.76 0.78
Air Conditioning
Electric Air conditioning 195 189 262 353 177 250 348 2.34 2.42 2.93 3.34 2.56 3.75 4.32
Electric Air conditioning central 434 421 584 786 395 557 775 2.50 2.59 3.13 3.57 2.73 3.67 4.34
Notes a) The model has a more detailed representation of the technology possibilities than shown in the table. For every item, the model considers a range of seven technology categories, ordered from an ordinary up to an advanced and a future category. The technical and economic characteristics of eaxh technology category change over time as a result of learning by doing and economies of scale in industrial production. Not all technology categories are considered as fully mature from a user's perspective, but in general the users' acceptance of advanced technology categories increases over time. Policy assumptions may drive acceleration of learning-by-doing and users' acceptance in the context of a scenario. An advanced technology category is more efficient than an ordinary one and in general more expensive to purchase at a given point in time. However, depending on the learning potential of a technology it is possible that an advanced technology becomes cheaper than ordinary technology in the long-term and still more efficient. For currently mature technologies this is generally unlikely to happen. In the table above, which shows a summary of the model's data, there is matching between purchasing costs and efficiency rates over time. b) The first column of the data refers to an estimation of current costs and efficiencies. The second column refers to a technology category which is the most cost-efficient in the medium term, as the more efficient technologies are not yet fully mature. The third column refers to the ultimate possibilities of the most advanced technology, as included in the model's dataset. c) Purchasing Costs are total acquisition costs, where for geothermal heat pumps also the drilling costs are included. d) The efficiencies indicated are nominal efficiencies and not seasonal energy efficiencies. e) Back-up systems are considered in the model, and where applicable are part of the purchasing costs and reflected in the average efficiency rates. This explains the difference of heat pump efficiencies across regions in Europe. f) The efficiency rates for cogeneration (CHP) systems refers to both electricity and heat outputs. g) In case of combined space and water heaters, the purchasing costs for water heating apply to the additional purchasing costs to cover water heating.
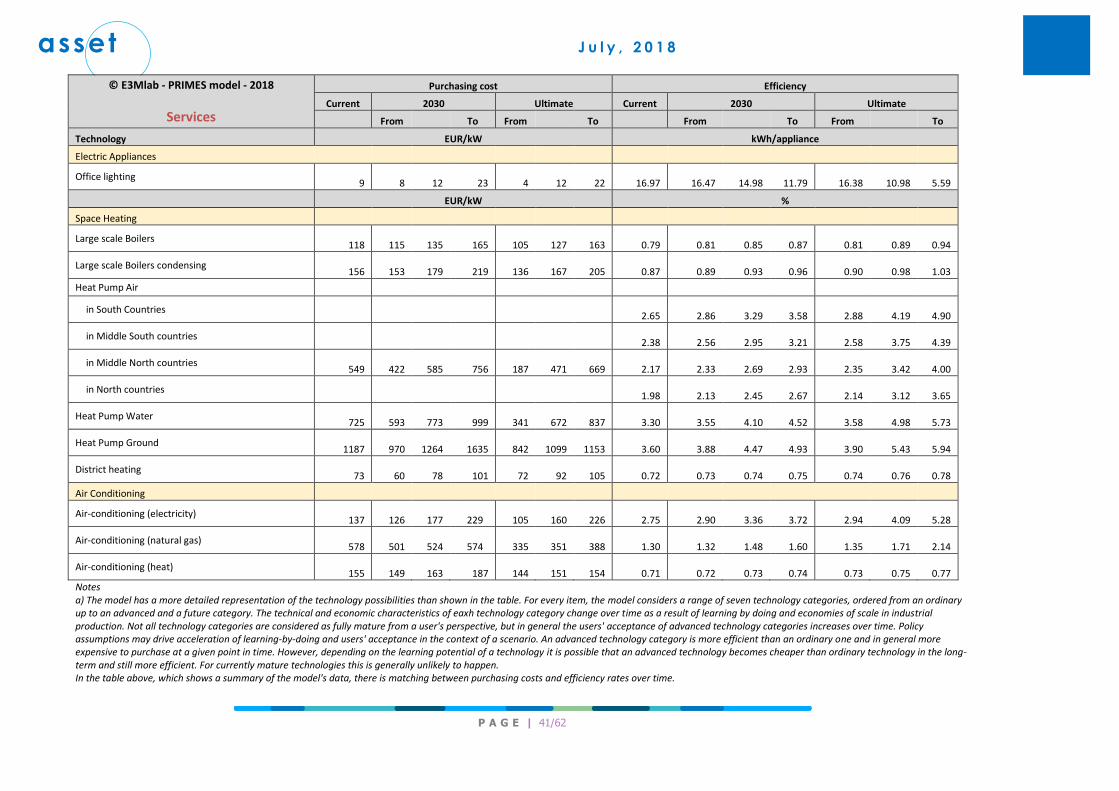
asset J u l y , 2 0 1 8
P A G E | 41/62
© E3Mlab - PRIMES model - 2018
Services
Purchasing cost Efficiency
Current 2030 Ultimate Current 2030 Ultimate
From To From To From To From To
Technology EUR/kW kWh/appliance
Electric Appliances
Office lighting 9 8 12 23 4 12 22 16.97 16.47 14.98 11.79 16.38 10.98
5.59
EUR/kW %
Space Heating
Large scale Boilers 118 115 135 165 105 127 163 0.79 0.81 0.85 0.87 0.81 0.89
0.94
Large scale Boilers condensing 156 153 179 219 136 167 205 0.87 0.89 0.93 0.96 0.90 0.98
1.03
Heat Pump Air
in South Countries 2.65 2.86 3.29 3.58 2.88 4.19
4.90
in Middle South countries 2.38 2.56 2.95 3.21 2.58 3.75
4.39
in Middle North countries 549 422 585 756 187 471 669 2.17 2.33 2.69 2.93 2.35 3.42
4.00
in North countries 1.98 2.13 2.45 2.67 2.14 3.12
3.65
Heat Pump Water 725 593 773 999 341 672 837 3.30 3.55 4.10 4.52 3.58 4.98
5.73
Heat Pump Ground 1187 970 1264 1635 842 1099 1153 3.60 3.88 4.47 4.93 3.90 5.43
5.94
District heating 73 60 78 101 72 92 105 0.72 0.73 0.74 0.75 0.74 0.76
0.78
Air Conditioning
Air-conditioning (electricity) 137 126 177 229 105 160 226 2.75 2.90 3.36 3.72 2.94 4.09
5.28
Air-conditioning (natural gas) 578 501 524 574 335 351 388 1.30 1.32 1.48 1.60 1.35 1.71
2.14
Air-conditioning (heat) 155 149 163 187 144 151 154 0.71 0.72 0.73 0.74 0.73 0.75
0.77
Notes a) The model has a more detailed representation of the technology possibilities than shown in the table. For every item, the model considers a range of seven technology categories, ordered from an ordinary up to an advanced and a future category. The technical and economic characteristics of eaxh technology category change over time as a result of learning by doing and economies of scale in industrial production. Not all technology categories are considered as fully mature from a user's perspective, but in general the users' acceptance of advanced technology categories increases over time. Policy assumptions may drive acceleration of learning-by-doing and users' acceptance in the context of a scenario. An advanced technology category is more efficient than an ordinary one and in general more expensive to purchase at a given point in time. However, depending on the learning potential of a technology it is possible that an advanced technology becomes cheaper than ordinary technology in the long-term and still more efficient. For currently mature technologies this is generally unlikely to happen. In the table above, which shows a summary of the model's data, there is matching between purchasing costs and efficiency rates over time.

asset J u l y , 2 0 1 8
P A G E | 42/62
b) The first column of the data refers to an estimation of current costs and efficiencies. The second column refers to a technology category which is the most cost-efficient in the medium term, as the more efficient technologies are not yet fully mature. The third column refers to the ultimate possibilities of the most advanced technology, as included in the model's dataset. c) Purchasing Costs are total acquisition costs, where for geothermal heat pumps also the drilling costs are included. d) The efficiencies indicated are nominal efficiencies and not seasonal energy efficiencies. e) Back-up systems are considered in the model, and where applicable are part of the purchasing costs and reflected in the average efficiency rates. This explains the difference of heat pump efficiencies across regions in Europe. f) The efficiency rates for cogeneration (CHP) systems refers to both electricity and heat outputs. g) In case of combined space and water heaters, the purchasing costs for water heating apply to the additional purchasing costs to cover water heating.

asset J u l y , 2 0 1 8
P A G E | 43/62
© E3Mlab - PRIMES model - 2018
Renovation for residential buildings
Regions Type of renovation measure (building envelope refurbishment) Energy savings
(%)
Investment Costs (Euro/Household)
Investment Costs (Euro/square meter)
Centre/West
Light renovation (light windows) 12% 5565 77
Light renovation (med. windows) 16% 6115 85
Light renovation (med. windows,light wall) 44% 10449 145
Light renovation (med. windows, light wall/roof) 61% 13757 191
Medium renovation (med. windows, med.wall/roof/basement) 69% 16505 230
Medium renovation (deep windows, med.wall/roof/basement) 73% 18679 260
Deep renovation (deep. windows, med.wall/roof/basement) 76% 21204 295
Deep renovation (deep. windows, deep wall/roof/basement) 78% 23932 333
North
Light renovation (light windows) 8% 2797 33
Light renovation (med. windows) 22% 6814 80
Light renovation (med. windows,light wall) 37% 11164 132
Light renovation (med. windows, light wall/roof) 55% 15076 178
Medium renovation (med. windows, med.wall/roof/basement) 67% 17221 203
Medium renovation (deep windows, med.wall/roof/basement) 74% 19164 226
Deep renovation (deep. windows, med.wall/roof/basement) 82% 22465 265
Deep renovation (deep. windows, deep wall/roof/basement) 87% 25702 303
South
Light renovation (light windows) 10% 4142 58
Light renovation (med. windows) 16% 4675 65
Light renovation (med. windows,light wall) 36% 7226 101
Light renovation (med. windows, light wall/roof) 49% 10368 144
Medium renovation (med. windows, med.wall/roof/basement) 56% 13128 183
Medium renovation (deep windows, med.wall/roof/basement) 65% 16169 225
Deep renovation (deep. windows, med.wall/roof/basement) 69% 17741 247
Deep renovation (deep. windows, deep wall/roof/basement) 75% 20603 287
East
Light renovation (light windows) 8% 2832 41
Light renovation (med. windows) 13% 3420 50
Light renovation (med. windows,light wall) 34% 5620 82
Light renovation (med. windows, light wall/roof) 48% 7155 105
Medium renovation (med. windows, med.wall/roof/basement) 56% 8563 125
Medium renovation (deep windows, med.wall/roof/basement) 62% 10096 148
Deep renovation (deep. windows, med.wall/roof/basement) 65% 11332 166
Deep renovation (deep. windows, deep wall/roof/basement) 69% 13233 194
Notes
a) Investment costs are the energy related expenditures needed to implement the indicated deepness level of building renovation, excluding usual
renovation expenditures needed for other purposes (structure, finishing materials, decoration etc.)
b) The energy savings rate refers to a typical building as in the current stock of existing buildings (not savings in new constructions, which follow the
buildings codes' insulation standards)
c) The data in the table are a summary of the data in the model which are more detailed and include several house types, house ages and
geographical categories

asset J u l y , 2 0 1 8
P A G E | 44/62
©E3Mlab PRIMES model-
2018
Power generation technologies
Overnight Investment Costs in a greenfield site,
excluding financial costs during construction time
Fixed Operation and Maintenance costs, annually Variable non fuel cost
Electrical Efficiency (net) in optimal load operation Self-Consumption of electricity
EUR/kW EUR/kW EUR/MWh ratio %
2020 2030 2040 2050 2020 2030 2040 2050 2020 2030 2040 2050 2020 2030 2040 2050 2020 2030 2040 2050
Steam Turbine Coal Conventional 1600 1600 1600 1600 25.6 25.6 25.6 25.6 2.40 2.40 2.40 2.40 0.38 0.42 0.43 0.43 0.09 0.09 0.09 0.09 Steam Turbine Lignite Conventional 1800 1800 1800 1800 32.5 32.5 32.5 32.5 3.00 3.00 3.00 3.00 0.37 0.38 0.37 0.37 0.12 0.12 0.12 0.12 Steam Turbine Coal Supercritical 1700 1700 1700 1700 41.5 35.7 31.7 30.9 3.63 3.51 3.38 3.35 0.45 0.46 0.47 0.47 0.07 0.07 0.07 0.07 Steam Turbine Lignite Supercritical 2000 2000 2000 2000 46.8 42.4 39.4 38.8 4.16 4.01 2.85 2.70 0.41 0.42 0.43 0.44 0.10 0.10 0.10 0.10 Fluidized Bed Combustion Coal 1900 1900 1900 1900 35.2 35.2 35.2 35.2 2.83 2.83 2.83 2.83 0.40 0.41 0.42 0.42 0.06 0.06 0.06 0.06 Fluidized Bed Combustion Lignite 2280 2280 2280 2280 42.2 42.2 42.2 42.2 4.40 4.40 4.40 4.40 0.38 0.39 0.40 0.40 0.12 0.12 0.12 0.12 Integrated Gasification Combined Cycle Coal 2400 2300 2250 2150 46.8 44.9 43.9 41.9 5.16 4.96 4.78 4.60 0.46 0.48 0.49 0.50 0.09 0.09 0.09 0.09
Gas Turbine Combined Cycle Gas Conventional 720 690 660 640 15.0 15.0 15.0 15.0 2.31 2.31 2.31 2.31 0.57 0.58 0.59 0.59 0.03 0.03 0.03 0.03 Gas Turbine Combined Cycle Gas Advanced 820 770 750 750 15.0 15.0 15.0 15.0 1.99 1.90 1.81 1.73 0.60 0.61 0.62 0.63 0.02 0.02 0.02 0.02 Steam Turbine Fuel Oil Conventional 1200 1200 1200 1200 20.7 20.7 20.7 20.7 2.76 2.76 2.76 2.76 0.35 0.35 0.35 0.35 0.05 0.05 0.05 0.05 Gas turbine with heat recovery 800 700 650 600 15.0 15.0 15.0 15.0 3.50 3.50 3.50 3.50 0.35 0.37 0.39 0.40 0.01 0.01 0.01 0.01
Very small scale Gas Plant 939 921 917 913 23.5 20.0 18.8 17.6 0.71 0.71 0.71 0.71 0.35 0.36 0.36 0.37 0.01 0.01 0.01 0.01
Pulverised Lignite Suprcritical CCS post combustion 3600 3420 3250 3200 68.6 65.0 61.6 60.6 6.24 6.02 4.28 4.04 0.32 0.33 0.34 0.35 0.33 0.30 0.28 0.28 Integrated Gasification Coal CCS pre combustion 3550 3350 3250 3150 69.8 65.9 63.9 61.9 7.74 7.44 7.17 6.91 0.37 0.39 0.40 0.41 0.32 0.27 0.25 0.25 Integrated Gasification Lignitel CCS pre combustion 3950 3750 3650 3550 77.6 73.6 71.6 69.6 6.38 6.15 5.95 5.75 0.34 0.37 0.38 0.39 0.35 0.29 0.26 0.26 Pulverised Coal Suprcritical CCS oxyfuel 3400 3150 2890 2850 75.5 64.7 55.5 53.9 6.06 5.86 5.64 5.59 0.36 0.37 0.38 0.38 0.32 0.27 0.24 0.24 Pulverised Lignite Suprcritical CCS oxyfuel 3800 3550 3350 3300 72.6 67.6 63.6 62.6 6.94 6.70 4.76 4.50 0.32 0.33 0.34 0.35 0.34 0.28 0.25 0.25 Gas combined cycle CCS post combustion 1750 1625 1500 1500 41.0 38.2 35.0 34.3 3.10 2.99 2.88 2.78 0.43 0.46 0.48 0.49 0.22 0.18 0.16 0.16 Gas combined cycle CCS oxyfuel 2013 1820 1650 1628 46.3 42.1 38.0 36.8 3.45 3.34 3.20 3.07 0.40 0.46 0.49 0.50 0.27 0.19 0.15 0.14
Steam Turbine Biomass 2000 1800 1700 1700 47.5 40.1 39.2 38.4 3.56 3.56 3.56 3.56 0.35 0.39 0.40 0.40 0.10 0.10 0.10 0.10
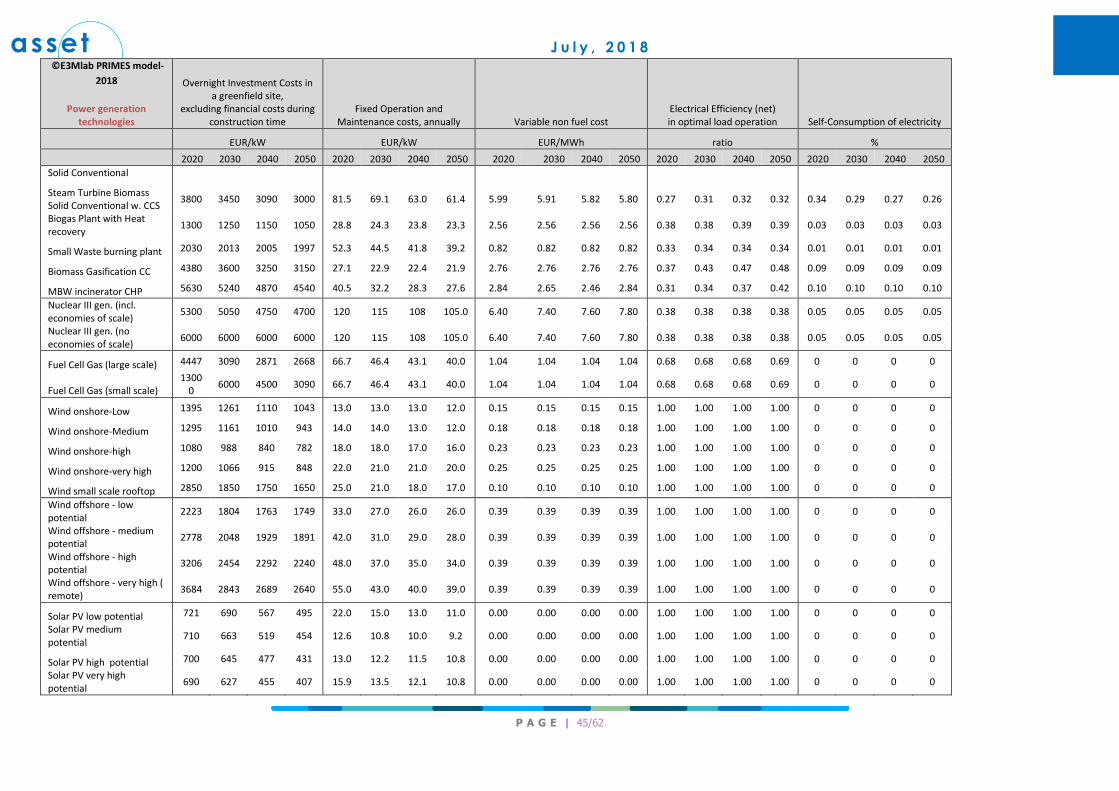
asset J u l y , 2 0 1 8
P A G E | 45/62
©E3Mlab PRIMES model-
2018
Power generation technologies
Overnight Investment Costs in a greenfield site,
excluding financial costs during construction time
Fixed Operation and Maintenance costs, annually Variable non fuel cost
Electrical Efficiency (net) in optimal load operation Self-Consumption of electricity
EUR/kW EUR/kW EUR/MWh ratio %
2020 2030 2040 2050 2020 2030 2040 2050 2020 2030 2040 2050 2020 2030 2040 2050 2020 2030 2040 2050
Solid Conventional
Steam Turbine Biomass Solid Conventional w. CCS
3800 3450 3090 3000 81.5 69.1 63.0 61.4 5.99 5.91 5.82 5.80 0.27 0.31 0.32 0.32 0.34 0.29 0.27 0.26
Biogas Plant with Heat recovery
1300 1250 1150 1050 28.8 24.3 23.8 23.3 2.56 2.56 2.56 2.56 0.38 0.38 0.39 0.39 0.03 0.03 0.03 0.03
Small Waste burning plant 2030 2013 2005 1997 52.3 44.5 41.8 39.2 0.82 0.82 0.82 0.82 0.33 0.34 0.34 0.34 0.01 0.01 0.01 0.01
Biomass Gasification CC 4380 3600 3250 3150 27.1 22.9 22.4 21.9 2.76 2.76 2.76 2.76 0.37 0.43 0.47 0.48 0.09 0.09 0.09 0.09
MBW incinerator CHP 5630 5240 4870 4540 40.5 32.2 28.3 27.6 2.84 2.65 2.46 2.84 0.31 0.34 0.37 0.42 0.10 0.10 0.10 0.10
Nuclear III gen. (incl. economies of scale)
5300 5050 4750 4700 120 115 108 105.0 6.40 7.40 7.60 7.80 0.38 0.38 0.38 0.38 0.05 0.05 0.05 0.05
Nuclear III gen. (no economies of scale)
6000 6000 6000 6000 120 115 108 105.0 6.40 7.40 7.60 7.80 0.38 0.38 0.38 0.38 0.05 0.05 0.05 0.05
Fuel Cell Gas (large scale) 4447 3090 2871 2668 66.7 46.4 43.1 40.0 1.04 1.04 1.04 1.04 0.68 0.68 0.68 0.69 0 0 0 0
Fuel Cell Gas (small scale) 1300
0 6000 4500 3090 66.7 46.4 43.1 40.0 1.04 1.04 1.04 1.04 0.68 0.68 0.68 0.69 0 0 0 0
Wind onshore-Low 1395 1261 1110 1043 13.0 13.0 13.0 12.0 0.15 0.15 0.15 0.15 1.00 1.00 1.00 1.00 0 0 0 0
Wind onshore-Medium 1295 1161 1010 943 14.0 14.0 13.0 12.0 0.18 0.18 0.18 0.18 1.00 1.00 1.00 1.00 0 0 0 0
Wind onshore-high 1080 988 840 782 18.0 18.0 17.0 16.0 0.23 0.23 0.23 0.23 1.00 1.00 1.00 1.00 0 0 0 0
Wind onshore-very high 1200 1066 915 848 22.0 21.0 21.0 20.0 0.25 0.25 0.25 0.25 1.00 1.00 1.00 1.00 0 0 0 0
Wind small scale rooftop 2850 1850 1750 1650 25.0 21.0 18.0 17.0 0.10 0.10 0.10 0.10 1.00 1.00 1.00 1.00 0 0 0 0
Wind offshore - low potential
2223 1804 1763 1749 33.0 27.0 26.0 26.0 0.39 0.39 0.39 0.39 1.00 1.00 1.00 1.00 0 0 0 0
Wind offshore - medium potential
2778 2048 1929 1891 42.0 31.0 29.0 28.0 0.39 0.39 0.39 0.39 1.00 1.00 1.00 1.00 0 0 0 0
Wind offshore - high potential
3206 2454 2292 2240 48.0 37.0 35.0 34.0 0.39 0.39 0.39 0.39 1.00 1.00 1.00 1.00 0 0 0 0
Wind offshore - very high ( remote)
3684 2843 2689 2640 55.0 43.0 40.0 39.0 0.39 0.39 0.39 0.39 1.00 1.00 1.00 1.00 0 0 0 0
Solar PV low potential 721 690 567 495 22.0 15.0 13.0 11.0 0.00 0.00 0.00 0.00 1.00 1.00 1.00 1.00 0 0 0 0
Solar PV medium potential
710 663 519 454 12.6 10.8 10.0 9.2 0.00 0.00 0.00 0.00 1.00 1.00 1.00 1.00 0 0 0 0
Solar PV high potential 700 645 477 431 13.0 12.2 11.5 10.8 0.00 0.00 0.00 0.00 1.00 1.00 1.00 1.00 0 0 0 0
Solar PV very high potential
690 627 455 407 15.9 13.5 12.1 10.8 0.00 0.00 0.00 0.00 1.00 1.00 1.00 1.00 0 0 0 0

asset J u l y , 2 0 1 8
P A G E | 46/62
©E3Mlab PRIMES model-
2018
Power generation technologies
Overnight Investment Costs in a greenfield site,
excluding financial costs during construction time
Fixed Operation and Maintenance costs, annually Variable non fuel cost
Electrical Efficiency (net) in optimal load operation Self-Consumption of electricity
EUR/kW EUR/kW EUR/MWh ratio %
2020 2030 2040 2050 2020 2030 2040 2050 2020 2030 2040 2050 2020 2030 2040 2050 2020 2030 2040 2050
Solar PV small scale rooftop
1435 930 745 610 24.0 17.0 15.0 13.0 0.00 0.00 0.00 0.00 1.00 1.00 1.00 1.00 0 0 0 0
Solar Thermal with 8 hours storage
5500 4237 3437 3075 121.
0 113.
0 99.0 77.0 0.10 0.10 0.10 0.10 1.00 1.00 1.00 1.00 0 0 0 0
Tidal and waves 6100 3100 2025 1975 39.6 33.3 28.0 23.5 0.10 0.10 0.10 0.10 1.00 1.00 1.00 1.00 0 0 0 0
Lakes 3000 3000 3000 3000 25.5 25.5 25.5 25.5 0.32 0.32 0.32 0.32 1.00 1.00 1.00 1.00 0 0 0 0
Run of River 2450 2400 2350 2300 8.9 8.2 8.2 8.1 0.00 0.00 0.00 0.00 1.00 1.00 1.00 1.00 0 0 0 0
Geothermal High Enthalpy 3901 3198 2897 2613 90.0 95.0
100.0
105.0 0.32 0.32 0.32 0.32 0.10 0.10 0.10 0.10 0 0 0 0
Geothermal Medium Enthalpy
4970 4586 3749 3306 95.0 95.0 92.0 92.0 0.32 0.32 0.32 0.32 0.10 0.10 0.10 0.10 0 0 0 0
Boilers Electricity 344 333 333 333 5.0 5.0 5.0 5.0 0.50 0.50 0.50 0.50 1.00 1.00 1.00 1.00 0 0 0 0
district heating Boilers Gas 137 158 158 158 1.2 1.2 1.2 1.2 0.44 0.44 0.44 0.44 0.89 0.96 0.96 0.96 0 0 0 0
district heating Boilers Fuel Oil
229 264 264 264 1.3 1.3 1.3 1.3 0.53 0.53 0.53 0.53 0.86 0.95 0.95 0.95 0 0 0 0
district heating Boilers Biomass
791 850 850 850 1.3 1.3 1.3 1.3 1.41 1.41 1.41 1.41 0.82 0.90 0.90 0.90 0 0 0 0
district heating Boilers Coal
351 405 405 405 1.3 1.3 1.3 1.3 1.41 1.41 1.41 1.41 0.82 0.90 0.90 0.90 0 0 0 0
district heating Boilers Lignite
419 483 483 483 1.4 1.4 1.4 1.4 1.57 1.57 1.57 1.57 0.79 0.90 0.90 0.90 0 0 0 0
MBW incinerator district heating
961 948 936 923 16.6 16.2 15.7 15.3 1.41 1.41 1.41 1.41 0.82 0.90 0.90 0.90 0 0 0 0
District Heating Electricity 850 850 850 850 1.1 1.1 1.1 1.1 0.50 0.50 0.50 0.50 0.99 0.99 0.99 0.99 0 0 0 0
District Heating Geothermal
2321 2209 2209 2209 77.8 80.4 88.7 97.6 1.14 1.22 1.35 1.50 0.10 0.10 0.10 0.10 0 0 0 0
District Heating Heat Pump
3019 2806 2806 2806 5.0 3.7 3.7 3.7 0.00 0.00 0.00 0.00 2.50 3.33 3.33 3.33 0 0 0 0
District Heating Solar 970 910 910 910 10.0 10.0 10.0 10.0 0.70 0.70 0.70 0.70 1.00 1.00 1.00 1.00 0 0 0 0
Industrial Boilers Coal 340 373 373 373 1.3 1.3 1.3 1.3 1.41 1.41 1.41 1.41 0.82 0.92 0.92 0.92 0 0 0 0
Industrial Boilers Lignite 406 445 445 445 1.4 1.4 1.4 1.4 1.57 1.57 1.57 1.57 0.79 0.92 0.92 0.92 0 0 0 0
Industrial Boilers Gas 114 124 124 124 1.2 1.2 1.2 1.2 0.44 0.44 0.44 0.44 0.89 0.98 0.98 0.98 0 0 0 0
Industrial Boilers Fuel Oil 222 243 243 243 1.3 1.3 1.3 1.3 0.53 0.53 0.53 0.53 0.86 0.96 0.96 0.96 0 0 0 0
Industrial Boilers Biomass 737 807 807 807 1.3 1.3 1.3 1.3 1.41 1.41 1.41 1.41 0.82 0.90 0.90 0.90 0 0 0 0

asset J u l y , 2 0 1 8
P A G E | 47/62
©E3Mlab PRIMES model-2018
Power generation technologies (cont’d)
Technical Capacity Factor
(equivalent full load operation) Annual growth of O&M costs with
plant age
Lifetime %
Years 2020 2030 2040 2050
Steam Turbine Coal Conventional 40 0.80 0.80 0.80 0.80 2.87%
Steam Turbine Lignite Conventional 40 0.80 0.80 0.80 0.80 2.59%
Steam Turbine Coal Supercritical 40 0.80 0.80 0.80 0.80 2.46%
Steam Turbine Lignite Supercritical 40 0.80 0.80 0.80 0.80 2.33%
Fluidized Bed Combustion Coal 40 0.80 0.80 0.80 0.80 2.54%
Fluidized Bed Combustion Lignite 40 0.80 0.80 0.80 0.80 2.54%
Integrated Gasification Combined Cycle Coal 30 0.80 0.80 0.80 0.80 2.28%
Gas Turbine Combined Cycle Gas Conventional 30 0.35 0.35 0.35 0.35 1.65%
Gas Turbine Combined Cycle Gas Advanced 30 0.35 0.35 0.35 0.35 1.62%
Steam Turbine Fuel Oil Conventional 40 0.40 0.40 0.40 0.40 2.70%
Gas turbine with heat recovery 25 0.24 0.24 0.24 0.24 0.91%
Very small scale Gas Plant 20 0.30 0.30 0.30 0.30 0.41%
Pulverised Lignite Suprcritical CCS post combustion 40 0.80 0.80 0.80 0.80 2.45%
Integrated Gasification Coal CCS pre combustion 30 0.80 0.80 0.80 0.80 2.25%
Integrated Gasification Lignitel CCS pre combustion 30 0.80 0.80 0.80 0.80 2.25%
Pulverised Coal Suprcritical CCS oxyfuel 40 0.80 0.80 0.80 0.80 2.41%
Pulverised Lignite Suprcritical CCS oxyfuel 40 0.80 0.80 0.80 0.80 2.45%
Gas combined cycle CCS post combustion 30 0.80 0.80 0.80 0.80 1.92%
Gas combined cycle CCS oxyfuel 30 0.80 0.80 0.80 0.80 1.97%
Steam Turbine Biomass Solid Conventional 40 0.80 0.80 0.80 0.80 2.91%
Steam Turbine Biomass Solid Conventional w. CCS 40 0.80 0.80 0.80 0.80 2.41%
Biogas Plant with Heat recovery 25 0.20 0.20 0.20 0.20 1.60%
Small Waste burning plant 20 0.10 0.10 0.10 0.10 0.73%
Biomass Gasification CC 30 0.70 0.70 0.70 0.70 7.20%
MBW incinerator CHP 35 0.65 0.65 0.65 0.65 4.46%
Nuclear III gen. (incl. economies of scale) 60 0.85 0.85 0.85 0.85 1.76%
Nuclear III gen. (no economies of scale) 60 0.85 0.85 0.85 0.85 1.76%
Fuel Cell Gas (large scale) 20 0.28 0.28 0.28 0.28 2.61%
Fuel Cell Gas (small scale) 20 0.28 0.28 0.28 0.28 3.99%
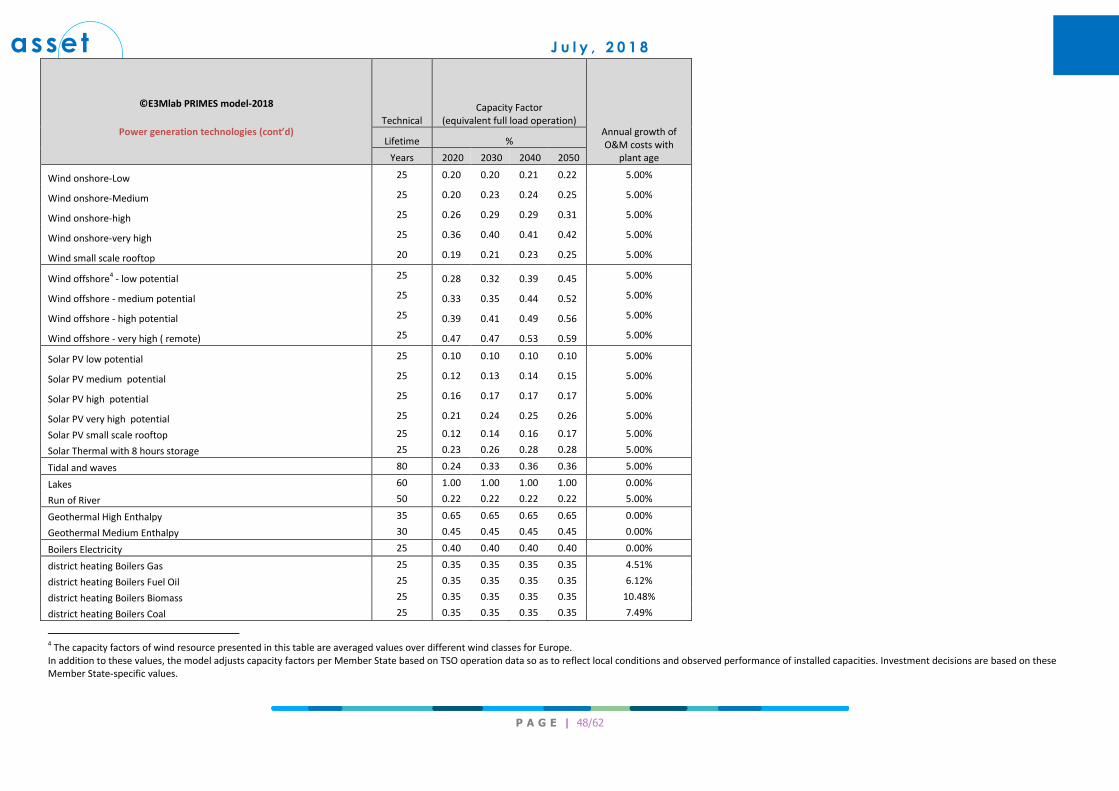
asset J u l y , 2 0 1 8
P A G E | 48/62
©E3Mlab PRIMES model-2018
Power generation technologies (cont’d)
Technical Capacity Factor
(equivalent full load operation) Annual growth of O&M costs with
plant age
Lifetime %
Years 2020 2030 2040 2050
Wind onshore-Low 25 0.20 0.20 0.21 0.22 5.00%
Wind onshore-Medium 25 0.20 0.23 0.24 0.25 5.00%
Wind onshore-high 25 0.26 0.29 0.29 0.31 5.00%
Wind onshore-very high 25 0.36 0.40 0.41 0.42 5.00%
Wind small scale rooftop 20 0.19 0.21 0.23 0.25 5.00%
Wind offshore4 - low potential 25 0.28 0.32 0.39 0.45 5.00%
Wind offshore - medium potential 25 0.33 0.35 0.44 0.52 5.00%
Wind offshore - high potential 25 0.39 0.41 0.49 0.56 5.00%
Wind offshore - very high ( remote) 25 0.47 0.47 0.53 0.59 5.00%
Solar PV low potential 25 0.10 0.10 0.10 0.10 5.00%
Solar PV medium potential 25 0.12 0.13 0.14 0.15 5.00%
Solar PV high potential 25 0.16 0.17 0.17 0.17 5.00%
Solar PV very high potential 25 0.21 0.24 0.25 0.26 5.00%
Solar PV small scale rooftop 25 0.12 0.14 0.16 0.17 5.00%
Solar Thermal with 8 hours storage 25 0.23 0.26 0.28 0.28 5.00%
Tidal and waves 80 0.24 0.33 0.36 0.36 5.00%
Lakes 60 1.00 1.00 1.00 1.00 0.00%
Run of River 50 0.22 0.22 0.22 0.22 5.00%
Geothermal High Enthalpy 35 0.65 0.65 0.65 0.65 0.00%
Geothermal Medium Enthalpy 30 0.45 0.45 0.45 0.45 0.00%
Boilers Electricity 25 0.40 0.40 0.40 0.40 0.00%
district heating Boilers Gas 25 0.35 0.35 0.35 0.35 4.51%
district heating Boilers Fuel Oil 25 0.35 0.35 0.35 0.35 6.12%
district heating Boilers Biomass 25 0.35 0.35 0.35 0.35 10.48%
district heating Boilers Coal 25 0.35 0.35 0.35 0.35 7.49%
4 The capacity factors of wind resource presented in this table are averaged values over different wind classes for Europe. In addition to these values, the model adjusts capacity factors per Member State based on TSO operation data so as to reflect local conditions and observed performance of installed capacities. Investment decisions are based on these Member State-specific values.
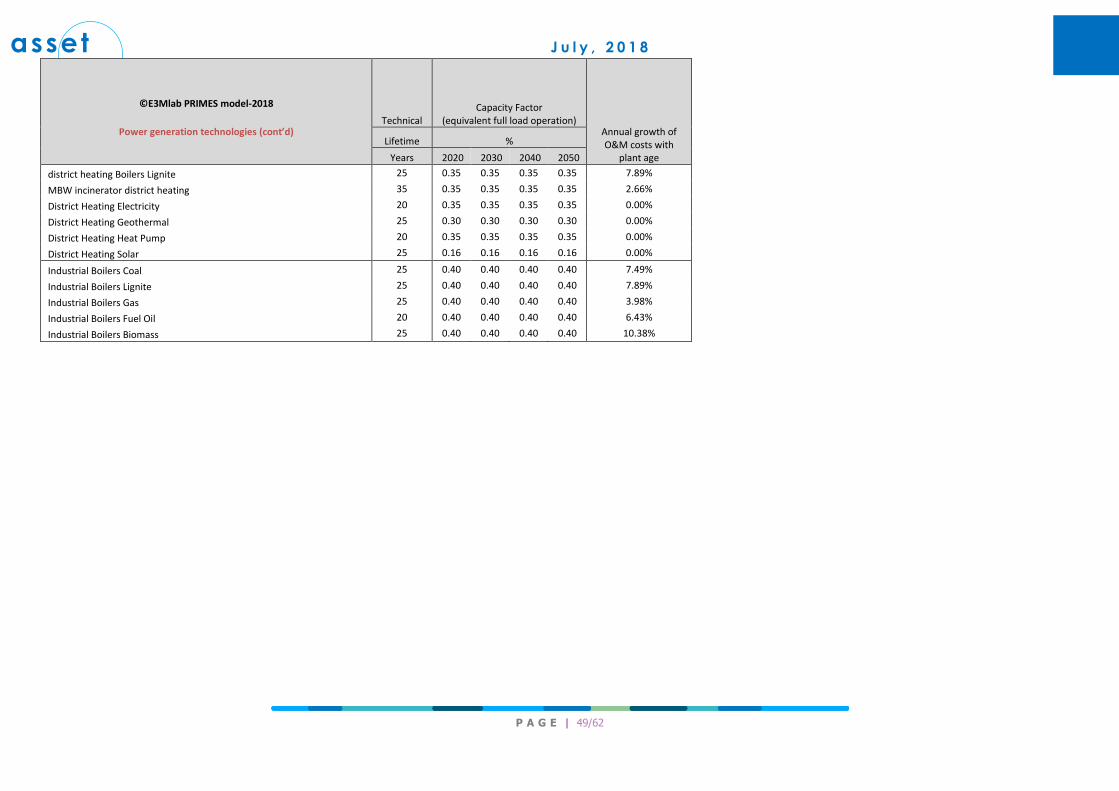
asset J u l y , 2 0 1 8
P A G E | 49/62
©E3Mlab PRIMES model-2018
Power generation technologies (cont’d)
Technical Capacity Factor
(equivalent full load operation) Annual growth of O&M costs with
plant age
Lifetime %
Years 2020 2030 2040 2050
district heating Boilers Lignite 25 0.35 0.35 0.35 0.35 7.89%
MBW incinerator district heating 35 0.35 0.35 0.35 0.35 2.66%
District Heating Electricity 20 0.35 0.35 0.35 0.35 0.00%
District Heating Geothermal 25 0.30 0.30 0.30 0.30 0.00%
District Heating Heat Pump 20 0.35 0.35 0.35 0.35 0.00%
District Heating Solar 25 0.16 0.16 0.16 0.16 0.00%
Industrial Boilers Coal 25 0.40 0.40 0.40 0.40 7.49%
Industrial Boilers Lignite 25 0.40 0.40 0.40 0.40 7.89%
Industrial Boilers Gas 25 0.40 0.40 0.40 0.40 3.98%
Industrial Boilers Fuel Oil 20 0.40 0.40 0.40 0.40 6.43%
Industrial Boilers Biomass 25 0.40 0.40 0.40 0.40 10.38%

asset J u l y , 2 0 1 8
P A G E | 50/62
©E3Mlab PRIMES model-2018
Conversion technologies - Revised
Investment cost per unit of capacity (EUR/kW-output)
Fixed O&M costs (EUR/kW-output)
Capital and fixed cost per unit of output (EUR/MWh-output)
Variable, fuel and emissions cost per unit of output (EUR/MWh-
output or per tCO2)
Total levelized cost per unit of output at a 8.5% discount rate
(EUR/MWh-output or per tCO2)
2015 2030 Ultimate 2015 2030 Ultimate 2015 2030 Ultimate 2015 2030 Ultimate 2015 2030 Ultimate
Hydrogen from natural gas steam reforming centralised - Large Scale (per 1 kW or 1 MWh H2 HHV)
550 500 450 22.0 20.0 18.0 11.8 10.7 9.7 36.0 49.0 176.0 48.0 60.0 186.0
Hydrogen from natural gas steam reforming centralised - Large Scale with CCU (per 1 kW or 1 MWh H2 HHV)
900 850 800 36.0 34.0 32.0 19.3 18.3 17.2 88.0 115.0 249.0 107.0 133.0 267.0
Hydrogen from natural gas steam reforming de-centralised - Medium Scale (per 1 kW or 1 MWh H2 HHV)
1978 1598 1450 57.0 31.0 28.0 48.0 36.2 33.0 40.0 55.0 196.0 88.0 91.0 229.0
Hydrogen from low temperature water electrolysis PEM centralised - Large Scale (per 1 kW or 1 MWh H2 HHV)
1400 340 200 49.0 15.0 10.0 26.6 6.9 4.2 72.5 78.0 86.0 99.0 85.0 90.0
Hydrogen from low temperature water electrolysis PEM de-centralised at a refuelling station (per 1 kW or 1 MWh H2 HHV)
2200 750 350 77.0 34.0 18.0 41.8 15.2 7.3 78.2 82.0 87.0 119.9 97.0 95.0
Hydrogen from low temperature water electrolysis Alkaline centralised - Large Scale (per 1 kW or 1 MWh H2 HHV)
1100 300 180 28.0 14.0 9.0 19.5 6.1 3.8 73.0 83.0 87.0 92.0 89.0 90.0
Hydrogen from low temperature water electrolysis Alkaline de-centralised at a refuelling station (per 1 kW or 1 MWh H2 HHV)
1650 380 300 41.0 17.0 15.0 29.3 7.7 6.3 73.0 83.0 88.0 102.0 91.0 94.0
Hydrogen from high temperature water electrolysis SOEC centralised (per 1 kW or 1 MWh H2 HHV)
1595 804 600 55.8 36.2 39.0 30.3 16.3 13.6 89.8 98.1 86.7 120.1 114.3 100.4
Hydrogen from high temperature water electrolysis SOEC de-centralised at a refuelling station (per 1 kW or 1 MWh H2 HHV)
2711.5 1407 750 94.9 63.3 48.8 51.5 28.5 17.0 91.4 99.7 88.2 142.8 128.2 105.2
©E3Mlab PRIMES model-2018
Conversion technologies - Revised
Investment cost per unit of capacity (EUR/kW-output)
Fixed O&M costs (EUR/kW-output)
Capital and fixed cost per unit of output (EUR/MWh-output)
Variable, fuel and emissions cost per unit of output (EUR/MWh-
output or per tCO2)
Total levelized cost per unit of output at a 8.5% discount rate
(EUR/MWh-output or per tCO2)
2015 2030 Ultimate 2015 2030 Ultimate 2015 2030 Ultimate 2015 2030 Ultimate 2015 2030 Ultimate
Methanation (per 1 kW or 1 MWh CH4 HHV) 1200 633 263 42.0 22.0 9.0 22.8 12.0 5.0 1.0 1.0 1.0 23.0 13.0 6.0
CH4 Liquefaction plant (per 1 kW or 1 MWh gas HHV) 450 450 450 18.0 18.0 18.0 7.7 7.7 7.7 9.0 13.0 40.0 17.0 20.0 47.0
Gas Liquefaction plant (per 1 kW or 1 MWh gas HHV) 200 200 200 20.0 20.0 20.0 4.8 4.8 4.8 2.0 3.0 4.0 7.0 8.0 9.0
Regasification Plant including LNG storage (per 1 kW or 1 MWh gas HHV)
175 175 175 5.0 5.0 5.0 2.7 2.7 2.7 0.0 0.0 2.0 3.0 3.0 5.0
Power to liquid via the methanol route (per 1 kW or 1 MWh CH4 HHV)
1000 620 364 50.0 31.0 18.0 20.9 12.9 7.6 7.0 10.0 34.0 28.0 23.0 41.0
Power to liquid via the Fischer Tropsch route (per 1 kW or 1 MWh CH4 HHV)
1556 1143 673 54.0 40.0 24.0 29.5 21.7 12.8 2.0 2.0 6.0 31.0 24.0 19.0
Power to liquid via High temperature co-electrolysis and Fischer Tropsch (per 1 kW or 1 MWh CH4 HHV)
2332 1511 965 163.0 106.0 68.0 54.5 35.3 22.5 111.0 118.0 165.0 165.0 153.0 188.0
Capture CO2 from air (Absorption technology) (per 1 tCO2) 770 648 518 26.9 22.7 18.1 116.9 98.4 78.7 0.2 0.2 0.2 117.0 99.0 78.9
Capture CO2 from air (Adsorption technology) (per 1 tCO2) 1260 894 495 44.1 31.3 17.3 191.3 135.8 75.2 0.1 0.1 0.2 191.0 136.0 75.4
CO2 Liquefaction plant (per 1 ton CO2) 174 174 174 3.0 3.0 3.0 3.2 3.2 3.2 0.0 0.0 0.0 3.0 3.0 3.0

asset J u l y , 2 0 1 8
P A G E | 51/62
©E3Mlab PRIMES model-2018
Refuelling technologies - Revised
Investment cost per unit of capacity (EUR/kW-output)
Fixed O&M costs (EUR/kW-output)
Capital and fixed cost per unit of output (EUR/MWh-output)
Variable, fuel and emissions cost per unit of output (EUR/MWh-
output or per tCO2)
Total levelized cost per unit of output at a 8.5% discount rate
(EUR/MWh-output or per tCO2)
2015 2030 Ultimate 2015 2030 Ultimate 2015 2030 Ultimate 2015 2030 Ultimate 2015 2030 Ultimate
H2 compression station (per 1 kW or 1 MWh H2 HHV) 114 102 91 0.4 0.4 0.4 2.30 2.10 1.80 3.60 4.60 5.10 5.90 6.60 7.00
Hydrogen Liquefaction plant (per 1 kW or 1 MWh H2 HHV) 761 635 457 23 23 23 12.10 10.60 8.40 1.10 1.40 1.50 13.20 11.90 9.90
H2 liquid to gas refuelling station (per 1 kW or 1 MWh H2 HHV) 855 759 568 1.6 1.4 1.1 16.90 15.00 11.20 3.70 4.60 5.20 20.60 19.60 16.40
H2 refuelling station Small (per 1 kW or 1 MWh H2 HHV) 1009 867 822 4.1 4.1 4.1 20.30 17.60 16.70 3.60 4.60 5.10 24.00 22.20 21.80
H2 refuelling station Medium (per 1 kW or 1 MWh H2 HHV) 542 412 379 1.7 1.7 1.7 10.80 8.30 7.60 3.60 4.60 5.10 14.50 12.90 12.80
H2 refuelling station Large (per 1 kW or 1 MWh H2 HHV) 325 247 151 0.7 0.7 0.7 6.40 4.90 3.10 3.60 4.60 5.10 10.10 9.50 8.20
ELC recharging points - Semi Fast recharging (per 1 kW or 1 MWh ELC)
240 168 149 9.6 6.7 6.0 5.79 4.05 3.59 0.00 0.00 0.00 5.79 4.06 3.59
ELC recharging points - Fast recharging (per 1 kW or 1 MWh ELC)
900 567 486 36.0 22.7 19.4 21.71 13.68 11.73 0.00 0.00 0.00 21.72 13.68 11.73
CNG compression station (per 1 kW or 1 MWh gas HHV) 89 89 89 5.7 5.7 5.7 2.70 2.70 2.70 1.20 1.50 2.00 3.90 4.20 4.70
CNG refuelling station (per 1 kW or 1 MWh gas HHV) 197 197 197 4.3 4.3 4.3 6.80 6.80 6.80 0.00 0.00 0.00 6.80 6.80 6.80
LNG refuelling station (per 1 kW or 1 MWh gas HHV) 120 120 120 3.9 3.9 3.9 4.50 4.50 4.50 0.00 0.00 0.10 4.50 4.50 4.60
Notes
a) Primes endogenously calculates electricity prices, therefore variable costs will be different from scenario to scenario. The variable costs in the table use base load electricity prices, carbon prices and fuel prices of a decarbonisation
scenario for the respective years.
b) Costs of installation, land cost and grid connection is included in the investment costs of Large Scale Batteries.
c) Costs of the technology "Methanation" refer only to plants that comprise the second stage (inputs: Hydrogen and CO2, output: CH4) of a Power- to-Gas pathway. Similar for the "Power-to-Liquids" costs. The costs for capturing CO2 or
producting hydrogen are not included.

asset J u l y , 2 0 1 8
P A G E | 52/62
©E3Mlab PRIMES model-2018 Distribution technologies - Revised
Investment cost per unit of capacity (EUR/kW-output)
Fixed O&M cost per unit of capacity (EUR/kW-output)
Variable Cost EUR/MWh Levelized cost per unit of product transported, at a 8.5%
discount rate (EUR/MWh-output)
2015 2030 Ultimate 2015 2030 Ultimate 2015 2030 Ultimate 2015 2030 Ultimate
NGS Transmission Network (per MWh ) (per MWh )
126 126 126 5.0 5.0 5.0 0.7 0.7 0.7 2.7 2.7 2.7
NGS Distribution Network (per MWh) 552 552 552 22.0 22.0 22.0 3.2 3.2 3.2 19.2 19.2 19.2
H2 pipeline 60bar (per MWh H2 HHV) 178 173 166 7.0 7.0 7.0 1.0 1.0 1.0 3.8 3.7 3.6
H2 pipeline 10 bar (per MWh H2 HHV) 723 723 723 29.0 29.0 29.0 4.1 4.1 4.1 25.2 25.2 25.2
Investment cost per unit of capacity
(EUR/ton CO2 per year) Fixed O&M cost per unit of capacity
(EUR/ton CO2 per year) Variable Cost EUR/kWh
Levelized cost per unit of product transported, at a 8.5% discount rate
(EUR/MWh-output)
2015 2030 Ultimate 2015 2030 Ultimate 2015 2030 Ultimate 2015 2030 Ultimate
CO2 Transmission network (per tCO2) 23 23 23 1.3 1.3 1.3 1.0 1.0 1.0 4.4 4.4 4.4
Investment cost per unit of capacity
(EUR/kW-output) Fixed O&M cost per unit of capacity
(EUR/kW-output) Variable Cost EUR/kWh
Levelized cost per unit of product transported, at a 8.5% discount rate
(EUR/MWh-output)
2015 2030 Ultimate 2015 2030 Ultimate 2015 2030 Ultimate 2015 2030 Ultimate
Road transport of liquid H2 74 68 55 7.0 7.0 7.0 0.3 0.3 0.3 3 2.8 2.5
Road transport of gaseous H2 344 324 284 58.0 58.0 58.0 3.6 3.6 3.6 19 18.5 17.5
©E3Mlab PRIMES model-2018 Storage technologies - Revised
Investment cost per unit of energy stored per year (EUR/MWh)
Fixed O&M costs (EUR/kW) Variable, fuel and emissions cost per unit of
stored energy (EUR/MWh)
Total levelized cost per unit of stored energy, at a 8.5% discount rate
(EUR/MWh-stored)
2015 2030 Ultimate 2015 2030 Ultimate 2015 2030 Ultimate 2015 2030 Ultimate
Compressed Air Energy Storage (per 1 kW or 1 MWh electricity)
125000 112500 110931 38.5 34.7 34.2 0.0 0.0 0.0 225.0 203.0 200.0
Flywheel (per 1 kW or 1 MWh electricity) 1750000 1575000 1553029 52.5 47.3 46.6 0.0 0.0 0.0 1127.0 1015.0 1000.0
Large-scale batteries (per 1 kW or 1 MWh electricity)
600000 253000 225484 40.5 15.0 13.1 0.0 0.0 0.0 311.0 122.0 108.0
Small-scale batteries (per 1 kW or 1 MWh electricity)
270000 114000 101619 16.9 6.3 5.5 0.0 0.0 0.0 74.0 31.0 27.0
Pumping (per 1 kW or 1 MWh electricity) 100000 90000 88745 22.5 20.3 20.0 0.0 0.0 0.0 155.0 140.0 138.0

asset J u l y , 2 0 1 8
P A G E | 53/62
Underground Hydrogen Storage (per 1 kW or 1 MWh H2)
5340 3936 3821 0.0 0.0 0.0 0.6 0.7 0.8 2.8 2.4 2.4
Pressurised tanks - Hydrogen storage (per 1 kW or 1 MWh H2)
6000 4800 4659 0.0 0.0 0.0 0.6 0.7 0.8 3.0 2.7 2.7
Liquid Hydrogen Storage - Cryogenic Storage (per 1 kW or 1 MWh H2)
8455 6800 4000 0.0 0.0 0.0 0.7 0.9 1.0 4.1 3.6 2.6
Metal Hydrides - Hydrogen Storage (per 1 kW or 1 MWh H2)
12700 11430 11271 0.0 0.0 0.0 0.5 0.7 0.8 5.7 5.3 5.3
Thermal Storage Technology (per 1 kW or 1 MWh Heat)
100000 90000 88745 100.0 97.2 95.8 0.0 0.0 0.0 78.6 70.7 69.7
LNG Storage Gas (per 1 kW or 1 MWh Gas) 135 135 135 0.0 0.0 0.0 0.6 0.7 0.8 1.9 2.1 2.1
Underground NGS Storage (per 1 kW or 1 MWh Gas)
33 33 33 0.0 0.0 0.0 0.6 0.7 0.8 4.4 4.5 4.6
Investment cost per ton CO2 stored per
year (EUR/tCO2) Investment cost per ton CO2 (EUR/tCO2) EUR/tCO2 liquefaction cost
Total levelized cost per unit of stored energy, at a 8.5% discount rate
(EUR/CO2-stored)
2015 2030 Ultimate 2015 2030 Ultimate 2015 2030 Ultimate 2015 2030 Ultimate
Liquid CO2 storage tank 1000 1000 1000 15.0 15.0 15.0 3.18 3.18 3.18 4.14 4.43 4.02
Notes
a) Primes endogenously calculates electricity prices, therefore, variable costs will be different from scenario to scenario. The variable costs in the table use base load electricity prices, carbon prices and fuel prices of a decarbonisation
scenario for the respective years.
b) Costs of installation, land cost and grid connection is included in the investment costs of Large Scale Batteries.
c) Costs of the technology "Methanation" refer only to plants that comprise the second stage (inputs: Hydrogen and CO2, output: CH4) of a Power- to-Gas pathway. Similar for the "Power-to-Liquids" costs. The costs for capturing CO2 or
producting hydrogen are not included.

asset J u l y , 2 0 1 8
P A G E | 54/62
10 APPENDIXES
APPENDIX 1: SURVEY TEMPLATE
Worksheet 1: Guidance
Guidance
We kindly ask you to work with three worksheets in nine steps:
I Introduction
1 Please, verify your contact data
2 We have pre-defined the technologies for your review in rows 6-7; detailed overview of parameters for these technologies is found in the worksheet "Technology data overview"
3 Should you be interested in reviewing a broader scope of technologies, please, check the list of technologies in the worksheet "all technology categories" and connect to [email protected] with the proposed list
4 Based on your request, we will send you the extended datasets
II Technology data overview
5 Please, go to "Technology data overview" worksheet and analyse the proposed parameters
6 Please mark your changes in green, f.ex.
2020 2030 2040 2050Steam Turbine Coal Conventional 1600 1600 1600 1600
Steam Turbine Lignite Conventional 1800 1800 1800 1800Steam Turbine Coal Supercritical 1700 1700 1700 1700
Steam Turbine Lignite Supercritical 2000 2000 2000 2000
III Additional information
7 Please, provide us with additional information, supporting the proposed changes:
List of sources for updated data
Is any major technology option in your category to be added?
Are there any pre-requisites to consider (is a technology can develop only under certain conditions?
Which technology pathways are most likely to develop?
Please, limit your input to max. 500 signs per topic
9 Please, send the updated form by 30th April EOB to: [email protected]
In case of any questions, please, contact: [email protected]
Overnight Investment Costs
EUR'13/kW
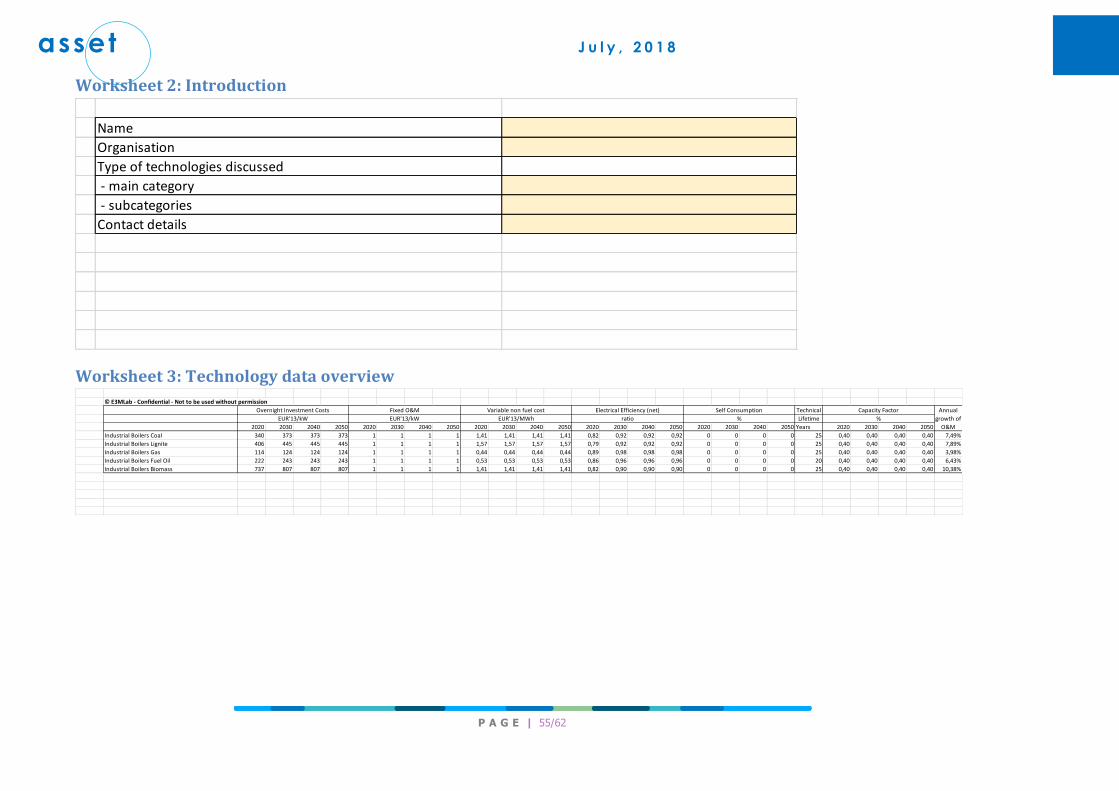
asset J u l y , 2 0 1 8
P A G E | 55/62
Worksheet 2: Introduction
Worksheet 3: Technology data overview
Name
Organisation
Type of technologies discussed
- main category
- subcategories
Contact details
© E3MLab - Confidential - Not to be used without permission
Technical
Lifetime
2020 2030 2040 2050 2020 2030 2040 2050 2020 2030 2040 2050 2020 2030 2040 2050 2020 2030 2040 2050 Years 2020 2030 2040 2050
Industrial Boilers Coal 340 373 373 373 1 1 1 1 1,41 1,41 1,41 1,41 0,82 0,92 0,92 0,92 0 0 0 0 25 0,40 0,40 0,40 0,40 7,49%
Industrial Boilers Lignite 406 445 445 445 1 1 1 1 1,57 1,57 1,57 1,57 0,79 0,92 0,92 0,92 0 0 0 0 25 0,40 0,40 0,40 0,40 7,89%
Industrial Boilers Gas 114 124 124 124 1 1 1 1 0,44 0,44 0,44 0,44 0,89 0,98 0,98 0,98 0 0 0 0 25 0,40 0,40 0,40 0,40 3,98%
Industrial Boilers Fuel Oil 222 243 243 243 1 1 1 1 0,53 0,53 0,53 0,53 0,86 0,96 0,96 0,96 0 0 0 0 20 0,40 0,40 0,40 0,40 6,43%
Industrial Boilers Biomass 737 807 807 807 1 1 1 1 1,41 1,41 1,41 1,41 0,82 0,90 0,90 0,90 0 0 0 0 25 0,40 0,40 0,40 0,40 10,38%
Annual
growth of
O&M
EUR'13/kW EUR'13/kW EUR'13/MWh ratio % %
Overnight Investment Costs Fixed O&M Variable non fuel cost Electrical Efficiency (net) Self Consumption Capacity Factor

asset J u l y , 2 0 1 8
P A G E | 56/62
Worksheet 4: Additional information
ADDITIONAL INFORMATION
1 List of sources for updated data (max. 500 signs)
2 Is any major technology option in your category to be added? (max. 500 signs)
3
Are there any pre-requisites to consider (is a technology can
develop only under certain conditions? (max. 500 signs)
4 Which technology pathways are most likely to develop? (max. 500 signs)

asset J u l y , 2 0 1 8
P A G E | 57/62
Worksheet 5: All technology categories - for information only
FOR INFORMATION ONLY
Main category Supporting category
1 Domestic Electric appliances
2 Domestic Cooking
3 Domestic Space heating
4 Domestic Water heating
5 Domestic Air conditioning
6 Domestic - services Electric appliances
7 Domestic - services Space heating
8 Domestic - services Air-conditioning
9 Renovation Costs Centre/West
10 Renovation Costs North
11 Renovation Costs South
12 Renovation Costs East
13 Industry Horizontal processes
14 Industry Glass annealing
15 Industry Iron and Steel basic processing
16 Industry Direct heat
17 Industry Drying and seperating
18 Industry Furnaces
19 Industry Electric processes
20 Industry Electric (pulp and paper) refining
21 Industry Foundries (non-ferrous alloys)
22 Industry Heat
23 Industry Kilns
24 Industry Lighting
25 Industry Machinery
26 Industry Process furnaces
27 Industry Raw material in petrochemical
28 Industry Space heating
29 Industry Sinter making
30 Industry Steam uses
31 Industry Coating
32 Industry Thermal processes
33 Industry Glass tanks
34 Industry Smelters
35 Power&heat Steam turbine and Fluidized Bed combution
36 Power&heat Gas plants
37 Power&heat Supercritical/CCS/gasification combustion
38 Power&heat Biomass/biogas applications
39 Power&heat Nuclear
40 Power&heat Fuel cells
41 Power&heat Wind
42 Power&heat Solar
43 Power&heat Hydro, tidal and waves
44 Power&heat Geothermal
45 Power&heat Electric boilers
46 Power&heat District heating heat-only-boilers technologies
47 Power&heat Industrial boilers
48 Novel technologies Conversion technologie s- Hydrogen
49 Novel technologies Conversion technologies - Power-to-X
50 Novel technologies CO2 capture and CO2 capture
51 Novel technologies Refuelling technologies
52 Novel technologies Distribution technologies
53 Novel technologies CO2 and H transmission network
54 Novel technologies Storage options

asset J u l y , 2 0 1 8
P A G E | 58/62
APPENDIX 2: LITERATURE REVIEW LIST A non-exhaustive list of literature used for the preparation and review of all the technologies is presented
below.
Electrolysis, Methanation, power to gas and power to liquids
IEA-RETD, "Non-individual transport - Paving the way for renewablepower-to-gas (RE-P2G)", 2016
IEA-RTD, "Policies for Storing Renewable Energy, A scoping study of policy considerations for
energy storage (RE-Storage)", 2016
Power-to-Gas Roadmap for Flanders; Brussels, October 2016
ENEA, "The potential of Power to gas",2016
E4tech, "Development of Water Electrolysis in the European Union", 2014
Shell, "Energy of the Future?", 2017
IEA, "Technology Roadmap. Hydrogen and Fuel Cells",2015
Power-to-Gas: technology and Business Models, Markus Lehner et al., Springer, 2014
Renewables in Transport 2050, FVV – FORSCHUNGSVEREINIGUNG
VERBRENNUNGSKRAFTMASCHINEN E.V., Report 1086, 2016
Power to Liquids, German Environment Agency, September 2016
Electrochemical production of chemicals, DNV, December 10,2012
What role is there for electrofuel technologies in European transport's low carbon future?, Dr Chris
Malins, Cerulogy, Noovember 2017
Power to methanol solutions for fexible and sustainable operations in power and process
industries, C. Bergins et al., Mitsubishi, 2015
Application of Power to Methanol Technology to Integrated Steelworks for Profitability, Conversion
Efficiency, and CO2 Reduction, G. Harp et al.
Electrochemical Conversion of Carbon Dioxide to Hydrocarbon Fuels, EME 580 Spring 2010
Techno-economic and environmental evaluation of CO2 utilisation for fuel production, JRC, 2016
Methanol synthesis using captured CO2 as raw material: Techno-economic and environmental
assessment, Ma Perez-Fortes et al. Applied energy 161, 2016
"Catalytic CO2 conversion: a techno-economic analysis and theoretical study, Thomas Savaete ,
Master's dissertation, University Gent, 2015-2016"
Renewable Power-to-Gas: A technological and economic review, Manuel Gotz et al., Renewable
Energy, 85, 2016
"Technology data for high temperature solid oxide electrolyser cells, alkali and PEM electrolysers,
Mathiessen Brian et al, Aalborg University, 2013"
Transition of Future Energy System Infrastructure; through Power-to-Gas Pathways, Azadeh
Maroufmashat and Michael Fowler , Energies, 1 June 2017
Systems Analyses Power to Gas, KEMA, June 20, 2013
"A comparison between renewable transport fuels that can supplement or replace biofuels in a
100% renewable energy system, D. Connomy et al, Energy, 73, 2014"

asset J u l y , 2 0 1 8
P A G E | 59/62
Storage Technologies
IEA, "Technology Roadmap. Hydrogen and Fuel Cells",2015
EASE,EERA, "European energy Storage Technology Development Roadmap",2017
Hydrogen-based Energy Conversion, SBC Energy Institute, Schlumberger, February 2014
Lazard's levelized cost of storage analysis, version 3, LAZARD, November 2017
A review at the role of storage in energy systems with a focus on power to gas and long term
storage, Herib Blanco, Andre Faaij, Renewable and Sustainable Energy Reviews, 81 (2018)
Electric Energy Storage, Technology Assessments, US DOE, 2015
Dunn, Kamath, Tarascon, "Electrical Energy Storage for the Grid : A Battery of Choices", 2016
IEA, "Prospects for Large-Scale Energy Storage in Decarbonised Power Grids",2009
EPRI, "Electricity energy Storage Technology Options" Awhite paper primer on applications, costs
amd benefits,2010
IEA, "Technology Roadmap", Energy Storage, 2014
IRENA, "Battery Storage for Renewables: Market Status and technology outlook", 2015
IRENA, "Renewables and Electricity Storage Atechnology roadmap for Remap 2030", 2015
IRENA, IEA, ETSAP,"Electricity Storage. Technology Brief", 2012
NREL, "Large Scale Energy storage",2015
NREL,"Cost and performance data from power generation technologies",2012
Deloitte, "Energy storage" Tracking the technologies that will transform the power sector",2013
LAZARD, "Levelised Cost of Storage"-version 2, 2016
Bllomberg, https://about.bnef.com/blog/lithium-ion-battery-costs-squeezed-margins-new-
business-models/
World Energy Council, "World Energy Resources E-storage",2016
World Energy Council, "World Energy Resources E-storage: Shifting from cost to value wind and
solar Applications",2016
IRENA, "Electricity storage and renewables: Costs and markets to 2030",2017
Hydrogen - Transmission and Distribution to the network
Power-to-Gas Roadmap for Flanders; Brussels, October 2016
ENEA, "The potential of Power to gas",2016
IEA, "Technology Roadmap. Hydrogen and Fuel Cells", 29 June 2015
Recharging infrastructure
Cambridge Econometrics, Low-carbon cars in Europe: A socio-economic assessment, February 2018
McKinsey, A portfolio of power-trains for Europe: a fact-based analysis: The role of Battery Electric
Vehicles, Plug-in Hybrids and Fuel Cell Electric Vehicles, 2012
CO2 capture
Henriette, "Economics of carbon dioxide capture and utilization-a supply and demand perspective",
Springer, 2016
Economics of carbon dioxide capture and utilization, Environ Sci Pollut Res, 2016, 23:22226-22241

asset J u l y , 2 0 1 8
P A G E | 60/62
Carbon capture and storage, SBC Energy Institute, Schlumberger, January 2013, update
Carbon dioxide capture and storage, UNEP, 2005, Cambridge University Press
Direct Air Capture of CO2 with Chemicals, APS physics, June 1, 2011
Putting costs of direct air capture in context, Yuki Ishimoto et al., FCEA Working Paper 002, June
2017
The CO2 economy: review of CO2 capture and reuse technologies, Efthymia Ioanna Koytsoumpa et
al., J. of Supercritical Fluids, 23-1-2017
Biophysical and economic limts to negative CO2 emissions, Pete Smith et al., Nature Climate
Change, 7 December 2015
The costs of CO2 transport, Zero emissions platform
CO2 utilization pathways, Mar Perez-Fortes et al., Energy Procedia, 63, 2014
CO2 utilization developments in conversion processes, Erdogan Alper et al., Petroleum, 3, 2017
Power generation –with focus on Renewable energy technologies
Reports and surveys from various stakeholders:
IRENA – Renewables power generation costs
SET-plan
IEA – World Energy Outlook
IEA – Energy Technology Perspectives
IEA – Medium Term Renewable Market Outlook
EIA – Annual energy outlook
IEA Wind Implementing Agreement
Frontier economics
BNEF – New energy outlook
National Renewable Energy Laboratory
Wind Europe, Solar PV association
Private stakeholders
Scientific literature in order to cross-check estimations for the costs in the long-run:
Challenges to the adoption and large-scale
diffusion of emergent energy technologies, University of California
The Learning-by-doing Effects in the Wind Energy Sector, International Association for Energy
Economics
Learning by Doing and Spillovers in Renewable
Energy, MIT
A Spatial-Economic Cost Reduction Pathway Analysis for U.S. Offshore Wind Energy
Development from 2015–2030, NREL
Industry
Best Available Techniques (BAT) Reference Documents for (previously IPPC):
Production of Cement, Lime,and Magnesium Oxide
Ceramic Manufacturing Industry
asset J u l y , 2 0 1 8
P A G E | 61/62
Manufacture of Glass
Large Volume Inorganic Chemicals- Ammonia, Acids and Fertilisers
Iron and Steel Production
Non-Ferrous Metals Industries
Large Volume Organic Chemical Industry
Production of Pulp, Paper and Board
OECD GLOBAL FORUM ON ENVIRONMENT Focusing on SUSTAINABLE MATERIALS MANAGEMENT
ETSAP Technology briefs on all available technologies
ECO-Design studies for elements covered by Eco-design regulations
DECC studies by Ricardo
Industrial associations websites and documents (CEFIC)
Residential and services
Heating and cooling technologies
2050 Pathways for Domestic Heat – Final Report – DELTA Energy & Environment
Spon’s Mechanical and Electrical Services Price Book 2015
Updated Buildings Sector Appliance and Equipment Costs and Efficiencies – EIA – Technology
Forecast Updates – Residential and Commercial Building Technologies – Reference Case
IRENA-IEA-ETSAP Technology Brief 3: Heat Pumps
Heat Pump Implementation Scenarios until 2030 – ECOFYS
Technology Roadmap – Energy Efficient Buildings: Heating and Cooling Equipment – IEA
EuP Lot 22 Domestic and Commercial Ovens
EuP lot 23 Domestic and Commercial Hobs and Grills
ENER Lot 20 – Local Room Heating Products
Online available brochures of manufacturers and retailers
Appliances
Omnibus” Review Study on Cold Appliances, Washing Machines, Dish Washers, Washer-Driers.
Lighting, Set-top Boxes and Pumps
Buildings Energy Data Book (2011) – U.S. Department of Energy
ODYSEE/Enerdata database
Renovation and database construction
The Entranze Project, http://www.entranze.eu/ accessed on 10 April 2017.
Cost-Effective Climate Protection in the Building Stock of the New EU Member States: Beyond the
EU Energy Performance of Buildings Directive, ECOFYS
Andreas Uihlein, Peter Eder, Towards additional policies to improve the environmental
performance of buildings Part II: Quantitative assessment European Commission Joint Research
Centre Institute for Prospective Technological Studies 2009
Study on the Energy Savings Potentials in EU Member States, Candidate Countries and EEA
Countries Final Report Fraunhofer-Institute for Systems and Innovation Research 2009

asset J u l y , 2 0 1 8
P A G E | 62/62
Eurostat Database: Housing Statistics in the European Union:
http://ec.europa.eu/eurostat/statistics-explained/index.php/Housing_statistics
National Statistics Bureaus
The Entranze Project, http://www.entranze.eu/ accessed on 10 April 2017
Inspire Archive, http://inspire.ec.europa.eu/webarchive/index.cfm/pageid/6/list/3.html accessed
on 15 December 2016.
BPIE, http://bpie.eu/publications/ accessed on 3 November 2016
The Healthvent Project, http://www.healthvent.byg.dtu.dk/ accessed on 10 April 2017
Europe's Building under the Microscope: A Country-by-Country Review of the Energy Performance
of Buildings., BPIE, 2011
CIBSE, CIBSE Guide A: Environmental Design, 2007
EN 13790:2008 Energy performance of buildings - Calculation of energy use for space heating and
cooling, 2008
Guide to the design, installation, testing and maintenance of services supplying water for domestic
use within buildings and their curtilages: BS 8558:2015
2013 ASHRAE Handbook: Fundamentals, ASHRAE, 2013