technology-intensive instruction with high …
TRANSCRIPT

TECHNOLOGY-INTENSIVE INSTRLOW PERFORMING MIDDLE S
JAMES
B.S., Univer
T
Submitted in partial fufor the degree of Ma
in the GradUniversity of Illinois
Urb
UCTION WITH HIGH PERFORMING ANDCHOOL MATHEMATICS STUDENTS
BY
P. DILDINE
sity of Illinois, 1997
HESIS
lfillment of the requirementsster of Science in Educationuate College of theat Urbana-Champaign, 1999
ana, Illinois

iii
ABSTRACT
Technology is receiving a great deal of attention in education reform. From the
President's Report on the Use of Technology to Strengthen K-12 Education (1997) to the
NCTM Standards 2000 Draft (1998) technology is becoming increasingly more
encouraged as a teaching tool and medium.
Technology offers opportunities to enhance student learning in mathematics.
Reports show students who used graphing calculator technology were more active,
participated in more group work, were able to read and interpret graphs, and were more
willing to engage in problem-solving (Dunham, 1993, 1995). These opportunities are
important for those who have not traditionally done very well within the mathematics
curriculum. These are students who are tracked, filtered, and as such actively choose to
"disidentify" (Steele, 1992) with mathematics.
This study examines two classes of middle school students - a high tracked group
and a low tracked group – and their experiences learning about rate, and reading and
interpreting graphs in a technology-intensive setting, and attitudes toward mathematics.
The students used graphing calculators with distance sensors to collect real-time graphical
data and create distance versus time graphs. Students completed attitudinal surveys and
achievement tests and four students from each class were interviewed about their
experiences in mathematics and this period of instruction.
The results suggested that low and high performing students in both classes with
technology-intensive instruction displayed more understanding of graphing concepts and
positive attitudes toward mathematics.

iv
ACKNOWLEDGEMENTS
Thank you, to those who pushed me, supported me, and put up with me. Thank
you, to my committee, Bridget Arvold, Rochelle Gutiérrez, and Ken Travers, for doing
all of the aforementioned and much, much more, and especially for providing so much
understanding and support throughout this and many of my other endeavors.

v
TABLE OF CONTENTS
LIST OF TABLES .......................................................................................................... .vii
LIST OF FIGURES......................................................................................................... viii
CHAPTER
1 INTRODUCTION............................................................................................... ..1
Problem Statement ................................................................................. ..3
Rationale.................................................................................................. ..3
Terminology............................................................................................ ..4
2 REVIEW OF THE LITERATURE..................................................................... ..6
Disidentification and the Mathematics Classroom.................................. ..6
Technology in Education ........................................................................ ..8
Technology in Mathematics Education................................................... 11
Technology to Explore Graphing Concepts ............................................ 13
Hand-Held Technology and Data Collection Devices ............................ 15
Summary ................................................................................................. 16
3 METHODOLOGY.............................................................................................. 18
Instrumentation........................................................................................ 18
Classroom Characteristics ....................................................................... 21
Equipment and Instruction ...................................................................... 22
Instructional Design: Daily Outline of Instruction.................................. 24
Post Data Collection................................................................................ 27
4 ANALYSIS AND CONCLUSIONS .................................................................. 29
Data from Achievement Tests................................................................. 29
Data from Survey Responses .................................................................. 36
Observation Results................................................................................. 44
Conclusions ............................................................................................. 57

vi
5 CASE STUDIES ................................................................................................. 60
The Basic Mathematics Students ............................................................ 61
The Algebra Students .............................................................................. 69
Summary of Case Studies ....................................................................... 76
6 SUMMARY, CONCLUSIONS, AND RECOMMENDATIONS...................... 79
Summary ................................................................................................. 79
Conclusions ............................................................................................. 82
Recommendations ................................................................................... 84
REFERENCES................................................................................................................ 86
APPENDIX
A SURVEY ITEMS................................................................................................ 89
B ACHIEVEMENT ITEMS................................................................................... 92
C INTERVIEW GRAPH ........................................................................................ 97
D BASIC MATHEMATICS SURVEY RESPONSES .......................................... 98
E ALGEBRA SURVEY RESPONSES.................................................................. 99

vii
LIST OF TABLES
Table Page
1 Basic Math Demographics .................................................................................. 21
2 Algebra Demographics........................................................................................ 21
3 Student Responses From the Posttest Compared to Pretest ................................ 30
4 Basic Mathematics Descriptive Statistics ........................................................... 30
5 Basic Mathematics t-Test: µ (1 - 2), p=0.02 ....................................................... 31
6 Frequency Breakdowns From the Basic Class (N=15) ....................................... 32
7 Algebra Class Descriptive Statistics ................................................................... 33
8 Algebra t-Test: µ(1 - 2 ), p=0.01 ......................................................................... 34
9 Frequency Breakdowns of Algebra Results ........................................................ 35
10 Basic Math Students Increase in Favorable Responses (N=15).......................... 38
11 Basic Math Students Decrease in Favorable Responses (N=15) ........................ 39
12 Algebra Students Increase in Favorable Responses (N=19) ............................... 41
13 Algebra Students Decrease in Favorable Responses (N=19).............................. 42

viii
LIST OF FIGURES
Figure Page
1 Graphs from a TI-82 created with the CBR unit ................................................. 22
2 Example graphs from the match-the-graph activity............................................ 25
3 Boxplots of the basic math students' achievement scores ................................... 31
4 Boxplots of algebra students' achievement scores .............................................. 34
5 Boxplots of basic students' favorable survey responses...................................... 40
6 Boxplots of algebra students' favorable survey responses .................................. 42
7 Match the graph example .................................................................................... 47
8 Michael's chalkboard explanation ....................................................................... 48
9 Close-enough match to a graph........................................................................... 49
10 Example of a horizontal segment with no slope ................................................. 51
11 Student example of a graph made by "cheating” ................................................ 52
12 A peak and a dip in the graphs ............................................................................ 52
13 Basic Math class example graph of a parallel parking experience ..................... 53
14 Group explanation of the parallel parking graph ................................................ 54
15 Ashley's self-generated graphs ............................................................................ 55
16 Algebra student example of determining speed over an interval ........................ 56
17 Michael's attempt to depict more distance in less time ....................................... 68
1
CHAPTER 1
INTRODUCTION
Current reform movements in mathematics education have proposed infusing the
mathematics curriculum with technology and creating technology-intensive instructional
environments. The technologies proposed and supported within technology-intensive
instructional programs are appropriate for mathematics education such as powerful
graphing calculators and data collection devices, the Internet and the World Wide Web,
Spreadsheets, and Computer Algebra Systems. The Principles and Standards for School
Mathematics: Discussion Draft (1998) from the National Council of Teachers of
Mathematics (NCTM) outlines six Guiding Principles for School Mathematics
Instructional Programs. According to NCTM's Technology Principle: "Mathematics
Instructional programs should use technology to help all students understand mathematics
and should prepare them to use mathematics in an increasingly technological world."
(Page 40)
And NCTM's Equity Principle affirms: "Mathematics instructional programs
should promote the learning of mathematics by all students." (Page 23) NCTM promotes
mathematics for all, challenging the notion that some students are just not proficient in
mathematics. By "all" NCTM means that mathematics programs should be promoted for
students who have traditionally done well in mathematics as well as those that have not
done as well or have not been given the same opportunity to learn substantial
mathematical concepts. Mathematics curricular programs should promote students who
are seen as low performing students as well as high performing students. Note that the

2
use of the term “performing” denotes a dynamic view of the students as active learners
and that students do not exist within a set of static descriptors.
Some students have been disenfranchised by the traditional mathematics
curriculum. This has happened in a variety of ways that include subtle reinforcement by
educational systems or more overt displays of ability tracking, a practice in which
students are sorted into different instructional sequences that often results in inequitable
educational opportunities and outcomes for students (NCTM, 1998). The practice of
sorting, tracking, or ability grouping is another inequitable example describing and
sorting students into static categories.
Furthermore, NCTM emphasizes that technology be used to promote the
understanding and use of mathematical concepts. NCTM also describes the technology
tools that should be included in the mathematics instructional program to be calculators,
computers, micro-computer/calculator based laboratories, Internet technology, and the
World Wide Web. NCTM supports the implementation of technology in mathematics
instructional programs but warns against the possible reliance on technology as
replacements for basic understandings.
Finally, NCTM recommends preparing students to use mathematics in an
increasingly technological world. The twenty-first century is rapidly approaching and the
jobs that today's students will hold will become increasingly more infused with
technology, such as sophisticated computer programs and data collection devices.

3
Problem Statement
This research is designed to address the following questions:
1.) How can hand-held calculator technology help low performing and high
performing middle school students identify more with the mathematics they are
learning?
2.) How does technology-intensive instruction help high performing and low
performing middle school mathematics students learn new mathematics, and
improve their attitudes toward mathematics?
Students in low-tracked classes and low performing students may demonstrate
negative attitudes toward mathematics and begin to disidentify or actively choose to not
identify with mathematics. Technology and technological tools might help low and high
performing students identify with mathematics and actively choose to respond positively
toward mathematics.
Rationale
In order to answer these questions a technology intensive mathematics unit was
created and used in an instructional period with middle school students at two different
ability levels. The goals for this research project were for students to explore the concept
of rate, and reading and interpreting graphs as well as to study the attitudes toward
mathematics in a basic mathematics class and algebra class in a middle-school setting.
Hand-held calculator technology was introduced into a basic mathematics class and an
algebra class at the eighth grade level over a two-week period of instruction.
4
There have been many advances in hand-held calculator technology; these include
graphing capabilities, symbolic representation, and real-world data collection. These
advances are transforming the landscape of mathematics education by creating the
possibility for all students to access powerful technology and technology tools for
exploration and analysis in a manner similar to scientists and mathematicians. Hand-held
calculator technology offers a few unique advantages over computers as the technological
tools of choice for this study. The smaller size and lower cost than computers grant more
opportunities for each student to handle and operate calculator equipment. This means a
greater number of students have opportunities to experiment and explore the
mathematical concepts, emphasizing the students as dynamic participants and much more
like scientists. An arrangement of calculator and data gathering devices offers a more
lab-like environment to facilitate the exploration of mathematics concepts within group
collaboration and configurations.
Terminology
This section will distinguish between the different pieces of technology used in
this study. Throughout the rest of this study terms will be used to describe the
technology setting of instruction these terms are defined here.
Technology-Intensive Instruction
Technology-intensive instruction used in this study takes a cue from the 1997
report from The President’s Committee of Advisors on Science and Technology
(PCAST) which emphasizes more instruction with technology at the K-12 levels.

5
This instruction is conducted through technological tools and explorations within a
laboratory environment in cooperative teams and with the instructor as the facilitator
instead of the fountain of knowledge. Students interact with the equipment pose
conjectures, test, make decisions, and explain results to others and the instructor.
Calculators and Calculator Technology
Calculators referred to in this document are Graphing Calculators except where
specifically noted as four-function calculators. In this research the calculators used were
Texas Instruments Model 82 or the TI-82.
Hand-Held Technology
This term is used to explicitly mean graphing calculator technology and
associated data collection tools. This term does not apply to newly developed hand-held
computers and similar devices.
Data-Collection Devices
This term applies to devices that when attached to the Texas Instruments graphing
calculators through a Calculator Based Laboratory (CBL) unit create a laboratory
environment where real-world data can be collected and displayed graphically. The
Calculator Based RangerTM (CBRTM) is a stand-alone version of the motion sensor. The
CBRTM does not need the CBL unit but there are other devices available aside from a
motion detector.

6CHAPTER 2
REVIEW OF THE LITERATURE
The research interests for this project can be divided into five separate areas-
1. Disidentification and the mathematics classroom;
2. Technology in education;
3. Technology in mathematics education;
4. Technology to explore graphing concepts; and
5. Research on hand-held technologies and data collection devices in mathematics education
Disidentification and the Mathematics Classroom
Steele describes academic disidentification as the “process that occurs when people stop
caring about their performance in an area, or domain that formerly mattered a great deal.”
(Steele, 1992, p.12). Hill (1997) applies this hypothesis to the mathematics classroom and
argues that many intrinsic qualities of a traditional mathematics classroom offer motives for
student disidentification from mathematics. Mathematics has been described as a gatekeeper
subject that has traditionally closed gates for students due to computational reliance and
traditional methods of tracking students into ability groups. The traditional mathematics
classroom has caused some mathematics students to disidentify with mathematics.
Tracking and filtering are the most overt examples of causes of students’ disidentification
and they intertwine with teacher expectations and differing views of mathematics between
teacher and student. Tracking in mathematics classes results in oversimplified, repetitive, and
fragmented instruction (Oakes, 1990). These classes require more rote memorization and less
critical thinking than high tracked classes where teachers pursue understanding of complex

7themes. Oakes presented and described this as evidence that implementation and curriculum
differ across tracked classes
Many of the disidentification issues involving tracking and filtering are based on
inequalities evidenced by large numbers of African-American and Hispanic minorities and the
poor in lower tracked classes (Oakes, 1990). NCTM recommends opportunity for all indicating
that those who study advanced mathematics are most often white males. This is occurring, as
careers are becoming more focused on technical and technological literacy. Careers are rapidly
evolving that require more scientific and problem-solving skills. Advancement in mathematics
can provide a background and education in these skills for the workforce of the future. At the
same time as the increased focus on mathematics and technical skills, women and most
minorities study less mathematics and are seriously underrepresented in careers using science
and technology.
Mathematics has become a critical filter for employment and full participation in our
society (NCTM, 1989). Walter Secada presents calculators as example technological tools that
may aid in removing the computational gate and filters to the study of mathematics. “Certainly
by middle school if not before, all students should have access to calculators, and the focus of the
curriculum should be enlarged beyond number and computation.” (Secada, 1990, p.139) The
influence of technology as an instructional practice has been identified and described as a
component of an organized program as a tool to increase students' conceptual understanding of
mathematics and facilitate more students taking additional and advanced mathematics courses.
"Teachers in OFA (Organized for Advancement) used Calculators and Computers as tools to
allow concentration on concepts and strategies instead of getting mired in arithmetic, and
students also learned more problem-solving." (Gutiérrez, 1996, p.519)

8Many students face self-esteem issues and on occasion demonstrate negative attitudes
toward mathematics and schooling especially those who are tracked in lower mathematics
classes. Technology offers opportunities to create instructional and educational environments
that promote the mathematical learning of all students. NCTM, in fact, describes the deprivation
of technological tools in the mathematics classroom as inequitable and handicapping to the
students in our society. (1998)
Reviewing Steele's disidentification hypothesis and additional studies focused on
technology in mathematics education it may be possible to develop methods that may help both
high and low performing students improve their self-esteem in their mathematics classes and
help them identify more with mathematics with technology. Research on graphing calculators in
the mathematics classroom (Hembree & Dessart, 1986) has shown there is an increase in positive
attitudes toward mathematics and an increase in self-concept in mathematics with students using
calculators. Dunham (1995) also found that female students' confidence levels and algebra skills
increased in the mathematics classroom with the introduction of the graphing calculator.
Technology in Education
Technology has frequently been viewed as a widely useful asset to education. It is only
in recent years that concerted efforts have been undertaken to mandate the inclusion of
technology in educational settings. Prior to recent reform movements to incorporate technology
and recent technological advances Seymour Papert in Mindstorms (1980) presented insights into
the future of education with the advent of the personal computer. Papert describes two major
research themes from the early 1980s that are relevant to research in technology and education

9even today. "Children can learn to use computers in a masterful way, and that learning to use
computers can change the way they learn everything else." (Papert, 1980, p.83)
Papert then explains a very important aspect of learning through technological means.
Learning through technology is more than just fun, very powerful kinds of learning are taking
place. Children are learning to speak mathematics and acquiring a new image of themselves as
mathematicians (Papert, 1980).
Interest in the use of technology to improve K-12 Education for US students has
increased in recent years. This interest has promoted the creation of committees and interest
groups to promote the implementation of technology in the K-12 setting. The Panel on
Educational Technology was formed in April 1995 under the President’s Committee of Advisors
on Science and Technology (PCAST) to inform and advise the President on the application of
technology in the K-12 setting. PCAST summarized six recommendations on the use of
technology in K-12 education. These are:
(1) Focus on learning with technology, not about technology. It is important to distinguish
between technology as a subject area and the use of technology to facilitate learning about any
subject area. The importance of technical knowledge in the coming century is very evident
however, PCAST recommends that technology be integrated across the K-12 curriculum and not
solely for purposes related to learning technical or technology-related skills.
(2) Emphasize content and pedagogy, not just hardware. Current educational reform efforts
emphasize the development of higher-order reasoning and problem solving skills. These same
emphases are evident in NCTM standards documents that emphasize the "process standards of
problem solving, and reasoning." (1989). The role of technology in achieving the goals of these
reform efforts should be emphasized. PCAST recognizes the importance of appropriate

10hardware and software in educational settings but attention should be given to the potential role
of technology in achieving the goals of current educational reform efforts through the use of new
pedagogic methods. PCAST draws attention to reform movements that extol the benefits of
constructivist learning in education, whereby students actively construct the knowledge of a
particular concept and negotiate goals and meanings with others in the class, including the
instructor.
(3) Give special attention to professional development. K-12 teachers should be provided with
preparation and support to implement technology in their classrooms. Teachers should be
provided with ongoing mentoring and should have time and support to familiarize themselves
with software and content to incorporate technology into their lesson plans.
(4) Engage in realistic budgeting. PCAST encourages schools to incorporate technology
expenditures into their operating budgets rather than relying on one-time grant awards or other
capital campaigns.
(5) Ensure equitable, universal access regardless of socioeconomic status, race, ethnicity, gender,
or geographic factors, and special attention should be given to students with special needs.
Access to knowledge-building and communication tools should be made available to all
students. "Educational technologies have the potential to ameliorate or exacerbate the growing
gulf between advantaged and disadvantaged Americans, depending on policy decisions involving
the ways in which such technologies are deployed and utilized." (PCAST, 1997)
(6) Initiate a major program of experimental research to ensure the efficacy of technology use
within our nation’s schools. A program of research on education in general and educational
technology will prove necessary to ensure the effectiveness of technology use. PCAST

11recommends that this research take place concurrently with the infusion of technology in K-12
education.
(PCAST, 1997, p.7-10)
Important aspects of the PCAST report are the emphasis on infusion of technology into
the curriculum to promote learning through the technology instead of learning the technology.
Students do not need to know exactly how a retractable pen or mechanical pencil works but they
are required to use them throughout education. Technology tools can be handled in much the
same way as pencils and other tools for learning. Students should be introduced to and instructed
through the technology as a tool for understanding, exploration, and problem solving. PCAST
also recommends the infusion of technology in all schools and with all students through an
equitable and universal allocation process thereby granting all students access to technology
tools. These two aspects are mirrored within reform movements recommending the
incorporation of technology into the current school curriculum.
Technology in Mathematics Education
NCTM recommends that technology receive increased emphasis in the K-12 mathematics
curriculum especially in relation to teachers' professional development, equitable and universal
access, and emphasizing content and pedagogy. NCTM Emphases include-
• appropriate calculators should be available to all students at all times;
• a computer should be available in every classroom for demonstration purposes;
• every student should have access to a computer for individual and group work;
• Students should learn to use the computer as a tool for processing information and
performing calculations to investigate and solve problems. (NCTM, 1989)

12The focus on technology in mathematics education has received increased attention in recent
years and drawn serious criticism. Critics of technology in the mathematics classroom describe
the use of calculators as a crutch or replacement for understanding and learning the basics
(Pomerantz, 1997). Proponents of technology generally contend that technology should not
replace the learning of the basic concepts but supplement the curriculum to encourage deeper and
more substantial explorations into the mathematics concepts. Pea (1985) suggests using
technology to help students cognitively reorganize mathematical knowledge.
Computers are commonly believed to change how effectively we perform traditional tasks,amplifying or extending our capabilities with the assumption that these tasks stayfundamentally the same. A primary role of computers is changing the tasks we do not bymerely amplifying but by reorganizing our mental functioning. (Pea, 1985, p. 5)
This is a crucial point that Pea makes in drawing the line between technology that simply makes
tasks quicker or easier in mathematics education. Which often comes under fire from those who
would oppose technology in mathematics education. Rather Pea supports a complete
restructuring in the nature of the activities explored and the nature of the tasks performed.
Kaput (1992) has analyzed the position and importance of technology in mathematics
education while posing the question: "What are the new things that you can do with technology
that you could not do before or were not practical to do?" This notion reflects Pea’s writing on
the potential for technology to reorganize mathematical and scientific thinking and not solely
amplify what is currently pursued. Kaput explains research on graphing systems to make
accessible to students as young as the middle school level some of the core ideas of calculus like
rate of change and explains that this can be done without the introduction of algebra (1992).
This opens such questions as: what curricular ideas are appropriate for what grade level and even
what curricular ideas are appropriate for certain ability tracked classrooms? When and how

13should graphing concepts and complex concepts such as rate be introduced to mathematics
students?
Technology to Explore Graphing Concepts
As Frances Van Dyke (1994) explains, graphs should be emphasized when algebra is first
introduced. Picturing the correct graph when given a situation or statement is a good
intermediate exercise and promotes abstract thinking for the students. She explains that with the
arrival and increased use of graphing calculators, students should become comfortable working
with graphs. Van Dyke points out that often in real-world contexts, and examples, there are very
few occurrences that can be explained or presented in clean algebraic notation, whereas a graph
of this data can be drawn with the aid of a calculator and can then be analyzed.
Mevarech and Kramarsky (1997) report that graphing involves interpretation - the ability
to read a graph and gain meaning from it - and construction - building a graph from data or
points. Students do not read graphs without prior knowledge and they generally come into
situations where reading graphs is necessary with a number of conceptions and misconceptions.
Several misconceptions surrounding graphs and graph interpretation are common-
• considering the graph as a picture of an event or events (graph as a map);
• confusing an interval and a point; and
• Conceiving a graph as constructed of discrete points.
(Mevarech, 1997)
Fernandez (1998) also presents common student conceptions and misconceptions about
graphs. She found that students often confuse the graph with the actual event and mistakenly use
the visual configuration of the graph to describe the actual event. This is very much related to

14students who consider a graph as a map or picture of an event. She eventually designed a
research study where she examined student approaches to graphs and features of graphs created
in real-time using motion-detectors.
Dunham's review of calculator research (1993) presented reports and studies that show
students who use graphing calculator technology-
• place at higher levels in a hierarchy of graphical understanding;• are better able to relate graphs to their equations;• can better read and interpret graphical information;• obtain more information from graphs;• have greater overall achievement on graphing items;• are better at "symbolizing," that is, finding an algebraic representation for a graph• better understand global features of functions;• increase their "example base" for functions by examining a greater variety of
representations, and;• better understand connections among graphical, numerical, and algebraic
representations;• had more flexible approaches to problem solving;• were more willing to engage in problem-solving and stayed with a problem longer;• concentrated on the mathematics problems and not on the algebraic manipulation;• solved non-routine problem inaccessible by algebraic techniques; and• believed calculators improved their ability to solve problems.(Dunham, 1993, p.442-443)
This broad band of research conclusions gathered by Dunham points to the potential of graphing
technology to affect the way students learn graphing concepts and problem-solving strategies.
Dunham expanded the research to explore the possibility for graphing technology to
affect the types of learning students experienced and the attitudes students exhibited when using
graphing calculator technology. After this review, Dunham found studies that concluded those
students who use graphing calculator technology-
• were more active , they participated in more group work, investigations, and problem solvingexplorations (Dunham, 1993; Dunham & Dick, 1994);
• are better able to read and interpret graphs, understand global features, and relate graphs(Dunham, 1996); and
• female students improve in confidence, spatial ability, and algebra skills (Dunham 1995)

15
Hand-Held Technology and Data Collection Devices
Recommendations for graphing calculators in mathematics education and research
supporting these recommendations have explored the potential of graphing calculators to
enhance the students' experience with multiple representations of mathematical ideas,
recommended by NCTM, (1989).
The NCTM Standards 2000 Draft states that the collection of real-time data through
computer or calculator-based laboratories and data-collection devices provides ways for the
students to analyze the data in meaningful and relevant ways. NCTM recommends these tools
for the middle school classroom for the exploration of topics such as rate and rate of change that
were previously reserved for calculus courses through empirical trial methods. While promoting
the increased use of technology NCTM warns against the reliance upon such technology in lieu
of development of knowledge of facts and procedures.
Pea's distinction between amplification and reorganization (1985) is relevant in terms of
calculator technology. Calculators as supported by NCTM, and used effectively to explore
graphs, should not take the place of learning to plot points on axes but rather open doors for
exploring these points and graphs in terms of real-world conditions and scenarios. The tasks and
approaches should be reorganized to support new and different ways of performing procedures
instead of amplifying the tasks that had previously been performed.
Fernandez (1998) emphasized data collection devices used with graphing calculators in
her study of students understanding graphs with technology. She describes data collection
devices as having the potential to focus mathematics instruction on the features of the graphs
rather than point by point analyses. Data collection devices such as the Texas Instruments CBR
16and CBL units seem to be especially valuable for enhancing students’ ability to interpret graphs
and create graphical representations to describe actual events.
In her study, Fernandez (1998) worked with a high school mathematics teacher to
observe the teacher instruct a weeklong unit to geometry and algebra students using calculators
and data collection devices. Using motion detector devices attached to graphing calculators, the
students manipulated graphs by exploring changes in their motion and subsequent changes in the
graphs they were creating. The students became "investigators, and problem solvers/posers"
(1998) in this study while discussing patterns and generalizations of the graphs they created. The
results of the Fernandez study and research show that student understanding of graphical features
and concepts such as rate of change had improved with the implementation of the graphing tools.
Her study also suggests that data collection devices and units arranged around this equipment
have implications for improving the attitude that students exhibit toward mathematics.
This technology provides students with tools to experiment in creating different graphicalrepresentations that involve motion and time, two important variables in the analysis ofreal data. Through this experimentation in a social context, the students expanded theirroles in classroom interactions. Additionally, this study suggests the potential of thistechnology in promoting positive attitudes toward learning about mathematics.(Fernandez, 1998, p.78)
Summary
The research on technology in education presents evidence that the infusion of
technology can prepare students for the entrance into an increasing technological workforce.
Research on graphing calculators presents opportunities to involve more students learning
through technology and for students to identify with mathematics. The disidentification
hypothesis was of interest to this research as Steele (1992) outlines ways in which students might
actively choose to not participate in mathematics after they are subjected to stimuli that devalue
their achievement within a particular area.

17Fernandez and Dunham's research imply that graphing calculators have the potential to
help students identify with mathematics. Dunham's research on graphing calculator use among
female students who improved in areas of confidence and spatial ability is relevant in this case.
How can technology help students gain more positive attitudes toward mathematics, especially
those low performing students who may exhibit negative attitudes toward mathematics and
tracked into lower ability groups? How can hand-held calculators help middle school students
learn mathematics?

18CHAPTER 3
METHODOLOGY
This research project was designed to answer:
Does technology-intensive instruction help high performing and low performing middle
school mathematics students learn mathematics, improve their attitudes toward mathematics,
explore mathematics in dynamic ways?
Can hand-held calculator technology help low performing and high performing middle
school students identify mathematics?
To answer these questions a basic math class and an algebra class were instructed in
mathematical concepts to examine how they would respond to technology intensive instruction.
A study involving instruction, data collection, and analysis was developed to explore the issues
surrounding the research questions and issues associated with them. The next sections are
devoted to describing the methods of data collection, classroom instruction, equipment used, and
data analysis.
Instrumentation
To approach these questions a two-week unit using the TI-82 graphing calculator and the
CBR distance sensor/motion detector was designed for two middle school classes. Data
collection methods utilized to examine each class were-
• Achievement tests to measure the cognitive aspects of the student’s knowledge of concepts;
• Surveys to measure the affective attitudes toward mathematics, technology;
• interviews to gather specific information from individual students;

19
• videotapes, audiotapes, and field notes from daily instruction to measure social interactions
among the students during experimentation, concept exploration, and affective aspects
among students.
The achievement tests were administered before and after the period of instruction.
The achievement tests consisted of ten multiple choice items taken from the Second International
Mathematics Study that were meant to measure students' knowledge about the concept of rate,
and reading and interpreting graphs. The test that was administered is included in Appendix B.
The attitudinal surveys were administered before and after the period of instruction.
The surveys consisted of 21 multiple choice items taken from the Second International
Mathematics Study. The surveys were meant to gauge students' attitudes toward mathematics,
and technology in the mathematics classroom. The surveys are included in Appendix A.
Interviews with four students from each class were conducted before and after the period
of instruction. The interviews consisted of questions that were posed about the students'
experiences in their current mathematics class, previous classes, their view of mathematics
beyond the classroom, and their responses to questions about a graph (Appendix C) representing
distance versus time. The eight students were chosen in cooperation with the classroom teacher
to represent a range of the students in each class. This was done to collect and examine several
snapshots of students who reflected several types of typical students in each class. Interviews
were important to this study as that would be the most reliable method of establishing how
significant the technology-intensive instruction had been to their understanding of the material
and how they experienced or responded to the technology-intensive instruction.

20Videotapes, audiotapes, and field notes were used to collect observations from daily
classroom activities. Videotapes were made of three days of classroom instruction and
audiotapes were used to record interactions between students on three additional days. Field
notes were collected on each day of instruction. These extensive methods of data collection
provided a comprehensive way to analyze every aspect of student performance, interaction, and
exploration within the instructional experiences. Videotapes demonstrated student cooperation,
student exploration through real-time data-collection, and student attempts that were not captured
through audio means. Audiotapes collected student conversations within their groups and with
the instructor to help in examining understanding at crucial moments of instruction. Field notes
taken by the researcher collected subtle clues and hints of student exploration and provided the
framework for what would become the student snapshots.
This study was conducted in a middle school in the Midwest. The data were collected in
late November 1997 over a two-week period, of ten class sessions. The students attending this
middle school are familiar with university students in education, and faculty from the university
visiting their school and their classes. The regular classroom teacher assisted with the project to
establish the best time of the school year and the classes that would be involved in this project.
Two classrooms were chosen to reflect a range of students at the eighth grade level. These
classrooms were a basic mathematics class, and an algebra class. The algebra class was the most
advanced mathematics class offered at this school and the classroom teacher described the basic
math class as consisting of low performing students that were frequently problematic in school.

21Classroom Characteristics
Basic Mathematics
The basic mathematics class consisted of twenty-three students. The demographics for the
basic math class are displayed in Table 1.
Table 1
Basic Math Demographics
Male Female Total PercentWhite 5 11 16 70Black 4 2 6 26
Latino/a 1 0 1 4Asian 0 0 0 0
Middle Eastern 0 0 0 0Total 10 13 23 100
Percent 43 57 100
Algebra
The algebra class consisted of nineteen students. The demographics of the algebra class are
presented in Table 2.
Table 2
Algebra Demographics
Male Female Total PercentWhite 6 8 14 74Black 1 1 2 10.5
Latino/a 0 0 0 0Asian 2 0 2 10.5
Middle Eastern 1 0 1 5Total 10 9 19 100
Percent 53 47 100

22Equipment and Instruction
The classroom teacher in this project assisted with the research design to involve the
classrooms that would be most beneficial for the project and the students’ education. Research
was conducted over ten class periods in each class. This amounted to a total of two weeks of
instruction over ten course periods of approximately 50 minutes each (two days were shortened
due to scheduling at the middle school).
The graphing calculators that were used in this research project were provided from
Texas Instruments through their workshop loan program. The equipment was 7 Texas
Instruments (TI-82) Graphing Calculators, one overhead display TI-82 model, and 6 Calculator
Based Ranger devices (CBR).
The CBR is a distance sensor or motion detector, a data collection device that can be
connected to the TI-82 calculator through a simple link cable without special software,
instruments, or wiring. This data collection device is a sonic motion detector that emits sonic
waves in a conical (20-degree) formation with a range of 0.5 meters to 6 meters. The motion
detector sends out an ultrasonic pulse and measures the time it takes for that pulse to return after
being reflected back from the object whose distance you are measuring. (Texas Instruments,
1997) This data is used to create graphical representations of the object’s position. Some typical
graphs created on the TI-82 by data collected by the CBR are included in Figure 1.
Figure 1. Graphs from a TI-82 created with the CBR unit.

23Figure 1 depicts three graphs created from students' motion back and forth in front of the
CBR unit. The first graph is a blank graph of distance (meters) vs. time (seconds). The second
graph depicts a student who started about .5 meters away, walked away from the CBR, stopped
roughly three meters away for about eight seconds, and then started walking back toward the
CBR. The third graph depicts a student who started about three meters away from the CBR
sensor, walker toward it, and then abruptly turned back and walked away from the CBR unit.
Heterogeneous groups consisting of four students were constructed in each class. The
groups were chosen by a method using numbered cards and grouping all the students holding a
certain number. These groups became permanent groups for the instructional period of two
weeks. The groups of students participated in the activities with each other in order to fulfill the
goals of the daily activity. There were smaller personal activities constructed and intended for
individual completion outside of class. The classroom framework was constructed to provide the
students with the opportunity to develop and experiment with the mathematical concepts while
developing their own personal and group-negotiated conjectures. It was anticipated that during
the instructional time the students would become investigators, and collaborators on the
experiments, posing problems to one another and offering solutions within experiments and
explorations.
The technology component of the research was constructed so the students would need to
know very little about the equipment (The calculators and the CBRs). The technology
component of this research project was designed to promote "learning through the technology
not learning the technology" (PCAST, 1997, p.11). The ten days of instruction were not
sufficient to allow for instruction of every facet of the calculators. Many of the students were
about to use the calculator technology for the first time and some were apprehensive as to

24whether they would break them or in ruin the devices in some way. The lessons were designed to
assuage possible student apprehension about the equipment.
It was important to instruct the students in the fewest steps necessary to operate the
equipment for the instructional period.
In order to facilitate this aim, the students engaged in a brief introductory activity that
enabled them to gain some familiarity with the calculators. The students learned three basic
functions that would assist them in completing the activities. These functions were the ON,
ENTER, and TRACE function keys.
A day-to-day outline of the activities and important questions from the instructional period
follow.
Instructional Design: Daily Outline of Instruction
Day 1
The first day of instruction was spent exploring the basic operations of the calculator
equipment. Students were organized into groups to operate the ON, and ENTER keys and
download the "Ranger" program from the CBR to the calculator. The surveys and achievement
tests were administered as well, on this day.
Day 2
Students participated in matching randomly generated graphs. These graphs were
generated from the calculator program and displayed on the screen. An example graph and a
graph representing an attempt to match that graph by a student volunteer are presented in Figure
2.

25
Figure 2. Example graphs from the match-the-graph activity.
During the second day of instruction students were also expected to identify the axes and units
on these axes.
Day 3 and Day 4
Students came to class with graphs they created at home to graph them on the equipment.
They were expected to share these graphs and share instructions for creating them.
Students were then presented with a series of prompts/questions to interpret information from the
graphs. Examples include-
• describe what happens to the walker's motion at a horizontal line;
• describe what happens to the graph when the walker stops;
• describe what the walker was doing when the interval is a steep incline;
• describe what the walker was doing when the interval is a steep decline;
• describe what happens at a peak in the graph;
• describe what happens at a dip in the graph;
• can you make a graph that is straight up and down;
• describe the farthest point the walker reaches from the sensor, and the closest; and
• describe how much total distance the walker covers.

26Day 5
Students described the similarities between possible "real-world" graphs of distance vs.
time (miles per hour) and the calculator generated graphs. Students also described other possible
graphs of rate such as dollars per hour.
Day 6
Day six consisted of group presentations as the students were given an overhead sheet
with a graph, blank graph area, and a series of questions on it or scenario to depict.
They were then expected to describe this scenario, answer some questions, and create the graph
using the sensor in front of the class while presenting it on the overhead.
Day 7 and Day 8
The students attempted to trace specific data points on a graph; and give exact values (i.e.,
how far away from the sensor at specific time measures). Questions/prompts that were presented
to the students were-
• how far away was the walker at the farthest point;
• where is the point where the walker was closest to the sensor (be careful not to read error
blips);
• determine the average speed of the “walker” or object over the distance-time graph at
particular intervals; and
• What is the average speed of the walker on any interval?
The students were expected to identify endpoints of intervals and determine the rate of
change over that interval as best they could.
Day 9
The students reviewed concepts from the past few days. Topics of interest included-

27
• representations of the axes on the graph;
• uses of the motion detector to tell where the walker was on periods of the graph as an
electronic measure;
• graphs in the real-world;
• problems the students encountered with the equipment and what they did to remedy these
problems, as well as "cheats" they discovered;
Day 10
The last day was spent debriefing the students about their involvement in this project.
Students were interviewed and the achievement tests were administered.
Post Data Collection
The intention of this research project was to answer the questions
Does technology-intensive instruction help high performing and low performing middle
school mathematics students learn mathematics, improve their attitudes toward mathematics,
explore mathematics in dynamic ways?
Can hand-held calculator technology help low performing and high performing middle
school students identify mathematics?
Additional questions;
• How would the basic math students respond to mathematical concept such as rate and rates
of change from a graphical perspective?
• How would the algebra students respond?
• How were the students engaged in learning the mathematics?
• How do these students view mathematics?

28
• How would these students view mathematics and mathematics instruction after being
exposed to technology?
• Would their attitudes toward mathematics, and technology become more positive after
instruction in such a technology intensive setting?
The data from achievement tests; surveys; interviews; and videotaped observations and
were examined to observe the effects the technology intensive unit had on each class. The large
amount data was analyzed to provide a detailed view into how the students responded to the
activities and the technology during the instructional period. The analysis of this data is
described in the next chapter.
The data were combined to produce a view of cognitive development during the
instructional period, affective development toward mathematics, and cooperative interactions
among group members. The intention was to see if the instructional period enhanced the
students conceptual development, affective development, and cooperative interactions within the
instructional setting especially those of the basic mathematics students.

29CHAPTER 4
ANALYSIS AND CONCLUSIONS
The focuses of this section and analysis will be:
• Evidence of the students' conceptual attainment from the instructional period through data
from achievement tests on rate and graph interpretation for each class;
• Evidence of the students' increase in favorable responses to survey items indicating positive
attitudes toward mathematics through data from surveys for each class;
• Evidence of identification with the concepts and engagement with classroom activities
through a narrative of daily observations from videotapes, audiotapes, and field notes;
• Evidence of conceptual development through a series of snapshots of students' participation,
collaboration, and active experimentation with the classroom activities through the
technology.
Data from Achievement Tests
The component of the study to measure cognitive development during the instructional
period was the achievement tests. The Algebra class and the Basic Mathematics class each
showed an increase in achievement scores from the pre achievement test to the post achievement
test. The results indicated that each class did attain knowledge about rate, and reading and
interpreting information from graphs. Table 3 presents the number of students in each class that
responded correctly to a greater number of items on the post achievement test, the number that
responded to fewer and the number that responded correctly to the same number of items.

30Table 3
Student Responses from the Posttest Compared to Pretest
Basic Mathematics Algebra Students
Correct responses were: Number Percentage Number PercentageGreater 7 47 9 47Fewer 2 13 2 11
The same 6 40 8 42Total N=15 100 N=19 100
The data in Table 3 suggest that the classes as a whole attained modest gains in
knowledge about interpreting graphs and determining rates. Students in each class responded
correctly to a greater number of items on the posttest. The classes had very few students that
responded correctly to fewer items on the posttest than the pretest. The scores in each class
suggest that more students responded correctly to a greater number of items after the instruction.
This will be explained in a brief summary for each class in the next two sections.
The Basic Mathematics Results
The results from the basic students' responses to the ten-item achievement test indicate;
• The mean of correct responses increased from 3.53 to 4.27 (Table 4).
Table 4
Basic Mathematics Descriptive Statistics
Pre Test Results Post Test ResultsN = 15 15Mean 3.53 4.27Median 2 4Mode 1 4Standard Deviation 2.67 2.49
The mean was not the only measure of central tendency that increased. The median and
mode also increased and tended toward four correct responses. The modal score is of interest to
this study as it points to most students tending toward the mean. The mean, median, and mode

31all tended to center on four correct items on the posttest. This shows that not only did most
students respond correctly to four items on the posttest the entire class tended to average toward
four correct items.
• Basic math students displayed a statistically significant (p=.02, t=2.32, df=14) increase in the
number of student correct responses to the achievement items (Table 5).
Table 5
Basic Mathematics t-Test: µ (1 - 2), p=0.02
Element of t-test ResultAlpha Level 0.05
Ho: µ(1 - 2) = 0 Ha: µ(1 - 2) > 0Mean of Paired Differences 0.73
t-Statistic 2.32degrees of freedom 14Reject Ho at Alpha 0.05
p value 0.02
The p-value given (p = 0.02) suggests that the increase in mean scores was not due to
chance but rather due to a difference in instructional methods.
• The cluster of basic students' correct responses increased from a range of one to five, to a
range of three to five. (Figure 3)
Figure 3. Boxplots of the basic math students' achievement scores.

32The boxplots for the basic math students are included to illustrate a cluster of students
around one to five correct responses moving upward toward three to five correct responses. The
graphical representation implies that although the students did not perform as well as the algebra
students they still performed well on the posttest compared to the initial responses.
• The frequency distribution reports the number of students in each group of correct responses
and indicates groups that are extraordinarily large, or small.
Table 6
Frequency Breakdowns From the Basic Class (N=15)
Correct Responses Number of Student (Pre) Number of Students (Post)1 5 22 3 23 0 24 1 45 3 16 0 07 2 28 0 19 1 1
10 0 0
Table 6 indicates that students who responded correctly to one or two items on the pre
test became more distributed among one, two, three, and four items correct. This reflects the
modal distribution movement from one item correct to four items correct.
Summary of Basic Math Achievement Results
The results suggest that the basic students did attain a significant increase in concepts
measured by the achievement tests. The data are significant but how relevant? This study sought
to introduce the concepts of rate and reading and interpreting graphs and measured the
achievement and response to that introduction. These results are relevant as they suggest that the

33basic mathematics students and low performing students were able to learn the material explored
during the technology-intensive instruction. These students frequently do not encounter
graphing and certainly not graphing of this nature until much later in their academic careers.
Introducing this concept now suggests that they may well be able to comprehend it at this level,
despite a system of tracking them into lower-ability classes.
The Algebra Class Results
The results from the nineteen algebra students' responses to the ten-item achievement test
indicate;
• The mean of correct responses increased from 8.32 to 9.11 (Table 7).
Table 7
Algebra Class Descriptive Statistics
Pre Test Results Post Test ResultsN = 19 19Mean 8.32 9.11Median 8 10Mode 10 10Standard Deviation 1.53 1.24
The mean, median, and mode all tended to center on ten correct items on the posttest.
The algebra students performed very well as a whole on the achievement tests. This
performance may also be due to previous experience with calculating distance from rate and time
(D=R*T). In relation to the basic students these students should perform well as they had
experience working with graphs prior to the instructional period and in essence the instruction
during this study reinforced what they had already learned about distance, time, and rate.
• The students displayed a statistically significant (p<.01, t=2.80, df=18) increase in the
number of correct responses to the achievement items (Table 8).

34Table 8
Algebra t-Test: µ(1 - 2 ), p=0.01
Element of t-test ResultAlpha Level 0.05
Ho: µ(1 - 2 ) = 0 Ha: µ(1 - 2 ) > 0Mean of Paired Differences 0.79
t-Statistic 2.80degrees of freedom 18Reject Ho at Alpha 0.05
p value 0.01
The statistically significant results suggest that the performance of the algebra students on
the posttest was not the result of chance but rather resultant from the instructional period. This is
especially relevant as they had been exposed to distance and rate calculation prior to the
instruction but they had not explored them graphically.
• The cluster of student correct responses increased from a range of eight to ten, to a range of
nine to ten (Figure 4).
Figure 4. Boxplots of algebra students' achievement scores.
The boxplots illustrate the cluster of algebra students moving from 7 to 9 correct items to
8 to 10 correct items. One concern is that the test was limited to ten items. Had the test
presented more items it would be intersting to see the level of correct responses. There was a
ceiling to the amount of correct items the algebra students could respond to. Time constraints
limited the amount of items included on each test.

35
• The frequency distribution reports the number of students in each group of correct responses
and indicates groups that are extraordinarily large, or small (Table 9).
Table 9
Frequency Breakdowns of Algebra Results
Correct Responses Number of Student (Pre) Number of Students (Post)1 0 02 0 03 0 04 1 05 0 06 0 17 4 18 5 49 4 2
10 5 11
Relevant aspects about this table include the large amount of students responding
correctly to eight or more items on the posttest compared to the absence of students responding
correctly to less than six items.
Summary of Algebra Students' Achievement Results
These results indicate that some algebra students demonstrated significant gains in items
measured by the achievement tests. The mean correct responses increased and more students
responded correctly to more items on the posttest. It also indicates that the algebra students
responded correctly to more items on each test than the basic math students did. These results
suggest some conceptual development during the instructional period.
Summary of Achievement Results
All these data and results describe one aspect of this research. The students in each class
did gain some conceptual knowledge about the ideas of rate and reading and interpreting graphs.

36The differences between each class were evident as the basic students had not encountered
graphs or distance formulae prior to the instructional period while the algebra students had
encountered both but not together. The achievement results are relevant as they describe two
classes of high and low performing students. Some students in each of these classes gained more
knowledge about reading graphs and interpreting information from graphs.
Additional data were collected through surveys in order to develop a glimpse of the way
that students felt toward mathematics and technology.
Data from Survey Responses
The students in each class responded to multiple choice surveys derived from instruments
administered in the Second International Mathematics Study. The percentage of students
responding favorably to each item is reported. The favorable (or positive) responses are included
to create a picture of students gaining a more positive attitude (desirable in this research) toward
mathematics, their mathematics experiences, and technology, (specifically calculators) in the
mathematics classroom. This is true for items that are worded in a reverse fashion (negatively) as
well. An example follows.
Example Item: "I think this report is ridiculously inane." Note: not used on the survey.Response Pre: Strongly agree.Response Post: Disagree.
The desired response is disagree since this report is not inane (positive is disagreement). Since
the response moved from strongly agree to disagree this would be a more favorable response.
The responses were coded from a Likert scale of 1 to 5 for "strongly agree" to "strongly
disagree" with 3 as an "undecided" response. Then a count for each response was performed for
each item. An example is shown with a count (out of 100) for each response.

37Example Item: "I think this report is ridiculously inane." Note: not used on the survey.Count of 1 (strongly agree): 33 Pre, 12 PostCount of 2 (agree): 2 Pre, 0 PostCount of 3 (undecided): 35 Pre, 35 PostCount of 4 (disagree): 20 Pre, 23 PostCount of 5 (strongly disagree): 10 Pre, 30 Post
Using this example, there are 35% responding in an unfavorable manner (combining the
"agree" and "strongly agree" categories) on the pre and 33% responding favorably ("disagree"
and "strongly disagree") on the post. Then there are 12% responding unfavorably on the post
and 53% responding in a favorable manner on the post. This indicates an increase in favorable
responses and suggests that the report was viewed favorably after the survey period. The
direction of change was positive on this example item with an increase of +20.
A direction of change was calculated by subtracting the pre survey percentage from the
post to determine the direction of change in the students' responses. The aforementioned example
an item with a negative change suggests that a smaller portion of responses was positive or
favorable after the instructional period. The opposite was true if an item was shown to have a
positive change from the pre to the post. Specific items of interest were selected with a definite
change in attitudes measured by a large change (negative or positive). The complete responses
for both classes are in Appendices D, and E.
Basic Mathematics Survey Results
The basic mathematics students' surveys indicated that a large percentage of them
responded favorably to most items on the pre test. This suggests that students felt positive
attitudes toward the particular items. The students also expressed positive responses to the same
items on the posttest, most often indicating an increase in positive attitudes. This is interesting as
it provides evidence that students in the basic class may have already identified with the

38mathematics they were learning. It is also interesting to note that nearly all of the responses
increased positively from the pre to the post.
The basic math students indicated an increase in favorable responses toward several
survey items after the instructional period (Table 10).
Table 10
Basic Math Students Increase in Favorable Responses (N=15)
Item Pre Post Difference
How do you feel about using charts and graphs in
mathematics? (IMPORTANCE)44 58 +14
How do you feel about using charts and graphs in
mathematics? (EASE)44 74 +30
How do you feel about using charts and graphs in
mathematics? (LIKE)56 74 +18
How do you feel about using a hand-held calculator
in mathematics? (IMPORTANCE)89 79 +10
How do you feel about using a hand-held calculator
in mathematics? (EASE)89 100 +11
How do you feel about using a hand-held calculator
in mathematics? (LIKE)83 95 +12
Solving Word Problems is more fun if you use a
hand-held calculator61 84 +23
I think Mathematics is fun 39 58 +19
Learning mathematics involves mostly memorizing 0 11 +11
I like to help others in mathematics problems. 22 42 +20
Mathematics is useful in solving everyday problems 67 74 +7
Using a hand held calculator can help you learn
many different mathematical topics61 79 +18
Table 10 displays some interesting trends in student responses to the survey items. A
larger percentage of basic students considered graphs to be more important, easy, and likable
after the instructional period. About twenty percent of the students thought mathematics was

39more fun and they liked working with others more after the instruction. The students also
responded more favorably toward items pertaining to calculator usage in the mathematics
classroom after the instructional period.
The students responded more favorably toward most of the survey items. There were
some items that the students responded less favorably toward after instruction. (Table 11).
Table 11
Basic Math Students Decrease in Favorable Responses (N=15)
Item Pre Post Difference
I can get along well in everyday life withoutmathematics.
78 68 -10
Mathematics is not needed in everyday living 78 74 -4
It is less fun to learn mathematics if you use acalculator
72 63 -9
Table 11 displays three items that the basic students responded to less favorably on the
posttest. This may have been due confusion resulting from the negative wording that all of these
items contain. Each of the items in Table 11 did have a large percentage of favorable responses
on each survey (greater than 60%). This indicates that although the favorable responses to these
items decreased, much more than half the students responded favorably.
The cluster of students in the boxplots in Figure 5 suggest that more than half of the
students responded more favorably to survey items on the post survey (Outliers are circles).

40
Figure 5. Boxplots of basic students' favorable survey responses.
Figure 5 depicts the cluster of favorable responses ranging from 0 % to 90 % for
particular items on the pre survey. The post survey depicts a more compact range of 40% to
100% favorable responses for items with a few students responding less favorably. The
tightening of this range within higher percentages suggest the students had gained some positive
attitudes toward the survey items.
Summary of Basic Math Survey Results
The basic math students responded favorably for most of the items on the pre and post
surveys. This is evidence that they did not have many negative attitudes toward mathematics
prior to the instruction and it suggests that their positive attitudes may have been reinforced by
the instructional period. There are limitations to consider in this type of instrumentation and
these might be evident in the responses to positive items worded in a negative manner.
However, the results from these surveys do shed some light on the way students are thinking
about their mathematics experiences.

41Algebra Survey Results
The algebra students' surveys indicated that a percentage of them responded favorably to
some items on the pre test. This suggests that students felt positive attitudes toward the
particular items. Table 12 displays the items that algebra students responded positively toward
on the pre and post surveys.
Table 12
Algebra Students Increase in Favorable Responses (N=19)
Item Pre Post Difference
How do you feel about using charts and graphs inmathematics? (EASE)
56 67 +11
How do you feel about using a hand-held calculatorin mathematics? (EASE)
67 94 +27
How do you feel about using a hand-held calculatorin mathematics? (LIKE)
78 89 +11
I can get along well in everyday life withoutmathematics.
78 89 +11
Using a hand held calculator can help you learnmany different mathematical topics
50 78 +28
Mathematics is useful in solving everyday problems 94 100 6
The algebra students responded favorably toward items that indicated they had some
positive experiences with the introduction of the technology. They did not however respond
remarkably favorably toward many of the other items. There were few items indicating a large
movement of students indicating more favorable responses. The algebra students did however
indicate clearly less favorable responses on a number of items. A table displaying items
indicating a clear trend of fewer students responding favorably in included in Table 16.

42Table 13
Algebra Students Decrease in Favorable Responses (N=19)
Item Pre Post Difference
I think Mathematics is fun 50 39 -11I really want to do well in mathematics 94 83 -11
Learning mathematics involves mostly memorizing 28 22 -6
I like to help others in mathematics problems. 61 44 -17
It is less fun to learn mathematics if you use acalculator
72 56 -16
Table 13 presents an interesting collection of responses from the algebra students
indicating less favorable attitudes toward items that pertain to their mathematics experiences
including helping others, having fun in math, and finding relevance of math. This is interesting
to note because although most students in the algebra class felt favorable toward these items the
items still display a tendency toward less favorable responses by some students. The boxplots
below indicate the clusters of students for each survey.
Figure 6. Boxplots of algebra students' favorable survey responses.

43The algebra students' responses tended to be distributed across more responses on the
post survey. This suggests evidence that the algebra students were not as confident or sure of
their positive feelings toward mathematics after the instructional period.
Summary of Algebra Survey Results
The algebra students responded favorably for most of the items on the pre and post
surveys. This is evidence that they did not have many negative attitudes toward mathematics
prior to the instruction and it suggests that their positive attitudes may have been reinforced by
the instructional period. It is interesting to note that although most students responded favorably
there were a percentage of students whose responses were less favorable on the posttest. The
cluster of students responding favorably broadened including more and less favorable responses.
The algebra students were used to a set routine and established success within their
mathematics class and this type of instruction may have disrupted that routine.
Conclusions from Survey Results
Most students did indicate favorable responses to items on the pre survey and more
favorable responses to items on the post survey. These were items dealing with technology in
mathematics, relevance of mathematics beyond the classroom, and their views of mathematics.
However, the differences that are apparent between the responses of the two classes are
important to develop the different ways that these classes view themselves in their mathematics
classrooms, how they identify with mathematics, and how the instructional period affected their
attitudes toward these items. Some students in the algebra class had a difficult time navigating
the freedom of the classroom organization and working cooperatively. While this may be a
commentary for how higher ability groups are tracked that is not as interesting as the indication
that the basic mathematics class seemed to enjoy this type of instruction more and indicate better

44descriptions of themselves in mathematics after being involved with this type of instruction. The
students in the algebra class encountered technical difficulties that may explain the attitudes
toward the instructional period as not very much fun. The basic students used the instructor as
more of a facilitator that would fix the problem so they could keep experimenting. The results
indicate that the students experienced a beneficial instructional period despite a few difficult
periods and the basic mathematics students responded more favorably on several items than did
the algebra students indicating more satisfaction with the instructional period compared to their
typical instruction.
The quantitative data above represent significant achievements for some students in each
class and the survey responses indicate considerable increases in positive responses toward
mathematics and mathematics instruction. However, I encountered considerable difficulty in
establishing the relationship between these data and detailing the experiences the students
actually had. I also collected data through videotapes and interviews and field observations. I
believe that several snapshots of this data will portray much more vivid examples of students
actively participating, solving problems, experimenting with ideas, and interacting with the
instructor and each other. These snapshots will reveal much more detail about the technology-
intensive instruction and the experiences the students had within that period.
Observation Results
The next section presents snapshots of the students' participation in the classroom
activities collected through field notes and videotapes. These snapshots point to clear
observations of high performing and low performing students exploring mathematical concepts

45and making discoveries in a technology-intensive setting. Low and high performing students
depicted in these snapshots will exhibit evidence that they;
• were more willing to engage in problem-solving and stayed with a problem longer;• concentrated on the mathematics problems and not on the algebraic manipulation;• solved non-routine problem inaccessible by algebraic techniques; and• believed calculators improved their ability to solve problems.• were more active , they participated in more group work, investigations, and problem solving
explorations (Dunham, 1993; Dunham & Dick, 1994);• were better able to read and interpret graphs, understand global features, and relate graphs
(Dunham, 1996)I noticed the students in each class discovering and exploring new ideas and concepts
associated with graphs and graph interpretation. Following each snapshot is a brief description of
how that snapshot is relevant to this study.
Snapshot 1
Students in each class initially choreographed a volunteer creating a graph on the
overhead display. Students choreographed, or directed, the volunteer walker in ways that
suggested their view of the graph as a picture or map. This was evidence of the initial
conceptions and misconceptions that students had prior to the instructional period.
Common directions from the classroom choreographers are presented:
"Go side to side!""Go in a circle!" "Spin!""Jump up and down!""Go toward the thing.""Run and then stop!""Run," "Now go back""Stop!" "Go!"
The first few commands to the walker will display graphs on the calculator, however they
are different from the choreographer's intentions. The walker's distance from the sensor is
measured and graphed. However, most students assume that as the walker jumps they will see a

46graph that goes upward rapidly. Another common misconception of this type is the
misconception that placing the sensor on a stair and then walking down and away will produce a
step-like graph. This is not the case and the students soon realized that this is not true through
experimentation. They also attempted to make circular graphs by telling the walker to spin or go
in a circle. This is also a misconception, that the sensor detects your actual physical movement
and not your distance from the sensor at particular points. Students then noticed this was not
working as they originally thought and sought to modify the graph in other ways by directing the
walker to run and stop.
The students were actively involved in the dynamic graph construction through these
initial experiments. This is relevant to this research because students in each class began to
understand what is being graphed and how the sensor was graphing it. Scenarios enacted during
the periods of exploration showed students who were wrestling with the misconceptions
described earlier from Mevarech, 1997; and Fernandez, 1998. This was evident in the volunteers
and in classroom choreographers. The cooperative and active choreographers and walkers were
quite different from what I had expected as per the classroom instructor's descriptions of the
basic students as low performing, and nonparticipating students and the algebra students as
nonparticipating and resistant to open-ended instruction.
Snapshot 2
Students working with the "match-the-graph" activity cooperated within their groups to
create the best possible match for a given graph. An example of this type of graph and an
attempt to match it is included in Figure 7.

47
Figure 7. Match the graph example.
Student participation and exploration was evident in every group. This was noticed in
each class and an example of dialogoue is included to provide evidence that there was group
participation and cooperation toward creating the graphs to match a given graph. Groups had
designated particular roles for individuals and these roles were consistently rotated to provide all
members with access to particular aspects of the experiments.
"You walk""You tell them when to go""You stand there so they know where to turn around""You count out the seconds.""You hit the button."
This allowed for the greatest number of students to have access to directing graph
creation as groups members shouted directions putting the onus on them to learn that particular
movements and specific directions (those who shout them, and those who follow them) are
crucial to developing accurate graphs.
Snapshot 3
Michael was a student in the basic mathematics class who usually sat in the back and read
other materials instead of participating and he was frequently characterized as a low performing
student by the classroom instructor. During the instructional period he seemed to enjoy the
calculator equipment a great deal and attempted to describe to his group members and sometimes
to nobody in particular what was going on. I caught Michael in a moment of agony on one of the
initial days. I say agony because he literally seemed to be in pain trying to figure something out.

48I asked him what was going on. He was trying to clarify in his head and explain to the group (at
the same time) that moving away from the motion detector meant the graph was going up and
coming back toward it meant the graph was going down. This is a correct interpretation, but he
was not settled until he could not explain it because several attempts to test this theory resulted in
more confusion. He searched frantically for some chalk and then he came up with this picture on
the board (Figure 8). His group listened attentively then they tried to test his hypothesis.
= moving away from the motion sensor
and
= back toward the sensor
Figure 8. Michael's chalkboard explanation.
This was relevant as an example of the potential for learning that calculators may help
reach in students, particularly students like Michael who, prior to the technology intensive
instructional period, receded into their own secluded thinking during math class. The classroom
instructor remarked at Michael’s eagerness to explain his theory, and I marveled his persistence
to overcome the internal struggle he was having while trying to visualize this event and explain
it. Then of course, his group wanted to make sure, so they tried it out often and eventually were
convinced of Michael’s conclusion.

49Snapshot 4
Groups frequently used physical markers in the classroom to designate starting points and
ending points of particular intervals they were trying to match. They also used real-time counts
of their own to decide when a walker should turn, stop, or speed up as dictated by the graph they
were trying to match. They matched these physical measures with the electronic measures on the
graph to produce accurately matched graphs. This was especially common in the algebra class.
Some groups measured off meters and used tape or books to establish where on the floor
the walker should turn or start or stop. They frequently counted seconds out or made sure that
the walker understood that when
“My hand goes to three and you turn around and come back toward us.” Or “I’ll count theseconds out and she’ll give you directions, O.K.?”
The algebra students also frequently decided that they did not have enough room to match
a particular graph exactly but instead they opted to create a reasonable match of the shape within
the physical distance that they were allowed as in the example shown in Figure 9.
Figure 9. Close-enough match to a graph.
Notice that the graph is about 0.5 meters short throughout each interval but the shape is
similar so the action performed is similar. This is relevant as students established the connection
between the physical environment of the classroom as related to the graphical representation of
the walker's movement. This is no small leap in understanding as it requires transferring the

50units measured by the technology devices to units measured on the floor or otherwise physically.
These scenarios are relevant in that they depict students discovering novel methods for:
a.) Navigating the physical arrangement of the classroom to create optimal graphs to interpret.
b.) Cooperating with group members and other groups to coordinate space and complete
activities.
Snapshot 5
There are several “big ideas” that emerge in graphing activities describing real events.
These “big ideas” are crucial to mathematics learning from the time slope is introduced through
calculus.
1.) When you have a function that is horizontal it's slope is zero. Example: y = any number.
This is because there is no change in y.
2.) When you have a vertical line its slope is undefined and tends toward infinity. Example: x =
anything. There is no change in x. Y is increasing, as x remains unchanging.
3.) As a function changes from positive or negative slope to the other it reaches a point where
the change in y = 0 or a peak/dip.
How do eighth grade students approach these situations? What do they conclude from these
situations or scenarios? Should these “big ideas” even be considered at the middle school level?
The students in this study encountered these big ideas and approached them with curiosity,
questions, and experimentation. In the first case, most students noticed that a horizontal line is
produced when the walker has stopped for an extended period of time. Asked to explain this
phenomenon they describe what seems natural to them. As Michael (a low performing student)
simply put it
"You are standing still, you are not moving but time is expiring. It’s like a rest orsomething."

51
Or as Kent (a high performing algebra student) said:
"You are staying at a constant distance from the detector that creates the graph and thatcreates a flat line."
This is a crucial concept to understanding graphs, that a horizontal line denotes no change
in y (x = anything) while x changes continuously (x = changing). Notice that this comment is
evident and similar in both the basic math student and algebra student. Nearly every student
clearly stated this after they had attempted it with the sensor and calculator an example is shown
in figure .
Figure 10. Example of a horizontal segment with no slope.
The second case, a vertical line with a slope that is undefined and tends toward infinity,
was a bit trickier but no less interesting and no less indicative of the curiosity of the students in
these two classes. A vertical line is "impossible" I heard many of them say. Why it was
impossible, was not as easily answered until the students had tried it enough and failed to make a
vertical line. Students in each class tried everything they could think of. They ran really fast,
they jumped, or they used additional props. The first two seem natural enough as the students
recognized and wanted to cover a large amount of distance in very little time. The discovery of
the futility of trying to make a vertical line is summarized:
"You can’t possibly move that fast and you can't cover that distance in no time"
A very big idea is evident here that the students recognize the relationship between
covering a large distance in little-or-no-time. This was evident in each classroom of students.

52Additionally, some students in each class attempted to produce a vertical line through "cheating"
with props. They accepted the fact that running to produce a vertical graph would not work.
They also realized that the vertical line had to be made with something that moved quickly in an
out of the sensor's beam. Some students attempted to move a chair quickly in-and-out of the
sensor's beam, moved a book quickly in and out of the range, or jumped quickly in and out. The
students realized that they had to trick the sensor into thinking they had moved a large amount of
distance in very little time. An example is shown in Figure 11.
Figure 11. Student example of a graph made by "cheating".
The third component of students discovering “big ideas” were the big ideas from dips and
peaks in the graphs and describing the behavior of the walker during the peak or dip. This is
another “big idea” because it involves identifying the peak as a point where the person pauses,
the graph changes, and there is a brief moment where change in y is zero. Examples are shown
in Figure 12.
Figure 12. A peak and a dip in the graphs.

53
One student in the basic math class explained:
"That little point at the top is really a little straight line."
Algebra students quickly recognized that the walker pauses briefly and then "turns around to
come back toward the sensor".
This is a big idea and relates to a misconception that some students encounter with these
type of graphs. Some students when interpreting the graphs will say that the graph is actually a
peak or a point where some jumps or is somehow otherwise up higher. The point represents a
stop and transition from one direction to the other direction.
Snapshot 6
This snapshot is very interesting as a female student in the basic mathematics class made
it. She decided and explained to the group that this graph (Figure 13) is made by a woman
pulling out of a parallel parking spot.
Figure 13. Basic Math class example graph of a parallel parking experience.
I was deeply interested. I believe "Huh?" was the first word out of my mouth. I had not
noticed it but then she explained it to me. She explained her reasoning to the group and once the
group agreed they presented it to the class.
"The woman backs up for a few feet. She then pauses, switches into drive, and pullsforward for about half the distance. Then she pauses again and backs up a few more feetand then she pauses again and pulls all the way out and drives off."

54
Figure 14. Group explanation of the parallel parking graph.
This was a very adept demonstration of the students' ability to transfer the graphs of
meters vs. seconds to feet vs. minutes. When prompted the students gave rough estimates of
where the car was in terms of the other car and how much time had passed (i.e. a few feet away,
a few minutes). They did indicate that the car was going slowly and at a constant pace for each
of the intervals of movement. They enacted the creation of this graph and the group members all
worked together to describe what was happening as they presented this to the class.
This was relevant because afterward the classroom instructor said that the girl who came
up with this usually sleeps during class and was described as a low performing student. This
activity gave her the opportunity to gain confidence in explaining the ideas she discovered using
the technology. This experience is important in relation to Dunham's research (1995) on
confidence and spatial ability in females with the use of graphing equipment.
Snapshot 7
Ashley was also described as a low performing student. Ashley described a very specific
scenario that she discovered after one of the early days of instruction. She describes her bus trip
to the school every morning.

55
0 10 20 30 40
Figure 15: Ashley's self-generated graphs.
These graphs represent another important transfer to real life events from the events in
the classroom. One day during instruction she drew the top graph to represent an experience she
had that could be graphed and I asked her what she was drawing. She described very clearly
what each interval meant (stopping the bus and picking someone up). She named who was
picked up and for the first interval she described that was her turn. She described the last
interval as everyone unloading from the bus.
I thought this was remarkable as she was quiet and the classroom teacher described her as
one of the low performing students in the classroom. The second graph shows her group’s
attempts with her direction to create the same graph with the distance sensor and calculator.
She described the math as being relevant to her life by describing her experience with the
bus route graph as relevant. Ashley made it clear that she did use this knowledge with other
experiences beyond the classroom.

56"When we talked about the one with the bus and the stops. I think about the bus like a graph."
This snapshot is relevant to this research as it presents a low performing student in the
basic math class comprehending and explaining how she transferred the ideas explored during
the instructional period to a situation outside the classroom.
Snapshot 8
The algebra students were better at determining the specific speed over an interval. This
was likely because they had experience with graphs prior to the instruction and they had
determined slope with specific discrete endpoints on an interval. The example in Figure 15
shows an example of an algebra student determining speed from an interval.
s
m
s
m
ss
mm
13
1
5.6
5.
5.105.16
0.25.2
Start TimeFinish Time
Start DistanceEnd Distance ==−−=
−−
Figure 16. Algebra student example of determining speed over an interval.
This snapshot is relevant as it details the algebra students' attempts to calculate the speed
over a certain interval by using the trace button on the calculator. They would trace the
endpoints of an interval to find the most useful points and then use those points in a typical slope
calculation to determine speed over that interval or change in y over change in x. Most of the
algebra students were able to get this far. Difficulty arose when attempting to distinguish
between extraneous blips on the graph from actual points on the interval. This suggested that

57most students recognized the necessity for defining clear end points on the interval to determine
average speed over that interval.
Summary of Snapshots
These snapshots are interesting from the perspective of conceptual development as
students wrestled with concepts and explained them to one another and the instructor. They are
also interesting from the perspective of student engagement. These snapshots help describe the
experiences that these students had and the type of dynamic learning the students were engaged
in. Students were involved in participating, cooperating, and experimenting throughout the
instruction and explaining their results throughout. This suggests that the basic mathematics
students might well be able to comprehend concepts such as graphing and determining
information from the graphs instead of routine arithmetic problem sets and calculating
percentages. These snapshots help explain some results driven by the original questions of this
study.
Conclusions
1.) How can hand-held calculator technology help low performing and high performing
middle school students identify more with the mathematics they are learning?
Each day during this instructional period the students in both classes were engaged in
learning mathematical ideas related to rate, and reading and interpreting information from
graphs. These topics were explored in technology, collaboration, and experimentation
environments. Students in both classes demonstrated positive attitudes using technology to
learn mathematics and more positive attitudes toward their mathematics experiences as
suggested by the surveys and classroom observations.
582.) How does technology-intensive instruction help high performing and low performing
middle school mathematics students learn new mathematics, and improve their attitudes
toward mathematics?
Some students began to identify with the mathematics as suggested by classroom
observations that showed increased ability to engage in experimentation and negotiation of ideas.
Some students in each class also demonstrated that they are able to identify with the mathematics
they were learning in relation to the world outside their classroom. Students in each class that
had previously not participated in discussions were openly presenting ideas and ways they would
use these ideas. These observations suggest the potential that technology-intensive instruction
has to engage more students in learning mathematics. This is important to consider and is related
to the NCTM proposal: that all students can learn mathematics. If newer students are given
opportunities to learn mathematics in this way then we are closer to helping all students learn
mathematics. Many students in these classes demonstrated abilities to communicate, reason,
connect, and explore problems during the instructional period as suggested by the classroom
observations. The results from the observations seem to be consistent with what other researchers
have found in graphing calculator studies. Some students in each class seemed to display a
better attitude toward mathematics and a better self-concept in mathematics (Hembree and
Dessart, 1986, Dunham, 1995).
Students were engaged and the technology appeared to provide a dynamic learning
environment. This type of dynamic learning environment presents a different mode for the
instructor to interact with the students within.
In studies where graphing technology was in use, students were more active and theyparticipated in more group work, investigations, problem solving, and explorations.Teachers lectured less and were often used as more of a consultant or facilitator than tasksetter. (Dunham, 1993, Dunham & Dick, 1994, p.43)

59
The students in this project seemed to benefit from the new environment and relationship that
existed between them and the instructor.
The instructor was not presenting the answers to the students and acting as the vessel of
knowledge but merely facilitating their interaction and exploration with the mathematics and the
equipment. Students explored and developed ideas through experimentation and exploration
with the technology in ways similar to scientists (Devitt, 1997). This exploration and new level
of experimentation appeared in each class, which suggests that the basic students are capable of
learning more complex mathematics.
Some students demonstrated sophisticated knowledge about the concepts covered and
participated actively in the activities. Several of these students were chosen for case study
explorations. It is relevant to discuss and look at specific students who represent different cases
of low and high performing students in each class.

60CHAPTER 5
CASE STUDIES
This section presents case studies created from three students in each class. Details are
included from interviews to describe the attitudes they had toward mathematics as well as their
experiences within the instructional period. The students were interviewed about their views of
mathematics, their mathematics educational experiences, and their responses to a graph they
could read and interpret for the interviewer.
Students in this section were selected from the larger classroom groups. The classroom
instructor assisted in selecting students to represent a range of achievement within the classes,
and backgrounds. Four students from each class were chosen to participate in interviews before
instruction using the technology and after the period of instruction. The students were asked
questions designed to allow them to express their feelings toward school mathematics, previous
mathematics experiences, and calculator technology. A graph was included in the interviews to
allow the students to share their version of conceptual understanding. Students were expected to
use this graph to describe what they interpreted about the graph. The students were audiotaped
and were allowed to draw or write out their ideas with colored pens and paper.
Themes and trends emerging from the interviews were analyzed to determine information
about the students' view of mathematics and the instructional period.
• Student pseudonym and ID number• General description• Observations and quotes from interviews, videotapes, and classroom observances pertaining
to;• Indicators of identification with mathematics• Indicators of concept development• Indicators of attitude toward mathematics
• Conclusions regarding this student

61
The Basic Mathematics Students
The classroom teacher reported that the students enrolled in this class did not have
classroom experience working with the concepts of rate, speed, or graphing prior to the
instructional period. None of the students had used a graphing calculator before the instructional
period. The classroom teacher expressed concerns about the students’ ability to maintain the
equipment in operating condition. The students had not worked cooperatively very much prior to
the instructional period and the regular teacher had often found that it was difficult to keep the
students on-task during group work.
The three students selected for case studies from the basic mathematics class were
Ashley, Jennifer, and Michael.
Ashley ID#21
General description. Ashley was a black female student in the basic mathematics class.
The regular teacher described her to be a low performing student. She was not disruptive in
during instruction. She was pleasant to interview and seemed very excited about participating in
the instruction with technology.
Observations and interviews. Ashley's responses in the initial interview suggested that
she had a view of mathematics that was limited to consumer mathematics. When asked if she
thought mathematics was relevant to her life she responded:
"Going to the store, yes. Like seeing if the person gives you the right amount of change."

62This response implies that Ashley understands the importance of mathematics as a
calculation tool necessary for consumer affairs. No mention was made of additional mathematics
concepts that may be relevant beyond the classroom.
She indicated that math should be easier and more exciting. When asked how she felt
about mathematics she responded:
"I don’t like it. It takes too much time to write out the problems. It’s boring; there’s nofun about it. No excitement."
This statement suggests that she may not identify with the calculation-based mathematics
emphasized by lower tracked mathematics. Her use of technology was limited to a typical four-
function calculator for efficiency. When asked if she used a calculator she responded with the
following.
"I do sometimes but I think it’s better to work out the problems. Sometimes they take toolong with the thousands and millions to add up so I use a calculator"
"Better" is an important word in her description as she conveys the importance of doing
mathematics without an aid. Her description of the graph suggested that she thought it depicted
an event but was unsure exactly what it was depicting.
Interviewer: "What about this part of the graph?" [Horizontal Line]Ashley: "It was repeating. It was doing the same thing over the time period"Interviewer: "What do you think it was repeating?"Ashley: "Someone selling something…."Interviewer: "Like what?"Ashley: "Someone was probably racing or jumping."
She described the graph as someone selling something that implies a need to relate math
to a consumer environment. When she was asked to explain more she then changed her mind
and described the graph as someone racing or jumping. The "jumping" suggested that she held a

63misconception of the graph as a picture or map (Mevarech, 1997). She did recognize the
horizontal line as a continuous event and described someone repeating something. When asked
to explain why, she described:
"The graph was doing the same thing over the time period."
This suggests recognition of time passing but the y-axis (in this case, but not mentioned by
Ashley, distance) is not changing.
"Jumping the same length or going the same speed or something."
The mention of speed her is important as it implies that she has an intuitive notion about the
meaning of the graph's representation.
Interviewer: "Why did you say speed?"Ashley: "Because it got greater or something"Interviewer: "What happened between here and here"Ashley: "They probably slowed down"
She continued with this idea by explaining that any interval directed upward means they are
going faster.
Interviewer: "How about over here?"Ashley: "They was gradually going faster."Interviewer: "Where at and does it stop?"Ashley: [nods] AffirmativelyInterviewer: "Where?"[graph writing][shows the plateau interval]
The videotapes and observation notes offered evidence that she worked very well with the
members of her group and generally operated the technology more than the other members did.
She seemed comfortable with the equipment and continually prompted others to generate a graph
while she operated the equipment. She explained how a graph she had made could represent her

64trip to school on the bus (Presented in the Chapter 4). This presentation was important for two
reasons.
1.) Ashley transferred the units of the distance sensor (seconds and meters) to units of the
scenarios and graphs she created and described (minutes and miles).
2.) Ashley made general descriptions of scenarios outside the classroom using terms and ideas
from the distance sensor experiments.
She explained that each horizontal interval was the bus stopping and getting someone else
and each interval that sloped up meant the bus was going toward the school. This suggested that
a developing ability of interpreting information from a graph. She was recalling her personal
experiences and applying the mathematics she learned to them.
Ashley's final interview responses indicated that she enjoyed the time of instruction and
the technology:
"It was fun and I think the school should get some of those calculators."
She was informed that the school does indeed have this equipment and she expressed
interest in using them more with the classroom teacher. She described the math covered in the
instructional time as both "easy" and "hard" and when asked to explain how it was easy or hard
she explained difficulty when she encountered instances of having to make decisions and
describe what was going on:
"We had to try and figure what we were doing in certain spots. I had never done anythinglike that before."She suggests that the novelty of the situation was difficult. It was hard because she had
not done anything like that before. This required more from her than the typical routine involved

65within the basic math class. She described the math as being relevant to her life by describing
her experience with the bus route graph again.
She also displayed evidence of being able to interpret the graph and the global attributes
of the graph as opposed to viewing the graph as a literal picture of up and down movement. She
mentioned specific ideas related to the representation of speed in the graph
Interviewer: "How is the distance and time related?"Ashley: "The graph is going straight up, it went up quicker."
Conclusions. Ashley is presented as a low performing student who encountered and
seemed to learn some mathematical ideas that were relevant to her. I learned quite a bit from her
responses and in turn chose to use her as a case study. She exhibited more positive responses
toward mathematics during and after the period of technology intensive instruction. This type of
instruction that challenges low performing students to explore more and relate the mathematics
they are learning to events in their lives could be beneficial for their learning of mathematics and
their attitudes toward mathematics. The period of technology intensive instruction was new and
exciting to Ashley and additional periods like this one could help Ashley continue to grow in her
experiences and using mathematics.
Jennifer ID#14
General description. Jennifer was a white female student in the basic mathematics class.
Jennifer became an interesting case because she transferred out of the basic class involved in the
instruction to another basic mathematics class during the instructional period. This transfer
meant that she was not included in the activities for more than one-half of the instructional time.
Observations and interviews. Jennifer was interesting given her absence through most of
the activities that the class participated in. Her responses to the final interview reflected that she

66had not been present through the instructional period where most students began to develop
sophisticated terminology to explain or interpret graphs. Most students made connections
between the sample graphs during the interview and their ideas with the motion detector
however; Jennifer was unable to describe graphs using sophisticated terms like speed and slope.
Jennifer understood some concepts but she was unsure as to how she should explain
them. The other students were confident in their decisions about interpreting graphs and
determining information from them as they related to the technology used in the classroom.
Jennifer seemed hesitant when talking about speed and slope, and she frequently questioned the
interviewer.
She was present for the first three days and she understood that a person moving in front
of the motion detector could create a graph similar to the sample graph presented during the
interview. She did not seem to understand the relationship between the attributes of the graph
the person's speed or position. She also did not appear to have conceptualized the relationship
between time and distance that is represented in the graphs. Her responses to questions about the
graph suggested that she recognized only one aspect of the relationship. She recognized that a
longer line on a graph represented more distance covered while not stating that the distance was
covered in less time.
Conclusions. Jennifer did not seem to understand many of the more sophisticated ideas
that were covered during the instructional period. She was unable to accurately describe the
behavior of the graph in terms other than the motion detector. The graphs did not have much
relevance to her outside of the few days she spent working with the equipment and in essence she
did not explain where she would need to use any of this knowledge outside of the classroom.

67Jennifer is included as a case study as her absence helped me consider the value of the
technology-intensive instruction as well as the form of infusion that this instruction utilized.
Without this infusion Jennifer was not as able to describe events on graphs accurately and was
not able to generalize information as well as many of the other students particularly the low
performing students in attendance throughout the instruction.
Michael ID# 25
General description. Michael was a white male student in the basic mathematics class.
He was frequently shy and quiet sitting in the back reading, as reported by the classroom teacher.
But with the introduction of the technology, and collaborative learning he became very animated
and involved in classroom activities. The most notable of these occurrences is presented as a
snapshot in the previous section.
Observations and interviews. Michael's initial interview responses suggested that he
thought mathematics was important and relevant beyond schooling. He described specific
situations in which mathematics would be valuable.
"It’s not the easiest class but math, ya gotta learn for your future. You’re gonna use mathfor everything, almost every job. Even if you don’t have a job that uses math, you knowlike you need to balance your checking account. Teachers use math, mathematicians,Architect-Geometry. Everybody uses adding subtracting, multiplication and division-basic stuff."
He seemed to have a notion that mathematics was important but he was frustrated with
mathematics that he perceived and described as useless or a review.
"We learned those [NUMBER PALINDROMES] and that’s new learning, when in yourlife are you going to use that? Same thing like…What is that called…in high school youdo lots of algebraic word problems or something, and some of that you’ll never use inyour life."

68Michael had an intuitive notion of the concept of rate, and reading graphs prior to the
instructional period. This is suggested by his discussion of a horizontal line on a graph.
"You are standing still, you are not moving but time is expiring. It’s like a rest orsomething."
He already recognized the relationship between the components of the graph-distance and time.
He knew that one component (time) is changing but the other is not. These responses were all
made prior to the instruction.
During the interview after the instructional period Michael demonstrated strong
understanding of these concepts and the ability to generalize them to more areas.
"The reason a car goes faster, the way you can tell is that is covers a larger amount ofdistance in a shorter amount of time. That’s how speed is."
This brief mention of speed indicates that he is able to identify the concepts and
relationships in the graph with an idea beyond the motion sensor and give the relationship an
appropriate name, in this case speed.
He explained these two graph intervals in terms of the relationship between distance and time as
it related to the motion sensor experience.
VS.
Figure 17. Michael's attempt to depict more distance in less time.
His explanation focused on the distance that was covered was the same, roughly 2 meters
but the time that passed while that distance was covered was quite different.
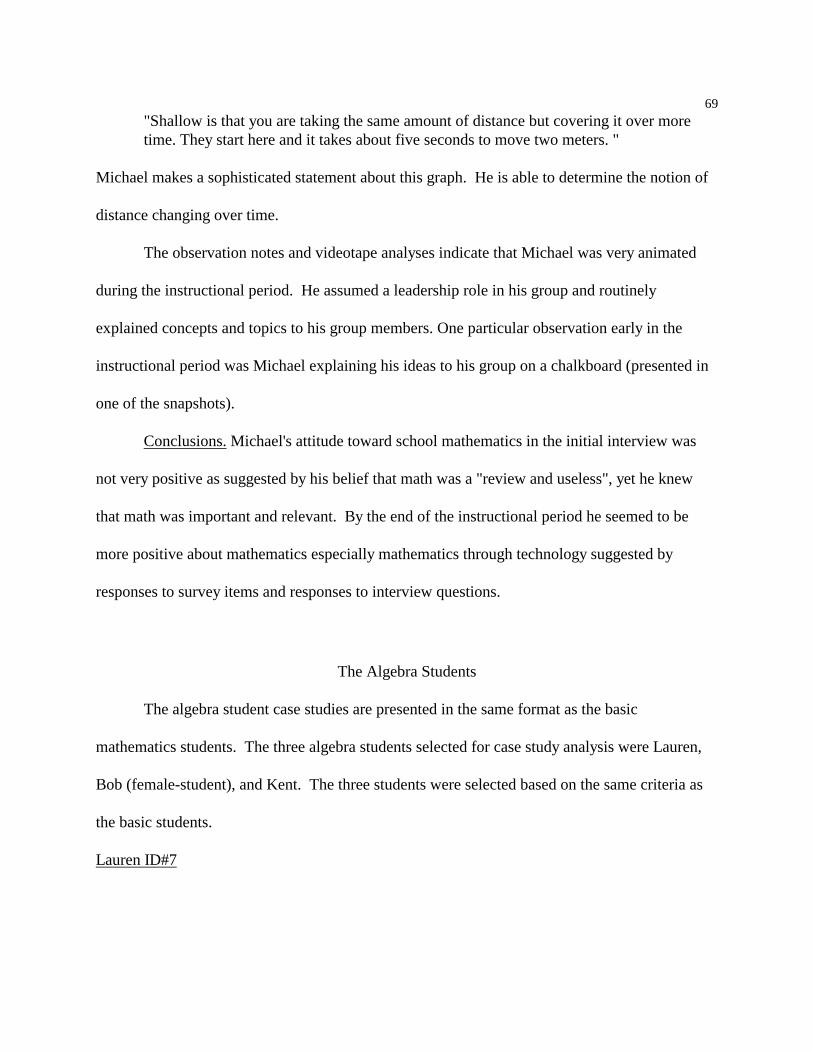
69"Shallow is that you are taking the same amount of distance but covering it over moretime. They start here and it takes about five seconds to move two meters. "
Michael makes a sophisticated statement about this graph. He is able to determine the notion of
distance changing over time.
The observation notes and videotape analyses indicate that Michael was very animated
during the instructional period. He assumed a leadership role in his group and routinely
explained concepts and topics to his group members. One particular observation early in the
instructional period was Michael explaining his ideas to his group on a chalkboard (presented in
one of the snapshots).
Conclusions. Michael's attitude toward school mathematics in the initial interview was
not very positive as suggested by his belief that math was a "review and useless", yet he knew
that math was important and relevant. By the end of the instructional period he seemed to be
more positive about mathematics especially mathematics through technology suggested by
responses to survey items and responses to interview questions.
The Algebra Students
The algebra student case studies are presented in the same format as the basic
mathematics students. The three algebra students selected for case study analysis were Lauren,
Bob (female-student), and Kent. The three students were selected based on the same criteria as
the basic students.
Lauren ID#7

70General description. Lauren was a white female student in the algebra class. Lauren was a
quiet student and like most of the algebra students was content to work individually to complete
the tasks required by the instructional activities after completing the group experiments.
Observations and interviews. Lauren's initial interview indicated that right now she was
experiencing some difficulty with word problems but she feels she does well otherwise in
mathematics.
"In general it’s ok but some things like word problems are a little bit more hard for me.Overall it’s o.k. Word problems-train problems, some are easy but when they getcomplicated they just go through one ear and out the other."
She knows that math is important and relevant to her
"Yeah because it’s important and everything for you to know what you are doing inbusiness or in college."
Her responses to the interview indicate that she had experience calculating rate before from the
formula D=R*T but she has trouble identifying characteristics of a graph of that relationship.
Lauren: "Keeping a consistent speed or getting faster because this dropped then it leveledoff then it got way higher."Lauren: "I don’t know the time though."Interviewer: "When it dropped what happened?"Lauren: "I guess it just slowed down."
Lauren seems to misconceive of the graph as a picture. She describes the graph in terms of ups
and downs. When it dropped down she says it slowed down when in fact the object moved back
toward its original position.
In the final interview Lauren still described difficulty with her word problems but she
became much more adept at detailing the information from the graph. She enjoyed using the
calculators in the instructional time and enjoyed the mathematics. Here she describes how she

71was finally able to use the trace button to give her the information she wanted on the initial
graph.
"Yeah, the first graph you showed us I had no idea how it could go up and down and whatthat meant then after a while we learned that. We learned how to use the trace button tofind the slope and find the speed and how fast it is going per meter."
She used specific points on the graph to give her measure of the average speed over an
interval and then the slope. This implies that she combined what she learned before with what
she learned during the instructional period. She explains the graph in terms of the equipment.
"Well, they started out here and using one of the CBRs this means that they are gettingfurther away from the detector. Then they stop for brief moment and then go back towardthe detector. Then they wait for a bit then here they start moving again. And they get to aslow down and then they stop."
This showed that she had a very good transfer of the class activities with technology to the paper
version.
Conclusions. Lauren was not observed on any of the videotapes but judging by her
results on the pre and post test and her interview responses it looks as though the instructional
period helped her solidify and conceptualize some things she learned prior to the instructional
period. She was a high performing student who performed very well on both achievement tests
and performed well prior to the instructional period.
Bob ID 13 (female)
General description. Bob was a female, black student in the algebra class. She was a quiet
student who did not participate very often but was considered by the regular teacher to be one of
the higher achieving students in the class.
Her responses after the instruction seemed to show that the experience with the
equipment was somewhat less than enjoyable.

72"There are a couple of things I don’t understand like using the TRACE button.I’ve always thought that doing mathematics was important and doing this stuff doesn’tmake it any less important."
This implies a belief that traditionally mathematics is done by paper and pencil without
technology and that the stuff covered during the instructional period of this research was extra.
She did however mention that it was relevant or rather it did not detract from the way she was
taught.
Observations and interviews. The interview results from Bob indicate that she felt
positively toward mathematics and her experiences in mathematics education. She felt that math
is important and yet she recognized that some topics are difficult for her.
"I think it is important, sometimes I don’t like it. If I don’t understand something then Idon't like it at all. I know I am going to need it in college and throughout my life. If youdon’t know math then you cannot buy or do anything. If you get the wrong change thenyou will not know."
Bob's attitude toward mathematics was fairly positive. She recognized that she was pretty good
at it and she described the necessity for studying mathematics.
"If you don’t know math then you cannot buy or do anything. If you get the wrong changethen you will not know I’ve always been in the higher math classes. I’m not perfect but Iguess I ‘m good at it."
Her anticipation of the calculator instruction was that it would be something new and she
was not concerned about challenges this instruction may pose.
"Excited, not so much that we will be doing something challenging but something new."
Bob described a possible situation depicted through the initial graph:
"We just learned D=RT so that graph might be the rate or something. The rate at whichsomething is going like 34 miles/hour or something."

73[she divided graph into increments and showed where 30,40,50,100 miles were and thehours.]
She wanted to apply a formula (D=R*T) to the graph she was given. Numerical units
were not represented on the graph. She tried to establish numerical units of her own to calculate
what she thought the graph was showing. Even after she quantified the axes she was unable to
use them to accurately describe the graph.
"If their distance is going this way and it goes down they could have gone backwards.Is this the whole graph?"
During the interview after the instructional period Bob was able to explain in more detail
what was happening in the graph especially in terms of speed as she explained a steep interval
and some of the details associated with interpreting that segment of the graph.
"Definitely faster because covering more distance in less time."
She recognized this fact and applied this fact while making her own graphs yet she was
unable to determine exact values or read specific points on the graph to determine speed.
Bob was frustrated with the equipment she could not figure out how to analyze specific
points on the graphs that were created. This is interesting and it highlights her frustration with
not being able to use her familiar D=R*T formula. Bob consistently wanted to work with
specific numbers and discrete points. This offers evidence of a misconception described by
Mevarech and Kramarsky (1997) of students confusing intervals and discrete points when
describing graphs and graphical situations. She still sees math as really important but no more
important than before the instruction.
Conclusions. Bob was an interesting case study of a high performing student. She
exhibited frustration with concepts especially when confronted with a situation she was

74unfamiliar with. In this study Bob found that working with global attributes of the graph and the
intervals of the graph to be more difficult for her and she frequently sought to examine the
discrete points on the graph. In many ways the technology did not offer Bob the opportunity to
dynamically explore the graphs within her group. I learned high performing students can benefit
from this type of instruction but it would require more guidance through the explorations.
Kent ID#4
General description. Kent was a male, Asian student in the algebra class. He was
interesting from a number of perspectives concerning this research. He was a high performing
student in his classes and he described support from home concerning his performance. He
described in detail how many-and what kinds of fields required proficiency in mathematics.
"81 or 83 major field use mathematics."
Kent’s interviews outline a view of mathematics that is very positive.
Observations and interviews. Kent indicated that mathematics is very important and
necessary. This was evident by responses from both interviews.
"Math’s Great, I like it a lot, It’s a necessary part of life. I get it a lot in my family. It’seasy, it’s fun."
Yet, he does not view specific graphing concepts as very relevant even after the instructional
period.
"Basically everything involves mathematics it doesn’t matter if it is common sense or notcommon sense. Eighty-three major fields need mathematics. I think its eighty-one oreighty three. We can’t really use the graphing calculators in our daily routine, we don’thave to graph in our daily routine."
His family places a great deal of importance on success in mathematics and they encourage him
in his mathematics education. He describes a belief about the relationship of technology and

75mathematics. He looks at mathematics as important to his understanding of technology,
specifically computer technology. On the other hand, he offers the belief that using calculators
in mathematics is akin to cheating.
"Mathematics requires you to use your brain. With a calculator you’re just enteringnumbers."
This is another example of both low performing students and high performing students’ view of
technology for efficiency and ease in mathematics. Although he described mathematics as easy
and fun, it is clear that he recognized the difficulty and elitist nature of knowing mathematics.
Kent had an intuitive notion about distance v. time graphs prior to the technology-
intensive instructional period. He was able to explain most of what was going on in the graph.
He immediately noticed that the first change in slope of the graph from an incline to a decline
signified a change in direction for the object creating the graph. He realized that this showed an
object coming back the way it had come, or retracing their steps.
"Well it’s a distance and time graph, showing someone’s motion. They are going alongconfidently at first. With no doubt. Then they slow down. 0 they begin going back towhere they started."
His terminology about the rate that the person was traveling seems to show less sophistication.
He describes the second incline as a faster trip solely based on the appearance that more distance
was covered and not specifically more in distance in less time.
"Because this line is longer and covers more distance than the first line. Almost like theycovered double."
However, in the post interview he gave responses that were much more sophisticated in terms of
the equipment and in the features of the graph.
"You are staying at a constant distance from the detector that creates the graph and thatcreates a flat line."

76
This understanding of a constant distance is a sophisticated way to explain what the other
students explained as no change in distance but time is passing.
Conclusions. Kent seemed very content with his experiences in mathematics and
suggested that technology should not be used to learn math. He did however display strong
positive responses to technology after the instructional period and he even seemed to enjoy the
instruction. He was very knowledgeable about the concept of rate but had difficulty interpreting
graphs before the instruction. After the instruction he applied what he knew before the instruction
to the interpretation of graphs and reading information from them explored during the
instruction.
Summary of Case Studies
The case studies and snapshots work in unison to create an image of the experiences the
students in each class have. The snapshots presented in the previous chapter included some
students that were involved in the case studies. These students are notably Ashley and her
experiences transferring concepts to her experiences outside of class. Michael is described while
presenting his experiences cooperating and experimenting with his group members. Kent is
quoted describing a very important point about horizontal lines.
By including these students in two areas I intended to present two facets of the
experiences these students had:
• The case study students shared personal experiences and ideas with me through the
interviews and personal observations as well as the general interactions and experiences they

77were engaged in during the daily instruction with the technology represent opportunities for
looking at.
• The snapshots represent opportunities for examining the students' experiences with the
specific activities while interacting with one another and engaging in experimentation with
the equipment.
The case studies represented high performing and low performing students from the
algebra and basic mathematics classes. They helped demonstrate the effects that the technology
intensive instruction had on individual students in the class. There were different effects on these
students and they suggest that the instruction affected their attitudes and conceptual development
differently. The algebra students had encountered the formula for calculating distance from rate
and time. They had not however, as reported by the classroom teacher, encountered graphical
representations of distance and time. The algebra students frequently attempted to apply
numerical and computational methods to interpret the graph during the interviews and
instruction. They expressed difficulty interpreting what the global aspects of the graph were.
The basic mathematics students had no experience with interpreting graphs or the distance and
rate formula. However, Michael and Ashley both exhibited intuitive notions about distance and
time graphs.
The basic mathematics students expressed frustrations with the boredom they experienced
in mathematics in the initial interviews compared with the final interview description of the
instructional period as exciting and they expressed more desire to perform activities like these.
The algebra students thought it was fun and it probably would not be any less important to their
future in mathematics. The basic mathematics students expressed overwhelming enthusiasm at

78doing something different and something that related the mathematics to them and they
mentioned that they would probably encounter technology like this later.
When these case studies are examined together with the snapshots it appears that the
period of instruction was very beneficial for both low performing students and high performing
students especially considered individually within the classroom. This is evident in increased
transfer of concepts, increased interaction and classroom participation due to the dynamic nature
of the instruction; increased positive attitudes toward the mathematics learned and explored
during the instructional period.
The results from the achievement data, survey data, snapshots, and case studies have been
presented to portray aspects of this research and the influence of technology-intensive education
on high performing and low performing students. After examining the students from these
results and data and the experiences and explorations that they have engaged in I will present a
summary discussion and recommendations for mathematics education in the next chapter.
79
CHAPTER 6
SUMMARY, CONCLUSIONS, AND RECOMMENDATIONS
This chapter presents conclusions drawn from this project, recommendations for
mathematics education, and implications for further study. This research project involved
technology intensive instruction to facilitate students' understanding of mathematical
concepts (rate and reading, interpreting graphs) and help improve their attitudes toward
mathematics. Technology intensive instruction through the use of tools like those used in
this research can align conceptual understanding of mathematics with positive attitudes
toward mathematics. This study suggests that during the instructional period some low
performing and high performing were engaged in learning mathematical ideas related to
rate, and reading and interpreting information from graphs.
Summary
Low performing and high performing students alike responded favorably to the
instructional techniques. Students in both of the classes demonstrated increased
knowledge about the concepts explored as suggested by the results of the pretest and
posttest. In addition to an increase in knowledge gained from the instructional period,
students in each class demonstrated positive attitudes using technology to learn
mathematics and more positive attitudes toward their mathematics experiences as
suggested by the surveys and classroom observations.
Some students began to identify more with their mathematics as suggested by
classroom observations that showed increased ability to engage in experimentation and
communication of ideas. The students in each class also demonstrated that they are able

80
to identify with the mathematics and transfer some concepts to the world outside their
classroom.
The results of this study are important to analyze the impact of technology-
intensive instruction on more classes. Questions need to be asked about the content
delivered to the traditionally lower-tracked classes, and the instructional methods with
low performing students. Several students who had not participated in class very much
prior to the instructional period became very involved in the instruction during the
research time with the technology. Several of these students actively described events
outside the classroom in relation to concepts explored, requesting more instruction of this
sort, or participating in ways the classroom instructor had not seen previously. Results
and observations like these imply the need for new methods of instruction to engage
newer and more students in mathematics. Steele describes students choosing to
disidentify while this project recognized several students who actively chose to identify
with the concepts that were explored during the instructional period.
Many students in these classes demonstrated abilities to communicate, reason,
connect, and explore problems during the instructional period as suggested by the
classroom observations.
The conclusions regarding this study and the experiences of the students support
mathematics education reform movements' recommendations for the infusion of
technology with mathematics education programs. The technology was not reserved for
the students enrolled in the advanced mathematics class but was available for all the
students in the study. This arrangement gave low performing and high performing

81
students opportunities to explore complex mathematical ideas that they had not had an
opportunity to before this instruction.
Limitations
There are several limitations to this research project. This study was administered
to small samples of specific students (2 classes of nearly 20 students). More conclusive
evidence of the effects of technology on these students could be gained through the
involvement of larger classes and more students at different grade levels. This study
focused on two middle school classes. However, research on graphing calculators in the
mathematics classroom (Hembree & Dessart, 1986) has shown there is an increase in
positive attitudes toward mathematics and an increase in self-concept in mathematics
with students using calculators across all grades and ability levels.
This research took place over a short time period (10 class periods) of instruction.
More time spent using the technology is necessary to gauge how the students use the
technology every day in more areas of mathematics. Technology should be infused with
the curriculum so that it is used regularly during instruction. This type of arrangement
will encourage students to continually consider experimentation and exploration as
reasonable approaches to learning mathematics. The novelty of the technology used in
this study may have attributed to students' positive attitudes. They had not experienced
instruction like this before and they may have responded out of excitement for the
novelty. This research was also limited in the amount of topics covered. There are many
more topics that can be explored in greater depth with graphing calculators and data
collection devices such as those used in this research.

82
Conclusions
This research focused on the experiences of low performing and high performing
middle school mathematics students. However in concluding this study serious questions
arise for areas associated with the future of these students and the future for mathematics
education. Some future areas of research deal with extended issues within mathematics
education. Some areas that can be explored are:
• continuation of positive attitudes toward mathematics in future mathematics classes;
• transfer of rate concepts to other mathematics classes or other fields;
• preservice mathematics teacher education with this technology; and
• continued professional development of current teachers with this technology
Continuation of Positive Attitudes toward Mathematics
The students in this research project demonstrated gains in achievement and
conceptual development of mathematics topics. They also gained more positive views of
mathematics and school mathematics indicating identification with mathematics, at least
immediately following the instructional period. It remains to be seen if the students at
both levels can retain this positive attitude in current classes or if more work with
technology would be beneficial. More research toward these ends would be worth
pursuing for the mathematics education community.
Transfer of Rate Concepts
Many students transferred concepts from the classroom to the “real-world” they
encountered daily. An extension of this transfer would be the study of how the students

83
transfer graphing concepts, and rate concepts to more advanced mathematics classes or
even to science classes. Data collection devices of this type are frequently used in science
classes yet there is rarely a relationship drawn between the mathematical concepts and the
science concepts.
Preservice Mathematics Teacher Education
The activities in this research project were piloted with an undergraduate
mathematics education course of preservice teachers. The preservice teachers learned the
concept of rate in addition to the inclusion of technology in the mathematics classroom.
Some of the students had not realized that some of the most fundamental ideas of calculus
are explored in activities like these. They remembered or relearned the vertical line test
for a function while they explored these experiments and they discovered new ways of
working with real-world graphs.
They enjoyed the experience and participated just as enthusiastically in the
activities as the middle school students. More research could be designed to see how
much of the concepts the students have retained in relation to their teaching of
mathematics. How comfortable do preservice mathematics teachers feel exploring
mathematics concepts with technology, especially concepts that can now be explored at
the middle school that were previously reserved for later grades? How do preservice
teacher feel about introducing higher concept topics to classes that have traditionally been
designated as low performing students?
84
Continual Professional Development
Another interesting extension to this research occurred when an abbreviated
version of this unit was presented at a workshop for teachers currently instructing middle
school mathematics. Some of the practicing teachers encountered the same
misconceptions that middle school students did. Including but not limited to describing
the graph as a map, attempting to create a graph while walking parallel to the sensor and
not perpendicular. Some of them also revisited fundamental calculus concepts; a vertical
line slope is undefined, while a horizontal line has no slope, and there is a very important
difference.
These practicing teachers enjoyed using the equipment and were excited about the
possibilities of this equipment and areas where they can include the equipment in their
classes. This workshop took place over a four-hour time period. It included instruction
with an abbreviated version of the materials intended for the two-week instructional
period in the middle school. This is interesting and important as more technology
especially calculator and hand-held technology enters mathematics education as a viable
tool for exploration. How comfortable and experienced are current mathematics teachers
with the technology that is being introduced?
Recommendations
This study and other reports of studies using graphing technology indicate the
potential for technology to dramatically influence the way students learn and the way
mathematics taught in the mathematics classroom. The potential for all students to
explore powerful mathematical ideas is exciting. Recommendations from this study

85
include letting more low performing students experiment with complex mathematical
ideas at an early age in dynamic classroom environments instead of continually
instructing in a traditional row-and-column format that focuses on drill and procedural
skills. More teachers should be given support to learn about this equipment to find
interesting and comprehensive methods for exploring mathematics. The mathematics
curriculum as it is right now does not serve all students and from this research technology
has the potential to introduce some of the students who are currently not being served by
the curriculum to powerful mathematical ideas. As such then, schools and teachers
should consider recommendations made by groups promoting the infusion of the
mathematics curriculum with technology. These groups are the NCTM, PCAST, and
several other researchers who have documented the effectiveness of technology-intensive
instruction.

86
REFERENCES
Devitt, T. (1997). Six reasons to infuse science with technology. Electronic Learning,16(5), 40-46, 61.
Dunham, P H. (1993). “Does using calculators work? The jury is almost in.” UMETrends, 5 (2), 8-9.
Dunham, P H. (1995). “Calculator use and gender issues.” Association for Women inMathematics Newsletter, 25 (2), 16-18.
Dunham, P H. (1996). “Looking for trends: what’s new in graphing calculatorresearch?” Proceedings of Eighth Annual International Conference onTechnology in Collegiate Mathematics. Ed. Gail Goodell. Reading, Mass.:Addison Wesley Publishing Company, 120-124.
Dunham, P. H. D., Thomas P . (1994). Connecting research to teaching: research ongraphing calculators. Mathematics Teacher, 87(6), 440-45.
Dyke, F. V. (1994). Relating to graphs in introductory Algebra. Mathematics Teacher,87(6), 427-439.
Fernandez, M. L. (1998). Technology, students' understanding of graphs, and classroominteractions. Paper presented at the PME-NA: Psychology of mathematicseducation 1998 conference, University of North Carolina.
Fey, J. T., Hirsch, C. R., & National Council of Teachers of Mathematics. (1992).Calculators in mathematics education. Reston, Va.: National Council of Teachersof Mathematics.
Gutierrez, R. (1996). Practices, beliefs, and cultures of high school mathematicsdepartments: understanding their influence on student advancement. Journal ofCurriculum Studies, 28(5), 495-530.
Hembree, R & Dessart, D.J. (1986). Effects of hand-held calculators in precollegemathematics mathematics education: A meta-analysis. Journal for Research inMathematics Education, 17(2), 83-89.
Hill, J. L. (1997). The Disidentification hypothesis and its application to the mathematicsclassroom: a model for understanding the relationship between mathematics andthe student. Unpublished Masters Thesis., University of Illinois, Champaign.
Kaput, J. J. (1992). Technology and Mathematics Education. In D. A. Grouws (Ed.),Handbook of research on mathematics teaching and learning (pp. 515-556). NewYork: Simon and Shuster.

87
Kaput, J. J. (1994). Technology in Mathematics Education Research: The First 25 Yearsin the JRME. Journal for Research in Mathematics Education, 25(6), 676-684.
Means, B., & United States. Office of Educational Research and Improvement. Office ofResearch. (1993). Using technology to support education reform. Washington,D.C: U.S. Dept. of Education Office of Educational Research and ImprovementOffice of Research.
Mevarech, Z. R., & Kramarsky., B. (1997). From verbal descriptions to graphicrepresentations: stability and change in students' alternative conceptions.Educational Studies in Mathematics, 32(3), 229-262.
National Council of Teachers of Mathematics. Commission on Standards for SchoolMathematics. (1989). Curriculum and evaluation standards for schoolmathematics. Reston, Va.: The Council.
National Council of Teachers of Mathematics. Commission on Teaching Standards forSchool Mathematics. (1991). Professional standards for teaching mathematics.Reston, VA: The Council.
National Council of Teachers of Mathematics. NCTM. (1998). Principles and standardsfor school mathematics: discussion draft. Reston, VA: NCTM.
Oakes, J. (1990). Multiplying Inequalities: The effects of race, social class, and trackingon opportunities to Learn Mathematics and Science. Santa Monica: RAND.
Papert, S. (1980). Mindstorms : children, computers, and powerful ideas. New York:Basic Books.
Pea, R. (1985, April). Beyond amplification: Using the computer to reorganize mentalfunctioning. Paper presented at the AERA - Computers as tools of the intellect:Lessons from the past and an agenda for the future, Chicago, IL.
Pea, R. (1987). Cognitive technologies for mathematics education. In A. Shoenfeld (Ed.),Cognitive science and mathematics education (pp. 89-123). Hillsdale: LawrenceErlbaum Associates.
Pomerantz, H. (1997). The role of calculators in math education (Research Compilation).Dallas, TX: Urban Systemic Inititative/Comprehsive Partnership for Mathematicsand Science Achievement.
PCAST, President’s Committee of Advisors on Science and Technology (1997). Reportto the President on the Use of Technology to Strengthen K-12 Education in theUnited States. (President Report ). Reston, Va.: PCAST.

88
Quesada, A. R. M., Mary E . (1994). The effects of using graphing calculators to enhancecollege students' performance in Precalculus. Educational Studies in Mathematics,27(n2, Sep), 205-15.
Ruthven, K. (1990). The influence of graphic calculator use on translation from Graphicto Symbolic Forms. Educational Studies in Mathematics, 21(Oct, no.5), 431-50.
Secada, W. G. (1990). The challenges of a changing world for mathematics education. InT. J. Cooney (Ed.), Teaching and learning mathematics in the 1990s: 1990 NCTMYearbook (pp. 135-143). Reston, VA: NCTM.
Suydam, M. N., Ohio State University. Calculator Information Center., & NationalInstitute of Education (U.S.). (1982). The use of calculators in pre-collegeeducation : fifth annual state-of-the-art review. Columbus, Ohio: CalculatorInformation Center.