technology gap and international knowledge transfer:...
TRANSCRIPT

Technology Gap and International Knowledge Transfer: NewEvidence from the Operations of Multinational Corporations∗
Nune Hovhannisyan†
Loyola University Maryland
July 2015
Abstract
Multinational corporations have long been recognized as both major creators of technologyand as conduits of technology transfer. Technology transfer can happen directly, when theaffi liate licenses the technology from the parent, or indirectly, when the affi liate imports in-termediate goods with embodied technology. This paper estimates the effect of the affi liates’productivity relative to the frontier – the technology gap – on the choice of licensing thetechnology or importing it through intermediate goods. A novel measure of multinationaltechnology transfer is employed using data on technology licensing payments versus importsfrom U.S. multinationals across many countries and industries. The main finding of thispaper is that a large technology gap of an affi liate favors indirect knowledge transfer throughimports. On average, a 10% increase in the technology gap decreases the share of licensingversus importing inputs embodying the technology by 5%. Considering that access to ideasand generation of new ones are crucial for long-run economic growth and convergence of acountry, this study highlights the policy implications for countries to raise their productivitylevels.
Keywords: Multinationals, technology transfer, productivity gap, intermediate inputs,royalties and license feesJEL: F23, F1, O33, L24
∗I would like to thank Wolfgang Keller, Murat Iyigun, James Markusen, Keith Maskus, Jaehan Cho, VictoriaGeyfman, David Joulfaian, Shushanik Hakobyan, Ben Li, William Olney, Fabio Mendez, Andrew Samuel, partici-pants at the Eastern Economic Association Annual Conference (New York 2015), Canadian Economic AssociationAnnual Conference (Montreal 2013), Midwest International Economics Group (Michigan State University 2013),and seminar participants at the University of Colorado Denver, Stonehill College, Loyola University Maryland,Miami University for very valuable comments and suggestions.†Department of Economics, Sellinger School of Business and Management, Loyola University Maryland, Bal-
timore, MD 21210; email: [email protected] ; web: http://nunehovhannisyan.weebly.com
1

1 Introduction
There has been a significant increase in the levels of global trade in goods and services. Two
components of this increase are noteworthy: currently, global trade in ideas is reaching an-
nual levels of $250 billion (World Development Indicators),1 and trade in intermediate inputs
comprises 57% of total trade in goods in OECD countries (Miroudot, Lanz and Ragoussis 2009).
The United States is a major seller of technology, accounting for around 50% of world royal-
ties and license fee receipts (World Development Indicators), and trade in intermediate inputs
in the U.S. accounts for half of total trade in goods (Miroudot et al. 2009). U.S. Multinational
Corporations (MNC) are important conduits of technology transfer, with around two-thirds of
royalties and license receipts coming from intra-firm transactions and approximately 60% of
total trade within U.S. multinationals being trade in intermediate inputs (The U.S. Bureau of
Economic Analysis).
A MNC can transfer its technology to foreign affi liates in disembodied form (know-how, indus-
trial processes, computer software) or in embodied form (intermediate inputs). Flows of royalty
and license receipts from affi liates to parents for the use of intangible technology is evidence of
disembodied technology transfer, while exports of goods for further processing from parents to
affi liates can indicate embodied technology transfer. It is well known that technology transfer is
an important determinant of long-term cross-country income, economic growth and convergence
of countries. However, the mode of technology transfer in embodied versus disembodied form
has a differential impact not only on access to current knowledge and economic growth, but also
on innovation, economic welfare, and convergence. The history of the soft drink "Fanta", which
1Trade in disembodied ideas is measured by world receipts (or payments) of royalties and license fees.
1

was invented by the German affi liate of the Coca-Cola Company, offers one example. Possessing
the recipe for Coca-Cola but lacking all the required ingredients due to a shortage in World
War II-era Germany, Coca-Cola Deutschland invented this new soft drink by using the only
available ingredients instead. In addition, the mode of technology transfer might also affect the
degree of knowledge spillovers from multinational affi liates to domestic firms, which improves
the productivity of the latter.2
What determines the mode of technology transfer within a MNC? This paper provides new
evidence that the technology gap of U.S. MNC foreign affi liates, defined as their productivity
compared to the productivity frontier, is associated with the decision of U.S. multinationals
to export tangible goods versus intangible technology within the MNC. The example of Intel
Corporation illustrates the hypothesis behind this paper. For 25 years, Intel Corporation has
had plants in China where chips (intermediate goods) are shipped for assembly and testing.
But in October 2010, the company announced the opening of a new wafer fabrication facility
(fab) in China capable of using the blueprint to make the actual chips. At the same time, Intel
announced the opening of a chip assembly factory in Vietnam (Takahashi 2010a; 2010b). One of
the reasons why Chinese affi liates of Intel Corporation currently receive technology in the form
of blueprints while Vietnamese affi liates receive technology in the form of intermediate goods
might be that the former are currently closer to the productivity frontier, while the latter are
farther from the frontier.
A panel data on the activities of U.S. multinationals in 45 host countries and across 7 manu-
facturing industries is employed to analyze the relationship between the affi liate’s technology gap
2See Keller (2010) for a survey of evidence on technology spillovers from international trade and foreign directinvestment.
2

and the share of importing technology versus inputs. Focusing on the activities of U.S. MNCs
is attractive as there is information on both the technology and input flows within firms. These
data come from legally mandated benchmark surveys, conducted every five years by the Bureau
of Economic Analysis (BEA), which enable the identification of U.S. parent-affi liate tangible
and intangible technology transfers across FDI host countries and industries. The technology
gap is measured as the deviation of the affi liate’s labor productivity from the parent productiv-
ity in the same industry and year. The main finding of this paper is that the technology gap
is negatively related to the share of disembodied versus embodied technology transfer, with a
10 percent increase in the technology gap on average decreasing the share of licensing versus
importing inputs by 5 percent.
The significance of this paper stems from the realization that, based on industry patterns,
MNCs tend to share know-how with country affi liates that are more productive, but export
intermediate goods to the less productive ones. The fact that affi liates which are far from the
frontier receive technology in the form of goods and not disembodied ideas, leads to policy
implications that for developing less-productive countries the reduction in the technology gap
would involve direct access to knowledge and ideas. This not only gives such countries access
to current information, but also stimulates the creation of new knowledge which in itself is
important for long-run economic growth and convergence.
The theory on multinational enterprises identifies horizontal and vertical directions for For-
eign Direct Investment (FDI). Horizontal FDI arises when multinationals replicate their pro-
duction in host countries to gain market access (Markusen 1984), whereas vertical FDI arises
when different stages of production are fragmented to take advantage of differences in factor
3
prices (Helpman 1984), intra-industry considerations (Alfaro and Charlton 2009), or interna-
tional transaction costs (Keller and Yeaple 2012).3 Country empirical studies have found that
market sizes, country similarity, factor endowments, and barriers to trade are among the most
important determinants of FDI, while country-industry studies find that these factors have a
differential impact on FDI in various industries.4
This paper contributes to the growing body of literature on vertical production sharing
within multinationals, where part of production takes place locally in affi liates while the other
is imported from parents (Hanson, Mataloni and Slaughter 2005; Fouquin, Nayman and Wagner
2007; Keller and Yeaple 2013). Hanson and coauthors find that MNC foreign affi liate’s demand
for imported inputs is higher in affi liate countries with lower trade costs, lower wages for less-
skilled labor, and lower corporate income tax rates (Hanson, Mataloni and Slaughter 2005).
Keller and Yeaple (2013) formalize and empirically confirm that knowledge intensity is another
important determinant for the location of intermediate input production, where it is more dif-
ficult to transfer technology in more knowledge-intensive industries.5 This paper differs from
the work of Hanson and colleagues and Keller and Yeaple by employing a direct measure which
differentiates between transfer of tangible intermediate inputs versus intangible technology from
U.S. parents to affi liates. Some new literature has emphasized the importance of especially
intangible technology transfer in contrast to goods transfer within vertical production sharing
(Atalay et al. 2014, Ramondo et al. 2015, and Cho 2015).
A second body of literature has documented the importance of productivity differences in
3Ekholm, Forslid, and Markusen (2007) formalize "export-platform" FDI with both horizontal and verticalmotivations.
4See Carr, Markusen and Maskus (2001), Bergstrand and Egger (2007), Brainard (1997) for country studies,and Helpman, Melitz and Yeaple (2004) and Awokuse, Maskus and An (2012) for country-industry studies.
5Keller and Yeaple (2008) provide key theoretical microeconomic foundations.
4

subsidiaries of foreign companies for knowledge flows within MNCs.6 Bjorn and coauthors find
that the larger the technology gap, the more important the foreign parent as a source of codified
knowledge, defined as patents, licenses and R&D (Bjorn, Johannes and Ingmar 2005). Their
study used survey data for foreign firms in Eastern European countries, but did not include
knowledge embodied in intermediate goods.7 A related study by Driffi eld, Love and Menghinello
(2010), finds that Total Factor Productivity (TFP) of foreign affi liates in Italy is important
for technology transfer from affi liates to parents (sourcing), but not important for technology
transfer from parents to affi liates (exploiting).8 Using data on French multinationals, Fouquin,
Nayman and Wagner (2007) find that labor productivity of countries is positively associated
with imported-input demand for affi liates in developed countries, but is negatively related for
affi liates in developing countries.
This paper adds to the first body of literature a relative measure of embodied and dis-
embodied technology to empirical analysis of multinationals’vertical production networks. In
relation to the second body of literature, this paper explicitly identifies two forms of knowledge
transfer within MNCs and highlights productivity differences of affi liates as an important factor
in determining the mode of technology transfer. As the decision of transfer occurs within the
firm, affi liate productivity may be endogenously determined by MNCs. This is addressed in
the present study relying on a theory of trade, FDI, and technology transfer (Keller and Yeaple
2013). Furthermore, across country and across year variation in labor productivity of affi liates of
6Martin and Salomon (2003) discuss general knowledge transfer capacities in multinational corporations.7See also Gupta and Govindarajan (2000). Using country-level analysis, they find that knowledge flows within
multinationals from home to host country are higher the lower the relative level of economic development of thehost country (measured by GDP per capita).
8The survey used in Driffi eld et al. (2010) is based on a binary response to whether there was transferof scientific and technological knowledge from parent to affi liate, which does not distinguish between tangible(intermediate goods) and intangible (patents, licenses, software) forms.
5

U.S. MNCs within the same manufacturing industry is used to identify not only the direction of
the impact, but also parameter estimates. A limitation of this paper is the usage of aggregated
country-industry level data due to inaccessibility of confidential firm-level data from the U.S.
Bureau of Economic Analysis.
The remainder of the paper is organized as follows. The next section highlights the theoretical
foundation. Section 3 presents the empirical estimation strategy and discusses estimation issues.
Section 4 details data sources, variable construction, and descriptive statistics. The results are
presented in section 5. Section 6 concludes.
2 Theoretical Foundation
The objective of this paper is to estimate whether there is a connection between the technological
gap of MNC affi liates and the mode of international knowledge transfer from the multinational
parents to affi liates across countries and industries. This paper focuses on one parent country’s
(the United States) affi liates abroad as it imposes certain homogeneity in terms of affi liate
activities. Assume that U.S. multinationals decided where to locate their foreign affi liates.9 The
remaining decision involves the type of knowledge transfer, which is measured by the transfer of
technology (know-how, industrial processes) versus intermediate goods from the U.S. parents to
host country affi liates.10 Direct measures of technology licensing payments and imports of goods
for further processing are used to specifically pin down the share of disembodied versus embodied
9Since the analysis in this paper is based on industry data, it prevents the study of questions related to thefirm-level location decisions of the U.S. MNC affi liates abroad.10This paper does not include arm’s length technology transfer of U.S. multinational corporations to other
unaffi liated domestic or foreign entities. Within-firm technology transfer in the form of intermediate inputs andideas from U.S. parents to affi liates is the main focus of this paper. Other types of embodied technology mightinclude capital goods and people, which are beyond the scope of this paper.
6

technology transfer from the U.S. parents to affi liates. The technology gap of an affi liate is
measured by the deviation of its labor productivity from the parent’s labor productivity in the
same industry and year.
The approach for estimating the relationship between the technology gap and international
knowledge transfer is as follows. I specify that the share of technology transfer (in intangible and
tangible forms) to an affi liate country c in industry i, TTci is a function Φ of the technology gap
of an affi liate country c in industry i, TGci and of other observed and unobserved determinants,
Zci:
TTci = Φ(TGci, Zci,Θ), (1)
where Θ is a vector of unknown parameters. Equation (1) can serve as a reduced-form of
a model of technology transfer within multinational corporations. The theoretical model that
motivates the empirical analysis that follows is based on Keller and Yeaple (2013). This model
of trade, FDI, and international technology transfer builds on the transaction costs of interna-
tional activities. There exist shipping costs to transfer intermediates that embody technological
information from the U.S. parents to affi liates and communication costs to transfer disembod-
ied technology. Shipping costs of moving goods across borders increase with distance from the
parent, while communication costs of transferring disembodied technology are higher in more
knowledge-intensive industries than in less knowledge-intensive industries.
According to this theory, it is harder to transfer technology in more knowledge-intensive
industries because technology is tacit and hard to codify, which means it is best conveyed face-
7
to-face.11 In the absence of in-person communication, the technology transfer may be more
imperfect the more knowledge-intensive the industry is. Multinational firms face a tradeoff
between trade costs and technology transfer costs, which explains why there is a gravity of
multinational sales, where affi liate sales fall with distance from the home country.
Since affi liate sales are positively related to productivity, this theory serves as a concep-
tual framework to explain what drives productivity differences across affi liate countries and
industries. Trade costs and technology transfer costs increase with distance to the U.S., which is
reflected in the lower productivity of affi liates. Furthermore, for a given distance from the U.S., a
more knowledge-intensive industry, on average, receives lower affi liate sales (lower productivity).
The theoretical framework suggests taking into account trade costs and technology transfer costs
in driving productivity differences across host countries and industries. The following section
discusses the empirical methodology.
3 Empirical Methodology
Based on the theoretical framework described above, the following estimation equation is em-
ployed:
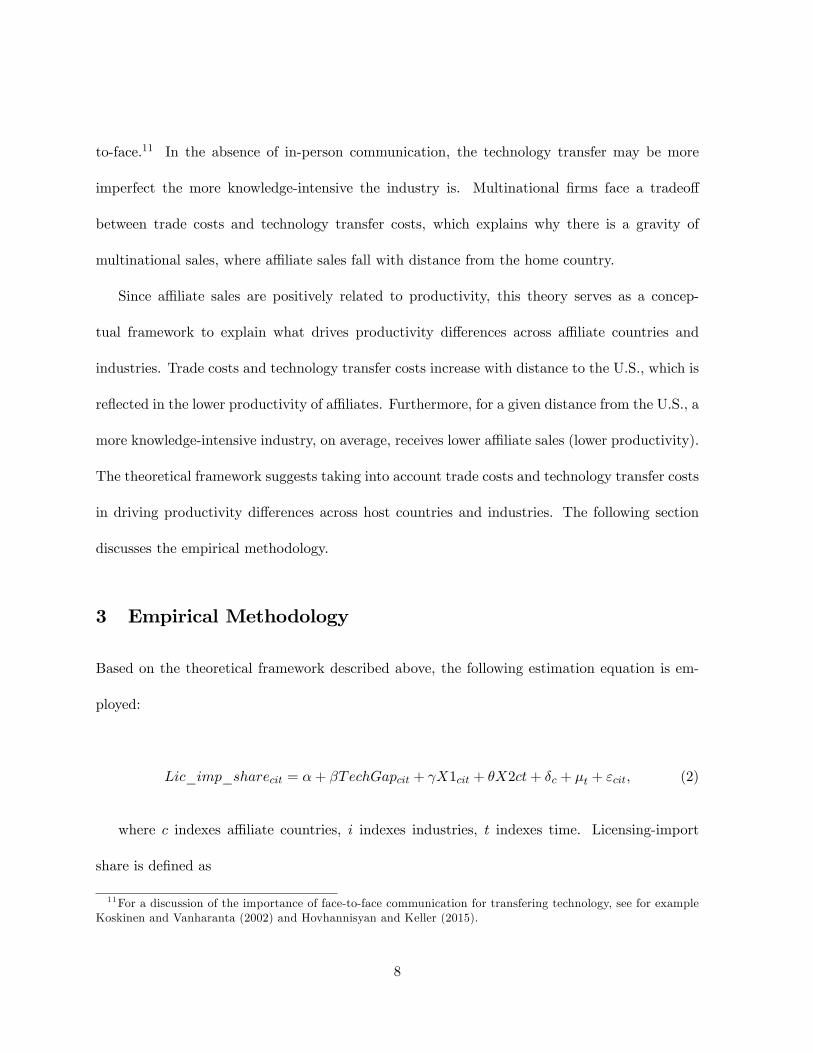
Lic_imp_sharecit = α+ βTechGapcit + γX1cit + θX2ct+ δc + µt + εcit, (2)
where c indexes affi liate countries, i indexes industries, t indexes time. Licensing-import
share is defined as
11For a discussion of the importance of face-to-face communication for transfering technology, see for exampleKoskinen and Vanharanta (2002) and Hovhannisyan and Keller (2015).
8

Lic_import_sharecit =Royalty_license_ receiptscit
Royalty_licence_receiptscit + Exports_goods_manufcit, (3)
where royalties and license receipts of the U.S. parents from the affi liates is a measure
of payments for the usage of disembodied technology, and U.S. exports of goods for further
manufacture from U.S. parents to affi liates is a measure of embodied technology in the form of
intermediate goods.
Technology gap is defined as
TechGapcit =ParentLabprodit − Labprodcit
ParentLabprodit(4)
where ParentLabprodit is parent labor productivity in an industry and year, and Labprodcit
is affi liate labor productivity in a country, industry and year.
Based on theory described above (Keller and Yeaple 2013), the productivity of affi liates falls
with distance from the United States due to increasing trade costs and technology transfer costs.
Furthermore, technology transfer in more knowledge-intensive industries is more costly than in
less knowledge-intensive industries. Thus, the labor productivity of affi liates is weighted by the
relative distance of the affi liate country from the U.S., as well as the relative knowledge-intensity
of the industry. The weighted labor productivity Labprodcit is constructed as
Labprodcit =1
Distc ×KIit× ˜Labprodcit (5)
9

where Distc is geographical distance between the U.S. and the affi liate country, KIit is
knowledge-intensity of an industry measured by parent R&D expenditures over sales (following
Keller and Yeaple 2013), and ˜Labprodcit is unweighted labor productivity of affi liates.
Turning to remaining variables of equation (2), X1 is a vector of control variables at the
country-industry-year level such as trade costs, X2 is a vector of control variables at the country-
year level such as R&D expenditures, population, GDP per capita, and human and physical
capital per worker, δc are country fixed effects, and µt are time fixed effects. It is expected that
the coeffi cient on β will be negative, implying that the smaller the technology gap of an affi liates
is (closer to frontier productivity), the more the affi liate will import technology directly (paying
royalties and license fees) relative to importing goods for further processing.12
It is important to mention that licensing-import share is bounded between 0 and 1 with
clusters of values at extreme points. We can employ a two-part Tobit model which is a widely
used estimation method for censored data. Greene (2004) shows that maximum likelihood
estimates of Tobit with fixed effects exhibit almost no bias, and incidental parameter problems
do not need special adjustment. An alternative to Tobit is fractional logit model, suggested by
Papke and Wooldridge (1996; 2008), where conditional mean is modeled as a logistic function.
Before turning to the empirical analysis and results, the next section gives an overview of the
data and descriptive statistics of the main variables.
12 In the robustness analysis, other measures of frontier will be employed as well.
10

4 Data
4.1 Main Variables
The primary data used in this paper are based on operations of U.S. MNCs abroad and come
from the United States Bureau of Economic Analysis (BEA). The data cover 45 countries where
U.S. multinationals have affi liates, span 7 NAICS manufacturing industries, and include 2 bench-
mark survey years (1999 and 2004). The manufacturing industries used in the analysis are food,
chemicals, primary and fabricated metals, machinery, computers and electronic products, elec-
trical equipment, appliances and components, and transportation equipment. The list of affi liate
countries used in the analysis is given in Appendix 1. The analysis is restricted to the benchmark
survey years because part of the data is available only in these surveys.13 Additionally, industry
classification has changed from SIC to NAICS, which prevents using earlier benchmark years.14
Licensing-Import Share is constructed using data on royalties and license fees received
by U.S. parents and on U.S. exports of goods shipped to majority-owned affi liates for further
processing. Royalties and license receipts, net of withholding taxes, received by U.S. parents
from its affi liates comes from the balance of payments and direct investment position data
in 1999 and 2004.15,16 Data on royalties and license receipts offer an appropriate measure of
13U.S. exports of goods for further manufacture, processing and assembly is only collected in benchmark surveyyears.14The other benchmark survey years are 1989, 1994 and 2009. The publicly available data from BEA by
country-industry are based on broadly defined industries. Due to a change in classification from SIC to NAICS, theComputers and Electronic Products manufacturing category was added, which would not allow direct comparisonacross industries with earlier benchmark years of 1989 and 1994. It is not possible to use 2009 benchmark surveybecause data on U.S. parents royalties and license fee receipts by industry was discontinued from 2006.15A more precise measure would be royalties and license receipts by U.S. parents from its majority-owned
foreign affi liates or payments to U.S. parents by its majority-owned foreign affi liates. Unfortunately, benchmarksurveys of 1999 and 2004 do not provide that type of detailed data broken down by country-industry. Overall,around 90% of royalties and license fee receipts by U.S. parents from foreign affi liates are from majority-ownedforeign affi liates.16Using data on royalties and license fees which are net of withholding taxes, tax policy differences across
11

direct technology as these receipts are for the use or sale of intangible property or rights such
as patents, industrial processes, trademarks, copyrights, franchises, manufacturing rights, and
other intangible assets or proprietary rights (U.S. Direct Investment Abroad: Final Results
from the 1999 Benchmark Survey, 2004).17 Overall, approximately 50% of royalties and license
fee payments from foreign affi liates to U.S. parents are for industrial processes which are most
closely related to the payments for the usage of disembodied technology.18
Royalty and license receipts reflect the value of technology transfer, which could reflect
changes in the volume of technology or changes in price. There are widely known diffi culties
with pricing and units of output of intangibles (Robbins 2009). Robbins notes that royalty
payments for licensing of industrial processes often consist of a lump-sum payment and a royalty
as a percentage of receipts.19 In terms of price, transfer pricing is such that under U.S. law
multinationals are required to charge the same price for intra-firm transactions on intangible
assets as for unrelated arm’s length transactions (Feenstra et al. 2010). Another diffi culty with
royalty and license receipts lies in the value of technology transfer that firms report, particularly
coming from different countries. Branstetter and coauthors argue that under U.S. tax codes and
the laws of foreign countries, there are restrictions on how U.S. multinationals make and value
royalty payments. Furthermore, U.S. multinationals charge the same royalties for affi liates in
different countries in order to avoid scrutiny from tax authorities (Branstetter et al. 2006).
affi liate countries should be mitigated.17See Howestine (2008) who describes various innovation-related data in the BEA international economic
surveys.18Data on royalties and license fees broken down by the type of intangible asset between affi liated parties is
available starting from 2006. On average in the period 2006-2009, U.S. parents’receipts of royalties and licensefees from affi liates included 50% of receipts for industrial processes, 30% for general use computer software, 15%for trademarks, and 5% for franchise fees, with the remainder to other categories.19Vishwasrao (2007) explores the factors determining the type of payments (up-front fees, royalties, or a com-
bination of both) for the technology transfer based on firm and industry characteristics for subsidiaries as well asfor unaffi liated firms.
12
Data on the U.S. exports of goods comes from 1999 and 2004 benchmark surveys and is
measured by the United States (either from the U.S. parent or another party) exports of goods
shipped to majority-owned affi liates for further processing, assembly, or manufacture.20,21 In
2004, exports for further processing from the U.S. parents to foreign affi liates were 60% of total
exports and 90% within the manufacturing industry (BEA).
Technology gap is constructed using data on the gross product and number of employees
of U.S. MNC parents and majority-owned foreign affi liates from the BEA. First, labor produc-
tivity of MNC parents is calculated as gross product (value added) divided by the number of
employees for a given industry and year. It is taken as the frontier for a given industry and
year. Then, labor productivity of majority-owned foreign affi liates is calculated as gross product
(value added) divided by the number of employees for a given country, industry and year.22 Fi-
nally, labor productivity of affi liates is weighted according to equation (5), where distance data
is obtained from CEPII and R&D data from the BEA. The technology gap of a given affi liate is
constructed as a relative difference from the frontier labor productivity (see equation 4). In this
form, differences in productivity across industries are controlled for, and the identification of
technology gap comes from variation across affi liate countries and years in a given manufacturing
industry.
20Although the U.S. exports of goods for further manufacture includes goods shipped from the U.S. parents orother U.S. entities, overall around 85% of imports by affi liates from the United States is from the U.S. parents.21Because of non-disclosure and confidentiality, the BEA does not provide small portion of data for royalties
and license fees and for U.S. exports of goods for further manufacture broken down by country and industry.Data given in a range [-$500,000; $500,000] is coded as $500,000; data is filled in with the same number forobservations where country-industry data is available for one year and missing for another (11% for exports, and3% for royalties).22Due to confidentiality, a small portion of employment figures is given in ranges; in those cases, the midpoint
of the range is taken.
13

4.2 Controls
Although the empirical analysis controls for country and year fixed effects, there may still be
differences across host country affi liates over time, and across industries. One of the most
important factors that will impact licensing-import share is trade costs, as it is costly to transfer
goods across borders. Following the methodology of Hanson and colleagues (2005) and Keller
and Yeaple (2013), ad-valorem trade costs at country-industry-year level are constructed as a
sum of freight costs and tariffs:
τ cit = 1 + freightcit + tariffcit, (6)
Freight costs are calculated as the ratio of import charges over customs value of imports.23
Tariffs are obtained from the TRAINS database using WITS software of the World Bank.24
Research & Development expenditures (R&D) are considered an important determinant of
technology transfer. To control for differences in country-level R&D, R&D expenditures as a
percentage of GDP are employed from World Development Indicators.25 Differences in R&D
intensity across industries are captured in the analysis since labor productivity is weighted by
the industry knowledge intensity, U.S. parent R&D expenditures/sales (see equation 5). Data
on R&D expenditures of affi liates is not used in the analysis because of endogeneity concerns.
There are vast differences across affi liate countries in the level of development, size, factor
23Using highly disaggregated data on U.S. imports in HS classification from www.internationaldata.org for 1999and 2004, freight cost value is calculated as import charges (freight, insurance and other charges) over customsvalue of imports. To aggregate these figures to BEA industry classification, freight cost value is weighted by therelative importance of a given HS code in BEA code based on U.S. exports to that country.24Weighted tariffs in 4-digit SIC classification are extracted from WITS software of the World Bank and matched
to BEA classification.25For the year where R&D expenditures were missing, data for a given country were linearly interpolated.
14
endowments and other economic factors that might drive differences in U.S. FDI. To control
for host country’s development level and size, population and GDP per capita are obtained
from Penn World Tables (PWT 6.3). Intellectual Property Rights Protection (IPR) in affi liate
countries might also be an important determinant for the transfer of technology from the U.S.
parent to affi liate.26 The IPR protection index is obtained from Park (2008). Physical capital per
worker is constructed using capital and employment data from Penn World Tables 8.0 (Feenstra
et al. 2015). Human capital per worker is proxied by human capital index available from Penn
World Tables 8.0 (Feenstra et al. 2015), which is based on (Barro and Lee 2010) Educational
Attainment Dataset.27
4.3 Descriptive Statistics
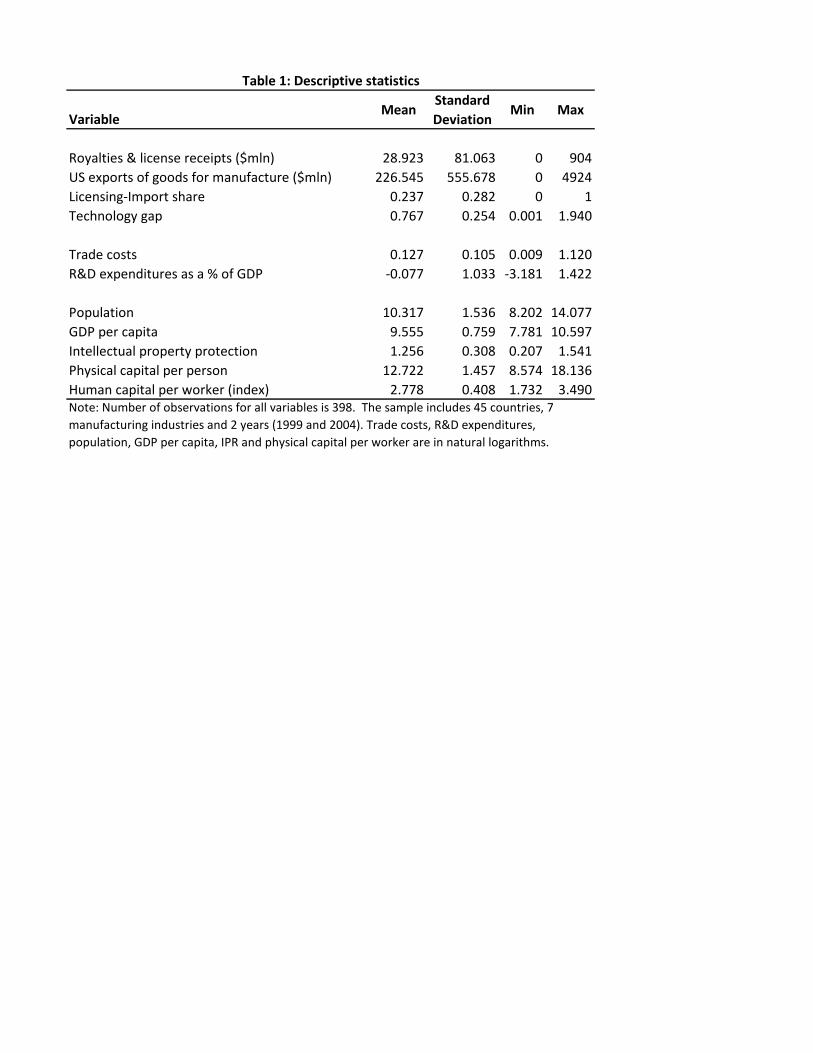
The final sample is an unbalanced panel of 45 countries, 7 manufacturing industries, and 2 years
(1999 and 2004). Summary statistics of the main variables are presented in Table 1.28 On aver-
age, exports of goods for further manufacture is around 8 times larger than royalties and license
receipts.29 Both royalties and license fees and exports of goods for further processing are quite
dispersed with a large standard deviation. Licensing-import share, representing a technological
measure of preference between imports of goods versus technology, is bounded between 0 and 1
by construction, with the smaller values representing a preference towards importing of inter-
26Branstetter et al. (2006) find connection between stronger IPR and increased technology transfer withinmultinational corporations.27 In addition, there might be location-based differences and interdependencies in knowledge acquisition across
affi liate countries (see e.g. Leonardi 2010), which are mitigated by including country fixed effects.28 In this analysis, I focus on positive numbers of technology gap, as my analysis does not apply to the case when
weighted labor productivity of affi liates is larger than parent labor productivity. Since weighted labor productivityis based on distance, Canada is a large outlier which is dropped from the analysis.29Feenstra et al. (2010) discuss various reasons for mismeasurement of international trade in ideas. Particularly,
they note that the values of receipts from sales of intangible assets are relatively small because of possibleunderreporting of affi liates and/or high threshold values for mandatory reports.
15

mediates and the larger values preference towards licensing the technology. Figure 1 presents a
histogram of licensing-import share which shows that around 30% of observations are close to
zero, with 16% of values being strictly zero and 2% of values being 1.30
The empirical strategy controls for country and year fixed effects, so general differences across
affi liate countries and across years are controlled. Additionally, since labor productivities differ
across industries, technology gap compares labor productivities within the same industry-year.
The next section presents the empirical results.
5 Results
The goal of the empirical analysis is to estimate a relationship between the technology gap of U.S.
multinationals foreign affi liates and licensing-import share: import of technology versus import
of goods. Table 2 presents initial estimation results of the equation (2) using Ordinary Least
Squares (OLS). All columns include country and year fixed effects, while in column 6 industry
fixed effects are added as well. Robust standard errors, which allow for clustering by country-
year, are shown in parentheses.31 Column 1 shows that there is a strong negative correlation
between affi liates’technology gap and their licensing-import share: within an industry, foreign
affi liates with a large technology gap from parents import relatively less technology in the form
of blueprints and designs and more in the form of intermediate goods.
The addition of trade costs in column 2 decreases the coeffi cient of technology gap only
30Around 16% of royalties and license fees are zero, and around 2% of U.S. exports of goods for manufactureare zero, which by construction results in 16% of zero values and 2% of values of one in licensing-import sharevariable.31Clustering by country-year is performed because some control variables do not vary by industry (e.g. IPR
protection index), while both licensing-import share and technology gap vary by industry.
16

slightly from −0.179 to −0.154 while it remains highly significant at 5 percent. As expected,
trade costs are estimated to be positive and significant, showing that import of goods is nega-
tively related to trade barriers, resulting in a larger licensing-import share. In column 3 R&D
expenditures as a percentage of GDP are added. The coeffi cient on R&D is positive and signifi-
cant, meaning that affi liate countries with high R&D are licensing more disembodied technology
rather than technology embodied in intermediate goods, which is what one would expect.
Additional country-year level controls are added in column 4. The coeffi cient on population
is negative and significant, while GDP per capita has a positive effect on licensing-import share
but it is not significant. The negative coeffi cient on population might imply that affi liates in
countries with larger size receive a larger fraction of goods for further manufacture, assembly
and processing. In column 5, IPR protection index and endowments of human and physical
capital are added. As expected, IPR protection index is estimated to be positive and significant,
implying that countries with strong protection of intellectual property receive more technology
in the form of blueprints relative to intermediate goods. The coeffi cients on physical and human
capital per worker are not significantly estimated. With the inclusion of all control variables,
the coeffi cient of technology gap is around −0.15.
What is the magnitude of the estimated coeffi cient? The mean of licensing-import share is
0.24, while the mean of technology gap is 0.77 (see Table 1). Based on the estimated coeffi cient,
this means that at the mean a 10% increase in the technology gap of a U.S. MNC affi liate, com-
pared to the parent in the same industry, decreases the share of licensing versus importing inputs
embodying the technology by 5%.32 The magnitude of the estimated coeffi cient is economically
32At the mean, the regression is [0.24 = −0.15 ∗ 0.77], thus a 10% increase in the right hand side is 0.0115,which lowers the licensing-import share by 0.0115/0.24 = 5%
17

sizeable.
To mitigate across-industry differences in technology gap and licensing-import share, indus-
try fixed effects are added in column 6. The technology gap is still negative and significant at
10%, while the magnitude of the coeffi cient decreases only slightly from around −0.15 to around
−0.13. However, trade costs, R&D expenditures and IPR protection cease to be significant.
Overall, the results from table 2 indicate that there is a significant effect of technology gap on
licensing-import share.
Although the OLS results reported in Table 2 provide important benchmark estimates, ad-
ditional econometric models are estimated in Table 3. For convenience, column 1 repeats the
OLS regression presented in Table 2 (column 5), while other econometric specifications are pre-
sented in columns 2 to 7. As mentioned previously, the dependent variable is a share with
values strictly between 0 and 1 and around 16 percent of zeroes. The possible reason for the
existence of zeroes is that data on both royalties and license receipts and exports of goods for
further manufacture are recorded only when a certain threshold is passed. Therefore, equation
1 is estimated as a two-way censored Tobit model in column 2. Column 2 shows that technology
gap has a negative and significant effect on licensing-import share, however the magnitudes of
the estimates are not directly comparable with OLS. To compare OLS estimates with Tobit, in
column 3, marginal effects at the mean of two-way censored Tobit model are presented. The
coeffi cient on technology gap at the mean is -0.137 compared to -0.146 with OLS. In columns
(4) and (5) Tobit and Tobit with marignal effects are estimated with the addition of industry
fixed effects. The coeffi cient estimates are very close to OLS with industry fixed effects (table
2, column 6). As an alternative to Tobit model, the fractional logit estimates, which model
18

conditional mean as a logistic function, are presented in column 6 and 7. In the fractional logit
model as well, the coeffi cient on technology gap , -0.117, is close to OLS. On the whole, in all
alternative econometric specifications, the technology gap variable is estimated negative and
highly significant.
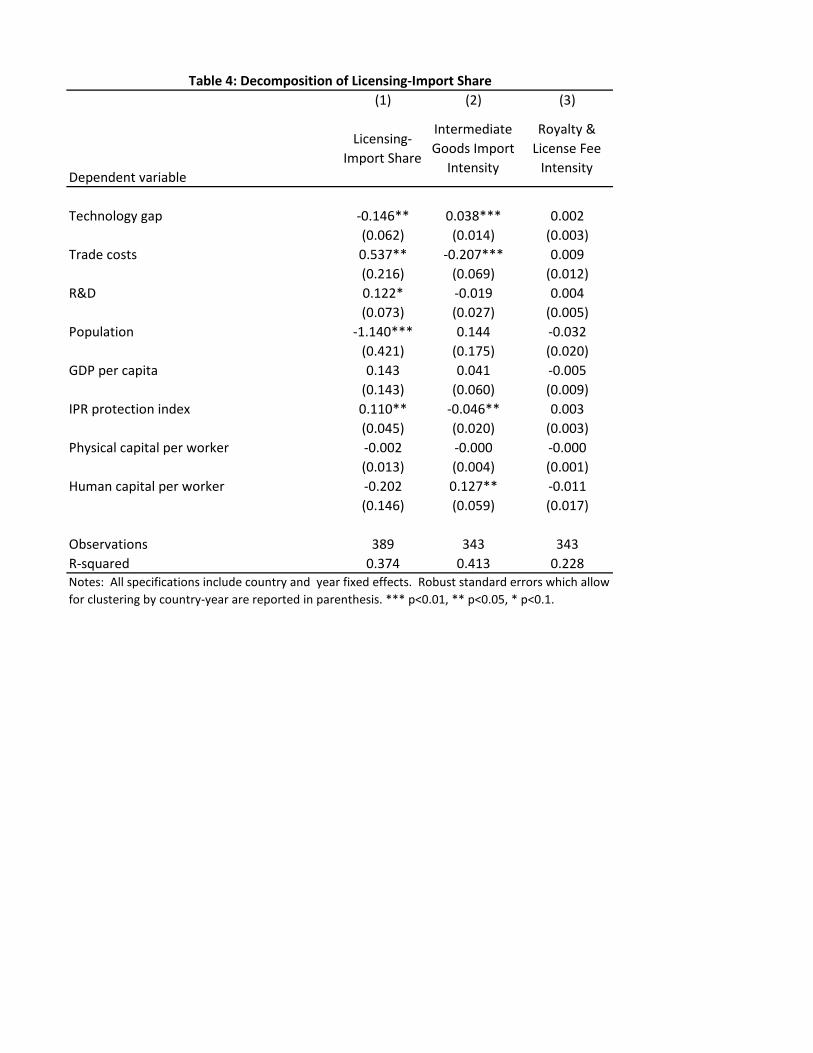
Licensing-import share is constructed by combining data on embodied and disembodied
technological transfer. To understand the differences between these two types of technology
transfer, decomposition of the dependent variable is performed in Table 4. For convenience,
column 1 of Table 4 repeats the benchmark estimates of Table 2 (column 5) with licensing-
import share as the dependent variable. In column 2, the dependent variable is intermediate
goods import intensity, constructed as U.S. exports of goods for further manufacture divided
by affi liate sales. As expected, the coeffi cient on technology gap is estimated to be positive
and significant, implying that affi liates with a large technology gap on average import more
intermediate goods. Additionally, the coeffi cient on trade costs is negative and significant,
meaning that trade costs decrease intermediate goods import intensity consistent with previous
literature. Turning to column 3, where the dependent variable is disembodied technology transfer
intensity (royalty and license fees divided by affi liate sales), the coeffi cient is almost zero and
not significant. One would expect the coeffi cient on disembodied technology transfer intensity
to be negative. However, the fact that technology gap in this case is not significantly estimated
probably has to do with small values of royalty and license fees and data limitations.
19

5.1 Robustness
The technology gap of affi liates is constructed using parent productivity as the frontier and
is based on weighted labor productivity of affi liates (see equations 4 and 5). Table 5 presents
results using alternative measures of technology gap. Column 1 repeats the benchmark estimates
of Table 2 (column 5) for convenience. Recall that labor productivity is weighted by the relative
distance of affi liate country and relative knowledge intensity of an industry (see equation 5). In
column 2, technology gap is constructed based on unweighted labor productivity. The coeffi cient
on technology gap is still negative and significant, however the magnitude of the coeffi cient
decreases from −0.150 to −0.092. The weighted coeffi cient is larger, which shows that it is
important to account for differences in proximity of affi liates of U.S. parents to home, as well as
the knowledge-intensity of an industry.
Another feasible option for defining technology gap involves using a different frontier measure.
To test the robustness of using parent productivity as a frontier, we can define the frontier as
the most productive affi liate in the same industry and year, as it is possible that parents and
affi liates perform different tasks. Then, the technology gap of a given affi liate is defined as
a relative difference from the most productive affi liate in the same industry and year. It is
important to note that in all cases, the frontier affi liate comes from a high-income country
affi liate. The results of this exercise are reported in column 3 of Table 5. Using affi liate frontier,
the coeffi cient on technology gap is estimated to be negative and significant and very close to
the benchmark estimate of −0.146. Additionally, the signs and estimates of the controls are
very similar to the benchmark estimates.
As an additional robustness check, technology gap is constructed based on frontier being
20
U.S. labor productivity using data from United Nations Industrial Statistics Database. Data on
U.S. value added and employment by 3 and 4 digit Standard Industrial Classification (SIC) is
obtained from INDSTAT4 database and matched to BEA industries. Then technology gap is
constructed as weighted labor productivity differences of U.S. multinational affi liates from U.S.
labor productivity. Using U.S. labor productivity in a given industry and year as a frontier
instead of U.S. multinational parent labor productivity should eliminate potential endogeneity
of the latter. The results of this exercise are presented in column 4 of table 5. The coeffi cient on
technology gap is almost identical to the benchmark (−0.149 compared to benchmark −0.146)
and is highly statistically significant. The coeffi cients and magnitudes of the control variables are
also very similar. Overall, this table shows that the main results of this paper are not sensitive
to the definition of frontier used in the construction of technology gap. In all 3 cases, technology
gap is negatively associated with licensing-import share.
It is possible to argue that if U.S. affi liates have access to more disembodied technology
(ideas), they can become more productive over time. To address the possibility of reverse
causality, Table 6 performs a number of robustness checks by including lagged technology gap
as well as lagged R&D. For convenience column 1 repeats the benchmark estimates of Table 2
(column 5). Because of industrial classification changes from SIC to NAICS in 1998, it is not
possible to lag technology gap for 7 broadly defined manufacturing industries. Therefore, in
column 2 technology gap value of 2004 is used for 1999 reducing the number of observations to
184. The coeffi cient on technology lag is still negative and highly significant, while the coeffi cient
on 5 year lagged technology gap is almost zero and not significantly estimated.
To control for prior technological gap, in column 3 two year lagged technology gap is added.
21

The latter is constructed using U.S. labor productivity as the frontier in a given industry-year and
proxying affi liates’productivity by a given country’s industry-year labor productivity (data from
United Nations INDSTAT4 database). The coeffi cient on technology gap is still negative and
significantly estimated (−0.138 compared to benchmark −0.146), while the lagged technology
gap is positive but not significant. To control for the past innovation effect, 3 year lagged R&D
expenditures are included in column 4. The estimate on technology gap is still negative and
significant, while the coeffi cient on lagged R&D is not significantly estimated.
To test whether including lagged technology gap is sensitive to the definition of the frontier,
columns 5-7 use technology gap with frontier being U.S. labor productivity from United Nations
INDSTAT4 data. Column 5 estimates are from table 5 column 4, while columns 6 and 7 include
three and five year lagged technology gap respectively with frontier being the maximum labor
productivity in a given industry-year from United Nations INDSTAT4 data. The coeffi cients
on technology gap in columns 6 and 7 are very close to the benchmark estimates, but lagged
variables are not significantly estimated. Overall, this table suggets that results are not driven
by past technology gap or past innovation.
A number of additional robustness checks have been conducted (see table 7). In column 2
interaction of trade costs with R&D is included to address the possibility of differential effect of
trade costs and R&D. The coeffi cient on interaction is not significant, while the coeffi cient on
technology gap decreases slightly from −0.146 to −0.139 but remains significant. One might also
argue that type of FDI matters for embodied versus disembodied technology transfer. If FDI is
horizontal and market entry is the primary goal, affi liates might be replicating U.S. production
abroad, so we would expect royalties to be higher. In the case of vertical FDI however, the
22

main goal is further processing and assembly, so we would expect exports of goods for further
processing to be higher. To test this hypothesis, the fraction of local affi liate sales to all affi liate
sales for each country and year is calculated from BEA benchmark surveys. The results are
shown in column 3. The results on technology gap are unchanged, while the coeffi cient on local
to all sales is negative and significant suggesting that countries that sell more locally import
more intermediate inputs than technology in disembodied form. This result is contrary to what
we would expect but might be driven from the aggregated country-level nature of sales.
The next section offers concluding remarks.
6 Conclusions
Multinational corporations are the main mediators of the worldwide increase in technology trade.
Intermediate inputs and know-how are the two forms of technology (tangible and intangible)
transferred within multinational corporations that this paper has examined. This paper analyzed
what determines the decision of multinationals on the form of technology transfer to its affi liates,
using data on U.S. multinational activity in 45 countries, 7 manufacturing industries and 2 years.
Detailed data on exports of goods for further processing, as well as royalties and license payments
observed between U.S. MNC parents and their affi liates, enables us to specifically identify two
types of knowledge transfer from parents to affi liates.
The main finding of this paper is that the technology gap, measured as the relative labor
productivity difference from the frontier, is negatively related to the share of direct versus indirect
transfer of knowledge from U.S. parents to affi liates. Relatively more productive affi liates get
technology in the form of know-how, industrial processes, etc., while relatively less productive
23

affi liates receive technology in the form of intermediate inputs. The magnitude of the effect is
sizeable: a 10 percent increase in the technology gap of affi liates decreases the share of licensing
versus importing inputs by 5 percent, on average. These results suggest that productivity of
affi liates is an important determinant for knowledge transfer within multinational corporations.
The transfer of technology is central to modern economics because of its implications for long-
term cross-country income, economic growth and convergence of countries. Access to knowledge
and know-how are obtained by MNC affi liates from their parents, as well as via spillovers from
those affi liates to domestic firms. Regardless of how such knowledge is gathered, it amounts to
an avenue for innovation and income growth. Based on the results mentioned above, this study
points to policy implications for countries to raise their productivity levels. Taking into account
that the presence of MNC affi liates and the performance of those affi liates are contributing
factors to the productivity levels of a country, policymakers should also think about creating
more appealing atmosphere for MNCs, including such factors as favorable entry criteria and tax
implications.
While this paper provides initial evidence on the relationship between the technology gap and
the mode of technology transfer in multinational corporations, there are important extensions
that should be considered in future work. First, obtaining firm-level or more disaggregated
industry data will enable the examination of this question without potential aggregation bias.
Second, it would be interesting to add a direct measure of technology, and explicitly model the
process of innovation in the framework of technology transfer. Third, it would be useful to
extend this analysis to other samples to see if the results continue to hold. A promising avenue
involves the use of data on Swedish multinationals. Fourth, it would be interesting to analyze
24
the type of technology transfer and its dynamic impact on economic growth. Finally, there are
important questions on whether the type of FDI matters for the mode of technology transfer.
25
References
Alfaro, L., and Charlton, A. 2009, "Intra-Industry Foreign Direct Investment", American Eco-
nomic Review, vol. 99, no. 5, pp. 2096-2119.
Atalay, E., Hortaçsu, A. and Syverson, C. 2014, "Vertical Integration and Input Flows", Amer-
ican Economic Review, vol. 104, no. 4, pp. 1120-48.
Awokuse, T.O., Maskus, K.E. and An, Y. 2012, "Knowledge Capital, International Trade, and
Foreign Direct Investment: a Sectoral Analysis”, Economic Inquiry, vol. 50, no. 3, pp. 707-723.
Barro, R.J. and Lee, J.W. 2010, "A New Data Set of Educational Attainment in the World,
1950—2010".
Bergstrand, J.H. and Egger, P. 2007, "A Knowledge-and-Physical-Capital Model of Interna-
tional Trade Flows, Foreign Direct Investment, and Multinational Enterprises", Journal of
International Economics, vol. 73, no. 2, pp. 278-308.
Björn, J., Johannes, S. and Ingmar, K. 2005, "Industry Level Technology Gaps and Comple-
mentary Knowledge Stocks as Determinants of Intra-MNC Knowledge Flows", Journal of
Economics and Business, vol. 8, no. 1&2, pp. 137-156.
Brainard, S.L. 1997, "An Empirical Assessment of the Proximity-Concentration Tradeoff be-
tween Multinational Sales and Trade", American Economic Review, vol. 87, no. 4, pp. 520-
544.
26

Branstetter, L.G., Fisman, R. and Foley, C.F. 2006, "Do Stronger Intellectual Property Rights
Increase International Technology Transfer? Empirical Evidence from U. S. Firm-Level Panel
Data", Quarterly Journal of Economics, vol. 121, no. 1, pp. 321-349.
Carr, D., Markusen, J. and Maskus, K.E. 2001 "Estimating the Knowledge-Capital Model of
the Multinational Enterprise", American Economic Review, vol. 91, no. 3, pp. 693-708.
Cho, J. "Intangible Capital Transfer within Multinationals", mimeo, 2015.
Driffi eld, N., Love, J.H. and Menghinello, S. 2010, "The Multinational Enterprise as a Source
of International Knowledge Flows: Direct Evidence from Italy", Journal of International
Business Studies, vol. 41, no. 2, pp. 350-359.
Ekholm, K., Forslid, R. and Markusen, J.R. 2007, "Export-Platform Foreign Direct Investment",
Journal of the European Economic Association, MIT Press, vol. 5, no. 4, pp. 776-795
Feenstra, R.C., Lipsey, R.E., Branstetter, L.G., Foley, C.F., Harrigan, J., Jensen, J.B., Kletzer,
L., Mann, C., Schott, P.K. and Wright, G.C. 2010, "Report on the State of Available Data for
the Study of International Trade and Foreign Direct Investment", Working Paper No. 16254
, National Bureau of Economic Research.
Feenstra, R.C., Inklaar, R. and Timmer, M.P. 2015, "The Next Generation of the Penn World
Table", American Economic Review, forthcoming.
Fouquin, M., Nayman, L. and Wagner, L. 2007, “Vertical Production Networks: Evidence from
France”. Economics Discussion Papers, No 2007-18.
27

Greene, W. 2004, "Fixed Effects and Bias due to the Incidental Parameters Problem in the
Tobit Model", Econometric Reviews, No. 2, pp. 125-148.
Gupta, A. and Govindarajan, V. 2000, "Knowledge Flows within MNCs", Strategic Management
Journal, vol. 21, no. 4, pp. 473—496.
Hanson, G.H., Mataloni Jr, R.J. and Slaughter, M.J. 2005, "Vertical Production Networks in
Multinational Firms", Review of Economics and Statistics, vol. 87, no. 4, pp. 664-678.
Helpman, E. 1984, "A Simple Theory of International Trade with Multinational Corporations",
Journal of Political Economy, pp. 451-471.
Helpman, E., Melitz, M.J. and Yeaple, S.R. 2004, "Export versus FDI with Heterogeneous
Firms", American Economic Review, vol. 94, no. 1, pp. 300-316.
Hovhannisyan, N. and Keller, W. 2015, “International Business Travel: An Engine of Innova-
tion?”, Journal of Economic Growth, vol. 20, no. 1, pp. 75-104
Howenstine, N. 2008, "Innovation-Related Data in Bureau of Economic Analysis International
Economic Surveys", The Journal of Technology Transfer, vol. 33, no. 2, pp. 141-152.
Keller, W. 2010, "International Trade, Foreign Direct Investment, and Technology Spillovers",
In Hall, B. and Rosenberg, N. eds., Handbook of the Economics of Innovation, vol. 2, Elsevier,
North-Holland.
Keller, W. and Yeaple, S.R. 2008, "Global Production and Trade in the Knowledge Economy",
Working Paper No. 14626, National Bureau of Economic Research.
28

Keller, W. and Yeaple, S.R. 2013, "The Gravity of Knowledge", American Economic Review,
vol. 103, no. 4, pp. 1414-44.
Koskinen, K.U. and Vanharanta, H. 2002, "The Role of Tacit Knowledge in Innovation Processes
of Small Technology Companies", International Journal of Production Economics, vol. 80, no.
1, pp. 57-64.
Leonardi, P. 2010. "Information, Technology, and Knowledge Sharing in Global Organizations:
Cultural Differences in Perceptions of where Knowledge Lies". In Canary H.E. and McPhee
R.D. eds., Communication and Organizational Knowledge: Contemporary Issues for Theory
and Practice. New York: Routledge.
Markusen, J.R. 1984, "Multinationals, Multi-Plant Economies, and the Gains from Trade",
Journal of International Economics, vol. 16, no. 3-4, pp. 205-226.
Martin, X. and Salomon, R. 2003, "Knowledge Transfer Capacity and its Implications for the
Theory of the Multinational Corporation", Journal of International Business Studies, vol. 34,
no. 4, pp. 356-373.
Miroudot, S., Lanz, R. and Ragoussis, A. 2009, "Trade in Intermediate Goods and Services",
OECD Trade Policy Working Papers.
Papke, L.E. and Wooldridge, J.M. 1996, “Econometric Methods for Fractional Response Vari-
ables with an Application to 401 (k) Plan Participation Rates", Journal of Applied Econo-
metrics, vol. 11, pp. 619—632.
29
Papke, L.E. and Wooldridge, J.M. 2008, "Panel Data Methods for Fractional Response Variables
with an Application to Test Pass Rates", Journal of Econometrics, vol. 145, no. 1-2, pp. 121-
133.
Park, W.G. 2008, "International Patent Protection: 1960-2005", Research Policy, vol. 37, no. 4,
pp. 761-766.
Ramondo, N., Rappoport, V. and Ruhl, K, "Intra-firm Trade and Vertical Fragmentation in
U.S. Multinational Corporations", mimeo, 2015.
Robbins, C.A. 2009, "Measuring Payments for the Supply and Use of Intellectual Property". In
Reinsdorf, M.B. and Slaughter, M.J. eds., International Trade in Services and Intangibles in
the Era of Globalization, Chicago: University of Chicago Press.
Takahashi, D. 2010a, "Intel Opens $2.5B Chip Factory in China", Venture Beat, Retrieved from
http://venturebeat.com/2010/10/26/intel-opens-2-5b-chip-factory-in-china/ January 2012
Takahashi, D. 2010b, "Intel Opens $1B Chip Assembly Factory in Vietnam", Venture Beat,
Retrieved from http://venturebeat.com/2010/10/29/intel-opens-a-1b-chip-assembly-factory-
in-vietnam/ January 2012
Vishwasrao, S. 2007, "Royalties vs. Fees: How Do Firms Pay for Foreign Technology?", Inter-
national Journal of Industrial Organization, vol. 25, no. 4, pp. 741-759.
U.S. Bureau of Economic Analysis. 2004. U.S. Direct Investment Abroad: Final Results from
the 1999 Benchmark Survey. Washington, DC: U.S. Government Printing Offi ce
30
VariableMean
Standard Deviation
Min Max
Royalties & license receipts ($mln) 28.923 81.063 0 904US exports of goods for manufacture ($mln) 226.545 555.678 0 4924Licensing-Import share 0.237 0.282 0 1Technology gap 0.767 0.254 0.001 1.940
Trade costs 0.127 0.105 0.009 1.120R&D expenditures as a % of GDP -0.077 1.033 -3.181 1.422
Population 10.317 1.536 8.202 14.077GDP per capita 9.555 0.759 7.781 10.597Intellectual property protection 1.256 0.308 0.207 1.541Physical capital per person 12.722 1.457 8.574 18.136Human capital per worker (index) 2.778 0.408 1.732 3.490
Table 1: Descriptive statistics
Note: Number of observations for all variables is 398. The sample includes 45 countries, 7 manufacturing industries and 2 years (1999 and 2004). Trade costs, R&D expenditures, population, GDP per capita, IPR and physical capital per worker are in natural logarithms.

Figure 1: Distribution of Licensing-Import Share
010
2030
Perc
ent
0 .2 .4 .6 .8 1Licensing-Import Share

(1) (2) (3) (4) (5) (6)Dependent variable
Technology gap -0.179** -0.154** -0.152** -0.145** -0.146** -0.133*(0.069) (0.062) (0.062) (0.061) (0.062) (0.078)
Trade costs 0.448** 0.494** 0.532** 0.537** 0.004(0.200) (0.202) (0.212) (0.216) (0.223)
R&D 0.149** 0.124* 0.122* 0.026(0.060) (0.073) (0.073) (0.072)
Population -1.068*** -1.140*** -0.681*(0.403) (0.421) (0.404)
GDP per capita 0.130 0.143 0.267*(0.152) (0.143) (0.136)
IPR protection index 0.097** 0.110** 0.016(0.046) (0.045) (0.052)
Physical capital per worker -0.002 0.005(0.013) (0.013)
Human capital per worker -0.202 -0.096(0.146) (0.136)
Industry fixed effects No No No No No Yes
Observations 389 389 389 389 389 389R-squared 0.354 0.367 0.369 0.374 0.374 0.436Notes: All specifications include country and year fixed effects. Robust standard errors which allow for clustering by country-year are reported in parenthesis. *** p<0.01, ** p<0.05, * p<0.1.
Licensing-Import Share
Table 2: Benchmark Regression

OLS TobitTobit-
Marginal Effects
TobitTobit-
Marginal Effects
Fractional Logit
Fractional Logit-
Marginal Effects
(1) (2) (3) (4) (5) (6) (7)Dependent variable
Technology gap -0.146** -0.178** -0.137** -0.175* -0.135* -0.943** -0.117**(0.062) (0.071) (0.055) (0.101) (0.078) (0.375) (0.046)
Trade costs 0.537** 0.617** 0.078** 0.022 0.003 3.189** 0.065**(0.216) (0.247) (0.031) (0.247) (0.031) (1.358) (0.028)
R&D 0.122* 0.198** -0.015** 0.091 -0.007 0.450 -0.006(0.073) (0.087) (0.007) (0.085) (0.007) (0.436) (0.005)
Population -1.140*** -1.323*** -13.646*** -0.786* -8.114* -5.169** -8.618**(0.421) (0.504) (5.204) (0.467) (4.821) (2.202) (3.674)
GDP per capita 0.143 0.175 1.668 0.310* 2.961* 1.106 1.707(0.143) (0.181) (1.727) (0.166) (1.583) (0.773) (1.194)
IPR protection index 0.110** 0.098* 0.123* -0.009 -0.012 0.661* 0.134*(0.045) (0.053) (0.066) (0.057) (0.072) (0.387) (0.079)
Physical capital per worker -0.002 -0.021 -0.272 -0.015 -0.187 -0.008 -0.016(0.013) (0.017) (0.215) (0.017) (0.211) (0.083) (0.170)
Human capital per worker -0.202 -0.179 -0.497 -0.066 -0.183 -0.904 -0.406(0.146) (0.179) (0.496) (0.166) (0.460) (0.875) (0.393)
Industry fixed effects X X
Observations 389 389 389 389 389 389 389R-squared 0.374
Licensing-Import Share
Notes: All specifications include country and year fixed effects. Robust standard errors which allow for clustering by country-year are reported in parenthesis. *** p<0.01, ** p<0.05, * p<0.1.
Table 3: Various Econometric Specifications
(1) (2) (3)
Dependent variable
Licensing-Import Share
Intermediate Goods Import
Intensity
Royalty & License Fee
Intensity
Technology gap -0.146** 0.038*** 0.002(0.062) (0.014) (0.003)
Trade costs 0.537** -0.207*** 0.009(0.216) (0.069) (0.012)
R&D 0.122* -0.019 0.004(0.073) (0.027) (0.005)
Population -1.140*** 0.144 -0.032(0.421) (0.175) (0.020)
GDP per capita 0.143 0.041 -0.005(0.143) (0.060) (0.009)
IPR protection index 0.110** -0.046** 0.003(0.045) (0.020) (0.003)
Physical capital per worker -0.002 -0.000 -0.000(0.013) (0.004) (0.001)
Human capital per worker -0.202 0.127** -0.011(0.146) (0.059) (0.017)
Observations 389 343 343R-squared 0.374 0.413 0.228
Table 4: Decomposition of Licensing-Import Share
Notes: All specifications include country and year fixed effects. Robust standard errors which allow for clustering by country-year are reported in parenthesis. *** p<0.01, ** p<0.05, * p<0.1.

(1) (2) (3) (4)Dependent variable
Technology gap (weighted) -0.146**(0.062)
Technology gap (unweighted) -0.092**(0.042)
Technology gap (affiliate frontier) -0.146**(0.070)
Technology gap (weighted, frontier US labor productivity) -0.149***(0.056)
Trade costs 0.537** 0.647*** 0.871*** 0.569***(0.216) (0.242) (0.240) (0.209)
R&D 0.122* 0.143* 0.126 0.097(0.073) (0.082) (0.086) (0.068)
Population -1.140*** -1.363*** -1.171** -1.058**(0.421) (0.471) (0.505) (0.409)
GDP per capita 0.143 0.113 0.183 0.188(0.143) (0.158) (0.164) (0.152)
IPR protection index 0.110** 0.141*** 0.134** 0.118**(0.045) (0.052) (0.056) (0.055)
Physical capital per worker -0.002 0.004 0.003 -0.004(0.013) (0.013) (0.012) (0.013)
Human capital per worker -0.202 -0.237 -0.138 -0.156(0.146) (0.144) (0.117) (0.142)
Observations 389 389 464 408R-squared 0.374 0.371 0.325 0.368
Table 5: Robustness-Alternative Measures of Technology Gap
Licensing-Import Share
Notes: All specifications include country and year fixed effects. Technology gap (weighted) is constructed using US MNC parent productivity in the same industry-year as the frontier and weighted labor productivity of affiliates. Technology gap (unweighted) is constructed using US MNC parent productivity in the same industry-year as the frontier and unweighted labor productivity of affiliates. Technology gap (affiliate frontier) is constructed using the most productive affiliate in the same industry-year and labor productivity of affiliates. Technology gap (weighted, frontier US labor productivity) is constructed using US labor productivity in the same industry-year as a frontier and weighted labor productivity of affiliates. Robust standard errors which allow for clustering by country-year are reported in parenthesis. *** p<0.01, ** p<0.05, * p<0.1.

(1) (2) (3) (4) (5) (6) (7)Dependent variable
Technology gap (frontier-US parent labor productivity) -0.146** -0.223*** -0.138* -0.149**(0.062) (0.077) (0.070) (0.062)
Technology gap (frontier-US labor productivity) -0.149*** -0.149** -0.145*(0.056) (0.065) (0.075)
Trade costs 0.537** 0.869** 0.490* 0.533** 0.569*** 0.596* 0.554(0.216) (0.370) (0.286) (0.216) (0.209) (0.340) (0.377)
R&D 0.122* -0.085 -0.010 0.175** 0.097 0.131 0.243(0.073) (0.099) (0.131) (0.087) (0.068) (0.177) (0.157)
Population -1.140*** 0.041 -0.810 -1.132** -1.058** -0.603 -1.292**(0.421) (0.064) (0.632) (0.431) (0.409) (0.617) (0.525)
GDP per capita 0.143 -0.105 0.527* 0.132 0.188 0.144 0.237(0.143) (0.181) (0.312) (0.139) (0.152) (0.422) (0.334)
IPR protection index 0.110** 0.137* 0.103** 0.118** 0.134 0.875**(0.045) (0.077) (0.046) (0.055) (0.091) (0.403)
Physical capital per worker -0.002 -0.015 0.008 -0.001 -0.004 0.001 -0.017(0.013) (0.017) (0.014) (0.013) (0.013) (0.014) (0.015)
Human capital per worker -0.202 0.518*** -0.271 -0.169 -0.156 -0.243 0.563(0.146) (0.061) (0.327) (0.155) (0.142) (0.419) (0.474)
Lagged technology gap (5 year) -0.003(0.056)
Lagged technology gap - US frontier (2 year) 0.174(0.122)
Lagged R&D (3 year) -0.047(0.048)
Lagged technology gap -maximum frontier (3 year) -0.052(0.102)
Lagged technology gap -maximum frontier (5 year) 0.046(0.115)
Observations 389 184 310 387 408 322 266R-squared 0.374 0.531 0.358 0.374 0.368 0.362 0.363
Table 6: Robustness- Past Technology Gap and Past R&D
Licensing-Import Share
Notes: All specifications include country and year fixed effects. Lagged technology gap (5 year) is 5 year lagged technology with US MNC parent labor productivity as the frontier. Lagged technology gap US frontier (2 year) is 2 year lagged technology gap with US labor productivity as the frontier. Lagged R&D (3 year) is 3 year lagged R&D expenditures as a percentage of GDP. Lagged technology gap - maximum frontier (3 year/5 year) is 3 year/5 year lagged technology gap with frontier being the maximum labor productivity in a given industry-year. Robust standard errors which allow for clustering by country-year are reported in parenthesis. *** p<0.01, ** p<0.05, * p<0.1.

(1) (2) (3)Dependent variable
Technology gap -0.146** -0.139** -0.147**(0.062) (0.061) (0.062)
Trade costs 0.537** 0.675** 0.553**(0.216) (0.295) (0.217)
R&D 0.122* 0.051 0.160*(0.073) (0.068) (0.082)
Population -1.140*** -0.895** -0.827*(0.421) (0.415) (0.480)
GDP per capita 0.143 0.243* 0.117(0.143) (0.139) (0.150)
IPR protection index 0.110** 0.081* 0.128***(0.045) (0.043) (0.046)
Physical capital per worker -0.002 -0.001 -0.001(0.013) (0.013) (0.013)
Human capital per worker -0.202 -0.158 -0.270*(0.146) (0.142) (0.139)
Trade costs* R&D 0.135(0.110)
Local sales/All sales -0.130*(0.068)
Observations 389 389 389R-squared 0.374 0.376 0.377
Table 7: Other Robustness Results
Licensing-Import Share
Notes: All specifications include country and year fixed effects. Trade costs* R&D is the interaction of trade costs and R&D expenditures. Local sales/All sales is the fraction of local affiliate sales of all affiliate sales for each country and year. Robust standard errors which allow for clustering by country-year are reported in parenthesis. *** p<0.01, ** p<0.05, * p<0.1.
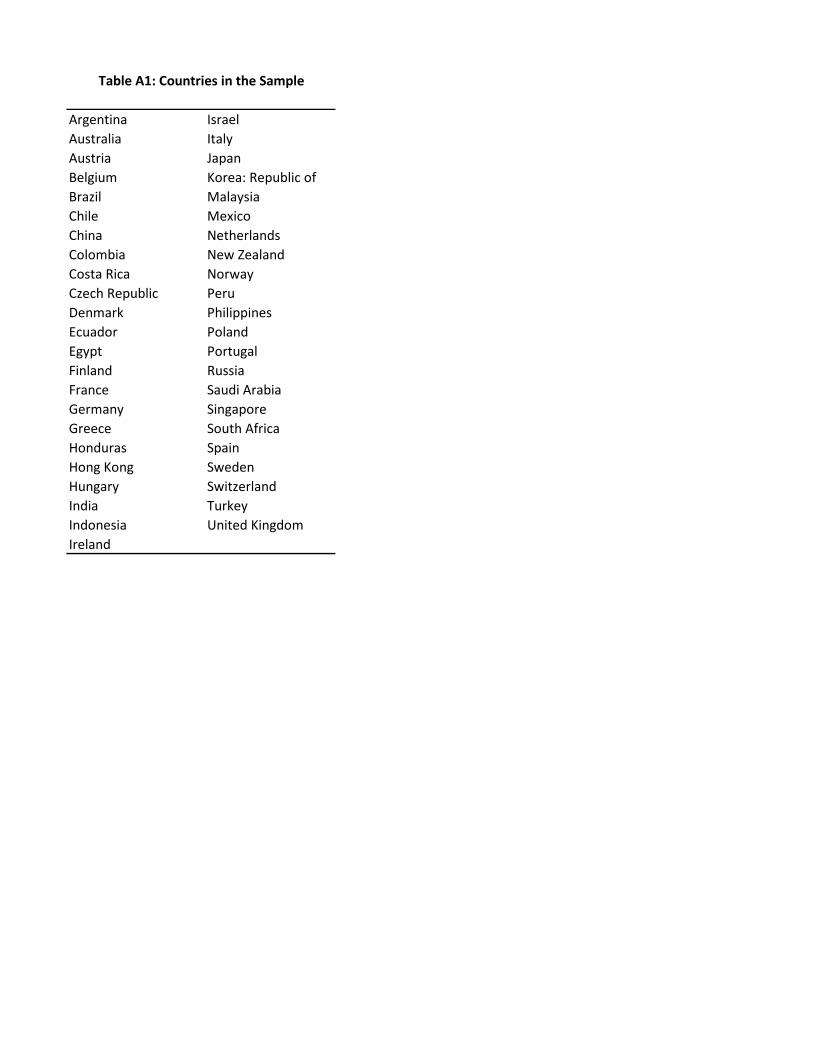
Argentina IsraelAustralia ItalyAustria JapanBelgium Korea: Republic ofBrazil MalaysiaChile MexicoChina NetherlandsColombia New ZealandCosta Rica NorwayCzech Republic PeruDenmark PhilippinesEcuador PolandEgypt PortugalFinland RussiaFrance Saudi ArabiaGermany SingaporeGreece South AfricaHonduras SpainHong Kong SwedenHungary SwitzerlandIndia TurkeyIndonesia United KingdomIreland
Table A1: Countries in the Sample