technology enables us to explore our earth the land and the oceans
TRANSCRIPT

Technology Enables Us To
Explore
Our EarthThe Land and the Oceans

Technology EARTH

Using Technology
GPS
Remote Sensing
GIS
ElectromagneticSpectrum
Reflectance Curves
Reflectance Curves
Ground Truthing
Buoys

Buoys are Buoyant

Buoys are used to help monitor large bodies of water on the Earth. They are often computerized and transmit data about ocean temperatures, wind patterns , currents and air temperature.

What Color is Light?

Electromagnetic SpectrumShows Waves of Energy

Reflectance CurvesThis is simple a “GRAPH” that shows how a type of matter reflects visible, infrared (heat) or other wavelenghts of light.
An upward curve indicates a lot of light is reflected. A downward curve show that the wavelength is absorbed.

Spectral AnalysisThe study of the reflectance of objects or substances
on Earth using Satellite Imagery
Electromagnetic Spectrum

Pictures that show satellite
images and rely on color torepresent data

Satellite

Using Satellites Helps In Monitoring the Earth
• Differences in soil types
• Algae – floating on top of water
• Distribution of plants (vegetation)
• Urban sprawl (growth of cities)
• Changes in deserts, forests and other large areas on the Earth


Global Positioning System

A GPS uses satellites to pinpoint locations on Earth. A GPS unit on Earth communicates with three or
more satellites then calculates the latitude, longitude and elevation of the GPS and transmits
the that position back to the unit.

Technology Enables Us to Explore
the
Ocean’s Depths

Alvin - submercible

Underwater Research

Robots

Jason – deep ocean vessel

SONARAcronym for: Sound
Navigation and RangingSonar is a method of
determining the depth of the ocean using echoes. It is also used to find “fish”.

Technology and the Hydrosphere
SONAR – COACH – page 144

Sonar


Remote Sensing
• A method of seeing what is beneath or on the surface of the ground and ocean
• It enables us to collect information about an area without visiting the area.
• Satellite photographs are a type of Remote Sensing

How Remote Sensing Works

Technology helps us to explore our Hydrosphere and the land on Earth“Remote Sensing”
Data can help scientists
understand: • About Food Webs
• How nutrients are distributed
• How sediments spread in water
• Help scientist observe and predict climate changes
• Predict or monitor “EL Nino”– See patterns of changes in surface
currents and temperatures

Ground TruthingA method of verifying the truth of a satellite images
This is done by visiting the area in person

Ground Truthing – involves scientists visiting an area and looking at maps that have been prepared by satellites
and be able to confirm that their maps match what was seen in the photograph and that actual terrain of the area.

Geographic – COACH – page 164
Information System
GIS- Mapmaking software - Layers
• Maps the location of a watershed• Show measures of controlling
water quality• Water temperature• pH and dissolved oxygen
• Identify pollutants that are near the area

Using Technology
GPS
Remote Sensing
GIS
ElectromagneticSpectrum
Topographic Map
Ground Truthing
Studying an area without
visiting the area in person
Software that
shows layers of maps

Topographic Mapping

Topographic MapsThe study of Earth’s natural and artifical
features by surveying and mapping the land

What is a Topographic Map?
In contrast to most maps, a topographic map shows the shape of the Earth’s
surface by using contour lines.
Topographic maps are used to
show elevation.

Contour lines are imaginary lines that join points of equal elevation above or below sea level. They never intersect or
meet.

Let’s take a walk up a hill!

We’re now at an elevation of 100 meters.
100m

Let’s keep going!
100m
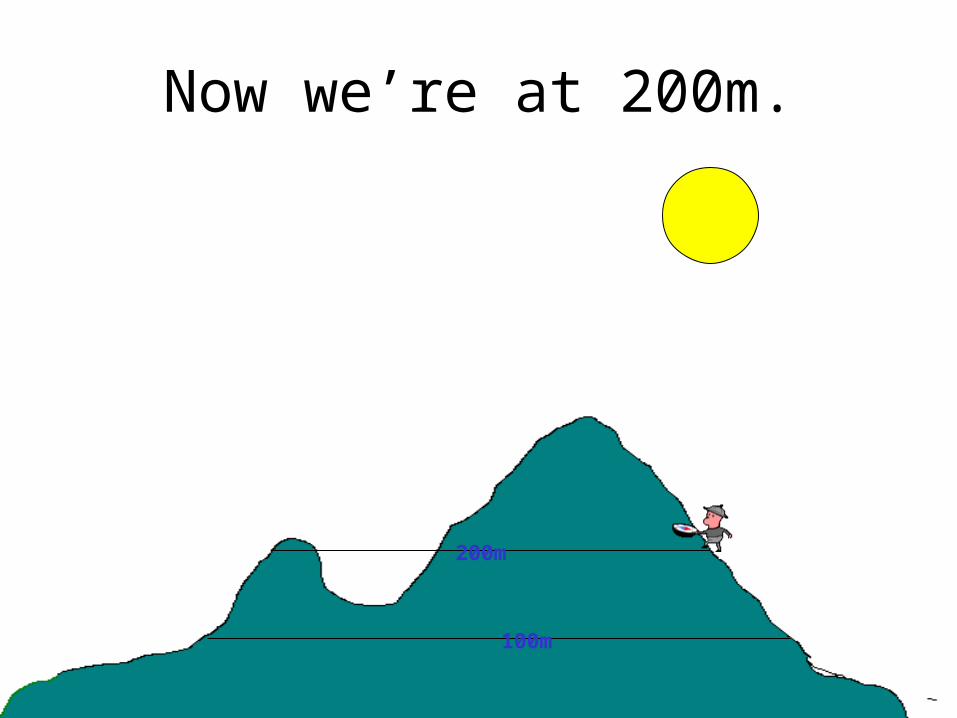
Now we’re at 200m.
100m
200m

Shall we march on?
100m
200m

We’ve made it to 300m!
100m
200m
300m

On to the peak!
100m
200m
300m

We’re on the peak, but what’s our elevation?
100m
200m
300m

Any ideas?
100m
200m
300m
Let’s add contour lines for every 50 meters and see if
that helps.

100m
200m
300m
We know that we are above 350m,
but less than 400m.
50m
150m
250m
350m

100m
200m
300m
Let’s head down the hill, it’s getting late!
50m
150m
250m
350m

100m
200m
300m
Now what’s our elevation?
50m
150m
250m
350m
If you said somewhere
between 200m and 250m you are
right!

100m
200m
300m
Let’s try this again!
50m
150m
250m
350m

100m
200m
300m
What’s our elevation now?
50m
150m
250m
350m
If you said 50m or just under, you’re
right!

Let’s now look at the same hill, but the way we
might see it from an airplane!

Each color change represents a 50 meter increase.

Now, let’s try the same hike! Our elevation is 0 meters.

Now what is our elevation?

If you said more than 150 meters, but less than 200 meters your right!

Let’s go a little higher.

Think you know our elevation now?
More than 300meters
But less than 350meters

If we were standing on the peak, what would be our
elevation?•More than 350 meters,
less than 400 meters

Let’s head down hill.

Know our elevation?

More than 100 meters,
less than 150 meters

• Contour lines are lines that connect points that are of the same elevation.
• They show the exact elevation, the shape of the land, and the steepness of the land’s slope.
• Contour lines never touch or cross.

Topographic Map

What is a contour interval?
• A contour interval is the difference in elevation between two contour lines that are side by side.
• Remember that a contour interval is not the distance between the two lines – to get the distance you need to use the map scale.

What if my contour lines are close together?
• If the contour lines are close together, then that indicates that area has a steep slope.

What if my contour lines are far apart?
• If the contour lines are far apart, then that indicates the land has a gentle slope (low slope).

What do the dark colored contour lines mean?
The dark colored contour lines represent every fifth contour line to make it easier to read the map.


Let’s see what you know.
400m 800m
1000m
1200m
A
B
C
D
E
F
600m

Grab a piece of paper and write your answers to the following questions.
Ready?

1. Could the elevation at the peak (B) be 1410 meters?
400m 800m
1000m
1200m
A
B
C
D
E
F
600m

2. What is the elevation at (E)?
400m 800m
1000m
1200m
A
B
C
D
E
F
600m

•1. No :The elevation must be under 1400 meters, but over 1300 meters.
•2. about 400 meters
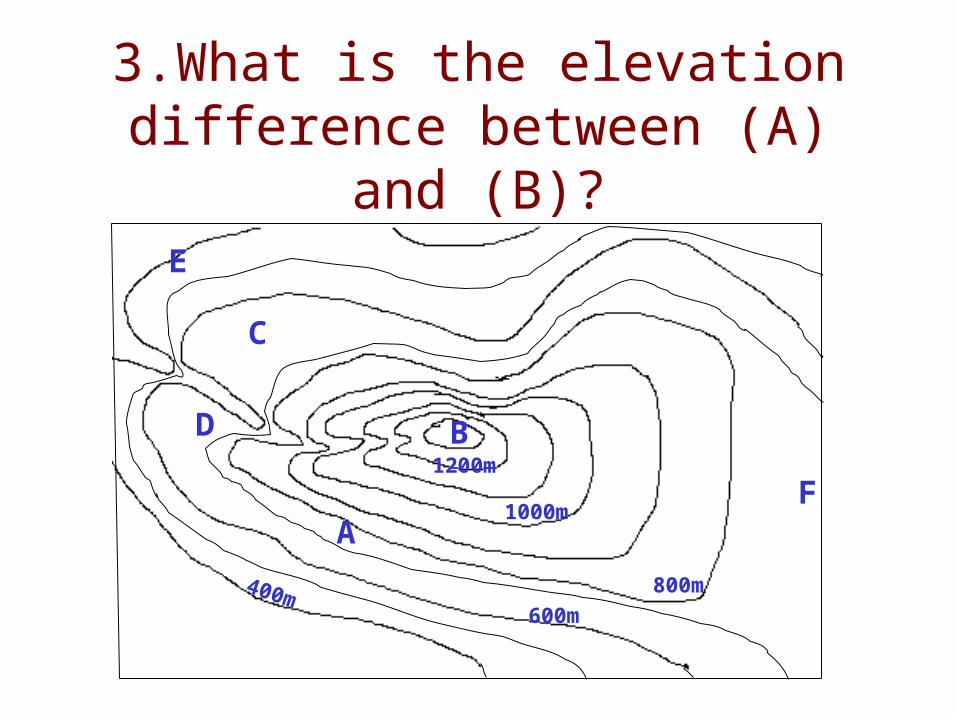
3.What is the elevation difference between (A) and
(B)?
400m 800m
1000m
1200m
A
B
C
D
E
F
600m

•3. (A) is probably close to the 750 meter line, (B) is above 1300 meters. The difference between the two would probably be 650 to 700 meters.

4. Could the elevation at (F) be 417 meters?
400m 800m
1000m
1200m
A
B
C
D
E
F
600m

5. If you walked a straight line from (D) to (C) would you walk over a
ridge or down a valley?
400m 800m
1000m
1200m
A
B
C
D
E
F
600m

•4. No: It must be more than 700 meters and less than 800 meters.
•5. Down a valley: If the contour lines point up the slope it’s a valley, if they point down the slope it’s a ridge.

6.Just looking at the map, would it be easier to head down from the peak going East, or going North?
400m 800m
1000m
1200m
A
B
C
D
E
F
600m
E
N
S
W

•6. East: When contour lines are close together that means there is a steep slope, the further apart the lines, the more gentile the slope and therefore an easier walk! Go east!

4
5
6
2
1
3
Using Technology
7

Using Technology
GPS
Remote Sensing
GIS
ElectromagneticSpectrum
Reflectance Curves
Reflectance Curves
Ground Truthing
Buoys
