technology demonstration report polyguard guardian
TRANSCRIPT

CEERE
Center for Energy Efficiency andRenewable Energy
Technology Demonstration Report
PolyGuardÄ
Guardian Environmental Technologies, Inc.
Prepared for
The Massachusetts StrategicEnvirotechnology Partnership
STEP
December 1999
Prepared by
Dr. Eric WinklerCenter for Energy Efficiency and Renewable Energy
University of Massachusetts AmherstEngineering Laboratory Box 2210
Amherst, Massachusetts 01003-2210
Guardian Environmental Technologies Inc. Technology Demonstration
Center for Energy Efficiency and Renewable Energy Page iiUniversity of Massachusetts at Amherst
PREFACE
The STEP technology assessment process is designed to identify those technologies thatwill support the economic and environmental/energy goals of the Commonwealth ofMassachusetts and may benefit from STEP assistance. The process is meant to be one ofscreening, in which technologies are evaluated by independent technical specialists.Recommendation from this process does not constitute an endorsement of the technologyor of the absolute validity of the technology. STEP technical assessments attest only that,through the screening process, the reviewers feel there may be benefit to theCommonwealth of Massachusetts.
PROJECT FUNDING
This STEP Technology Assessment was funded byThe University of Massachusetts and The Massachusetts Division of Energy Resources

Guardian Environmental Technologies Inc. Technology Demonstration
Center for Energy Efficiency and Renewable Energy Page iiiUniversity of Massachusetts at Amherst
EXECUTIVE SUMMARY
Technology Innovation
PolyGuard™ is a granular absorption media used to remove hydrocarbon contaminants from liquid andvapor streams. PolyGuard's mode of action depends upon the ability of the active material to selectivelyabsorb molecules with suitable solubility characteristics directly into its internal structure to form a stable,solid solution. Such a mechanism allows PolyGuard to absorb very large quantities of molecules, whichhave compatible solubility characteristics. Contaminants in water or air waste streams are partitioned intosoft or glassy regions of the medium. These regions have a strong affinity for hydrocarbons, chlorinatedhydrocarbons and many other non-polar organic compounds. PolyGuard has very little affinity formolecules whose solubility characteristics are very different from those of the active PolyGuard polymer.PolyGuard may not readily absorb inorganic compounds and some organic compounds that have highwater solubility from aqueous streams.
Company Description and Projected Market Impact
Guardian Environmental Technologies (GET) is a Connecticut corporation, founded in 1992 by thepresent majority owner, and has been located in Kent, Connecticut, since that time. The basic technologywas developed as a result of the development of families of polymeric absorbents, with a high affinity forhydrocarbons and chlorinated compounds.
GET estimates that the total U.S./Worldwide market potential, which uses absorption or adsorptiontechnology, is in excess of $24 billion, with a predicted continued growth rate in selected marketsegments of 4% to 6% per year, through 2001. Because the most widely used method of environmentaland industrial process water cleanup is carbon adsorption, GET has selected those industries where theuse of carbon is most common. Of the leading types of volatile organic compound treatment equipmentused for air pollution control, carbon is near the top in order of market share.
Prior Research Results
Lab testing has been performed on PolyGuard with several priority pollutants. Some of theseunpublished studies demonstrate that PolyGuard absorbent can absorb more than twice its weight ofdiesel fuel or home heating fuel. Laboratory studies with iso-octane demonstrated a loading capacity forPolyGuard of greater than 4:1 (grams of contaminant per gram of PolyGuard).
Product Demonstration Objectives
This experimental pilot program was conducted in conjunction with the Commonwealth of MassachusettsStrategic Envirotechnology Partnership (STEP). The primary objectives of this pilot were: i) todemonstrate removal of organic compounds associated with gasoline contaminated ground water utilizingPolyGuard absorbent ii) to quantify the absorption potential of PolyGuard specifically for MTBE inconjunction with other organic contaminants associated with gasoline contaminated ground water, iii) toquantify the absorption potential of PolyGuard for BTEX compounds, iv) to evaluate the stability of thespent PolyGuard material providing information on disposal alternatives, and v) to monitor the hydraulicperformance of PolyGuard under pump and treat remediation operation.
Experimental Methodology
The test demonstration methodology was designed in cooperation with GET and EnvironmentalCompliance Services (ECS, Agawam, MA) the cleanup site operator. The demonstration site was agasoline release at gas station located in Bellingham Massachusetts with high levels of MTBE and BTEX.Contaminant levels were reported for BTEX and MTBE as 75 and 125 mg/L respectively, prior to
Guardian Environmental Technologies Inc. Technology Demonstration
Center for Energy Efficiency and Renewable Energy Page ivUniversity of Massachusetts at Amherst
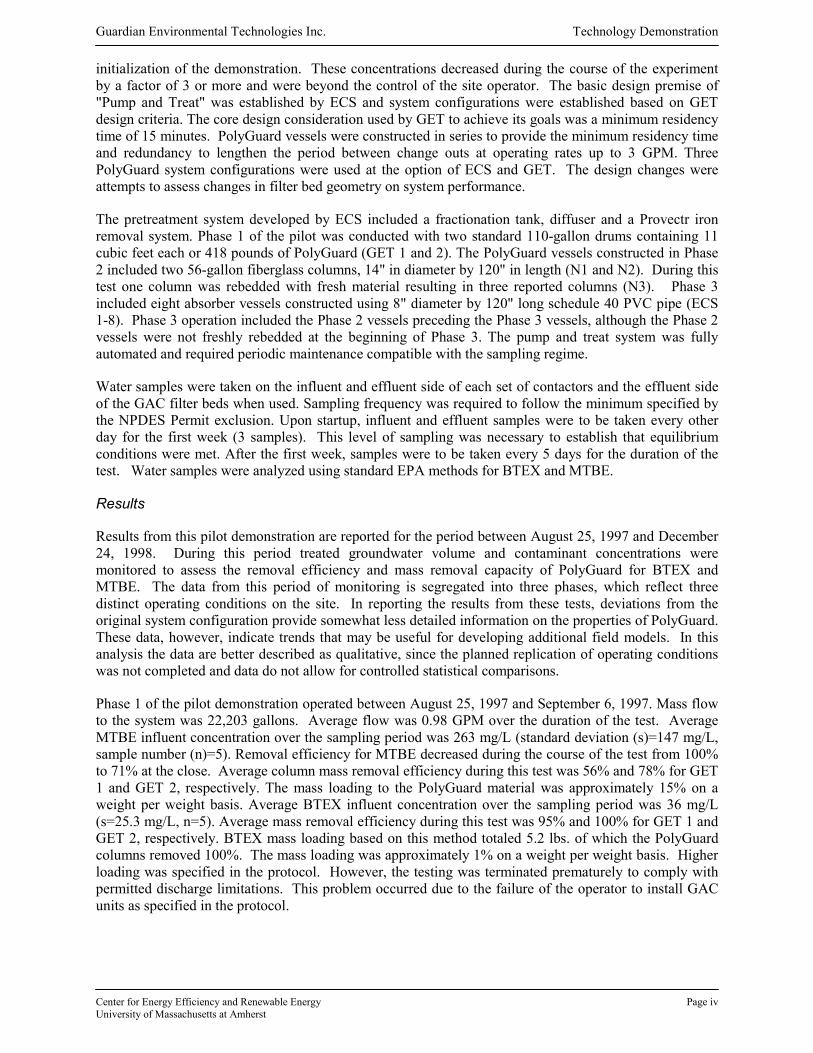
initialization of the demonstration. These concentrations decreased during the course of the experimentby a factor of 3 or more and were beyond the control of the site operator. The basic design premise of"Pump and Treat" was established by ECS and system configurations were established based on GETdesign criteria. The core design consideration used by GET to achieve its goals was a minimum residencytime of 15 minutes. PolyGuard vessels were constructed in series to provide the minimum residency timeand redundancy to lengthen the period between change outs at operating rates up to 3 GPM. ThreePolyGuard system configurations were used at the option of ECS and GET. The design changes wereattempts to assess changes in filter bed geometry on system performance.
The pretreatment system developed by ECS included a fractionation tank, diffuser and a Provectr ironremoval system. Phase 1 of the pilot was conducted with two standard 110-gallon drums containing 11cubic feet each or 418 pounds of PolyGuard (GET 1 and 2). The PolyGuard vessels constructed in Phase2 included two 56-gallon fiberglass columns, 14" in diameter by 120" in length (N1 and N2). During thistest one column was rebedded with fresh material resulting in three reported columns (N3). Phase 3included eight absorber vessels constructed using 8" diameter by 120" long schedule 40 PVC pipe (ECS1-8). Phase 3 operation included the Phase 2 vessels preceding the Phase 3 vessels, although the Phase 2vessels were not freshly rebedded at the beginning of Phase 3. The pump and treat system was fullyautomated and required periodic maintenance compatible with the sampling regime.
Water samples were taken on the influent and effluent side of each set of contactors and the effluent sideof the GAC filter beds when used. Sampling frequency was required to follow the minimum specified bythe NPDES Permit exclusion. Upon startup, influent and effluent samples were to be taken every otherday for the first week (3 samples). This level of sampling was necessary to establish that equilibriumconditions were met. After the first week, samples were to be taken every 5 days for the duration of thetest. Water samples were analyzed using standard EPA methods for BTEX and MTBE.
Results
Results from this pilot demonstration are reported for the period between August 25, 1997 and December24, 1998. During this period treated groundwater volume and contaminant concentrations weremonitored to assess the removal efficiency and mass removal capacity of PolyGuard for BTEX andMTBE. The data from this period of monitoring is segregated into three phases, which reflect threedistinct operating conditions on the site. In reporting the results from these tests, deviations from theoriginal system configuration provide somewhat less detailed information on the properties of PolyGuard.These data, however, indicate trends that may be useful for developing additional field models. In thisanalysis the data are better described as qualitative, since the planned replication of operating conditionswas not completed and data do not allow for controlled statistical comparisons.
Phase 1 of the pilot demonstration operated between August 25, 1997 and September 6, 1997. Mass flowto the system was 22,203 gallons. Average flow was 0.98 GPM over the duration of the test. AverageMTBE influent concentration over the sampling period was 263 mg/L (standard deviation (s)=147 mg/L,sample number (n)=5). Removal efficiency for MTBE decreased during the course of the test from 100%to 71% at the close. Average column mass removal efficiency during this test was 56% and 78% for GET1 and GET 2, respectively. The mass loading to the PolyGuard material was approximately 15% on aweight per weight basis. Average BTEX influent concentration over the sampling period was 36 mg/L(s=25.3 mg/L, n=5). Average mass removal efficiency during this test was 95% and 100% for GET 1 andGET 2, respectively. BTEX mass loading based on this method totaled 5.2 lbs. of which the PolyGuardcolumns removed 100%. The mass loading was approximately 1% on a weight per weight basis. Higherloading was specified in the protocol. However, the testing was terminated prematurely to comply withpermitted discharge limitations. This problem occurred due to the failure of the operator to install GACunits as specified in the protocol.

Guardian Environmental Technologies Inc. Technology Demonstration
Center for Energy Efficiency and Renewable Energy Page vUniversity of Massachusetts at Amherst
Phase 2 of the pilot demonstration operated between October 27, 1997 and December 3, 1997. Mass flowto the system was 40,707 gallons. Average flow of 0.63 GPM over the duration of the test. AverageMTBE influent concentration over the sampling period was 85.6 mg/L (24.8 mg/L, n=9). Removalefficiency for MTBE decreased during the course of the test from 100% to 21%. Average column massremoval efficiency during this test was 42%, 58% and 44% for N1, N2 and N3, respectively. MTBE massloading during this test period totaled 28.1 lbs. of which the PolyGuard columns removed 15.1 lbs. Themass loading to the PolyGuard material was approximately 4% on a weight per weight basis. AverageBTEX influent concentration over the sampling period was 30.3 mg/L (s=10.8 mg/L, n=9). Removalefficiency for BTEX decreased minimally and less than that observed for MTBE during the course of thetest. Average column removal efficiency during this test was 98 to 100% for all three N columns. Onone instance, November 18th, removal efficiency dropped to 81% in N2. However, it is unclear whetheran analytical error occurred on that data rendering a sample concentration bias. Mass removal wascalculated as previously described. BTEX mass loading based on this method totaled 10.35 lbs. of whichthe PolyGuard columns removed 99.6%. The GAC column removed BTEX, which passed through the Ncolumns. The mass loading to the PolyGuard material was approximately 3% on a weight per weightbasis. Higher loading was specified in the protocol. However, the testing was terminated prematurely tocomply with permitted discharge limitations.
Phase 3 of the pilot demonstration was implemented June 17, 1998 and data is reported up until August31, 1998. Total mass flow pumped though the system during this test was 51,951 gallon with an averageflow of 0.44 GPM over the duration of the test. Average MTBE influent concentration over the samplingperiod was 38.3 mg/L (s=14.0 mg/L, n=11). Removal efficiency for MTBE decreased during the courseof the test from 100% to 39%. The vessels from Phase 2 used in Phase 3 did not remove any appreciableamounts of MTBE during this test. Average system mass removal efficiency during this test was 82%.MTBE mass loading totaled 14.9 lbs. of which the ECS PolyGuard columns removed 13.1 lbs. The massloading to the PolyGuard material in the ECS columns ranged from 1 to 7% on a weight per weight basis.Average BTEX influent concentration over the sampling period was 14.6 mg/L (s=7.0 mg/L, n=11).Removal efficiency for BTEX remained at 100% during the course of the test. Average column massremoval efficiency during this test ranged from 3% to 100%. BTEX mass loading based on this methodtotaled 6.82 lbs. of which the N columns removed 6.81 lbs. Based on the useful data, apart from the non-detects, it is estimated that the ECS columns removed 0.01 lbs. of BTEX. The mass loading to thePolyGuard material in the system was approximately 1% on a weight per weight basis. The N columnshad a slightly higher mass loading rate of 3% on a weight per weight basis.
System performance demonstrated removal rates for BTEX up to 100% during the operation of each ofthe phases. The removal rates for MTBE were lower ranging from 3% to 100% for any individual columnduring each interval, while average system removal was 91, 41 and 82% for Phases 1, 2, and 3,respectively.
Under the study operating conditions system hydraulic performance did not present any limitations to use.A qualitative assessment of the hydraulic performance suggests that under the operating rates observed inthis study, the system configuration and system construction, PolyGuard is capable of handling flows ashigh as 2 GPM or higher without significant effort to increase operating pressures.
No information regarding product stability or disposal costs were available from these studies. Disposalcosts reported by GET indicate approximate costs of $275 to $325 per 55-gallon drum for hazardousmaterial disposal and $89 per 55-gallon drum for non-hazardous material disposal. Proposed disposalmay include fuel blending and or incineration.
A preliminary cost analysis was performed to assess the per pound cost to remove MTBE usingPolyGuard. This analysis was made using total estimated contaminant removed and material cost ofPolyGuard. Operational and capital cost were excluded from this analysis because under pilotingconditions these cost do not reflect full commercial deployment of the technology. Lowest cost per pound
Guardian Environmental Technologies Inc. Technology Demonstration
Center for Energy Efficiency and Renewable Energy Page viUniversity of Massachusetts at Amherst
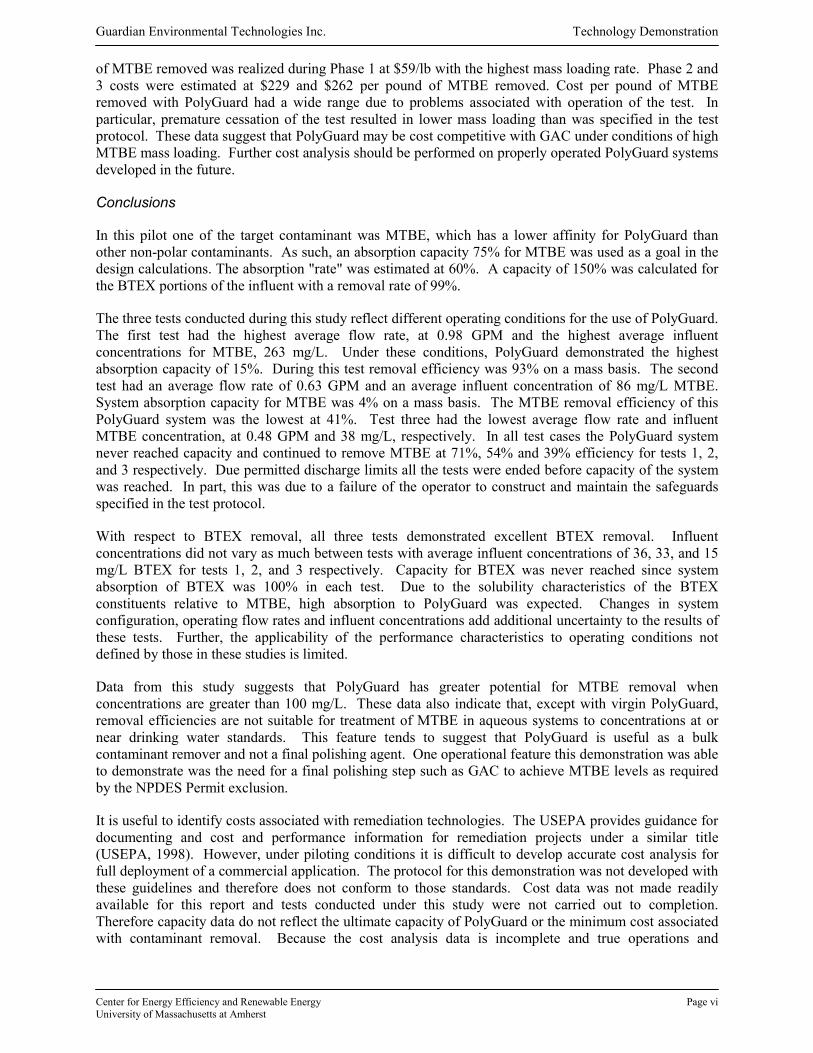
of MTBE removed was realized during Phase 1 at $59/lb with the highest mass loading rate. Phase 2 and3 costs were estimated at $229 and $262 per pound of MTBE removed. Cost per pound of MTBEremoved with PolyGuard had a wide range due to problems associated with operation of the test. Inparticular, premature cessation of the test resulted in lower mass loading than was specified in the testprotocol. These data suggest that PolyGuard may be cost competitive with GAC under conditions of highMTBE mass loading. Further cost analysis should be performed on properly operated PolyGuard systemsdeveloped in the future.
Conclusions
In this pilot one of the target contaminant was MTBE, which has a lower affinity for PolyGuard thanother non-polar contaminants. As such, an absorption capacity 75% for MTBE was used as a goal in thedesign calculations. The absorption "rate" was estimated at 60%. A capacity of 150% was calculated forthe BTEX portions of the influent with a removal rate of 99%.
The three tests conducted during this study reflect different operating conditions for the use of PolyGuard.The first test had the highest average flow rate, at 0.98 GPM and the highest average influentconcentrations for MTBE, 263 mg/L. Under these conditions, PolyGuard demonstrated the highestabsorption capacity of 15%. During this test removal efficiency was 93% on a mass basis. The secondtest had an average flow rate of 0.63 GPM and an average influent concentration of 86 mg/L MTBE.System absorption capacity for MTBE was 4% on a mass basis. The MTBE removal efficiency of thisPolyGuard system was the lowest at 41%. Test three had the lowest average flow rate and influentMTBE concentration, at 0.48 GPM and 38 mg/L, respectively. In all test cases the PolyGuard systemnever reached capacity and continued to remove MTBE at 71%, 54% and 39% efficiency for tests 1, 2,and 3 respectively. Due permitted discharge limits all the tests were ended before capacity of the systemwas reached. In part, this was due to a failure of the operator to construct and maintain the safeguardsspecified in the test protocol.
With respect to BTEX removal, all three tests demonstrated excellent BTEX removal. Influentconcentrations did not vary as much between tests with average influent concentrations of 36, 33, and 15mg/L BTEX for tests 1, 2, and 3 respectively. Capacity for BTEX was never reached since systemabsorption of BTEX was 100% in each test. Due to the solubility characteristics of the BTEXconstituents relative to MTBE, high absorption to PolyGuard was expected. Changes in systemconfiguration, operating flow rates and influent concentrations add additional uncertainty to the results ofthese tests. Further, the applicability of the performance characteristics to operating conditions notdefined by those in these studies is limited.
Data from this study suggests that PolyGuard has greater potential for MTBE removal whenconcentrations are greater than 100 mg/L. These data also indicate that, except with virgin PolyGuard,removal efficiencies are not suitable for treatment of MTBE in aqueous systems to concentrations at ornear drinking water standards. This feature tends to suggest that PolyGuard is useful as a bulkcontaminant remover and not a final polishing agent. One operational feature this demonstration was ableto demonstrate was the need for a final polishing step such as GAC to achieve MTBE levels as requiredby the NPDES Permit exclusion.
It is useful to identify costs associated with remediation technologies. The USEPA provides guidance fordocumenting and cost and performance information for remediation projects under a similar title(USEPA, 1998). However, under piloting conditions it is difficult to develop accurate cost analysis forfull deployment of a commercial application. The protocol for this demonstration was not developed withthese guidelines and therefore does not conform to those standards. Cost data was not made readilyavailable for this report and tests conducted under this study were not carried out to completion.Therefore capacity data do not reflect the ultimate capacity of PolyGuard or the minimum cost associatedwith contaminant removal. Because the cost analysis data is incomplete and true operations and

Guardian Environmental Technologies Inc. Technology Demonstration
Center for Energy Efficiency and Renewable Energy Page viiUniversity of Massachusetts at Amherst
maintenance data could not be collected in this demonstration of PolyGuard, it is difficult to quantify thecompetitive advantages of PolyGuard when compared to GAC systems, the current industry standard.However, qualitative evidence suggests performance and cost advantages under high MTBEconcentrations and a range of BTEX concentrations
Further studies are recommended based on qualitative results from this study. Foremost, isothermanalysis under a variety of operating conditions will assist in quantifying absorption rates, especiallywhere concentration varies. Furthermore, it is recommended that studies tests of PolyGuard absorptionwith complex solutions under controlled conditions may assist in understanding product performance.Additional investigation into system fouling and microbial activity is also recommended since they areproblems in GAC systems. Field studies under alternative conditions to those reported in this study mayassist in developing full scale operating parameters, but may be less useful for broader applicability todiverse sets of operating conditions.
The potential strengths and weaknesses of PolyGuard compared with GAC should also be furtherexplored. Full life cycle costs, including capital costs, O&M, and disposal need to be more fullycharacterized for operational systems, following EPA methodologies.
Guardian Environmental Technologies Inc. Technology Demonstration
Center for Energy Efficiency and Renewable Energy Page viiiUniversity of Massachusetts at Amherst
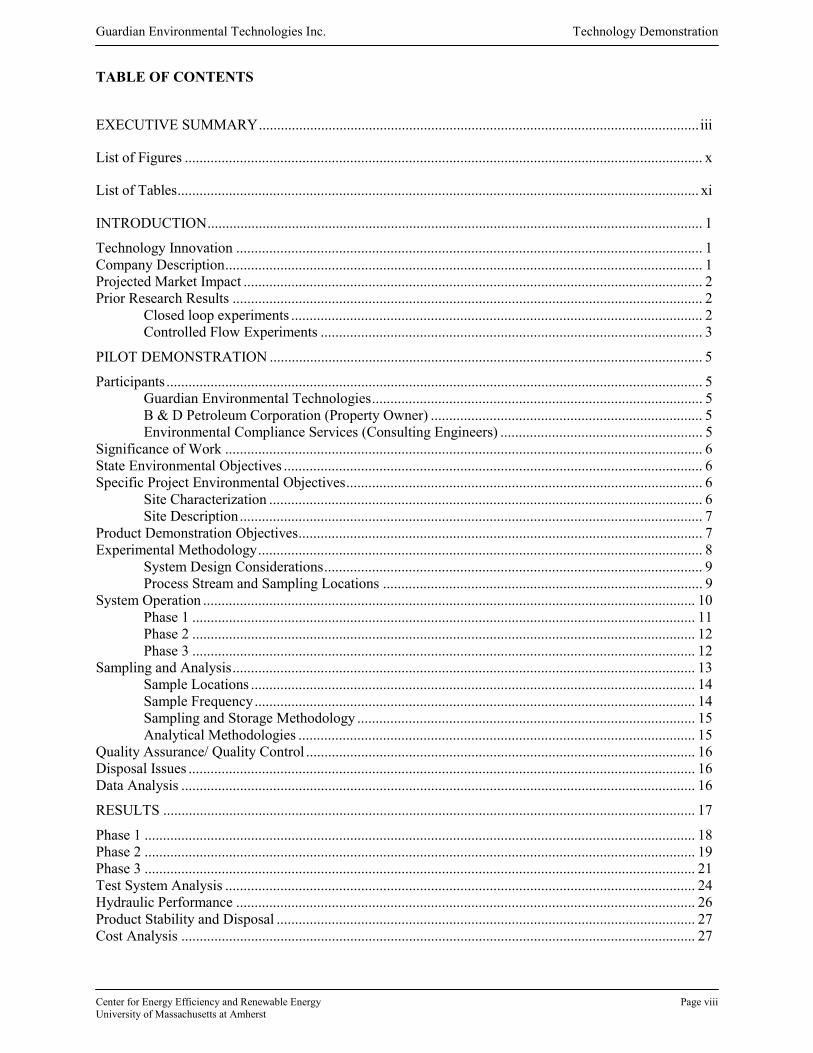
TABLE OF CONTENTS
EXECUTIVE SUMMARY........................................................................................................................ iii
List of Figures ............................................................................................................................................. x
List of Tables.............................................................................................................................................. xi
INTRODUCTION....................................................................................................................................... 1
Technology Innovation ............................................................................................................................... 1Company Description.................................................................................................................................. 1Projected Market Impact ............................................................................................................................. 2Prior Research Results ................................................................................................................................ 2
Closed loop experiments ................................................................................................................ 2Controlled Flow Experiments ........................................................................................................ 3
PILOT DEMONSTRATION ...................................................................................................................... 5
Participants .................................................................................................................................................. 5Guardian Environmental Technologies.......................................................................................... 5B & D Petroleum Corporation (Property Owner) .......................................................................... 5Environmental Compliance Services (Consulting Engineers) ....................................................... 5
Significance of Work .................................................................................................................................. 6State Environmental Objectives .................................................................................................................. 6Specific Project Environmental Objectives................................................................................................. 6
Site Characterization ...................................................................................................................... 6Site Description.............................................................................................................................. 7
Product Demonstration Objectives.............................................................................................................. 7Experimental Methodology......................................................................................................................... 8
System Design Considerations....................................................................................................... 9Process Stream and Sampling Locations ....................................................................................... 9
System Operation ...................................................................................................................................... 10Phase 1 ......................................................................................................................................... 11Phase 2 ......................................................................................................................................... 12Phase 3 ......................................................................................................................................... 12
Sampling and Analysis.............................................................................................................................. 13Sample Locations ......................................................................................................................... 14Sample Frequency........................................................................................................................ 14Sampling and Storage Methodology ............................................................................................ 15Analytical Methodologies ............................................................................................................ 15
Quality Assurance/ Quality Control .......................................................................................................... 16Disposal Issues .......................................................................................................................................... 16Data Analysis ............................................................................................................................................ 16
RESULTS ................................................................................................................................................. 17
Phase 1 ...................................................................................................................................................... 18Phase 2 ...................................................................................................................................................... 19Phase 3 ...................................................................................................................................................... 21Test System Analysis ................................................................................................................................ 24Hydraulic Performance ............................................................................................................................. 26Product Stability and Disposal .................................................................................................................. 27Cost Analysis ............................................................................................................................................ 27
Guardian Environmental Technologies Inc. Technology Demonstration
Center for Energy Efficiency and Renewable Energy Page ixUniversity of Massachusetts at Amherst
CONCLUSIONS....................................................................................................................................... 28
REFERENCES.......................................................................................................................................... 30
APPENDICES........................................................................................................................................... 32
Appendix A: Design Calculations for Test number 3. .............................................................................. 33Appendix B: Pilot Test Analytical Data.................................................................................................... 34Appendix C: Remediation Action Plan Status Report, April 1998 ........................................................... 38Appendix D: Remediation Action Plan Status Report, May, 1999........................................................... 50
Guardian Environmental Technologies Inc. Technology Demonstration
Center for Energy Efficiency and Renewable Energy Page xUniversity of Massachusetts at Amherst
List of Figures
Figure 1: Schematic of closed loop capacity test apparatus. (After, GET, 1997). .......................................3
Figure 2: Schematic of single pass column absorption apparatus. (After, GET, 1997). .............................4
Figure 3: Site of Gasoline spill in Bellingham, Massachusetts, 1997. ..........................................................7
Figure 4: Typical fiberglass PolyGuard filter unit. (After GET, Inc. 1998)..................................................8
Figure 5: Schematic of treatment process train. (After ECS, Agawam, MA, 1998). ..................................10
Figure 6: Phase 1 test showing screen on top of PolyGuard Media. ..........................................................11
Figure 7: Phase 2 showing two 56-gallon fiberglass PolyGuard units (N1 and N2), prior towrapping units with insulation....................................................................................................12
Figure 8: Phase 3 pilot absorption beds shown in mounting rack during construction...............................13
Figure 9: Phase 1 MTBE concentrations and removal efficiency. ..............................................................18
Figure 10: Phase 1 BTEX concentrations and removal efficiency..............................................................19
Figure 11: Phase 2 MTBE concentrations and removal efficiency. ............................................................20
Figure 12: Phase 2 BTEX concentrations and removal efficiency..............................................................21
Figure 13: Phase 3 MTBE concentrations and removal efficiency. ............................................................22
Figure 14: Phase 3 BTEX concentrations and removal efficiency.............................................................24
Figure 15: Theoretical removal efficiency curves corrected for time and system configuration...............25
Figure 16: Plot of MTBE removal efficiency for each column correcting for flow per pound ofPolyGuard illustrating. ................................................................................................................25
Figure 17: Plot of BTEX removal efficiency for each column correcting for flow per pound ofPolyGuard illustrating. ................................................................................................................26
Guardian Environmental Technologies Inc. Technology Demonstration
Center for Energy Efficiency and Renewable Energy Page xiUniversity of Massachusetts at Amherst
List of Tables
Table 1. Test constituents, parameters and results from closed loop studies. ..............................................3
Table 2. Results from absorption studies with residency time of 10 minutes. .............................................4
Table 3. Initial level of contaminants at proposed site. ................................................................................7
Table 4. Summary table of associated errors with sampling intervals and variation in BTEXcontaminant concentration. .........................................................................................................14
Table 5. Summary table of associated errors with sampling intervals and variation in MTBEcontaminant concentration for expected removal efficiency of 75%..........................................15
Table 6. Analyte and Methods to be Utilized in Pilot Study......................................................................16
Table 7. Objectives and Completion Status. ..............................................................................................17
Table 8. Average operating conditions for each test Phase........................................................................17
Table 9. Cost estimates data reflecting maximum cost for MTBE removal using PolyGuard, notincluding capital or operating costs. ...........................................................................................27

Guardian Environmental Technologies Inc. Technology Demonstration
Center for Energy Efficiency and Renewable Energy Page 1University of Massachusetts at Amherst
INTRODUCTION
Technology Innovation
PolyGuard™ is a granular absorption media used to remove hydrocarbon contaminants from liquid andvapor streams. PolyGuard's mode of action depends upon the ability of the active material to selectivelyabsorb molecules with suitable solubility characteristics directly into its internal structure to form a stable,solid solution. Such a mechanism allows PolyGuard to absorb very large quantities of molecules, whichhave compatible solubility characteristics. Contaminants in water or air waste streams are partitioned intosoft or glassy regions of the medium. These regions have a strong affinity for hydrocarbons, chlorinatedhydrocarbons and many other non-polar organic compounds. PolyGuard has very little affinity formolecules whose solubility characteristics are very different from those of the active PolyGuard polymer.PolyGuard may not readily absorb inorganic and some organic compounds that have high water solubilityfrom aqueous streams.
Granular activated carbon (GAC), molecular sieves and similar media depend upon the adsorption ofcontaminants onto the internal surfaces of the material. Contaminant selectivity is based upon severalfactors, including the chemical nature of the material to be adsorbed and the molecular size and shape ofthe compound. GAC has a broad range of selectivity towards various molecular types, and carbon willadsorb polar molecules (including water-soluble compounds) as well as non-polar molecules, such ashydrocarbons. The capacity of the carbon to adsorb different types of molecules, however, will vary frommodest to low, again depending upon the characteristics of the contaminants and conditions such astemperature, pressure and concentration.
In contrast, PolyGuard's mode of action depends upon the ability of the active material to selectivelyabsorb molecules with suitable solubility characteristics directly into its internal structure to form a stable,solid solution.
This mode of action distinguishes PolyGuard from other absorbents and adsorbents. These characteristicsare; a) PolyGuard absorbs contaminants into its internal structure at weight to weight ratios of up to 4:1.b) Once contaminants are absorbed, organic compounds are "encapsulated" and cannot be easily releasedthrough pressure alone. c) The capacity of the absorption bed in vapor phase application is not affected bythe presence of water vapor in the contaminant stream.
PolyGuard has a strong affinity for hydrocarbons (including components of: gasoline, diesel fuel, andheating oil), chlorinated hydrocarbons, chlorinated industrial solvents such as TCE and PCE, andpolychlorinated biphenyls (PCBs). PolyGuard has applicability in treating industrial waste streams, pumpand treat remediation of contaminated soil and ground water, and other applications where GAC is used.In previous laboratory studies PolyGuard demonstrated strong absorption potential for methyl-tertiary-butyl-ether (MTBE), a significant component of gasoline.
Company Description
Guardian Environmental Technologies (GET) is a Connecticut corporation, founded in 1992 by thepresent majority owner, and has been located in Kent, Connecticut, since that time. The basic technologywas developed as a result of the development of families of polymeric absorbents, with a high affinity forhydrocarbons and chlorinated compounds.
GET’s first product was first introduced in 1992 under the name PetroGuard™. The original product wasmeant purely as an oil spill control for surface oil removal. PetroGuard has been enhanced and improved
Guardian Environmental Technologies Inc. Technology Demonstration
Center for Energy Efficiency and Renewable Energy Page 2University of Massachusetts at Amherst
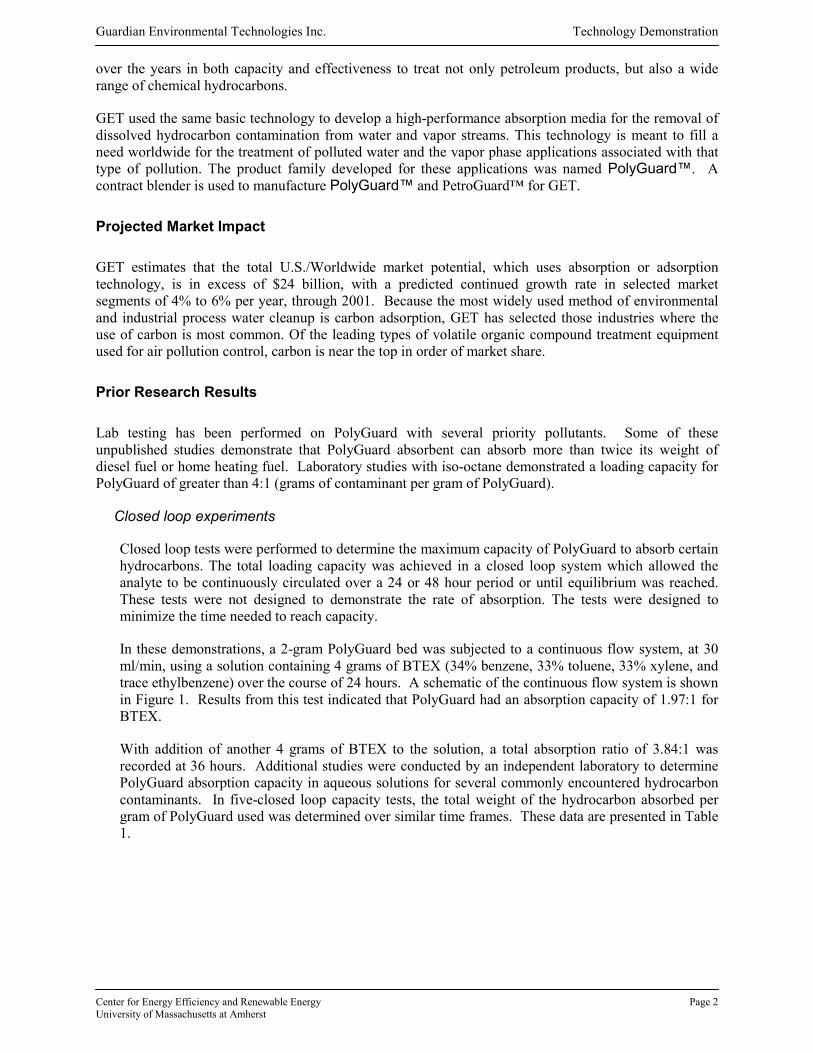
over the years in both capacity and effectiveness to treat not only petroleum products, but also a widerange of chemical hydrocarbons.
GET used the same basic technology to develop a high-performance absorption media for the removal ofdissolved hydrocarbon contamination from water and vapor streams. This technology is meant to fill aneed worldwide for the treatment of polluted water and the vapor phase applications associated with thattype of pollution. The product family developed for these applications was named PolyGuard™. Acontract blender is used to manufacture PolyGuard™ and PetroGuard™ for GET.
Projected Market Impact
GET estimates that the total U.S./Worldwide market potential, which uses absorption or adsorptiontechnology, is in excess of $24 billion, with a predicted continued growth rate in selected marketsegments of 4% to 6% per year, through 2001. Because the most widely used method of environmentaland industrial process water cleanup is carbon adsorption, GET has selected those industries where theuse of carbon is most common. Of the leading types of volatile organic compound treatment equipmentused for air pollution control, carbon is near the top in order of market share.
Prior Research Results
Lab testing has been performed on PolyGuard with several priority pollutants. Some of theseunpublished studies demonstrate that PolyGuard absorbent can absorb more than twice its weight ofdiesel fuel or home heating fuel. Laboratory studies with iso-octane demonstrated a loading capacity forPolyGuard of greater than 4:1 (grams of contaminant per gram of PolyGuard).
Closed loop experiments
Closed loop tests were performed to determine the maximum capacity of PolyGuard to absorb certainhydrocarbons. The total loading capacity was achieved in a closed loop system which allowed theanalyte to be continuously circulated over a 24 or 48 hour period or until equilibrium was reached.These tests were not designed to demonstrate the rate of absorption. The tests were designed tominimize the time needed to reach capacity.
In these demonstrations, a 2-gram PolyGuard bed was subjected to a continuous flow system, at 30ml/min, using a solution containing 4 grams of BTEX (34% benzene, 33% toluene, 33% xylene, andtrace ethylbenzene) over the course of 24 hours. A schematic of the continuous flow system is shownin Figure 1. Results from this test indicated that PolyGuard had an absorption capacity of 1.97:1 forBTEX.
With addition of another 4 grams of BTEX to the solution, a total absorption ratio of 3.84:1 wasrecorded at 36 hours. Additional studies were conducted by an independent laboratory to determinePolyGuard absorption capacity in aqueous solutions for several commonly encountered hydrocarboncontaminants. In five-closed loop capacity tests, the total weight of the hydrocarbon absorbed pergram of PolyGuard used was determined over similar time frames. These data are presented in Table1.

Guardian Environmental Technologies Inc. Technology Demonstration
Center for Energy Efficiency and Renewable Energy Page 3University of Massachusetts at Amherst
Figure 1: Schematic of closed loop capacity test apparatus. (After, GET, 1997).
Table 1. Test constituents, parameters and results from closed loop studies.
Beginning Contaminant Total Final Loading Absorption Loading PolyGuard Contaminant Capacity (grams) (grams) (ppm) (grams/gram)
iso-Octane (2.0 grams) 1.0 2 2.0:1.0MTBE (2.0 grams) 1.0 465 1.53:1.0Trichloroethylene (2.0 grams) 1.0 5 1.99:1.0BTEX (4.0 grams) 2.0 76 3.84:1.0PCB's (Arochlor 1248) (2 grams) 2.0 5 0.99:1.0Note: The experiment did not measure ultimate capacity-only performance at the measured capacity.
Controlled Flow Experiments
Additional tests were conducted to demonstrate the rate of absorption of contaminants from acontrolled flow of water to simulate a specific residence time. These tests were run to determine theability of PolyGuard to remove certain hydrocarbon contaminants in a single pass through, as wouldoccur in the field. The apparatus used in these studies is shown in Figure 2. It should be noted thatthe maximum absorption capacity (weight to weight ratio) was not demonstrated in these tests,because the bed was not allowed to reach equilibrium.
In selecting an acceptable residence time, the most effective practical weight to weight ratio wascalculated to prevent reaching maximum capacity. This is significant, since PolyGuard forms a"plug" resulting from the transformation of the granules into a solid glass-like mass, when completedsaturated with hydrocarbons. In a field installation this would only occur if the bed was loaded withpure or near pure product or if a system was neglected and allowed to run beyond capacity. In fieldapplications, this would be demonstrated by a large pressure drop. Operational devices, such asequilibration tanks, are capable of avoiding application of pure product onto the bed under fieldsituations.
����������������
��������������������������� ������� ������� ������� ������� ������� ������� ������� ������� ������� ������� ������� ������� ������� ������� ������� ������� ������� ������� ������� ������� ������� ������� ������� ������� ������� ������� ������� ������� ������� ������� ������� ������� ������� ������� ������� ������� ������� ������� ������� ������� ������� ������� ������� ������� ������� ������� ������� ������� ������� ������� ������� ������� ������� ������� ������� ������� ����������������������������
����������������
��������
��������
PolyGuard
Glasswool
pump
undissolvedBTX
����������������
solution
����������������������������������������������� ������� ������� ������� ������� ������� ������� ������� ������� ������� ������� ������� ������� ������� ������� ������� ������� ������� ������� ������� ������� ������� ������� ������� ������� ������� ������� ������� ������� ������� ������� ������� ������� ������� ������� ������� ������� ������� ������� ������� ������� ������� ������� ������� ������� ������� ������� ������� ������� ������� ������� ������� ������� ������� ������� ������� ������� ��������������������
3 waystopcock andflow adjustm ent valve
3 waystopcockinfluent sam ple port
effluentsam pleport ����
����
substrateaddition port
���������
������������
M agnetic M ixer(slow RPM )
Pressurereliefvalve

Guardian Environmental Technologies Inc. Technology Demonstration
Center for Energy Efficiency and Renewable Energy Page 4University of Massachusetts at Amherst
Figure 2: Schematic of single pass column absorption apparatus. (After, GET,1997).
PolyGuard was packed into a 1-inch wide column giving a length to width ratio of 5:1. Fiveexperiments were conducted with MTBE, TCE, Iso-Octane, Arochlor 1248, and a benzene-toluene-xylene mixture. Analyte solution was passed over the bed using a residence time of approximately10-minutes, based on bed volume. The percent contaminant absorbed from the five tests are presentedin Table 2. below:
Table 2. Results from absorption studies with residency time of 10 minutes.
Contaminants (20 mg/L) % AbsorbedMTBE 87.8TCE 98.9Iso-Octane 98.5PCB (Arochlor 1248) 87.4Benzene 99.8Toluene 99.8Xylene 99.9
The results from bench scale studies suggest that PolyGuard may perform as efficiently as GACunder loading rates and residency times described in these studies. In these tests, comparisons tocarbon efficiency were not performed. There are potential limitations to the application of resultsfrom single component studies. This is especially so, where the application of PolyGuard is typicallywith systems containing a mixture of contaminants. Further studies are recommended for this area ofinquiry. Comparisons to GAC can be made once some of these unknowns are addressed.Furthermore, these data do not reflect changes in absorption rates relative to bed loads. Kinetic
Guardian Environmental Technologies Inc. Technology Demonstration
Center for Energy Efficiency and Renewable Energy Page 5University of Massachusetts at Amherst
studies could enhance the developer's ability to predict absorption rates that may be affected by dualmode transfer processes and or concentration gradients.
These data indicate that additional bench scale testing is required. In particular, isotherm studies withpriority contaminants, and complex solutions will provide performance data suitable for broaderapplications. Further work on retention times is needed to assess the full range of loading rates.
PILOT DEMONSTRATION
Participants
Guardian Environmental Technologies
Guardian Environmental Technologies provided all PolyGuard media and the primary columns forthis test. The STEP PI and GET were to compile all relevant data into an overall analysis. GET was tosupport final report preparation along with the STEP PI. GET was to provide the STEP program withany additional available data for preparation of the final report of the pilot demonstration. WilliamLitwin was the primary responsible individual at Guardian Environmental Technologies.
B & D Petroleum Corporation (Property Owner)
B & D Petroleum Corporation provided access to the site for maintenance, sampling, and monitoringthe pilot study.
Environmental Compliance Services (Consulting Engineers)
Environmental Compliance Services, of Agawam and Brighton Massachusetts, was designated tooperate and maintain the PolyGuard system for the duration of the pilot. ECS agreed to fabricate allsecondary columns for Phase 3 and was responsible for installation and operation of the system asconsulting engineers for the site. ECS was responsible for sampling and laboratory analysis. ECS wasresponsible for providing data to GET and to the STEP PI. ECS was responsible for supervising andor carry out the sampling protocols, transport samples to the analytical facilities, and provide foranalysis of samples. ECS was responsible for assuring that standard operating procedures (SOPs)were followed and that changes were reported to the STEP PI. ECS was to be primarily responsiblefor assuring that sampling protocols and analytical methods adhered to the specifications of this pilotprogram and would notify Guardian Environmental Technologies or the STEP PI of any deviations ofthe specified protocols in a timely manner. ECS was also responsible for review of the final report.
University of Massachusetts – Amherst (STEP)
The Center for energy Efficiency and Renewable Energy in the Department of Mechanical andIndustrial Engineering at the University of Massachusetts at Amherst (UMASS - Amherst) providedproject oversight and reporting through the STEP Principal Investigator. The STEP P.I. was to ensurethat technical, practical, and operational aspects of the study were documented and that objectivesestablished for this pilot were completed. The STEP P.I. provided guidance on sampling protocolsand technical guidance for the pilot. Oversight during the project included design and revisions topilot test protocol, site visits during installation, initial sampling, dismantling, preparation of finalreport.

Guardian Environmental Technologies Inc. Technology Demonstration
Center for Energy Efficiency and Renewable Energy Page 6University of Massachusetts at Amherst
Executive Office of Environmental Affairs (STEP)
The Executive Office of Environmental Affairs was responsible for oversight and coordination of theevaluation and issuance of the final report. EOEA was responsible for coordination of project reviewand assistance in delivery and preparation of a demonstration project case study. Massachusetts DEPprovided oversight on regulatory requirements through the regional BWSC coordinator. DEPparticipated in site visits and review of analytical results and report preparation.
Significance of Work
National attention to environmental pollution has led to new treatment technologies. In particular,removal of contaminants from groundwater is of significant importance as having immediate impact onother water quality issues. However much of the technology which has been developed requiressignificant capital investment, may be of uncertain efficacy, and may be labor intensive or impractical forcertain applications. On-site incineration may not be a practical. Off-site incineration of collectedPolyGuard has been identified as a suitable candidate for fuel blending at cogeneration and incinerationfacilities capable of handling these materials. Direct landfilling of spent PolyGuard would require specialconditions as would be required for any adsorbent/absorbent containing similar contaminants.
The most common technique for treating contaminated groundwater is to pump the water out of theground and treat through granulated activated carbon (GAC) beds either in liquid or vapor forms (USEPA, 1997). However, this method often has severe limitations when used in treating water-solubleorganic compounds, biologically active groundwater systems and water with high iron or manganeseconcentrations. Numerous innovative treatment schemes are employed successfully for remediatingcontaminated groundwater. However, startup time, operation and maintenance, and user and regulatoryacceptance are detractors to novel methodologies. The system utilized in this study is innovative since itcapable of treating contaminants that GAC cannot and is operationally similar to GAC in setup andO&M. This affords rapid implementation and well defined performance characteristics, two key factorsfor user acceptance. Reduced cost per pound of removed contaminant and disposal are important forsystem utilization.
State Environmental Objectives
In Massachusetts, clean up of contaminated sites under the Massachusetts Contingency Plan (MCP) – 310CMR 40.0000 is performance based. This allows innovative technologies to be utilized where theirperformance meets the minimum criteria. Pump and treat remediation of gasoline contamination isrequired to meet specific effluent concentrations prior to discharge. Under the conditions of a ReleaseAbatement Measure (RAM), as was the case on this study site, discharge levels were set by the USEPAunder a National Pollution Discharge Elimination Discharge System (NPDES) Permit Exclusion. Underthis Exclusion Permit, limits are as follows: TPH (Total Petroleum Hydrocarbons)– 5000 ug/L, Benzene –5 ug/L, BTEX (Benzene, Toluene, Ethyl Benzene, and Xylenes) - 100 ug/L, and MTBE (Methyl TertiaryButyl Ether)– 70 ug/L.
Specific Project Environmental Objectives
Site Characterization
The site is a gasoline release at gas station (Figure 3) with high levels of MTBE and BTEX.Contaminant levels are reported in Table 3 below. Specific details of the proposed test site includingthe site plan and location, hydrology, complete groundwater organic and inorganic analysis are

Guardian Environmental Technologies Inc. Technology Demonstration
Center for Energy Efficiency and Renewable Energy Page 7University of Massachusetts at Amherst
included in Appendix C, the Remediation Abatement Measure Proposal, date July, 1997. Details ofthe site status prior to and during the demonstration are included in Appendix C, Status update of theRemediation Abatement Measure Proposal, date April 1998. Contaminant concentrate levels arepresented in Table 3.
Figure 3: Site of Gasoline spill in Bellingham, Massachusetts, 1997.
Table 3. Initial level of contaminants at proposed site.
Contaminant Concentration (mg/L)
BTEX 75MTBE 125TPH (Included in BTEX)
Site Description
Environmental Compliance Services, Inc. (ECS) prepared a Release Abatement Measure (RAM)status report summarizing activities which took place at the B & D Petroleum Sales Facility located at220 South Main Street in Bellingham, Massachusetts (here-in-after referred to as the Site). Thisreport discussed remedial operations associated with the groundwater recovery and treatment system(GTS), GTS sampling and analysis results, and monitoring of the groundwater quality at the Sitesince the implementation of the RAM modification in August, 1997.
Product Demonstration Objectives
This experimental pilot program was conducted in conjunction with the Commonwealth of MassachusettsStrategic Envirotechnology Partnership (STEP). The primary objectives of this pilot were: i) todemonstrate removal of organic compounds associated with gasoline contaminated ground water utilizingPolyGuard absorbent ii) to quantify the absorption potential of PolyGuard specifically for MTBE inconjunction with other organic contaminants associated with gasoline contaminated ground water, iii) toquantify the absorption potential of PolyGuard for BTEX compounds, iv) to evaluate the stability of the
Guardian Environmental Technologies Inc. Technology Demonstration
Center for Energy Efficiency and Renewable Energy Page 8University of Massachusetts at Amherst
spent PolyGuard material providing information on disposal alternatives, and v) to monitor the hydraulicperformance of PolyGuard under pump and treat remediation operation.
The final effluent concentration must be below the requirement mandated by the USEPA NPDES PermitExclusion. This goal was to be achieved using PolyGuard in conjunction with a granulated activatedcarbon (GAC) finish filter or other equivalent technology. Performance of the PolyGuard system wasjudged on its ability to trap contaminants in large quantities and extend the life of the final polishing filter.
In this pilot, the target contaminant was MTBE, which has a lower affinity for PolyGuard than other non-polar contaminants. BTEX was a secondary target contaminant. As such, an absorption capacity 75% forMTBE was used as a goal in the design calculations. This value was based on previous laboratory tests.The absorption "rate" was estimated at 60%. A capacity of 150% was calculated for the BTEX portionsof the influent with a removal rate of 99%. These rates were expected to vary due to fluctuations in flowrates and concentration levels, but are considered the target performance goals.
Experimental Methodology
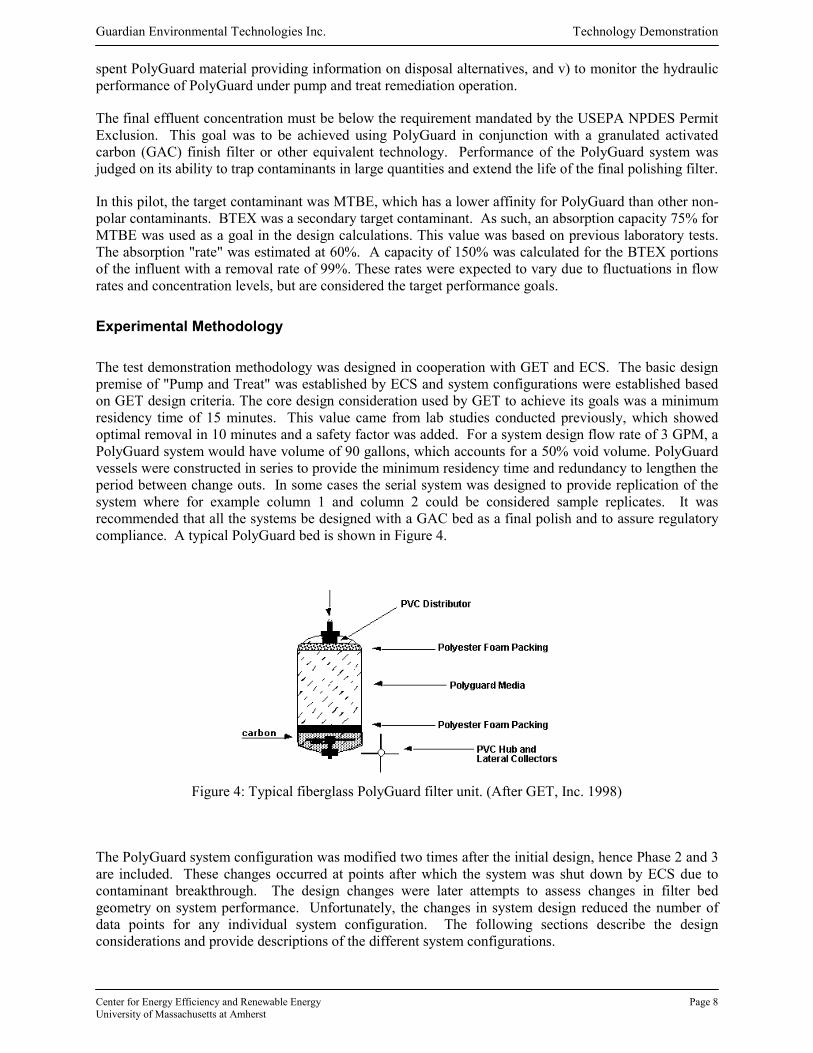
The test demonstration methodology was designed in cooperation with GET and ECS. The basic designpremise of "Pump and Treat" was established by ECS and system configurations were established basedon GET design criteria. The core design consideration used by GET to achieve its goals was a minimumresidency time of 15 minutes. This value came from lab studies conducted previously, which showedoptimal removal in 10 minutes and a safety factor was added. For a system design flow rate of 3 GPM, aPolyGuard system would have volume of 90 gallons, which accounts for a 50% void volume. PolyGuardvessels were constructed in series to provide the minimum residency time and redundancy to lengthen theperiod between change outs. In some cases the serial system was designed to provide replication of thesystem where for example column 1 and column 2 could be considered sample replicates. It wasrecommended that all the systems be designed with a GAC bed as a final polish and to assure regulatorycompliance. A typical PolyGuard bed is shown in Figure 4.
Figure 4: Typical fiberglass PolyGuard filter unit. (After GET, Inc. 1998)
The PolyGuard system configuration was modified two times after the initial design, hence Phase 2 and 3are included. These changes occurred at points after which the system was shut down by ECS due tocontaminant breakthrough. The design changes were later attempts to assess changes in filter bedgeometry on system performance. Unfortunately, the changes in system design reduced the number ofdata points for any individual system configuration. The following sections describe the designconsiderations and provide descriptions of the different system configurations.
Guardian Environmental Technologies Inc. Technology Demonstration
Center for Energy Efficiency and Renewable Energy Page 9University of Massachusetts at Amherst
System Design Considerations
Each PolyGuard system design was configured and predicted absorption capacity was used tocalculate bed life. The table in Appendix A illustrates the design calculations for the Phase 3 systemconfiguration. Phase 1 and Phase 2 sizing was based on similar tables (not provided). Contaminantconcentrations from the Bellingham site (Table 3) were used in the bed life calculations. Thecontaminant loading used for bed life prediction was calculated as the sum of MTBE, BTEX, plus40% of the BTEX and MTBE concentrations (an estimate of TPH).
Consideration was given to potential competitive absorption, expected to occur at lower contaminantconcentrations. Absorption capacity and rate were calculated separately. The removal efficiencies ofPolyGuard for TPH, BTEX and MTBE were expected to be different, based on previous experienceand known chemical characteristics. It was considered that performance of the absorption system, asmeasured by removal of BTEX or MTBE alone, would underestimate total hydrocarbon absorptioncapacity. However, under field test conditions, this factor could not be controlled.
In order to utilize the full capacity of the PolyGuard bed, the system configuration was to includevessels in series. The first column was expected to remove most of the BTEX constituents at a rate of99% and at a capacity of 1.5 lbs./lb. BTEX and TPH fractions are readily absorbed by PolyGuard,more than MTBE, and should be removed first. Using this configuration, the first vessel or vesselswere expected to remove BTEX and TPH and little MTBE. The subsequent columns were expectedto be capable of removing a predicted amount of MTBE. As the initial vessels became exhausted, thesubsequent columns were expected to experience shorter bed life. With the objective to describe massloading capacity, the expended columns were not be rebedded until the last set of column had reachedsaturation.
A liquid phase carbon vessel in series was recommended for use after the PolyGuard vessels as apolisher and safeguard against exceeding the NPDES permit conditions should breakthrough occurprior to predicted bed life.
The calculations used in sizing the system are based on approximations of relative absorptioncapacity. Estimated bed life for MTBE, BTEX, and other constituents are listed in the Appendix A
Process Stream and Sampling Locations
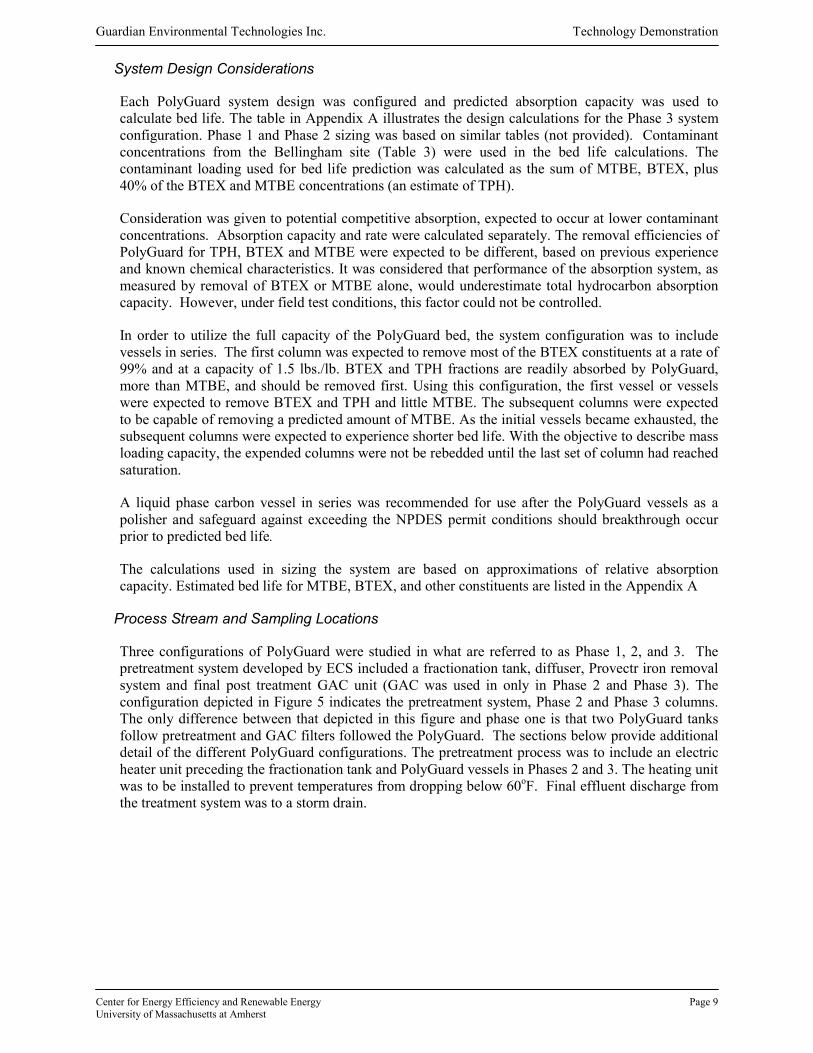
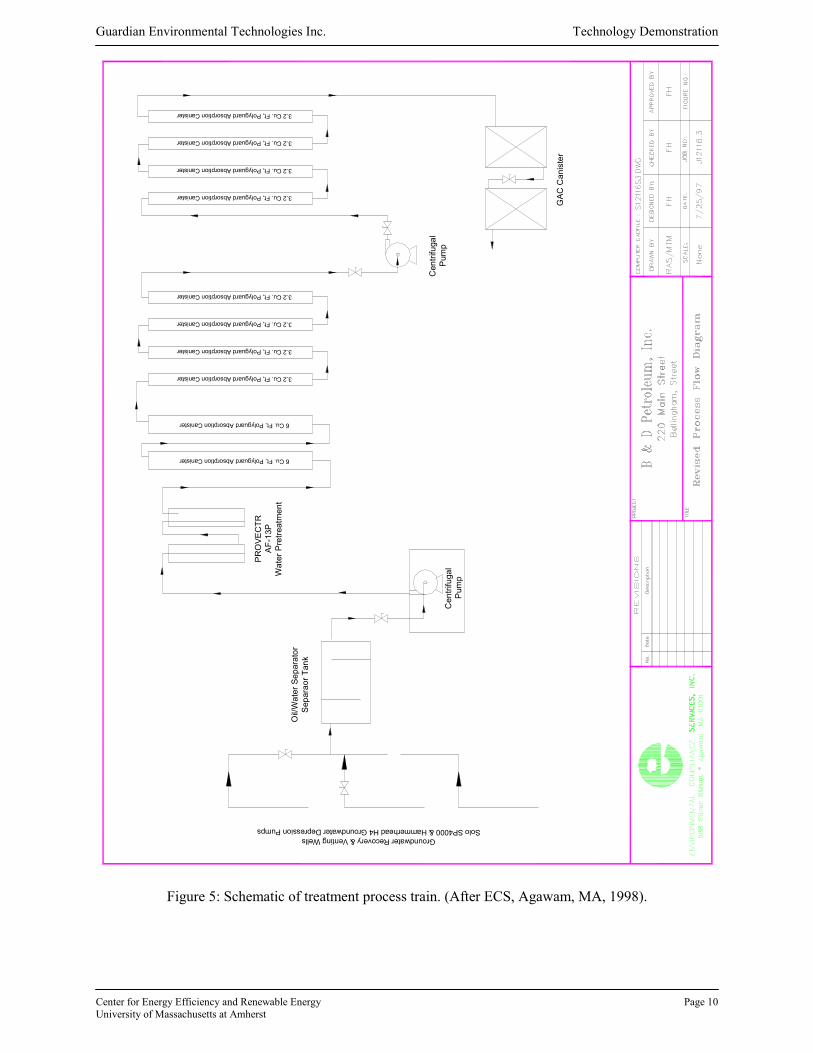
Three configurations of PolyGuard were studied in what are referred to as Phase 1, 2, and 3. Thepretreatment system developed by ECS included a fractionation tank, diffuser, Provectr iron removalsystem and final post treatment GAC unit (GAC was used in only in Phase 2 and Phase 3). Theconfiguration depicted in Figure 5 indicates the pretreatment system, Phase 2 and Phase 3 columns.The only difference between that depicted in this figure and phase one is that two PolyGuard tanksfollow pretreatment and GAC filters followed the PolyGuard. The sections below provide additionaldetail of the different PolyGuard configurations. The pretreatment process was to include an electricheater unit preceding the fractionation tank and PolyGuard vessels in Phases 2 and 3. The heating unitwas to be installed to prevent temperatures from dropping below 60oF. Final effluent discharge fromthe treatment system was to a storm drain.
Guardian Environmental Technologies Inc. Technology Demonstration
Center for Energy Efficiency and Renewable Energy Page 10University of Massachusetts at Amherst
6 Cu. Ft, Polyguard Absorption Canister
Solo SP4000 & Hammerhead H4 Groundwater Depression PumpsGroundwater Recovery & Venting Wells
3.2 Cu. Ft, Polyguard Absorption Canister
3.2 Cu. Ft, Polyguard Absorption Canister
3.2 Cu. Ft, Polyguard Absorption Canister
3.2 Cu. Ft, Polyguard Absorption Canister
3.2 Cu. Ft, Polyguard Absorption Canister
3.2 Cu. Ft, Polyguard Absorption Canister
3.2 Cu. Ft, Polyguard Absorption Canister
3.2 Cu. Ft, Polyguard Absorption Canister
6 Cu. Ft, Polyguard Absorption Canister
Cen
trifu
gal
Pum
pC
entri
fuga
lP
ump
GAC
Can
iste
r
PRO
VEC
TRAF
-13P
Wat
er P
retre
atm
ent
Oil/
Wat
er S
epar
ator
Sepa
raor
Tan
k
Figure 5: Schematic of treatment process train. (After ECS, Agawam, MA, 1998).

Guardian Environmental Technologies Inc. Technology Demonstration
Center for Energy Efficiency and Renewable Energy Page 11University of Massachusetts at Amherst
System Operation
The pump and treat system was fully automated and required periodic maintenance compatible with thesampling regime. Normal inspection included checking that pumps and timer programs were operational.Some issues regarding cold weather required more periodic inspections and system shut down wasreported several times in the attached RAM reports (Appendix C and D). System checks occurred duringsample collection. Pumping operations were designed to follow standard pumping rates for containmentof the pollutant plume. Under this pilot, pumping volumes were controlled by groundwater elevations inthe recovery wells. For this reason pump operation was periodic but total flows were monitored using atotalizer flow meter. Personnel responsible for operating the system also collected samples, transportedsamples to the analytical laboratory, and reported system operations.
A system operation milestone was considered when PolyGuard absorber influent and effluentconcentrations were approximately equal, when static conditions were observed (i.e. no change inabsorption rates or capacity) or when USEPA NPDES Permit Exclusion requirements mandated a changein the remedial action plan. The term “breakthrough” was loosely defined for the purposes of this study asthe condition where influent and effluent concentrations were within 10% of each other on threeconsecutive sampling events or where analytical measures were insufficient to distinguish differencesbetween samples.
The following are descriptions of the three system iterations used throughout the pilot demonstrationsultimately resulting in the flow system illustrated in Figure 5 above.
Phase 1
Phase 1 of the pilot was conducted with two standard 110-gallon drums containing 11 cubic feet eachor a total of 418 pounds of PolyGuard. Hereafter these vessels are referred to as GET 1 and GET 2.The PolyGuard material was placed in the drums and held in place with a steel filter, which was helddown by the steel tank cover, (Figure 6). Influent flow to the tanks was located near the bottom of thetank and effluent discharged through the top. Tubing into and out of the tanks was PVC SCH 40 orequivalent. Sampling ports were positioned at the outlet side of each tank, utilizing a brass valve. Thesystem was constructed and operation began August 25, 1997. Samples were collected on 5 datebetween August 25 and September 6. The system was shut down after September 6, 1997 onceanalytical data showed the system was discharging beyond regulatory limits. This response was duein part to the contractor’s failure to construct a GAC unit after the PolyGuard units as was specified inthe pilot protocol.
Figure 6: Phase 1 test showing screen on top of PolyGuard Media.
Guardian Environmental Technologies Inc. Technology Demonstration
Center for Energy Efficiency and Renewable Energy Page 12University of Massachusetts at Amherst
Phase 2
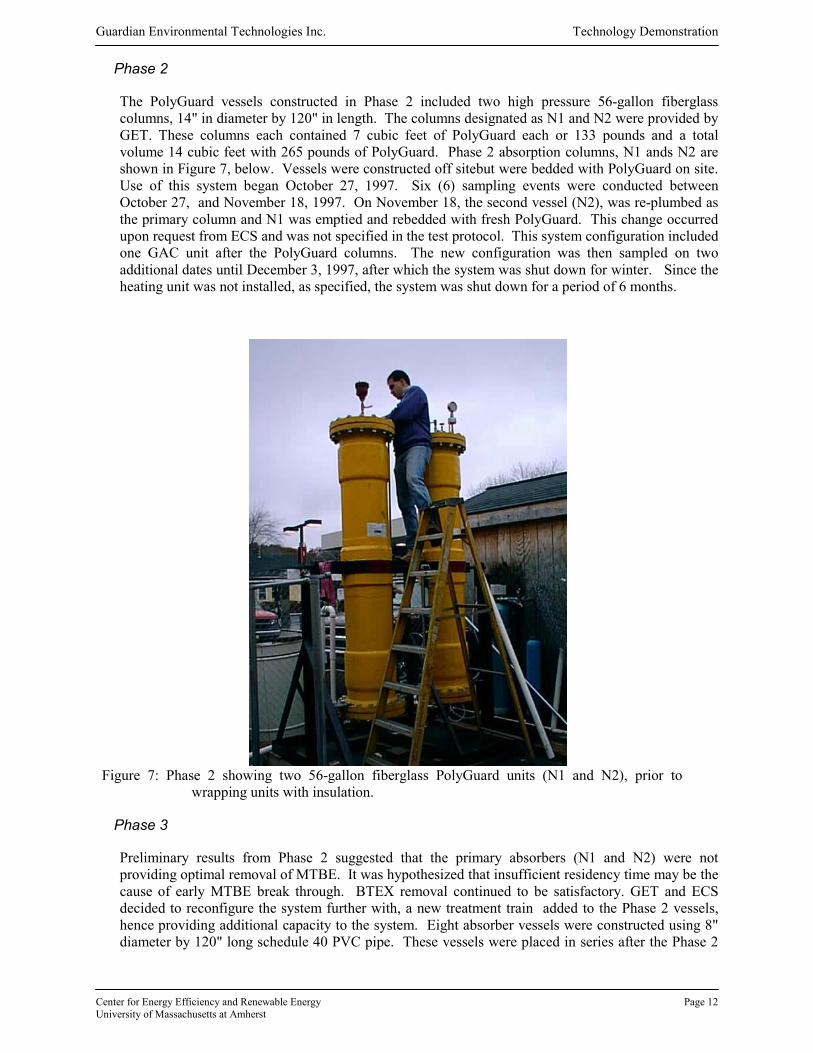
The PolyGuard vessels constructed in Phase 2 included two high pressure 56-gallon fiberglasscolumns, 14" in diameter by 120" in length. The columns designated as N1 and N2 were provided byGET. These columns each contained 7 cubic feet of PolyGuard each or 133 pounds and a totalvolume 14 cubic feet with 265 pounds of PolyGuard. Phase 2 absorption columns, N1 ands N2 areshown in Figure 7, below. Vessels were constructed off sitebut were bedded with PolyGuard on site.Use of this system began October 27, 1997. Six (6) sampling events were conducted betweenOctober 27, and November 18, 1997. On November 18, the second vessel (N2), was re-plumbed asthe primary column and N1 was emptied and rebedded with fresh PolyGuard. This change occurredupon request from ECS and was not specified in the test protocol. This system configuration includedone GAC unit after the PolyGuard columns. The new configuration was then sampled on twoadditional dates until December 3, 1997, after which the system was shut down for winter. Since theheating unit was not installed, as specified, the system was shut down for a period of 6 months.
Figure 7: Phase 2 showing two 56-gallon fiberglass PolyGuard units (N1 and N2), prior towrapping units with insulation.
Phase 3
Preliminary results from Phase 2 suggested that the primary absorbers (N1 and N2) were notproviding optimal removal of MTBE. It was hypothesized that insufficient residency time may be thecause of early MTBE break through. BTEX removal continued to be satisfactory. GET and ECSdecided to reconfigure the system further with, a new treatment train added to the Phase 2 vessels,hence providing additional capacity to the system. Eight absorber vessels were constructed using 8"diameter by 120" long schedule 40 PVC pipe. These vessels were placed in series after the Phase 2

Guardian Environmental Technologies Inc. Technology Demonstration
Center for Energy Efficiency and Renewable Energy Page 13University of Massachusetts at Amherst
vessels. These vessels are referred to as E1 through E8 and are shown in Figure 8. Each PVC columnhad a bed load volume of 2.8 cubic feet filled with 52.8 pounds of PolyGuard. A stainless steelbooster pump was installed between vessels E4 and E5 to provide additional linear velocity lost dueto pressure drops. This system configuration also included two GAC units installed after thePolyGuard columns, as was recommended in the test protocol. It was anticipated that during thisphase multiple columns could be considered replicates for the purposes of quantifying absorptionrates and capacities. However, loading rates would be an additional variable for which there would beno control. Each vessel therefore was fitted with sampling ports at the inlet and one at the outlet ofE8 and the GAC units.
Figure 8: Phase 3 pilot absorption beds shown in mounting rack during construction.
Bed size was calculated for the design flow rate and a residency time of at least 15 to 20 minutes based onbed volume. The total bed size in Phase 3 of this test was 41 cubic feet or 779 pounds, including the Ncolumns, 473 pounds in the ECS columns. The two N columns (N2 and N3) were left online since theycontinued to provide effective BTEX removal.
Sampling and Analysis
The sampling protocol specified that influent and effluent contaminant concentrations would bequantified at multiple positions in the treatment train. These data were to be used to calculate theabsorption capacity of PolyGuard (Objectives 1, 2, and 3). These data were also to be used tocharacterize the relative rates of absorption and suitability of residency time specified for the material.The sampling frequency was designed to establish when absorption equilibrium is reached as well aschanges in absorption as the PolyGuard material became saturated. Instantaneous flow rate (gal/min) weremonitored at each sampling event and mass flow (total gallons) was monitored using a continuous flowmeter (totalizer) and recorded at each sampling period (Objective 5). Flow rates reported in this study donot reflect the instantaneous flow rates since these data were unreliable. The flow rates reported areaverages, calculated from the mass flow volume divided by the total time (including on and off pumpingcycles. This result suggests that instantaneous flow rates are likely to be higher than average flow rates.
Guardian Environmental Technologies Inc. Technology Demonstration
Center for Energy Efficiency and Renewable Energy Page 14University of Massachusetts at Amherst
Sample Locations
Water samples were taken on the influent and effluent side of each set of contactors and the effluentside of the GAC filter beds when used (Phase 2 and 3). Phase 1 sampling was at the inlet side of thePolyGuard beds (GET1), between the two beds, and at the outlet of the second PolyGuard bed(GET2). Phase 2 sampling was at the inlet to the first N bed (N1), between the two N beds, at theoutlet of the second N bed (N2) and at the outlet of the GAC unit. Phase 3 sampling was modified toallow for fewer samples initially. The influent samples were taken prior to N1 (influent), after N2,after the ECS columns E1, E2, E4 (to include E3 and E4), E7, E8, and after the GAC unit. Initialanalysis during Phase 3 was limited to influent, N2 and ECS 1, 4, 7 for the initial sampling periodssince breakthrough was not observed. Sampling E2 began on the third sample date and E8 on theeighth sampling period. Sampling between the N beds never occurred during Phase 3.
Sample Frequency
Sampling frequency was required to follow the minimum specified by the USEPA NPDES PermitExclusion. Upon startup, influent and effluent samples will be taken every other day for the firstweek (3 samples). This level of sampling was necessary to establish that equilibrium conditions weremet. After the first week, samples were to be taken every 5 days for the duration of the test. The 5-day interval was determined to provide an acceptable relative error in calculating the absorption ratiousing sensitivity analysis described below.
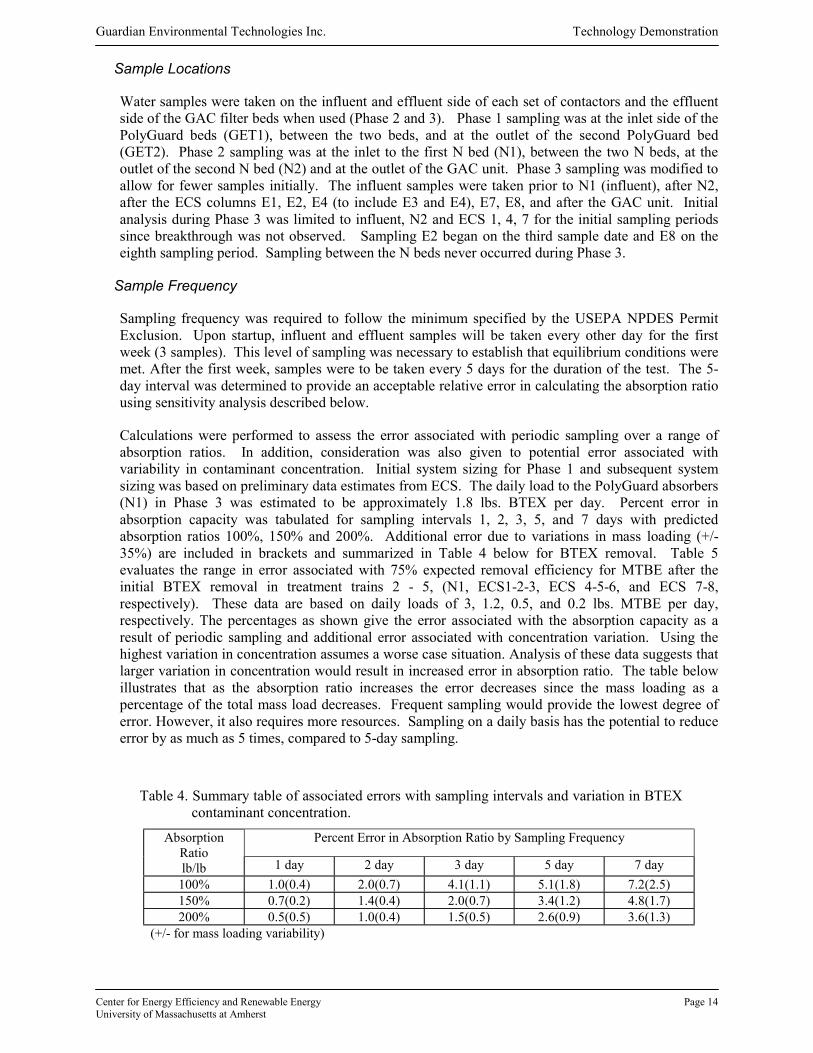
Calculations were performed to assess the error associated with periodic sampling over a range ofabsorption ratios. In addition, consideration was also given to potential error associated withvariability in contaminant concentration. Initial system sizing for Phase 1 and subsequent systemsizing was based on preliminary data estimates from ECS. The daily load to the PolyGuard absorbers(N1) in Phase 3 was estimated to be approximately 1.8 lbs. BTEX per day. Percent error inabsorption capacity was tabulated for sampling intervals 1, 2, 3, 5, and 7 days with predictedabsorption ratios 100%, 150% and 200%. Additional error due to variations in mass loading (+/-35%) are included in brackets and summarized in Table 4 below for BTEX removal. Table 5evaluates the range in error associated with 75% expected removal efficiency for MTBE after theinitial BTEX removal in treatment trains 2 - 5, (N1, ECS1-2-3, ECS 4-5-6, and ECS 7-8,respectively). These data are based on daily loads of 3, 1.2, 0.5, and 0.2 lbs. MTBE per day,respectively. The percentages as shown give the error associated with the absorption capacity as aresult of periodic sampling and additional error associated with concentration variation. Using thehighest variation in concentration assumes a worse case situation. Analysis of these data suggests thatlarger variation in concentration would result in increased error in absorption ratio. The table belowillustrates that as the absorption ratio increases the error decreases since the mass loading as apercentage of the total mass load decreases. Frequent sampling would provide the lowest degree oferror. However, it also requires more resources. Sampling on a daily basis has the potential to reduceerror by as much as 5 times, compared to 5-day sampling.
Table 4. Summary table of associated errors with sampling intervals and variation in BTEXcontaminant concentration.
Percent Error in Absorption Ratio by Sampling FrequencyAbsorptionRatiolb/lb 1 day 2 day 3 day 5 day 7 day
100% 1.0(0.4) 2.0(0.7) 4.1(1.1) 5.1(1.8) 7.2(2.5)150% 0.7(0.2) 1.4(0.4) 2.0(0.7) 3.4(1.2) 4.8(1.7)200% 0.5(0.5) 1.0(0.4) 1.5(0.5) 2.6(0.9) 3.6(1.3)
(+/- for mass loading variability)
Guardian Environmental Technologies Inc. Technology Demonstration
Center for Energy Efficiency and Renewable Energy Page 15University of Massachusetts at Amherst
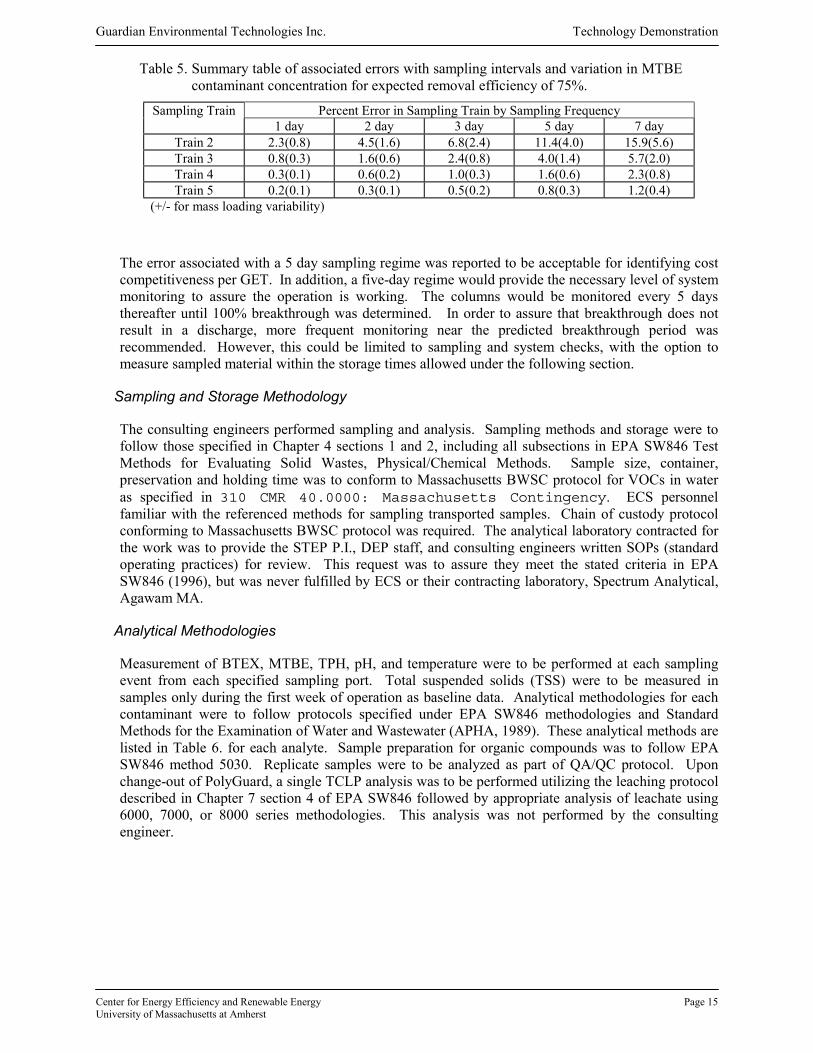
Table 5. Summary table of associated errors with sampling intervals and variation in MTBEcontaminant concentration for expected removal efficiency of 75%.
Sampling Train Percent Error in Sampling Train by Sampling Frequency1 day 2 day 3 day 5 day 7 day
Train 2 2.3(0.8) 4.5(1.6) 6.8(2.4) 11.4(4.0) 15.9(5.6)Train 3 0.8(0.3) 1.6(0.6) 2.4(0.8) 4.0(1.4) 5.7(2.0)Train 4 0.3(0.1) 0.6(0.2) 1.0(0.3) 1.6(0.6) 2.3(0.8)Train 5 0.2(0.1) 0.3(0.1) 0.5(0.2) 0.8(0.3) 1.2(0.4)
(+/- for mass loading variability)
The error associated with a 5 day sampling regime was reported to be acceptable for identifying costcompetitiveness per GET. In addition, a five-day regime would provide the necessary level of systemmonitoring to assure the operation is working. The columns would be monitored every 5 daysthereafter until 100% breakthrough was determined. In order to assure that breakthrough does notresult in a discharge, more frequent monitoring near the predicted breakthrough period wasrecommended. However, this could be limited to sampling and system checks, with the option tomeasure sampled material within the storage times allowed under the following section.
Sampling and Storage Methodology
The consulting engineers performed sampling and analysis. Sampling methods and storage were tofollow those specified in Chapter 4 sections 1 and 2, including all subsections in EPA SW846 TestMethods for Evaluating Solid Wastes, Physical/Chemical Methods. Sample size, container,preservation and holding time was to conform to Massachusetts BWSC protocol for VOCs in wateras specified in 310 CMR 40.0000: Massachusetts Contingency. ECS personnelfamiliar with the referenced methods for sampling transported samples. Chain of custody protocolconforming to Massachusetts BWSC protocol was required. The analytical laboratory contracted forthe work was to provide the STEP P.I., DEP staff, and consulting engineers written SOPs (standardoperating practices) for review. This request was to assure they meet the stated criteria in EPASW846 (1996), but was never fulfilled by ECS or their contracting laboratory, Spectrum Analytical,Agawam MA.
Analytical Methodologies
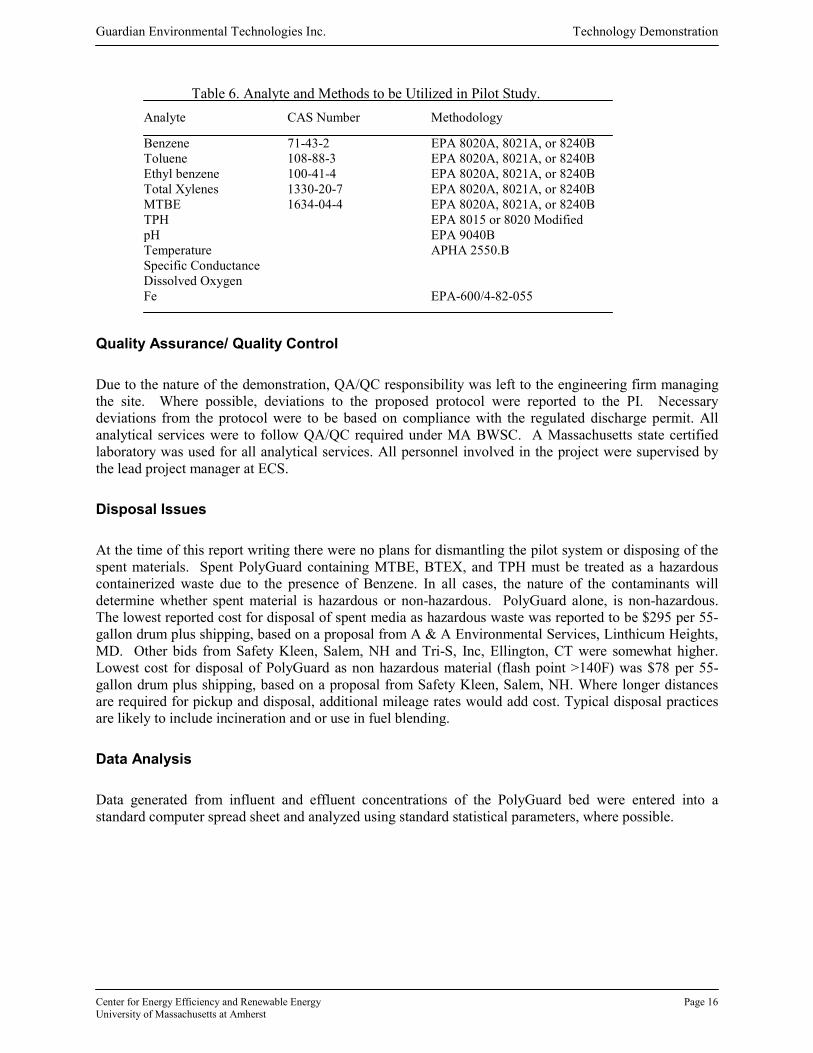
Measurement of BTEX, MTBE, TPH, pH, and temperature were to be performed at each samplingevent from each specified sampling port. Total suspended solids (TSS) were to be measured insamples only during the first week of operation as baseline data. Analytical methodologies for eachcontaminant were to follow protocols specified under EPA SW846 methodologies and StandardMethods for the Examination of Water and Wastewater (APHA, 1989). These analytical methods arelisted in Table 6. for each analyte. Sample preparation for organic compounds was to follow EPASW846 method 5030. Replicate samples were to be analyzed as part of QA/QC protocol. Uponchange-out of PolyGuard, a single TCLP analysis was to be performed utilizing the leaching protocoldescribed in Chapter 7 section 4 of EPA SW846 followed by appropriate analysis of leachate using6000, 7000, or 8000 series methodologies. This analysis was not performed by the consultingengineer.
Guardian Environmental Technologies Inc. Technology Demonstration
Center for Energy Efficiency and Renewable Energy Page 16University of Massachusetts at Amherst
Table 6. Analyte and Methods to be Utilized in Pilot Study.Analyte CAS Number Methodology
Benzene 71-43-2 EPA 8020A, 8021A, or 8240BToluene 108-88-3 EPA 8020A, 8021A, or 8240BEthyl benzene 100-41-4 EPA 8020A, 8021A, or 8240BTotal Xylenes 1330-20-7 EPA 8020A, 8021A, or 8240BMTBE 1634-04-4 EPA 8020A, 8021A, or 8240BTPH EPA 8015 or 8020 ModifiedpH EPA 9040BTemperature APHA 2550.BSpecific ConductanceDissolved OxygenFe EPA-600/4-82-055
Quality Assurance/ Quality Control
Due to the nature of the demonstration, QA/QC responsibility was left to the engineering firm managingthe site. Where possible, deviations to the proposed protocol were reported to the PI. Necessarydeviations from the protocol were to be based on compliance with the regulated discharge permit. Allanalytical services were to follow QA/QC required under MA BWSC. A Massachusetts state certifiedlaboratory was used for all analytical services. All personnel involved in the project were supervised bythe lead project manager at ECS.
Disposal Issues
At the time of this report writing there were no plans for dismantling the pilot system or disposing of thespent materials. Spent PolyGuard containing MTBE, BTEX, and TPH must be treated as a hazardouscontainerized waste due to the presence of Benzene. In all cases, the nature of the contaminants willdetermine whether spent material is hazardous or non-hazardous. PolyGuard alone, is non-hazardous.The lowest reported cost for disposal of spent media as hazardous waste was reported to be $295 per 55-gallon drum plus shipping, based on a proposal from A & A Environmental Services, Linthicum Heights,MD. Other bids from Safety Kleen, Salem, NH and Tri-S, Inc, Ellington, CT were somewhat higher.Lowest cost for disposal of PolyGuard as non hazardous material (flash point >140F) was $78 per 55-gallon drum plus shipping, based on a proposal from Safety Kleen, Salem, NH. Where longer distancesare required for pickup and disposal, additional mileage rates would add cost. Typical disposal practicesare likely to include incineration and or use in fuel blending.
Data Analysis
Data generated from influent and effluent concentrations of the PolyGuard bed were entered into astandard computer spread sheet and analyzed using standard statistical parameters, where possible.

Guardian Environmental Technologies Inc. Technology Demonstration
Center for Energy Efficiency and Renewable Energy Page 17University of Massachusetts at Amherst
RESULTS
Results from this pilot demonstration are reported for the period between August 25, 1997 and December24, 1998. During this period treated groundwater volume and contaminant concentrations weremonitored to assess the removal efficiency and mass removal capacity of PolyGuard for BTEX andMTBE. The data from this period of monitoring is segregated into three phases, which reflect threedistinct operating conditions on the site. In reporting the results from these tests, deviations from theoriginal system configuration provide somewhat less detailed information on the properties of PolyGuard.These data, however, indicate trends that may be useful for developing additional field models. In thisanalysis the data are better described as qualitative, since the planned replication of operating conditionsdid not occur controlled statistical comparisons were not possible.
Five primary objectives were established for this study. Based on data quality and quantity four of theobjectives had sufficient data to be discussed in this report. The table below illustrates the objectives andcompletion status.
Table 7. Objectives and Completion Status.
Objective Completed
1 Demonstrate removal of organic compounds associated withgasoline contaminated ground water utilizing PolyGuard
Yes
2 Quantify the absorption potential of PolyGuard specificallyfor MTBE in conjunction with other organic contaminants
Yes
3 Quantify the absorption potential of PolyGuard for BTEXcompounds,
Yes
4 Evaluate the stability of the spent PolyGuard materialproviding information on disposal alternatives, and
No
5 Monitor the hydraulic performance of PolyGuard under pumpand treat remediation operation.
Yes
Detailed descriptions of system operating conditions and sampling data are included in Appendices C andD of this document. The following results are based on data reported in those Appendices. Additionaldata tables are presented in Appendix B, from which the following analysis is based. A summary of theoperating concentrations and flow rates is presented in Table 8, below.
Table 8. Average operating conditions for each test Phase. (s = Standard Deviation)
Average Influent Concentration and Standard Deviation (mg/L)Test
MTBE BTEXAverage Flow Rate
(GPM)
Phase 1 263 (s=147) 36 (s=25.3) 0.98
Phase 2 86 (s=24.8) 33 (s=10.8) 0.63
Phase 3 38 (s=14) 15 (s=7.1) 0.44

Guardian Environmental Technologies Inc. Technology Demonstration
Center for Energy Efficiency and Renewable Energy Page 18University of Massachusetts at Amherst
Phase 1
Phase 1 of the pilot demonstration operated between August 25, 1997 and September 6, 1997 usingPolyGuard vessels GET 1 and GET 2. Initial operation began August 25, 1997 and five samplingevents were carried out prior to system shutdown. Mass flow to the system was 22,203 gallons. Therange of flow rates recorded at each of the 4 sampling dates after startup was 0.56 to 2.0 GPM with anaverage flow of 0.98 GPM over the duration of the test. Average flow was approximate one half thedesign flow. However, average flow during the test does not reflect the actual flow during pumpingcycles.
Influent MTBE concentrations ranged from 133 to 438 mg/L. Average MTBE influent concentrationover the sampling period was 263 mg/L (n=5). Effluent MTBE concentrations from the first andsecond 110-gallon PolyGuard tanks (GET 1 and GET 2) ranged from non-detect out of GET 2 on thesecond sampling date to 70 mg/L out of GET 1 on the last sampling date. Figure 9 illustrates theinfluent and effluent concentrations and removal efficiency over the course of the test.
Figure 9: Phase 1 MTBE concentrations and removal efficiency.
PolyGuard system removal efficiency for MTBE decreased during the course of the test from 100%to 71% at the close. Average column mass removal efficiency during this test was 56% and 78% forGET 1 and GET 2, respectively. Mass removal was calculated by interpolating the mass loadingbetween the target sampling period and the prior period, using an average of the concentrationsmultiplied by the volume loading. MTBE mass loading based on this method totaled 66.7 lbs. ofwhich the PolyGuard removed 61.8 lbs. The mass loading to the PolyGuard material wasapproximately 15% on a weight per weight basis. Since the overall system removal efficiency forMTBE exceeded 71% at the close of the test it is possible that the system could achieve a highercapacity than that measured during the test. PolyGuard exhibited “initial breakthrough,” the point atwhich the PolyGuard beds showed a very low removal of MTBE. The termination point as specifiedin the test protocol, or the point at which the effluent and influent concentrations were within 10% orunchanged over 3 consecutive sampling events, was not observed. In addition, the treatment train forthis demonstration, required the use of GAC as a polishing technology for MTBE prior to discharge
0
100000
200000
300000
400000
500000
8/25/97 8/27/97 8/29/97 8/31/97 9/2/97 9/4/97 9/6/97
Date
MTB
E ug
/L
0
0.1
0.2
0.3
0.4
0.5
0.6
0.7
0.8
0.9
1
Rem
oval
Effi
cien
cy
InfluentGET 1GET 2Removal Rate
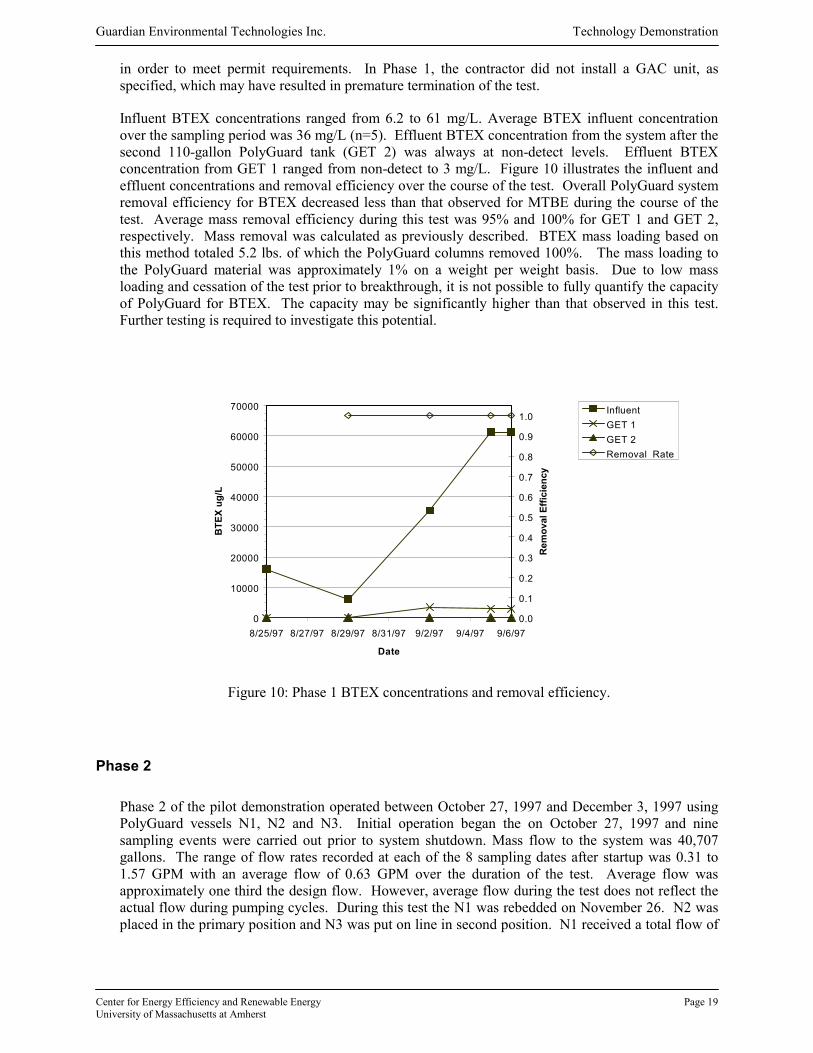
Guardian Environmental Technologies Inc. Technology Demonstration
Center for Energy Efficiency and Renewable Energy Page 19University of Massachusetts at Amherst
in order to meet permit requirements. In Phase 1, the contractor did not install a GAC unit, asspecified, which may have resulted in premature termination of the test.
Influent BTEX concentrations ranged from 6.2 to 61 mg/L. Average BTEX influent concentrationover the sampling period was 36 mg/L (n=5). Effluent BTEX concentration from the system after thesecond 110-gallon PolyGuard tank (GET 2) was always at non-detect levels. Effluent BTEXconcentration from GET 1 ranged from non-detect to 3 mg/L. Figure 10 illustrates the influent andeffluent concentrations and removal efficiency over the course of the test. Overall PolyGuard systemremoval efficiency for BTEX decreased less than that observed for MTBE during the course of thetest. Average mass removal efficiency during this test was 95% and 100% for GET 1 and GET 2,respectively. Mass removal was calculated as previously described. BTEX mass loading based onthis method totaled 5.2 lbs. of which the PolyGuard columns removed 100%. The mass loading tothe PolyGuard material was approximately 1% on a weight per weight basis. Due to low massloading and cessation of the test prior to breakthrough, it is not possible to fully quantify the capacityof PolyGuard for BTEX. The capacity may be significantly higher than that observed in this test.Further testing is required to investigate this potential.
Figure 10: Phase 1 BTEX concentrations and removal efficiency.
Phase 2
Phase 2 of the pilot demonstration operated between October 27, 1997 and December 3, 1997 usingPolyGuard vessels N1, N2 and N3. Initial operation began the on October 27, 1997 and ninesampling events were carried out prior to system shutdown. Mass flow to the system was 40,707gallons. The range of flow rates recorded at each of the 8 sampling dates after startup was 0.31 to1.57 GPM with an average flow of 0.63 GPM over the duration of the test. Average flow wasapproximately one third the design flow. However, average flow during the test does not reflect theactual flow during pumping cycles. During this test the N1 was rebedded on November 26. N2 wasplaced in the primary position and N3 was put on line in second position. N1 received a total flow of
0
10000
20000
30000
40000
50000
60000
70000
8/25/97 8/27/97 8/29/97 8/31/97 9/2/97 9/4/97 9/6/97
Date
BTE
X ug
/L
0.0
0.1
0.2
0.3
0.4
0.5
0.6
0.7
0.8
0.9
1.0
Rem
oval
Effi
cien
cy
InfluentGET 1GET 2Removal Rate
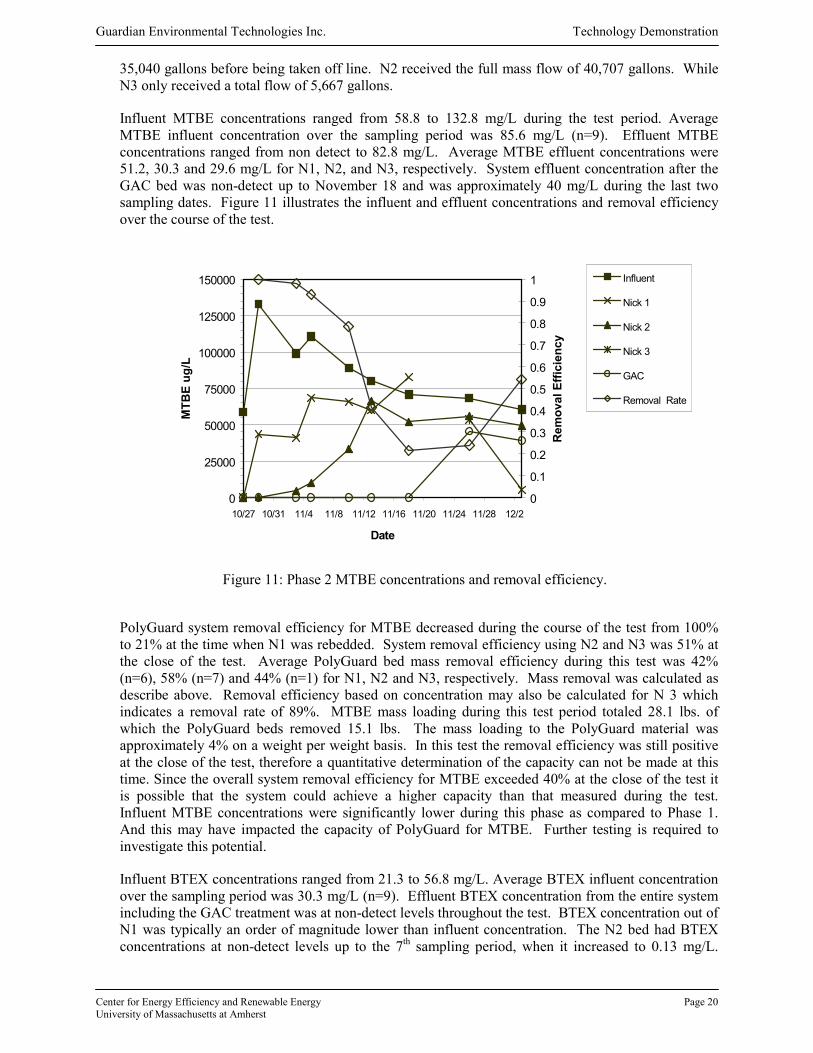
Guardian Environmental Technologies Inc. Technology Demonstration
Center for Energy Efficiency and Renewable Energy Page 20University of Massachusetts at Amherst
35,040 gallons before being taken off line. N2 received the full mass flow of 40,707 gallons. WhileN3 only received a total flow of 5,667 gallons.
Influent MTBE concentrations ranged from 58.8 to 132.8 mg/L during the test period. AverageMTBE influent concentration over the sampling period was 85.6 mg/L (n=9). Effluent MTBEconcentrations ranged from non detect to 82.8 mg/L. Average MTBE effluent concentrations were51.2, 30.3 and 29.6 mg/L for N1, N2, and N3, respectively. System effluent concentration after theGAC bed was non-detect up to November 18 and was approximately 40 mg/L during the last twosampling dates. Figure 11 illustrates the influent and effluent concentrations and removal efficiencyover the course of the test.
Figure 11: Phase 2 MTBE concentrations and removal efficiency.
PolyGuard system removal efficiency for MTBE decreased during the course of the test from 100%to 21% at the time when N1 was rebedded. System removal efficiency using N2 and N3 was 51% atthe close of the test. Average PolyGuard bed mass removal efficiency during this test was 42%(n=6), 58% (n=7) and 44% (n=1) for N1, N2 and N3, respectively. Mass removal was calculated asdescribe above. Removal efficiency based on concentration may also be calculated for N 3 whichindicates a removal rate of 89%. MTBE mass loading during this test period totaled 28.1 lbs. ofwhich the PolyGuard beds removed 15.1 lbs. The mass loading to the PolyGuard material wasapproximately 4% on a weight per weight basis. In this test the removal efficiency was still positiveat the close of the test, therefore a quantitative determination of the capacity can not be made at thistime. Since the overall system removal efficiency for MTBE exceeded 40% at the close of the test itis possible that the system could achieve a higher capacity than that measured during the test.Influent MTBE concentrations were significantly lower during this phase as compared to Phase 1.And this may have impacted the capacity of PolyGuard for MTBE. Further testing is required toinvestigate this potential.
Influent BTEX concentrations ranged from 21.3 to 56.8 mg/L. Average BTEX influent concentrationover the sampling period was 30.3 mg/L (n=9). Effluent BTEX concentration from the entire systemincluding the GAC treatment was at non-detect levels throughout the test. BTEX concentration out ofN1 was typically an order of magnitude lower than influent concentration. The N2 bed had BTEXconcentrations at non-detect levels up to the 7th sampling period, when it increased to 0.13 mg/L.
0
25000
50000
75000
100000
125000
150000
10/27 10/31 11/4 11/8 11/12 11/16 11/20 11/24 11/28 12/2
Date
MTB
E ug
/L
0
0.1
0.2
0.3
0.4
0.5
0.6
0.7
0.8
0.9
1
Rem
oval
Effi
cien
cy
Influent
Nick 1
Nick 2
Nick 3
GAC
Removal Rate
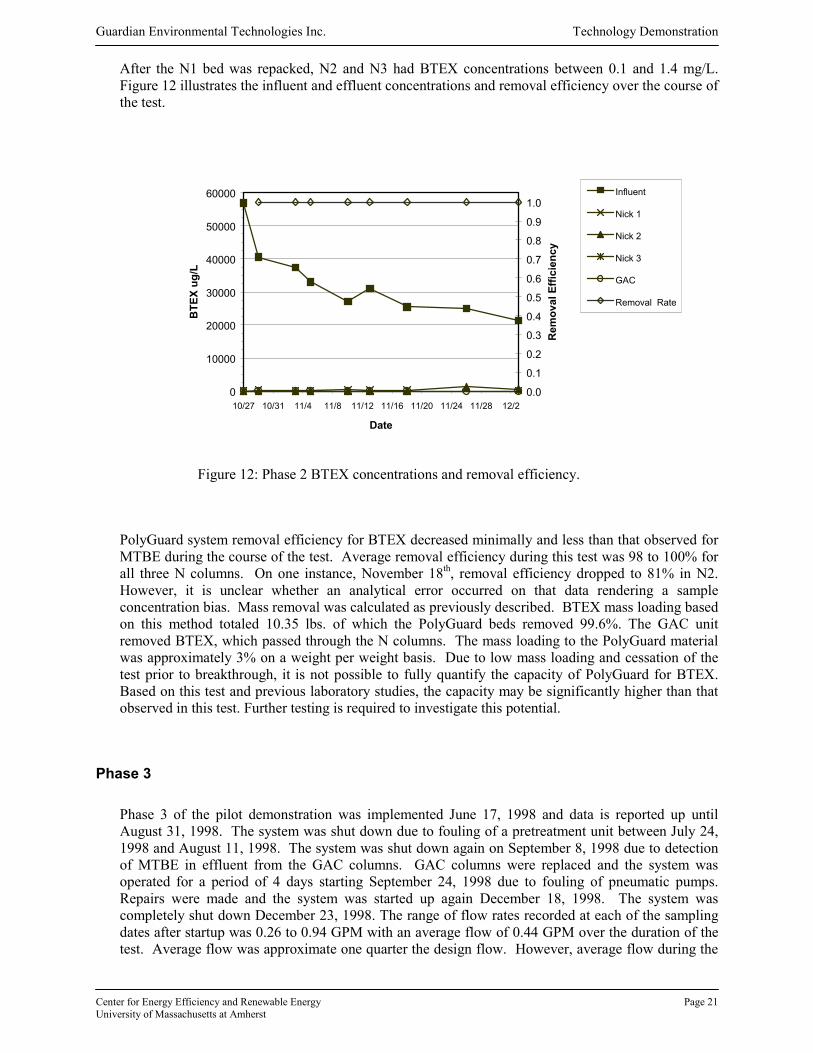
Guardian Environmental Technologies Inc. Technology Demonstration
Center for Energy Efficiency and Renewable Energy Page 21University of Massachusetts at Amherst
After the N1 bed was repacked, N2 and N3 had BTEX concentrations between 0.1 and 1.4 mg/L.Figure 12 illustrates the influent and effluent concentrations and removal efficiency over the course ofthe test.
Figure 12: Phase 2 BTEX concentrations and removal efficiency.
PolyGuard system removal efficiency for BTEX decreased minimally and less than that observed forMTBE during the course of the test. Average removal efficiency during this test was 98 to 100% forall three N columns. On one instance, November 18th, removal efficiency dropped to 81% in N2.However, it is unclear whether an analytical error occurred on that data rendering a sampleconcentration bias. Mass removal was calculated as previously described. BTEX mass loading basedon this method totaled 10.35 lbs. of which the PolyGuard beds removed 99.6%. The GAC unitremoved BTEX, which passed through the N columns. The mass loading to the PolyGuard materialwas approximately 3% on a weight per weight basis. Due to low mass loading and cessation of thetest prior to breakthrough, it is not possible to fully quantify the capacity of PolyGuard for BTEX.Based on this test and previous laboratory studies, the capacity may be significantly higher than thatobserved in this test. Further testing is required to investigate this potential.
Phase 3
Phase 3 of the pilot demonstration was implemented June 17, 1998 and data is reported up untilAugust 31, 1998. The system was shut down due to fouling of a pretreatment unit between July 24,1998 and August 11, 1998. The system was shut down again on September 8, 1998 due to detectionof MTBE in effluent from the GAC columns. GAC columns were replaced and the system wasoperated for a period of 4 days starting September 24, 1998 due to fouling of pneumatic pumps.Repairs were made and the system was started up again December 18, 1998. The system wascompletely shut down December 23, 1998. The range of flow rates recorded at each of the samplingdates after startup was 0.26 to 0.94 GPM with an average flow of 0.44 GPM over the duration of thetest. Average flow was approximate one quarter the design flow. However, average flow during the
0
10000
20000
30000
40000
50000
60000
10/27 10/31 11/4 11/8 11/12 11/16 11/20 11/24 11/28 12/2
Date
BTE
X ug
/L
0.0
0.1
0.2
0.3
0.4
0.5
0.6
0.7
0.8
0.9
1.0
Rem
oval
Effi
cien
cy
Influent
Nick 1
Nick 2
Nick 3
GAC
Removal Rate

Guardian Environmental Technologies Inc. Technology Demonstration
Center for Energy Efficiency and Renewable Energy Page 22University of Massachusetts at Amherst
test does not reflect the actual flow during pumping cycles. Total mass flow pumped though thesystem during this test was 51,951 gallons between June 17, 1998 and August 31, 1998. Whileadditional pumping occurred during 10 days in September and December, these data were notavailable at the time this report was being prepared. For this reason, no water quality data arereported for sampling dates after August 31, 1998. Operational problems after August 31 includedfreezing problems in the ECS units, due to low air temperatures and uninsulated columns. The Nbeds showed no sign of freezing. Additionally, low influent concentrations, significantly differentfrom those measured in Phases 1 and 2 make comparisons difficult.
The system operated in Phase 3 included the Phase 2 N1 and N2 units and the eight ECS units.Eleven sampling events are reported including sampling at startup June 17, 1998. System samplingduring this test was varied and not all sampling points were sampled at each event. Typical samplingoccurred at 7 locations: Influent, N3, ECS 1, ECS 2, ECS 4, ECS 7 and ECS 8. Data from the GACcolumns are not reported for Phase 3. For the purpose of this review, missing data was reported asNR and no estimation was used for calculating removal efficiency or capacity. This analysis willlikely result in a negative bias on performance due to the fact that these missing data occur early on inthis test when absorption would be highest.
Influent MTBE concentrations ranged from 10.6 to 69.2 mg/L. Average MTBE influent concentrationover the sampling period was 38.3 mg/L (n=11). Effluent MTBE concentrations from the Phase 3 N2and N3 (at the N3 effluent port) ranged from 5.6 to 71.7 mg/L. Average MTBE influentconcentration to the ECS columns was 39.6 mg/L. Overall ECS PolyGuard column effluentconcentrations ranged from non-detect to 55.7 mg/L. With average MTBE effluent concentrations forthe test at 27.9, 34.4, 25.5, 11.2 and 8.8 mg/L for ECS 1, ECS 2, ECS 4, ECS 7 and ECS 8,respectively. Figure 13 illustrates the influent and effluent concentrations and removal efficiencyover the course of the test.
Figure 13: Phase 3 MTBE concentrations and removal efficiency.
0
10000
20000
30000
40000
50000
60000
70000
80000
6/15 6/22 6/29 7/6 7/13 7/20 7/27 8/3 8/10 8/17 8/24 8/31
Date
MTB
E ug
/L
0.0
0.1
0.2
0.3
0.4
0.5
0.6
0.7
0.8
0.9
1.0 InfluentN2 outECS E1ECS E2ECS E4ECS E7ECS E8Removal Rate

Guardian Environmental Technologies Inc. Technology Demonstration
Center for Energy Efficiency and Renewable Energy Page 23University of Massachusetts at Amherst
PolyGuard system removal efficiency for MTBE decreased during the course of the test from 100%to 39% at the close. Average system mass removal efficiency during this test was 82%. IndividualECS column efficiency ranged from 95% to values indicating that MTBE was released from thecolumn. While the data is not presumed to be equivocal, what appears to be MTBE contributed fromthe N2 and N3 units may be within error associated with sampling and analysis. The N2 and N3 unitsused in this test did not remove any MTBE on average. MTBE mass loading totaled 14.9 lbs. ofwhich the ECS PolyGuard units removed 13.1 lbs. The mass loading to the PolyGuard material in theECS units ranged from 1 to 7% on a weight per weight basis. The ECS units at the end of the testcontinued to demonstrate absorption removal rates from 8 to 31%. Since the overall system removalefficiency for MTBE was better than 35% at the close of the test, it is possible that the system couldachieve a higher capacity than that measured during the test. Further testing is required to investigatethis potential.
Influent BTEX concentrations ranged from 5.9 to 28.3 mg/L. Average BTEX influent concentrationover the sampling period was 14.6 mg/L (n=11). Effluent BTEX concentrations from the N2 and N3units (at the N3 effluent port) ranged from non-detect to 0.07 mg/L. Average BTEX influentconcentration to the ECS units was less than 0.05 mg/L. ECS PolyGuard unit effluent concentrationsranged from non-detect to 0.05 mg/L. On all but 4 of the 10 sampling dates, past the initial start date,effluent out of ECS 1 was non detect. BTEX concentrations were at non-detect levels on all dates inECS 2, ECS 4, ECS 7 and ECS 8. Overall, analytical testing suggests that most BTEX was removedin the N2 and N3 units and a small portion was removed in ECS 1. Non-detect values reported in theAppendix B indicate method detection limits (MDL) for the sum of benzene, toluene, ethylbenzene,m,p-xylenes, and o-xylene. In some cases the MDL value is large suggesting that comparisons ofnon-detects and zero values is not appropriate. However, for the purposes of this review a non-detectwas considered zero, since it is conservative when estimating removal capacity. In this study non-detect was not considered ½ the MDL. Figure 14 illustrates the influent and effluent concentrationsand removal efficiency over the course of the test.
PolyGuard system removal efficiency for BTEX remained at 100% during the course of the test.Average column mass removal efficiency during this test ranged from 3% to 100%. On more thanone instance the effluent from ECS 1 exceeded the influent from the N2 and N3 units, possibly due tosampling or analytical error. Mass removal was calculated as previously described. BTEX massloading based on this method totaled 6.82 lbs. of which the N2 and N3 units removed 6.81 lbs. Basedon the useful data, apart from the non-detects, it is estimated that the ECS columns removed 0.01 lbs.of BTEX. The mass loading to the PolyGuard material in the system was approximately 1% on aweight per weight basis. The N columns had a slightly higher mass loading rate of 3% on a weightper weight basis. As was the case in Phase 2, the low mass loading to the system and cessation of thetest prior to breakthrough, does not provide suitable information to quantify the capacity ofPolyGuard for BTEX. Based on this test the capacity may be significantly higher than that observedin this test. Further testing is required to investigate this potential.

Guardian Environmental Technologies Inc. Technology Demonstration
Center for Energy Efficiency and Renewable Energy Page 24University of Massachusetts at Amherst
Figure 14: Phase 3 BTEX concentrations and removal efficiency
Test System Analysis
System performance demonstrated removal rates for BTEX up to 100% during the operation of eachof the phases. The removal rates for MTBE were lower ranging from 3% to 100% for any individualcolumn during each interval. While average system removal for MTBE was 91, 41 and 82% forPhases 1, 2, and 3, respectively. Quantitative comparison of the three tests for the purpose ofidentifying different operating parameters is not possible based on the fact that the test data was notreplicated as outlined in the demonstration protocol.
It is desirable to define an overall performance characteristic based on the results of the three tests.To this end, an evaluation of rates of removal relative to flow volume per pound of PolyGuard ispresented. One hypothesis is that PolyGuard performs uniformly under a range of flow andconcentration conditions. If this were the case, a plot of the flow per pound and the removal rate forall the test columns would have a similar characteristic curve. This concept normalizes for flow rateeffects (Q) whereby each column becomes a replicate of any PolyGuard system. The shape of thecurve may linear or non-linear, the latter may be exponential or s-shaped as depicted in Figure 15(After, USEPA, 1973). The s-shaped curve is representative of adsorption phenomena, similar to thatobserved with GAC. The exponential curve may suggest a rate limited transport process such as thatexpected in PolyGuard. In this case, the adsorption process is fast relative to the diffusion ofcontaminants into the molecular structure.
0
5000
10000
15000
20000
25000
30000
6/15 6/22 6/29 7/6 7/13 7/20 7/27 8/3 8/10 8/17 8/24 8/31
Date
BTE
X ug
/L
0
0.1
0.2
0.3
0.4
0.5
0.6
0.7
0.8
0.9
1 InfluentN2 outECS E1ECS E2ECS E4ECS E7ECS E8Removal Rate
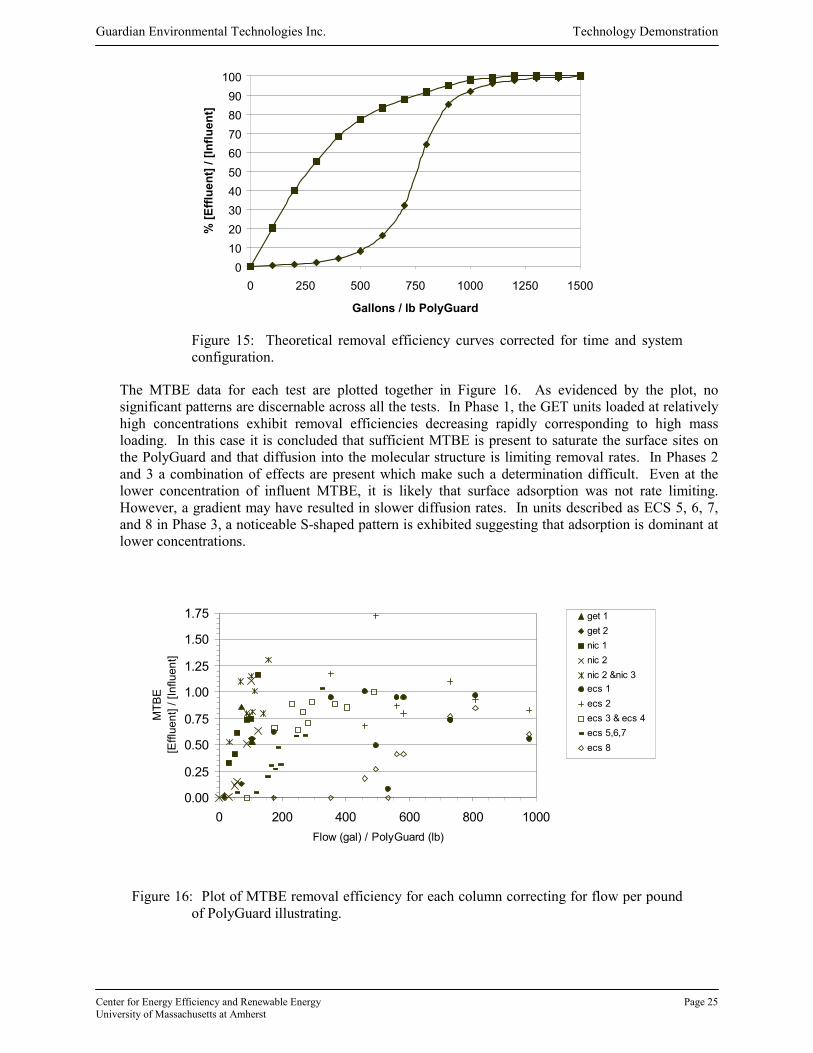
Guardian Environmental Technologies Inc. Technology Demonstration
Center for Energy Efficiency and Renewable Energy Page 25University of Massachusetts at Amherst
Figure 15: Theoretical removal efficiency curves corrected for time and systemconfiguration.
The MTBE data for each test are plotted together in Figure 16. As evidenced by the plot, nosignificant patterns are discernable across all the tests. In Phase 1, the GET units loaded at relativelyhigh concentrations exhibit removal efficiencies decreasing rapidly corresponding to high massloading. In this case it is concluded that sufficient MTBE is present to saturate the surface sites onthe PolyGuard and that diffusion into the molecular structure is limiting removal rates. In Phases 2and 3 a combination of effects are present which make such a determination difficult. Even at thelower concentration of influent MTBE, it is likely that surface adsorption was not rate limiting.However, a gradient may have resulted in slower diffusion rates. In units described as ECS 5, 6, 7,and 8 in Phase 3, a noticeable S-shaped pattern is exhibited suggesting that adsorption is dominant atlower concentrations.
Figure 16: Plot of MTBE removal efficiency for each column correcting for flow per poundof PolyGuard illustrating.
0102030405060708090
100
0 250 500 750 1000 1250 1500
Gallons / lb PolyGuard
% [E
fflue
nt] /
[Inf
luen
t]
0.00
0.25
0.50
0.75
1.00
1.25
1.50
1.75
0 200 400 600 800 1000Flow (gal) / PolyGuard (lb)
MTB
E[E
fflue
nt] /
[Inf
luen
t]
get 1get 2nic 1nic 2nic 2 &nic 3ecs 1ecs 2ecs 3 & ecs 4ecs 5,6,7ecs 8
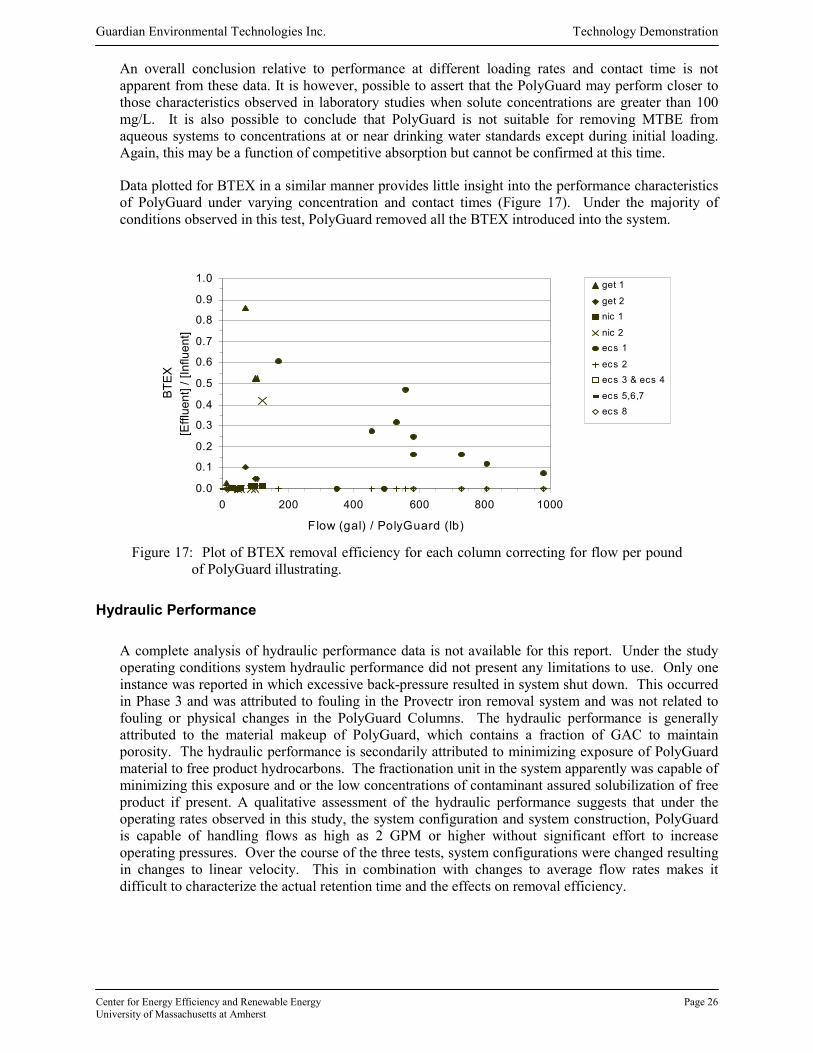
Guardian Environmental Technologies Inc. Technology Demonstration
Center for Energy Efficiency and Renewable Energy Page 26University of Massachusetts at Amherst
An overall conclusion relative to performance at different loading rates and contact time is notapparent from these data. It is however, possible to assert that the PolyGuard may perform closer tothose characteristics observed in laboratory studies when solute concentrations are greater than 100mg/L. It is also possible to conclude that PolyGuard is not suitable for removing MTBE fromaqueous systems to concentrations at or near drinking water standards except during initial loading.Again, this may be a function of competitive absorption but cannot be confirmed at this time.
Data plotted for BTEX in a similar manner provides little insight into the performance characteristicsof PolyGuard under varying concentration and contact times (Figure 17). Under the majority ofconditions observed in this test, PolyGuard removed all the BTEX introduced into the system.
Figure 17: Plot of BTEX removal efficiency for each column correcting for flow per poundof PolyGuard illustrating.
Hydraulic Performance
A complete analysis of hydraulic performance data is not available for this report. Under the studyoperating conditions system hydraulic performance did not present any limitations to use. Only oneinstance was reported in which excessive back-pressure resulted in system shut down. This occurredin Phase 3 and was attributed to fouling in the Provectr iron removal system and was not related tofouling or physical changes in the PolyGuard Columns. The hydraulic performance is generallyattributed to the material makeup of PolyGuard, which contains a fraction of GAC to maintainporosity. The hydraulic performance is secondarily attributed to minimizing exposure of PolyGuardmaterial to free product hydrocarbons. The fractionation unit in the system apparently was capable ofminimizing this exposure and or the low concentrations of contaminant assured solubilization of freeproduct if present. A qualitative assessment of the hydraulic performance suggests that under theoperating rates observed in this study, the system configuration and system construction, PolyGuardis capable of handling flows as high as 2 GPM or higher without significant effort to increaseoperating pressures. Over the course of the three tests, system configurations were changed resultingin changes to linear velocity. This in combination with changes to average flow rates makes itdifficult to characterize the actual retention time and the effects on removal efficiency.
0.0
0.1
0.2
0.3
0.4
0.5
0.6
0.7
0.8
0.9
1.0
0 200 400 600 800 1000
Flow (gal) / PolyGuard (lb)
BTEX
[E
fflue
nt] /
[Inf
luen
t]
get 1
get 2nic 1
nic 2ecs 1
ecs 2ecs 3 & ecs 4
ecs 5,6,7ecs 8

Guardian Environmental Technologies Inc. Technology Demonstration
Center for Energy Efficiency and Renewable Energy Page 27University of Massachusetts at Amherst
Product Stability and Disposal
No data was made available during or after the test with respect to product stability or disposal issues.At the close of the test, the N3 bed was opened and observed visually and tested for odor. While onlya slight odor was observed, contaminant concentrations were not determined.
Cost Analysis
It is useful to identify costs associated with remediation technologies. The USEPA provides guidancefor documenting and cost and performance information for remediation projects under a similar title(USEPA, 1998). However, under piloting conditions it is difficult to develop accurate cost analysisfor full deployment of a commercial application. The protocol for this demonstration was notdeveloped with these guidelines and therefore does not conform to those standards. Cost data was notmade readily available for this report and tests conducted under this study were not carried out tocompletion. Therefore capacity data do not reflect the ultimate capacity of PolyGuard or theminimum cost associated with contaminant removal. Because the cost analysis data is incompleteand true operations and maintenance data could not be collected in this first demonstration ofPolyGuard, STEP cannot confirm or disprove GET’s competitive advantage claims when comparedto GAC systems, the current industry standard.
The cost estimates for MTBE removal presented in Table 9 are based only on the data available fromthis demonstration. The figures do not include capital casts or operation and maintenance costs, sincethose data are not realistic under piloting conditions. Instead cost per pound of contaminant removalis based on the total cost of PolyGuard. The cost for MTBE removal calculated for Phases 2 and 3are considered unrealistic since these tests appeared to have operational problems and low massloading.
Table 9. Cost estimates data reflecting maximum cost for MTBE removal using PolyGuard,not including capital or operating costs.
Test Phase Volume (ft3) Cost MTBE Removed (lbs) Cost / lb MTBE
Phase 1 22 $3630 61.76 $59
Phase 2 21 $3465 15.13 $227
Phase 3 22.4 $3696 14.11 $262
Economic analysis demonstrates a range of costs which reflect somewhat positively on the potentialadvantages for PolyGuard. For example, cost per pound of MTBE removed using PolyGuard duringPhase 1 compares favorably to estimates for removal using GAC at $125/lb, based on 1% capacity(GAC cost estimate provided by GET). These data suggest that PolyGuard may be cost competitiveunder conditions of high MTBE mass loading. Again, since these tests were ended before PolyGuardremoval efficiency reached zero, it is likely that PolyGuard can remove greater quantities of MTBEthan evidenced here and therefore would have even lower costs per pound removal. Based on thesedata additional work is warranted to further investigate this possibility, using cost documentationguidelines recommended by the USEPA.

Guardian Environmental Technologies Inc. Technology Demonstration
Center for Energy Efficiency and Renewable Energy Page 28University of Massachusetts at Amherst
CONCLUSIONS
PolyGuard has been demonstrated to absorb large quantities of MTBE and BTEX relative to its own masscompared to GAC. These studies were previously performed under laboratory conditions at contaminantconcentrations and flow rates that favor higher absorption rates and capacity. Initial studies suggest thatPolyGuard may be capable of absorbing more than twice its weight in MTBE and four times its weight inBTEX. Typical adsorption rates for MTBE with GAC are estimated at less than 3%. Under the claimedperformance characteristics, PolyGuard was proposed as a cost-effective absorbent for the removal ofMTBE and BTEX from contaminated groundwater compared to GAC. Under this study, demonstrationobjectives were to define the operating removal efficiencies and absorption capacity for PolyGuard withMTBE and BTEX contaminated groundwater from a gas station spill site.
Changes in system configurations and average flow rates make it difficult to characterize the actualretention time and effects on removal efficiency. In addition, changes in influent concentrations addedconsiderable uncontrolled test variation, which confounded results. For this reason and circumstancesbeyond the control of this reviewer, it is not possible to place quantitative weight to a performancecharacteristic, which may be applied to other sites with different operating conditions. However, certainconclusions may be drawn from the data and used in assessing potential application of PolyGuard undersimilar or related conditions.
The three tests conducted during this study reflect different operating conditions for the use of PolyGuard.The first test had the highest average flow rate, at 0.98 GPM and the highest average influentconcentrations for MTBE, 263 mg/L. Under these conditions, PolyGuard demonstrated the highestabsorption capacity of 15%. During this test removal efficiency was 93% on a mass basis. The secondtest had an average flow rate of 0.63 GPM and an average influent concentration of 86 mg/L MTBE.System absorption capacity for MTBE was 4% on a mass basis. The MTBE removal efficiency of thisPolyGuard system was the lowest at 41%. Test three had the lowest average flow rate and influentMTBE concentration, at 0.48 GPM and 38 mg/L, respectively. In all test cases the PolyGuard systemnever reached capacity and continued to remove MTBE at 71%, 54% and 39% efficiency for tests 1, 2,and 3 respectively. Due to permit restraints on allowable discharge of MTBE, the failure to install theGAC units, and breakthrough characteristics of PolyGuard, all the tests were ended before the PolyGuardreached its maximum adsorption capacity.
With respect to BTEX removal, all three tests demonstrated excellent BTEX removal. Influentconcentrations did not vary as much between tests with average influent concentrations of 36, 33, and 15mg/L BTEX for tests 1, 2, and 3 respectively. Capacity for BTEX was never reached since systemabsorption of BTEX was 100% in each test. Due to the solubility characteristics of the BTEXconstituents relative to MTBE, high absorption to PolyGuard was expected. Changes in systemconfiguration, operating flow rates and influent concentrations add additional uncertainty to the results ofthese tests. Further, the applicability of the performance characteristics to operating conditions notdefined by those in these studies is limited.
Data from this study suggests that PolyGuard has greater potential for MTBE removal whenconcentrations are greater than 100 mg/L. These data also indicate that, except with virgin PolyGuard,removal efficiencies are not suitable for treatment of MTBE in aqueous systems to concentrations at ornear drinking water standards. This feature tends to suggest that PolyGuard is useful as a bulkcontaminant remover and not a final polishing agent. One operational feature this demonstration was ableto demonstrate was the need for a final polishing step such as GAC to achieve MTBE levels as requiredby the NPDES Permit exclusion. Further testing is recommended to determine to what extent competitiveabsorption may limit applications using PolyGuard.
Guardian Environmental Technologies Inc. Technology Demonstration
Center for Energy Efficiency and Renewable Energy Page 29University of Massachusetts at Amherst
Hydraulic performance of the PolyGuard system under the test conditions was not fully investigated.However, only one instance of system flow problems over the course of all three tests and was notattributed to the PolyGuard units.
No information regarding product stability or disposal costs were available from these studies. Disposalcosts reported by GET indicate approximate costs of $295 per 55-gallon drum for hazardous materialdisposal and $78 per 55-gallon drum for non-hazardous material disposal. Final disposal may includefuel blending and or incineration.
A minimal cost analysis was performed, considering only removal cost of MTBE based on material costof PolyGuard and did not include capital or operational costs. Operational and capital cost were excludedfrom this analysis because of costs associated with pilot system modifications are not expected under fulldeployment of the technology. Due to the nature of this pilot demonstrations, data was not of suitablequality to conform to reported methods recommended by the USEPA. Cost per pound of MTBE removedusing PolyGuard during all phases ranged from $59 to $262 per pound of MTBE. Lowest costs wererealized during Phase 1 with a cost of $59/lb and the highest mass loading rate. Phase 1 costs maycompare favorably to estimates for MTBE removal using GAC at $125/lb, based on 1% capacity. Phase2 and 3 costs were estimated at $229 and $262 per pound of MTBE removed These data suggest thatPolyGuard may be cost competitive under conditions of high MTBE mass loading and that further costanalysis should be performed once the system can be optimized for performance. These studies shouldconform to USEPA guidance for documenting cost and performance.
Further studies are recommended based on qualitative results from this study. Foremost, isothermanalysis under a variety of operating conditions will assist in quantifying absorption rates, especiallywhere concentration varies. Furthermore, investigations of complex solutions under controlled conditionsmay assist in understanding competitive absorption phenomena hypothesized herein. Additionalinvestigation into system fouling and microbial activity is also recommended since they are problems inGAC systems. Field studies under alternative conditions to those reported in this study may assist indeveloping full scale operating parameters, but may be less useful for broader applicability to diverse setsof operating conditions.
The potential strengths and weaknesses of PolyGuard compared with GAC should also be furtherexplored. Full life cycle costs, including capital costs, O&M, and disposal need to be more fullycharacterized for operational systems, following EPA methodologies.

Guardian Environmental Technologies Inc. Technology Demonstration
Center for Energy Efficiency and Renewable Energy Page 30University of Massachusetts at Amherst
REFERENCES
APHA, Standard Methods for Examination of Water and Wastewater, 1989. American Pubic HealthAssociation, Washington, D.C.
Environmental Compliance Services, Inc. 1998. Release Abatement Measure Status Report B & DPetroleum Sales Facility 220 South Main Street Bellingham, Massachusetts DEP Site #2-10377. Agawam,MA.
Environmental Compliance Services, Inc. 1999. Release Abatement Measure Status Report B & DPetroleum Sales Facility 220 South Main Street Bellingham, Massachusetts DEP Site #2-10377. Brighton,MA.
USEPA, Process Design Manual for Carbon Adsorption 1973. EPA 625173002. U.S. Department ofCommerce, NTIS, Springfield, VA.
USEPA, Test Methods for Evaluating Solid Wastes, Physical/Chemical Methods, SW-846. 1996. U.S.Department of Commerce, NTIS, Springfield, VA.
USEPA, Guide to Documenting and Managing Cost and Performance Information for RemediationProjects. 1998. EPA 542B98007. U.S. Department of Commerce, NTIS, Springfield, VA.

Guardian Environmental Technologies Inc. Technology Demonstration
Center for Energy Efficiency and Renewable Energy Page 31University of Massachusetts at Amherst

Guardian Environmental Technologies Inc. Technology Demonstration
Center for Energy Efficiency and Renewable Energy Page 32University of Massachusetts at Amherst
APPENDICES
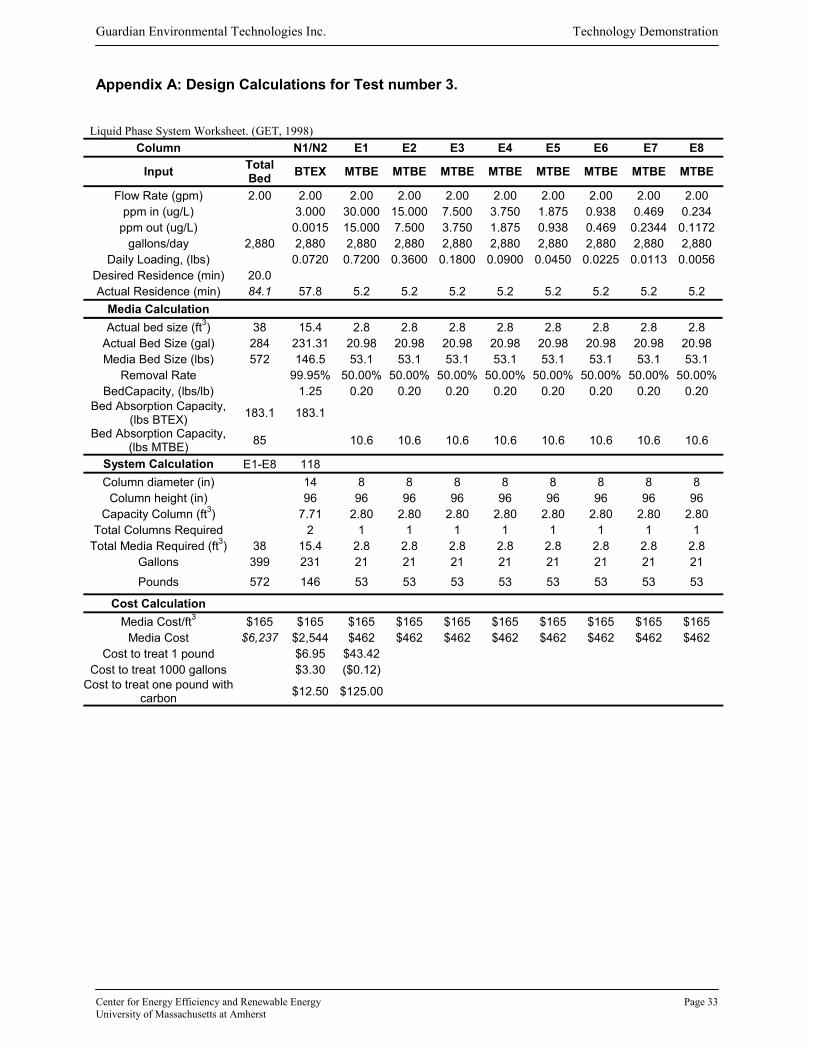
Guardian Environmental Technologies Inc. Technology Demonstration
Center for Energy Efficiency and Renewable Energy Page 33University of Massachusetts at Amherst
Appendix A: Design Calculations for Test number 3.
Liquid Phase System Worksheet. (GET, 1998)Column N1/N2 E1 E2 E3 E4 E5 E6 E7 E8
Input TotalBed BTEX MTBE MTBE MTBE MTBE MTBE MTBE MTBE MTBE
Flow Rate (gpm) 2.00 2.00 2.00 2.00 2.00 2.00 2.00 2.00 2.00 2.00ppm in (ug/L) 3.000 30.000 15.000 7.500 3.750 1.875 0.938 0.469 0.234
ppm out (ug/L) 0.0015 15.000 7.500 3.750 1.875 0.938 0.469 0.2344 0.1172gallons/day 2,880 2,880 2,880 2,880 2,880 2,880 2,880 2,880 2,880 2,880
Daily Loading, (lbs) 0.0720 0.7200 0.3600 0.1800 0.0900 0.0450 0.0225 0.0113 0.0056Desired Residence (min) 20.0Actual Residence (min) 84.1 57.8 5.2 5.2 5.2 5.2 5.2 5.2 5.2 5.2
Media CalculationActual bed size (ft3) 38 15.4 2.8 2.8 2.8 2.8 2.8 2.8 2.8 2.8
Actual Bed Size (gal) 284 231.31 20.98 20.98 20.98 20.98 20.98 20.98 20.98 20.98Media Bed Size (lbs) 572 146.5 53.1 53.1 53.1 53.1 53.1 53.1 53.1 53.1
Removal Rate 99.95% 50.00% 50.00% 50.00% 50.00% 50.00% 50.00% 50.00% 50.00%BedCapacity, (lbs/lb) 1.25 0.20 0.20 0.20 0.20 0.20 0.20 0.20 0.20
Bed Absorption Capacity,(lbs BTEX) 183.1 183.1
Bed Absorption Capacity,(lbs MTBE) 85 10.6 10.6 10.6 10.6 10.6 10.6 10.6 10.6
System Calculation E1-E8 118Column diameter (in) 14 8 8 8 8 8 8 8 8
Column height (in) 96 96 96 96 96 96 96 96 96Capacity Column (ft3) 7.71 2.80 2.80 2.80 2.80 2.80 2.80 2.80 2.80
Total Columns Required 2 1 1 1 1 1 1 1 1Total Media Required (ft3) 38 15.4 2.8 2.8 2.8 2.8 2.8 2.8 2.8 2.8
Gallons 399 231 21 21 21 21 21 21 21 21Pounds 572 146 53 53 53 53 53 53 53 53
Cost CalculationMedia Cost/ft3 $165 $165 $165 $165 $165 $165 $165 $165 $165 $165
Media Cost $6,237 $2,544 $462 $462 $462 $462 $462 $462 $462 $462Cost to treat 1 pound $6.95 $43.42
Cost to treat 1000 gallons $3.30 ($0.12)Cost to treat one pound with
carbon $12.50 $125.00

Guardian Environmental Technologies Inc. Technology Demonstration
Center for Energy Efficiency and Renewable Energy Page 34University of Massachusetts at Amherst
Appendix B: Pilot Test Analytical Data
Pilot 1 DATE8/25/97 8/29/97 9/2/97 9/5/97 9/6/97 All Dates
Concentration (ug/L) MeanMTBE Influent 208200 438100 401200 133200 133200 262780MTBE GET 1 800 12500 346100 69800 69800 99800MTBE GET 2 0 0 45600 39100 39100 24760BTEX Influent 15930 6150 35400 61200 61200 35976BTEX GET 1 0 0 3529 3000 3000 1906BTEX GET 2 0 0 0 0 0 0
Flow Rate (GPM) Mean/Totalflow rate 0.00 0.56 2.02 1.38 0.95 0.98gallons 0.00 3215.00 11660.00 5954.00 1374.00 22203
Mass Loading (lbs) Sum Mass LoadingMTBE Influent 8.99 42.36 13.77 1.58 66.71MTBE GET 1 0.19 18.10 10.72 0.83 29.83MTBE GET 2 0.00 2.30 2.18 0.47 4.95BTEX Influent 0.31 2.10 2.49 0.73 5.62BTEX GET 1 0.00 0.18 0.17 0.04 0.38BTEX GET 2 0.00 0.00 0.00 0.00 0.00
Interval Mass Removal (lbs)Sum Mass Removal
MTBE InfluentMTBE GET 1 8.81 24.26 3.05 0.75 36.88MTBE GET 2 0.19 15.80 8.54 0.37 24.88Sum removal 8.99 40.06 11.59 1.12 61.76
BTEX InfluentBTEX GET 1 0.31 1.92 2.32 0.69 5.24BTEX GET 2 0.00 0.18 0.17 0.04 0.38Sum removal 0.31 2.10 2.49 0.73 5.62
Interval Mass Removal / Lb PolyGuard (lb/lb)Sum Mass Removal
/ lb PolyGuardMTBE InfluentMTBE GET 1 0.04 0.12 0.01 0.00 0.18MTBE GET 2 0.00 0.08 0.04 0.00 0.12PG System Removal 0.02 0.10 0.03 0.00 0.15BTEX InfluentBTEX GET 1 0.00 0.01 0.01 0.00 0.03BTEX GET 2 0.00 0.00 0.00 0.00 0.00PG System Removal 0.00 0.01 0.01 0.00 0.01
Interval Removal Efficiency (Mass)Removal Efficiency (Mass)
MTBE InfluentMTBE GET 1 0.98 0.57 0.22 0.48 0.56MTBE GET 2 1.00 0.87 0.80 0.44 0.78PG System Removal 1.00 0.95 0.84 0.71 0.93BTEX InfluentBTEX GET 1 1.00 0.92 0.93 0.95 0.95BTEX GET 2 1.00 1.00 1.00 1.00PG System Removal 1.00 1.00 1.00 1.00 1.00
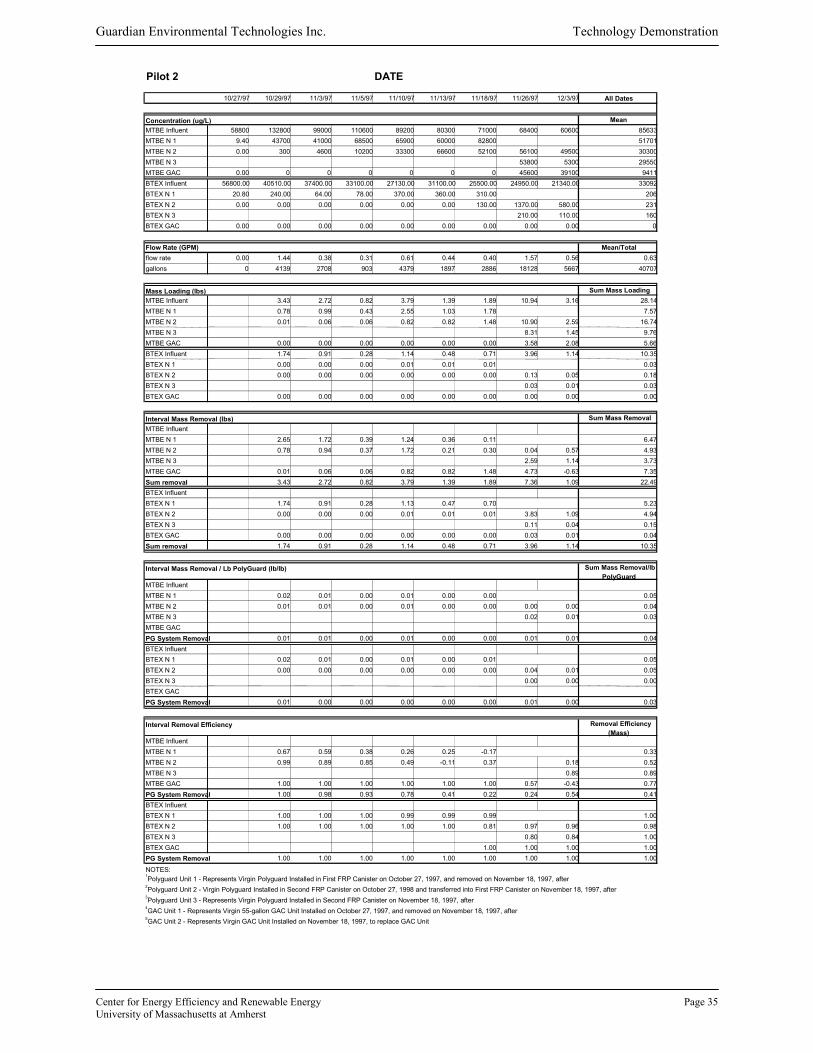
Guardian Environmental Technologies Inc. Technology Demonstration
Center for Energy Efficiency and Renewable Energy Page 35University of Massachusetts at Amherst
Pilot 2 DATE
10/27/97 10/29/97 11/3/97 11/5/97 11/10/97 11/13/97 11/18/97 11/26/97 12/3/97 All Dates
MeanMTBE Influent 58800 132800 99000 110600 89200 80300 71000 68400 60600 85633MTBE N 1 9.40 43700 41000 68500 65900 60000 82800 51701MTBE N 2 0.00 300 4600 10200 33300 66600 52100 56100 49500 30300MTBE N 3 53800 5300 29550MTBE GAC 0.00 0 0 0 0 0 0 45600 39100 9411BTEX Influent 56800.00 40510.00 37400.00 33100.00 27130.00 31100.00 25500.00 24950.00 21340.00 33092BTEX N 1 20.80 240.00 64.00 78.00 370.00 360.00 310.00 206BTEX N 2 0.00 0.00 0.00 0.00 0.00 0.00 130.00 1370.00 580.00 231BTEX N 3 210.00 110.00 160BTEX GAC 0.00 0.00 0.00 0.00 0.00 0.00 0.00 0.00 0.00 0
Flow Rate (GPM) Mean/Totalflow rate 0.00 1.44 0.38 0.31 0.61 0.44 0.40 1.57 0.56 0.63gallons 0 4139 2708 903 4379 1897 2886 18128 5667 40707
Sum Mass LoadingMTBE Influent 3.43 2.72 0.82 3.79 1.39 1.89 10.94 3.16 28.14MTBE N 1 0.78 0.99 0.43 2.55 1.03 1.78 7.57MTBE N 2 0.01 0.06 0.06 0.82 0.82 1.48 10.90 2.59 16.74MTBE N 3 8.31 1.45 9.76MTBE GAC 0.00 0.00 0.00 0.00 0.00 0.00 3.58 2.08 5.66BTEX Influent 1.74 0.91 0.28 1.14 0.48 0.71 3.96 1.14 10.35BTEX N 1 0.00 0.00 0.00 0.01 0.01 0.01 0.03BTEX N 2 0.00 0.00 0.00 0.00 0.00 0.00 0.13 0.05 0.18BTEX N 3 0.03 0.01 0.03BTEX GAC 0.00 0.00 0.00 0.00 0.00 0.00 0.00 0.00 0.00
Sum Mass RemovalMTBE InfluentMTBE N 1 2.65 1.72 0.39 1.24 0.36 0.11 6.47MTBE N 2 0.78 0.94 0.37 1.72 0.21 0.30 0.04 0.57 4.93MTBE N 3 2.59 1.14 3.73MTBE GAC 0.01 0.06 0.06 0.82 0.82 1.48 4.73 -0.63 7.35Sum removal 3.43 2.72 0.82 3.79 1.39 1.89 7.36 1.09 22.49BTEX InfluentBTEX N 1 1.74 0.91 0.28 1.13 0.47 0.70 5.23BTEX N 2 0.00 0.00 0.00 0.01 0.01 0.01 3.83 1.09 4.94BTEX N 3 0.11 0.04 0.15BTEX GAC 0.00 0.00 0.00 0.00 0.00 0.00 0.03 0.01 0.04Sum removal 1.74 0.91 0.28 1.14 0.48 0.71 3.96 1.14 10.35
Sum Mass Removal/lbPolyGuard
MTBE InfluentMTBE N 1 0.02 0.01 0.00 0.01 0.00 0.00 0.05MTBE N 2 0.01 0.01 0.00 0.01 0.00 0.00 0.00 0.00 0.04MTBE N 3 0.02 0.01 0.03MTBE GACPG System Removal 0.01 0.01 0.00 0.01 0.00 0.00 0.01 0.01 0.04BTEX InfluentBTEX N 1 0.02 0.01 0.00 0.01 0.00 0.01 0.05BTEX N 2 0.00 0.00 0.00 0.00 0.00 0.00 0.04 0.01 0.05BTEX N 3 0.00 0.00 0.00BTEX GACPG System Removal 0.01 0.00 0.00 0.00 0.00 0.00 0.01 0.00 0.03
Removal Efficiency(Mass)
MTBE InfluentMTBE N 1 0.67 0.59 0.38 0.26 0.25 -0.17 0.33MTBE N 2 0.99 0.89 0.85 0.49 -0.11 0.37 0.18 0.52MTBE N 3 0.89 0.89MTBE GAC 1.00 1.00 1.00 1.00 1.00 1.00 0.57 -0.43 0.77PG System Removal 1.00 0.98 0.93 0.78 0.41 0.22 0.24 0.54 0.41BTEX InfluentBTEX N 1 1.00 1.00 1.00 0.99 0.99 0.99 1.00BTEX N 2 1.00 1.00 1.00 1.00 1.00 0.81 0.97 0.96 0.98BTEX N 3 0.80 0.84 1.00BTEX GAC 1.00 1.00 1.00 1.00PG System Removal 1.00 1.00 1.00 1.00 1.00 1.00 1.00 1.00 1.00
NOTES:1Polyguard Unit 1 - Represents Virgin Polyguard Installed in First FRP Canister on October 27, 1997, and removed on November 18, 1997, after
li2Polyguard Unit 2 - Virgin Polyguard Installed in Second FRP Canister on October 27, 1998 and transferred into First FRP Canister on November 18, 1997, afterli3Polyguard Unit 3 - Represents Virgin Polyguard Installed in Second FRP Canister on November 18, 1997, afterli4GAC Unit 1 - Represents Virgin 55-gallon GAC Unit Installed on October 27, 1997, and removed on November 18, 1997, afterli5GAC Unit 2 - Represents Virgin GAC Unit Installed on November 18, 1997, to replace GAC Unit
1
Interval Removal Efficiency
Mass Loading (lbs)
Concentration (ug/L)
Interval Mass Removal (lbs)
Interval Mass Removal / Lb PolyGuard (lb/lb)

Guardian Environmental Technologies Inc. Technology Demonstration
Center for Energy Efficiency and Renewable Energy Page 36University of Massachusetts at Amherst
Phase 3 MTBEDATE
6/17/98 6/25/98 7/2/98 7/10/98 7/14/98 7/17/98 7/21/98 7/24/98 8/17/98 8/24/98 8/31/98 All Dates
Concentration (ug/L) MeanInfluent 29400 10600 33400 69200 41600 36500 50500 40400 47900 34000 28000 38318N2 out 26500 5600 36800 55000 32600 42100 40900 40900 38200 44500 71700 39527ECS E1 2800 3500 35000 55700 16200 3300 39100 39100 28300 43100 40300 27855ECS E2 41200 37800 27900 32800 33900 31300 31200 40000 33500 34400ECS E4 ND 2200 27200 33400 17900 26700 24000 28300 27600 34200 33500 25500ECS E7 ND 100 1300 6700 5500 7200 11500 8800 16100 20100 34800 11210ECS E8 NR NR NR 1200 1500 NR 4700 3600 12400 17000 20900 8757
Flow Rate (GPM) Mean/Totalflow rate 0 0.79 0.94 0.49 0.34 0.46 0.26 0.27 0.9 0.41 0.45 0.48gallons 167 9142 9481 5611 1949 1983 1488 1168 7798 4158 9006 51951
MTBE Mass Loading (lbs) Sum Mass Loading
Influent 1.58 1.81 2.49 0.93 0.67 0.56 0.46 2.98 1.47 2.42 15.38N2 out 1.27 1.74 2.23 0.74 0.64 0.53 0.41 2.67 1.49 4.53 16.26ECS E1 0.25 1.58 2.20 0.61 0.17 0.27 0.40 2.28 1.29 3.25 12.29ECS E2 0.00 1.69 1.92 0.55 0.52 0.43 0.33 2.11 1.28 2.87 11.70ECS E4 0.17 1.21 1.47 0.43 0.38 0.33 0.26 1.89 1.11 2.64 9.90ECS E7 0.01 0.06 0.19 0.10 0.11 0.12 0.10 0.84 0.65 2.14 4.33ECS E8 0.04 0.54 0.53 1.48 2.59
Interval Mass Removal lbs) Sum Mass Removal
InfluentN2 out 0.31 0.07 0.26 0.20 0.03 0.03 0.05 0.31 1.25ECS E1 1.02 0.16 0.03 0.13 0.47 0.26 0.02 0.39 0.20 1.28 3.97ECS E2 0.28 0.05 0.07 0.00 0.39 0.79ECS E4 0.08 0.48 0.45 0.12 0.14 0.10 0.07 0.22 0.17 0.23 2.05ECS E7 0.17 1.15 1.28 0.33 0.27 0.21 0.16 1.05 0.46 0.50 5.57ECS E8 0.06 0.19 0.10 0.11 0.12 0.06 0.30 0.12 0.66 1.73Sum removal 1.58 1.92 2.49 0.93 1.02 0.72 0.42 2.28 0.96 3.05 15.36
Interval Mass Removal / Lb PolyGuard (lb/lb)
Sum Mass
Removal / lb
PolyGuardInfluentN2 out 0.00 0.00 0.00 0.00 0.00 0.00 0.00 0.00 0.00 0.00 0.00ECS E1 0.02 0.00 0.00 0.00 0.01 0.00 0.00 0.01 0.00 0.02 0.08ECS E2 0.00 0.00 0.01 0.00 0.00 0.00 0.00 0.00 0.00 0.01 0.01ECS E4 0.00 0.00 0.00 0.00 0.00 0.00 0.00 0.00 0.00 0.00 0.02ECS E7 0.00 0.01 0.01 0.00 0.00 0.00 0.00 0.01 0.00 0.00 0.04ECS E8 0.00 0.00 0.00 0.00 0.00 0.00 0.00 0.01 0.00 0.01 0.03System Removal 0.00 0.00 0.00 0.00 0.00 0.00 0.00 0.00 0.00 0.00 0.02
Interval Removal Efficiency (Mass)Removal Efficiency (Mass)
InfluentN2 out 0.20 0.04 0.11 0.21 0.04 0.05 0.10 0.10 -0.01 -0.87 -0.06ECS E1 0.80 0.09 0.01 0.18 0.74 0.49 0.04 0.15 0.14 0.28 0.24ECS E2 -0.07 0.13 0.09 -2.11 -0.57 0.17 0.07 0.00 0.12 0.05ECS E4 0.30 0.29 0.23 0.22 0.27 0.24 0.20 0.11 0.13 0.08 0.15ECS E7 0.95 0.95 0.87 0.76 0.72 0.63 0.61 0.55 0.41 0.19 0.56ECS E8 0.59 0.36 0.19 0.31 0.40System Efficeincy 1.00 0.97 0.92 0.89 0.84 0.79 0.91 0.82 0.64 0.39 0.83
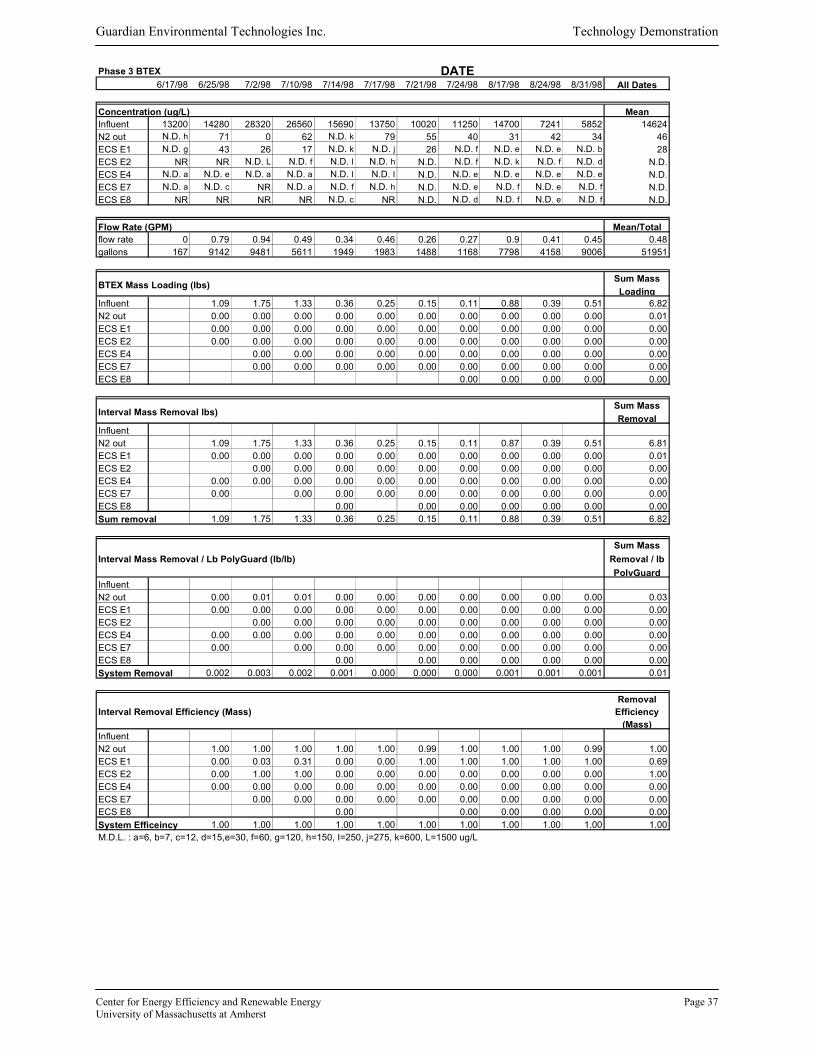
Guardian Environmental Technologies Inc. Technology Demonstration
Center for Energy Efficiency and Renewable Energy Page 37University of Massachusetts at Amherst
Phase 3 BTEX DATE6/17/98 6/25/98 7/2/98 7/10/98 7/14/98 7/17/98 7/21/98 7/24/98 8/17/98 8/24/98 8/31/98 All Dates
Concentration (ug/L) MeanInfluent 13200 14280 28320 26560 15690 13750 10020 11250 14700 7241 5852 14624N2 out N.D. h 71 0 62 N.D. k 79 55 40 31 42 34 46ECS E1 N.D. g 43 26 17 N.D. k N.D. j 26 N.D. f N.D. e N.D. e N.D. b 28ECS E2 NR NR N.D. L N.D. f N.D. I N.D. h N.D. N.D. f N.D. k N.D. f N.D. d N.D.ECS E4 N.D. a N.D. e N.D. a N.D. a N.D. I N.D. I N.D. N.D. e N.D. e N.D. e N.D. e N.D.ECS E7 N.D. a N.D. c NR N.D. a N.D. f N.D. h N.D. N.D. e N.D. f N.D. e N.D. f N.D.ECS E8 NR NR NR NR N.D. c NR N.D. N.D. d N.D. f N.D. e N.D. f N.D.
Flow Rate (GPM) Mean/Totalflow rate 0 0.79 0.94 0.49 0.34 0.46 0.26 0.27 0.9 0.41 0.45 0.48gallons 167 9142 9481 5611 1949 1983 1488 1168 7798 4158 9006 51951
BTEX Mass Loading (lbs) Sum Mass Loading
Influent 1.09 1.75 1.33 0.36 0.25 0.15 0.11 0.88 0.39 0.51 6.82N2 out 0.00 0.00 0.00 0.00 0.00 0.00 0.00 0.00 0.00 0.00 0.01ECS E1 0.00 0.00 0.00 0.00 0.00 0.00 0.00 0.00 0.00 0.00 0.00ECS E2 0.00 0.00 0.00 0.00 0.00 0.00 0.00 0.00 0.00 0.00 0.00ECS E4 0.00 0.00 0.00 0.00 0.00 0.00 0.00 0.00 0.00 0.00ECS E7 0.00 0.00 0.00 0.00 0.00 0.00 0.00 0.00 0.00 0.00ECS E8 0.00 0.00 0.00 0.00 0.00
Interval Mass Removal lbs) Sum Mass Removal
InfluentN2 out 1.09 1.75 1.33 0.36 0.25 0.15 0.11 0.87 0.39 0.51 6.81ECS E1 0.00 0.00 0.00 0.00 0.00 0.00 0.00 0.00 0.00 0.00 0.01ECS E2 0.00 0.00 0.00 0.00 0.00 0.00 0.00 0.00 0.00 0.00ECS E4 0.00 0.00 0.00 0.00 0.00 0.00 0.00 0.00 0.00 0.00 0.00ECS E7 0.00 0.00 0.00 0.00 0.00 0.00 0.00 0.00 0.00 0.00ECS E8 0.00 0.00 0.00 0.00 0.00 0.00 0.00Sum removal 1.09 1.75 1.33 0.36 0.25 0.15 0.11 0.88 0.39 0.51 6.82
Interval Mass Removal / Lb PolyGuard (lb/lb)Sum Mass
Removal / lb PolyGuard
InfluentN2 out 0.00 0.01 0.01 0.00 0.00 0.00 0.00 0.00 0.00 0.00 0.03ECS E1 0.00 0.00 0.00 0.00 0.00 0.00 0.00 0.00 0.00 0.00 0.00ECS E2 0.00 0.00 0.00 0.00 0.00 0.00 0.00 0.00 0.00 0.00ECS E4 0.00 0.00 0.00 0.00 0.00 0.00 0.00 0.00 0.00 0.00 0.00ECS E7 0.00 0.00 0.00 0.00 0.00 0.00 0.00 0.00 0.00 0.00ECS E8 0.00 0.00 0.00 0.00 0.00 0.00 0.00System Removal 0.002 0.003 0.002 0.001 0.000 0.000 0.000 0.001 0.001 0.001 0.01
Interval Removal Efficiency (Mass)Removal
Efficiency (Mass)
InfluentN2 out 1.00 1.00 1.00 1.00 1.00 0.99 1.00 1.00 1.00 0.99 1.00ECS E1 0.00 0.03 0.31 0.00 0.00 1.00 1.00 1.00 1.00 1.00 0.69ECS E2 0.00 1.00 1.00 0.00 0.00 0.00 0.00 0.00 0.00 0.00 1.00ECS E4 0.00 0.00 0.00 0.00 0.00 0.00 0.00 0.00 0.00 0.00 0.00ECS E7 0.00 0.00 0.00 0.00 0.00 0.00 0.00 0.00 0.00 0.00ECS E8 0.00 0.00 0.00 0.00 0.00 0.00System Efficeincy 1.00 1.00 1.00 1.00 1.00 1.00 1.00 1.00 1.00 1.00 1.00M.D.L. : a=6, b=7, c=12, d=15,e=30, f=60, g=120, h=150, I=250, j=275, k=600, L=1500 ug/L
Guardian Environmental Technologies Inc. Technology Demonstration
Center for Energy Efficiency and Renewable Energy Page 38University of Massachusetts at Amherst
Appendix C: Remediation Action Plan Status Report, April 1998

Guardian Environmental Technologies Inc. Technology Demonstration
Center for Energy Efficiency and Renewable Energy Page 39University of Massachusetts at Amherst
Page C1
RELEASE ABATEMENT MEASURESTATUS REPORT
B & D PETROLEUM SALES FACILITY220 SOUTH MAIN STREET
BELLINGHAM, MASSACHUSETTSDEP SITE #2-10377
Prepared For:
Massachusetts Department ofEnvironmental Protection
Bureau of Waste Site Cleanup627 Main Street
Worcester, Massachusetts 01605
Prepared By:
Environmental Compliance Services, Inc.588 Silver Street
Agawam, Massachusetts 01001
File No. J12116.10RAMStatus1.doc
April, 1998
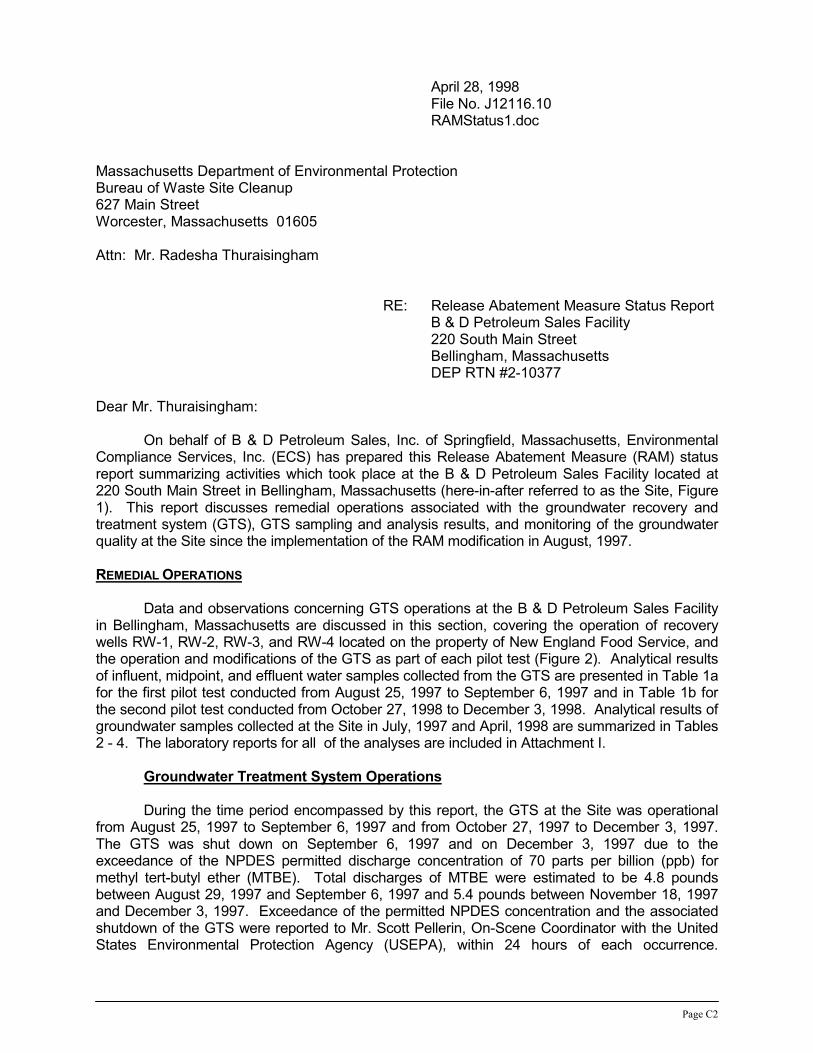
Page C2
April 28, 1998File No. J12116.10
RAMStatus1.doc
Massachusetts Department of Environmental ProtectionBureau of Waste Site Cleanup627 Main StreetWorcester, Massachusetts 01605
Attn: Mr. Radesha Thuraisingham
RE: Release Abatement Measure Status ReportB & D Petroleum Sales Facility220 South Main StreetBellingham, MassachusettsDEP RTN #2-10377
Dear Mr. Thuraisingham:
On behalf of B & D Petroleum Sales, Inc. of Springfield, Massachusetts, EnvironmentalCompliance Services, Inc. (ECS) has prepared this Release Abatement Measure (RAM) statusreport summarizing activities which took place at the B & D Petroleum Sales Facility located at220 South Main Street in Bellingham, Massachusetts (here-in-after referred to as the Site, Figure1). This report discusses remedial operations associated with the groundwater recovery andtreatment system (GTS), GTS sampling and analysis results, and monitoring of the groundwaterquality at the Site since the implementation of the RAM modification in August, 1997.
REMEDIAL OPERATIONS
Data and observations concerning GTS operations at the B & D Petroleum Sales Facilityin Bellingham, Massachusetts are discussed in this section, covering the operation of recoverywells RW-1, RW-2, RW-3, and RW-4 located on the property of New England Food Service, andthe operation and modifications of the GTS as part of each pilot test (Figure 2). Analytical resultsof influent, midpoint, and effluent water samples collected from the GTS are presented in Table 1afor the first pilot test conducted from August 25, 1997 to September 6, 1997 and in Table 1b forthe second pilot test conducted from October 27, 1998 to December 3, 1998. Analytical results ofgroundwater samples collected at the Site in July, 1997 and April, 1998 are summarized in Tables2 - 4. The laboratory reports for all of the analyses are included in Attachment I.
Groundwater Treatment System Operations
During the time period encompassed by this report, the GTS at the Site was operationalfrom August 25, 1997 to September 6, 1997 and from October 27, 1997 to December 3, 1997.The GTS was shut down on September 6, 1997 and on December 3, 1997 due to theexceedance of the NPDES permitted discharge concentration of 70 parts per billion (ppb) formethyl tert-butyl ether (MTBE). Total discharges of MTBE were estimated to be 4.8 poundsbetween August 29, 1997 and September 6, 1997 and 5.4 pounds between November 18, 1997and December 3, 1997. Exceedance of the permitted NPDES concentration and the associatedshutdown of the GTS were reported to Mr. Scott Pellerin, On-Scene Coordinator with the UnitedStates Environmental Protection Agency (USEPA), within 24 hours of each occurrence.

Page C3
Additionally, none of the other target contaminants, benzene, toluene, ethylbenzene, xylene(BTEX), or total petroleum hydrocarbons (TPH) were detected at any time in the GTS effluentduring either pilot test.
The submission of the RAM modification in July, 1997 proposed a pilot test be conductedat the Site utilizing Polyguard™ as an absorbent to treat BTEX and MTBE contaminatedgroundwater at a flowrate of 5 gallons per minute (gpm) and the use of a compost biofilter to treateffluent gases at a flowrate of 10 standard cubic feet per minute (scfm) from a diffuser (See Figure3). ECS proposed utilizing the compost biofilter for off-gas treatment based upon theirdemonstrated effectiveness at treating a variety of BTEX and TPH contaminated airstreams.However, upon initiating construction of the biofilter, ECS determined that the proposed seedingbacteria was incapable of degrading MTBE. Additionally, ECS was unable to locate a vender witha demonstrated MTBE degrading bacteria. As the diffuser, at an airflow rate of 10 scfm andgroundwater flowrate of 5 gpm, was determined to only reduce the groundwater MTBEconcentration by approximately 5%, removal of the diffuser from the proposed GTS wasdetermined to have only a minor impact on the estimated utilization rate of Polyguard™.
ECS and Guardian Environmental Technologies (GET) of Kent, Connecticut designed theinitial operation parameters of the GTS based upon the results of the bench scale tests ofPolyguardTM presented in Appendix B of the July, 1997 RAM modification, “Pump and TreatRemediation of Groundwater Using a Polymer Absorbent: A Pilot Demonstration Protocol ForPolyguard™.” Bench scale tests presented in the Protocol indicated an 87.8% removal rate ofMTBE for PolyGuard™ with a residence time of 10 minutes and an absorption capacity of 1.53pounds MTBE per pound PolyGuard™ (153%) with a contact time of 24 hours. For designpurposes an absorption capacity of 135%, an absorption rate of 87.8%, and a residence time of15 minutes were assumed for the GTS as presented in the Protocol. Consequently, ECS initiatedconstruction of the GTS at the Site utilizing two 110-gallon (14.4 ft3) PolyGuard™ canisters (totalof 634 pounds, 316 pounds per drum). As an added safety measure, ECS reduced the initialflowrate of the GTS to approximately 2 gpm, increasing the total residence time to approximately55 minutes (assuming a porosity of 50%).
GTS PolyGuard™ Pilot Test One
All water samples were collected during the pumping cycle of the GTS. All samples werecollected directly into 40-milliliter septum-sealed glass vials which were pre-preserved withhydrochloric acid to a pH value of less than 2. The samples were refrigerated on-site and duringtransport to the laboratory following chain-of-custody protocols. The samples were submitted toSpectrum Analytical, Inc. of Agawam, Massachusetts for analysis using EPA Method 602, withMTBE as an additional parameter, and using EPA Method 8100M for TPH. The results of theseanalyses are included in Attachment I. The operational details of the first PolyGuard™ Pilot Testare as follows:
August 20, 1997; Installed two 110-gallon PolyGuard™ absorbent drums, water flow meter,Provectr 13P iron removal system, transfer sump and pump, oil/waterseparator, new water lines from four existing bottom loading pneumaticpumps (MH-1, MH-2, MH-3, and MH-4) to oil/water separator, andinstallation of explosion proof wiring for sump pump.
August 21, 1997; Completed plumbing of water lines and test sump pump and compressor.

Page C4
August 25, 1997; Tied high level alarm in sump to compressor control panel. Commencedstart-up of GTS, and collected first set of groundwater samples. Recordedflow meter reading.
August 29, 1997; Collected water samples from before, between, and after PolyGuard™absorbent drums. Noted that two of the pneumatic pumps were notpumping. Recorded flow meter reading.
September 2, 1997; Disconnected air lines to down pumps. Installed oil and moisture filterswith automatic blowdown on air discharge line from compressor. Blew allair lines out, cleaned pumps, reconnected and started pumps. Collectedwater samples from before, between, and after PolyGuard™ absorbentdrums. Recorded flow meter reading.
September 5, 1997; Collected water samples from before, between, and after PolyGuard™absorbent drums. Recorded flow meter reading. Received groundwateranalytical results indicating exceedance of NPDES permitted dischargeconcentration of 70 ppb for MTBE on September 2, 1997.
September 6, 1997; Collected water samples from before, between, and after PolyGuard™absorbent drums. Recorded flow meter reading and shut GTS down.Notified Mr. Scott Pellerin of EPA of discharge exceedance and GTSshutdown.
As presented in Table 1a, breakthrough of both BTEX and MTBE through the first drum ofPolyGuard™ occurred within 8 days of start-up after treating only 14, 875 gallons of water andremoving approximately 32 pounds of MTBE and 2.15 pounds of BTEX. Total volume ofgroundwater treated by the GTS between August 25, 1997 and September 6, 1997 was 22,203gallons and the total mass of MTBE removed by the PolyGuard™ was approximately 60 poundsand the total mass of BTEX recovered was approximately 5.4 pounds. No BTEX and no TPHwere discharged from the GTS.
The average MTBE concentration over the period of operation was 262,780 microgramsper liter (ug/l). GET reported that the sudden drop in efficiency of BTEX removal in drum 1documented by the breakthrough of BTEX on September 2, 1997 was likely due to channeling,void collapse, or other mechanical failures and could not be attributed to “saturation” of thePolyGuard™. Recognizing that the bench scale tests as reported in the Protocol were conductedwith packed vessels with a length to diameter ratio of 5:1, GET and ECS met with SteveEmmendorfer, P.E., Vice President of Construction of Nickerson Engineering of Torrington,Connecticut, regarding design of new pressure vessels to contain the PolyGuard™.
GTS Polyguard� Pilot Test Two
The redesigned PolyGuard™ absorption units each contained approximately 8 ft3 ofPolyGuard™ and were designed for flowrates of 2 - 3 gpm. The units were constructed of 65 inchlong 14 inch diameter fiberglass wrapped pipe (FRP) having a length to diameter ratio of 4.6 to 1.The treatment train was also redesigned to include a 55-gallon drum of granular activated carbon(GAC) after the two PolyGuard™ absorption units.
All water samples were collected during the pumping cycle of the GTS. All samples werecollected directly into 40-milliliter septum-sealed glass vials which were pre-preserved withhydrochloric acid to a pH value of less than 2. The samples were refrigerated on-site and during
Page C5
transport to the laboratory following chain-of-custody protocols. The samples were submitted toSpectrum Analytical, Inc. of Agawam, Massachusetts for analysis using EPA Method 602, withMTBE as an additional parameter. Only effluent samples from the GAC unit were analyzed forTPH in order to meet the NPDES permit exclusion requirements. GTS Influent, PolyGuard™midpoint, and PolyGuard™ discharge/GAC influent, samples were not analyzed for TPH giventhat laboratory analyses performed during the first pilot test indicated total BTEX concentrationsexceeding TPH concentrations. The results of these analyses are included in Attachment I. Theoperational details of the second PolyGuard™ Pilot Test are as follows:
October 27, 1997; Nickerson and ECS installed the new PolyGuard™ absorption contactorunits and GAC drum at the Site. A 48 hour pump test was conducted fromOctober 27, 1997 to monitor system operating flowrates and pressures.Water samples were collected from before the first PolyGuard™ unit,between the PolyGuard™ units, after the second PolyGuard™ unit (beforethe GAC unit), and after the GAC unit. The flow meter reading wasrecorded.
October 29, 1997; Approximately 4,140 gallons of contaminated water were pumped betweenOctober 27, 1997 at 5:10 pm and October 29, 1997 at 7 am. During thetime period the sump pump was on the system had an average flowrate of1.8 gpm and an initial pressure of 18 pounds per square inch (psi) betweenthe Provectr water treatment system and the first PolyGuard™ unit.However, a pressure of 45 psi was observed on October 29, 1997 beforethe Provectr system was observed and the system was shutdown in orderto avoid burning out the sump pump. Water samples were collected frombefore the first PolyGuard™ unit, between the PolyGuard™ units, after thesecond PolyGuard™ unit (before the GAC unit), and after the GAC unit,and the flow meter reading was recorded prior to shutting the GTS down.
October 31, 1997; Due to excessive pressure drop across the venturi and Provectr system theventuri was removed, given that the water entering the Provectr issignificantly aerated by both QED pneumatic pumps and the sump pump.The GTS was restarted and observed to cycle on for approximately 10minutes and off for approximately 2 hours.
November 3, 1997; The GTS was still observed to be cycling with a peak flowrate of 1.8 gpmduring the time period the sump pump cycled on, and an average flowrateof less than 0.5 gpm. Water samples were collected from before the firstPolyGuard™ unit, between the PolyGuard™ units, after the secondPolyGuard™ unit (before the GAC unit), and after the GAC unit. The flowmeter reading was recorded.
November 5, 1997; Water samples were collected from before the first PolyGuard™ unit,between the PolyGuard™ units, after the second PolyGuard™ unit (beforethe GAC unit), and after the GAC unit. The flow meter reading wasrecorded.
November 10, 1997; Water samples were collected from before the first PolyGuard™ unit,between the PolyGuard™ units, after the second PolyGuard™ unit (beforethe GAC unit), and after the GAC unit. The flow meter reading wasrecorded.

Page C6
November 13, 1997; Cleaned all four pneumatic pumps, low delivery air pressure noted at all ofthe pumps, two of the pumps would not restart. Transfer sump heating upbut operating with significant back pressure from Provectr andPolyGuard™ absorption units. Maximum flowrate was 2 gpm. Watersamples were collected from before the first PolyGuard™ unit, between thePolyGuard™ units, after the second PolyGuard™ unit (before the GACunit), and after the GAC unit. The flow meter reading was recorded.
November 18, 1997; ECS replaced GAC unit. Nickerson personnel replaced PolyGuard™ infirst absorption unit with PolyGuard™ from second column and placedvirgin PolyGuard™ in second absorption unit. Low pressure to pneumaticpumps was determined to be stuck solenoid valve on compressor. All fourpneumatic pumps restarted. Water samples were collected from before thefirst PolyGuard™ unit, between the PolyGuard™ units, after the secondPolyGuard™ unit (before the GAC unit), and after the GAC unit. The flowmeter reading was recorded.
November 26, 1997; Water samples were collected from before the first PolyGuard™ unit,between the PolyGuard™ units, after the second PolyGuard™ unit (beforethe GAC unit), and after the GAC unit. The flow meter reading wasrecorded.
December 3, 1997; Sump pump containment observed to be periodically leaking due toexceedance of sump pump capacity by pneumatic pumps, and delaybetween shutdown of compressor and sufficient line pressure drop to shutoff pneumatic pumps. PolyGuard™ flowrate increased to 3 gpm. Backpressure on pneumatic pumps increased and lid on oil/water separatorresealed. Sump pump set to cycle at 45 minutes on and 10 minutes off.Water samples were collected from before the first PolyGuard™ unit,between the PolyGuard™ units, after the second PolyGuard™ unit (beforethe GAC unit), and after the GAC unit. The flow meter reading wasrecorded and the system was shutdown. Notified Mr. Scott Pellerin of EPAof discharge exceedance and GTS shutdown.
Between October 27, 1997 and November 18, 1997 approximately 10.4 pounds of MTBEand 5 pounds of BTEX were recovered by the two PolyGuard™ absorption units at an averageflowrate of 0.5 gpm (Table 1b). Approximately, 16,912 gallons were treated during this timeperiod. Removal rates of MTBE for the entire PolyGuard™ bed decreased from 100% to 27%over the same time period. Total capacity (assuming saturation of the first PolyGuard™ unit onNovember 13, 1997) was only 5.79 pounds of MTBE and 5.04 pounds of BTEX per 220 pounds ofPolyGuard™.
On November 18, 1997, with all four pumps on-line, the GTS resumed pumping at anaverage continuous flowrate of approximately 2 gpm, approximately 4 times the flowrate of 0.5gpm observed during the previous period. Approximately 23,800 gallons of contaminatedgroundwater were treated between November 18, 1997 and when the GTS was shutdown onDecember 3, 1997. Removal rates for the entire PolyGuard™ were approximately 21% over thistime period. Although breakthrough of MTBE from the second PolyGuard™ unit into the GAC unitand breakthrough of MTBE through the GAC unit occurred between November 18, 1997 andNovember 26, 1997, the PolyGuard™ appeared to have additional absorption capacity asdemonstrated by the laboratory analytical results for the water samples collected on December 3,1997, which indicated a removal rate of 93.4%.
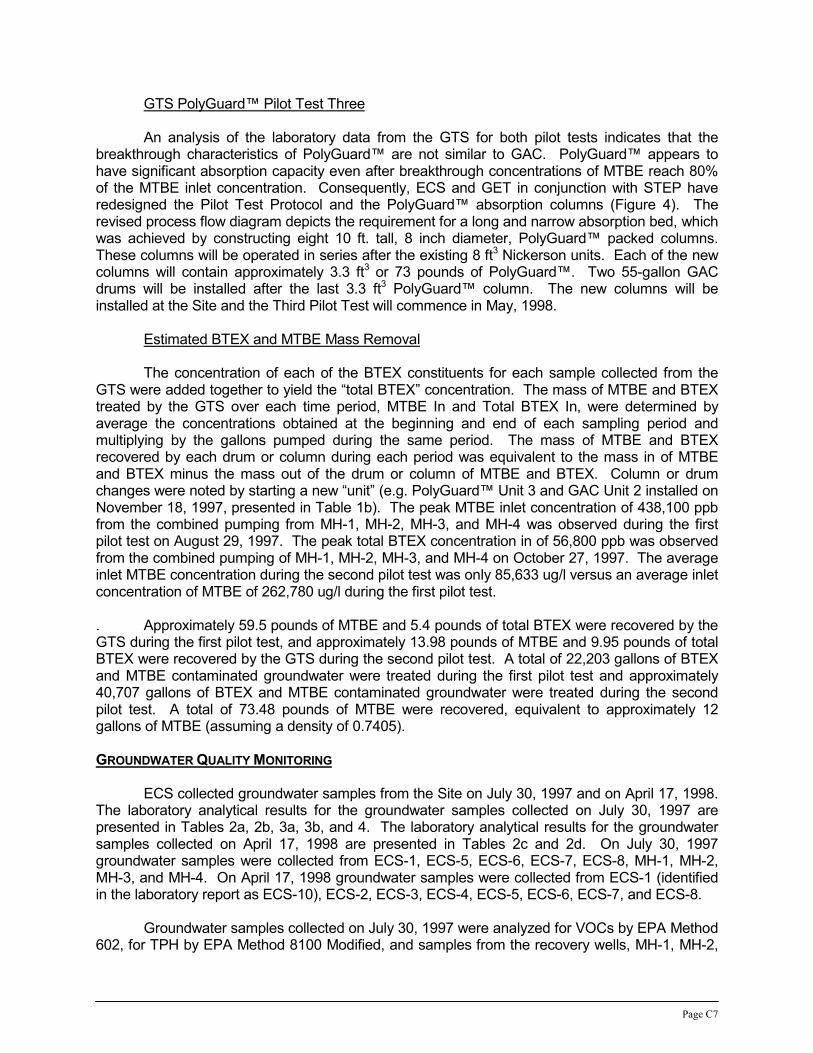
Page C7
GTS PolyGuard™ Pilot Test Three
An analysis of the laboratory data from the GTS for both pilot tests indicates that thebreakthrough characteristics of PolyGuard™ are not similar to GAC. PolyGuard™ appears tohave significant absorption capacity even after breakthrough concentrations of MTBE reach 80%of the MTBE inlet concentration. Consequently, ECS and GET in conjunction with STEP haveredesigned the Pilot Test Protocol and the PolyGuard™ absorption columns (Figure 4). Therevised process flow diagram depicts the requirement for a long and narrow absorption bed, whichwas achieved by constructing eight 10 ft. tall, 8 inch diameter, PolyGuard™ packed columns.These columns will be operated in series after the existing 8 ft3 Nickerson units. Each of the newcolumns will contain approximately 3.3 ft3 or 73 pounds of PolyGuard™. Two 55-gallon GACdrums will be installed after the last 3.3 ft3 PolyGuard™ column. The new columns will beinstalled at the Site and the Third Pilot Test will commence in May, 1998.
Estimated BTEX and MTBE Mass Removal
The concentration of each of the BTEX constituents for each sample collected from theGTS were added together to yield the “total BTEX” concentration. The mass of MTBE and BTEXtreated by the GTS over each time period, MTBE In and Total BTEX In, were determined byaverage the concentrations obtained at the beginning and end of each sampling period andmultiplying by the gallons pumped during the same period. The mass of MTBE and BTEXrecovered by each drum or column during each period was equivalent to the mass in of MTBEand BTEX minus the mass out of the drum or column of MTBE and BTEX. Column or drumchanges were noted by starting a new “unit” (e.g. PolyGuard™ Unit 3 and GAC Unit 2 installed onNovember 18, 1997, presented in Table 1b). The peak MTBE inlet concentration of 438,100 ppbfrom the combined pumping from MH-1, MH-2, MH-3, and MH-4 was observed during the firstpilot test on August 29, 1997. The peak total BTEX concentration in of 56,800 ppb was observedfrom the combined pumping of MH-1, MH-2, MH-3, and MH-4 on October 27, 1997. The averageinlet MTBE concentration during the second pilot test was only 85,633 ug/l versus an average inletconcentration of MTBE of 262,780 ug/l during the first pilot test.
. Approximately 59.5 pounds of MTBE and 5.4 pounds of total BTEX were recovered by theGTS during the first pilot test, and approximately 13.98 pounds of MTBE and 9.95 pounds of totalBTEX were recovered by the GTS during the second pilot test. A total of 22,203 gallons of BTEXand MTBE contaminated groundwater were treated during the first pilot test and approximately40,707 gallons of BTEX and MTBE contaminated groundwater were treated during the secondpilot test. A total of 73.48 pounds of MTBE were recovered, equivalent to approximately 12gallons of MTBE (assuming a density of 0.7405).
GROUNDWATER QUALITY MONITORING
ECS collected groundwater samples from the Site on July 30, 1997 and on April 17, 1998.The laboratory analytical results for the groundwater samples collected on July 30, 1997 arepresented in Tables 2a, 2b, 3a, 3b, and 4. The laboratory analytical results for the groundwatersamples collected on April 17, 1998 are presented in Tables 2c and 2d. On July 30, 1997groundwater samples were collected from ECS-1, ECS-5, ECS-6, ECS-7, ECS-8, MH-1, MH-2,MH-3, and MH-4. On April 17, 1998 groundwater samples were collected from ECS-1 (identifiedin the laboratory report as ECS-10), ECS-2, ECS-3, ECS-4, ECS-5, ECS-6, ECS-7, and ECS-8.
Groundwater samples collected on July 30, 1997 were analyzed for VOCs by EPA Method602, for TPH by EPA Method 8100 Modified, and samples from the recovery wells, MH-1, MH-2,
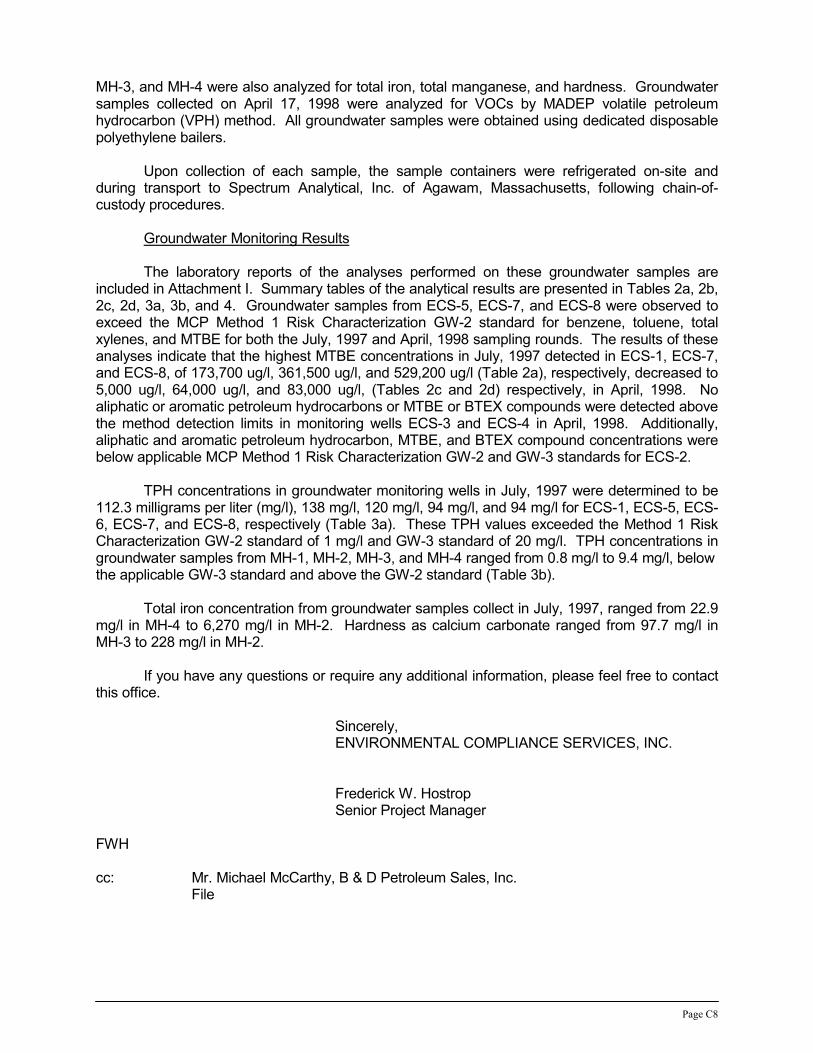
Page C8
MH-3, and MH-4 were also analyzed for total iron, total manganese, and hardness. Groundwatersamples collected on April 17, 1998 were analyzed for VOCs by MADEP volatile petroleumhydrocarbon (VPH) method. All groundwater samples were obtained using dedicated disposablepolyethylene bailers.
Upon collection of each sample, the sample containers were refrigerated on-site andduring transport to Spectrum Analytical, Inc. of Agawam, Massachusetts, following chain-of-custody procedures.
Groundwater Monitoring Results
The laboratory reports of the analyses performed on these groundwater samples areincluded in Attachment I. Summary tables of the analytical results are presented in Tables 2a, 2b,2c, 2d, 3a, 3b, and 4. Groundwater samples from ECS-5, ECS-7, and ECS-8 were observed toexceed the MCP Method 1 Risk Characterization GW-2 standard for benzene, toluene, totalxylenes, and MTBE for both the July, 1997 and April, 1998 sampling rounds. The results of theseanalyses indicate that the highest MTBE concentrations in July, 1997 detected in ECS-1, ECS-7,and ECS-8, of 173,700 ug/l, 361,500 ug/l, and 529,200 ug/l (Table 2a), respectively, decreased to5,000 ug/l, 64,000 ug/l, and 83,000 ug/l, (Tables 2c and 2d) respectively, in April, 1998. Noaliphatic or aromatic petroleum hydrocarbons or MTBE or BTEX compounds were detected abovethe method detection limits in monitoring wells ECS-3 and ECS-4 in April, 1998. Additionally,aliphatic and aromatic petroleum hydrocarbon, MTBE, and BTEX compound concentrations werebelow applicable MCP Method 1 Risk Characterization GW-2 and GW-3 standards for ECS-2.
TPH concentrations in groundwater monitoring wells in July, 1997 were determined to be112.3 milligrams per liter (mg/l), 138 mg/l, 120 mg/l, 94 mg/l, and 94 mg/l for ECS-1, ECS-5, ECS-6, ECS-7, and ECS-8, respectively (Table 3a). These TPH values exceeded the Method 1 RiskCharacterization GW-2 standard of 1 mg/l and GW-3 standard of 20 mg/l. TPH concentrations ingroundwater samples from MH-1, MH-2, MH-3, and MH-4 ranged from 0.8 mg/l to 9.4 mg/l, belowthe applicable GW-3 standard and above the GW-2 standard (Table 3b).
Total iron concentration from groundwater samples collect in July, 1997, ranged from 22.9mg/l in MH-4 to 6,270 mg/l in MH-2. Hardness as calcium carbonate ranged from 97.7 mg/l inMH-3 to 228 mg/l in MH-2.
If you have any questions or require any additional information, please feel free to contactthis office.
Sincerely,ENVIRONMENTAL COMPLIANCE SERVICES, INC.
Frederick W. HostropSenior Project Manager
FWH
cc: Mr. Michael McCarthy, B & D Petroleum Sales, Inc.File
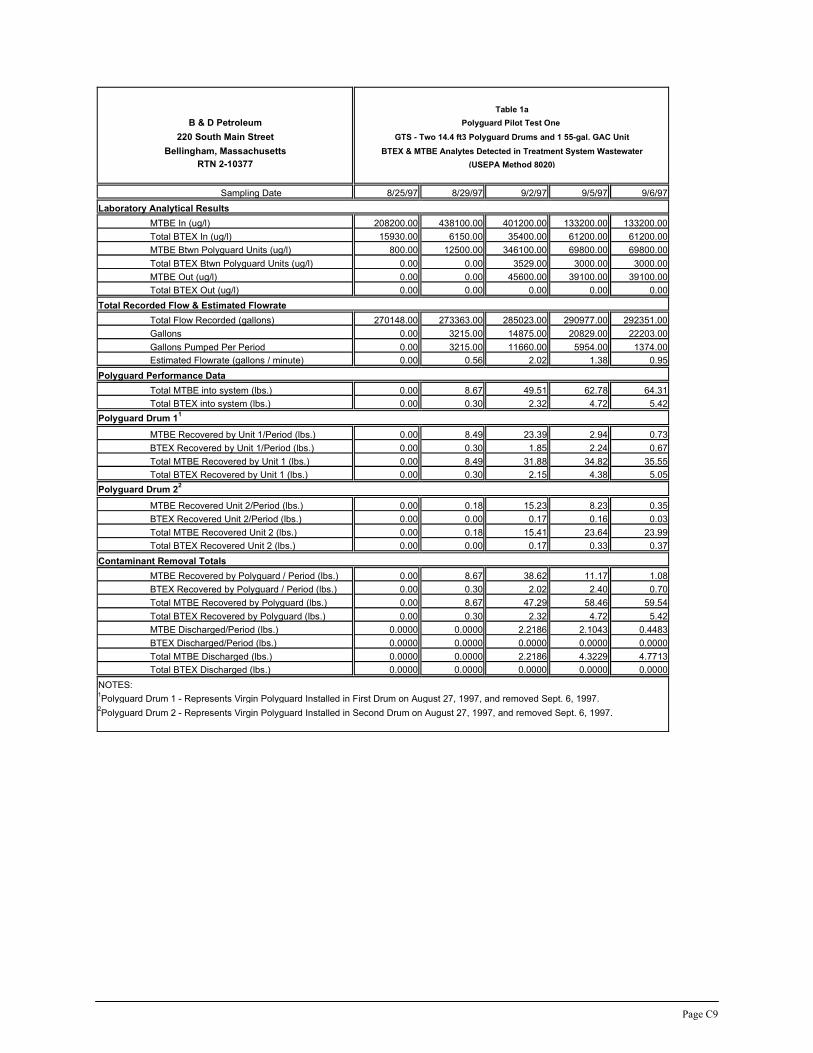
Page C9
Table 1aB & D Petroleum Polyguard Pilot Test One
220 South Main Street GTS - Two 14.4 ft3 Polyguard Drums and 1 55-gal. GAC UnitBellingham, Massachusetts BTEX & MTBE Analytes Detected in Treatment System Wastewater
RTN 2-10377 (USEPA Method 8020)
Sampling Date 8/25/97 8/29/97 9/2/97 9/5/97 9/6/97Laboratory Analytical Results
MTBE In (ug/l) 208200.00 438100.00 401200.00 133200.00 133200.00Total BTEX In (ug/l) 15930.00 6150.00 35400.00 61200.00 61200.00MTBE Btwn Polyguard Units (ug/l) 800.00 12500.00 346100.00 69800.00 69800.00Total BTEX Btwn Polyguard Units (ug/l) 0.00 0.00 3529.00 3000.00 3000.00MTBE Out (ug/l) 0.00 0.00 45600.00 39100.00 39100.00Total BTEX Out (ug/l) 0.00 0.00 0.00 0.00 0.00
Total Recorded Flow & Estimated FlowrateTotal Flow Recorded (gallons) 270148.00 273363.00 285023.00 290977.00 292351.00Gallons 0.00 3215.00 14875.00 20829.00 22203.00Gallons Pumped Per Period 0.00 3215.00 11660.00 5954.00 1374.00Estimated Flowrate (gallons / minute) 0.00 0.56 2.02 1.38 0.95
Polyguard Performance DataTotal MTBE into system (lbs.) 0.00 8.67 49.51 62.78 64.31Total BTEX into system (lbs.) 0.00 0.30 2.32 4.72 5.42
Polyguard Drum 11
MTBE Recovered by Unit 1/Period (lbs.) 0.00 8.49 23.39 2.94 0.73BTEX Recovered by Unit 1/Period (lbs.) 0.00 0.30 1.85 2.24 0.67Total MTBE Recovered by Unit 1 (lbs.) 0.00 8.49 31.88 34.82 35.55Total BTEX Recovered by Unit 1 (lbs.) 0.00 0.30 2.15 4.38 5.05
Polyguard Drum 22
MTBE Recovered Unit 2/Period (lbs.) 0.00 0.18 15.23 8.23 0.35BTEX Recovered Unit 2/Period (lbs.) 0.00 0.00 0.17 0.16 0.03Total MTBE Recovered Unit 2 (lbs.) 0.00 0.18 15.41 23.64 23.99Total BTEX Recovered Unit 2 (lbs.) 0.00 0.00 0.17 0.33 0.37
Contaminant Removal TotalsMTBE Recovered by Polyguard / Period (lbs.) 0.00 8.67 38.62 11.17 1.08BTEX Recovered by Polyguard / Period (lbs.) 0.00 0.30 2.02 2.40 0.70Total MTBE Recovered by Polyguard (lbs.) 0.00 8.67 47.29 58.46 59.54Total BTEX Recovered by Polyguard (lbs.) 0.00 0.30 2.32 4.72 5.42MTBE Discharged/Period (lbs.) 0.0000 0.0000 2.2186 2.1043 0.4483BTEX Discharged/Period (lbs.) 0.0000 0.0000 0.0000 0.0000 0.0000Total MTBE Discharged (lbs.) 0.0000 0.0000 2.2186 4.3229 4.7713Total BTEX Discharged (lbs.) 0.0000 0.0000 0.0000 0.0000 0.0000
NOTES: 1Polyguard Drum 1 - Represents Virgin Polyguard Installed in First Drum on August 27, 1997, and removed Sept. 6, 1997.2Polyguard Drum 2 - Represents Virgin Polyguard Installed in Second Drum on August 27, 1997, and removed Sept. 6, 1997.

Page C10
Table 1bB & D Petroleum Polyguard Pilot Test Two
220 South Main Street Groundwater Treatment System - Two 8 ft3 Polyguard Columns and 1 55-gal. GAC UnitBellingham, Massachusetts BTEX & MTBE Analytes Detected in Treatment System Wastewater
RTN 2-10377 (USEPA Method 8020)
Sampling Date 10/27/97 10/29/97 11/3/97 11/5/97 11/10/97 11/13/97 11/18/97 11/26/97 12/3/97Laboratory Analytical Results
MTBE In (ug/l) 58800.00 132800.00 99000.00 110600.00 89200.00 80300.00 71000.00 68400.00 60600.00Total BTEX In (ug/l) 56800.00 40510.00 37400.00 33100.00 27130.00 31100.00 25500.00 24950.00 21340.00MTBE Btwn Polyguard Units (ug/l) 9.40 43700.00 41000.00 68500.00 65900.00 60000.00 82800.00 56100.00 49500.00Total BTEX Btwn Polyguard Units (ug/l) 20.80 240.00 64.00 78.00 370.00 360.00 310.00 1370.00 580.00MTBE Into GAC (ug/l) 0.00 300.00 4600.00 10200.00 33300.00 66600.00 52100.00 53800.00 5300.00Total BTEX Into GAC (ug/l) 0.00 0.00 0.00 0.00 0.00 0.00 130.00 210.00 110.00MTBE Out of GAC (ug/l) 0.00 0.00 0.00 0.00 0.00 0.00 0.00 45600.00 39100.00Total BTEX Out of GAC (ug/l) 0.00 0.00 0.00 0.00 0.00 0.00 0.00 0.00 0.00
Total Recorded Flow & Estimated FlowrateTotal Flow Recorded (gallons) 292351.00 296490.00 299198.00 300101.00 304480.00 306377.00 309263.00 327391.00 333058.00Gallons 0.00 4139.00 6847.00 7750.00 12129.00 14026.00 16912.00 35040.00 40707.00Gallons Pumped Per Period 0.00 4139.00 2708.00 903.00 4379.00 1897.00 2886.00 18128.00 5667.00Estimated Flowrate (gallons / minute) 0.00 1.44 0.38 0.31 0.61 0.44 0.40 1.57 0.56
Polyguard Performance DataTotal MTBE into system (lbs.) 0.00 3.31 5.93 6.72 10.37 11.71 13.53 24.08 27.13Total BTEX into system (lbs.) 0.00 1.68 2.56 2.83 3.93 4.39 5.07 8.89 9.98
Polyguard Unit 11
MTBE Recovered by Unit 1/Period (lbs.) 0.00 2.55 1.66 0.38 1.20 0.00 0.00 0.00 0.00BTEX Recovered by Unit 1/Period (lbs.) 0.00 1.68 0.88 0.27 1.09 0.46 0.67 0.00 0.00Total MTBE Recovered by Unit 1 (lbs.) 0.00 2.55 4.22 4.59 5.79 5.79 5.79 0.00 0.00Total BTEX Recovered by Unit 1 (lbs.) 0.00 1.68 2.55 2.82 3.91 4.37 5.04 0.00 0.00
Polyguard Unit 22
MTBE Recovered Unit 2/Period (lbs.) 0.00 0.75 0.90 0.36 1.66 0.21 0.29 0.04 0.55BTEX Recovered Unit 2/Period (lbs.) 0.00 0.00 0.00 0.00 0.01 0.01 0.01 3.69 1.05Total MTBE Recovered Unit 2 (lbs.) 0.00 0.75 1.65 2.01 3.67 3.88 4.17 4.20 4.76Total BTEX Recovered Unit 2 (lbs.) 0.00 0.00 0.01 0.01 0.02 0.02 0.03 3.72 4.77
Polyguard Unit 33
MTBE Recovered Unit 3/Period (lbs.) 0.00 0.00 0.00 0.00 0.00 0.00 0.00 2.50 0.49BTEX Recovered Unit 3/Period (lbs.) 0.00 0.00 0.00 0.00 0.00 0.00 0.00 0.10 0.04Total MTBE Recovered Unit 3 (lbs.) 0.00 0.00 0.00 0.00 0.00 0.00 0.00 2.50 2.99Total BTEX Recovered Unit 3 (lbs.) 0.00 0.00 0.00 0.00 0.00 0.00 0.00 0.10 0.14
GAC Carbon Unit 14
MTBE Recovered GAC Unit 1/Period (lbs.) 0.00 0.01 0.06 0.06 0.79 0.79 1.43 0.00 0.00BTEX Recovered GAC Unit 1/Period (lbs.) 0.00 0.00 0.00 0.00 0.00 0.00 0.00 0.00 0.00Total MTBE Recovered GAC Unit 1 (lbs.) 0.00 0.01 0.06 0.12 0.91 1.70 3.13 0.00 0.00Total BTEX Recovered GAC Unit 1 (lbs.) 0.00 0.00 0.00 0.00 0.00 0.00 0.00 0.00 0.00
GAC Carbon Unit 25
MTBE Recovered GAC Unit 3/Period (lbs.) 0.00 0.00 0.00 0.00 0.00 0.00 0.00 4.56 0.00BTEX Recovered Unit 3/Period (lbs.) 0.00 0.00 0.00 0.00 0.00 0.00 0.00 0.03 0.01Total MTBE Recovered Unit 3 (lbs.) 0.00 0.00 0.00 0.00 0.00 0.00 0.00 4.56 4.56Total BTEX Recovered Unit 3 (lbs.) 0.00 0.00 0.00 0.00 0.00 0.00 0.00 0.03 0.03
Contaminant Removal TotalsMTBE Recovered by Polyguard / Period (lbs.) 0.00 3.30 2.56 0.73 2.86 0.55 0.39 2.53 1.05BTEX Recovered by Polyguard / Period (lbs.) 0.00 1.68 0.88 0.27 1.10 0.46 0.68 3.79 1.09Total MTBE Recovered by Polyguard (lbs.) 0.00 3.30 5.87 6.60 9.46 10.01 10.40 12.94 13.98Total BTEX Recovered by Polyguard (lbs.) 0.00 1.68 2.56 2.83 3.93 4.39 5.07 8.86 9.95MTBE Recovered by GAC / Period (lbs.) 0.00 0.01 0.06 0.06 0.79 0.79 1.43 4.56 0.00BTEX Recovered by GAC / Period (lbs.) 0.00 0.00 0.00 0.00 0.00 0.00 0.00 0.03 0.01Total MTBE Recovered by GAC (lbs.) 0.00 0.01 0.06 0.12 0.91 1.70 3.13 7.69 7.69Total BTEX Recovered by GAC (lbs.) 0.00 0.00 0.00 0.00 0.00 0.00 0.00 0.03 0.03MTBE Discharged from GAC/Period (lbs.) 0.0000 0.0000 0.0000 0.0000 0.0000 0.0000 0.0000 3.4493 2.0029BTEX Discharged from GAC/Period (lbs.) 0.0000 0.0000 0.0000 0.0000 0.0000 0.0000 0.0000 0.0000 0.0000Total MTBE Discharged from GAC (lbs.) 0.0000 0.0000 0.0000 0.0000 0.0000 0.0000 0.0000 3.4493 5.4522Total BTEX Discharged from GAC (lbs.) 0.0000 0.0000 0.0000 0.0000 0.0000 0.0000 0.0000 0.0000 0.0000
NOTES: 1Polyguard Unit 1 - Represents Virgin Polyguard Installed in First FRP Canister on October 27, 1997, and removed on November 18, 1997, after sampling.2Polyguard Unit 2 - Virgin Polyguard Installed in Second FRP Canister on October 27, 1998 and transferred into First FRP Canister on November 18, 1997, after sampling.3Polyguard Unit 3 - Represents Virgin Polyguard Installed in Second FRP Canister on November 18, 1997, after sampling.

Guardian Environmental Technologies Inc. Technology Demonstration
Center for Energy Efficiency and Renewable Energy Page 50University of Massachusetts at Amherst
Appendix D: Remediation Action Plan Status Report, May, 1999
Guardian Environmental Technologies Inc. Technology Demonstration
Center for Energy Efficiency and Renewable Energy Page 51University of Massachusetts at Amherst
Page D1
RELEASE ABATEMENT MEASURESTATUS REPORT
B & D PETROLEUM SALES FACILITY220 SOUTH MAIN STREET
BELLINGHAM, MASSACHUSETTSDEP SITE #2-10377
Prepared For:
Massachusetts Department ofEnvironmental Protection
627 Main StreetWorcester, Massachusetts 01605
Prepared By:
Environmental Compliance Services, Inc.18 Shepard Street
Brighton, Massachusetts 02135
File No. J50053RAMStatus2.doc
May, 1999
Page D2
May 14, 1999File No. J50053
Massachusetts Department of Environmental ProtectionBureau of Waste Site Cleanup627 Main StreetWorcester, Massachusetts 01605
Attn: Mr. Radesha Thuraisingham
RE: Release Abatement Measure Status ReportB & D Petroleum Sales Facility220 South Main StreetBellingham, MassachusettsDEP RTN #2-10377
Dear Mr. Thuraisingham:
On behalf of B & D Petroleum Sales, Inc. of Springfield, Massachusetts, EnvironmentalCompliance Services, Inc. (ECS) has prepared this Release Abatement Measure (RAM) statusreport summarizing activities which took place between April, 1998 and April, 1999 at the B & DPetroleum Sales Facility located at 220 South Main Street in Bellingham, Massachusetts (here-in-after referred to as “the Site”) (See Figure 1 - Site Locus). This report presents the results ofremedial operations associated with the groundwater recovery and treatment system (GTS), GTSsampling and analysis results, and monitoring of the groundwater quality at the Site.
REMEDIAL OPERATIONS
Data and observations concerning GTS operations at the B & D Petroleum Sales Facilityin Bellingham, Massachusetts are discussed in this section, covering the operation of recoverywells RW-1, RW-2, RW-3, and RW-4 located on the property of New England Food Service, andthe operation and modification of the GTS after the completion of the second pilot test. Theprocess flow schematic for the third pilot test is presented in Figure 2. Owing to the configurationof the absorption columns for the third pilot test, water samples from the system were collectedfrom various sampling points: before the first Nickerson Absorption Column, after the secondNickerson Absorption Column, after the first, second, fourth, seventh, and eighth ECS AbsorptionColumns, and after the first and second granular activated carbon (GAC) adsorption unit.
Analytical results of GTS water samples are summarized in Table 1 for the third pilot testcommenced on June 17, 1998. The laboratory reports for all of the analyses are included inAttachment I.
Groundwater Treatment System Operations
During the time period encompassed by this report, the GTS at the Site was operationalfrom June 17, 1998 to July 24, 1998, and from August 11, 1998 through September 8, 1998 andfrom September 24, 1998 to September 28, 1998, and from December 18, 1998 throughDecember 23, 1998.
Page D3
The GTS was shut down from July 24, 1998 to August 11, 1998 due to an extremely lowpumping rate. The low pumping rate was attributed to fouling of the pneumatic pumps andexcessive back pressure from the Provectr iron removal system. Repairs were completed onAugust 11, 1998 and the GTS was restarted.
On September 8, 1998, the GTS was shut down owing to the detection of MTBE in theeffluent from the first of two 55-gallon granular activated carbon (GAC) adsorption units (depictedin Figure 2). No exceedance of the NPDES permitted discharge concentration of 70 parts perbillion (ppb) for methyl tert-butyl ether (MTBE) from the GTS occurred. Additionally, none of theother target contaminants: benzene, toluene, ethylbenzene, xylene (BTEX), or total petroleumhydrocarbons (TPH) were detected at any time in the GTS effluent during the pilot test.
The GAC units were replaced and the GTS was restarted on September 24, 1998. OnSeptember 28, 1998, the GTS shut down owing to failure of the pneumatic pumps from ironfouling. Additional modifications were proposed and implemented at this time to the GTS,including heat taping and insulating of the lines associated with the ECS columns and installationand replacement of the automatic head for the Provectr iron removal system. Repairs to thesystem were conducted in October and November, 1998 and the system was restarted onDecember 18, 1999. Sustained subfreezing temperatures caused system failure on December23, 1998, and the GTS was shut down pending redesign to increase the overall system flowrate.The design of the new GTS will be presented in the Phase III - Identification, Evaluation, andSelection of Comprehensive Remedial Action Alternatives Report (Phase III, 310 CMR 40.0851-0869).
ECS and Guardian Environmental Technologies (GET) of Kent, Connecticut modified theabsorption column design to eliminate mechanical failure or bypass associated with the 110-gallon (14.4 ft3) Polyguard™ canisters after Pilot Test One. This modified absorption columndesign was continued for Pilot Test Three with the construction of eight 10’ long verticalabsorption columns, each with a capacity of 3.2 ft3. These columns were placed in series after thetwo 7 ft3 columns constructed and utilized in Pilot Test Two (See Figure 2). Given PolyguardTM’sdensity of approximately 18 lbs./ft3, these additional columns contained approximately 57.6 lbs. ofPolyguardTM each for a total of 460 lbs. Consequently, Pilot Test Three utilized a total of 712 lbs.of PolyguardTM, 252 lbs. of which were contained in the two 7 ft3 “Nickerson” columns, and 460lbs. of which were contained in the eight “ECS” columns. The total residence time for thePolyguardTM treatment train at a flowrate of 2 gpm was estimated to be 148 minutes. Two 55-gallon, 200 lbs. GAC units were installed after the final PolyguardTM absorption column given thatthe two prior Pilot Tests indicated rapid breakthrough of MTBE at low concentrations.
GTS PolyGuard™ Pilot Test Three
All water samples were collected during the pumping cycle of the GTS. All samples werecollected directly into 40-milliliter septum-sealed glass vials which were pre-preserved withhydrochloric acid to a pH value of less than 2. The samples were refrigerated on-site and duringtransport to the laboratory following chain-of-custody protocols. The samples were submitted toSpectrum Analytical, Inc. of Agawam, Massachusetts for analysis using EPA Method 602, withMTBE as an additional parameter. Only effluent samples from the GAC unit were analyzed forTPH in order to meet the NPDES permit exclusion requirements. GTS Influent or Polyguard™ In(PIN), discharge from second Nickerson column (N2), discharge from first ECS column (E1),discharge from second ECS column (E2), discharge from fourth ECS column (E4), discharge fromseventh ECS column (E7), discharge from eighth ECS column (E8), and discharge from GACunits one and two (C1) and (C2). The results of these analyses are included in Attachment I.
Page D4
GTS PolyGuard™ Pilot Test Three
An analysis of the laboratory data from the GTS for all three pilot tests indicates that thebreakthrough characteristics of Polyguard™ are not similar to GAC for MTBE. Polyguard™ stillhas significant absorption capacity even after breakthrough of MTBE occurs. During pilot testthree MTBE concentrations exceeding NPDES allowable concentrations broke through the entire712 lbs. of Polyguard™ into the GAC units after removing only 5.86 lbs. of MTBE, or breakthroughoccurred after 0.8% mass ratio application of MTBE to Polyguard™ (This ratio was only 0.2%when MTBE broke through column E7).
The existing Nickerson columns, which were carried over in their configuration from pilottest two, absorbed an additional 1.24 lbs. of MTBE during pilot test three and 99+% of the totalBTEX compounds. Total loadings on the Nickerson columns between pilot tests two and pilot testthree were 8.99 lbs. of MTBE and 10.38 lbs. of total BTEX (approximately 99% of the total BTEXtreated during pilot tests two and three). MTBE breakthrough of the Nickerson columns within10% of the inlet MTBE concentration was observed on July 2 and July 17, 1998. This mayindicate that the Nickerson columns were near capacity for MTBE absorption, in which case thecapacity of Polyguard™ for MTBE would be approximately 4% (8.99 lbs. MTBE absorbed / 252lbs. Polyguard™). No comparable value can be calculated for total BTEX; however, sampling ofthe GTS in December, 1998 documented that only benzene was breaking through the first of thetwo Nickerson columns; consequently, Polyguard’s capacity for BTEX is greater than 8% (10.38lbs. total BTEX / 126 lbs. Polyguard™).
Estimated BTEX and MTBE Mass Removal
The concentration of each of the BTEX constituents for each sample collected from theGTS were added together to yield the “total BTEX” concentration. The mass of MTBE and BTEXtreated by the GTS over each time period, MTBE In and Total BTEX In, were determined byaveraging the concentrations obtained at the beginning and end of each sampling period andmultiplying by the gallons pumped during the same period. The mass of MTBE and BTEXrecovered by each column or set of columns (e.g. ECS-4 represents the total absorbed bycolumns ECS-3 and ECS-4, and ECS-7 represents the total absorbed by columns ECS-5, ECS-6,and ECS-7) during each period was equivalent to the mass in of MTBE and BTEX minus themass out of the column or train of columns of MTBE and BTEX. Only the GAC units werechanged during the performance of pilot test three. The peak MTBE inlet concentration of438,100 ug/l from the combined pumping from MH-1, MH-2, MH-3, and MH-4 was observedduring the first pilot test on August 29, 1997. The peak total BTEX concentration in of 56,800 ug/lwas observed from the combined pumping of MH-1, MH-2, MH-3, and MH-4 on October 27, 1997.The peak MTBE inlet concentration during the third pilot test was 69,200 ug/l on July 10,1998, andthe peak total BTEX inlet concentration during the third pilot test was 26,560 ug/l on July 10, 1998.The average inlet MTBE concentration during the second pilot test was only 85,633 ug/l versus anaverage inlet concentration of MTBE of 262,780 ug/l during the first pilot test. The average inletMTBE concentration during the third pilot test decreased to 43,451 ug/l from the first and secondpilot tests. The average total BTEX concentration during the third pilot test decreased to
. Approximately 59.5 lbs. of MTBE and 5.4 lbs. of total BTEX were recovered by the GTSduring the first pilot test, 13.98 lbs. of MTBE and 9.95 lbs. of total BTEX were recovered by theGTS during the second pilot test, and 12.07 lbs. of MTBE and 5.1 pounds of total BTEX wererecovered by the GTS during the third pilot test. A total of 22,203 gallons of BTEX and MTBEcontaminated groundwater were treated during the first pilot test, approximately 40,707 gallons

Page D5
were treated during the second pilot test, and approximately 47,626 gallons were treated duringthe third pilot test. A total of 85.55 pounds of MTBE was recovered during the performance of thethree pilot tests, equivalent to approximately 13.8 gallons of MTBE (assuming a density of0.7405).
GROUNDWATER QUALITY MONITORING
ECS collected groundwater samples from the Site on March 10, 1999 as part of the PhaseII Scope of Work after completing the installation of five additional soil borings along South MainStreet (See Figure 1). These laboratory analytical results will be presented in the Phase II -Comprehensive Site Assessment Report.
If you have any questions or require any additional information, please feel free to contactthis office.
Sincerely,ENVIRONMENTAL COMPLIANCE SERVICES, INC.
Frederick W. HostropSenior Project Manager
FWH
cc: Mr. Michael McCarthy, B & D Petroleum Sales, Inc.File
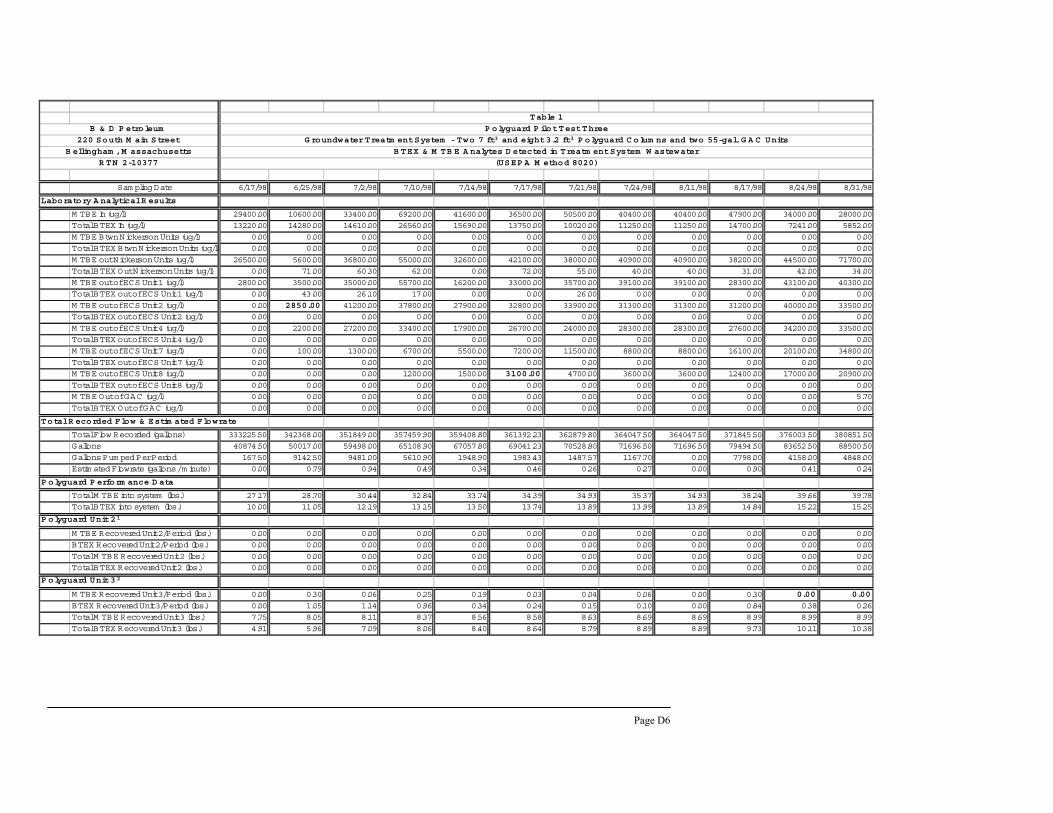
Page D6
Table 1
B & D P etroleum P olyguard P ilot Test Three
220 South M ain Street G roundwater Treatm ent System - Two 7 ft3 and eight 3.2 ft3 P olyguard C olum ns and two 55-gal. G A C Units
B ellingham , M assachusetts B TEX & M TB E A nalytes D etected in Treatm ent System W astewater
R TN 2-10377 (USEP A M ethod 8020)
Sam pling Date 6/17/98 6/25/98 7/2/98 7/10/98 7/14/98 7/17/98 7/21/98 7/24/98 8/11/98 8/17/98 8/24/98 8/31/98
Laboratory A nalytical R esults
M TBE In (ug/l) 29400.00 10600.00 33400.00 69200.00 41600.00 36500.00 50500.00 40400.00 40400.00 47900.00 34000.00 28000.00Total BTEX In (ug/l) 13220.00 14280.00 14610.00 26560.00 15690.00 13750.00 10020.00 11250.00 11250.00 14700.00 7241.00 5852.00
M TBE Btwn Nickerson Units (ug/l) 0.00 0.00 0.00 0.00 0.00 0.00 0.00 0.00 0.00 0.00 0.00 0.00Total BTEX Btwn Nickerson Units (ug/l) 0.00 0.00 0.00 0.00 0.00 0.00 0.00 0.00 0.00 0.00 0.00 0.00
M TBE out Nickerson Units (ug/l) 26500.00 5600.00 36800.00 55000.00 32600.00 42100.00 38000.00 40900.00 40900.00 38200.00 44500.00 71700.00Total BTEX Out Nickerson Units (ug/l) 0.00 71.00 60.30 62.00 0.00 72.00 55.00 40.00 40.00 31.00 42.00 34.00
M TBE out of ECS Unit 1 (ug/l) 2800.00 3500.00 35000.00 55700.00 16200.00 33000.00 35700.00 39100.00 39100.00 28300.00 43100.00 40300.00Total BTEX out of ECS Unit 1 (ug/l) 0.00 43.00 26.10 17.00 0.00 0.00 26.00 0.00 0.00 0.00 0.00 0.00
M TBE out of ECS Unit 2 (ug/l) 0.00 2850.00 41200.00 37800.00 27900.00 32800.00 33900.00 31300.00 31300.00 31200.00 40000.00 33500.00Total BTEX out of ECS Unit 2 (ug/l) 0.00 0.00 0.00 0.00 0.00 0.00 0.00 0.00 0.00 0.00 0.00 0.00
M TBE out of ECS Unit 4 (ug/l) 0.00 2200.00 27200.00 33400.00 17900.00 26700.00 24000.00 28300.00 28300.00 27600.00 34200.00 33500.00Total BTEX out of ECS Unit 4 (ug/l) 0.00 0.00 0.00 0.00 0.00 0.00 0.00 0.00 0.00 0.00 0.00 0.00M TBE out of ECS Unit 7 (ug/l) 0.00 100.00 1300.00 6700.00 5500.00 7200.00 11500.00 8800.00 8800.00 16100.00 20100.00 34800.00
Total BTEX out of ECS Unit 7 (ug/l) 0.00 0.00 0.00 0.00 0.00 0.00 0.00 0.00 0.00 0.00 0.00 0.00M TBE out of ECS Unit 8 (ug/l) 0.00 0.00 0.00 1200.00 1500.00 3100.00 4700.00 3600.00 3600.00 12400.00 17000.00 20900.00
Total BTEX out of ECS Unit 8 (ug/l) 0.00 0.00 0.00 0.00 0.00 0.00 0.00 0.00 0.00 0.00 0.00 0.00M TBE Out of GAC (ug/l) 0.00 0.00 0.00 0.00 0.00 0.00 0.00 0.00 0.00 0.00 0.00 5.70
Total BTEX Out of GAC (ug/l) 0.00 0.00 0.00 0.00 0.00 0.00 0.00 0.00 0.00 0.00 0.00 0.00
Total R ecorded Flow & Estim ated Flowrate
Total Flow Recorded (gallons) 333225.50 342368.00 351849.00 357459.90 359408.80 361392.23 362879.80 364047.50 364047.50 371845.50 376003.50 380851.50Gallons 40874.50 50017.00 59498.00 65108.90 67057.80 69041.23 70528.80 71696.50 71696.50 79494.50 83652.50 88500.50
Gallons Pum ped Per Period 167.50 9142.50 9481.00 5610.90 1948.90 1983.43 1487.57 1167.70 0.00 7798.00 4158.00 4848.00Estim ated Flowrate (gallons / m inute) 0.00 0.79 0.94 0.49 0.34 0.46 0.26 0.27 0.00 0.90 0.41 0.24
P olyguard P erform ance D ata
Total M TBE into system (lbs.) 27.17 28.70 30.44 32.84 33.74 34.39 34.93 35.37 34.93 38.24 39.66 39.78Total BTEX into system (lbs.) 10.00 11.05 12.19 13.15 13.50 13.74 13.89 13.99 13.89 14.84 15.22 15.25
P olyguard Unit 21
M TBE Recovered Unit 2/Period (lbs.) 0.00 0.00 0.00 0.00 0.00 0.00 0.00 0.00 0.00 0.00 0.00 0.00BTEX Recovered Unit 2/Period (lbs.) 0.00 0.00 0.00 0.00 0.00 0.00 0.00 0.00 0.00 0.00 0.00 0.00
Total M TBE Recovered Unit 2 (lbs.) 0.00 0.00 0.00 0.00 0.00 0.00 0.00 0.00 0.00 0.00 0.00 0.00Total BTEX Recovered Unit 2 (lbs.) 0.00 0.00 0.00 0.00 0.00 0.00 0.00 0.00 0.00 0.00 0.00 0.00
P olyguard Unit 32
M TBE Recovered Unit 3/Period (lbs.) 0.00 0.30 0.06 0.25 0.19 0.03 0.04 0.06 0.00 0.30 0.00 0.00
BTEX Recovered Unit 3/Period (lbs.) 0.00 1.05 1.14 0.96 0.34 0.24 0.15 0.10 0.00 0.84 0.38 0.26Total M TBE Recovered Unit 3 (lbs.) 7.75 8.05 8.11 8.37 8.56 8.58 8.63 8.69 8.69 8.99 8.99 8.99
Total BTEX Recovered Unit 3 (lbs.) 4.91 5.96 7.09 8.06 8.40 8.64 8.79 8.89 8.89 9.73 10.11 10.38
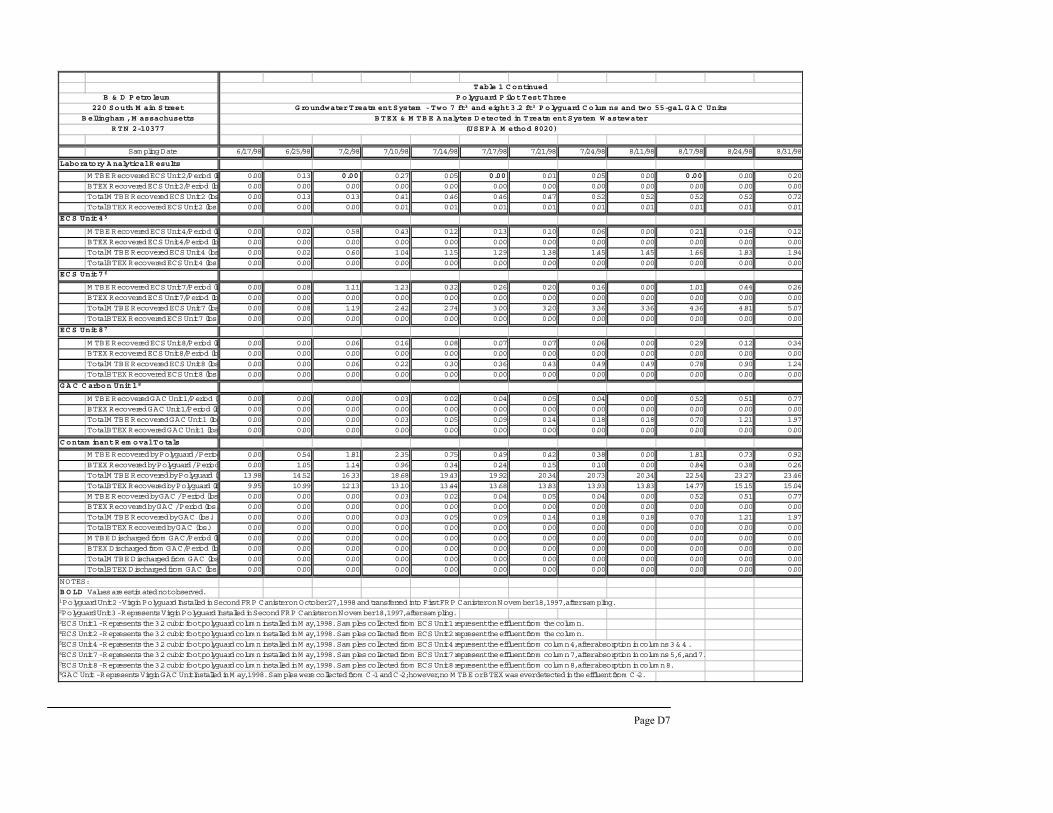
Page D7
Table 1 C ontinued
B & D P etroleum P olyguard P ilot Test Three
220 South M ain Street G roundwater Treatm ent System - Two 7 ft3 and eight 3.2 ft3 P olyguard C olum ns and two 55-gal. G A C Units
B ellingham , M assachusetts B TEX & M TB E A nalytes D etected in Treatm ent System W astewater
R TN 2-10377 (USEP A M ethod 8020)
Sam pling Date 6/17/98 6/25/98 7/2/98 7/10/98 7/14/98 7/17/98 7/21/98 7/24/98 8/11/98 8/17/98 8/24/98 8/31/98
Laboratory A nalytical R esults
M TBE Recovered ECS Unit 2/Period (lb 0.00 0.13 0.00 0.27 0.05 0.00 0.01 0.05 0.00 0.00 0.00 0.20
BTEX Recovered ECS Unit 2/Period (lbs 0.00 0.00 0.00 0.00 0.00 0.00 0.00 0.00 0.00 0.00 0.00 0.00
Total M TBE Recovered ECS Unit 2 (lbs 0.00 0.13 0.13 0.41 0.46 0.46 0.47 0.52 0.52 0.52 0.52 0.72
Total BTEX Recovered ECS Unit 2 (lbs. 0.00 0.00 0.00 0.01 0.01 0.01 0.01 0.01 0.01 0.01 0.01 0.01
EC S Unit 45
M TBE Recovered ECS Unit 4/Period (lb 0.00 0.02 0.58 0.43 0.12 0.13 0.10 0.06 0.00 0.21 0.16 0.12
BTEX Recovered ECS Unit 4/Period (lbs 0.00 0.00 0.00 0.00 0.00 0.00 0.00 0.00 0.00 0.00 0.00 0.00
Total M TBE Recovered ECS Unit 4 (lbs 0.00 0.02 0.60 1.04 1.15 1.29 1.38 1.45 1.45 1.66 1.83 1.94
Total BTEX Recovered ECS Unit 4 (lbs. 0.00 0.00 0.00 0.00 0.00 0.00 0.00 0.00 0.00 0.00 0.00 0.00
EC S Unit 76
M TBE Recovered ECS Unit 7/Period (lb 0.00 0.08 1.11 1.23 0.32 0.26 0.20 0.16 0.00 1.01 0.44 0.26
BTEX Recovered ECS Unit 7/Period (lbs 0.00 0.00 0.00 0.00 0.00 0.00 0.00 0.00 0.00 0.00 0.00 0.00
Total M TBE Recovered ECS Unit 7 (lbs 0.00 0.08 1.19 2.42 2.74 3.00 3.20 3.36 3.36 4.36 4.81 5.07
Total BTEX Recovered ECS Unit 7 (lbs. 0.00 0.00 0.00 0.00 0.00 0.00 0.00 0.00 0.00 0.00 0.00 0.00
EC S Unit 87
M TBE Recovered ECS Unit 8/Period (lb 0.00 0.00 0.06 0.16 0.08 0.07 0.07 0.06 0.00 0.29 0.12 0.34
BTEX Recovered ECS Unit 8/Period (lbs 0.00 0.00 0.00 0.00 0.00 0.00 0.00 0.00 0.00 0.00 0.00 0.00
Total M TBE Recovered ECS Unit 8 (lbs 0.00 0.00 0.06 0.22 0.30 0.36 0.43 0.49 0.49 0.78 0.90 1.24
Total BTEX Recovered ECS Unit 8 (lbs. 0.00 0.00 0.00 0.00 0.00 0.00 0.00 0.00 0.00 0.00 0.00 0.00
G A C C arbon Unit 18
M TBE Recovered GAC Unit 1/Period (lb 0.00 0.00 0.00 0.03 0.02 0.04 0.05 0.04 0.00 0.52 0.51 0.77
BTEX Recovered GAC Unit 1/Period (lb 0.00 0.00 0.00 0.00 0.00 0.00 0.00 0.00 0.00 0.00 0.00 0.00
Total M TBE Recovered GAC Unit 1 (lbs 0.00 0.00 0.00 0.03 0.05 0.09 0.14 0.18 0.18 0.70 1.21 1.97
Total BTEX Recovered GAC Unit 1 (lbs 0.00 0.00 0.00 0.00 0.00 0.00 0.00 0.00 0.00 0.00 0.00 0.00
C ontam inant R em oval Totals
M TBE Recovered by Polyguard / Period 0.00 0.54 1.81 2.35 0.75 0.49 0.42 0.38 0.00 1.81 0.73 0.92
BTEX Recovered by Polyguard / Period 0.00 1.05 1.14 0.96 0.34 0.24 0.15 0.10 0.00 0.84 0.38 0.26
Total M TBE Recovered by Polyguard (lb 13.98 14.52 16.33 18.68 19.43 19.92 20.34 20.73 20.34 22.54 23.27 23.46
Total BTEX Recovered by Polyguard (lb 9.95 10.99 12.13 13.10 13.44 13.68 13.83 13.93 13.83 14.77 15.15 15.04
M TBE Recovered by GAC / Period (lbs 0.00 0.00 0.00 0.03 0.02 0.04 0.05 0.04 0.00 0.52 0.51 0.77
BTEX Recovered by GAC / Period (lbs.) 0.00 0.00 0.00 0.00 0.00 0.00 0.00 0.00 0.00 0.00 0.00 0.00
Total M TBE Recovered by GAC (lbs.) 0.00 0.00 0.00 0.03 0.05 0.09 0.14 0.18 0.18 0.70 1.21 1.97
Total BTEX Recovered by GAC (lbs.) 0.00 0.00 0.00 0.00 0.00 0.00 0.00 0.00 0.00 0.00 0.00 0.00
M TBE Discharged from GAC/Period (lb 0.00 0.00 0.00 0.00 0.00 0.00 0.00 0.00 0.00 0.00 0.00 0.00
BTEX Discharged from GAC/Period (lbs 0.00 0.00 0.00 0.00 0.00 0.00 0.00 0.00 0.00 0.00 0.00 0.00
Total M TBE Discharged from GAC (lbs 0.00 0.00 0.00 0.00 0.00 0.00 0.00 0.00 0.00 0.00 0.00 0.00
Total BTEX Discharged from GAC (lbs. 0.00 0.00 0.00 0.00 0.00 0.00 0.00 0.00 0.00 0.00 0.00 0.00
NOTES:
B O LD Values are estim ated not observed.1Polyguard Unit 2 - Virgin Polyguard Installed in Second FRP Canister on October 27, 1998 and transferred into First FRP Canister on Novem ber 18, 1997, after sam pling.2Polyguard Unit 3 - Represents Virgin Polyguard Installed in Second FRP Canister on Novem ber 18, 1997, after sam pling.3ECS Unit 1 - Represents the 3.2 cubic foot polyguard colum n installed in M ay, 1998. Sam ples collected from ECS Unit 1 represent the effluent from the colum n.4ECS Unit 2 - Represents the 3.2 cubic foot polyguard colum n installed in M ay, 1998. Sam ples collected from ECS Unit 2 represent the effluent from the colum n.5ECS Unit 4 - Represents the 3.2 cubic foot polyguard colum n installed in M ay, 1998. Sam ples collected from ECS Unit 4 represent the effluent from colum n 4, after absorption in colum ns 3 & 4 .6ECS Unit 7 - Represents the 3.2 cubic foot polyguard colum n installed in M ay, 1998. Sam ples collected from ECS Unit 7 represent the effluent from colum n 7, after absorption in colum ns 5, 6, and 7.7ECS Unit 8 - Represents the 3.2 cubic foot polyguard colum n installed in M ay, 1998. Sam ples collected from ECS Unit 8 represent the effluent from colum n 8, after absorption in colum n 8.5GAC Unit - Represents Virgin GAC Unit Installed in M ay, 1998. Sam ples were collected from C-1 and C-2; however, no M TBE or BTEX was ever detected in the effluent from C-2.