technology & business...
TRANSCRIPT

Strategic Market Insights – Q1 2017 Report
Technology & Business Services

www.g2cap.com 2
G2 Capital Advisors is pleased to present its Technology & Business Services industry update for Q1 2017,
providing commentary and analysis on M&A and market trends within the Technology & Business Services
industry. We hope you find this report helpful and encourage you to contact us directly if you would like to
discuss our perspective on the current market environment, trends, or our relevant industry experience.
G2 OverviewInvestment Banking and Restructuring Advisory
THIRTY-FIVE professionals
across SIX offices
FOUR Industry Practice Groups
Transportation & Logistics / Supply Chain
Industrials / Manufacturing
Technology / Business Services
Aerospace & Defense / Security
FIVE Service Offerings
Securities
Sell-Side
Buy-Side
Operational
Restructuring
Financial
Restructuring
G2 offers clients an operational, experience-based approach within
each of its practice sectors.
G2 is focused in four sectors; each practice group headed by a leader with 20+ years of C-level operating
experience. G2’s managing directors have navigated all stages of the corporate lifecycle, from growth to
maturity, and apply that experience to provide advisory services to our clients.
Sector-Focused; Experience-Based
Transportation &
Logistics / Supply Chain
Industrials /
Manufacturing
Technology /
Business Services
Aerospace & Defense /
Security
Led by Ron Lentz Led by Jack Shields Led by Matt Konkle Led by Bob Kinder
▪ Freight Forwarding
▪ Trucking / Final Mile
▪ Warehousing / Distribution
▪ Third Party Logistics (3PL)
▪ e-Commerce Fulfillment
▪ Manufacturing / Distribution
▪ Flooring
▪ Plastics / Packaging
▪ Consumer Products
▪ Metals
▪ Tech-enabled Services
▪ BPO
▪ Managed Services
▪ Internet & Digital Media
▪ Business Services
▪ Cyber Security
▪ Defense Robotics
▪ UAV, C4ISR, Hardware
▪ Aerospace Electronics
▪ Aerospace Components
G2 Overview

www.g2cap.com 3
Company Title Role
COO
Led the reorganization of the company’s e-Commerce fulfillment,
customer care and supply chain services business units following the
acquisition of Fifth Gear.
President
End-to-end e-Commerce services company specializing in complex
order fulfillment and BPO. Led the go-to-market strategy and growth of
the business before selling for $65 million or 15x earnings.
President
Enterprise software company specializing in order management
technology for direct-to-consumer retailers. Transformed the business
through multiple acquisitions and launch of offshore operations in India.
CFO
Pioneer in early warning notification software and services for Public
Safety industry. Led the sale of the company to Golden Gate Capital
for 3x trailing twelve month revenue.
Controller
Enterprise software company that created the Enterprise Marketing
Management (EMM) category. Acquired by Teradata Corporation for
$550M or 6x trailing twelve month revenue.
Technology & Business ServicesMatt Konkle, Managing Director
Matt Konkle brings 20+ years of C-level operating experience to G2’s Technology & Business Services
practice group. Deep industry background in e-Commerce, supply chain and logistics, enterprise
software, and business services, with operational expertise in tech-enabled services, business process
outsourcing and managed services.
Matt KonklePractice Leader
Technology & Business
Services
Market UpdateG2 Insights
Below highlights a few key trends in the Technology & Business Services industries:
▪ e-Commerce sales grew 14.6% in the first quarter of 2017 compared to the same period of 2016. In
addition to disrupting traditional retail, e-Commerce growth is driving innovation across its technology and
service providers. Consumer demand for faster, cheaper service and personalized brand experience allows
service providers that leverage technology, data and process automation to gain a competitive advantage.
▪ More businesses are implementing Cloud managed services to reduce the operational and infrastructural
costs of their core business processes. The managed mobility services segment is expected to grow at a
higher rate than business, network, security, and data services over the next five years due to adoption of
the Internet of Things (IoT) and Bring Your Own Device (BYOD).
▪ Despite increasing global economic concern and talent shortages, staffing and recruiting professionals
remain bullish for 2017 and expect performance similar to 2016. Improving revenue growth and overall
profitability are key priorities for staffing firms, which are leveraging M&A to expand geographically, add
complementary services and diversify their client base.
▪ Many industries are slated for regulatory changes under the new administration, creating opportunity for
consulting and professional services firms, particularly midmarket firms with expertise in niche
markets. Freelance and network-based models are redrawing industry lines, pushing traditional
consultancies to collaborate and explore new business models. Competing for talent, firms are turning to
technology-based solutions to enable their consulting capabilities and enhance recruitment.

www.g2cap.com 4
Technology & Business ServicesM&A Activity – Middle Market
M&A transaction multiples are the median North American M&A activity independent of target / acquirer industry and enterprise
value. The dataset has been restricted to multiples between 0.0x and 30.0x EBITDA; sourced through Pitchbook’s 2017 Q1 Report.
The U.S. Middle Market as shown in this chart has been defined as companies with an enterprise value between $25MM and
$1,000MM, and headquartered in the United States.
M&A Transaction Multiples
U.S. Middle Market Private Equity Activity
Data sourced through PitchBook 2017 Q1 Report
Total deal activity has remained steady since Q2 2013; overall deal multiples remain strong. Though
there has been some pullback in M&A, debt remains a strong driver of transaction valuations.
6.1
x
4.1
x
4.9
x
5.7
x
4.9
x
5.2
x
4.0
x 5.8
x
4.7
x
5.7
x
5.9
x
6.2
x
4.9
x
4.8
x
5.8
x
5.4
x
5.9
x
4.3
x
2.6
x
3.8
x 3.6
x
3.7
x
3.4
x
4.2
x
4.0
x
4.7
x 4.3
x
4.8
x
3.3
x
5.0
x
4.8
x
5.7
x
4.7
x
3.9
x
10.4x
6.7x
8.8x9.3x
8.6x 8.6x8.2x
9.8x9.3x
10.0x10.7x
9.5x9.9x
9.6x
11.5x
10.1x9.8x
0.0x
2.0x
4.0x
6.0x
8.0x
10.0x
12.0x
1Q 2Q 3Q 4Q 1Q 2Q 3Q 4Q 1Q 2Q 3Q 4Q 1Q 2Q 3Q 4Q 1Q
2013 2014 2015 2016 2017
Multip
les o
f E
BIT
DA
Debt/EBITDA Equity/EBITDA Valuation/EBITDA
$71
$59
$81
$89
$115
$104
$115
$113
$94
$102
$100
$104
$89
$96
$85
$87
$91
$364$333
$505 $507
$595
$518
$566
$507 $502$537
$571 $570 $559 $553
$469
$541
$422
0
100
200
300
400
500
600
700
$0
$20
$40
$60
$80
$100
$120
$140
1Q 2Q 3Q 4Q 1Q 2Q 3Q 4Q 1Q 2Q 3Q 4Q 1Q 2Q 3Q 4Q 1Q
2013 2014 2015 2016 2017*
Deal Value ($B) # of Deals Closed
Deal V
alu
e (
$B
N)
To
tal D
eal C
ount

www.g2cap.com 5
Selected Industry Deals 2017 Q1
Key Trading Statistics
Several notable transactions have already been completed or announced in the Technology &
Business Services industry through 2017 Q1. G2 has outlined select transactions below, followed by
a more comprehensive list on the following tables.
Technology & Business Services
Technology & Business Services
Sector Summary in Millions USD (converted where necessary)
Data sourced from S&P Capital IQ on Friday, March 31, 2016
FY 20171 LTM2
SectorNumber of
Companies
Median Enterprise
Value (MM)
Median
Revenue
Growth
Median
EBITDA
Growth*
EV /
Revenue
EV /
EBITDA
BPO 17 6,013 8.2% 12.0% 2.6x 12.6x
Business Intelligence 10 5,884 31.1% 10.8% 5.5x 17.4x
Consulting Services 15 1,199 6.1% 23.4% 1.8x 12.5x
Cloud Software &
Services13 6,089 27.6% 58.5% 6.3x NM
e-Commerce Services 8 30,045 19.0% 62.0% 4.1x 20.8x
Mobile Wireless 20 2,162 6.8% 13.5% 2.5x 9.4x
1 Estimated – 2017 Fiscal Year2 LTM Multiples as at Friday, March 31, 2016
* YoY growth calculations exclude companies with negative margins in either period
considered.
▪ Innosight acquired by Huron (March 2017) – Innosight Holdings LLC, a growth strategy firm focused
on helping companies navigate disruptive change, enable innovation and manage strategic
transformation has been acquired by Huron, a global professional services firm. Huron and
Innosight will use their strategic, operational and technology capabilities to help clients across
multiple industries develop pioneering solutions to address disruption and achieve sustained
growth. The transaction is valued at $134MM, with $100MM cash at close and the remainder in an
earn out structure.
▪ eNom acquired by Tucows Inc. (January 2017) – eNom, a wholesale domain name registrar has
been acquired by Tucows, a provider of network access, domain names and other Internet services
from Rightside, a leading provider of domain name services for $83.5MM. The transaction will give
Tucows a total network of over 40,000 resellers globally and 29 million domains under
management, making it the second largest domain registrar in the world.
▪ DSM Computing Solutions acquired by Apogee IT Services (January 2017) – DSM Computing
Solutions Inc., an IT services provider and pioneer in cloud computing based in Toronto, Ontario
has been acquired by Apogee IT Services, a managed IT services provider that serves over 375
small and medium-sized businesses across the Northeast. The addition will continue the strategic
extension of Apogee’s IT service offerings across northeastern North America. No transaction
valuations are disclosed.

www.g2cap.com 6
Technology & Business ServicesRecent M&A Activity – Pending & Closed
BPO
Sector Summary in Millions USD (converted where necessary)
Data sourced from S&P Capital IQ on Friday, March 31, 2017
Date Closed Target Acquirer / InvestorImplied Enterprise
Value (MM)EV / EBITDA EV / Revenue
PendingUrban Fulfillment Services,
LLCHCL Technologies Limited - - -
Pending EDL Consulting, Inc. Simplus - - -
Pending Ciber, Inc. AMERI Holdings, Inc. $97.9 NM 0.1x
PendingRagingWire Data Centers,
Inc.
NTT Communications
Corporation- - -
PendingPreferred Systems Solutions,
Inc.STG Group, Inc. $119.5 - -
Pending SourceHOV LLC HGM, LLC - - -
Pending Novitex Enterprise Solutions Apollo Global Management - - -
Apr-17 Nonik Technologies, Inc.Doberman Technologies
LLC- - -
Mar-17Geneva Technical Services,
LLCHalo Group, LLC - - -
Mar-17 TalentBridge Holdings, LLCEmployee Relations
Associates, Inc- - -
Mar-17 ATCG Solutions, LLC AMERI Holdings, Inc. - - -
Mar-17 Maintech, Incorporated Oak Lane Partners, LLC $18.3 - -
Mar-17Network Access Products,
Inc.
Comm-Works Holdings,
LLC- - -
Mar-17 Information Innovators Inc. Salient CRGT, Inc. - - -
Feb-17 Orion Financial Group, Inc. MetaSource, LLC - - -
Feb-17 Titan Computer Services, Inc. Undisclosed $0.1 - 13.1x
Jan-17 Congruity LLC Procurri LLC - - -
Jan-17DSM Computing Solutions
Inc.Apogee IT Services, Inc. - - -
Jan-17 Navantis, Inc. Datavail Corporation - - -
Jan-17 True North Service, Inc. LogiGear Corporation - - -
Jan-17 Tech-Pro, Inc.Artech Information
Systems LLC- - -
Jan-17 Payroll Specialties NW, Inc. Asure Software, Inc. $3.5 NM 2.1x
Jan-17 Incepture Inc. HM Health Solutions, Inc. - - -
Jan-17Personnel Management
Systems, Inc.Asure Software, Inc. $5.0 - -
Dec-16 Stratiform, Inc. PCM, Inc. $2.9 - 0.7x

www.g2cap.com 7
Technology & Business ServicesRecent M&A Activity – Pending & Closed
Sector Summary in Millions USD (converted where necessary)
Data sourced from S&P Capital IQ on Friday, March 31, 2017
Date Closed Target Acquirer / InvestorImplied Enterprise
Value (MM)EV / EBITDA EV / Revenue
Pending Cloud Cruiser, Inc.Hewlett Packard Enterprise
Company- - -
Mar-17 AppDynamics, Inc. Cisco Systems, Inc. $3,902.9 NM 18.9x
Jan-17 MarketSight LLC Reimagine Holdings Group - - -
Jan-17 Omniata Inc. Activision Blizzard, Inc. - - -
Jan-17 DestiMetrics, LLCSterling Valley Systems,
Inc.- - -
Jan-17 Yodil, Inc. Duck Creek Technologies - - -
Business Intelligence
Consulting ServicesDate Closed Target Acquirer / Investor
Implied Enterprise
Value (MM)EV / EBITDA EV / Revenue
Pending Fuld & Company, Inc.Accretio Investments Pte.
Ltd.$3.8 - -
Pending BBVI Consulting, LLCMedical Innovation
Holdings, Inc.- - -
PendingFarmers Edge Precision
Consulting Inc.
Hamblin Watsa Investment
Counsel Ltd.- - -
Pending KPFF, LLCApple Growth Partners,
Inc.- - -
Mar-17First Annapolis Consulting,
Inc.Accenture plc - - -
Mar-17Magnus Management Group,
LLCNXTKey Corporation - - -
Mar-17Geneva Technical Services,
LLCHalo Group, LLC - - -
Mar-17Northeast Association
Management, Inc.
York Risk Services Group,
Inc.- - -
Mar-17 Solutions-IES, Inc.Draper Aden Associates,
Inc.- - -
Mar-17Consulting Services Support
CorporationCardiff International, Inc. $1.5 - -
Mar-17AdvancedEPM Consulting,
Inc.Datavail Corporation - - -
Mar-17 OverMont Consulting, LLC Whitley Penn LLP - - -
Mar-17 Innosight LLCHuron Consulting Group
Inc.$134.3 - -
Feb-17 Eclipsecurity, LLC HALOCK Security Labs - - -
Feb-17 ORTECH Consulting Inc. Kontrol Energy Corp. $3.5 4.9x 0.9x
Feb-17Sunpark Consulting Group,
Inc.NetAccess Systems, Inc. - - -
Jan-17 M&S Technologies, Inc. Kudelski Security - - -
Jan-17 CynergisTek, Inc. Auxilio, Inc. $31.7 6.3x 2.1x
Jan-17 BEworks Inc. kyu - - -
Jan-17Natural Resource
Technology, Inc.O'brien & Gere Limited - - -
Jan-17 R.A.S. Associates, Inc. Perficient, Inc. - - -
Jan-17 Alcyon, Inc. Alutiiq, LLC - - -

www.g2cap.com 8
Technology & Business ServicesRecent M&A Activity – Pending & Closed
Sector Summary in Millions USD (converted where necessary)
Data sourced from S&P Capital IQ on Friday, March 31, 2017
Cloud & Software Services
Date Closed Target Acquirer / InvestorImplied Enterprise
Value (MM)EV / EBITDA EV / Revenue
Pending Halogen Software Inc.Saba Software, Inc.;
6883621 Canada Inc.$170.6 26.9x 2.4x
Pending BlueCat Networks, Inc.Madison Dearborn
Partners, LLC- - -
PendingProSmart Sports
Development, Inc.Sora Capital Corp. $6.2 - -
Pending ClicksMob, Inc.ExciteAd Digital Marketing
Ltd$5.1 - 0.3x
Pending AudioEye, Inc. Undisclosed $13.7 NM 13.7x
Pending iMicron Web Services LLC. Techwave Consulting Inc. $1.1 - -
Pending GreedyRates.ca Inc. XLMedia PLC $9.3 - -
Apr-17 Ifwe Inc.MeetMe, Inc. (nka:The
Meet Group, Inc.)$60.0 - 1.4x
Apr-17 Veracode, Inc. CA, Inc. $614.0 - -
Feb-17 GreatDay, Inc., PotCircles South American Gold Corp. $0.9 - -
Feb-17 Infoaxe, Inc. Revcontent, LLC $30.0 - -
Feb-17 DeviantArt, Inc. Wix.com Ltd. $36.0 - -
Jan-17 Axiometrics Inc. MPF Research Inc. $80.0 - -
Jan-17Performance Assessment
Network, Inc.PSI Services LLC $271.0 - -
Jan-17 eNom Inc. Tucows Inc. $83.5 61.6x 0.5x
Jan-17 ShareASale.com, Inc. Digital Window Ltd. $45.0 - 3.2x
Jan-17 Avention, Inc.The Dun & Bradstreet
Corporation$150.0 - 2.5x
Jan-17 Meetoou LLC Net2Phone, Inc. - - -
Jan-17 DestiMetrics, LLCSterling Valley Systems,
Inc.- - -
Jan-17 Wow Media Products, Inc. Undisclosed - - -
Jan-17 LocateAR, LLC The Glimpse Group, Inc. - - -
Jan-17 iGuideCA San Diego DigitalRealtyX, Inc. - - -

www.g2cap.com 9
Technology & Business ServicesRecent M&A Activity – Pending & Closed
Sector Summary in Millions USD (converted where necessary)
Data sourced from S&P Capital IQ on Friday, March 31, 2017
e-Commerce Services
Date Closed Target Acquirer / InvestorImplied Enterprise
Value (MM)EV / EBITDA EV / Revenue
Pending
Quotit Corporation And
HealthCompare Insurance
Services, Inc.
National General Holdings
Corp.- - -
Pending TaskStream, LLC Tk20, Inc. - - -
Mar-17 GiveForward Inc. YouCaring Dot Com, LLC - - -
Mar-17 NetSource Communications Venture Technologies - - -
Mar-17 Dog Vacay, Inc. A Place for Rover, Inc. - - -
Mar-17 GiveForward Inc. YouCaring Dot Com, LLC - - -
Mar-17 comparehotels.online eMedia Group Inc. - - -
Mar-17 MyBuilder Limited HomeAdvisors - - -
Feb-17 HomeStars HomeAdvisor - - -
Feb-17 Tilt.com, Inc. Airbnb, Inc. - - -
Feb-17 LiftMetrix, Inc. HootSuite Media Inc.
Feb-17 CommonKindness, Inc. makeena, inc. - - -
Jan-17 Tiketscript BV Eventbrite - - -
Jan-17 CrowdRise, Inc. GoFundMe, Inc - - -
Jan-17 CameraLends LLC KitSplit Inc. - - -
Jan-17 Limos.com, Inc. On Demand iCars, Inc. - - -
Mobile Wireless
Date Closed Target Acquirer / InvestorImplied Enterprise
Value (MM)EV / EBITDA EV / Revenue
Pending Pareteum Corporation Undisclosed $29.8 NM 2.3x
Pending Lumos Networks Corp.EQT Partners AB; EQT
Infrastructure, L.P.$869.1 10.3x 4.2x
Pending YourLink Inc.Xplornet Communications
Inc.$21.5 - -
Feb-17 Fonality Inc. NetFortris, Inc. - - -
Jan-17Detel Computer Solutions Llc
And Broadplex LLC
Conterra Ultra Broadband,
LLC- - -
Jan-17Midwest Underground
Solutions, Specific AssetsFTE Networks, Inc. - - -

www.g2cap.com 10
Technology & Business ServicesPublic Trading Metrics – BPO
IndustryEnterprise
Value
Market
CapCash
LTM
Revenue
LTM
EBITDAEBITDA Margin LT Debt
LT Debt /
EBITDA
EV / LTM
Revenue
EV / LTM
EBITDA
Mean 17,198 16,964 1,001 6,316 1,309 17.2% 1,659 1.6x 2.6x 12.6x
Median 6,013 6,857 423 2,914 654 19.8% 612 1.4x 2.2x 12.5x
Company Ticker
Size (Millions USD)
EBITDA Margin
Leverage Valuation
Enterprise
Value
Market
CapCash
LTM
Revenue
LTM
EBITDALT Debt
LT Debt /
EBITDA
EV / LTM
Revenue
EV / LTM
EBITDA
Accenture plc NYSE:ACN 71,773 74,336 3,239 33,757 5,721 16.9% 25 0.0x 2.1x 12.5x
Automatic Data Processing, Inc. NASDAQGS:ADP 45,219 45,963 2,705 12,051 2,733 22.7% 2,003 0.7x 3.8x 16.5x
Cognizant Technology
Solutions CorporationNasdaqGS:CTSH 31,935 36,226 2,034 13,487 2,668 19.8% 797 0.3x 2.4x 12.0x
Convergys Corporation NYSE:CVG 2,148 2,000 139 2,914 365 12.5% 297 0.8x 0.7x 5.9x
Equifax Inc. NYSE: EFX 19,110 16,509 129 3,145 1,123 35.7% 2,087 1.9x 6.1x 17.0x
ExlService Holdings, Inc. NasdaqGS:EXLS 1,420 1,601 213 686 99 14.4% 35 0.4x 2.1x 14.3x
Fidelity National Information
Services, Inc.NYSE:FIS 36,076 26,177 683 9,241 2,270 24.6% 10,146 4.5x 3.9x 15.9x
Genpact Limited NYSE:G 5,407 4,927 423 2,571 421 16.4% 698 1.7x 2.1x 12.9x
Global Payments Inc. NYSE:GPN 16,120 12,303 1,163 3,776 989 26.2% 4,261 4.3x 4.3x 16.3x
Infosys Limited NSEI:INFY 31,357 36,060 3,489 10,208 2,774 27.2% NA NA 3.1x 11.3x
StarTek, Inc. NYSE:SRT 171 137 1 307 15 5.0% 1 0.1x 0.6x 11.0x
Sykes Enterprises,
IncorporatedNasdaqGS:SYKE 1,240 1,240 267 1,460 164 11.2% 267 1.6x 0.8x 7.6x
TeleTech Holdings, Inc. NasdaqGS:TTEC 1,528 1,358 55 1,275 158 12.4% 217 1.4x 1.2x 9.7x
West Corporation NasdaqGS:WSTC 5,022 2,035 183 2,292 654 28.5% 3,130 4.8x 2.2x 7.7x
Wipro Limited BSE:507685 16,558 19,224 813 8,495 1,698 20.0% 303 0.2x 1.9x 9.8x
Wirecard AG XTRA:WDI 6,013 6,857 1,407 1,117 310 27.8% 612 2.0x 5.4x 19.4x
WNS (Holdings) Ltd. NYSE:WNS 1,276 1,429 71 586 91 15.5% NA NA 2.2x 14.1x
Sector Summary in Millions USD (converted where necessary)
Charts show average daily multiples for each year
Data sourced from S&P Capital IQ on Friday, March 31, 2017
15.0x
10.7x
8.3x
10.5x11.0x
12.0x
11.2x
11.6x
13.6x13.6x13.1x
0.0x
2.0x
4.0x
6.0x
8.0x
10.0x
12.0x
14.0x
16.0x
EV
/ E
BIT
DA
S&P 500
3.5x
2.1x
1.7x
2.3x2.2x
1.9x
2.2x2.4x
2.7x 2.7x 2.7x
0.0x
0.5x
1.0x
1.5x
2.0x
2.5x
3.0x
3.5x
4.0x
EV
/ T
OT
AL
RE
VE
NU
E
S&P 500

www.g2cap.com 11
Technology & Business ServicesPublic Trading Metrics – Business Intelligence
IndustryEnterprise
Value
Market
CapCash
LTM
Revenue
LTM
EBITDAEBITDA Margin LT Debt
LT Debt /
EBITDA
EV / LTM
Revenue
EV / LTM
EBITDA
Mean 8,376 7,840 340 2,024 582 18.9% 1,367 3.3x 5.5x 17.4x
Median 5,884 5,927 187 1,787 150 -0.3% 1,126 2.7x 6.7x 16.9x
Company Ticker
Size (Millions USD)
EBITDA Margin
Leverage Valuation
Enterprise
Value
Market
CapCash
LTM
Revenue
LTM
EBITDALT Debt
LT Debt /
EBITDA
EV / LTM
Revenue
EV / LTM
EBITDA
CACI International Inc NYSE:CACI 4,155 2,861 54 4,331 377 8.7% 1,231 3.3x 1.0x 11.0x
FireEye, Inc. NasdaqGS:FEYE 2,045 2,238 163 720 (219) -30.5% 751 -3.4x 2.8x NM
Gartner, Inc. NYSE:IT 9,181 8,961 1,228 2,512 396 15.8% 1,606 4.1x 3.7x 23.2x
IHS Markit Ltd. NasdaqGS:INFO 20,541 16,909 155 3,031 871 28.7% 3,146 3.6x 6.8x 23.6x
New Relic, Inc. NYSE:NEWR 1,761 1,957 88 263 (42) -16.1% NA NA 6.7x NM
Proofpoint, Inc. NasdaqGM:PFPT 3,189 3,220 382 410 (33) -8.2% 372 -11.1x 7.8x NM
Science Applications
International CorporationNYSE:SAIC 4,079 3,242 210 4,450 334 7.5% 1,022 3.1x 0.9x 12.2x
Splunk Inc. NasdaqGS:SPLK 7,614 8,611 421 950 (300) -31.6% NA NA 8.0x NM
Verisk Analytics, Inc. NasdaqGS:VRSK 15,748 13,500 155 2,005 934 46.6% 2,274 2.4x 7.9x 16.9x
Workday, Inc. NYSE:WDAY 15,444 16,906 540 1,569 (274) -17.4% 534 -2.0x 9.8x NM
Sector Summary in Millions USD (converted where necessary)
Charts show average daily multiples for each year
Data sourced from S&P Capital IQ on Friday, March 31, 2017
22.9x 23.1x
15.4x
24.3x
22.8x
19.6x
15.9x
17.1x18.0x
18.1x 18.4x
0.0x
5.0x
10.0x
15.0x
20.0x
25.0x
30.0x
EV
/ E
BIT
DA
S&P 5004.6x
4.9x
3.7x
5.2x 5.4x
6.8x
9.1x 9.3x
8.0x
5.6x 5.6x
0.0x
1.0x
2.0x
3.0x
4.0x
5.0x
6.0x
7.0x
8.0x
9.0x
10.0x
EV
/ T
OT
AL
RE
VE
NU
E
S&P 500

www.g2cap.com 12
Technology & Business ServicesPublic Trading Metrics – Consulting Services
IndustryEnterprise
Value
Market
CapCash
LTM
Revenue
LTM
EBITDAEBITDA Margin LT Debt
LT Debt /
EBITDA
EV / LTM
Revenue
EV / LTM
EBITDA
Mean 7,995 8,094 811 4,429 665 12.3% 692 1.5x 1.8x 12.5x
Median 1,199 1,072 54 726 124 13.0% 135 1.0x 1.4x 11.7x
Company Ticker
Size (Millions USD)
EBITDA Margin
Leverage Valuation
Enterprise
Value
Market
CapCash
LTM
Revenue
LTM
EBITDALT Debt
LT Debt /
EBITDA
EV / LTM
Revenue
EV / LTM
EBITDA
Booz Allen Hamilton Holding
CorporationNYSE: BAH 6,521 5,307 350 5,647 520 9.2% 1,485 2.9x 1.2x 12.5x
Accenture plc NYSE:ACN 71,773 74,336 3,239 33,757 5,721 16.9% 25 0.0x 2.1x 12.5x
Cap Gemini S.A.ENXTPA:CAP
16,860 15,167 1,879 12,539 1,582 12.6% 3,273 2.1x 1.3x 10.7x
CRA International, Inc. NasdaqGS:CRAI 249 302 54 325 27 8.2% NA NA 0.8x 9.3x
Ecology & Environment, Inc. NasdaqGM:EEI 33 43 12 102 5 5.1% 0 0.0x 0.3x 6.3x
Exponent, Inc. NasdaqGS:EXPO 1,351 1,524 87 300 66 22.1% NA NA 4.5x 20.3x
Huron Consulting Group Inc. Nasdaq: HURN 1,169 894 17 726 128 17.6% 292 2.3x 1.6x 9.2x
Navigant Consulting, Inc. NYSE:NCI 1,199 1,072 8 939 142 15.1% 135 1.0x 1.3x 8.4x
NV5 Global, Inc. NasdaqCM:NVEE 395 398 36 224 26 11.6% 22 0.8x 1.8x 15.2x
Resources Connection, Inc. NasdaqGS:RECN 492 498 45 587 46 7.9% 48 1.0x 0.8x 10.6x
TechnipFMC plc NYSE:FTI 11,431 15,164 5,948 8,313 1,085 13.0% 1,573 1.5x 1.4x 10.5x
The Advisory Board Company Nasdaq: ABCO 2,377 1,883 91 803 124 15.4% 536 4.3x 3.0x 19.2x
The Dun & Bradstreet
CorporationNYSE: DNB 5,261 3,983 353 1,704 450 26.4% 1,595 3.5x 3.1x 11.7x
The Hackett Group, Inc. NasdaqGS:HCKT 556 569 20 260 39 15.1% 7 0.2x 2.1x 14.1x
Willdan Group, Inc. Nasdaq: WLDN 255 271 23 209 15 7.1% 2 0.1x 1.2x 17.2x
Sector Summary in Millions USD (converted where necessary)
Charts show average daily multiples for each year
Data sourced from S&P Capital IQ on Friday, March 31, 2017
14.2x
9.0x
7.6x
13.3x
9.4x
8.8x
10.0x
12.8x13.5x
11.4x 11.6x
0.0x
2.0x
4.0x
6.0x
8.0x
10.0x
12.0x
14.0x
16.0x
EV
/ E
BIT
DA
S&P 500
2.0x
1.4x
1.0x1.1x
1.2x 1.2x1.3x
1.5x
1.7x 1.7x 1.7x
0.0x
0.5x
1.0x
1.5x
2.0x
2.5x
EV
/ T
OT
AL
RE
VE
NU
E
S&P 500

www.g2cap.com 13
Technology & Business ServicesPublic Trading Metrics – Cloud Software & Services
IndustryEnterprise
Value
Market
CapCash
LTM
Revenue
LTM
EBITDAEBITDA Margin LT Debt
LT Debt /
EBITDA
EV / LTM
Revenue
EV / LTM
EBITDA
Mean 48,736 52,040 1,204 8,495 4,175 14.4% 6,710 5.2x 6.5x NM
Median 6,089 5,731 401 1,391 48 3.8% 926 1.1x 7.0x NM
Company Ticker
Size (Millions USD)
EBITDA Margin
Leverage Valuation
Enterprise
Value
Market
CapCash
LTM
Revenue
LTM
EBITDALT Debt
LT Debt /
EBITDA
EV / LTM
Revenue
EV / LTM
EBITDA
Box, Inc. NYSE:BOX 2,011 2,113 177 399 (115) -28.9% 40 -0.3x 5.0x NM
Cornerstone OnDemand, Inc. NasdaqGS:CSOD 2,140 2,203 83 423 (46) -10.9% 238 -5.2x 5.1x NM
IAC/InterActiveCorp NasdaqGS:IAC 6,089 5,731 1,329 3,140 420 13.4% 1,582 3.8x 1.9x NM
Microsoft Corporation NasdaqGS:MSFT 475,536 508,935 8,468 85,688 27,738 32.4% 59,306 2.1x 5.5x NM
Qualys, Inc. NasdaqGS:QLYS 1,134 1,378 87 198 48 24.2% NA NA 5.7x NM
Salesforce.com, inc. NYSE:CRM 58,862 58,362 1,607 8,392 505 6.0% 2,008 4.0x 7.0x NM
ServiceNow, Inc. NYSE:NOW 14,303 14,695 401 1,391 (69) -4.9% 508 -7.4x 10.3x NM
Twilio Inc. NYSE:TWLO 2,221 2,527 306 277 (34) -12.3% NA NA 8.0x NM
Twitter, Inc. NYSE:TWTR 8,703 10,791 1,192 2,483 95 3.8% 1,560 16.5x 3.5x NM
Tyler Technologies, Inc. NYSE:TYL 5,681 5,727 36 756 159 21.1% 10 0.1x 7.5x NM
Workday, Inc. NYSE:WDAY 15,444 16,906 540 1,569 (274) -17.4% 534 -2.0x 9.8x NM
Yahoo! Inc. NasdaqGS:YHOO 38,905 44,391 1,329 5,409 261 4.8% 1,317 5.1x 7.2x NM
Zendesk, Inc. NYSE:ZEN 2,534 2,759 94 312 (84) -27.0% NA NA 8.1x NM
Sector Summary in Millions USD (converted where necessary)
Charts show average daily multiples for each year
*Multiples less than 30.0x included
Data sourced from S&P Capital IQ on Friday, March 31, 2017
15.5x
11.1x
9.8x
11.8x10.7x
20.5x20.3x
26.1x26.6x
28.9x
22.5x
0.0x
5.0x
10.0x
15.0x
20.0x
25.0x
30.0x
35.0x
EV
/ E
BIT
DA
S&P 5004.8x
3.6x
2.5x
3.6x
5.7x
7.1x
10.8x10.6x
9.0x
7.2x 7.1x
0.0x
2.0x
4.0x
6.0x
8.0x
10.0x
12.0x
EV
/ T
OT
AL
RE
VE
NU
E
S&P 500
www.g2cap.com 14
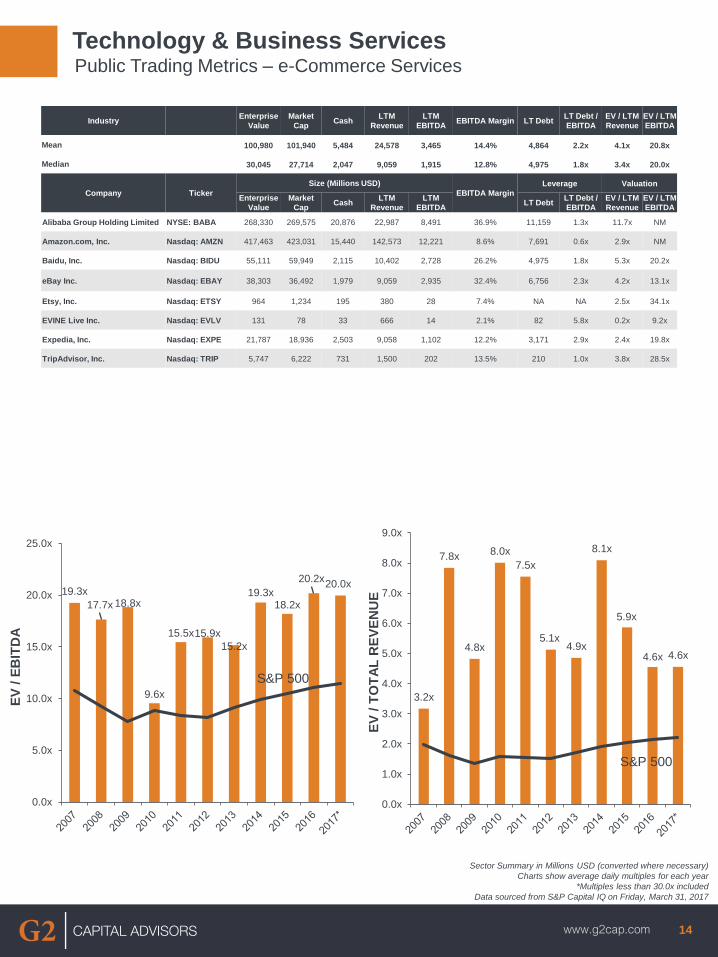
Technology & Business ServicesPublic Trading Metrics – e-Commerce Services
IndustryEnterprise
Value
Market
CapCash
LTM
Revenue
LTM
EBITDAEBITDA Margin LT Debt
LT Debt /
EBITDA
EV / LTM
Revenue
EV / LTM
EBITDA
Mean 100,980 101,940 5,484 24,578 3,465 14.4% 4,864 2.2x 4.1x 20.8x
Median 30,045 27,714 2,047 9,059 1,915 12.8% 4,975 1.8x 3.4x 20.0x
Company Ticker
Size (Millions USD)
EBITDA Margin
Leverage Valuation
Enterprise
Value
Market
CapCash
LTM
Revenue
LTM
EBITDALT Debt
LT Debt /
EBITDA
EV / LTM
Revenue
EV / LTM
EBITDA
Alibaba Group Holding Limited NYSE: BABA 268,330 269,575 20,876 22,987 8,491 36.9% 11,159 1.3x 11.7x NM
Amazon.com, Inc. Nasdaq: AMZN 417,463 423,031 15,440 142,573 12,221 8.6% 7,691 0.6x 2.9x NM
Baidu, Inc. Nasdaq: BIDU 55,111 59,949 2,115 10,402 2,728 26.2% 4,975 1.8x 5.3x 20.2x
eBay Inc. Nasdaq: EBAY 38,303 36,492 1,979 9,059 2,935 32.4% 6,756 2.3x 4.2x 13.1x
Etsy, Inc. Nasdaq: ETSY 964 1,234 195 380 28 7.4% NA NA 2.5x 34.1x
EVINE Live Inc. Nasdaq: EVLV 131 78 33 666 14 2.1% 82 5.8x 0.2x 9.2x
Expedia, Inc. Nasdaq: EXPE 21,787 18,936 2,503 9,058 1,102 12.2% 3,171 2.9x 2.4x 19.8x
TripAdvisor, Inc. Nasdaq: TRIP 5,747 6,222 731 1,500 202 13.5% 210 1.0x 3.8x 28.5x
Sector Summary in Millions USD (converted where necessary)
Charts show average daily multiples for each year
*Multiples less than 30.0x included
Data sourced from S&P Capital IQ on Friday, March 31, 2017
19.3x
17.7x 18.8x
9.6x
15.5x15.9x
15.2x
19.3x18.2x
20.2x20.0x
0.0x
5.0x
10.0x
15.0x
20.0x
25.0x
EV
/ E
BIT
DA
S&P 500
3.2x
7.8x
4.8x
8.0x
7.5x
5.1x4.9x
8.1x
5.9x
4.6x 4.6x
0.0x
1.0x
2.0x
3.0x
4.0x
5.0x
6.0x
7.0x
8.0x
9.0x
EV
/ T
OT
AL
RE
VE
NU
E
S&P 500

www.g2cap.com 15
Technology & Business ServicesPublic Trading Metrics – Mobile Wireless
IndustryEnterprise
Value
Market
CapCash
LTM
Revenue
LTM
EBITDAEBITDA Margin LT Debt
LT Debt /
EBITDA
EV / LTM
Revenue
EV / LTM
EBITDA
Mean 44,189 28,482 1,115 19,380 6,050 22.7% 17,729 4.0x 2.5x 9.4x
Median 2,162 1,161 240 670 231 29.3% 1,116 3.2x 2.2x 7.8x
Company Ticker
Size (Millions USD)
EBITDA Margin
Leverage Valuation
Enterprise
Value
Market
CapCash
LTM
Revenue
LTM
EBITDALT Debt
LT Debt /
EBITDA
EV / LTM
Revenue
EV / LTM
EBITDA
Alaska Communications
Systems Group, Inc.Nasdaq: ALSK 256 96 21 227 55 24.0% 175 3.2x 1.1x 4.7x
AT&T Inc. NYSE: T 377,518 255,182 5,788 163,786 49,740 30.4% 117,562 2.4x 2.3x 7.6x
ATN International, Inc. Nasdaq: ATNI 1,146 1,137 270 457 148 32.4% 144 1.0x 2.5x 7.7x
CenturyLink, Inc. NYSE: CTL 32,349 12,883 222 17,470 6,488 37.1% 18,185 2.8x 1.9x 5.0x
Cogent Communications
Holdings, Inc.Nasdaq: CCOI 2,349 1,922 274 438 135 30.9% 560 4.1x 5.4x 17.4x
Consolidated Communications
Holdings, Inc.Nasdaq: CNSL 2,556 1,185 27 743 263 35.4% 1,366 5.2x 3.4x 9.7x
Fairpoint Communications, Inc. Nasdaq: FRP 1,323 449 35 824 444 53.9% 898 2.0x 1.6x 3.0x
General Communication, Inc. Nasdaq: GNCM.A 2,154 746 19 934 273 29.2% 1,333 4.9x 2.3x 7.9x
Gogo Inc. Nasdaq: GOGO 1,299 949 117 597 79 13.2% 801 10.1x 2.2x 16.4x
Hawaiian Telcom Holdco, Inc. Nasdaq: HCOM 543 264 16 393 110 28.0% 290 2.6x 1.4x 4.9x
Iridium Communications Inc. Nasdaq: IRDM 2,186 940 371 434 226 52.1% 1,657 7.3x 5.0x 9.7x
NII Holdings, Inc. Nasdaq: NIHD 556 131 257 985 32 3.2% 216 6.8x 0.6x 17.4x
ORBCOMM Inc. Nasdaq: ORBC 807 682 25 187 37 19.7% 149 4.0x 4.3x 22.0x
Shenandoah
Telecommunications CompanyNasdaq: SHEN 2,170 1,377 36 535 236 44.0% 797 3.4x 4.1x 9.2x
Silicon Motion Technology
CorporationNasdaq: SIMO 1,396 1,649 274 556 147 26.4% NA NA 2.5x 9.5x
Spok Holdings, Inc. Nasdaq: SPOK 264 390 126 180 37 20.4% NA NA 1.5x 7.2x
Sprint Corporation NYSE: S 65,866 34,609 3,707 32,879 9,633 29.3% 30,759 3.2x 2.0x 6.8x
Telephone and Data Systems,
Inc.NYSE: TDS 5,072 2,920 900 5,104 917 18.0% 2,433 2.7x 1.0x 5.5x
T-Mobile US, Inc. Nasdaq: TMUS 78,292 53,385 5,500 37,242 9,314 25.0% 28,962 3.1x 2.1x 8.4x
Verizon Communications Inc. NYSE: VZ 305,683 198,741 4,307 123,623 42,685 34.5% 112,839 2.6x 2.5x 7.2x
Sector Summary in Millions USD (converted where necessary)
Charts show average daily multiples for each year
Data sourced from S&P Capital IQ on Friday, March 31, 2017
14.8x
6.8x
5.6x
6.9x 6.9x6.4x
14.5x15.0x
13.9x
10.2x
10.0x
0.0x
2.0x
4.0x
6.0x
8.0x
10.0x
12.0x
14.0x
16.0x
EV
/ E
BIT
DA
S&P 500
3.8x
2.3x
1.9x2.1x 2.1x
1.9x2.1x
2.5x 2.4x 2.4x 2.5x
0.0x
0.5x
1.0x
1.5x
2.0x
2.5x
3.0x
3.5x
4.0x
4.5x
EV
/ T
OT
AL
RE
VE
NU
E
S&P 500

www.g2cap.com 16
Economic & Industry Trends
Last 5 Year EV / EBITDA Trend by Industry
Technology & Business Services
Data sourced through S&P Capital IQ on Friday, March 31, 2017
Data sourced through S&P Capital IQ on Friday, March 31, 2017
% Change in Personal DPI
200
205
210
215
220
225
230
235
240
245
250
Q1 '07 Q1' 08 Q1 '09 Q1 '10 Q1 '11 Q1 '12 Q1 '13 Q1 '14 Q1 '15 Q1 '16 Q1' 17
Ind
ex 1
982-1
984=
100
0.0x
5.0x
10.0x
15.0x
20.0x
25.0x
30.0x
Q1 '12 Q3 '12 Q1 '13 Q3 '13 Q1 '14 Q3 '14 Q1 '15 Q3 '15 Q1 '16 Q3 '16 Q1 '17
EV
/ E
BIT
DA
^SPX BPO e-Commerce Services
Consulting Services Mobile Wireless Business Intelligence

www.g2cap.com 17
ReferenceContact & Glossary of Terms
For more information about G2, please visit: www.g2cap.com
Our corporate headquarters is located at: 535 Boylston Street, Suite 701, Boston, MA 02116
Boston | Chicago | Indianapolis | Los Angeles | Naples | San Francisco
The information included in this Presentation is not a complete analysis of all material facts regarding any company, industry,
or security and does not constitute investment advice. Opinions expressed or implied by the materials here presented reflect
only the judgement of its author as of the date of the Presentation and is subject to change without notice. The information in
this Presentation has been obtained from sources which G2 generally considers reliable, but we make no representation or
warranty, express or implied, as to the accuracy or completeness of any information herein. This Presentation has been
prepared for informational purposes only and upon the express understanding that it will be used only for the purposes set
forth in the Section captioned G2 Overview above. G2 expressly disclaims any and all liability which may be based on such
information, errors therein or omissions there from. Securities offered through Western International Securities, Inc. Member
FINRA & SiPC. G2 Securities and Western International Securities are separate and unaffiliated entities.
Matt Konkle, Managing Director Jeffrey Unger, CEO
[email protected] [email protected]
317.371.6608617.918.7929
Shubz Chandna, Analyst
617.417.5891
Term Definition
Revenue
Total revenue from the sale of goods and services rendered during the reporting period, in normal course of
business, reduced by sales returns and allowances, and sales discounts. For banks, this item is defined as net
interest income after loan loss provisions
EBITDAEarnings before interest, taxes, depreciation, and amortization. Calculated as Revenue – Expenses, excluding
interest, taxes, depreciation and amortization
Market CapMarket value of a company using most recently reported basic weighted average shares outstanding.
Calculated as Market Price (as of period end) * Basic Weighted Average Shares Outstanding
Long-Term DebtSum of the carrying values as of the balance sheet date of long-term debt with a maturity beyond one year or
the normal operating cycle, if longer
Net DebtNet Debt shows the company’s overall debt situation by netting the value of debts with cash and other similar
liquid assets. Calculated as Total Debt – Cash & Cash Equivalents and Short Term Investments
Enterprise Value
Enterprise Value represents the combined economic value of a company as of the most recent fiscal year end.
Calculated as Diluted Market Capitalization + Total Debt + Minority Interest + Preferred Stock – Cash and Short
Term investments
P/EA valuation ratio of a company stock price compared to its per share earnings. Calculated as Market Price /
Earnings per Share for the last annual period
Tangible Book Value Total Shareholder’s Equity – Goodwill and Intangible Assets