technology and colour development of hispano-moresque lead-glazed pottery
TRANSCRIPT

8/6/2019 Technology and Colour Development of Hispano-moresque Lead-glazed Pottery
http://slidepdf.com/reader/full/technology-and-colour-development-of-hispano-moresque-lead-glazed-pottery 1/17

8/6/2019 Technology and Colour Development of Hispano-moresque Lead-glazed Pottery
http://slidepdf.com/reader/full/technology-and-colour-development-of-hispano-moresque-lead-glazed-pottery 2/17
24 J . Molera, M. Vendrell-Saz,M . Garcia-Val& and T. Prude11
colours; copper-like, shining decoration was produced instead of the gold-like decoration of the
thirteenth century. Therefore, the change appea rs to be intentiona l and m ay reflect a deliberate
change in the technology of manufacture of these ceramics.
The green colour of the lead glazes is traditionally related to the presence of Cu2+ or Fe2+ inthe glaze, whereas the yellow to brown colours are related to Fe3+ (Weyl 1959,95 -7; Parmelee
1973, 71). As no copper has been detected in these glazes, the change of the colour must be
related to the degree of oxidation of the iron contained in the glaze (Bamford 1977; Wakam atsu
et al. 1987). The green colour is always related to dark and blackish pastes and, therefore, a
reductive process has normally been accepted as a part of the firing of these ceramics. However,
from the study of the workshop, there is no archaeological evidence that green lead-glazed
pottery was produced separately from the other ceramics which are oxidized, either in the
thirteenth or in the fourteenth centuries. Green-g lazed ceramics have grey to dark brown reduced
pastes, while yellow-, honey- and brown-glazed pots have cream and red oxidized pastes.
The a ims of this paper are: (i) the chem ical and physical (colour) characterization of the green,
yellow, honey and brown g lazes; (ii) to establish the cause of the colour; and (iii) to determ ine
the technology of production responsible for the different glaze colours. As the glazes are
transparent, in order to determine how the ceramic body influences the colour, both glazes and
pastes have been analysed independently.
E X P E R I M E N T A L
Chemical and mineralogical analyses of the ceramic body were performed by X-ray fluor-
escence (XR F) and X-ray diffraction (XRD), respectively, after removal of the glaze layer. Thestate of oxidation of the iron contained in the pastes was also determined by measuring the
Mossbauer spectra at room temperature. The study of the morpho logy and chemical composition
of the glazes was performed on the outer surface and on polished sections by scanning electron
microscopy (SEM ) provided with energy and wavelength dispersive X-ray spectrom eters (EDS
and WDS). The degree of iron reduction of the glazes cannot be studied by Mossbauer
spectroscopy due to the presence of lead.
To quantify the colour of the ceram ics, optical spectra of d iffuse reflectance were measured
between 360 and 800nm, at intervals of 0.5nm using a spectrophotometer fitted with an
integrating sphere. The measurem ents were performed on the surface of the g laze-over-paste and
on the paste alone after removing the glaze. The real colour of the glaze was determined bymeasuring the optical transm ittance from 400 to 700 nm in a microphotometer adapted to a Carl
Zeiss Universal microscope, on thin sections (c. 5 0p m ) of four selected samples (from green,
yellow, honey and brown pots). From the spectral distribution of reflectance and transmittance
the colour coordinates were calculated (Wyszecky and Stiles 1967, 238-321).
R E S U L T S
Pastes
The chemical analyses of the pastes are shown in Table 1 . No significant differences were
observed between the pastes corresponding to the yellow- and green-glazed pottery of the
thirteenth century. All of them are more calcareous (> 6.5% CaO) and poorer in iron (< 5%
F e2 03 ) han the fourteenth-century honey-glazed pastes, which are less calcareous (< 5%CaO)

8/6/2019 Technology and Colour Development of Hispano-moresque Lead-glazed Pottery
http://slidepdf.com/reader/full/technology-and-colour-development-of-hispano-moresque-lead-glazed-pottery 3/17
Hispano-Moresque lead-glazed pottery 25
Table I Chemical compositions of paste fw t. %, averuge nnd. ir i parentheses. standard deviation ) fo r the samples of
thirteenth- and fourteenth-centup lead-glazed pottery. I . 2. 3 and 4 identif?.each group in Figure 3
Si02 A1203 CaO KzO F e 2 0 3 MgO T i 0 2
1 Green glaze 60.23 16.08 6.83 4.14 4.74 2.17 0.72
(lo)* (1 .55) (1.77 ) (1.86) (0.32) (0.66) (0 .24) (0.04)13th
century 2 Yellow glaze 60.64 16.02 6.74 4.19 4.74 2.16 0.70
(4) (1.66) (1.52) (0.57) (0.10) (0.41) (0.29) (0.02)
14th 3 Honey-coloured 58.96 18.78 4.72 4.54 5.72 2.30 0.78
century glaze ( I 8) ( 1 . 1 1 ) (0.43) (1.02) (0.23) (0.40) (0.16) (0.01)
13th-14th 4 Brown glaze 69.90 13.76 1.86 2.98 4.65 1.27 0.72
centuries (25) (3.00) (1.22) ( I OX ) (0.27) (0.55) (0.17) (0.06)
* Number of samples of each group analysed.
and richer in iron (> 5% Fe 20 3) . Th e cooking pots of both centuries show similar chemical
compositions indicating the persistence of the sam e paste (highly siliceo us and below 2% of
Ca O content). In a previous study (Molera et a l . 1996) he use of the same clay with additions of
quartz sand or calcite to m ake the cook ing pots and the honey-coloured lead-glazed pastes of the
fourteenth century was demonstrated. Therefore, two different clays were mined to obtain
the three pastes (the authors' unpub lished results): a clay which was used in the production of the
yellow- and green-glazed pastes of the thirteenth century; another clay w hich, with the addition
of siliceous temper, was used in the production of the cooking pots during both centuries and,
with the addition of calcite, was used in the production of the honey-glazed pottery.
The mineralogical analysis of the pastes (Table 2 ) reveals the presence of neoformed phases
such as gehlenite and pyroxene (except in the cooking pots which have a very low calcium
content and, thus, a very low development of gehlenite). Accordingly, the typical firing
temperature may be established between 850 "C and 900 "C .The different con tents of hematite
Table 2 Mineralogical composition of the pastes (rvt. %. avercige and. in parentheses, stundard de viatio n) fo r the
samples of thirteenth- and fourteenth -century lead-glaze d pottery . I , 2, 3 and 4 identib each group in Figure 3
Quartz Calcite Hemutite K-feldspa r Melilite C a. Al . Fe Ca-
gehl-nker pvroxens feldspar
- -Green glaze 35.4 1 . 1 2.6 1.3 I .2
(lo)* (9.1) (1.0) (1.7) ( 1.4) ( 1 .O)
century 2 Yellow glaze 37.8 I .6 2.8 2.8 1.2 0.4 1.4
(4) (9.8) (1.7) (0.6) (0 .4 ) ( 1 . 1 ) (0.1) (3.2)
14th 3 Honey-coloured 22.2 2.6 3.7 3.4 2.5 3.1 3.3
century glaze (18) (3.2) (2.6) (1.7) (1.8) (3.4) (5.7) (4.8)
13th-14th 4 Brown glaze 44.2 1 . 1 3.4 2.2 0.6 - 4.8
centuries (25) ( 9 3 ) (0.4) (1.7) (3.9) (0.6) (5.7)
13th
-
*Number of samples of each group analysed

8/6/2019 Technology and Colour Development of Hispano-moresque Lead-glazed Pottery
http://slidepdf.com/reader/full/technology-and-colour-development-of-hispano-moresque-lead-glazed-pottery 4/17
26 J . Molera, M . Vendrell-Saz, M . Garcia-Vallks and T. Pradell
are related to the several paste colours; cooking pots and honey-glazed pastes (red) have 3 to 4%
of hematite and the yellow-glazed pastes (cream y) have less than 3%. Green-g lazed pastes of the
thirteenth century (grey colour) rarely contain hematite, which may be related to a reducing
process during the firing inferred from the dark colours of the body.Mossbauer spectra of different pastes were obtained as shown in Figure 1. The hyperfine
parameters of the Mossbauer spectra of representative pastes of each group and their association
with the several mineral phases developed during firing are shown in Table 3. The degree of
reduction is related to the ratio Fe'+/Fe3+ and the phases in which Fe2+ and Fe3+ are present
indicate the range of temperatures at which the ceramic was oxidized or reduced. We found that
green-glazed pastes of the thirteenth century present several degrees of reduction, although
yellow-glazed pots of the thirteenth century and all glazed fourteenth-century samples (honey-
glazed) and the cooking pots were made with oxidized pastes. Those pots of the thirteenth
century exhibiting a darkish green-glazed surface correspond to the most reduced pastes
produced at a temperature over 850 "C (temperature reached while reduction is performed),
as indicated by the absence of iron oxides, hematite, maghemite and m agnetite, and the presence
of well-deve loped hercynite and Fe2+ in a silicate phase (Pradell et al. 1995). The green-glazed
ceramics of the thirteenth century also present a high degree of reduction: iron oxides are related
to a maghem ite phase, with part of them (about 20% of the total iron) transformed to hercynite
and Fe2+ in calcium silicates. These results indicate similar temperatures of reduction in both
pastes but a possibly more reducing atmosphereAonger time in those pastes with a deep green
glaze.
The pastes corresponding to the yellow-glazed pottery of the thirteenth century show no
apparent reduction, and the firing temperature was about 900 "C, determined from the Fe3+hyperfine parameters -QS = 0.97(1)- (Maniatis et al . 1982 ; Janot and Delcroix 1974). The
fourteenth-century honey-glazed pastes and the brown-glazed cooking pots are also well
oxidized with a higher presence of hematite than the thirteenth-century yellow-glazed pastes
with between 60%and 70% of the total iron of the sample as hematite. A broad distribution of
iron oxide grain sizes indicates, most probably, a poorly oxidizing atmosphere during the firing.
The variable development of hematite in non-reducing conditions may be related to the
incorporation of Fe3+ in Ca-silicates developed du ring the firing from the reaction of C aO w ith
the clay at temperatures over 700°C. Calcium content is as important as iron con tent in the final
colour of the paste (M aniatis et al . 1983). Moreover, the illitic or kaolinitic character of the clay
also contributes to the final mineral composition and colour since kaolinite collapses at lowertemperatures than illite (Mackenzie et al. 1987). In the fourteenth-century samples, remains of
collapsed illite were observed in the XRD patterns, suggesting a clay richer in illite than in the
thirteenth century , in which clay the remains of illite are lower.
Glazes
All these glazes are transparent, their thickness is fairly broad ranging from 80p m to 140pm
depending on the pot and also on the position in the same pot. The glazes are heterogeneous,
showing several crystalline phases developed in the glaze-paste interface during the firing and
bubbles of gas escaping from the paste surrounded by some of these crystals (Molera et al.
1993).
The chemical analyses of the glazes are summarized in Table 4 where the mean and the
standard deviation are given for each glaze colour (green and yellow of the thirteenth century ,

8/6/2019 Technology and Colour Development of Hispano-moresque Lead-glazed Pottery
http://slidepdf.com/reader/full/technology-and-colour-development-of-hispano-moresque-lead-glazed-pottery 5/17
Hispano-Moresque lead-glazed potter?, 27
A
B
+
-12 -9 -8 - 3 0 3 6 9 12
Velocity (mm/s)
Figure 1 Mossbauer spectra ofpaste s corresponding to each of the pottery groups studied. (A) a highly reduced paste
with a deep green-glazed apparent colour. (B ) a reduced paste o f a green-glazed pot. (C) a paste corresponding to a
yellow-glazed pot in which the development of the sextet corresponding to hematite may be seen.

8/6/2019 Technology and Colour Development of Hispano-moresque Lead-glazed Pottery
http://slidepdf.com/reader/full/technology-and-colour-development-of-hispano-moresque-lead-glazed-pottery 6/17
Te3Mo
b
p
am
e
ose
e
p
efom e
ho
h
c
o
go
su
e
1.23a4dn
e
hgo
iFg
3
IS(mds
QS(md
BH
(T
A1
A2
rmd
a% o
oaF
1
D
ega
F+
045
)
F+hce
09(3
09(2
1hcuy
Gega
F+
03(5
Ion od
03(4
F+hce
09(3
1.05 (2)
F+ce
11(2
~+-ce
11(3
07(4
135)
24(3
28(3
09(2
-01(5
14(2
20(4
24(4
-
-
05(3
07(5
-
-
05(4
-
03(4
-
07(3
48.5 (426(32(3
08(4
05(2
04(4
-
- - -
-
-
-
-
3 4 2 1 5 3 1 4 5
-
2
Yowga
F+
03(2
09(2
-
07(2
5
Hme
0.38 (2
-02(2
50(323(218(2)
05(4
5
-
-
1hcuy
3H
coega
F+
03(2
091)
05(2
34
Hme
03(2
-01(3
501)
18(51)
04(3
76
-
-
1h1hcue
4
Bowga
F+
03(2
07(3
04(3
3
Hme
03(3
-02(2
451)
17I)
04(3
6
, 2c- is a 3 N
8/6/2019 Technology and Colour Development of Hispano-moresque Lead-glazed Pottery
http://slidepdf.com/reader/full/technology-and-colour-development-of-hispano-moresque-lead-glazed-pottery 7/17
Hispano-Moresque lead-glazed pottery 29
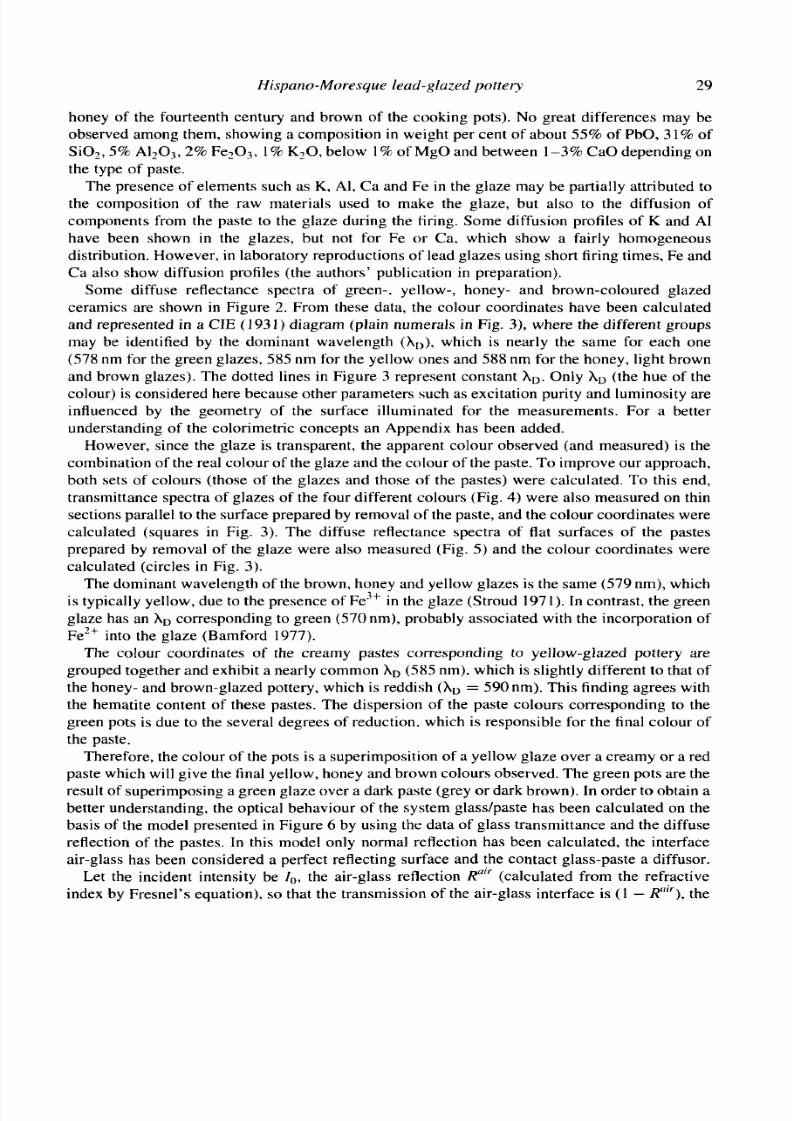
honey of the fourteenth century and brown of the cooking pots). No great differences may be
observed among them, showing a composition in weight per cent of about 55% of PbO, 31%of
Si02,5% A1203,2% Fe203. % K 2 0 , below 1% of MgO and between I-3% CaO depending on
the type of paste.The presence of elements such as K, Al, Ca and Fe in the glaze may be partially attributed to
the composition of the raw materials used to make the glaze, but also to the diffusion of
components from the paste to the glaze during the firing. Some diffusion profiles of K and A1
have been shown in the glazes, but not for Fe or Ca, which show a fairly homogeneous
distribution. However, in laboratory reproductions of lead glazes using short firing times, Fe and
Ca also show diffusion profiles (the authors' publication in preparation).
Some diffuse reflectance spectra of green-. yellow-, honey- and brown-coloured glazed
ceramics are shown in Figure 2. From these data, the colour coordinates have been calculated
and represented in a CIE (1931) diagram (plain numerals in Fig. 3), where the different groups
may be identified by the dominant wavelength (AD), which is nearly the same for each one
(578 nm for the green glazes, 585 nm for the yellow ones and 588 nm for the honey, light brown
and brown glazes). The dotted lines in Figure 3 represent constant AD. Only AD (the hue of the
colour) is considered here because other parameters such as excitation purity and luminosity are
influenced by the geometry of the surface illuminated for the measurements. For a better
understanding of the colorimetric concepts an Appendix has been added.
However, since the glaze is transparent, the apparent colour observed (and measured) is the
combination of the real colour of the glaze and the colour of the paste. To improve our approach,
both sets of colours (those of the glazes and those of the pastes) were calculated. To this end,
transmittance spectra of glazes of the four different colours (Fig.4) were also measured on thinsections parallel to the surface prepared by removal of the paste, and the colour coordinates were
calculated (squares in Fig. 3 ) . The diffuse reflectance spectra of flat surfaces of the pastes
prepared by removal of the glaze were also measured (Fig. 5) and the colour coordinates were
calculated (circles in Fig. 3 ) .
The dominant wavelength of the brown, honey and yellow glazes is the same (579 nmj, which
is typically yellow, due to the presence of Fe" in the glaze (Stroud 1971).In contrast, the green
glaze has an A D corresponding to green (570 nm), probably associated with the incorporation of
Fez+ into the glaze (Bamford 1977).
The colour coordinates of the creamy pastes corresponding to yellow-glazed pottery are
grouped together and exhibit a nearly common AD (585 nm), which is slightly different to that ofthe honey- and brown-glazed pottery, which is reddish (AD = 590 nm). This finding agrees with
the hematite content of these pastes. The dispersion of the paste colours corresponding to the
green pots is due to the several degrees of reduction. which is responsible for the final colour of
the paste.
Therefore, the colour of the pots is a superimposition of a yellow glaze over a creamy or a red
paste which will give the final yellow, honey and brown colours observed. The green pots are the
result of superimposing a green glaze over a dark paste (grey or dark brown). In order to obtain a
better understanding, the optical behaviour of the system glass/paste has been calculated on the
basis of the model presented in Figure 6 by using the data of glass transmittance and the diffuse
reflection of the pastes. In this model only normal reflection has been calculated, the interface
air-glass has been considered a perfect reflecting surface and the contact glass-paste a diffusor.
Let the incident intensity be lo ,he air-glass reflection R"" (calculated from the refractive
index by Fresnel's equation), so that the transmission of the air-glass interface is ( I - Roir) , he

8/6/2019 Technology and Colour Development of Hispano-moresque Lead-glazed Pottery
http://slidepdf.com/reader/full/technology-and-colour-development-of-hispano-moresque-lead-glazed-pottery 8/17
w0
Te4C
mc
cm
o
og
a
e
(w
9
a
a
i
mh
A
su
dd
u
o
fo
h
sam
eo
hrenha
fo
enhcnu
eg
a
I, 23
a
4dn
eh
go
nFg
3
SO
A
C
O
K0
F
MgO
T
0
P
O
MnO
C
1h
1 Gega(137(1552(0625(0509(0325(0504(0104(0056(5100(0000(00
2 Yowga(632(1154(0224(0208(0219(0104(0104(0056(5100(0000(00
1h
3H
coe38(1556(0815(0206(0221(0505(0104(0157(1600(00000
0
cuy
ga(6
1h1h4Bowga(938(0753(0709(0608(0122(0406(0003(0051(4800(000.00 (00
cue
*Nmbofsampeofehg
ayd
Fro' a sN

8/6/2019 Technology and Colour Development of Hispano-moresque Lead-glazed Pottery
http://slidepdf.com/reader/full/technology-and-colour-development-of-hispano-moresque-lead-glazed-pottery 9/17
40'IHispatio-Moresque lead-glazed po ttery 31
- 305
20
10
0 1I I I I I
400 500 600 700 800
I I I
wavelength (nm)
Figure 2 Drffuse rejlectcince ciirws of sotiie .selected glii:ed ceriir1tic.s.f he d iff er mt co1our.s studied.
internal glass transmittance T , the d iffu se reflection o f the paste R,, and the intensity reflected by
the system I . Following Figure 6, light suffers two reflections on the air-glass interface, one
diffuse reflection on the interface glass-paste and is transmitted inside the glass body (which is
considered here as an homo gene ous transparent m edium in which k = 0).Thu s, the I value after
the first reflection is:
1 = In *( 1 - Rf"'')* T R,, *( 1 - R";")
where Itlo= R
Only one reflection has been considered for calculating because the intensity of the second
reflection is under 0.001% of lo . By using this model, the dispersion of the calculatedreflectances show the s am e shape as that of the expe rimen tal curve s but the values are slightly
lower (about 5% ) in the whole spectrum. This fact may be explained because only the normal
reflectance has been considered and, addition ally, there are som e internal reflections on the
discontinuities of the gla ze such as crystallites and bubb les which, und er observation cond itions,
would increase the amount of reflected light.
D I S C U S S I O N
Although the ceramics under study present four different colours (green, yellow, honey and
brown), the glazes are only yellow or green. Among the chemical elements form ing the glaze,
iron is the only one capable of giving colour to the transparent lead glaze. Therefore, if iron is
diffused from the paste as Fe3+ the glaze becomes yellow , but, if Fe2+ is diffused , the co lour of
the glaze is green. Laboratory e xperim ents made by the autho rs confirmed that Fe , Al, K, and so

8/6/2019 Technology and Colour Development of Hispano-moresque Lead-glazed Pottery
http://slidepdf.com/reader/full/technology-and-colour-development-of-hispano-moresque-lead-glazed-pottery 10/17
32
0.40-
0.44 -
0.40 -X
0.36-
J . Moleru, M . Vendrell-Suz, M . Gar&-Vullks and T. Prude11
1.0 ,0.0
0.0
0.1
0.6
0.5
0.4
0 .3
0.2
0.1
0.0
0.0 0.1 0.2 0.3 0.4 0.3 0.6 0.7 0.8 0.0 1.0
x coordinate
0.32-
0.32 0.36 0.40 0.44 0.48
Y
Figure 3 CIE (1931 diagram showing the chromatici@points o the transmission ojf our glaz es (numerals in squares).
the diffuse reflectance nj he paste (numerals in ci rc les) and the dlffuffuse eflectance of glazed pottery (plain nurnerals).
The numerals indicate the type nf potteff: ( I ) green-glazed; ( 2 ) yellow-glazed: (3) honey-glazed; (4 ) brown-glazed
(c oo kin g p c ~ t ~ ) .he dotted lines radiating from point (C ) represenr constant dominant wavelength hl, (see text and
Appendix).

8/6/2019 Technology and Colour Development of Hispano-moresque Lead-glazed Pottery
http://slidepdf.com/reader/full/technology-and-colour-development-of-hispano-moresque-lead-glazed-pottery 11/17
Hispano-Moresque lead-glazed potter?, 33
0'7010 60
0 50
0 40
0 30
0 0
400
1
500 600 700
wavelength (nm)
on, can diffuse from the paste to the glaze during heating (the authors' publication in
preparation).
The observed colour corresponds to that of the glaze supe rimpo sed on the colo ur of the paste.
As may be observed in Figure 3, the colour coordinates corresponding to the yellow pottery
(marked as 2 ) fall between those of the yellow glazes (ma rked as 2 in a squ are) and those of the
creamy pastes (ma rked with 2 in a circle). The colour coord inates of the honey and brown pots (3
and 4, respectively) are between the yellow glazes (marked as 2 in a square) and the
corresponding reddish and red pastes (3 and 4 in circles).
The observations for the four groups of pottery here presented may be su mm arized as follows.
( 1 ) green glaze on a grey paste (colou rless of low luminosity). T he appa rent colour is green. A sthe degree of reduction of the paste is not uniform different hues of green may be observed.
( 2 )apparently yellow-glazed pottery: a yellow glaze on a cream y paste (m ode rate Ca O content
and low development of hematite). The colour observed is yellow.
(3) apparently honey-glazed pottery: a yellow glaze on a reddish p aste (m odera te Ca O content
but well-developed hem atite). Th e colour observed is light brown (hone y).
(4)apparently brown glaze of cook ing pots: a yellow glaze on a red paste (very low Ca O content
and good development of hematite). The colour observed is brown.
Th e glazes and pastes for yellow a nd green pots have the sam e chemical com positions but the
paste is oxid ized or reduced, respectively. How ever. this can not be attributed to a different firing
process because yellow and green colo urs, in som e cases, are found togethe r in the sam e pot. But
the green colours are alw ays related to glazes applied to both sides, and yellow c olours to one
side only glazed. And even when both colours are found in different p arts of the sam e pot, the
paste below green glaze is grey to brown and the paste below yellow glaze is red. The reason

8/6/2019 Technology and Colour Development of Hispano-moresque Lead-glazed Pottery
http://slidepdf.com/reader/full/technology-and-colour-development-of-hispano-moresque-lead-glazed-pottery 12/17
34 J . Moleru, M . Vendrell-Saz, M . Gurcia-Vallks and T. Pradell
6o1 2 yellow
1 green
40 0 500 60 0 700 800wavelength (nm)
Figure 5 Diffuse reflectance curves of selected pastes obtai ned on smoothed surfaces after rem ova l of the glaze
may be that a reducing atmosphere is created during firing by the gases produced inside the
ceramic body enclosed by glaze on two sides.
During firing, reducing and inert gases such as CO, water vapour, COz, an d so on are produced
by the combustion of the wood which con sum es an important part of the oxygen inside the kiln.
Thus, the pottery cannot be completely oxidized.
As the glaze m elts at about 700"C (Nordyke 1984), when calcite deco mp oses both sides of the
pot are sealed by the glaz e and a reducing a tmosphere is produced inside the paste by the trapped
C 0 2 .Under these conditions Fez+ diffuses from the paste to the glaze which becom es green. If
Figure 6 Schematic path fol lowed by the light in the systeni glaze-paste.

8/6/2019 Technology and Colour Development of Hispano-moresque Lead-glazed Pottery
http://slidepdf.com/reader/full/technology-and-colour-development-of-hispano-moresque-lead-glazed-pottery 13/17
Hispunn-Morrsque leLid-gIu:ed p o t t e p 35
only one side is glazed. the gases produced by decomposition of the calcite may escap e through
the porosity of the ceramic body by the non-glazed side. The reason for the higher reduction of
the pottery of the thirteenth century glazed on both sides (i.e.. high er diffusion of Fe” to the
glaze) may be the calcite content of the clay body. The paste used in the fourteen th century w asCa -po ore r and probably the calcite w as of bigger grain size as indicated by the high develop men t
of gehlenite.
During the cooling ph ase, there is no burning, the partial pressure of oxygen is 2076, and the
iron of the paste is oxidized w hile the temperature is relatively high (ove r 50 0° C ). If both sides
are glazed the ceramic body is sealed before the oxidizing atmosphere reaches the paste and,
thus, i t remains reduced due to the protective action of the glaze coverin g both sides.
When only one side is glazed, the oxygen reaches the paste through the porosity of
the ceram ic body and the iron is oxidize d. Thu s, the paste bec ome s more or less red depending
on the iron available as oxides. If most of this iron has incorporated into the silicate’s
structure (like gehlenite or pyroxene), less iron remains to form hematite in the cooling
stage. The grain size of calcite is also an important factor, as in the honey pottery of the
fourteen th century which develop ed more hematite than the oxidized pottery of the thirteenth
century.
T o support the hyp othesis of a single firing there are several exa mple s of pots of the thirteenth
century partially glazed on one and both sides. The ir colour chang es from yellow to green, and
the colour of the paste under the glaze from cre am to grey, in those parts glazed on one or two
sides respectively.
All these facts support the hypothesis that the diffusion of iron from the pas te to the gla ze is in
the form of Fe’+ or Fe” wh ile the process that takes place in the paste is oxidiz ing or reducingand, therefore, the colour of the g lazes is yellow or brown. o r green, respectively.
C O N C L U S I O N S
From these results the following important points may be made.
The real colour of the glaze is produced by iron diffused from the paste.
The colour observed is that of the glaze by transmittance (which acts as an optical filter)
superimposed to that of the underlying paste by diffuse reflection.
Green-glazed pottery is always glazed on both surfaces and, as a consequence, the paste is
reduced and the iron is diffused as Fe”. giving the glaze green coloration.In those ce ram ics glazed on one surf ace the paste is oxidized and the glaze beco me s yellow by
the diffusion of Fe”.
The difference of the apparent colours in the yellow, honey and brown pottery is due to the
different development of hematite in the paste because of a difference in the Ca content of the
different groups and the mineralogical nature of the raw materials. Additional to the Ca content,
the mineralogical analyses of the paste of yellow pottery (high gehlenite content) seem to
indicate a bigger grain size of calcite, which after transformation into CaO reacts with the
silicate surrounding to fo rm gehle nite in this Ca-rich enviro nme nt.
The same paste was used to produ ce green and yellow pottery during the thirteenth century . A
change in the paste used in the fourteenth ce ntury produce s a reddish co lour (hon ey ) probably
because of the smaller grain size of the calcite grains. When the CaO content is under 2%
(as in the cooking pots) the paste becomes red and the observed colour through the glaze is
brown.

8/6/2019 Technology and Colour Development of Hispano-moresque Lead-glazed Pottery
http://slidepdf.com/reader/full/technology-and-colour-development-of-hispano-moresque-lead-glazed-pottery 14/17
36 J . Molera, M . Vendrell-Suz, M . Gurcia-Vullks uncl T. Prude11
There are no differences between cooking pots produced in the thirteenth and the fourteenth
centuries, either in the paste or in the co lour.
The ch ange from green and yellow pottery (thirteenth century ) to honey (fourteenth century)
is parallel to the change from green- and black-decorated tin-glazed pottery of the thirteenth
century to the lustre pottery of the fourteenth century ( M . Mesquida pers. co mm .). Th us , if the
honey colour is a voluntary de cision of the potters to follow a fashion, they appear to have had
good knowledge of the behav iou r of the raw materials and, perhaps, u ndertook em pirical tests to
check how different clays change under firing. No changes have been detected in the cooking
pots in which the most important property is their thermal behaviour instead of their colou r. Th is
fact reflects a high development in the ceramic industry and in the empirical knowledge of the
ceramic process by the Hispano-Moresque potters.
A C K N O W L E D G E M E N T S
The authors want to thank Dr Merci Mesquida. archaeologist of the Paterna Council. for her collaboration i n supplying
the materials for analysis and giving her time to discuss the results i n the historical framework.
R E F E R E N C E S
Amigues, F.. and Mesquida, M.. 1987, ( 1 1 1 honlo r w d i e w l d i e ceriimiccr. El Te.s/rrr ilel Mali. Paterrirr ( V r r l h c i i i ) .
Amigues. F., and M esquida. M.. 1993.Les iztc4iers ef kr cercrr11ique tk e Pirtenirr ( X l l l e - X I V e si?clrJ.M u sk Saint-Jacques.
Bamford. C. R.. 1977. Color generation and control in glass. Gluss scierrce r r n d feclrnology 2. Elsevier. Amsterdam.CIE (Com mission Internationale pour I’Eclairage). 193 , Cambridge University Press, Cambridge.
Janot. C .. and D elcroix. P., 1974. Currrcterisutiorl de rnuteriau.r arckhnlogique.s pur .spectromerrieMiissbuuer. Centre de
Recherches Archtologiques Notes et Monographies Techniques. 4. Centre National de la Recherche Scientifique.
Paris.
Mackenzie. R. A,. Rahnian. A. A, . and Moir. H. M.. 1987. Interaction of kaolinite with calcite on heating. 11. Mixtures
with one kaolinite in carbon dioxide, Therrnrichirn.Actu, 124. 119-27.
Maniatis. Y. , Simopoulos. A,. and Kostikas. A,. 1982.The investigation of ancient ceramic technology by Miissbauer
spectroscopy. in Archrreologicnl cerurnics (eds. J. S . Olin and A. D. Franklin). 97- 108. Smithsonian Institution.
Washington, DC.
Maniatis, Y. , Simopoulos. A,. K ostikas. A ,, and Perdikatsis. V. . 1983. Effect ofred ucing atmosphere on minerals and iron
oxides developed in fired clays: the role of calcium, J. Am. Ci , rum Soc., 66 ( I I ), 773-8 I ,
Mesquida, M.. 1987. Uiitr terrisserirr dels segles X I / / i X I V . Publicacions del Ajuntament de Paterna. Paterna.Molera. J. , Pradell, T.. Martinez-Manent. S.. and Vendre ll-Saz, M.. 1993, The growth of sanidine crystals i n the lead
Molera, J. , Garcia-VaIICs, M.. Pradell. T., and Vendrell-Saz, M., 1996, Hispano-Moresque pottery production of the
Nordyke. J. S.. 1984. Lucid in the btorld ofcrrumics. Am. Ceram. Soc.. Columbus. Ohio.
Parmalee, C. W., 1973, Cermnic glozes. Cahners Publ. Co., Boston, MA.
Pradell, T.. M olera. J .. Garcia-VallCs. M.. and Vendrell-Saz. M. , 1995. Study and characterization of reduced ceramics. i n
Proceedings Eurnpeari meeting on rrrrcierrt cernmics (eds. M. V endrell, J. Molera, M. Garcia and T. Prad ell). 417-3 0,
Publicacions de la Generalitat de Catalunya. Barcelona.
Stroud. J . S.. 19 71, Optical absorp tion and color caused by selec ted cations i n high-density lead silicate glass. J. Am.
Cerum. Soc., 54 (8). 401 -6.
Wakamatsu. M.. Takeuchi, N.. and Ishida, S. , 1987. Effect of furnace atmosphere on color i n iron glaze, J. N o t i -
Cri.sttrl/irre Solids, 95/96. 733-40.
Weyl. W . A ,, 1959. Coloured ~ l u s s e ~ .awson’s of Pall Mall. London.
Wyszechy, G.. and Stiles, W. S. . 1967, Color science. John Wiley and Sons. New York, London. Sidney.
Publicationes de la Casa de Velazquez. Madrid.
Beziers.
glaze of Hispano-Moresque potttery. Applied Cloy Sci., 7. 483-91.
fourteenth-century workshop of Testar del M oli (Paterna. Spain ). A t - c h r r r o m r t ~ .8 ( I ) . 67-80.

8/6/2019 Technology and Colour Development of Hispano-moresque Lead-glazed Pottery
http://slidepdf.com/reader/full/technology-and-colour-development-of-hispano-moresque-lead-glazed-pottery 15/17
37
A P P E N D I X
I n order to clarify some of the aspects presented i n this paper concerning the colour measurements. the authors prepared
this Appendix which should not he conhidered as a text on colorimetry hut only ;in aid to following the graphics and
calculations presented.Colour is a psychological perception caused by the stimulus produced by the visihle light in the eye, that is to say.
when a particular combination of w avelengths reaches the eye it is detected by the brain a s a particular colour. Although
each wavelength has its characteristic colour response. the range of pure colours given by each wavelength does not
represent the total range of available colours.
Each colour has three attributes. namely luminosity (th e quantity of ligh t). hue (whi ch allows us to differentiate
between red. green. blue. and so on) and excitation purity (t hc quantity of white that, mixed with a pure colour.
reproduces a particular colour). As the response oft he eye depends on the stimulus. it is obvious that the illuminant Hux
has to be considered when q uantitative nieasureineiits of the colour ;ire carried out. The Com mission Internationa le pour
I 'Eclairage (C IE )established some standard illurninants one of which is known as C (which corresponds to the north sky
light) and is one of the most widely used.
Leonard0 d a Vinci said that almost all the colours niay be made by mixtures of three 'well selected' colours. If we
draw a triangle whose corners are pure green, red and blue (Fig. 7), avoiding the mathematical development which is
beyond the scope oft hi s text. we may establish a colour C , as the w m of a certain amount of green ,yI. blue hl and red r l .
then:
Cl = r I R + ~ I G f h l t l
Thi s is the basis of the algebra of the colours which a llows us to establish that a mixture of tw o colours C, an d Czmay he
determined as follows:
2'Ci = 0'1+ r ? ) R+ (gl + gz)G+ ( b ,+ h:)B
However. the pure spectral colours (monochromatic light) cannot be obtained by mixing other spectral colours, so that
th e locus of all the spectral colours falls outside the triangle. Accordingly. there are some colours that cannot be obtained
by additions of green, blue and red lights previously chosen (those points lying between the triangle and the locus line).
Bu t al l the possible colours lie inside the lociis of the pure spectral colours and the purple line betw een blue an d red. I t is
for this reason that Leonardo's statement includes the term 'well selected'. By mixing three spectral colours limiting a
small triangle only a limited variety of colours could be obtained.
So , if we want to mix three 'colours' to obtain m y of the posbible colours. we must choose three points outside the
curve. These points will he 'non-existent' colours hut from the mathematical point of view this does not present a
3R
Figure 7

8/6/2019 Technology and Colour Development of Hispano-moresque Lead-glazed Pottery
http://slidepdf.com/reader/full/technology-and-colour-development-of-hispano-moresque-lead-glazed-pottery 16/17
38 J . Moleru, M. Vendrell-Suz,M. Gurciu-Valle's and T. Prude11
problem. After experiments with hundreds of observers the CIE established the spectral distribution of three standard
disrribittiori cweJrcirrits ( x h . and : A ) and developed a representation system (CIE 193 I ) i n which all the coordinates are
positive (Fig. 8) .
Colour culculution
The radiant flux reflected or transmitted by an object has to be specitied by its spectral distribution RhLhAhor Th Lh A h .
where R , is the sp ectral reflectance. T i the spectral transmittance and LA the spectral distribution of the Rux illuminating
the object. The tristiniulus values X . Y an d Z of a reflecting object are given by (an d similarly for a transparent body ):
x = kCRhLhA-hAA; Y = kCRhLh>jhAh: an d z z CRALhzhAh
where .rh.F~ and z h are the distribution coefficients, and the normalizing factor k takes the value
k = lOO/CLhyhAh
so that. for a perfect reflecting or trans mitting objec t ( R hor T h equals one for all wavelength) Y = 100.Then. the value of
Y represents the Iumiriosiiv of the colour of this object.The chromaticity coordinates are calculated from the tristimulus X , Y an d Z
. r = X / ( X i Y + Z ) ; y = Y I ( X + Y + Z ) an d : = Z / ( X + Y + Z )
The colour coordinates of the illurninant may also be calculated from its spectral distribution and i t represents the
achromatic point ( C n our case).
Donzinanf wavelength and excitation purity
The dominant wavelength. AD . o fa particular colour is the wavelength of the spectrum wh ich, mixed with the achromatic
stimulus. matches the given colou r. So that, it represents the h e fthis colour. I n the CIE ( 193 ) diagram it is represented
1 o
0.9
0 .8
0.7
0.6
0.5
0.4
0.3
0.2
0.1
0.0
4 52 0
j f i 55 0
9 00
1480L/ti0.0 0.1 0.2 0.3 0.4 0.5 0.6 0.7 0.8 0.9 1.0
x coordinate
Figure 8
8/6/2019 Technology and Colour Development of Hispano-moresque Lead-glazed Pottery
http://slidepdf.com/reader/full/technology-and-colour-development-of-hispano-moresque-lead-glazed-pottery 17/17