technology advances in igcc with co2 capture - tu...
TRANSCRIPT

Technology advances in IGCC with CO2 capture
4th International Conference on Clean Coal Technologies
3rd International Freiberg Conference on IGCC and XtL Technologies
18-20 May 2009
Disclaimer on last slide

Contributing Authors
Mark Prins*Rik van der PloegRob van den Berg Charudatta PatilEva van Dorst
Frank GeuzebroekDebnath Paul

Contents
1. Shell Coal Gasification Process (SCGP)
2. IGCC unit operations
Coal-to-power efficiencies of IGCC
Comparison with USC boilers
3. IGCC with CO2 capture
4. Costs of IGCC with and without CO2 capture
5. Future Outlook
IGCC = Integrated Gasification Combined Cycle
USC = Ultra Super Critical

1. Shell Coal Gasification Process
Slagging condition
Membrane wall gasifier
Dry feed system
Water tube boiler
Solid slag handling

Shell SCGP process line-up
Wetscrubbing
Coal feeding
Milling/drying
milling and drying(if required)
Fly ash to
HP steam
MP steam
Slag
Coal/petcoke Fly ashrecirc. Quench gas
Gasifier
Salts
Rawsyngas
Water treatment
900°C
Fly ash system
1,600°C Dry Solids Removal

SCGP – advantages• High availability and low maintenance cost owing to the robustness of the
membrane wall gasifier and the long life time of coal burners
• High throughput through multiple burners
• Efficient use of coal (low operating expenditure) and low CO2 emissions resulting from complete conversion of any coal/coke (carbon conversion >99%)
• High cold gas efficiency resulting in the production of more syngas from the same amount of coal/coke owing to the optimised operating temperature
• High flexibility to feedstocks (most coal types and petroleum coke)
• High operating flexibility with respect to short-term coal quality changes

SCGP – typical energy balance
Raw synthesis gas
Coal in 100%
82%
2.0% Steam from reactor wall (reused)
12.8% Steam from Syngas cooler (reused)
0.5% Unconverted carbon (fly ash/slag)2.7% Low-level heat (cooling of slag)
18.0% Total

SCGP is a proven technology on an ever-increasing scale
Coa
lint
ake
(tota
l)
6 t/d 150 t/d 250 t/d
2,000 t/d First commercial
application
7,500 t/d licensed, a further 7,500 t/d
considered
1976 Pilot unit
Amsterdam, Netherlands
1978 Demonstration unit
Harburg, Germany
1987 SCGP-1
Houston, USA
1993 NUON IGCC Buggenum, Netherlands
2006 Largest Chinese
licence
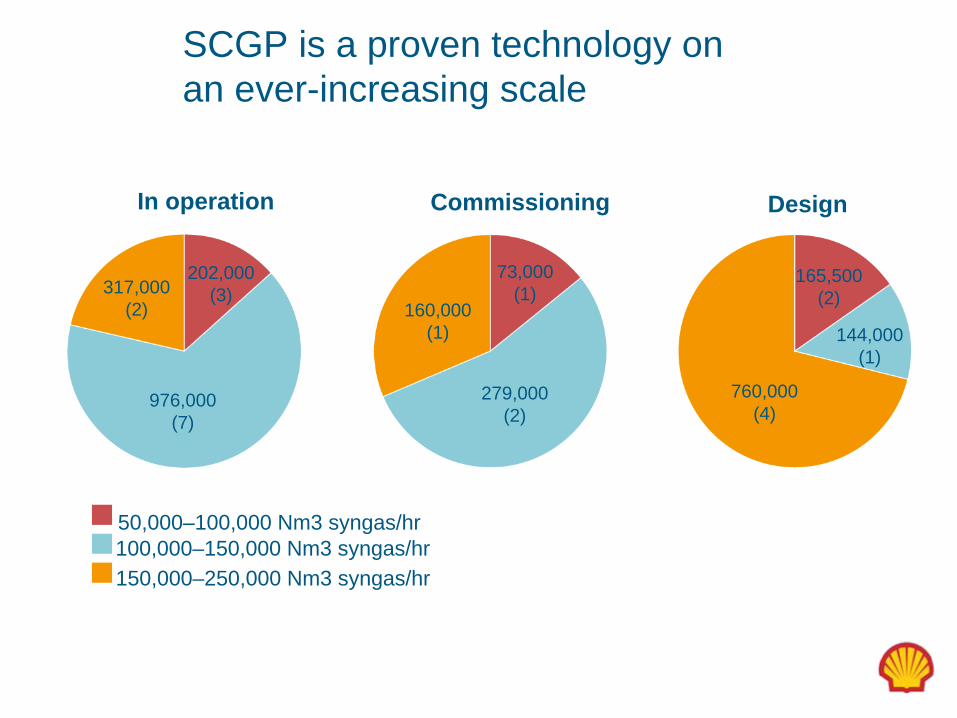
SCGP is a proven technology on an ever-increasing scale
In operation
976,000 (7)
Commissioning Design
202,000 (3)317,000
(2)
279,000 (2)
760,000 (4)
73,000 (1)
160,000 (1)
165,500 (2)
144,000 (1)
50,000–100,000 Nm3 syngas/hr100,000–150,000 Nm3 syngas/hr150,000–250,000 Nm3 syngas/hr

2. IGCC unit operations
Coal
Stack
SteamSteam
SaltsSulphurSlag
Steam
Nitrogen
Oxygen
Coal treatment
and supply
Coal gasification
Gas cooling and
purificationGas turbine Generator Steam
turbine
Waste heat boiler
ElectricitySulphur
productionWater
purification
Air separation
Gasification/gas treating
Air separation
Combined cycle
Waste water treatingAir

Nuon IGCC, Buggenum, the Netherlands
• Integrated coal gasification combined-cycle power plant
• Commissioned in 1994 as a demonstration plant
• Commercial operation since 1998
• 2,000 tonne/day coal producing 4.0 ×
106 Nm3 syngasCourtesy NuonEnergy balance:
Coal intake 585 MWeGas turbine output 156 MWeSteam turbine output 128 MWeTotal output 284 MWeOwn consumption 31 MWe
Net output 253 MWe
Net efficiency (LHV) 43 %

Technology development of IGCC components
SCGP gasifier Capacity and operating pressure matches with latest gas turbines
Air Separation Unit
For 95% O2 , industry going from 2-column to 3- column ASU to save 20-30% electricity
Gas Treatment Shell’s Sulfinol process and UOP’s Selexol process are benchmark technologies
Hot gas clean-up under developmentGas Turbine Major efficiency improvements due to higher
compression ratios and Turbine Inlet Temperatures

Industrial Gas Turbines
500
700
900
1100
1300
1500
1700
10 12 14 16 18 20 22 24 26 28 30Pressure ratio
Turb
ine
Inle
t Tem
pera
ture
(°C
)
32%
34%
36%
38%
40%
42%
44%
Effic
ienc
y on
NG
(% L
HV)
Turbine Inlet TemperatureEfficiency on NG (% LHV)
Long-term development
target for 1700°C class
Available for syngas (F- class)
Available for natural gas (G/H-class)
1993 (E- class)

IGCC coal-to-power efficiencies
Basis: El Cerrejon coal with Cold Gas Efficiency ~82%. Site is sea shore in the Netherlands, typical ISO ambient conditions (15°C air, 12°C sea water, temperature range sea water = 8°C), 0 m elevation
43
47.5 48.2 48.7 49.2 49.5 50.1 50.6
45
40
42
44
46
48
50
52
E clas
s (Bu
ggen
um)
F clas
s - ba
se ca
seG cl
ass
ASU 50
% integ
ration
High ef
ficien
cy A
SU
Hot Gas
Clea
nUp
Effic
ienc
y IG
CC
[%LH
V]

Coal Milling & Drying
Shell Coal gasifier
Coal
CO2 CompressionASU
(max 50% air int.)Air
DryCoal
CO2
(low purity) H2
Oxygen
Shift
Sulphur
VHP/HP/LP N2
GT N2VHP/HP N2BFWLP/IP Steam (sh)
SlagFlyashWaste Water
H2S Removal
62.3 Mio € €
Claus + SCOT
POWERGeneration
PowerAcid Gas Removal
3. IGCC with CO2 capture – additional units
HP (sat)IP (sh) Steam
IP (sh) Steam
GT air
GT air
H2 S

Efficiency Penalty of CO2 capture
1. Water Gas Shift dry syngas typically ~60% CO, ~30% H2 high extent of WGS is required for >90% CO2 capture LHV of H2 (242 kJ/mol) less than of CO (283 kJ/mol)
2. CO2 removal due to high partial pressure, relatively low steam & power requirements for amine absorption/regeneration
3. CO2 compression compression to 120 bar, polytropic efficiency = 80%
4. Gas Turbine TIT reduction small decrease of 35oC assumed for first generation hydrogen-fuelled gas turbines

IGCC+90% CO2 capture Today’s technology
El Cerrejon coal with CGE ~82%, MHI701F4, Selexol, Sour Shift
IGCC LHV Efficiency : 36.4% based on in house study
1st drop ~5.5%p (sour shift)
2nd drop ~1.5%p (Selexol)
3rd drop ~2.5%p (CO2 compression)
50
48
46
44
42
40
38
36No capture Shift CO2 AGR CO2
compressTIT
reduction
36.4
38
40.5
42
47.5
Effi
cien
cy IG
CC
, %LH
V

IGCC+90% CO2 capture Tomorrow’s technology
41.241.6
48.250
48
46
44
42
40
38
36
Effi
cien
cy IG
CC
, %LH
V
New technology
New technology
New technology
CO2 compression
Next Gen GT
4.5-5% LHV efficiency improvement potential for Future IGCC + CO2 captureBased on application of new technology
This widens the efficiency gap with post combustion CCS solutions
El Cerrejon coal: New IGCC technology

4. Cost of IGCC with and without CO2 capture
0%
20%
40%
60%
80%
100%
120%
140%
no CCS with CCS
Rela
tive
CAPE
X (%
) Solids Handling/Sulphur RecoveryEffluent systems
CO2 compression
Power generation
SCGP + ASU +syngas treatment

Forecast of development of CCS costs and carbon price
* Carbon price for 2015 from 2008-15 estimates from Deutsche Bank, New Carbon Finance, Soc Gen, UBS, Point Carbon, assumed constant afterwards
Source: Reuters; Team analysis
Commercial phase:Cost of CCS expected to be in the range of the future carbon price
Demonstration phase (2015)
Early commercial
phase (2020+)
Mature commercial
phase (2030+)
€/tonne CO2
Estimated cost of CCS
Carbon price forecast*
05
1015202530354045505560657075808590
Demonstrati on phase:Not economic on standalone basis. Ec
onom
icga
p

5. Future Outlook
• Shell Coal Gasification Process offers high thermal efficiency and feedstock flexibility, ideal for IGCC
• SCGP is fully proven technology (>20 licenses worldwide)
• SCGP can be scaled up with larger and more efficient gas turbines
• Advanced technology could push coal-to-power efficiency:
– well above 49% for IGCC
– well above 42% for IGCC with CO2 capture
• Financial incentives needed to invest in IGCC + CO2 capture at current low CO2 emission prices

Thank you
Discussion and questions

Definitions and cautionary note
•Reserves: Our use of the term “reserves” in this presentation means SEC proved oil and gas reserves and SEC proven mining reserves.
•Resources: Our use of the term “resources” in this presentation includes quantities of oil and gas not yet classified as SEC proved oil and gas reserves or SEC proven mining reserves. Resources are consistent with the Society of Petroleum Engineers 2P and 2C definitions.
•Organic: Our use of the term Organic includes SEC proved oil and gas reserves and SEC proven mining reserves excluding changes resulting from acquisitions, divestments and year-end pricing impact.
•This presentation contains forward-looking statements concerning the financial condition, results of operations and businesses of Royal Dutch Shell. All statements other than statements of historical fact are, or may be deemed to be, forward-looking statements. Forward-looking statements are statements of future expectations that are based on management’s current expectations and assumptions and involve known and unknown risks and uncertainties that could cause actual results, performance or events to differ materially from those expressed or implied in these statements. Forward-looking statements include, among other things, statements concerning the potential exposure of Royal Dutch Shell to market risks and statements expressing management’s expectations, beliefs, estimates, forecasts, projections and assumptions. These forward-looking statements are identified by their use of terms and phrases such as ‘‘anticipate’’, ‘‘believe’’, ‘‘could’’, ‘‘estimate’’, ‘‘expect’’, ‘‘intend’’, ‘‘may’’, ‘‘plan’’, ‘‘objectives’’, ‘‘outlook’’, ‘‘probably’’, ‘‘project’’, ‘‘will’’, ‘‘seek’’, ‘‘target’’, ‘‘risks’’, ‘‘goals’’, ‘‘should’’ and similar terms and phrases. Also included as a forward looking statement in this presentation is our disclosure of reserves, proved oil and gas reserves, proven mining reserves, organic reserves, net reserves and resources. There are a number of factors that could affect the future operations of Royal Dutch Shell and could cause those results to differ materially from those expressed in the forward-looking statements included in this presentation, including (without limitation): (a) price fluctuations in crude oil and natural gas; (b) changes in demand for the Group’s products; (c) currency fluctuations; (d) drilling and production results; (e) reserve estimates; (f) loss of market and industry competition; (g) environmental and physical risks; (h) risks associated with the identification of suitable potential acquisition properties and targets, and successful negotiation and completion of such transactions; (i) the risk of doing business in developing countries and countries subject to international sanctions; (j) legislative, fiscal and regulatory developments including potential litigation and regulatory effects arising from recategorisation of reserves; (k) economic and financial market conditions in various countries and regions; (l) political risks, including the risks of expropriation and renegotiation of the terms of contracts with governmental entities, delays or advancements in the approval of projects and delays in the reimbursement for shared costs; and (m) changes in trading conditions. All forward-looking statements contained in this presentation are expressly qualified in their entirety by the cautionary statements contained or referred to in this section. Readers should not place undue reliance on forward-looking statements. Additional factors that may affect future results are contained in Royal Dutch Shell’s 20-F for the year ended December 31, 2007 (available at www.shell.com/investor and www.sec.gov ). These factors also should be considered by the reader. Each forward-looking statement speaks only as of the date of this presentation. Neither Royal Dutch Shell nor any of its subsidiaries undertake any obligation to publicly update or revise any forward-looking statement as a result of new information, future events or other information. In light of these risks, results could differ materially from those stated, implied or inferred from the forward-looking statements contained in this presentation. This presentation aggregates our equity position in projects for both direct and indirect interests. For example, this includes our indirect interest in the NWS and Pluto projects via our 34% shareholding in Woodside Energy Ltd.

•The United States Securities and Exchange Commission (SEC) permits oil and gas companies, in their filings with the SEC, to disclose only proved reserves that a company has demonstrated by actual production or conclusive formation tests to be economically and legally producible under existing economic and operating conditions. We use certain terms, such as resources, in this presentation that SEC's guidelines strictly prohibit us from including in filings with the SEC. U.S. Investors are urged to consider closely the disclosure in our Form 20-F, File No 1-32575, available on the SEC website www.sec.gov. You can also obtain these forms from the SEC by calling 1- 800-SEC-0330.
•In this presentation we have aggregated our proved reserves from consolidated and equity companies, as management does not view proved reserves differently based upon whether they are attributed to consolidated or equity companies. For a complete breakdown of our proved oil and gas reserves and proven mining reserves please see our Form 20-F for the year ended December 31, 2007
•The companies in which Royal Dutch Shell plc directly and indirectly owns investments are separate entities. In this publication the expressions “Shell” is sometimes used for convenience where references are made to Group companies in general. Likewise, the words “we”, “us” and “our” are also used to refer to Group companies in general or those who work for them. These expressions are also used where there is no purpose in identifying specific companies.