techniques for estimating space station … for estimating space station aerodynamic characteristics...
TRANSCRIPT

NASA-CR-193394
TECHNIQUES FOR ESTIMATING SPACE STATION
AERODYNAMIC CHARACTERISTICS
Richard E. Thomas
Texas A&M Research Foundation
Box 3578
College Station, TX 77843
July I, 1989 - August 31, 1992
(NASA-CR-1933q4) TECHN[QU£S FOR
6STIMAT[NG SPACE STATION
AEROOYNAM[C CHARACTERISTZCS Final
Technical Report, 1Jul. 1989 - 31
Aug. 1992 (Texas AEM Univ.) 85 p
N94-13955
Unclas
G3/IB 0185770
NATIONAL AERONAUTICS AND SPACE ADMINISTRATION
Lyndon B. Johnson Space Center
Houston, TX
NAG 9-386
https://ntrs.nasa.gov/search.jsp?R=19940009482 2018-06-16T22:12:32+00:00Z
THE EFFECT OF MULTIPLY REFLECTED MOLECULES
IN FREE MOLECULE FLOW OVER A GENERAL BODY
A Thesis
by
GORDON LEE POWELL, JR.
Submitted to the Office of Graduate Studies of
Texas A&M University
in partial fulfillment of the requirements for the degree of
MASTER OF SCIENCE
May 1993
l(,lajor Subject: Aerospace Engineering

THE EFFECT OF MULTIPLY REFLECTED MOLECULES
IN FREE MOLECULE FLOW OVER A GENERAL BODY
A Thesis
by
GORDON LEE POWELL, JR.
Approved as to style and content by:
Richard'E_ Tliomas -
(Chair of Committee)
_" Leland A Carlson'
(Member)
Mario A. Colaiuca
(Member)
Waiter E. Haisler
(Head of Department)
May 1993

ABSTRACT
111
I:_CEDrN¢ PAGE OLA_K NOT FILt_D
The Effect of Multiply Reflected Molecules
in Free Molecule Flow Over a General Body. (May 1993)
Gordon Lee Powell, Jr., B.S., Texas A&M University
Chair of Advisory Committee: Dr. Richard E. Thomas
A method was devised and calculations were performed to determine the effects of
reflected molecules on the aerodynamic force and moment coefficients for a body in free
molecule flow. A procedure was developed for determining the velocity and temperature
distributions of molecules reflected from a surface of arbitrary momentum and energy
accommodation. A system of equations, based on momentum and energy balances for the
surface, incident, and reflected molecules, was solved by a numerical optimization
technique. The minimization of a "cost" function, developed from the set of equations,
resulted in the determination of the defining properties of the flow reflected from the
arbitrary surface. The properties used to define both the incident and reflected flows were:
average temperature of the molecules in the flow, angle of the flow with respect to a
vector normal to the surface, and the molecular speed ratio. The properties of the reflected
flow were used to calculate the contribution of multiply reflected molecules to the force and
moments on a test body in the flow. The test configuration consisted of two fiat plates
joined along one edge at a right angle to each other. When force and moment coefficients
of this 90" concave wedge were compared to results that did not include multiple
reflections, it was found that multiple reflections could nearly double lift and drag
coefficients, with nearly a 50% increase in pitching moment for cases with specular or
iv
nearly specular accommodation. The cases of diffuse or nearly diffuse accommodation
often had minor reductions in axial and normal forces when multiple reflections were
included. There were several cases of intermediate accommodation where the addition of
multiple reflection effects more than tripled the lift coefficient over the convex technique.

V
To my parents, for all the support you have given me over the years for everything
that I wanted to do; and to friends and roommates for the friendship, encouragement, and
entertainment you have provided the past few years.
In memory of my good friend, Brian Harder (Oct 12, 1962 - Mar 22, 1993).
vi
ACKNOWLEDGMENT
The author would like to thank Mr. Steve Fitzgerald, whose ideas and initial work
started this project in motion. Thanks, also, to the rest of the people at NASA Johnson
Space Center, who funded the research project, and assisted with the Orbital Aerodynamics
Computer Program. Thanks are also due to the faculty and staff of the Aerospace
Engineering Department, as well as fellow graduate students who offered support and
advice. Thanks to Mr. Maurice Griffin, who assisted in the early stages of this research.
Special thanks go to Dr. Richard Thomas for his immense patience and stalwart support.

vii
TABLE OF CONTENTS
Page
ABSTRACT ........................................... iii
ACKNOWLEDGMENT .................................... vi
TABLE OF CONTENTS ................................... vii
LIST OF TABLES ....................................... ix
LIST OF FIGURES ........................................ x
LIST OF SYMBOLS ...................................... xiv
INTRODUCTION ......................................... 1Background ........................................ 3PreviousWork ...................................... 6Objectives ........................................ 11
DETERMINING THE REFLECTED FLOW PROPERTIES.............. 13
APPLICATION OF MULTIPLE REFLECTIONS .................... 17Orbital AerodynamicsComputerProgram ..................... 17Assumptionsfor ReflectedFlow ........................... 18Descriptionof TestConfiguration .......................... 19Determinationof ReflectedParticleFlux Distribution .............. 21
RESULTSAND DISCUSSION ............................... 25Resultsfor _ = 0.0, o, = 0.0, o, = 0.0 ..................... 25
Results for _ = 1.0, o, = 1.0, e, = 1.0 ..................... 28
Results for a = 0.9, o, = 1.0, e, = 1.0 ..................... 31
Results for _ = 0.9, _, = 0.9, o, = 0.9 ..................... 33
Results for c_ = 0.7, _, = 0.6, _, = 0.6 ..................... 36
Results for _ = 0,5, a, = 0.4, _, = 0.4 ..................... 39
Results for _ = 0.3, o, = 0.2, a, = 0.2 ..................... 41
Results for ot = 0.1, a_ = 0.1, a, = 0.1 ..................... 44Discussion ........................................ 47
CONCLUSION ......................................... 49
REFERENCES ......................................... 51
°.,
Vlll
APPENDIX A: DERIVATION OF THE FITZGERALD EQUATIONS ...... 53
APPENDIX B: VERIFICATION OF REFLECTED FLOW PROPERTIES .... 63
VITA ............................................... 69
ix
LIST OF TABLES
Page
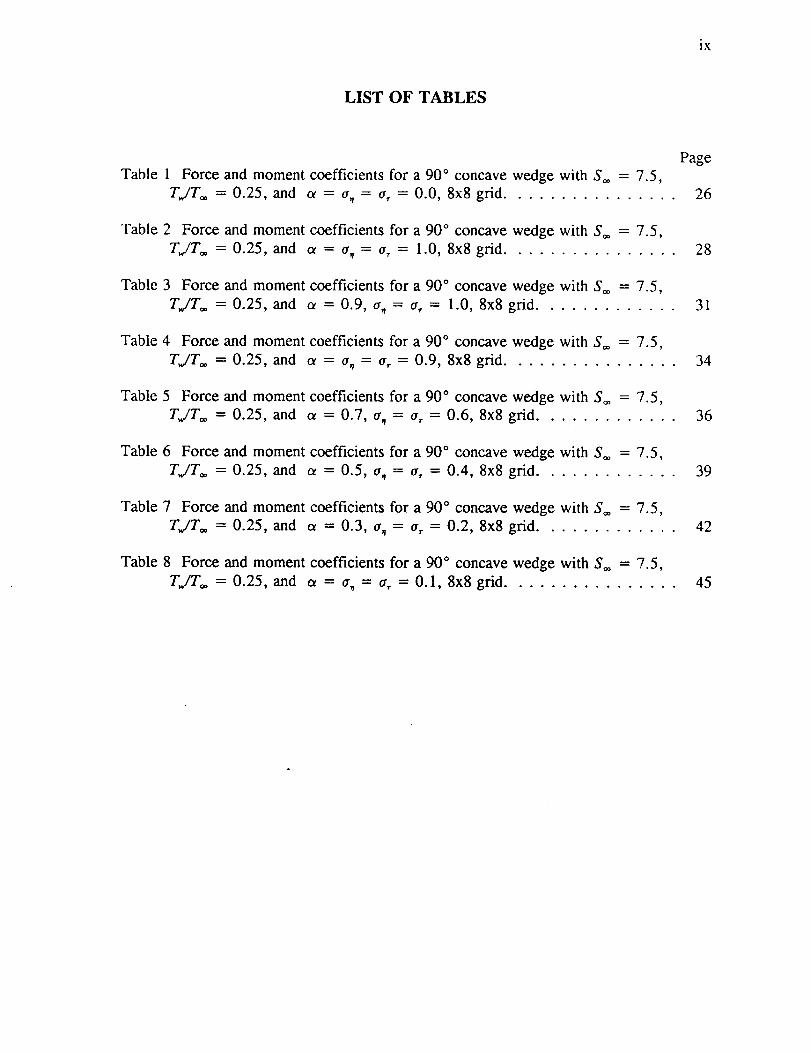
Table 1 Force and moment coefficients for a 90 ° concave wedge with So" = 7.5,
TJT,, = 0.25, and ot = a, = tr, = 0.0, 8x8 grid ................ 26
Table 2 Force and moment coefficients for a 90 ° concave wedge with So" = 7.5,
TJT® = 0.25, and ot = tr, = tr, = 1.0, 8x8grid ................ 28
Table 3 Force and moment coefficients for a 90 ° concave wedge with So. = 7.5,
T_/TO" = 0.25, and t_ = 0.9, o, = or, = 1.0, 8x8 grid ............. 31
Table 4 Force and moment coefficients for a 90 ° concave wedge with So" = 7.5,
TJTO" = 0.25, and et = o, = _, = 0.9, 8x8 grid ................ 34
Table 5 Force and moment coefficients for a 90 ° concave wedge with So" = 7.5,
T,,/TO" = 0.25, and c_ = 0.7, tr, = tr, = 0.6, 8x8 grid ............. 36
Table 6 Force and moment coefficients for a 90 ° concave wedge with So" = 7.5,
TJTO" = 0.25, and a = 0.5, o, = tr, = 0.4, 8x8grid ............. 39
Table 7 Force and moment coefficients for a 90 ° concave wedge with So" = 7.5,
T,,,/T** = 0.25, and t_ = 0.3, tr, = tr, = 0.2, 8x8 grid ............. 42
Table 8 Force and moment coefficients for a 90 ° concave wedge with So, = 7.5,
TJT,,, = 0.25, and t_ = tr, = tr, = 0.1, 8x8 grid ................ 45

LIST OF FIGURES
X
Page
Fig. 1 Global coordinate system and axis with relation to freestream velocityvector ........................................... 20
Fig. 2 90" wedge test configuration geometry and local coordinate systems with
subshape and element numbering scheme ...................... 20
Fig. 3 Geometry used to define elementary solid angle for integration of Nocilla's
intensity .......................................... 23
Fig. 4 Incident and reflected velocity vectors for a surface area element ....... 23
Fig. 5 Axial force coefficient for a 90 ° concave wedge with So* = 7.5, T,JT_. =
0.25, and o_ = a, = a, = 0 ............................. 26
Fig. 6 Normal force coefficient for a 90 ° concave wedge with So* = 7.5, T,,/TO*
= 0.25, and _ = a_ = a, = 0 ........................... 26
Fig. 7 Lift coefficient for a 90 ° concave wedge with S® = 7.5, TJTO* = 0.25,
and _ = a_ = a, =0 ................................. 27
Fig. 8 Drag coefficient for a 90 ° concave wedge with S** = 7.5, TiTs. = 0.25,
and _ = cr_ = a, = 0 ................................. 27
Fig. 9 Pitching moment coefficient for a 90 ° concave wedge with So* = 7.5, TJTO*
= 0.25, and ot = a_ = a, = 0 ........................... 28
Fig. 10 Axial force coefficient for a 90 ° concave wedge with S** = 7.5, TJT_, =
0.25, and ot = a_ = a,= 1 ............................. 29
Fig. 11 Normal force coefficient for a 90 ° concave wedge with So. = 7.5, TJT_
= 0.25, and ot = a_ = a, = 1........................... 29
Fig. 12 Lift coefficient for a 90 ° concave wedge with So, = 7.5, T,,/T_. = 0.25,
and a = a_ = a, = 1 ................................. 29
Fig. 13 Drag coefficient for a 90 ° concave wedge with So* = 7.5, TJT_, = 0.25,
and o_ = a_= a, = 1. ................................ 29
Fig. 14 Pitching moment coefficient for a 90 ° concave wedge with So, = 7.5,
TJT.,, = 0.25, and ot = aT = _r, = 1 ....................... 30

xi
Fig. 15 Axial forcecoefficientfor a90° concave wedge with So. = 7.5, T,,/To. =
0.25, and ot = 0.9, a_ = a, = 1.0 ......................... 31
Fig. 16 Normal force coefficient for a 90 ° concave wedge with So. = 7.5, TJTo.
= 0.25, and o_ = 0.9, a,,= a, = 1.0 ....................... 31
Fig. 17 Lift force coefficient for a 90 ° concave wedge with So. = 7.5, TJTo. =
0.25, and c_ =0.9, a_ = tr, = 1.0 ......................... 32
Fig. 18 Drag force coefficient for a 90 ° concave wedge with So. = 7.5, TJTo. =
0.25, and t_ =0.9, a,_= a, = 1.0 ......................... 32
Fig. 19 Pitching moment coefficient for a 90 ° concave wedge with So. = 7.5,
TJTo. = 0.25, and c_ =0.9, a, = a, = 1.0 ................... 32
Fig. 20 Axial force coefficient for a 90 ° concave wedge with So. = 7.5, TJTo. =
0.25, and t_ = a_ = tr, = 0.9 ............................ 34
Fig. 21 Normal force coefficient for a 90 ° concave wedge with So. = 7.5, TJT,,,
= 0.25, and a = a, = a, = 0.9 .......................... 34
Fig. 22 Lift force coefficient for a 90 ° concave wedge with So. = 7.5, TJTO* =
0.25, and ot = a, = a, = 0.9 ............................ 34
Fig. 23 Drag force coefficient for a 90 ° concave wedge with So* = 7.5, TJT_. =
0.25, and ot = a_ = a,.=0.9 ............................ 34
Fig. 24 Pitching moment coefficient for a 90 ° concave wedge with So* = 7.5,
TJT,,, = 0.25, and ot = a_ = a, = 0.9 ...................... 35
Fig. 25 Axial force coefficient for a 90 ° concave wedge with So. = 7.5, T,,/TO* =
0.25, and _ = 0.7, a,_ = a,. = 0.6 .................. ....... 36
Fig. 26 Normal force coefficient for a 90 ° concave wedge with So. = 7.5, TJTo.
=0.25, and ot =0.7, a, = a, = 0.6 ....................... 36
Fig. 27 Lift force coeffieient for a 90 ° concave wedge with So. = 7.5, TJTo. =
0.25, and ot =0.7, a,,= a, =0.6 ......................... 37
Fig. 28 Drag force coefficient for a 90 ° concave wedge with So. = 7.5, TJTo. =
0.25, and ot = 0.7, a_ = a, = 0.6 ......................... 37
Fig. 29 Pitching moment coefficient for a 90 ° concave wedge with So. = 7.5,
T,,,/T** = 0.25, and ot = 0.7, tr,_ = tr, = 0.6 ................... 38

xii
Fig. 30 Axial forcecoefficientfor a 90° concave wedge with So* = 7.5, TJTO* =
0.25, and ot =0.5, a,,= a, = 0.4 ......................... 39
Fig. 31 Normal force coefficient for a 90 ° concave wedge with So* = 7.5, TJToo
=0.25, and ot =0.5, a,= at =0.4 ....................... 39
Fig. 32 Lift force coefficient for a 90 ° concave wedge with S_o = 7.5, TJTO* =
0.25, and ot = 0.5, a, = a, =0.4 ......................... 40
Fig. 33 Drag force coefficient for a 90 ° concave wedge with So. = 7.5, TJTO* =
0.25, and a = 0.5,(r, = tr, = 0.4 ......................... 40
Fig. 34 Pitching moment coefficient for a 90 ° concave wedge with So* = 7.5,
TJTO* =0.25, and _ = 0.5, a, = a, = 0.4 ................... 41
Fig. 35 Axial force coefficient for a 90 ° concave wedge with So. = 7.5, T,,./TO* =
0.25, and o_ = 0.3, a, = a, = 0.2 ......................... 42
Fig. 36 Normal force coefficient for a 90 ° concave wedge with So. = 7.5, TJTO*
= 0.25, and ot = 0.3, a,, = a, = 0.2 ....................... 42
Fig. 37 Lift force coefficient for a 90 ° concave wedge with So. = 7.5, TJTO* =
0.25, and o_ = 0.3, a,,= a, = 0.2 ......................... 43
Fig. 38 Drag force coefficient for a 90" concave wedge with So* = 7.5, TJTO* =
0.25, and ot = 0.3, tr,, = a_. = 0.2 ......................... 43
Fig. 39 Pitching moment coefficient for a 90 ° concave wedge with S,_ = 7.5,
T,,,/TO* = 0.25, and ot = 0.3, a T = a, = 0.2 ................... 43
Fig. 40 Axial force coefficient for a 90 ° concave wedge with So* = 7.5, TJTo. =
0.25, and ot = a T = a, = 0.1 ............................ 45
Fig. 41 Normal force coefficient for a 90 ° concave wedge with So* = 7.5, T,,/TO*
= 0.25, and tr = a T = a, = 0.1 .......................... 45
Fig. 42 Lift force coefficient for a 90" concave wedge with So* = 7.5, T,JTO* =
0.25, and ot = a T = a, = 0.1 ............................ 46
Fig. 43 Drag force coefficient for a 90 ° concave wedge with So. = 7.5, T_/TO* =
0.25, and ot = a T = (r, = 0.1 ............................ 46
Fig. 44 Pitching moment coefficient for a 90 ° concave wedge with So. = 7.5,
TJTo. = 0.25, and a = a T = a, =0.1 ...................... 46
xiii
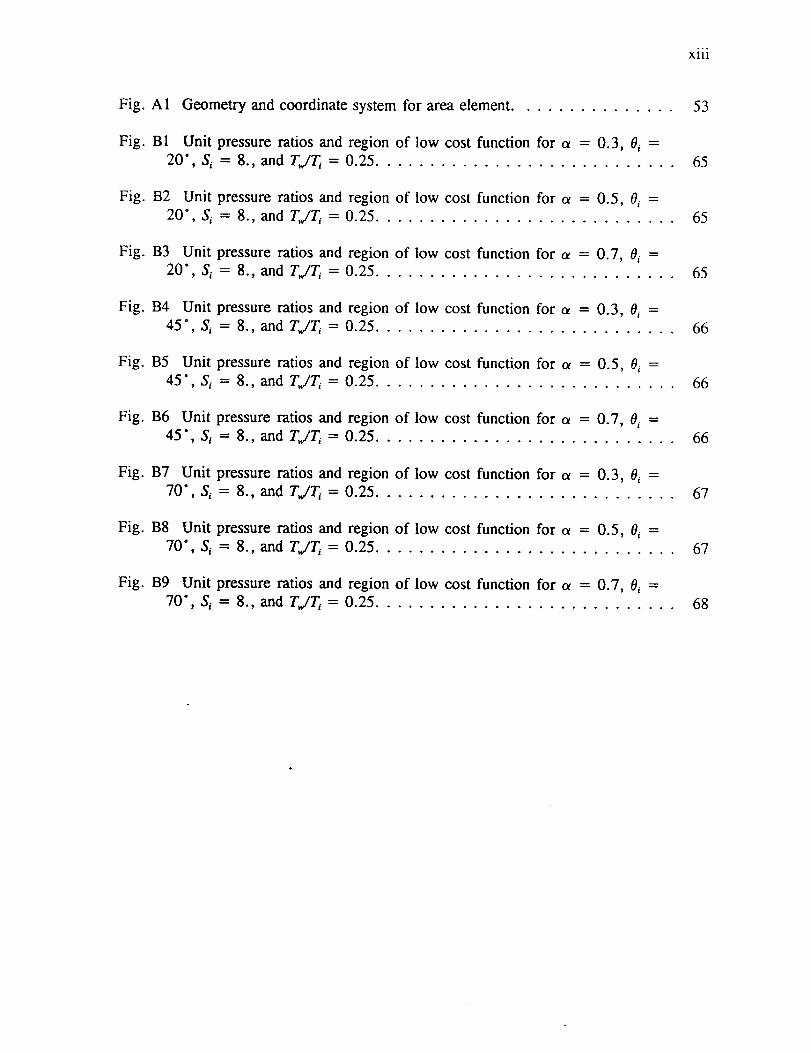
Fig. A1
Fig. B1 Unit2o', s,
Fig. B2 Unit
2o', s,
Fig. B3 Unit
20", Si
Fig. B4 Unit
45", S i
Fig. B5 Unit
45", Si
Fig. B6 Unit
45", Si
Fig. B7 Unit
70", Si
Fig. B8 Unit
70", Si
Fig. B9 Unit
70", Si
Geometry and coordinate system for area element ............... 53
pressure ratios and
= 8., and TJT,. =
pressure ratios and
= 8., and TJT,. =
pressure ratios and
= 8.,and TJT_ =
pressure ratios and
= 8., and TJT,. =
pressure ratios and
= 8., and TJT,. =
pressure ratios and
= 8., and TJT,. =
pressure ratios and
= 8., and TJT, =
pressure ratios and
= 8., and =
pressure ratios and
= 8., and TJT_ =
region of low cost function for _ = 0.3, 0_ =0.25 ............................ 65
regton of low cost function for o_ = 0.5, 0, =0.25 ............................ 65
region of low cost function for o_ = 0.7, 0, =
0.25 ............................ 65
regxon of low cost function for o_ = 0.3, 0_ =0.25 ............................ 66
regton of low cost function for ot = 0.5, 0_ =0.25 ............................ 66
regxon of low cost function for c_ = 0.7, 0; =0.25 ............................ 66
region of low cost function for o_ = 0.3, 0i =0.25 ............................ 67
region of low cost function for a = 0.5, 0_ =0.25 ............................ 67
region of low cost function for o_ = 0.7, 0i =0.25 ............................ 68

xiv
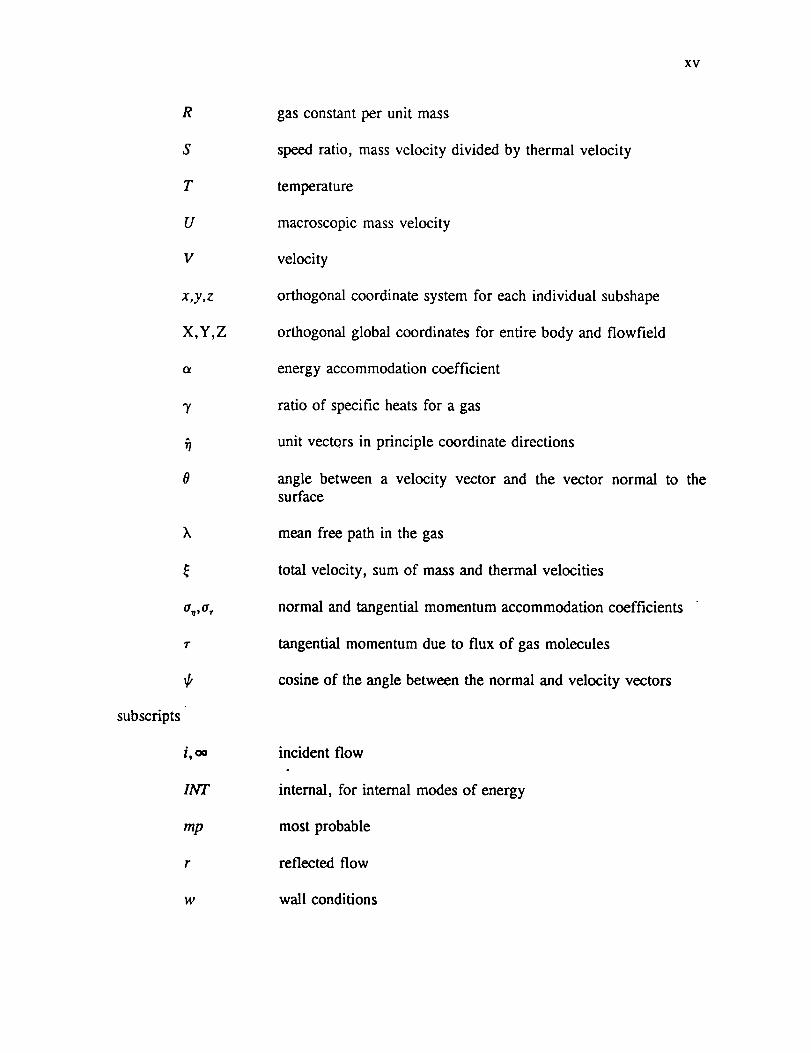
LIST OF SYMBOLS
A,Ar_f
¢
CA
Co
CL
CMp
CMR
CM,
C,
E
f
Fl
F2
F3
J
k
m
n
P
reference area of a surface subshape
thermal velocity of molecule
axial force coefficient
drag force coefficient
lift force coefficient
pitching moment coefficient
rolling moment coefficient
yawing moment coefficient
normal force coefficient
side force coefficient
flux of energy across an element of surface area
Maxwellian distribution, fraction of diffusely reflecting molecules
equation based on conservation of tangential momentum
equation based on conservation of normal momentum
equation based on conservation of energy
objective function for the optimization of conservation equations
Boltzman's constant (gas constant per molecule)
mass of gas molecule
number density of gas molecules
particle flux per unit area per unit time
component of momentum normal to surface due to flux of gasmolecules
XV
R
S
T
U
V
x,y,z
X,Y,Z
0
7"
subscripts
i, oo
INT
mp
F
gas constant per unit mass
speed ratio, mass velocity divided by thermal velocity
temperature
macroscopic mass velocity
velocity
orthogonal coordinate system for each individual subshape
orthogonal global coordinates for entire body and flowfield
energy accommodation coefficient
ratio of specific heats for a gas
unit vectors in principle coordinate directions
angle between a velocity vector and the vector normal to thesurface
mean free path in the gas
total velocity, sum of mass and thermal velocities
normal and tangential momentum accommodation coefficients
tangential momentum due to flux of gas molecules
cosine of the angle between the normal and velocity vectors
incident flow
internal, for internal modes of energy
most probable
reflected flow
w wall conditions
INTRODUCTION
Satellite and aerodynamics are two words that many people would not usually
associated with each other. In designing satellites, aerodynamics is not generally important
for determining the structure or configuration of the craft. In the highly rarefied gas
present at orbital altitudes, the actual forces exerted on a satellite are orders of magnitude
less than those experienced by aircraft. However, due to the much longer time of flight
for satellites compared to a typical aircraft mission, the cumulative effect of the forces over
time is of great concern.
Concern about the composition and density of the upper atmosphere and rarefied gas
dynamics preceded the space age as aircraft and rockets flew higher and faster. With the
advent of the space age, there was a desire for a better understanding of satellite
aerodynamics because "it will permit accurate predictions of the expected impact locations
of heavy or dangerous payloads, so that attempts can be made to divert them from impact
areas where damage could result or areas that would be embarrassing. ''t The Rand
Corporation study of orbital decay was initiated soon after a 21 pound chunk of iron and
steel, a portion of Sputnik IV, fell on a street comer in Manitowoc, Wisconsin in
Septembe/" of 1962. Today, more important than concerns about debris from reentering
spacecraft, the aerodynamic forces and moments on an orbiting body are of concern for the
designers of the craft for a number of other reasons. The primary motivations are: sizing
the attitude stabilization and control systems, a need to determine orbital re-boost,
determining propellant requirements between service visits, sizing a gyro-stabilization
Journal model is AIAA Journal.

2
system, and calculating the acceleration environment for micro-gravity experiments. The
space station program, designing Freedom, has many of these concerns.
The flight regime of these orbiting vehicles is known as free molecular flow (FMF).
Free molecular flow is the regime of rarefied gas dynamics where collisions between
molecules in the flow can be ignored when compared to the frequency of collisions between
the flow and the body immersed in the flow. Essentially, the particles reflected from a
surface do not interact with particles in the freestream and therefore do not affect the
incoming flow as they do in continuum flows.
Several aspects of satellite aerodynamics need to be investigated more thoroughly
in order to better predict forces and moments on a craft. Long the primary difficulty of
satellite aerodynamics, modeling the atmosphere at orbital altitudes has become more
tractable with the availability of more accurate data. The next logical area to seek
improvement is in the techniques for estimating the force and moment coefficients on a
body in the atmosphere at orbital altitude. This is especially important with the increasing
complexity of satellite configurations such as the space station Freedom, with its truss
structure and numerous large panels.
It is no longer feasible to model all vehicle configurations as if they were simple
convex bodies. Convex bodies are easiest to model in free molecule flow since the transfer
of momentum and energy of the impinging particles can be calculated and then the particles
can be forgotten about. The traditional methods for calculating the aerodynamic forces and
moments in free molecule flow could still be adequate if the body being studied is
configured as a convex surface. A concave surface, on the other hand, allows the
impinging freestream molecules to reflect off one portion of the body and possibly strike
3
the body again. Eachinteractionof a gasparticleandthe surfacecontributesto thetotal
forceand momenton the body.
Background
In anystudyof freemoleculeflow of gas,thereare threemainflow parametersthat
shouldbe kept in mind. Oneof the mostimportantparametersis the Knudsennumber,
Kn, based on the mean free path. The mean free path is the average distance that a
molecule travels between collisions with other particles in the gas. The Knudsen number
is defined to be X/l, where X is the mean free path, and I is some characteristic length. For
interior flows, the characteristic dimension is often taken to be the diameter of the channel.
In the case of exterior flows, the characteristic length may be the overall length of the body
about which the flow is being studied. Another important parameter is the molecular speed
ratio, S. The speed ratio is similar to the Mach number, but applicable to the molecular
flow of gases. S is the ratio of the macroscopic mass velocity of the gas to the thermal
velocity of the gas particles. The third parameter to be considered is the temperature ratio.
T,c/T_ is the ratio of the body wall temperature to the incident freestream temperature.
The mean free path, so critical for defining the free molecule flow regime, is related
to the atmospheric density. For a constant gas temperature and composition, the mean free
path is inversely related to density. Like density, the variation of mean free path in the
atmosphere can be crudely modeled as exponential with altitude. At standard conditions,
the mean free path is about 6 X 10 _ cm, and at orbital altitudes of 400 km it is roughly 1
X l(Pm.
The field of gas dynamics is further subdivided by consideration of the Knudsen
number. There are three flow regimes that are generally considered. For cases where the
Knudsen number is much less than unity, ranging from the inviscid limit of 0.0 up to about
0.1, the flow is in the continuum region. The continuum region is that flow regime that
encompasses "normal" aerodynamics. The gas behaves as a continuum and it is very
difficult to evaluate the effects of individual gas particles or molecules. When the Knudsen
number is near 1.0, aerodynamic processes are termed transition or slip flows. Under
those circumstances, the normal boundary layer assumption of zero velocity at the body
surface may no longer apply. In this slip flow, the boundary layer is still in existence, but
the gas velocity at the wall is greater than zero. The third regime, and the one of interest
in the present work, is free molecule flow. Free molecule flow is generally defined as a
flow with a Knudsen number much greater than 1.0. Because the incident and reflected
flow do not interact with each other, the total flow may be analyzed by a superposition of
the two streams.
Since all the momentum and energy transfer occurs directly on the body surface,
it is necessary to know how a particle interacts with a surface. Accommodation coefficients
are commonly used to describe the fraction of momentum and energy transferred to a body
by a colliding molecule. The forms of the energy, normal momentum, and tangential
momentum accommodation coefficients to be used in this study are:

5
E i -- E r
_ai-P_o-
7"i --'/'r
(1)
where Ei, P, and r_ are fluxes on the surface of the incident energy, tangential momentum,
and normal momentum. Er, Pr, and rr are the fluxes at the surface due to reemitted
molecules, and Ew, Pw are the fluxes of molecules that are in Maxwellian equilibrium with
the wall. z
For modeling the rarefied gas environment, the distribution of velocities is
commonly considered to be Maxwellian3:
n /f- (2rRT) m
(2)
The freestream flow is assumed to be a drifting Maxwellian gas, striking a surface of
arbitrary (but known) accommodation a, tr,, tr,:
, ,3,f- (21-RT_) 3nexp 2RT_
Where the velocities of the molecules, _, are considered to be a superposition of the
macroscopic mass velocity, U, and the random thermal velocity, c.
6
= (¢,u,÷c.)O, . (¢,V,+c2)_2. (0,V,÷c3)_3
= (-¢ru,÷c,)_, ÷ (¢,U,÷c90 _ ÷ (ov÷q)O,(4)
In addition, the flow reemitted from the surface is also assumed to take on a drifting
Maxwellian distribution.
fr - (2_rRT) 3a exp 2_ J (5)
Previous Work
The study of flee molecule flow, although it has numerous high-tech and modem
applications, is by no means a new field of study. Some of the earliest works involving
modem rarefied gas flow were carried out by James Clerk Maxwell and his
contemporaries. Maxwell was the first to investigate gas flows with large mean free paths
and one of the first to put an understanding of rarefied flows of gas to work, explaining the
effects of Crooke's radiometer and rarefied gas flows in capillary tubes. Perhaps the most
important assumption he made with regard to free molecule flow was to break up the
.
reflected flow from a surface into two components. A fraction, f, of the particles are
reflected in a manner that transfers all of their tangential momentum to the surface, so the
reflected flow would not have any net velocity parallel to the surface. The remaining
fraction, l-f, reflects in a mirror-like fashion, transferring only normal momentum to the
7
surface and not affecting the component of velocity parallel to the surface. 4
The two components of flow that are usually considered today are specular and
diffuse reflection. In specular reflection, the incident flow is unaffected in the direction
parallel to the surface and the direction of the flow perpendicular to the surface is changed
in direction only. The magnitude of velocity perpendicular to the surface is unchanged.
For diffuse reflection, the incident flow is completely accommodated to the surface
conditions. The reflected particles leave the surface in a uniform distribution with no net
motion parallel to the surface.
Knudsen was also an early contributor in the field. In L.B. Loeb's book, The
Kinetic Theory of Gases, 1934, he references work done by M. Knudsen, published in
1909, on the effusion of gases through a hole in a thin diaphragm, s In that work, he
developed the cosine distribution for the direction of molecular flow emitting from a point.
Knudsen is also attributed by S_inger as having developed the idea of diffuse reflection. 6
In the same paper, the idea of mirror or specular reflection is cited as being due to
Newton. S_ger was the first to detail the free molecule transfer of energy of the internal
degrees of freedom of diatomic molecules, o
Many of the early studies of free molecular processes were for flows at low speed
and for internal flow configurations. The results of this work were applied in vacuum
processes and to flows through ducts and orifices.
A.F. Zahm coined the term Superaerodynamics to refer to flight in conditions of
high Mach number, high altitude and hence low density, and was one of the first to
consider the high speed molecular flows that would be found by advanced vehicles in high
altitude flight. 7 S_nger, in his paper referenced above, was also one of the early

investigatorsof high speedrarefiedgasflows. His work includedcalculationof the drag
of a normally inclinedflat plate in a flow of finite speedratio.
However, mostof theadvancesin free moleculeflow at high speedswere made
after World War II. This wastheperiodof the "perfection"of the rocketengine,andthe
beginning of an era in which free molecule flow became of practical concern.
Superaerodynamicswasno longerjust in the realm of the theorist. Tsien's 1946paper
consideredthemolecularflow at largefreestreamMachnumberoveran inclinedflat plate.
As Tsiennoted,thegreatestsimplificationof freemoleculeflow over continuummethods
was that "one neednot considerthedistortion of the Maxwelliandistribution dueto the
collision of there-emittedmoleculeswith the moleculesin the stream.,,8
The introduction of a thermal accommodation coefficient is attributed to
Smoluchowsky and Knudsen. The coefficient is defined by:
de, -dE,.Ol =
dE i -dE w
where dE_ and dEr are energy fluxes incident on and reemitted per unit time from a
differential element of area. The value of dE,, is the flux of energy corresponding to a flow
of reemitted molecules with a Maxwellian distribution with a temperature, Tw, equal to the
wall temperature. In a slight change from MaxweU's method, Schaaf and Chambr6
introduce both a tangenti_ and normal momentum accommodation coefficient in parallel
to the energy accommodation, since a single parameter, like f, may not be sufficient to
describe the reflection process adequately. 9

9
Ti - T r- (r = O)
Ti - T w '
-/ mPi -- Pr
Pi -- Pw
where r and p are the tangential and normal components of momentum.
Numerous investigations were carded out in the post war period, but nearly all the
work involved flow over bodies that are convex. Schaaf and Chambr6, in "Flow of
Rarefied Gases", provide a table of works exploring flow around plates, cylinders, spheres,
cones, ogives, ellipsoids, and composite bodies. Sentman produced a very thorough paper
that very clearly demonstrated how to calculate the force and moment coefficients on a
complex body made up of elements including flat plates, circular cylinders, cone frustums,
and spherical segments. 1° He notes that his equations account for shielding such as the
back surface of a cylinder by the front surface, but not shielding of one element by another,
so that care must be taken in their application.
Sentman's work at Lockheed was followed by the development of a computer
program at Lockheed Missiles & Space Company's Huntsville Research & Engineering
Center. This orbital aerodynamics program, which added the ability to account for mutual
molecular shadowing, used Sentman's equations to allow the calculation of the aerodynamic
forces and moments on a complex vehicle shapes. II It is still in use today, and this
research endeavors to expand the accuracy and utility of the program.
It was not until the late 1950's and early 1960's that external flow over concave
shapes began to appear in the literature with any regularity. Ira Cohen and Moustafa
Chahine were among the first to tackle the problem. Cohen investigated the flow into an

10
open hemispherewith diffuse reflection of molecules.12 Chahine studied specular
reflection andpartial accommodationin an infinite cylindrical surfaceand in a spherical
segment.13
Additionalwork on the freemoleculeflow over ageneralconcavebody appearsin
Koganandalsoin Patterson.Koganpresentsa thoroughbut nonappliedderivationof the
integral equationsfor flow over a concavesurfaceand includessomedata from other
investigations.14Pattersonalsotoucheson theproblemof concavesurfaces,but limits his
investigationto the applicationof rarefiedflow in pipes.15
Bird considersflowswith multiple reflectionandstatestheir importanceto external
flows pastbodiesof complexgeometry. He notesthat theFredholmintegral equationof
thesecondkind thatarisesin thesolutionof this problemis necessarilysolvednumerically.
He doesdiscussin detail the applicationof the test-particleMonteCarlo methodto flows
aroundgeometriesthat are too difficult to calculateanalytically. He demonstratesthe
MonteCarlo methodfor a circular tube flux problem.16
Koppenwallneralso included someaspectsof flow over concavesurfacesin his
work. He chosenot to investigatethe full effectsof multiple reflectionson a concave
surface,but did includetheeffect hecalls "screening"on concaveelements. His results
areexactfor thecasewhereT,,,/T** = 0 and S,, = Qo, but can be used as an approximation
for cases with T,,JT** < 1 and Sw > > 1.17 A note should be made about the difference
of shielding and screening. Shielding is when a portion of the body is positioned directly
between one part of the body and the direction of the mass velocity vector. Recognizing
that the incoming flow has a distribution of directions based on the thermal velocity of the
gas, shielding is when a portion of the body blocks flow to another part of the body from

directionsotherthan the massvelocity.
11
Objectives
The calculationof the effectsof multiple reflectionsfor a generalbody in free
molecularflow is a problemthathasbeenidentifiedandconsideredfor manyyears. The
problemhasbeenfoundto bedifficult in both theanalyticalandnumericalfields. Analytic
solutionsfor the problem involving fairly simplegeometrieshavebeenfoundby several
researchers.However,ananalyticclosedform solutionfor a generalgeometricbody has
notbeendeveloped,sincetheintegrationoveranarbitrary body is difficult or impossible.
Previousworks haveconcentratedon simplegeometriessuchasL-shapedor flapped flat
plates,hollow semicylinders,andhollow hemispheres.
In addition to difficulties resulting from geometry, most works assumespecific
valuesfor the surfaceaccommodationcoefficients. The most commonassumptionsare
diffusereflection,followedby specularreflection. Accommodationcoefficientshavevalues
of 1.0 for diffuse reflection, indicatingthatthe moleculesare reemittedfrom the surface
with a Maxwelliandistributionof speedsbut nomassvelocity parallelto the surface. The
moleculeshavea meantemperatureequalto thatof thewall. Theassumptionof specular
reflection indicates that no energy accommodationtakes place and that tangential
momentumof the particles is not changed. The normal momentumdoesnot changein
magnitudebut thedirection is reversed.For specularreflections,all threeaccommodation
coefficientsaredefinedto be zero.
Anotherdifficulty encounteredwhendealingwith theproblemof multiply reflected

12
moleculesis thequestionof how the particlesinteractwith a surface,or moreprecisely,
thebehaviorof theparticlesleavinga surfaceafterimpingement.Whenconvexbodiesare
considered,the only concern is the momentumand energy transferredto the surface.
There is no needto know the eventualdispositionof the reflectedparticles. However,
when including the effectsof reflectedparticleson concavebodies, the momentumand
energypropertiesof the reflectedparticlesare critical becauseit is possiblefor those
moleculesto strikea secondarysurfaceand impart furthermomentumandenergytransfer
to the surface.
Oncethebehaviorof thereflectedparticlesis determined,a waymustbedeveloped
to implementthat information. For a generalconcavebody, the flow reflectedfrom a
surfaceelementmaystrike thebody againin anotherlocation. Any elementon thebody
may seea combinationof previouslyreflectedand freestreamflows striking the surface.
A problem when consideringmultiple reflections is that someparticlesmay strike the
surfaceonly once,while othersmay strikethe surfacestwice or evenmanytimes.
In this research,a methodfor numericallydeterminingthe distributionof reflected
momentumandenergyfor ageneralbodywith arbitraryaccommodationispresented.The
ability to calculatethereflecteddistributions,andhencepossiblythe secondarycollisions,
leadsto amorephysically"exactMmethodof calculatingtheforceandmomentcoefficients
on anarbitrarybody with arbitrary valuesof theaccommodationcoefficients. An existing
computerprogram,theLockheed Orbital Aerodynamics Computer Program, is updated toO
include the effects of multiple reflections in the calculation of free molecule aerodynamic
forces and moments.

DETERMINING THE REFLECTED FLOW PROPERTIES
13
The first objective was to determine the properties that defined the flow of reflected
particles from a surface. The initial work and ideas for the task were produced by Mr.
Steve Fitzgerald under the auspices of a NASA Johnson Space Center program to improve
the aerodynamic modeling of the space station Freedom. Fitzgerald realized that the three
expressions defining the momentum and energy accommodation coefficients were
expressions of the conservation of normal and tangential momentum and energy. The
coefficients were defined as:
E_-IErl e,-IP_l _,-Irrlo, - E,-IE.I ' _ - P,-I_l ' ,r = _ (6)
7"i
The equations were simply rearranged and set equal to zero such as:
o : (1-,,j_-, - IrA
o = (_-o-,.)P,+ o-.Iv.I - IP.I
o : (_-o,)E,+ _1_1 - lEA
(7)
By substituting the gas kinetic expressions for each of the fluxes into equations (7) above,
a system of three equations was produced. A more detailed explanation and derivation is
shown in Appendix A. Given defining information about the incident flow upon the surface
such as T_, Si, _bi, and complete knowledge of the surface, geometry and accommodation
coefficients, the system becomes one of three equations with three unknowns.
Unfortunately, because of non-lineaxities like the error function, the system cannot be
solved by analytic methods.

14
However,becauseit is possibleto put fairly definiteandreasonableboundson the
unknownsand becauseit is possibleto makea fairly good initial guessat a solution, a
simply constrained,non-linearoptimizationtechniqueis readilyapplicable. Settingeach
of theequationsequalto Ft, F2, or F3 respectively:
F, = 0 = (1-,_)_-,- I_,1
F_ = 0 = (_-_)e, + o,,IP,,I - I_1
F_ = 0 = (_-o,)_, + _lEwl - IZr,I
(8)
It is necessary to form an objective function from F_, F2, and 1::3 that can be minimized:
:]J = _Fi + F2 + F (9)
TO insure that each of the individual equations, F, independently approach zero without
simply summing to zero, each term in the cost function is squared.
The objective or "cost" function can be solved by a nonlinear optimization
technique. J can be minimized given the input values of tr., tr,, or, T, _i, Si, 3', and Tw.
These quantities are known from material properties, atmospheric data and the geometry
of the problem. The constraints are simple bounds on the variables Tr, fir, and S,. T, is
bounded by the lowest and highest of the incident and wall temperatures, fir is bounded
to keep the reflected velocity directed out of the surface, and not into it. S, is bounded by
zero and the incident speed ratio, S_, for most usual cases of accommodation.
A commercial Fortran optimization routine was utilized to take advantage of an
existing and reliable optimization scheme. The double precision routine will minimize a
15
function of N variablessubjectto boundson thevariablesusinga quasi-Newtonmethod
anda user-suppliedgradient. Optionally,a differentcommercialroutinemaybe usedfor
the optimization. This routine will also minimize a function of N variablessubjectto
boundson thevariablesusinga modifiedNewtonmethodanda user-suppliedHessian.
Theinitial guessesfor optimizationaresimplefunctionsof thefreestreamconditions
and theaccommodationcoefficients. The purposeof a setof calculatedinitial guessesis
to providea beginningpoint for theoptimizationsearchthat is closerto the solutionthan,
say, the incident conditions. A set of guessesthat is deemedto at leastapproximatea
likely solutionwill possiblyhelpavoid local minimain the searchfor a global minimum
and reducethenumberof searchstepsneeded.The setof initial guessesthat seemedto
provide the mostconsistentresultsfor all combinationsof accommodationwas:
:r = E.+
s,.,,, :
(10)
Successful minimization of the cost function results in the desired values of fir, S, and T_
necessary for the determination of the distribution of the stream reflected from a surface.
When a global minimum is found, the value of the cost function should be very near zero.
For the cases run in this investigation, the cost function at the location of a solution was
often in the neighborhoo_ of i0 -'° to 10-2°, although it was occasionally as large as 10 "4.
For comparison, the cost function evaluated with the initial guesses (i.e. at the start of
optimization) may be as large as 104.
Successful minimization of the cost function is not automatically assured, even with
a "good" set of initial guesses. The choice of a set of accommodation coefficients to
16
describea surfaceis not really an arbitrary matter, but a materialproperty. So, a poor
choiceof accommodationcoefficientsmayleadto a setof equationsthathavenosolution-°
cannotbe minimizedsuccessfully.AppendixB discussestheselectionof accommodation
coefficientsand thesuccessfuldeterminationof thepropertiesof the reflectedflow.

17
APPLICATION OF MULTIPLE REFLECTIONS
Since in free molecule flow the gas molecules do not interact with one another but
only with the surface, the flow of incident and reflected particles can be appraised
separately and the results summed to calculate the cumulative effect. With that in mind,
it was decided that the best way to compare the forces on a body with and without
consideration of multiple reflections was to continue to use the Lockheed Orbital
Aerodynamics Program and add the necessary sections of code to calculate the contribution
from multiple reflections.
Orbital Aerodynamics Computer Program
The Orbital Aerodynamics Computer Program is a computer code written in the
Fortran language that can obtain aerodynamic force and moment coefficients for any
complex vehicle, symmetrical or asymmetrical, at any vehicle angle of attack or roll, or
combination of both. The code handles complex vehicles by regarding each composite part
(subshape) of the vehicle as a separate body. The code can handle mutual shadowing of
subshapes and can model vehicles using cylinders, cones and cone frustums, circular plates
and rings, rectangular plates, right-angled triangular plates, and spheres. Based on a user
input mean free path for each altitude case, the Knudsen number is calculated and force and
moment coefficients are calculated as required by the flow regime. Rarefied continuum
flow utilizes modified Newtonian theory. The transition regime makes use of an empirical
relation that was developed to approximate experimental data. The FMF regime uses the
standard formulations of free molecule theory, and Sentman's equations in particular.
18
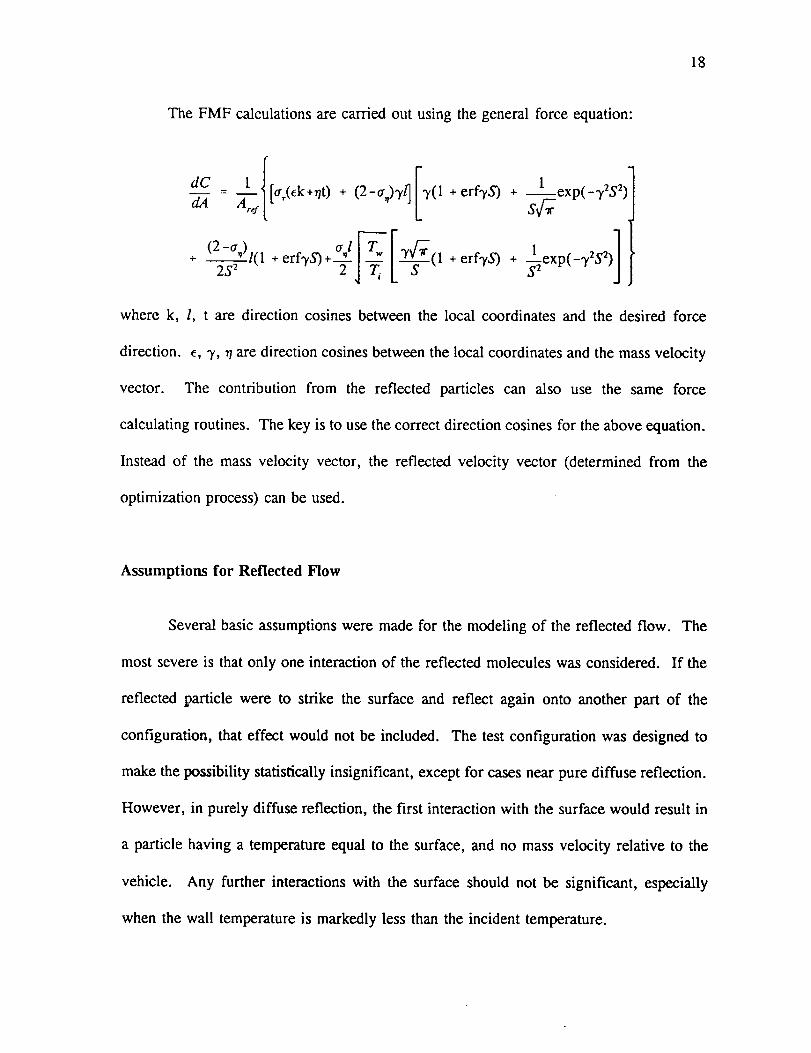
The FMF calculationsarecarriedout usingthegeneralforceequation:
dC- 1 {[a(ek+r/t) +(2_a)_,/][3,(l+erf.rS) + Lexp(_3,2S2) ]dA J
+ (2S_")l(1 +erfs'S)+a/_T_. [-_--(1+erfqcS)+2 _-_2exp(-3'2S2) |[
where k, l, t are direction cosines between the local coordinates and the desired force
direction, e, 3', rt are direction cosines between the local coordinates and the mass velocity
vector. The contribution from the reflected particles can also use the same force
calculating routines. The key is to use the correct direction cosines for the above equation.
Instead of the mass velocity vector, the reflected velocity vector (determined from the
optimization process) can be used.
Assumptions for Reflected Flow
Several basic assumptions were made for the modeling of the reflected flow. The
most severe is that only one interaction of the reflected molecules was considered. If the
reflected particle were to strike the surface and reflect again onto another part of the
configuration, that effect would not be included. The test configuration was designed to
make the possibility statistically insignificant, except for cases near pure diffuse reflection.
However, in purely diffuse reflection, the first interaction with the surface would result in
a particle having a temperature equal to the surface, and no mass velocity relative to the
vehicle. Any further interactions with the surface should not be significant, especially
when the wall temperature is markedly less than the incident temperature.
19
The parametersthat were input to the OA codeto define the flow regimewere
chosento representconditionsin low earthorbit. For thetestcases,thetemperatureratio,
TJT,, was 0.25. The incident speed ratio, S_, was chosen to be 7.5, and a mean free path
of I0,000 units insured the applicability of free molecule flow. A value of 1.1 was chosen
for the ratio of specific heats for the gas, % The OA code requires input of a reference
radius for the calculation of the reference area. The radius used for this investigation was
0.5642, corresponding to the radius of a circle of area 1.0.
The mass velocity vector of the reflected flow was also assumed to stay in the same
plane as that defined by the incident velocity and the normal to the surface, consistent with
the reflection model used. By limiting the freestream velocity to the X,Y plane, the test
is kept symmetrical about the X,Y plane and side force (Cr) , rolling moment (CMR), and
yawing moment (Cur) are all held to 0.0.
Description of Test Configuration
The configuration used to test the multiple reflections code could be called a
concave wedge. The model consists of two square fiat plates, each with unit area, located
at right angles to each other with one edge of the first plate next to one edge of the other
plate. The configuration is defined to be at 0" angle of attack when the bisector of the
angle between the plates" is directed straight into the flow. The origin of the global
coordinate system is at the center of the wedge, located at the intersection of the bisector
and a segment joining the centers of the two fiat plates. The global X coordinate direction
is in the opposite direction of the bisector of the wedge, and the Y coordinate is "up". The

20
Z coordinatedirectioncompletestheright handsystemby beingparallel to thecornerjoint
of the plates. Figure 1 showsthe test configurationand coordinatesystems. Figure 2
showsmoreclearly theway subshapeswere usedto model theconcavewedge.
y X i
g_@ /- ....
//Fig. 1 Global coordinate system and axis
with relation to freestream velocity vector.
\4 \7\ \
\ \..... k- .... -k .....
\5 \8
\6 X
\\
f
L\\ \
i/ // /_
,' //B/ _._V -
7[ I/ 4/II I/
/Ill
Fig. 2 90" wedge test configuration
geometry and local coordinate systems
with subshape and element numberingscheme.
Every surface of the configuration that is exposed to flow must have a subshape
assigned to it. To model the flow over a flat plate with both sides exposed to the flow
requires two rectangular subshapes: one for the top surface and one for the bottom. By
restricting the investigation to a range of angles of attack from 0 ° to 45", some
simplification of the model takes place. Only three subshapes are required, one (plate I)
on the top half of the wedge, and two (plates II and III) on the bottom half. For reasons
discussed later in this report, it was not necessary to continue the range of angle of attack
beyond 45". Although it would be valid to use the concept of this work in angles of attack
greater than 45 °, the present means of application renders the method invalid for that range

21
of angles.
Each subshapeis further divided into area elementsfor calculating force and
moments.TheOrbital Aerodynamics(OA) codecalculatestheincrementalforcest'oreach
elementandsumsthemall to give the final valuesof forceand momentcoefficients. The
values calculatedby the OA code are stored so that the contribution from multiple
reflections may be added to them. The idea is to cycle through all elementsof each
subshapeand determinethe reflectedflow from that point to every otherelementof the
othersubshapes.
Thereareseveralwaysto cut downon thenumberof elementto elementcasesthat
mustbe checked. First, sinceall the subshapesare fiat or convex, it is assumedthat no
reflectedflow from oneelementwill strikeanotherelementon thesamesubshape.Second,
if theelementis receivingno incident flow from the freestream,thenit will not sendany
reflectedflow to othersubshapes.Third, by testingthedot product of the normal vectors
from two elements, it can be determined if it is physically possible for flow to go from the
outer surface of one element to the outer surface of the other. Elements of flat subshapes
can all share the same coordinate system, translated to the center of each element, thereby
cutting down on the number of coordinate system rotations that must be calculated, as in
a cylindrical or conic subshape.
Determination of Reflected Particle Flux Distribution
Since the reflected flow is defined by a direction vector away from the point of
reflection, calculating the effects on a secondary element that does not lie directly on that

22
vectorcouldbeadifficulty. Fortunately,S.Nocilla developeda modelfor there-emission
of moleculesfrom a surfacein free moleculeflow.lg This re-emission law is the key to
the application of multiple reflections to free molecule flow. Nocilla derived what he called
the "intensity" of reflected flow in any direction from the reflective surface. The intensity
is the number flux of particles in an elementary solid angle dfl divided by the total number
flux of particles emitted from an area element:
where:
and it follows that:
]r(_ -N_r _/)
1_ _._exp(-S_)cos O [1 + F(X)]
cosYr = sin0rsinO c°s$ + cos0 cosO
U r = SrCOSO r
X(a) = exp(-a2r) + rlC2a_(1 +erfa)
X r =SrCO_ r
F(X) = X,2 + _r'a(SX, +X_)(1 + erf X)expXr 2
I _c0 dfl = 1fl r
(12)
According to this model, the re-emitted molecules are in Maxwellian equilibrium
with a translational velocity, U, Figure 3 shows the coordinate system for the velocities
and Fig. 4 shows how the intensity could be integrated over a region in space to determine
the particle flux from an elemental area to that region in space. An attraction of the
Nocilla model is its simplicity. However, it is also quite accurate at predicting the
reflected distributions, at least for the particle energies investigated by F. C. Hurlbut,
which were used for comparison by Nocilla. The experimental results were taken from

23
Hurlbut's 1959Randreportdetailingthe projection of nitrogen molecular beams on lithium
fluoride crystals.
Z
_
x
Fig. 3 Geometry used to define elementary
solid angle for integration of Nocilla's
intensity.
Z
U.
&4
Fig. 4 Incident and reflected velocityvectors for a surface area element.
The intensity of the reflected flow was integrated over the area of each secondary
element that might receive reflected flow from the primary element. A simple two
dimensional quadrature integration from a commercially available math subroutine library
was employed. The integration was performed in the azimuthal and elevation directions
of a spherical type coordinate system.
The limits over which the intensity was integrated for each secondary element were
determined by finding the four vectors from the center of the primary element to each of
the comers of the secondary element. By comparing the directions of the comer vectors,
two of the comers were chosen as the limits for the azimuthal integration. The limits for
the elevation integration were then found as functions of the azimuthal location along the
edges of the secondary element.

24
The force and momentroutinesfrom theoriginal Orbital AerodynamicsProgram
could be used for the reflected flow as well as the freestream,with several minor
differences. The correct directional cosineswere calculatedfor the reflected flow and
desiredforce directions. The force coefficientcalculatedby theroutine hadto be further
modifiedby two factors: the intensity,andageometricfactor. The valueof the intensity,
integratedover the region in spaceoccupiedby the secondaryelement,is thefirst factor.
A ratio of the primary to secondaryelementalareas,eachmultiplied by the cosineof the
anglebetweenthe normal vector and the flow direction coming into the element,is the
secondfactor. This geometricfactor accountsfor the difference in crosssectionalarea
eachelementpresentsto the flow.
These calculations produced the incremental force coefficient added by the
consideration of multiply reflected molecules. The resultant incremental forces were stored
and, after all elements were evaluated, were summed with the forces and moments from
the convex results produced by the old code. The output portion of the code was altered
to provide listings of both the convex and concave results.

RESULTS AND DISCUSSION
25
The free molecule flow over the concave wedge was evaluated for a speed ratio of
7.5, and a wall to incident temperature ratio of 0.25. Eight sets of accommodation values
were tested, and results compared to the values calculated without consideration of multiple
reflections. In addition to varying the accommodation values, several different cases were
evaluated with different grid resolutions for the numerical integration.
The traditional limiting cases of specular and diffuse reflection were run with grid
sizes of 2x2, 4x4, and 8x8 for the integration. The original Lockheed Orbital
Aerodynamics Code provides exactly the same answers for all grid sizes when flat
subshapes are used, so there is only one set of data present for the convex cases. The rest
of the accommodation cases only include the values for 8x8 grid spacing.
Results for c_ = 0.0, a, = 0.0, a, = 0.0
There were significant increases in the axial and drag coefficients with specular
reflection that should be noted. Table I contains the output coefficients for the fully
specular case. The axial force coefficient for the specular case increased by an amount in
excess of 2.51 when the vehicle was at an angle of attack (AOA) of 0". This was just over
an 87% increase in the coefficient value from the results without multiple reflections. The
effect of multiple reflections diminished with increasing angle of attack, and the results with
and without multiple reflections converged at the 45" AOA case as shown in Fig. 5.
Figure 6 compares the normal force coefficient for convex and concave results. There is
no difference in results for the 0" AOA case, but there is an 89% increase with multiple
26
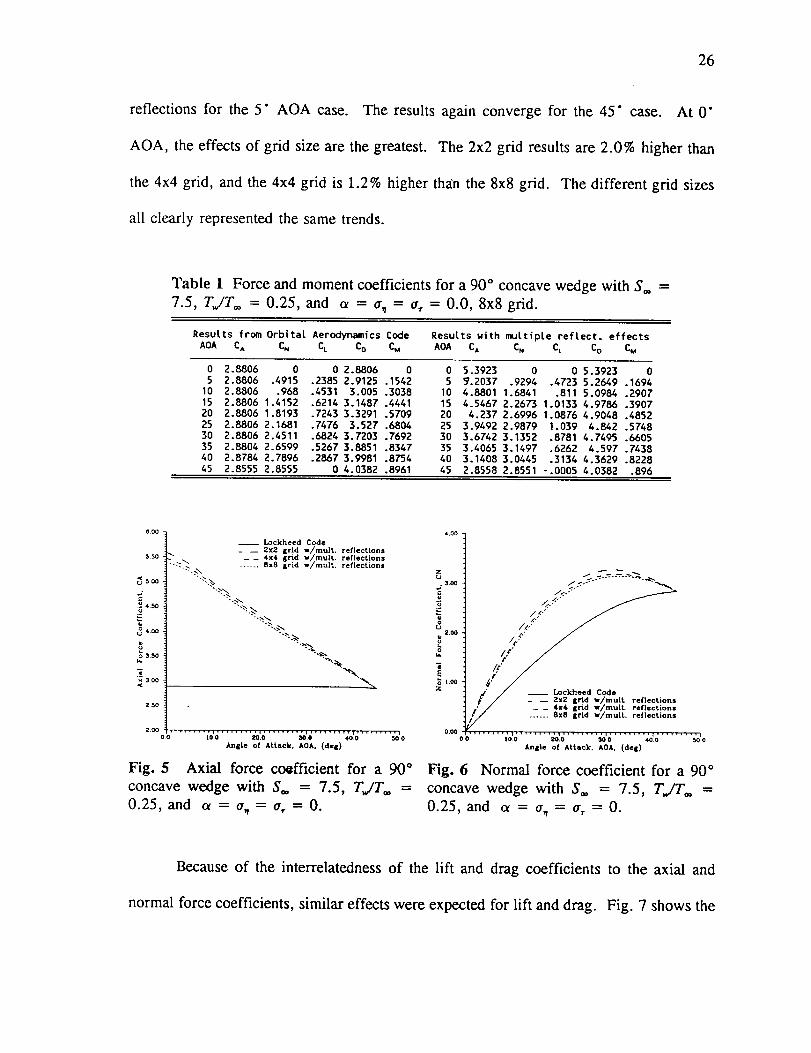
reflectionsfor the 5" AOA case. The resultsagainconvergefor the 45" case. At 0"
AOA, theeffectsof grid sizeare thegreatest. The2x2 grid resultsare2.0% higherthan
the 4x4 grid, andthe4x4 grid is 1.2% higherthanthe 8x8grid. Thedifferent grid sizes
all clearly representedthesametrends.
Table 1 Forceandmomentcoefficientsfor a 90° concave wedge with So. =
7.5, TffTo. = 0.25, and oe = a,_ = a,. = 0.0, 8x8 grid.
Resutts from Orbitat Aerodynamics Code Resutts with muLtipLe reftect, effects
AOA CA CN CL CO CM AOA CA CN Ct CO CM
0 2.8806 0 0 2.8806 0
5 2.8806 .4915 .2385 2.9125 .1542
10 2.8806 .968 .4531 3.005 .3038
15 2.8806 1.4152 .6214 3.1487 .4441
20 2.8806 1.8193 .7243 3.3291 .5709
25 2.8806 2.1681 .7476 3.527 .6804
30 2.8806 2.4511 .6824 3.7203 .7692
35 2.8804 2.6599 .5267 3.8851 .8347
40 2.8784 2.7896 .2867 3.9981 .8754
45 2.8555 2.8555 0 4.0382 .8961
0 5.3923 0 0 5.3923 0
5 _.2037 .9294 .4723 5.2649 .1694
10 4.8801 1.6841 .811 5.0984 .2907
15 4.5467 2.2673 1.0133 4.9786 .3907
20 4.237 2.6996 1.0876 4.9048 .4852
25 3.9492 2.9879 1.039 4.842 .5748
30 3.6742 3.1352 .8781 4.7495 .6605
35 3,4065 3.1497 .6262 4.597 .7438
40 3.1408 3.0445 .3134 4.3629 .8228
45 2.8558 2.8551 -.0005 4.0382 .896
$.50
5OO
_ 450 •
_ 400 •
3_
3.00
Z_
__ Lockheed Code
_ -- 2x2 £rfd w/muir, reflections_" 4x4 grid w/muir, reflections
_'.>_" 8x8 Erid w/muir, reflection="'_.._\
"'_,_
"'_,_.
"'_.._,
"..',.._
"-_.%
2.O0 00 ................... LOIO , ,,I ..... I ......... I ......... I• _0.0 _0,0 40.0 500
J_rIRle ot Attack. AOA. (deE)
Fig. 5 Axial force coefficient for a 90 °
concave wedge with So. = 7.5, TJT00 =
0.25, and c_ = a,,= a,. = 0.
. 3.00
d2.00
EI.O0
Z
_.._ ..... _..._
/.P"
/['
i/j / Lockheed Code
# / - _ 2=Z _rid '=,/muir. reflections.'r f _d w/muir, reflections
_d w/mulL reflections
o.0o ..............00 I0!0 .... zo.01.................. 30=0 *.00_......... 5010
JIJaEle of Attack. AOA. (deE)
Fig. 6 Normal force coefficient for a 90 °
concave wedge with S® = 7.5, TiT® =
0.25, and c_ = (r_ = o', = 0.
Because of the interrelatedness of the lift and drag coefficients to the axial and
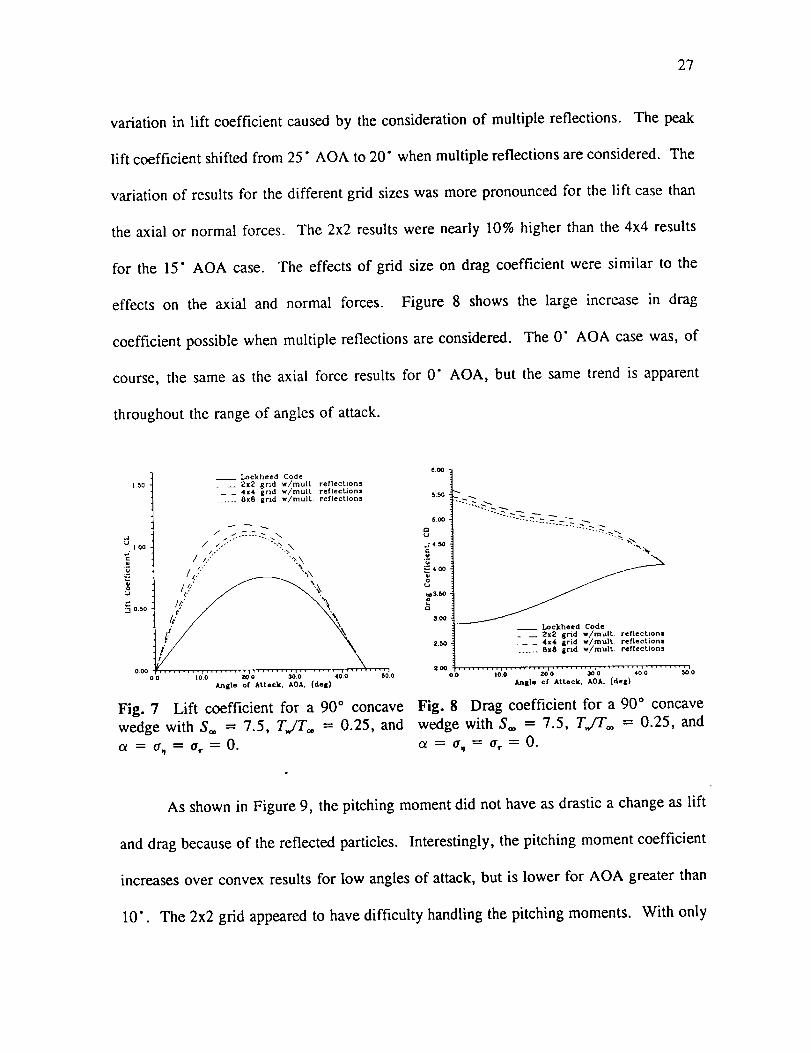
normal force coefficients, similar effects were expected for lift and drag. Fig. 7 shows the
27
variation in lift coefficientcausedby theconsiderationof multiple reflections. The peak
lift coefficientshiftedfrom 25" AOA to 20" whenmultiplereflectionsareconsidered.The
variationof resultsfor thedifferentgrid sizeswasmorepronouncedfor the lift casethan
theaxial or normal forces. The 2x2 resultswere nearly 10% higherthan the 4x4 results
for the 15" AOA case. The effectsof grid sizeon drag coefficient were similar to the
effects on the axial and normal forces. Figure 8 shows the large increase in drag
coefficient possiblewhenmultiple reflectionsareconsidered. The 0" AOA casewas, of
course, the sameas the axial force results for 0" AOA, but the same trend is apparent
throughout the range of angles of attack.
__ Lockheed Code
i.50 _ __ 2x2 grid w/muir reflections4x4 grid w/mulL reflections
8x8 grid w/muir, reflections
d =0o / -'-'" "'-"\
/ ,,.,, -,,,.,\o / ,,'.,E. /,' "'_\
o
oo ; .......£o'_......._o'd..........Angle of Attack, AOA, (deg)
Fig. 7 Lift coefficient for a 90 ° concave
wedge with S= = 7.5, T_/T= = 0.25, and
Ot ---- or_ = ff_ = 0.
5.OO
8 .......--'""-------Z.._.._"-.4.50 ""__"_
u= 3.50
3.00 ___ Lockheed Code
2x2 grid w_mulL reflections2.50 _ _ 4x4 grid w/muir reflections
...... 8z8 grid w/muir, reflections
0,0 lO.O 200 300 40 0
Angle of Attack, AOA. (deg)
Fig. 8 Drag coefficient for a 90 ° concave
wedge with So, = 7.5, TJT_ = 0.25, and
ct = or,_ = Or ---- O.
As shown in Figure 9, the pitching moment did not have as drastic a change as lift
and drag because of the reflected particles. Interestingly, the pitching moment coefficient
increases over convex results for low angles of attack, but is lower for AOA greater than
10". The 2x2 grid appeared to have difficulty handling the pitching moments. With only

28
two distinct momentarms for this calculationand all the forces applied at those two
distanceswith a 2x2 grid, it is not really surprisingtheresultsweren't smooth.
.d.,.I.,"
U
,,//_00.40 /
/
"':'-- Lockheed Code_0.20 / //
/___'e fleetionl- _d w/rnult_eflecLion_
_ii;c[iT, X;
0.00 ................................
oo _o!o 2o'.0 :_o'.,_' ' ' ,o'o ....... :_o'oAngle of Atlsck, AOA. (deg)
Fig. 9 Pitching moment coefficient for a
90 ° concave wedge with So. = 7.5, TJT_
= 0.25, and ol = (r = crr = 0.
Results for o_ = 1.0, o, = 1.0, or = 1.0
The output values of force and moment coefficients for fully diffuse reflection are
shown in Table 2. The axial and normal force coefficients, shown in Figs. 10 and i 1,
Table 2 Force and moment coefficients for a 90 ° concave wedge with S** =
7.5, TJT** = 0.25, and ot = a_ = a,. = 1.0, 8x8 grid.
Results frown Orbital Aerodynamics Code Results with multiple reflect, effects
AOA CA CN Cc CO CM A0A CA CN Ct Co CM
0 2.9737 0 0 2.9737 0
5 2.9518 .256 -.0022 2.9629 .0804
10 2.8866 .5045 -.0044 2.9303 .1583
15 2.7801 .7382 -.0065 2.8764 .2317
20 2.6355 .9501 -.0086 2.8015 .2982
25 2.4571 1.1341 -.0106 2.7062 .3559
30 2.2504 1.2848 -.0125 2.5913 .4031
35 2.0229 1.3993 -.014 2.4597 .4381
40 1.789 1.4828 -.0141 2.3236 .4573
45 1.6178 1.6178 0 2.2879 .4409
0 2.9597 0 0 2.9597 0
5 2.9378 .2557 -.0013 2.949 .0804
10 2.8729 .5037 -.0028 2.9167 .1585
15 2.7667 .7368 -.0043 2.8632 .232
20 2.6226 .9481 -.0061 2.7887 .2987
25 2.4449 1.1311 -.0081 2.6938 .3566
30 2.239 1.2806 -.0105 2.5793 .4041
35 2.0126 1.3935 -.0129 2.4479 .4395
40 1.7802 1.4749 -.0144 2.3118 .4592
45 1.6106 1.6075 -.0022 2.2756 .4432
29
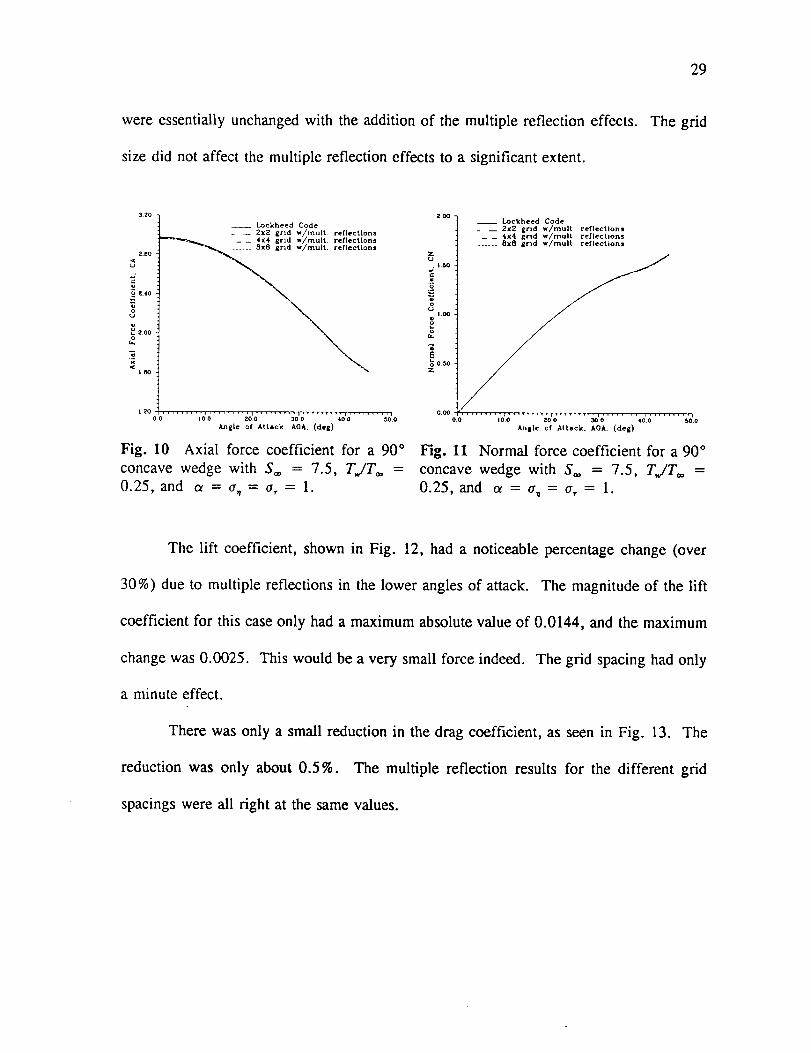
were essentially unchanged with the addition of the multiple reflection effects.
size did not affect the multiple reflection effects to a significant extent.
The grid
2.eL0
Z.4o
_2.00
__ Lockheed Code
2x2 grid w//mult, reflections
_ 4x4 grid w/mulL, reflections
8x8 grid w//mult, reflections
12000 .....................................,o'o zo_o 3o'0 ....;o'._'' _o'oAngLe of Atlack, AOA, (deg)
Fig. 10 Axial force coefficient for a 90 °
concave wedge with S_. = 7.5, T,,/T_. =
0.25, and a = or, = o-, = 1.
__ Lockheed Code
_ __ 2x2 grid w/mult, reflections
4x4 grid w_mult, reflections8x8 grid w/mull reflections
• | .60
P
M
Z
I0_0 ZO'O ' ' 'ao_d 4oq.o _o
Angle of Attack. AOA. (deg)
Fig. 11 Normal force coefficient for a 90 °
concave wedge with So, = 7.5, TJT_ =
0.25, and o_ = tr,_ = a, = 1.
The lift coefficient, shown in Fig. 12, had a noticeable percentage change (over
30%) due to multiple reflections in the lower angles of attack. The magnitude of the lift
coefficient for this case only had a maximum absolute value of 0.0144, and the maximum
change was 0.0025. This would be a very small force indeed. The grid spacing had only
a minute effect.
There was only a small reduction in the drag coefficient, as seen in Fig. 13. The
reduction was only about 0.5%. The multiple reflection results for the different grid
spacings were all right at the same values.

30
0,000
o -OOlO
-- Lockheed Code
- -- 2x2 grid w/mulL, reflections4x4 grid w/mulL reflections
8x8 grid w/mulL reflections
-0020 ...................... 1
Angle of Attack. AOA. (dell)
Fig. 12 Lift coefficient for a 90 ° concave
wedge with So. = 7.5, TJT_ = 0.25, and
_=a_=_,= 1.
Z80
°
Z80
2.40
__ Lockheed Code
- -- 2x2 £rld w/mult, reflections4x4 grid w//mult, reflections
8x8 £rid w/muir, reflections
z,OOoo ......... i .................,oo ..... /o'8 ....... ;o';'" ,olo so0Anl[le of Attack. AOA. (deg)
Fig. 13 Drag coefficient for a 90 ° concave
wedge with So. = 7.5, TiT® = 0.25, and
c_ = a_ = a, = 1.
Figure 14 shows the nearly identical plots of pitching moment for the convex and
concave cases. The magnitude of the difference is a maximum of 0.001.
050 -
_0,40
0.30
_0.20
_. o.to / - .-- 2x2 l_rld w/muir, reflections
...... , " , • •
0oooo........ 10'_....... io'; .............................30.0 40.0 50.0
Angle of Att.e.ck. AOA. (dell)
Fig. 14 Pitching moment coefficient for a
90" concave wedge with S® = 7.5, TJT_.
=0.25, and ot = e_ = a,= 1.

31
Results for _ = 0.9, a, = 1.0, a, = 1.0
Values for the force and moment coefficients for full momentum accommodation
and energy accommodation of 0.9 can be found in Table 3. Figures 15 and 16 display the
axial and normal force coefficients for this case. The alteration of the energy
accommodation resulted in virtually no change from the fully diffuse case.
Table 3 Force and moment coefficients for a 90 ° concave wedge with So* =
7.5, TJTo. = 0.25, and o+ = 0.9, tr, = a, = 1.0, 8x8 grid.
ResuLts from Orbital Aerodynamics Code Results with multiple reflect, effectsA0A CA CN Ct CO CM AOA CA CN CL CO CM
0 2.9737 0 0 2.9737 0 0 2.9646
5 2.9518 .256 -.0022 2.9629 .0804 5 2.942710 2.8866 .5045 -.0044 2.9303 .1583 10 2.8776
15 2.7801 .7382 -.0065 2.8764 .2317 15 2.771220 2.6355 .9501 -.0086 2.8015 .2982 20 2.626725 2.4571 1.1341 -.0106 2.7062 .3559 25 2.4486
30 2.2504 1.2848 -.0125 2.5913 .4031 30 2.2423
35 2.0229 1.3993 -.014 2.4597 .4381 35 2.0155
40 1.789 1.4828 -.0141 2.3236 .4573 40 1.7829
45 1.6178 1.6178 0 2.2879 .4409 45 1.6133
0 0 2.9646 0
•256 -.0015 2.9538 .0804
•5044 -.0029 2.9214 .1584
.T38 -.0044 2.8677 .2317
.9497 -.006 2.7931 .2983
1.1333 -.0077 2.6981 .3561
1.2834 -.0097 2.5836 .4035
1.3968 -.0119 2.4522 .4386
1.4786 -.0133 2.3162 .4583
1.6113 -o0014 2.2801 .4423
Lockheed Code
28o
2'00
II
1.20 ........ i ......... , ................ Io.o' ,oo .... _o'._.... _',0 ,o'.o _o
Angle of Attack, AOA. (dei)
Fig. 15 Axial force coefficient for a 90 °
concave wedge with S® = 7.5, TJT= =
0.25, and _ =0.9, a+= _,= 1.0.
.+
tj 1.00tl
o=,.o
l=E
-- -- 8=8 gn'd w/mulL reflections
0+0o ''',, .................... v .................. ioo" ' tO+.O 20'0 300 40'o 50+0
Anlle of Attack. AOA. (deE)
Fig. 16 Normal force coefficient for a 90 °
concave wedge with S® = 7.5, TJTO* =
0.25, and ot = 0.9,<r_ = tr, = 1.0.
Figure 17 shows the lift coefficient on the concave and convex wedges for angles

32
of attackfrom 0° to 45". The resultswith multiple reflectionswere slightly less thanfor
the fully diffusecase. The concaveresultswere up to 30% less(in absolutevalue) than
the convexresults. For AOA from 40" to 45", the concavelift coefficient wasstill less
than theconvexcase,wherethefully diffuse lift coefficientwasslightly greaterthan the
convexcase. The magnitudeof thechangeand the actualvalue of lift coefficientswere
very small, as in thediffusecase. The dragcoefficientresults,shownin Fig 18,werenot
changedsignificantly from the diffuse caseof Fig. 13 for either convex or concave.
Changeswere lessthan0.5%.
._ -o ooe
_, -0012
__ Lockheed Code
_ _ 8x_l I_rtd w/muir reflections
-oozo ......................................oo ,olo zo'o" ':;*'d ' ' ,0'0 _o'oAngle ot Attack. AOA. (dej)
Fig. 17 Lift force coefficient for a 90 °
concave wedge with S_ = 7.5, TJT_ =
0.25, and. _ = 0.9, _, = e, = 1.0.
Z80
8
2.6¢
o
C._2.40
2.20
-- Lockheed Code
- _ Bx8 ir_d w/mult, reflections
_.oo ............oo "' '1'0'_ '_ol_...... _o'_................._*.o _o'0
Anllle ot Attack, AOA, (del)
Fig. 18 Drag force coefficient for a 90 °
concave wedge with S_ = 7.5, TJT® =
0.25, and _ = 0.9, a_ = a,= 1.0.
Figure 19 shows, the pitching moment coefficient results for the wedge. The
concave and convex results were indistinguishable from each other, and from the diffuse
case.

33
_t
c__o.4o
C,
_ 030
_o.2o
_o.Lo
_ _ 8x8 grid w/mulL reflectlons
Angle of Attack. AOA. (dell)
Fig. 19 Pitching moment coefficient for a
90 ° concave wedge with S_o = 7.5, T,,,/To.
= 0.25, and a = 0.9, cr_ = cr, = 1.0.
Results for c_ = 0.9, a, = 0.9, cr = 0.9
The results for the case with all accommodation equal to 0.9 are contained in Table
4. As shown in Fig. 20, the convex axial force coefficient results were nearly the same
as the diffuse case. However, there was a more significant change in the concave results
for this accommodation case. The axial force at 0" angle of attack was reduced from 2.96
to 2.88, a 2.7% change. The normal force also changed with the addition of multiple
reflections. Figure 21 shows, for instance, the increase in normal force coefficient from
1.23 to 1.33 for 25" AOA. This is about a 7.7% increase in the coefficient.
Figure 22 shows the change in lift coefficient due to the consideration of multiple
reflections. When all accommodation values were 0.9, there was a positive lift force,
unlike the diffuse case. The lift was still small in magnitude, 0.065 at 25" AOA for the
convex case. The increase in lift coefficient due to multiple reflections was 0.11 at 25"
AOA, so the percentage increases were very large. At 40" AOA, the multiple reflection

34
lift coefficient was 251% greater than the convex result.
Table 4 Force and moment coefficients for a 90 ° concave wedge with So. =
7.5, TJTo. = 0.25, and c_ = tr, = tr, = 0.9, 8x8 grid.
Resutts from Orbitat Aerodynamics Code Resutts with multiple reftect, effects
AOA CA CN Ct Co CM AOA CA CN CL Co CM
0 2.9644 0 0 2.9644 0 0 2.8846 0
5 2.9447 .2796 .0219 2.9578 .0877 5 2.8658 3077
10 2.886 .5509 .0414 2.9378 .1729 10 2.8095 .6048
15 2.7901 .8059 .0563 2.9037 .2529 15 2.7176 .8812
20 2.66 1.037 .0647 2.8543 .]254 20 2.593] 1.1269
25 2.4995 1.2375 .0652 2.788] .388] 25 2.4406 1.3331
30 2.3134 1.4014 .057 2.7042 .4397 30 2.2652 1.4896
35 2.1086 1.5254 .0401 2.6022 .4778 35 2.0734 1.5933
40 1.898 1.6135 .016 2.491 .4991 40 1.87/8 1.6491
45 1.7416 1.7416 0 2.4629 .4864 45 1.7377 1.7357 -
0 2.8846 0
.0567 2.8817 .0852
.1077 2.8718 .1681
.1478 2.853 .2463
.1719 2.8223 .3175
.1768 2.7753 .3798
.1575 2.7066 .4319
• 1159 2.6123 .472• 0562 2.4985 .4966• 0014 2.456 .4876
The drag coefficient for the wedge in flee molecule flow is shown in Fig. 23. The
convex results were similar to the diffuse case, but the concave results were reduced by
0.08 at 0" AOA (2.7% change).
2.80
¢
z4o
u
1.60
-- Lockheed Code
I._ ........ i ......... v ......... r ......... i ......... ,o.o' I0.0 20.0 30.0 40.0 50.0
An£1e of Attack.'AOA. (dell)
Fig. 20 Axial force coefficient for a 90 °
concave wedge with So. = 7.5, TJT_ =
0.25, and _ = _,= a,=0.9.
. 1.60
il,OO ///////
g.
_ z////_ o._
_ - 8x8 grid w/mulL reflections
0.0o ......... i ......... i ......... i ......... t .....O.O 10.0 20.0 30.0 40.0 ' ' "5'O10
Anllle of Attack, AOA. (dell)
Fig. 21 Normal force coefficient for a 90 °
concave wedge with So. = 7.5, TJT_ =
0.25, and ot = a_ = a, = 0.9.

35
t_ 010
"_ -ooo"l
-o o_
/ \/ \
//// \\\
/ \
// \\
__ Lockheed Code
_ _ 8x8 grid w/muir, reflections
-Olo ..........................oo ,o'o ' "_o'6 "'_0'.6 ..... ,o'o '"_o'.oAngle of kttmck. AOA. (deE)
Fig. 22 Lift force coefficient for a 90 °
concave wedge with S_. = 7.5, TJT** =
0.25, and ol = tr, = a, = 0.9.
2,80
Co 2.?U
o 260
t3 2.50
__ Lockheed Code
_ _ 8x8 grid w/mulL, reflections
2.30 ......... i ......... i ......... ! ............. io.o ,oo 200 _*.o " '_o'._ _.oAngle of Attack, AOA. (deg)
Fig. 23 Drag force coefficient for a 90 °
concave wedge with S® = 7.5, T,fT® =
0.25, and c_ = a, = tr, = 0.9.
Figure 24 shows the concave and convex pitching moment coefficients. The
concave results were just distinguishable from the convex results for angles of attack from
10" to 40". There was a reduction of up to 0.008 (about 2%) in that range.
0.,50
U. 0.40
0.30
_O.ZO
g0.10
__ 8x8 grid w/mutt, reflections
o.oo ......... i ......... m ......... t ......... , ......... m0.0 tO.O 20,0 300 40 0 SO,O
Angle of Att4ck. AOA. (deg)
Fig. 24 Pitching moment coefficient for a
90* concave wedge with S._ = 7.5, T.,/T_
= 0.25, and c_ = tr_ = _, = 0.9.

36
Results for _ = 0.7, _, = 0.6, _, = 0.6
For the test case with energy accommodation of 0.7 and both tangential and normal
momentum accommodation of 0.6 the calculated force and moment coefficients for convex
and concave wedges are displayed in Table 5. Figure 25 shows the results for the axial
force coefficient. The addition of reflected particles increased the axial force from 7% to
10% over most of the range of angles of attack, with the greatest physical change, 0.25
(8.9%), at 15" AOA. The greatest change in normal force coefficient was 0.53 (41%
increase) at 20" AOA, as shown in Fig. 26. The normal force coefficient with multiple
reflections has a more pronounced maximum point at 35 ", while the convex coefficient has
no internal maximum in the range of angles of attack from 0" to 45".
Table 5 Force and moment coefficients for a 90" concave wedge with S_. =
7.5, TiTs. = 0.25, and c_ = 0.7, o',_ = a,. = 0.6, 8x8 grid.
Results from Orbital Aerodynamics Code Results with multiple reflect, effects
AOA CA CN CL Co CM AOA CA CN Ct Co CM
0 2.9365 0 0 2.9365 0 0 3.1581 0 0 3.1581 0
5 2.9233 .3502 .0941 2.9427 .I099 5 3.1509 .5686 .2918 3.1885 .1359
10 2.8842 .6899 .1786 2.9602 .2165 10 3.1261 1.0839 .5246 3.2668 .2636
15 2.8203 1.009 .2446 2.9853 .3166 15 3.0716 1.5085 .6621 3.3574 .3747
20 2.7336 1.2978 .2846 3.0126 .4073 20 2.9799 1.8272 .6978 3.4252 .466
25 2.6265 1.5477 .2927 3.0345 .4857 25 2.8526 2.0472 .6498 3.4505 .5372
30 2.5025 1.7513 .2655 3.0429 .5496 30 2.6907 2.1686 .5327 3.4145 .59
35 2.3659 1.9035 .202] 3.0298 .5968 35 2.5015 2.202 .369 3.3121 .6241
.40 2.2248 2.0055 .1062 2.9934 .6246 40 2.2961 2.1608 .1794 3.1478 .6382
45 2.1129 2.1129 0 2.988 .623 45 2.1116 2.1103 -.0009 2.9853 .6233

37
320
300
280
_2eo
c_
240
_" 2.20
200 __ Lockheed Code
_ _ BxB grid. w/mult, reflections
Angle of Attack. AOA. (deg)
Fig. 25 Axial force coefficient for a 90 °
concave wedge with So, = 7.5, T,,/To, =
0.25, and c_ = 0.7, cr, = or, = 0.6.
2 _0
/
G i.so //
_,1 //
< o_,o / ckheed Code
___ 8X8 grid i/mull, reflection,
0,00 • • , i ......... ,0.0 lO 0 2010 _.0 40 0 _0 O
Angle of Attack. AOA. (deg)
Fig. 26 Normal force coefficient for a 90 °
concave wedge with S_ = 7.5, TJTO* =
0.25, and ot = 0.7, cr, = or, = 0.6.
Figure 27 shows the lift coefficient for the test configuration for angles of attack
from 0" to 45". The increases in the lift coefficient with the addition of multiple
reflections were in the range of 0.3 to 0.4 over most of the angles of attack. The changes
were large in terms of percentage (100% to 200%) because of the low values of lift
coefficient for the convex case. Figure 28 shows the changes in the drag coefficient due
to the addition of multiple reflections. The magnitude of the changes was similar to the
changes in lift coefficient, but because of the large values of convex wedge drag
coefficient; the percentage change was less than 14%. The character of the drag coefficient
was somewhat different for this accommodation case. The drag coefficient for the more
diffuse accommodation cases was a maximum at 0" AOA and decreased regularly for
higher angles of attack. For this case, the drag coefficient increased for angles of attack
greater than 0" up to 30" and then decreased slightly. The coefficient with concave effects
followed this pattern, but had a much greater decrease from 30" to 45" AOA.

38
o ooo / _,
/ ..,/ \
/ \
_j o¸4oo / ,
_ / \
/ \
_ o_2oo / \
-ooooJ
-02oo__ Lockheed Code
-- - 8x8 grid w/mult reflections
-0400 .........oo' 1o'_...... io'; .............................300 400 50 0
Angle of Attack, AOA, (del)
Fig. 27 Lift force coefficient for a 90 °
concave wedge with So. = 7.5, T,,/To. =
0.25, and _ = 0.7, a,= a,=0.6.
3.50
3.40
0,30
_" 3.20
0 3.10
t:_ 3DO
290
// \
/ \
/ \
/ \/
/ \/ \
/
\
\
J
-- Lockheed Code
- - 8x8 £r_d w/rnult., reflections
2.80 ....................o o " 'to'o 2o'0 ' ' " ' ......... ' .........300 40,0 50.0
Angle of Attack. AOA, (dell)
Fig. 28 Drag force coefficient for a 90 °
concave wedge with So, = 7.5, T,,/To. =
0.25, and ot = 0.7, a,, = <r,. = 0.6.
The increase in pitching moment due to the consideration of concave surface effects
is evident in Fig. 29. Changes found in the pitching moment were fairly small, on the
order of 0.05, with the largest absolute increase at 20" AOA. The increase at 20" was
0.059 or 14.4%.
0,BO
o=_" 0.OOI/
g,
0.40
o._ / //
__ Lockheed Code
- _ 8x8 grid w/muir, reflections
0.0o ......... , .................... i .........oo 1.o 'i0'.; .... 3o'o 400 so'.0Ani_.le of Attack. AOA. (de_)
Fig. 29 Pitching moment coefficient for a
90 ° concave wedge with So. = 7.5, TJTo.
= 0.25, and ot = 0.7, tr_ = tr, = 0.6.

39
Results for t_ = 0.5, o, = 0.4, o, = 0.4
The case with energy accommodation of 0.5 and momentum accommodation of 0.4
followed the same trends as the cases discussed above. The results are presented in Table
6. The force coefficient in the axial direction for angles of attack from 0" to 45" is shown
in Fig. 30. The increase in axial force coefficient at 0" was 0.80, or about 27.7%. The
27.7% increase was nearly four times the increase found in the _ = 0.7 case. The convex
and concave results converged at 45" AOA, as before. Figure 31 shows the coefficient for
the normal force on the wedge. The maximum change in normal force was a 0.69 increase
at 20". The increases at lower angle of attack were higher percentage changes, up to 83 %,
but 0.69 was the greatest physical change.
Table 6 Force and moment coefficients for a 90 ° concave wedge with So. =
7.5, T,,/T_ = 0.25, and ot = 0.5, aT = a, = 0.4, 8x8 grid.
Results from Orbital Aerodynamics Code Results with multiple reflect, effectsAOA CA CN Ct CO CM AOA CA CN Ct Co CM
0 2.9179 0 0 2.9179 0 0 3.7256 0 0 3.7256 0
5 2.9091 .3973 .1422 2.9326 .1247 5 3.7078 .7282 .4023 3.7571 .1828
10 2.883 .7826 .2701 2.9751 .2456 10 3.6549 1.3426 .6875 3.8325 .3377
15 2.8404 1.1444 .3702 3.0398 .3591 15 3.5544 1.8141 .8323 3.9028 .4564
20 2.7826 1.4716 .4312 3.1181 .4618 20 3.4141 2.1573 .8596 3.946 .546
25 2.7112 1.7545 .4443 3.1987 .5506 25 3.242 2.3856 .7919 3.9465 .6134
30 2.6285 1.9846 .4044 3.2687 .6228 30 3.0433 2.506 .6486 3.8885 .6635
35 2.5374 2.1557 .3104 3.3149 .6761 35 2.8233 2.5267 .4503 3.762 .6986
40 2.4427 2.2668 .1664 3.3283 .7082 40 2.5893 2.4596 .2198 3.5645 .7176
45 2.3604 2.3604 0 3.3381 .714 45 2.36 2.3589 -.0007 3.3368 .7141

40
380
_320
0 2.BO
0 24O
\
2.00 _ Lockheed Code
I _ _ 5_8 grid w/mult, reflections
1.80 .............. , ......... , ......... , ......... ,O0 I0.0 ZO.O 300 400 50.0
Angle of Attack, AOA. (deg)
Fig. 30 Axial force coefficient for a 90 °
concave wedge with So, = 7.5, TJTo, =
0.25, and _ = 0.5, a, = (r, = 0.4.
• ///////
_ 1.50
t,
0 /////
"_ t.oo
;¢ /
0.50 /// _ _ 8x8 grid w/mult, reflections
7.0.00 0 0 ......... I .... i ..........,oo..... 20o .... ;o'_"" °o'0....... ;o'o
Angle of Attack. AOA, (de E)
Fig. 31 Normal force coefficient for a 90 °
concave wedge with So, = 7.5, TJTo, =
0.25, and <x = 0.5,(r,_= a, = 0.4.
The changes in the coefficient of lift are shown in Fig. 32. The addition of multiple
reflections acted to increase the lift coefficient, and move the point of maximum lift from
25" AOA without multiple reflections to around 20" with multiple reflections. The
coefficient was increased a maximum of 0.46 at 15" AOA (124%). There was a 183%
increase in lift at 5" AOA.
0.60
d,0.40
020
"1 -0 O0
¢ x/ \
/ \
1111 \x\\\
__ Lockheed Code
_ _ 8x8 grid w/mulL, reflections
-O.4O ....................................0=O 'OFO I_l; 1 '_'0 ,O'4O '_1 0
Angle of Attack. AOA, (deg)
Fig. 32 Lift force coefficient for a 90 °
concave wedge with So, = 7.5, T,/T® =
0.25, and a = 0.5,<r_ = o', = 0.4.
4.00
/ x
\
\
\
\
\\
2SO __ Lockheed Code
_ _ 6x8 grid w/muir, reflections
oo 1o'.o 2dO 3O0 4dO r_-_-_ 0
Angle of Attack, AOA. (deg)
3.00
.J
._ 3.40u
u
3.20
L.i= 300
Fig. 33 Drag force coefficient for a 90 °
concave wedge with So, = 7.5, T,/T** =
0.25, and a = 0.5, o, = a, = 0.4.

41
The drag force andpitching momentcoefficientresultsare shownin Figs. 33and
34. Thepoint of maximumincreasesin drag andpitchingmomentwereat 15" AOA. The
dragcoefficientincreaseda maximumof 0.863(28%)andthemomentcoefficientincreased
a maximumof 0.097, or 27%, due to theconcaveeffects.
_" o.so
__oF.
"_ 0.40
Eo
0,20
iiiii I II I/ _ Lockheed Code
/ ' _ - 8xB grid w/mult, reflections
o.0o ...........................
Angle of Attack. AOA. (deg)
Fig. 34 Pitching moment coefficient for a90 ° concave wedge with So. = 7.5, T/T**
= 0.25, and ol = 0.5, a_ = a_ = 0.4.
Results for _ = 0.3, a, = 0.2, a, = 0.2
Data from calculations of force and moment coefficients for energy accommodation
of 0.3 and momentum accommodation of 0.2 is presented in Table 7. The results for axial
force and normal force coefficients are shown in Figs. 35 and 36. The axial force
coefficient increased by 1,72 with the addition of multiple reflections for an AOA of 0".
That was a 59% increase.
The normal force coefficient increased about 48% to 2.44 at a 20" angle of attack.
There was significant change in the normal coefficient over the whole range of tested
angles of attack.
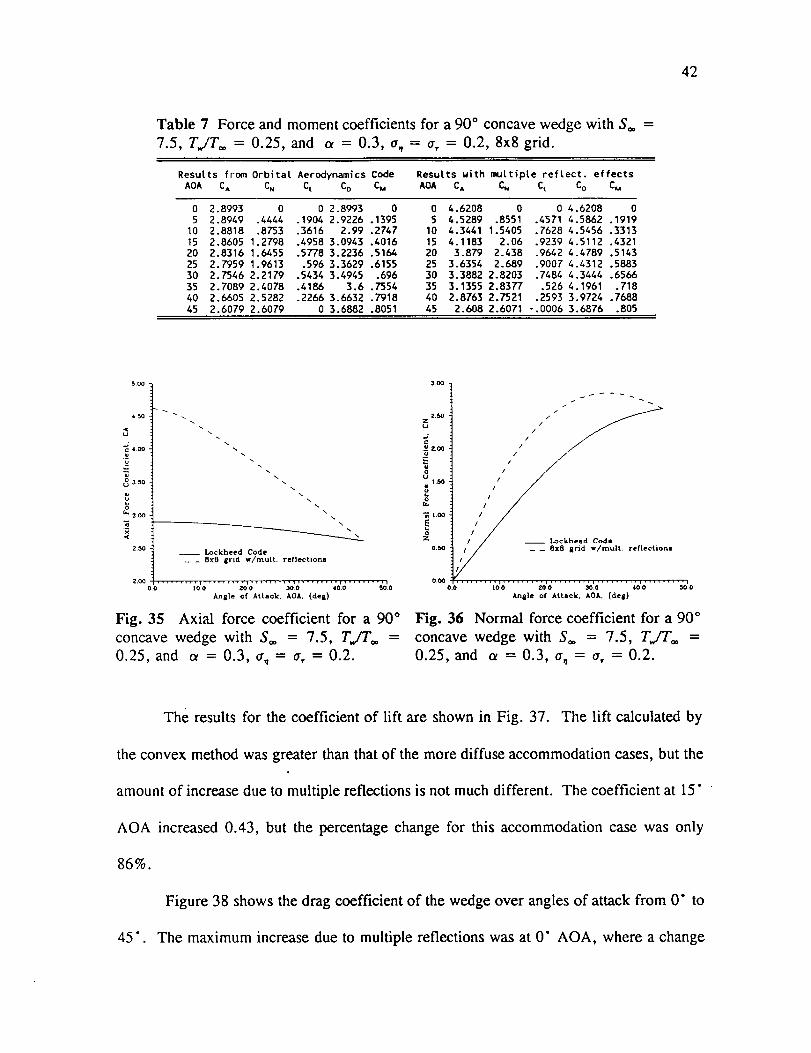
42
Table 7 Forceandmomentcoefficientsfor a90° concave wedge with So0 =
7.5, T,,/TO0 = 0.25, and a = 0.3, tr, = a, = 0.2, 8x8 grid.
Resutts from Orbitat Aerodynamics Code Resutts with muttipte reftect, effects
AOA CA CN C L C O CM AOA CA CN CL Co CM
0 2.8993 0 0 2.8993 0 0 4.6206 0
5 2.8949 .4444 .1904 2.9226 .1395 5 4.5289 .8551
10 2.8818 .8753 .3616 2.99 .2747 10 4.3441 1.5405
15 2.8605 1.2798 .4958 3.0943 .4016 15 4.1183 2.06
20 2.8316 1.6455 .5778 3.2236 .5164 20 3.879 2.438
25 2.7959 1.9613 .596 3.3629 .6155 25 3.6354 2.689
30 2.7546 2.2179 .5434 3.4945 .696 30 3.3882 2.6203
35 2.7089 2.4078 .4186 3.6 .7554 35 3.1355 2.8377
40 2.6605 2.5282 .2266 3.6632 .7918 40 2.8763 2.7521
45 2.6079 2.6079 0 3.6882 .8051 45
0 4.6208 0
.4571 4.5862 .1919
.7628 4.5456 .3313
.9239 4.5112 .4321
.9642 4.4789 .5143
.9007 4.4312 .5883
.7484 4.3444 .6566
.526 4.1961 .718
.2593 3.9724 .7688
2.608 2.6071 -.0006 3.6876 .805
4_
4.00
"dO 350
r_ 300\
\
\
__ I_ckheed Code
_ -- 8x6 grid w/muir, reflections
2.o0 ..................................... ioo ,o'o .....zoo _'d" 40'.0 300
Angle of Attack, AOA. (deE)
Fig. 35 Axial force coefficient for a 90 °
concave wedge with S® = 7.5, T,,/T_. =
0.25, and a = 0.3, try= a, =0.2.
3O0
_ Z.o0 //
1.o0
2: / ckheed Code
0._ ii / - _ 8x8 grid w/mult, reflections
/ooo ......... i ......... , ......... _ ......... , ......... i
0.0 tO0 zoO 300 40.0 300
Andile of Attack, AQA. (dell)
Fig. 36 Normal force coefficient for a 90 °
concave wedge with SO0 = 7.5, TJT® =
0.25, and ot = 0.3, tr_ = tr, = 0.2.
The results for the coefficient of lift are shown in Fig. 37. The lift calculated by
the convex method was greater than that of the more diffuse accommodation cases, but the
amount of increase due to multiple reflections is not much different. The coefficient at 15"
AOA increased 0.43, but the percentage change for this accommodation case was only
86%.
Figure 38 shows the drag coefficient of the wedge over angles of attack from 0 ° to
45 ° . The maximum increase due to multiple reflections was at 0" AOA, where a change

43
of 1.72 (59%) waspresent. The shapeof the lift and dragplots for this accommodation
wascomparableto the specularcase.
IOO-
OBO ///// "\x\\
060 /_
/ \
ii \,
0 _0
-ooo i
-020-.: __ Lockheed Code_ _ 8x8 grid w/muJt, reflectlons
-040oo ....... ,'o*_....................................._o 3oo 4oo _o'o
Angle ol Attack. AOA. (deg)
Fig. 37 Lift force coefficient for a 90 °
concave wedge with S** = 7.5, TJT** =
0.25, and _ = 0.3,_ = _, =0.2.
d
_3_00
xx
\
__ Lockheed Code
_ _ 8xB grid w/mulL reflections
Z.O0 ................................ _ ......... ioo _o!o '_o'_' _'o ,oo 5ooAngle ot Attack, AOA. {deg)
Fig. 38 Drag force coefficient for a 90 °
concave wedge with S** = 7.5, T/T** =
0.25, and _ = 0.3, a, = tr, = 0.2.
The results for the pitching moment coefficient for the convex and concave wedge
are shown in Fig. 39. Multiple reflections acted to increase the pitching moment for angles
of attack from 0" to 20". From 20" up to 45", the pitching moment decreased compared
to the convex case. The increase at 10" was 0.056 (20%), and the decrease at 30" was
0.039 (5.7%).

44
080
080
E
0.4O
_ o.2o
/
/ //
Lockheed Code
_ _ 8x8 grtd w/rnult, reflectlons
Angle of Attack, £OA. (dell)
Fig. 39 Pitching moment coefficient for a
90 ° concave wedge with So. = 7.5, TJTo.
= 0.25, and ot =0.3, a_ = a, = 0.2.
Results for ot = 0.1, ov = 0.1, _r, = 0.1
Table 8 contains the output data from the calculations for the wedge in free
molecule flow with surface accommodation of ot = a_ = a, = 0.1. The axial force
coefficient is shown in Fig. 40 and the normal force coefficient results are shown in Fig.
41. The axial force coefficient was greatly increased by the addition of multiple reflections
with an increase of 1.92 at 0" AOA. The normal force also had some large increases from
10" to 30" AOA, with the largest increase, 0.82 (47%) at 20" AOA.

45
Table 8 Forceandmomentcoefficientsfor a 90° concave wedge with So. =
7.5, T,v/To. = 0.25, and c_ = a, = a, = 0.1, 8x8 grid.
ResuLts from Orbital Aerodynamics Code ResuLts with muLtipLe reflect, effects
A0A CA CN CL CO CM A0_ CA CN CL CO CM
0 2.8899 0 0 2.8899 0 0 4.8157 0 0 4.8157 0
5 2.8877 .4679 .2145 2.9175 .1469 5 4.7108 .9041 .4901 4.7717 .2142
10 2.8812 .9217 .4074 2.9975 .2892 10 4.5042 1.62 .8132 4.7171 .3621
15 2.8706 1.3475 .5586 3.1215 .4229 15 4.258 2o161 .9853 4.6722 .466
20 2.8561 1.7324 .651 3.2764 .5437 20 4.0032 2.5552 1.0319 4.6357 .5508
25 2.8383 2.0647 .6718 3°445 .648 25 3.751 2.8186 .9693 4.5907 °6275
30 2.8176 2.3345 .6129 3.6074 .7326 30 3.5015 2.9579 .8109 4.5114 .6981
35 2.7947 2.5338 .4726 3.7426 .7951 35 3.2519 2.9783 .5745 4.3721 .7611
40 2.7695 2.6589 .2566 3.8306 .8336 40 2.9994 2.8902 .2861 4.1554 .8124
45 2.7317 2.7317 0 3.8632 .8506 45 2.7319 2.7312 -.0005 3.863 .8505
5.00
\
_4.00 _
__ Lockheed Code
_ _ 8x8 grid w/mu|t, reflections
2.00 ......... , ......... i ................. ioo ,o o zoo '_oI; ..... ;o'_ _o
A_£1e or Attack, AOA. (dell)
Fig. 40 Axial force coefficient for a 90 °
concave wedge with S= = 7.5, TJTo. =
0.25, and _ = a, = e, = 0.1.
3.00- --_
Z //////I
o
_ ///I/
k,
__ 8xB grid "_'/mult. reflections
0.00 ......... i ......... _ ...................o* 1o.o =oo "_'_ ,o'o " '_o'o
Anele of Attack. AOA. (deg)
Fig. 41 Normal force coefficient for a 90 °
concave wedge with S= = 7.5, TiT= =
0.25, and _ = _,= e, =0.l.
Figure 42 shows the lift coefficient for the wedge at this accommodation case. The
largest increase was 0.43 at 15", but the increase in lift coefficient between 0" and 15" was
near 100%. The angles of attack greater than 30" did not show nearly as great an increase.
The angle of attack of maximum lift coefficient also shifted to lower AOA for the concave
case.
The drag coefficient is shown in Fig. 43. The increase in drag was dramatic, and
nearly as great as for specular reflection; the drag coefficient at 0" changed from 2.89 to

46
4.82 (67%). Also significantwasthefact thatwith increasingangleof attack, theconcave
dragcoefficientalwaysdecreasedwhile theconvexdragcoefficientalways increased.
t00
0OO
o_o
0 40
1/ \
/ \
/ \
/ \
/ \
/ \\
/ \
/ \
__ Lockheed Code
-0 20 _ _ 8x8 grid w/muir reflections
-0 400. ° ....................................,o'.o ' _'.o .... _'.,;" ,o'o 7o'oAngle of Attack. AOA, (deg)
Fig. 42 Lift force coefficient for a 90 °
concave wedge with So. = 7.5, T,,/To, =
0.25, and ct = a T = a,. = 0.1.
400
l)G
d
J
__ Lockheed Code
_ _ 8x8 grid w/muir, reflections
2.0o ,,, ................
Angle ol Attack, AOA, (del)
Fig. 43 Drag force coefficient for a 90 °
concave wedge with So, = 7.5, TiT® =
0.25, and ct = aT = a, = 0.1.
The pitching moment is shown in Fig. 44. Only the accommodation cases with a
= 0.5 and aT = a,. = 0.4 and the fully specular case had larger absolute value changes in
the pitching moment. The intermediate accommodation case only had an increase in the
pitching moment, but this case was like the specular case that had an increase at low angle
of attack and a decrease at higher angles of attack. The largest increase was 0.073 at 10"
AOA, or about 25 %.
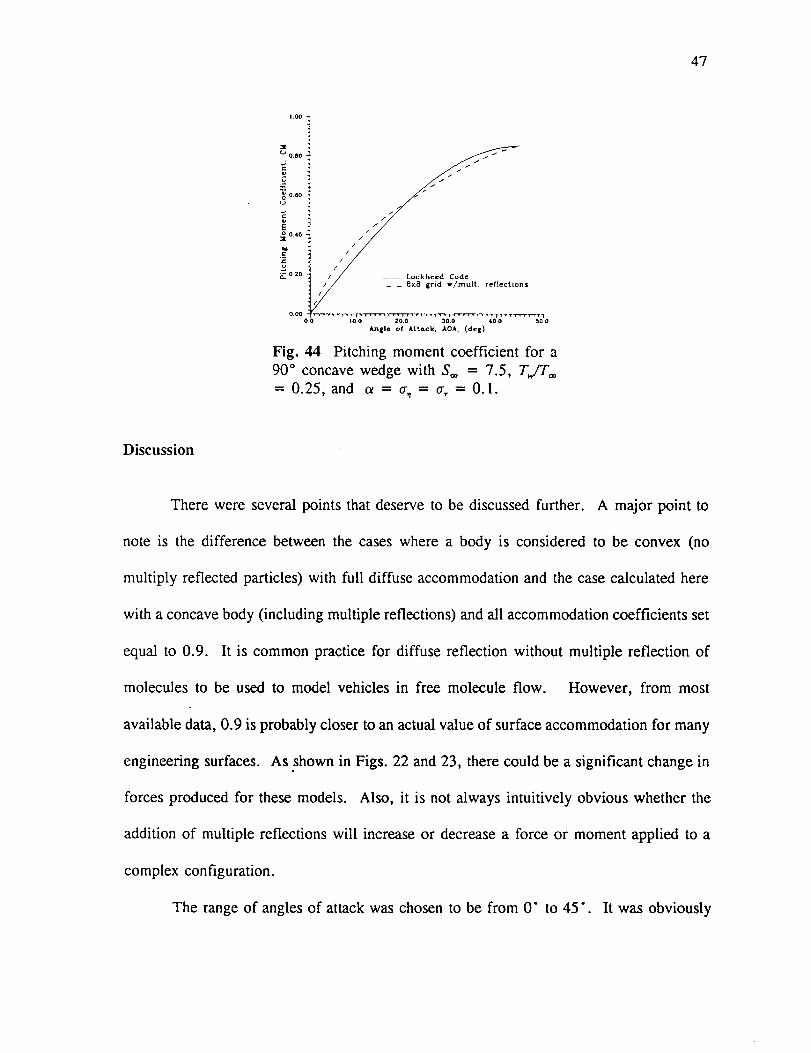
47
080
_ 0.60
t_ 020
/o._ ...........................oo ' '1'o'_ .....20.0 3'o'c;.... 4'o!_ ';o'o
Angle o_ Attack, AOA. (dee)
///
//
/
/
///_ Lockheed Code/ - - Bx8 grid w/mult, reflections
Fig. 44 Pitching moment coefficient for a
90 ° concave wedge with S_ = 7.5, TJTo.
= 0.25, and a = or, = a, = 0.1.
Discussion
There were several points that deserve to be discussed further. A major point to
note is the difference between the cases where a body is considered to be convex (no
multiply reflected particles) with full diffuse accommodation and the case calculated here
with a concave body (including multiple reflections) and all accommodation coefficients set
equal to 0.9. It is common practice for diffuse reflection without multiple reflection of
molecules to be used to model vehicles in free molecule flow. However, from most
available data, 0.9 is probably closer to an actual value of surface accommodation for many
engineering surfaces. As shown in Figs. 22 and 23, there could be a significant change in
forces produced for these models. Also, it is not always intuitively obvious whether the
addition of multiple reflections will increase or decrease a force or moment applied to a
complex configuration.
The range of angles of attack was chosen to be from 0" to 45". It was obviously

48
not necessaryto evaluateangles less than 0" becauseof the symmetry of the test
configuration. At 45", the#I plate is perpendicular to the flow and plate #II is edge-on to
the flow. Because a plate that is edge on to the flow can have momentum transferred to
it by the flow, it was necessary to include subshape #III on the underside of plate #II to
balance the normal force on plate II by diffusely reflecting particles. Beyond 45", the
bottom subshapes, II and III, would shield subshape I from some incident flow. Because
of the right angle between the plates, specular flow from plate I would never hit subshape
II and the results should be the same as the convex case. At the other extreme of diffuse
reflection, particles reflected from subshape I would not likely have a measurable effect on
subshape II since we have seen the small contribution that diffusely reflected particles have
on force and moment coefficients. To actually include these cases in the study would
require a new method of checking for shielding of subshapes from the reflected flow from
other elements.

49
CONCLUSION
Forceand momentcoefficientsfor a 90" wedge,in freemoleculeflow with speed
ratio7.5, with and without consideringmultiply reflectedmoleculeswere reported. The
wedgewascomposedof two squareflat platesof unit areajoined at one edgewith right
includedangle. The traditionally limiting casesof specularanddiffuse reflection showed
that multiple reflection of moleculescould have a very significant effect for specular
reflection, but almostno measurableeffect in the caseof diffuse reflections. In addition
to the limiting cases,severalcasesof intermediateaccommodationwere also calculated.
The magnitudeof effect of the multiple reflectionsfor the intermediateaccommodation
caseswasmoresignificantfor accommodationvaluesnearthe specularrange. However,
evenfor the nearlydiffusecasewith o_= a_ = tr, = 0.9, modeling a wedge as concave
resulted in significant changes from the convex results.
For the case of specular reflection, the axial force and drag coefficients increased
by an amount in excess of 2.51 when the test configuration was at an angle of attack
(AOA) of 0". This was just over an 87% increase over the coefficient value of the results
without multiple reflections. The effect of multiple reflection diminished with increasing
angle of attack, and the results become the same at 45" angle of attack. The lift coefficient
remained the same at 0" and 45" angles of attack, but increased for angles of attack in
between.
In the nearly diffuse case with ot = a, = a, = 0.9, which may represent actual
conditions for engineering surfaces at orbital speeds, there were large percentage increases
in the lift coefficient (150% to 250%). The actual magnitude of lift coefficients for that

50
casearequite low (up to 0.17) so thepercentagechangemaybea bit misleading.
Themethodusedfor calculatingtheeffectsof multiplereflectionscouldenablemore
accurateresultsfor the calculationof force and momentcoefficientson vehiclesin low
earth orbit. The methodof optimization to solve for the defining parametersof the
reflectedflow couldbeappliedto any typeof freemoleculecalculationscheme,including
the moremodernandprevalenttestparticleMonteCarlo method.

51
REFERENCES
'Gazley, C. Jr., Rowell, L.N., and Schilling, G.F., "On the Prediction of Satellite
Orbit Decay and Impact," Rand Corporation, Santa Monica California, RM-4619-PR, Oct.1965.
2Kogan, M. N., Rarefied Gas Dynamics, Plenum Press, New York, 1969, p. 405.
3Patterson, G. N., Introduction to the Kinetic Theory of Gas Flows, University of
Toronto Press, Toronto, 1971, pg. 59.
4Maxwell, J.C., "On Stresses in Rarefied Gases Arising From Inequalities of
Temperature," The Scientific Papers of James Clerk Maxwell, Vol. 2, Cambridge
University Press, Paris, 1890, pp. 681-712.
5Loeb, L.B., The Kinetic Theory of Gases Being a Text and Reference Book Whose
Purpose Is to Combine the Classical Deductions with Recent Experimental Advances in a
Convenient Form for Student and Investigator, McGraw-Hill Book Company, New York,
1934, p. 301.
6S_inger, E., "The Gas Kinetics of Very High Flight Speeds," NACA, TM 1270, 1950,
(translated from 1938 report).
7Zahm, A.F., "Superaerodynamics," Journal of the Franklin Institute, Vol. 217, 1934,
pp. 153-166.
STsien, H.S., "Superaerodynamics and Mechanics of Rarefied Gases," Journal of the
Aerospace Sciences, Vol. 13, 1946, pp. 653-664.
9Schaaf, S.A., and Chambr6, P.L., "Flow of Rarefied Gases," Fundamentals of Gas
Dynamics, Princeton University Press, Princeton, New Jersey, 1958, pp. 693-694.
t°Sentman, L. H., "Free Molecule Flow Theory and Its Application to the
Determination of Aerodynamic Forces," LMSC Tech. Rep. 448514, Lockheed Missiles and
Space Co., Sunnyvale, California, October 1961.
l_Warr, J.W., III, "An Orbital Aerodynamics Computer Program to Calculate Force
and Moment Coefficients on Complex Vehicle Configurations," Lockheed Missiles & Space
Company, Huntsville, Alabama, TM 54/20-275, Aug. 1970.
12Cohen, I.M., "Free Molecule Flow Over Non-Convex Bodies," United States Air
Force, AFOSR TN 60-190, Report 497, Feb. 1960.

52
13Chahine,M. T., "Free Molecule Flow Over Non-Convex Surfaces," Ph.D.Dissertation,MechanicalEngineering,University of California, January1961.
14Kogan, M. N., Rarefied Gas Dynamics, Plenum Press, New York, 1969, p. 420-431.
15Patterson, G. N., Introduction to the Kinetic Theory of Gas Flows, University of
Toronto Press, Toronto, 1971, pp. 106-107.
16Bird, G.A., Molecular Gas Dynamics, Clarendon Press, Oxford, 1976, pp. 91-106.
17Koppenwallner, G., "Freimolekulare Aerodynamik for Satellitenanwendung," [Free
Molecular Aerodynamics for Satellite Application,] ESA-TI'-776, translated by theEuropean Space Agency, July 1983.
_SNocilla, S., "The Surface Re-Emission Law in Free Molecule Flow," Proceedings
of the Third International Symposium on Rarefied Gas Dynamics, Academic Press, New
York, Vol. i, 1963, pp. 327-346
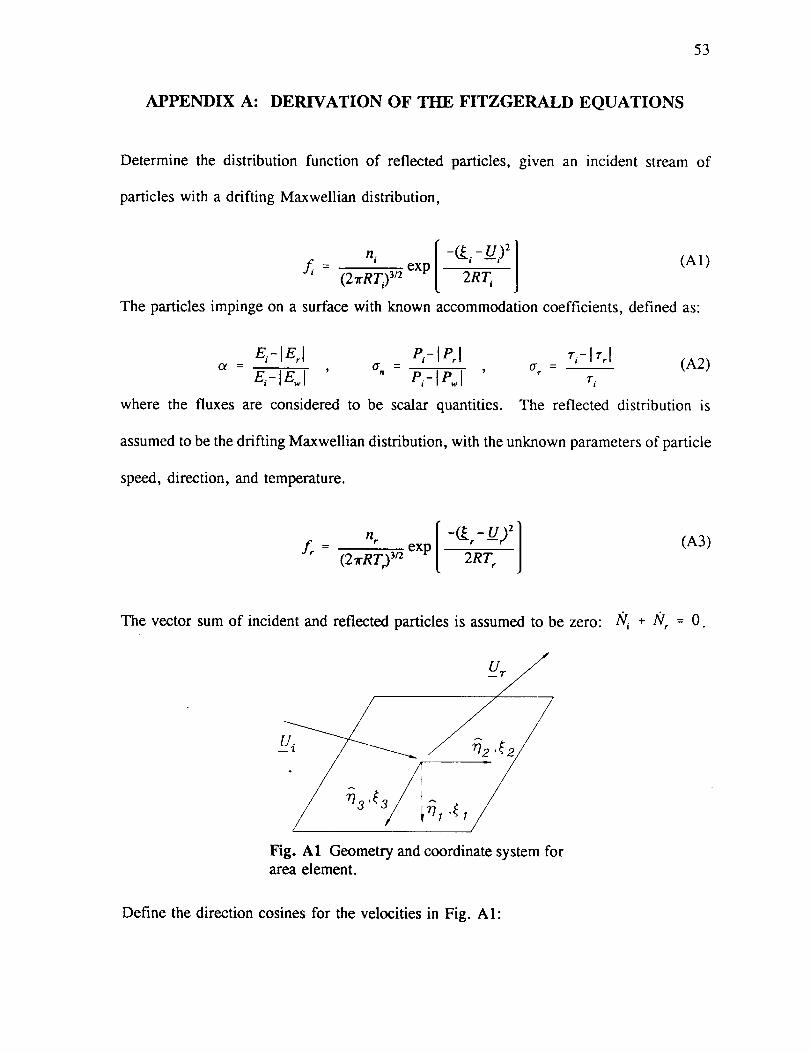
53
APPENDIX A: DERIVATION OF THE FITZGERALD EQUATIONS
Determine the distribution function of reflected particles, given an incident stream of
particles with a drifting Maxwellian distribution,
n,. [ -_i-U.) 2 ] (A1)f = (2_'RT,) 3n exp 2RT.
The particles impinge on a surface with known accommodation coefficients, defined as:
E,.-lEA P,-IP_l _,-I_1o, - e,-I_l o- , tr,.- (A2)' .P,-Ie.I _-,
where the fluxes are considered to be scalar quantities. The reflected distribution is
assumed to be the drifting Maxwellian distribution, with the unknown parameters of particle
speed, direction, and temperature.
nr [ -_r-UY] (A3)fr -- (2a.RTr)Sn exp 2RT
The vector sum of incident and reflected particles is assumed to be zero:
/
Fig. A1 Geometry and coordinate system forarea element.
_÷_=0.
Define the direction cosines for the velocities in Fig. AI:

54
U "_, U • -_--i --r
_W._ _W/_2
Iu, I lull
W._ U/O_a, = Iu, l o, = Iu, I
Then the total velocities can be written:
_, = (¢,V,+cO_, + (4,,U,÷c9__ + (o,V,+c_)_
_. = c,O, + c2_2 + c3_3
(A4)
Or, if the coordinate system has been chosen so that the incident velocity vector is in the
r/l. 2 plane, then 0,. = 0r = 0, and:
_i = (¢iUi+cI)Ol
_r
_w
= ( 1 ¢,_U,+c9_(-¢,Vr+c,)_ + _ + c_
= c,_, + c_ + c_03
dc 3 dc 2 dQ
dc 3
After integration, and since S_ =E v_ k
C,_ 2_ ' and R = _m, the particle flux is:

55
112
[v_- _fl,(1 +erf@fl) + exp(-_S_)]
For the number flux for all reflected particles:
_* = d
nr,,,,-A/,- (2r_-_)312 j __, j _®J ?_,(-_brU, +ct)expdc 3 dc 2 dct
nit.
A/_ - (21rR7")'12 1 [-c_ ]_¢"?(-ffrU +c,)exp 2--_]
After integration and substituting as in (A5), the particle flux is:
112[ kTr [V_- ffflr(1 +erfff,Sr) + exp(-_2_S_)]
Substitute into particle conservation and solve for the number density, G:
nF
= "/g;-_
_--_j
!/2
[V/7 if,S,(1 +erfff,S,) + exp(-ff_S,?)]
1/2
[qg-_"_,,%(1 +erf_b,S) + exp(-_b2rS_)]
/'lr = n i []'°T_ V/7 _b,S,(1+erf_bS,)+ exp(-_S 2)
_ _ _fl,(l+eff_,,S) + exp(-¢2_S_)
Number density of particies emitted diffusely from wall:
n. I- lfw - (21rRT)312 exp
(A5)
dc 3
(A6)
For the case of diffuse emission, Sw = 0, since Uw = 0, then:

56
n W
] !/2
T. [_r_- _bS,(1 +erf_b,S)= ni Z
+ exp(-_b_S_)](A7)
Pressure due to the flux of particles on an element of surface:
co co co 2
P. = m I0 I-col -co_'f d_3 d_2 d_l
e_ D
mni _ co 2
(2TRT)3/zf_,,v,l?coJ_coOky,+cl) exp __Ti ] dc3 dc 2 d¢ I
__,v(¢,iUi+c,)Zexp[-c_ ]dcti?ooexp[-c2 z ]ac_i_=exp[-c_]2--_,/ [2-_,/ [2-_,1dc_
P, = n,kT_ [(ff_S_ +½)(1 +erf¢,S,)
_,S,. 2 2+ --exp(-ffiSi) (AS)
Resultant pressure from momentum of reflected particles:
Pr= m I_°d_ll ?cod/j21 ?co_rfd_,
Pr mn,. j___ ® I-_T](2xRT,.) m l?co J_o.(ff_U,+c, )zexp dc3dc2dc,
PT --
mn,. ,.¢,u. ..... 2 [ -c_ ! [ -C_]dcz I I -c_ ]/(2_RT) s-o, - -
= nSL2 2 1
(_ +7)(1 +erf_fl)+ __x_exp(__b2S_)] (A9)
Pressure due to diffusely emitted particles:
Pw= m f_°ae,f__ae_f__e_ae_
Pw mnw0
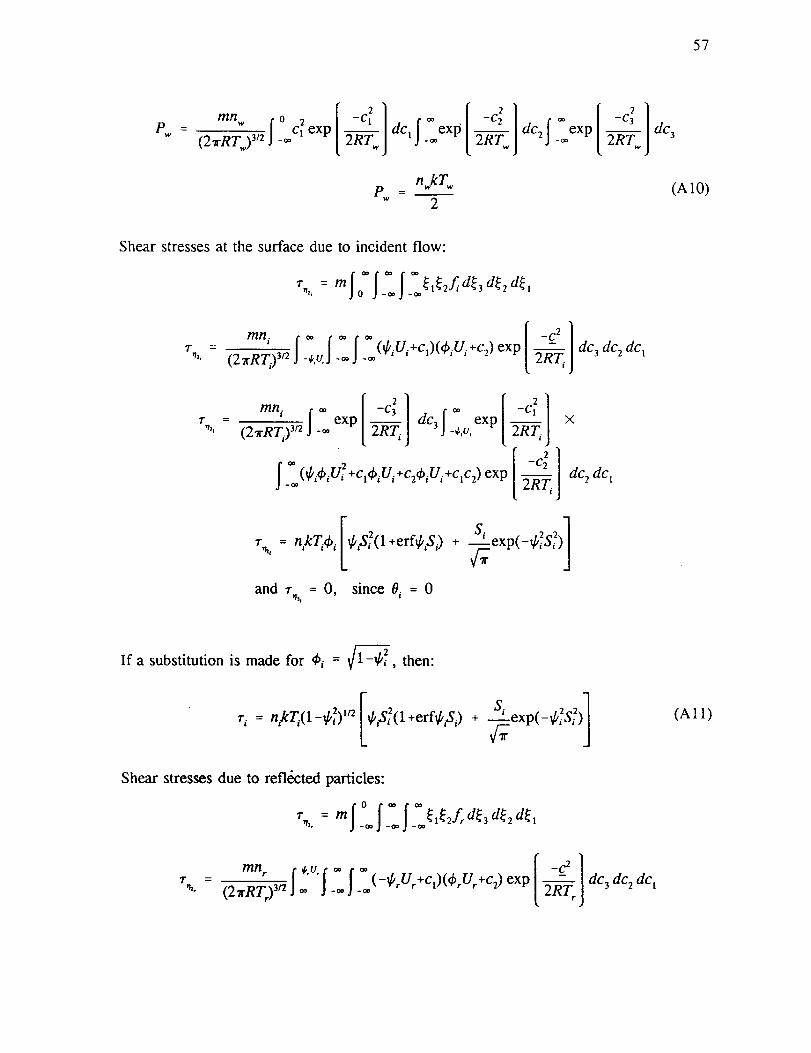
57
_ mnw
Pw (2rRT) 3n I o [ -c_ ]dQI _®exp [ -c2 ]dc zf__exp [ -c_ I-Sexp[ 2-_.j - t2--_.j 2-_.j
n, kTp-
2
de 3
(AIO)
Shear stresses at the surface due to incident flow:
7- = ml/ I ?,.,I 'o._l_2fid_3d_2 d_712_ _ I
TY12i
_ mn i o, ¢,, 0,
(2_Rr,)3,2f_,_,_I__.f__(C,U,+c,)(4',U,+c2)exp
7" mn,- I - /(_R_>,,_f-. _x, __,] _c,j_,._,ex,t--_,]
o, 2 [ -C2 2 ]I-® (¢'4''U_ +c'4"U' +c24''U'+Qc2) exp 2RT_J
T
X
and 7" = 0, since O, = 0
dc 3 dc 2 dQ
Si 2 2 ]
de 2 dc I
If a substitution is made for 4,, = _/1-_bT, then:
n/cr,O-¢b '_ [= ¢,S, (1 +erf¢,S,)7"i
Shear stresses due to reflected particles:
7" --
Si 2 2 q
7".,.= m j._o I-: f-:_'_2f_ d_3 d_2 d_t
(21'R-T) 3n J¢* l=I :(-¢_U_+ct)(4'_U_+c2)exp
(All)
dc 3 dc 2 dc t

58
7"
(2rRT) sn I--_ exp 2--_J dcs -_ exp _ x
oo 2 -C2
I_ (-J/r4_rU,. ÷clrbrUr-C24),Ur÷ClC2) exp _ dc_ dq
I-
r = -n_kT4_r ]_,S)(l+erfffrS ) + Srexp(-_b2rS_)
and r = 0, since 0 r = 0
If a substitution is made for q5 = _ _if2,. , then:
7"r = -nrkTr(l%/'2r) 1/2 _,.S_(1 + erfg, fl) + -_-xexp(-ffrS_) (A12)
For diffusely emitted particles, since Sw = 0, there is no contribution to the shear forces:
D
% = r,.. 7"y,,. 0 (A 13)
For the flux of incident energy at the surface, the internal energy for each degree of
freedom (DOF) is LkT_2 "
5 -33'For a perfect gas, DOF -
3,-1"1
The incident energy flux is:
E_ = J?I?_*I-*o(l me+T[ 3,-1
kr,[ 5-33,] - -
• kTi [ 5-33' /
The second term, internal energy, is equal to N.--_- J or:[ 3"-1 '
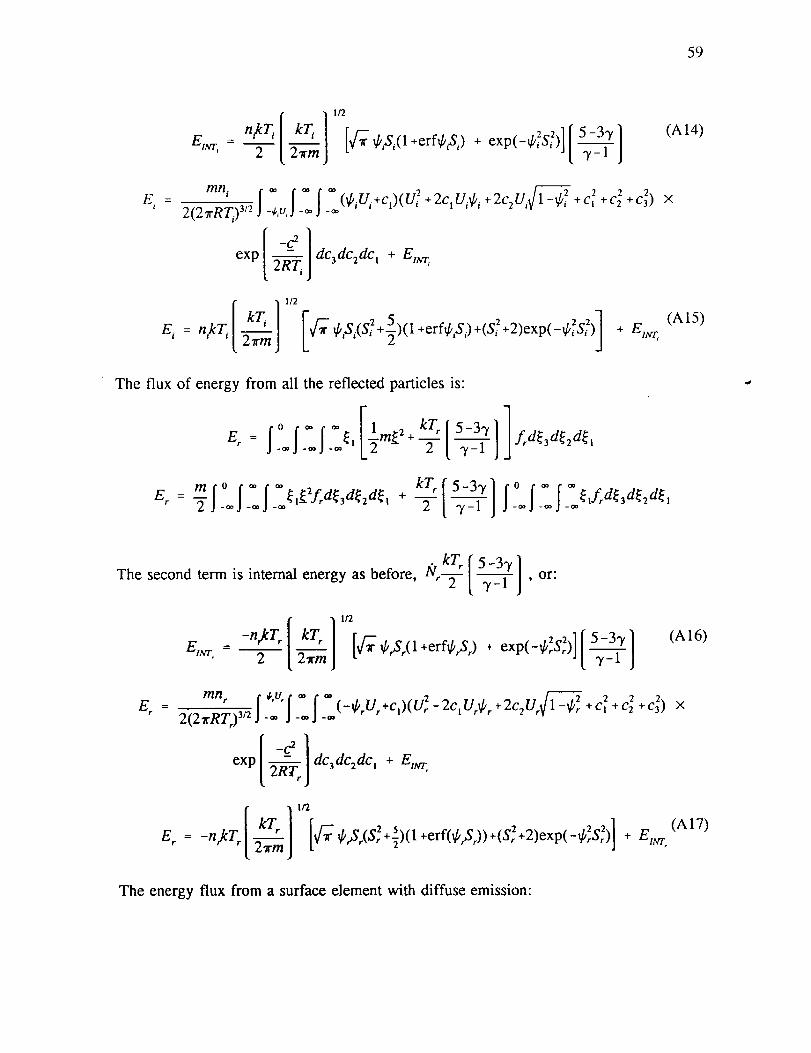
59
1/2
[_/_ ffS_(1 +erfff,Si) + exp(-ff_S{)] [ _]5-33,
(A14)
E i - mn, (_;U.+c,)(U_ +2c, Ui_/_ + 2c2U i -_ +c_ +c2 +c3) x2(2_rRT.)3/2 -_,u ....
exp dc3dc2dc t + EI_ '
1/2
1E,=nkT i _.____j [x[-_,s,(s2i+5)(l+erfd/,si)+(s_ +E,_,
(A15)
The flux of energy from all the reflected particles is:
I T 3,-lJ
• kr[ 5_33,/The second term is internal energy as before, N_--T or:t _-ll'
-n,kT_ [ kT,. ] 'a
E'm" - 2 [ _ j [_" _,,S_(1 +erffbfi)+ exp(__2S_)] [ 5-33, ]
I t 3,-1 J
(A16)
gr -- mn_ [,,v,[_. _ 2 2 22(27rRT) 3/z ,-** ,-** J _(-¢'_U'+c')(U_-2czU_C'_+ 2c2UA/1-d/2r +c, +c2 +c3) x
exp _ dc3dc:flc t + Et_
E = -n,kT_ 27rm I b[-_ _'Sr(S2+-_)(1 +erf(ff,S)) 2 2 2
(A17)
The energy flux from a surface element with diffuse emission:

60
Ew +7 71
[5-33]̀
N kT [ 5-33' ]where the internal energy term is w--_- I. 3'-1 , and since Sw = 0:
1/2
-n.,kT I kT_ 5-33, ]
E'ur" - 2 [2¥--m [ 3`-1 J
(A18)
Ew mnw2(2--_ ), a I[ * [__. J__.c,(c_ +c_ +c_) exp dcsdc2dc I + Em.r
] 112
E., = - 2 n,.,kT_ kT
E = -nwkT _ I kT I ,a [ 3'+12(3"- 1) ]
(A19)
Create a set of equations to solve for the desired quantities Tr, S, _b,. Rearrange
accommodation expressions, (A2), and set equal to zero.
F, = 0 = (1-a)r_ - I_.1
F= = 0 = (1-a.)P_ + _,lPwl - IP_l
F3 = 0 = (1-oOE_ + o,lE,.,I- IErl
Substituting (A11) and (A'12) into F,:
F 1
2 [- 2 S,. 2 2= (1-G)n,kT_(1-_b,) ''2/_,s, (1 +erf_,S,) + --exp(-_k,S,) -
2 / 2 S, 2 2"]
n,kT_(1-G)'a LC,,S_(l +erf_kfl) + -_exp(-GSr) j

61
Or, after substituting(A6) for nr and simplifying:
F, = 0 = (1-G)S,[T_(1-ff_)] ta - Sr[Tr(1-1_t2r)] 112(A20)
To make the expressions more concise, define the quantity:
x0k,S) = 9_- t/,S(1 +erf_bS) + exp(-ff_S z)(A21)
Substituting (A8), (A9), (A10), and (A21) into F2:
lF_ = (1-a.)-_r (l+erfff.S,) + ¢,.S,x(_,.S,) + cr -_
(1 +erftkfl) + tkfl_X(_,S)
Substituting (A6) for n_ and simplifying:
F 2 = (l-G) (l+eff_bS,) + T_i _bS, 1 + _ _X($i,Si) 2
(1 +erf¢,fir) + rl2 X(_b,,S) T_T-/-_bfl
(A22)
Substituting (A14), (A15), (A16), (A17), (A18), (A19), and (A21) into F3:
f / 1kT,. f_ _S.(l+erfil, S.)+(S_+2)x(_.,S,) + 5-37
F 3 = (1-c0n,kT_l_--_---_j 2 '' '',r2 ' 2(3,-1) X(_b,,S,)
om,,,kT_ _j 2(3,-1) ] -
+
Or, after substituting (A6) for n_ and simplifying:

62
F3 = (l-cOT._'_'_b,S_ (l+erf_bS)+ (S_+2) + 5-33' ] + aT[ v+I
2 X(_,S_) 2(_-2[) J [ 2(V -1)
[__(l+erf'fl)+(S_+2) + 5-3V]L x(J/_,S) 2(v-1)J
Form an objective function from Ft, F2, F3:
J =TFt +F2 +F
(A23)
(A24)
The objective or "cost" function can be solved by a nonlinear optimization technique. J
can be minimized given the input values of % tr,, _, T_, _b;, Si, % and Tw. These quantities
are known from material properties, atmospheric data and the geometry of the problem.
Minimization results in the desired values of fir, St, and Tr necessary for the determination
of the distribution of the stream reflected from a surface.

63
APPENDIX B: VERIFICATION OF REFLECTED FLOW PROPERTIES
After experimenting with the optimization process to determine the properties of the
reflected flow from a surface, it was apparent that choosing a random set of
accommodation coefficients for energy and momentum would not insure a correct solution.
There were apparently certain "sets" of accommodation coefficients that could yield correct
solutions. Two issues needed an answer. The first was whether or not the reflected
properties from the minimization were an adequate solution to the set of equations. The
second was whether or not the solution was reasonable or even physically possible.
To determine if the minimization was finding global minimums in the solution of
the set of conservation equations, the value of the cost function itself could be monitored.
A series of tests were carried out with the optimization program to try various combinations
of accommodation and find out what the cost function looked like. A set of input
conditions was chosen and a fixed energy accommodation value was selected. The
tangential and normal momentum accommodation coefficients were then cycled through 0.0
to 1.0, and a surface of the cost function was generated. From the cost surface and for
each value of energy accommodation, a region of normal and tangential accommodation
that produc:ed a low cost function could be determined. For this purpose, any solution that
produced a cost value of 10 .4 or less was considered to be an adequate solution.
If the optimized reflected quantities could be compared to another known solution
to the problem, it could be determined if the solution was physically reasonable. In gas
kinetics, there is an expression for the pressure due to the stream of gas particles reflected
from a surface. Using the reflected distribution:

64
(B1)
[exp(-_S_) + qt-_-_,S,(1 + erf_bS)]
2 2 +]_ [exp(-_r&) _/'_-_5_(1 + erf_beSr)]
There is also an expression that calculates the resultant pressure of the reflected flow using
the incident and wall conditions and accommodation coefficients. The resultant pressure,
using the accommodation method:
T_ [ 2 2 erf_b,S_)]P_ - _[_S;exp(-_,&) + _(_S_ + -_)(1 +
T _ [exp(__b_S/2) + _[_'_Si(1 + erf_fli)] (B2)
P,, = (1 - %)P, + %Pw
where both pressure expressions have been divided by nik to simplify the expressions. By
looking at a surface generated by the ratio of the pressures, PrllPra, a contour where the
pressure ratio is 1.0 can be picked out.
To get an idea if the optimization was producing valid answers for the reflected
propertiesl the regions of low cost function were overlaid with the contour of unit pressure
ratios. Figures B1 through B9 show the correspondence between the regions of low cost
function and the unit pressure ratio for an incidence angle of 20".
Several things can be learned from the results. There is evidence that the
accommodation coefficients may actually be a function of the angle of incidence of the
impinging flow, as suggested by several investigators. For the cases with a 20" angle
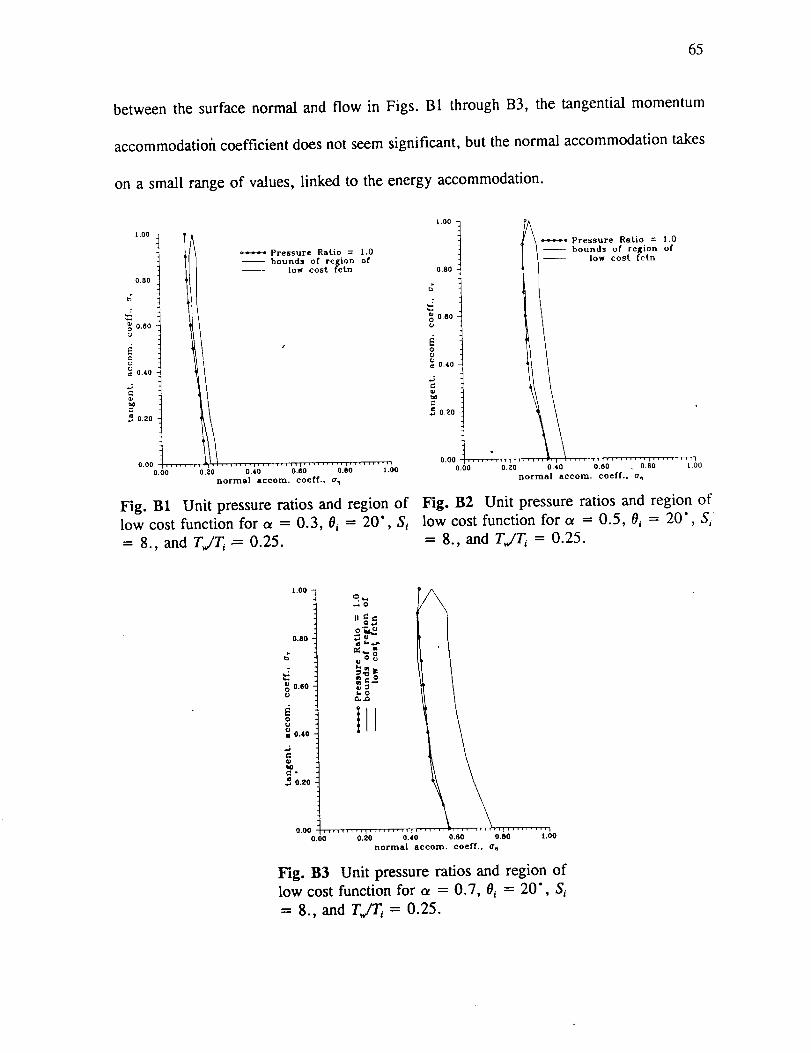
65
betweenthe surfacenormaland flow in Figs. B1 through B3, the tangentialmomentum
accommodationcoefficientdoesnotseemsignificant,but thenormalaccommodationtakes
on a small rangeof values,linked to the energyaccommodation.
t .00
0.80
o0 0.60o
0.40
_ 0.20
0.00
0.00 0.20 0.40 0.80 0.80 1.00
normal aeeom, coeff., a_
Fig. B1 Unit pressure ratios and region of
low cost function for _ = 0.3, 0_ = 20", Si
= 8., and T,,./T_ = 0.25.
t.O0 1
IA _ Pressure Ratio = 1.0Pressure Ratio = 1.0_I I -- bounds of region of
-- 0.80
0.80
_ 020 1
0.00|
-- bounds of region of
low cost fern
1,, ii 1 ..... ,, i .... 1,1,,,i .... ,t I .... 1,,,10.00 0.20 0.40 0.80 , 0.80 1.00
normal aecom, coeff., o,_
Fig. B2 Unit pressure ratios and region of
low cost function for a = 0.5, 0i = 20", S,
= 8., and TJT_ = 0.25.
1.00
O_Oo. 1 I
I "° i[ t_0.60 _u "q_
kO
_ 0.40
O.ZO
0.00
0.80 0.20 0.40 0.80 0.80 [.00
normal accom, coeff., o',7
Fig. B3 Unit pressure ratios and region of
low cost function for c_ = 0.7, 0_ = 20", S_
= 8., and TJT_ = 0.25.

66
The caseswith an incidenceangleof 45" in Figs. B4 through B6 show that the
normal and tangentialaccommodationare both nearly equally significant. Again, the
energyaccommodationis linked to therangeof momentumaccommodationvaluesthat are
"possible".
1.00
0.80
0.60o
0.40
..J
0.20
0.00
Pressure Ratio = 1.0
bounds of region of
-- low cost fern
0.00 0.20 0.40 0.60 0.00 t.00
normal accom, coet'f., o.
Fig. B4 Unit pressure ratiosand region of
low cost functionfor a = 0.3,/_i= 45", S_
= 8., and TJT_ = 0.25.
1.00
_ Pressure Ratio -- 1.0
-- bounds of reldon of
0.B0
_0.60
0
0.40
0.20
o.00 _ ...... L ....... '_' .... ; .... _ .........
o.0o 0.20 0.40 0.80 0.80 t.O0
normal accom, coeff., a_
Fig. B5 Unit pressure ratios and region oflow cost function for c_ = 0.5, 0_ = 45", S,
= 8., and TJT,. = 0.25.
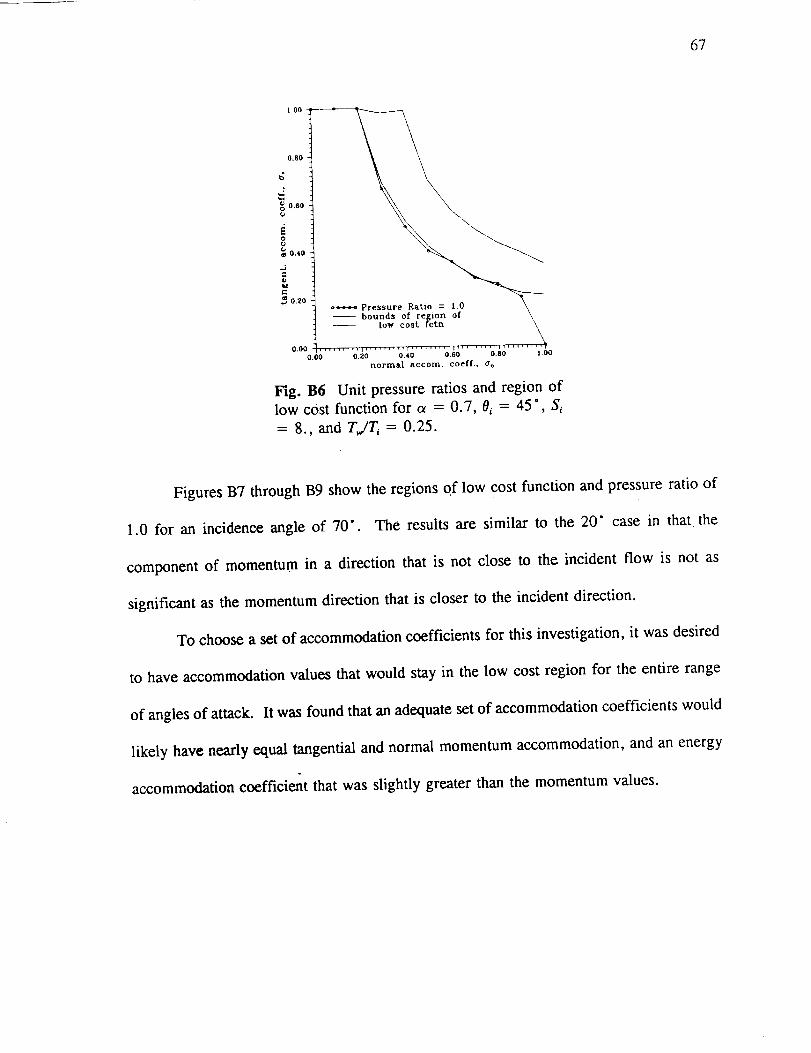
67
!.00 --
_0 0.60
°_0.40
0.20 - .
tow cost _cltn
O.O0 0.20 0.40 0.60 0.00 1.00
norms! accom, coeff., o'q
Fig. B6 Unit pressure ratios and region of
low cost function for c_ = 0.7, 0_ = 45", S_
= 8., and TJT, = 0.25.
Figures B7 through B9 show the regions of low cost function and pressure ratio of
1.0 for an incidence angle of 70". The results are similar to the 20" case in that the
component of momentum in a direction that is not close to the incident flow is not as
significant as the momentum direction that is closer to the incident direction.
To choose a set of accommodation coefficients for this investigation, it was desired
to have accommodation values that would stay in the low cost region for the entire range
of angles of attack. It was found that an adequate set of accommodation coefficients would
likely have nearly equal tangential and normal momentum accommodation, and an energy
accommodation coefficient that was slightly greater than the momentum values.
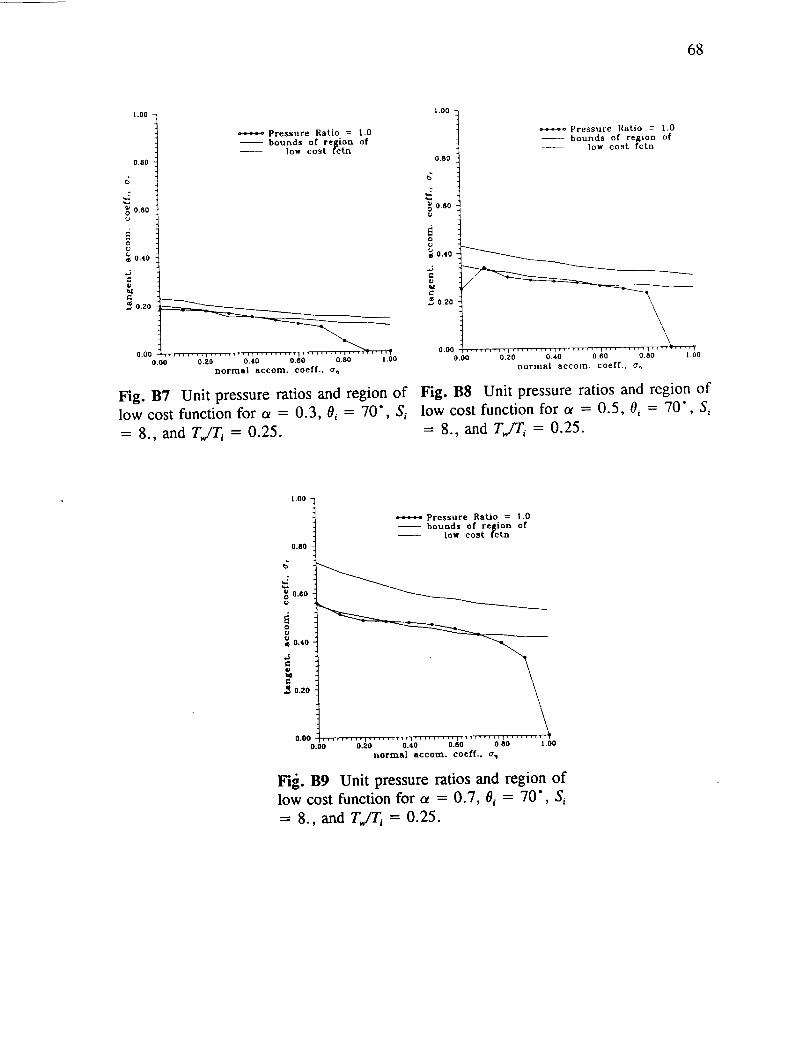
68
t.O0
0.80
0,60
0.40
Pressure Ratio = 1.0
bounds of region of
---- low cost fern
0.20 __
ooo°o_....... o'_ ....... o'_,....... o'_;....... _ ....... ;._,onormal accom, coeff., a m
Fig. B7 Unit pressure ratios and region of
low cost function for c_ = 0.3, 0_ -- 70", Si
= 8., and TJT, = 0.25.
t.00
0.80
.
0.00
o
_0.40
C
0.20
0.00
Pressure Ratio = 1.0
bounds of region of
-- low cost fctn
0,00 0.20 0.40 0.60 0,80 1.00
normal accom, coeff., a m
Fig. B8 Unit pressure ratios and region of
low cost function for c_ = 0.5, 0_ = 70", S,
= 8., and TILT, = 0.25.
t .00
0.80
_ 0.60
0.40
e_
.._ O.ZO
Pressure Ratio = 1.0
bounds of region of
-- low cost fern
0.00 ......... I .....0.00 0.2:0 0.40 0.60 0.80 1.00
normal accom, coeff., crn
Fig. B9 Unit pressure ratios and region of
low cost function for a = 0.7, O_ = 70", S_
= 8., and TJT_ = 0.25.

69
VITA
Gordon Lee Powell, Jr. was born
to Mr. Gordon Powell, Sr. and Mrs. Mary Powell. He lived there until he graduated from
high school at La Crosse Central in 1985. Gordon was offered a Lechner Fellowship to
study engineering at Texas A&M University, so headed south. He attended school in
Texas and worked back in La Crosse during the summers to help fund the completion of
his Bachelor of Science degree in Aerospace Engineering in 1989. Gordon worked for the I
Aerospace Engineering Department as a research assistant under a NASA JSC contract,
then worked for the Center for Strategic Technology, headed by Dr. Richard E. Thomas.
He continued to work for Dr. Thomas as a research assistant for R. Thomas and
Associates. Gordon was president of the Texas A&M University Bicycling Club for over
five years, before becoming a student advisor to the club during his last few semesters at
A&M. After the completion of his Master of Science degree, Gordon intends to embark
on the greatest adventure of his life--the search for full time employment. Gordon can be
reached through his parents at: