techniques for cg music video production: the making … · techniques for cg music video...
TRANSCRIPT

Techniques for CG Music Video Production:the making of
Dance to the Music / Play to the Motion
Adriana SchulzMarcelo CicconetBruno Madeira
Aldo ZangLuiz Velho
VISGRAF Laboratory
March 2010

Abstract
This technical report presents a set of techniques for the production of music videosusing computer graphics and animation. Their practical application is illustrated
through examples developed for making the video “Dance to the Music / Play to theMotion”.

Contents
1 Introduction 11.1 The Video . . . . . . . . . . . . . . . . . . . . . . . . . . . . . . . . . . . . 11.2 The Techniques . . . . . . . . . . . . . . . . . . . . . . . . . . . . . . . . . 3
2 Cinematography 42.1 Video Format . . . . . . . . . . . . . . . . . . . . . . . . . . . . . . . . . . 42.2 Lighting . . . . . . . . . . . . . . . . . . . . . . . . . . . . . . . . . . . . . 52.3 Cameras . . . . . . . . . . . . . . . . . . . . . . . . . . . . . . . . . . . . . 6
3 Motion Capture 73.1 Introduction . . . . . . . . . . . . . . . . . . . . . . . . . . . . . . . . . . . 73.2 MoCap Technique . . . . . . . . . . . . . . . . . . . . . . . . . . . . . . . . 83.3 MoCap at Visgraph . . . . . . . . . . . . . . . . . . . . . . . . . . . . . . . 10
4 Animation 134.1 Introduction . . . . . . . . . . . . . . . . . . . . . . . . . . . . . . . . . . . 134.2 Motion Graphs . . . . . . . . . . . . . . . . . . . . . . . . . . . . . . . . . 134.3 The choreo.graph . . . . . . . . . . . . . . . . . . . . . . . . . . . . . . . . 15
5 Modeling 3D Characters 185.1 Introduction . . . . . . . . . . . . . . . . . . . . . . . . . . . . . . . . . . . 185.2 Building the character . . . . . . . . . . . . . . . . . . . . . . . . . . . . . 18
6 Rendering and Lighting 236.1 Introduction . . . . . . . . . . . . . . . . . . . . . . . . . . . . . . . . . . . 236.2 Making a Light Probe . . . . . . . . . . . . . . . . . . . . . . . . . . . . . 236.3 Rendering with Light Maps in Mental Ray . . . . . . . . . . . . . . . . . . 28
7 Camera Calibration 307.1 Introduction . . . . . . . . . . . . . . . . . . . . . . . . . . . . . . . . . . . 307.2 Calibration Techniques . . . . . . . . . . . . . . . . . . . . . . . . . . . . . 317.3 Calibration and MoCap . . . . . . . . . . . . . . . . . . . . . . . . . . . . 31
8 Music 358.1 Automatic Composition . . . . . . . . . . . . . . . . . . . . . . . . . . . . 358.2 Motion Scoring . . . . . . . . . . . . . . . . . . . . . . . . . . . . . . . . . 37
i

CONTENTS ii
9 Motion Graphics 389.1 Opening Title . . . . . . . . . . . . . . . . . . . . . . . . . . . . . . . . . . 389.2 Live Action Clip . . . . . . . . . . . . . . . . . . . . . . . . . . . . . . . . 399.3 Dance Graph . . . . . . . . . . . . . . . . . . . . . . . . . . . . . . . . . . 39
A BVH File Format 40
Bibliography 41

Chapter 1
Introduction
In this document we will present the making of “Dance to the Music / Play to the Motion”music video. The main motivation to write this technical report is to introduce throughpractical examples the basic set of computer graphics and animation techniques that arecommonly used to create special effects and produce artistic videos.
1.1 The Video
Overview
The Dance to the Music / Play to the Motion piece was produced as part of a researchproject of the VISGRAF Laboratory on the areas of Computer Animation and Music.Its purpose was to test various methods being developed in our current research and tovalidate their effectiveness in the context of a real application.
The video combines novel aspects of automatic music composition with computergenerated animation and high quality rendering to investigate an authoring paradigm forexpressive audio-visual content creation.
Essentially the project tries to answer the following question: “Is it possible to usedance in order to compose music” ? For this purpose, we employed motion analysistechniques to drive a song synthesis probabilistic machine, such that the choreographedmovements of a real dancer create new music that is subsequently performed by a com-puter animated character.
Storyboard
To demonstrate the results of the project a video was produced showing all the steps ofthis process.
We wanted the video to be, at the same time, artistic and illustrative – an authoringdecision that posed great challenges to us.
The strategy adopted to fulfill our goal was to make the video more like a danceperformance in itself than a documentary explaining the inner workings of the research.On the other hand, the video should also reveal the interplay of music and dance toproduce an integrated piece.
1

CHAPTER 1. INTRODUCTION 2
Consequently, the structure of the narrative consisted of a dancer performing a sambasong. This performance is divided in two parts: in the first part, she dances to anautomatic generated music; and in the second part, the real dancer becomes a virtualdancer that, through her movements, create a new music. In other words, the paradigm:Dance to The Music / Play to the Motion.
Hints of how some technical aspects of the method relate to the actual action areprovided by text explanations at both begining and end of the video, as well as, bygraphical elements, such diagrams that are superimposed on the images throughout thevideo. The figure below shows the storyboard for this video:
Figure 1.1: Storyboard.

CHAPTER 1. INTRODUCTION 3
1.2 The Techniques
To produce the video Dance to The Music / Play to the Motion we employed a plethoraof techniques that are commonly used in Digital Special Effects and Computer AnimatedFilms.
These techniques span a wide variety of domains, ranging from live action shooting toCG character animation on the visual side, and from music scoring to soundtrack creationon the audio side.
Pipeline
The complete video is generated by series of steps that combine in non-trivial ways thevarious techniques mentioned above. These tasks form a pipeline of video production,that begins with the argument, storyboard and pre-production planning, continues withshooting and production, and ends with editing and post-production.
In the subsequent chapters of this technical report, we will present in detail each ofthese techiniques and discuss how they are assembled to produce the video Dance to theMusic / Play to the Motion.
More specifically, we wil address the following topics:
• Cinematography
• Motion Capture
• Animation
• Modeling of 3D Characters
• Rendering and Illumination
• Camera Calibration
• Music and Soundtrack
• Motion Graphics
• Editing

Chapter 2
Cinematography
In thsi section we discuss the technical aspects of the live action cinematography.
2.1 Video Format
From the very beginning we decided to make the video in the most advanced standards.This implied that we would use the format Full HD, which has an image resolution of1920×1080 pixels and a frame rate of 60 fps. This choice also determined the wide aspectratio, 16 : 9, for the image.
Since the first part of the video shows the real dance performance, we had to shootlive action in a studio where the motion capture took place.
Figure 2.1 shows the set for the dance performance. It is actually the main backgroundfor the video, because we opted to use a fixed camera a wide shot of the action.
Figure 2.1: Background of HD Frame
The set, as can also be seen in Figure 2.1 was a studio with a dance floor and a darkbackground. The dancer was wearing a black suit with retroreflective markers.
4

CHAPTER 2. CINEMATOGRAPHY 5
2.2 Lighting
The lighting was designed to emphasize the motion of the dancer. It consisted mainlyof a backlight provided by two 600W Omni reflectors just outside the upper sides of theimage frame, as shown in Figure 2.2.
Figure 2.2: Base Illumination: Backlight
The purpose of this base illumination was to mark the silhouette of the dancer withoutrevealing too much of her figure.
The backlight was complemented by a frontal fill light, which consisted of a 200Wreflector placed next to the main camera, as can be seen in Figure 2.3. The intensity ofthis source was carefully balanced to brighten the retro-reflective marker in the dancer’ssuit, while preserving a high contrast for the backlight effect from the base illumination.
Figure 2.3: Fill Light

CHAPTER 2. CINEMATOGRAPHY 6
2.3 Cameras
The live action part of the video was shot with two cameras: a frontal main camera forwide view coverage of the dance performance and a secondary side camera for close-upsof the dancer. Figure 2.4 shows both cameras positioned at their location in the studio.
Figure 2.4: Cameras
The main camera was a 3-CCD Panasonic AVCHD video camera, while the secondcamera was a 1-CCD Sony HDV camera. We used Manfrotto tripods for both cameras.Figure 2.5 shows the capture setup during shooting.
Figure 2.5: Shooting a Scene.

Chapter 3
Motion Capture
Motion Capture (MoCap) is a technology that allows us to record human motion withsensors and to digitally map the motion to computer-generated creatures[1].
The applications of motion capture go far beyond animation and include biomedi-cal analysis, surveillance, sports performance analysis and input mechanism for human-computer interaction. Each application has its own particular set of singularities andchallenges.
In this chapter, we will discuss motion capture of full body motion for characteranimation. We will introduce the basic concepts, detail the technique and describe howit was implemented at the VISGRAF Laboratory.
3.1 Introduction
By definition, to animate is to bring to life, in this case, to make a lifeless object (a graphicsmodel) move. Realistic animation of human motion is a challenging task, firstly, becausehuman movements can be quite complex since joints have many degrees of freedom and,secondly, because people are skilled at perceiving the subtle details of human motion.For example, people are capable of recognizing friends at a distance purely from the waythey walk and can perceive personality and mood from body language. This implies thatsynthetic human motion needs to be very accurate in order to appear real.
It is the opinion of many researchers of the area that synthesis of realistic humanmotion can only be made possible by an approach that makes extensive use of data fromthe real world [2]. It this context, it has been quite appealing for animators to usedmethods of copying the movements of real life objects.
An early example of such a technique is Rotoscoping, in which animators trace overlive-action film movement, frame by frame, in order to create realistic motion. Thougharchives show that most of Snow White’s movements were traced from actors motions us-ing this technique, Wald Disney never admired to it. In fact, this was consider “cheating”because it was not produced by the imagination of the artist and also “cheep animation”because animations were supposed to be “bigger than life” not merely a “copy of life” [1].
Rotoscoping was, naturally, a precursor of MoCap and the controversy around it hasthe same origin. On the one hand, there is the need for creating engaging and expressivecharacters and on the other hand the need of synthesizing realistic motion efficiently and
7

CHAPTER 3. MOTION CAPTURE 8
fast. Therefore, withing the animation community, there is a historical tension betweenanimators and MoCap technicians [3].
The techniques for motion creation are usually divided into three basic categories:manual specification (key framing), motion capture and simulation [4].
Key framing borrows its name from traditional hand animation and is, in fact, verysimilar to it in the sense that, while computers reduce some of the labor by automaticallyinterpolating between frames, the animator has to specify critical (or key) positions forthe objects. This requires great training and talent, since a characters usually have manycontrols (e.g, each of the main characters of the movie Toy Story, which were animatedin this fashion, had more than 700 controls). The advantage of this method is that theartist is able to control subtle details of the motion. Nevertheless, it is very hard to makethe characters look real.
Motion Capture, as we have mentioned above, is a process that transfers recordedmovement to an animated object. Some of the advantages of motion capture over tradi-tional computer animation are [5]:
• more rapid, even real time results;
• real, naturalistic movement data;
• extremely accurate 3-D data that permits the study of the essence of the movements;and
• data formats that require minimal storage and allow for easy manipulation andprocessing.
The physically based approach, uses laws of physics to generate motion through sim-ulation and optimization. This technique is largely used, not only for human motion,but also to animate fluids, fire, explosions, face and hair. Simulation techniques supplyphysical realism, while MoCap allows for natural looking motion. Currently, many appli-cations merge both techniques together in order to create models of human motion thatare flexible and realistic [2].
3.2 MoCap Technique
Motion Capture systems can be divided into three different categories [5]: inside-in (sen-sors and sources located on the body), inside-out (sensors located on the body and sourcesoutside) and outside-in (sources located on the body and sensors outside).
An example of an inside-in system is an electromechanical suit, where sensors areattached to to the performer’s body measuring the actual joints inside the body. Theadvantages of this method are the absence of occlusions (all sensors are always “visible”)and the portability of the suits. Nevertheless the actor’s movement are constrained bythe armature.
In electromagnetic (inside-out) systems, electromagnetic sensors, placed on joints ofthe moving object, measure their orientation and position with respect to an electromag-netic field generated by a transmitter. This method also directly collects positions and

CHAPTER 3. MOTION CAPTURE 9
orientations of the sensors and does not have to consider occlusion problems. The draw-backs of this technique relate to the range and accuracy of the magnetic field as well asthe constraint of movement by cables.
Optical systems are inside-out systems which use data captured from image sensors totriangulate the 3D position of a subject between one or more calibrated cameras. Dataacquisition is traditionally implemented using special retro-reflexive markers attached toan actor and infrared cameras. However, more recent systems are able to generate accuratedata by tracking surface features identified dynamically for each particular subject. Thisis called the marker-less approach.
Optical techniques are widely used since they allow large performance areas (dependingon the number of cameras) and performers are not seriously constrained by markers.Nevertheless, orientation information is not directly generated and therefore extensivepost-processing needs to be done in order to reconstruct the three dimensional motion.
The three major tasks that need to be undertaken are [6]: markers have to be iden-tified and correlated in the 2D images, 3D locations have to be constructed from the 2Dlocations, and 3D marker locations need to be constrained to the model being capture(e.g., human skeleton).
The first step is to find the markers at each frame and track them over the videosequence. The latter can be quite difficult because markers often overlap, change po-sition relative to one another and are occluded. In addition, noise can arise from thephysical system (markers may move relative to their initial positions) or the samplingprocess. Hence three major problems occur when tracking the markers and may needuser interventions to be resolved: missing data in the presence of occlusions, swappedpaths between two markers that pass within a small distance of each other, and noise.
Figure 3.1: Two-camera view of a point. Extracted from [6].
The second step is to reconstruct the 3D points from the 2D trajectories. For thispurpose, cameras need to calibrated , i.e., the position, orientation and intrinsic propertiesof the cameras need to be known. This can be done by recording a number of image pointswhose locations are known. With calibrated cameras, the three dimensional coordinatesof each marker can be recontructed from at least two different views (the more orthogonalthe views the better), as shown in Figure 3.1.
Finally, the 3D marker positions need to be transformed into the motion parametersof a kinematic skeleton model. For this, it is crucial to place the markers in adequate
CHAPTER 3. MOTION CAPTURE 10
positions. The markers cannot be located exactly on the joint firstly because they areplaced on the surface of the skin and second because they have to be set in positions wherethey will not move according to the performance. This represents a problem becausealthough distances between consecutive joints are always the same, distances betweenmarkers may vary. Therefore, in order to locate the joint relative to the marker, we neednot only the position, but also the orientation.
To solve these problems, most standard formats require placing three non-linear mark-ers on each rigid body part instead of one in each joint [7]. These locations are then usedto determine the position and orientation of each limb and the skeleton configuration isdetermined while the tracked subject performs an initialization pose (T-pose). Since noiseis usually added to the data, directly using the calculated joint positions will probablyresult in varying bone lengths. To get around this problem, many systems calculate jointrotations and use a skeletal hierarchy to reconstruct the pose of the articulated body.
3.3 MoCap at Visgraph
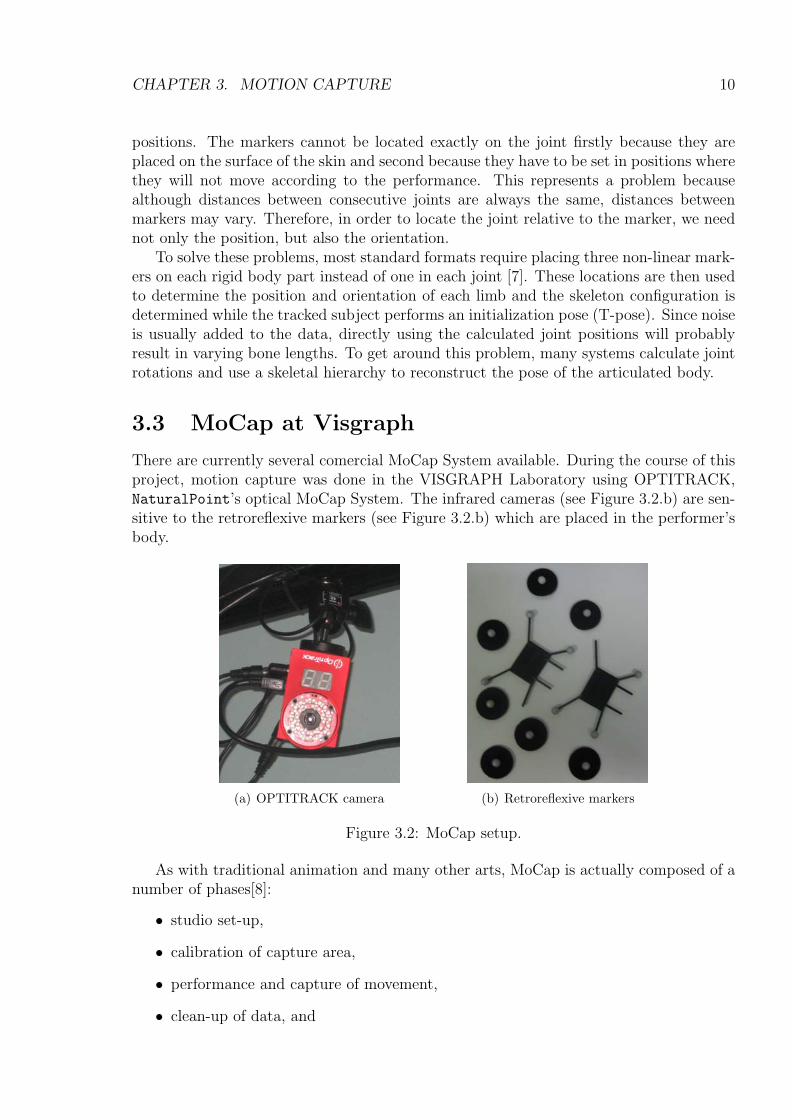
There are currently several comercial MoCap System available. During the course of thisproject, motion capture was done in the VISGRAPH Laboratory using OPTITRACK,NaturalPoint’s optical MoCap System. The infrared cameras (see Figure 3.2.b) are sen-sitive to the retroreflexive markers (see Figure 3.2.b) which are placed in the performer’sbody.
(a) OPTITRACK camera (b) Retroreflexive markers
Figure 3.2: MoCap setup.
As with traditional animation and many other arts, MoCap is actually composed of anumber of phases[8]:
• studio set-up,
• calibration of capture area,
• performance and capture of movement,
• clean-up of data, and

CHAPTER 3. MOTION CAPTURE 11
• post-processing of data.
The studio was set up with six cameras, as shown in Figure 3.3. Tracking a largenumber of performers or expanding the capture area is accomplished by the additionof more cameras. Since each marker must be“seen” by at least two cameras, a greaternumber of cameras diminishes the possibility of occlusions.
Figure 3.3: OPTITRACK cameras set up at the Visgraf Laboratory.
Camera calibration was done with the help of OPTITRACK’s software, AREA. Thissoftware also specifies the postion of the markers in the performer’s body (see Figure 3.4).
Figure 3.4: Dancer performing at the VISGRAPH Laboratory
The ARENA software (see Figure 3.5 ) was also used to process the acquired data.The first processing step is to trajectorize the data. This procedure takes the 2D datafrom each individual camera and changes it to a fully 3D path of each individual marker.

CHAPTER 3. MOTION CAPTURE 12
Figure 3.5: The ARENA software.
After this procedure the software allows for post capture editing (such as filling gaps,fixing swaps and smoothing tracks) and exporting a file in a BVH or C3D format.
In this project, we used the BVH file format, which was originally developed by Biovi-sion, a motion capture services company, as a way to provide motion capture data to theircustomers. Nowadays, it is widely used, and many applications support importing andexporting files in this format. It consists of two parts, a header section which describes thehierarchy and initial pose of the skeleton, and a data section which contains the motiondata. For a more detailed description of the BVH file format, see Appendix A.

Chapter 4
Animation
4.1 Introduction
In the previous chapter we discussed Motion Capture and its applications to characteranimation. Though the technique is very powerful in the sense that it allows renderingnatural and realistic motion, MoCap by itself is nothing more than a method for repro-ducing acquired movements. Therefore, much effort has been, and is currently being, putinto extending the applications of MoCap data.
There are many reasons that make editing captured motion extremely important.Firstly, it is usually necessary to eliminate artifacts generated during acquisition. Sec-ondly, it is important to match time and space of computer generated environments,overcome spatial constraints of capture studios and allow for the existence of motionsthat would be extremely hard for an actor to perform, such as the ones used in specialeffects. Finally, it is interesting to be able to reuse motion data in different occasions. Forexample, given a walking scene, it should be possible to generate a walk on an uneventerrain or steeping over an obstacle.
In addition to editing [9, 10], it is the interest of many researches in the field tosynthesize new streams of motion from previously acquired data and, therefore, be ableto create new and more complex motions. Motion synthesis strategies include constructingmodels of human motion [11, 12], interpolating motion to create new sequences [13] andreordering motion clips employing a motion graph [14].
In this work, we use a motion graph to create a new motion stream from previouslyacquired data. We introduced a couple of restricted to this graph, so it could used as atool to guide the concatenation of musical phrases for the composition of a new song.
In the next section we describe how a motion graph is built and in section 4.3 wediscuss the choreo.graph, a measure-synchronous motion graph which was implement forthe purpose of this project.
4.2 Motion Graphs
Motion graphs were introduced in [14], in order to encapsulate connections among adatabase. In this graph, edges correspond to motion clips (sequence of frames) and nodesto choice points (specific frames) connecting these clips. After selecting the similar frames,
13
CHAPTER 4. ANIMATION 14
or windows of frames, and creating the graph connections, a walk along the graph allowsus to re-assemble the captured clips, creating new motion.
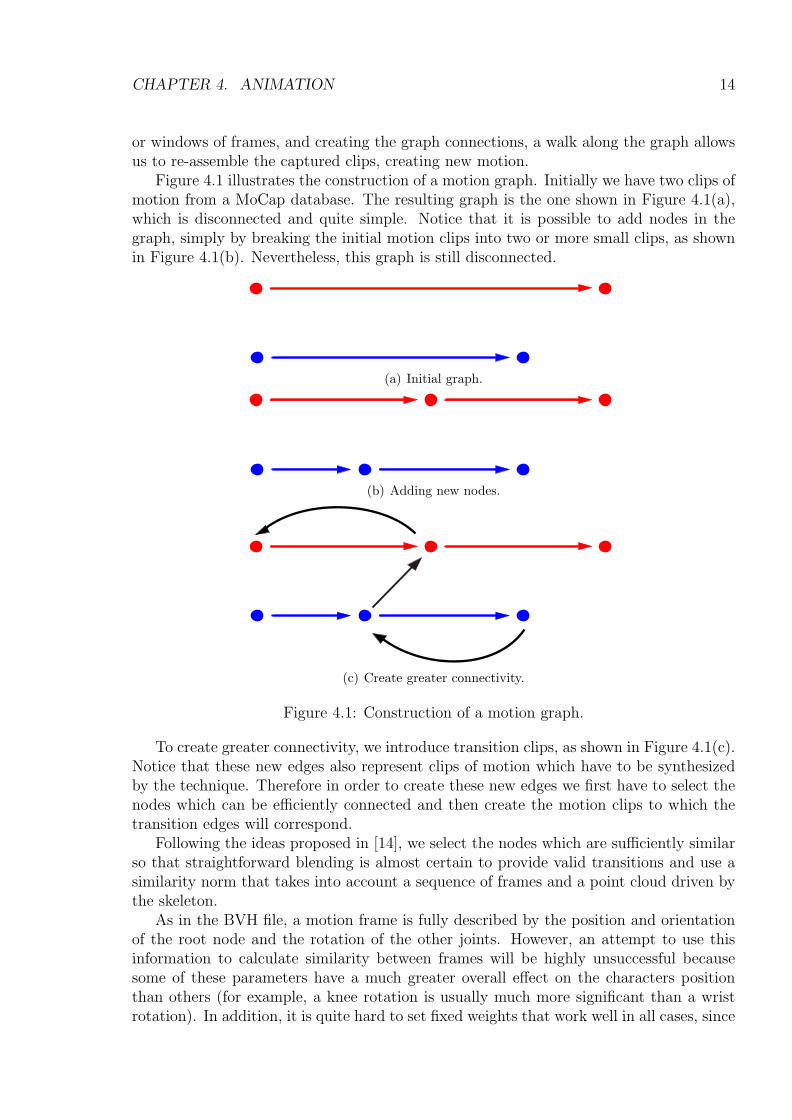
Figure 4.1 illustrates the construction of a motion graph. Initially we have two clips ofmotion from a MoCap database. The resulting graph is the one shown in Figure 4.1(a),which is disconnected and quite simple. Notice that it is possible to add nodes in thegraph, simply by breaking the initial motion clips into two or more small clips, as shownin Figure 4.1(b). Nevertheless, this graph is still disconnected.
(a) Initial graph.
(b) Adding new nodes.
(c) Create greater connectivity.
Figure 4.1: Construction of a motion graph.
To create greater connectivity, we introduce transition clips, as shown in Figure 4.1(c).Notice that these new edges also represent clips of motion which have to be synthesizedby the technique. Therefore in order to create these new edges we first have to select thenodes which can be efficiently connected and then create the motion clips to which thetransition edges will correspond.
Following the ideas proposed in [14], we select the nodes which are sufficiently similarso that straightforward blending is almost certain to provide valid transitions and use asimilarity norm that takes into account a sequence of frames and a point cloud driven bythe skeleton.
As in the BVH file, a motion frame is fully described by the position and orientationof the root node and the rotation of the other joints. However, an attempt to use thisinformation to calculate similarity between frames will be highly unsuccessful becausesome of these parameters have a much greater overall effect on the characters positionthan others (for example, a knee rotation is usually much more significant than a wristrotation). In addition, it is quite hard to set fixed weights that work well in all cases, since

CHAPTER 4. ANIMATION 15
the effect of a joint rotation on the shape of the body depends on the current configurationof the body.
(a) Similar sequence of frames.
(b) Added connection.
(c) Resulting graph.
Figure 4.2: Addition of a transition edge.
To solve this problem, we use a point cloud, which describe the skeleton pose (ideallythis point cloud is a downsampling of the mesh defining the character) and vector distancenorm. It is important to notice that a motion is fundamentally unchanged if we translateit along the floor plane or rotate it about the vertical axis. Therefore, before comparingthe distance between two point clouds we apply a rigid 2D transform to the second pointcloud that sets it at the optimal position so that weighted sum of squared distances isminimal.
In addition, it is important to consider not only the current position but also derivativeinformation, such as velocity and acceleration. We incorporate this information to thesimilarity metric by using a window of frames. This also helps the blending procedure.An example is shown in Figure 4.2. The similarity metric selects the two sequencesof frames as shown in Figure 4.2(a). Therefore we can add an edge that connects thebeginning of first sequence of frames to the end of the second one, shown in Figure 4.2(b).The resulting motion associated to this transition edge is created by blending the twosequences of frames.
Finally, after the edges are created, we prune the graph by computing the stronglyconnected components (SCCs). We use only the largest SCC so as to guarantee that thereare no dead ends, and therefore we can synthesize the motion indefinitely.
4.3 The choreo.graph
Songs are metrically organized in measures, which determine the size of the melodicphrases. Therefore, in order to preserve the size of the melodic phrases during composi-

CHAPTER 4. ANIMATION 16
tion, it is important to build a measure-synchronous motion graph.Since the performer is dancing according to a song we are able to relate melodic
phases to parts of the acquired motion (choreography phrase). Once both informationsare synchronized, we can use music metric information to segment the dancer’s movement.
A measure-synchronous motion graph is then built by observing segment boundariessimilarities. We used the similarity metric described in the previous section, but insteadof connecting the nodes which are sufficiently similar, we connect the end of each motionphrase to the five nearest segments, creating a directional weighted graph.
A restricted random walk on this graph creates a new motion. We observed thattwo restrictions are appropriate for the resulting music to resemble samba style pieces.First, musical instruments should not vary too frequently. In our implementation, thisis guaranteed by dynamically varying the weights of the graph edges during the walk.Second, it is important to observe intensity variations between large music blocks duringcomposition. We used three distinct blocks, and motion phrases were annotated accord-ingly. During motion synthesis, the user can specify the number of phrases desired foreach block and the order in which they occur.
The choreo.graph is not restrict the to the strongly connected components. Instead,the large number of connections in the graph is combined with a weighting system toprevent the walk from reaching the last phrase of each clip, which would be a dead end.
Nevertheless, it would be interesting to reach the end of the clip, since usually dancersperform a “finishing pose”. To this end, we use a restricted graph search that allowsquickly reaching the last phrase after the total number of phrases (specified by the user)has been concatenated.
The user interface was developed in C++ using QT toolkit. We also implemented aBVH file parser and a player that allows us to compare captured to rendered motion. Asshown in Figure 6.3, the interface shows where each part of the rendered motion comesfrom. The graph transitions (blended motions) are represented in black and the originalmotion clips in an increasing saturation scale of color.

CHAPTER 4. ANIMATION 17
Figure 4.3: User interface that was implemented.

Chapter 5
Modeling 3D Characters
The animation produced as explained in the last chapter was transfered to a mannequinand to a skeleton made of spheres and cylinders. This chapter explains how we did thisusing Maya.
5.1 Introduction
We can split 3D Characters into two groups, which one demanding a different modelingprocess:
Articulated Characters They are characters made of rigid bodies connected by joints.The modeling process can be done by parenting nodes that represents these bodies totheirs respective joints in a hierarchy. They are usually used to represent mechanicalobjects.
Soft characters They consists on deformable surfaces attached to skeletons. The sur-faces deforms depending on the skeletons configuration. In the modeling processthe user has to specify the influence of each joint over each point of the surface,it is usually done by using painting interfaces. They are usually used to representorganic characters.
On this project we only made use of articulated characters.There are many good references about modeling characters in Maya. A good intro-
duction can be found in [15], and more detailed explanations are given by [16] and [17].
5.2 Building the character
The first step was importing the BVH animation. It was done by using the MEL scriptbvhimport.mel written by Sergiy Migdalskiy and available in the site Highend3d.com.After doing it, a skeleton appeared allowing us to check the animation by moving thetime line (see Figure 5.1).
It would be possible to map the animation of this skeleton to a 3D model previouslymodeled. It could be done by using the Character Mapper Tool combined to the TraxEditor. But, we adopted a different solution, we modeled the character directly over thisskeleton.
18

CHAPTER 5. MODELING 3D CHARACTERS 19
Figure 5.1: The skeleton created after importing the BVH animation.
Accessing the Hypergraph Editor we could see the skeleton hierarchy exported by theArena software as shown in Figure 5.2.
Figure 5.2: The hierarchy of a character exported by Arena.
We moved the skeleton to a T-pose by setting the time line to a negative value. Then,we created the spheres and cylinders and placed them over the bones (see Figure 5.3).

CHAPTER 5. MODELING 3D CHARACTERS 20
Figure 5.3: The character made of cylinders and spheres.
After displacing the primitives over the bones, we attached them to theirs respectivejoints using the Hypergraph Editor. The result after parenting all primitives is shown inFigure 5.4.
Figure 5.4: The hierarchy of the character made of cylinders and spheres.
The mannequin was created by using a similar process. We made use of the pieces

CHAPTER 5. MODELING 3D CHARACTERS 21
from the mannequin given by the book [18]. The result is presented in the pictures 5.5and 5.6.
Figure 5.5: The geometry of the mannequin.
Figure 5.6: The hierarchy of the mannequin.
After modeling the geometry and parenting all primitives, we adjusted the surfacematerial. We chose a Blinn material, where we mapped the wood texture presented inFigure 5.7 to the Color and Bump Mapping attributes.
After adjusting the attributes of the Blinn material we achieved the final look presentedin Figure 5.8.

CHAPTER 5. MODELING 3D CHARACTERS 22
Figure 5.7: The texture used in the mannequin.
Figure 5.8: The final look of the mannequin.

Chapter 6
Rendering and Lighting
6.1 Introduction
Traditional cameras were set up to record the light so that it could be reproduced onphotographic paper, while digital cameras, on the other hand, were developed to repro-duce the light captured on a monitor. Neither displays nor photo papers can representthe entire dynamic range of illumination. However, if taken many photos with differentexposure times, these images can be combined so that the dynamic range is approximatelyrecovered. With this technique, a series of images can be combined into a single imagewith high dynamic range (HDR), called radiance map.
Because HDR images store the full range of light reaching a point in space, theycontain information about the shape, color and intensity of direct light sources, as well asthe color and distribution of the indirect lighting surfaces from the rest of the scene. Usingappropriate rendering algorithms, and sampling techniques, we can efficiently use HDRto accurately simulate how objects and environments would be if they were illuminatedby light from the real world. This process of using images as light sources is calledimage-based lighting (IBL), and was introduced by Paul Debevec [19].
The first step in working with lighting by artificial lighting scenes taken from a realenvironment, is to store the illumination of the real environment. One way of doing thisis by obtaining an omnidirectional, high dynamic range image that records the incidentillumination conditions at a particular point in space. An image with this features iscalled of Light Probe.
6.2 Making a Light Probe
There are several techniques for mounting a Light Probe. In this paper we choose one ofthese forms and further proceed to explain the process followed in the construction of theLight Probe.
The selected method
One method for obtaining a Light Probe is to take a high-dynamic range image of amirrored ball. Assuming an orthogonal camera, then in theory a single photograph of the
23

CHAPTER 6. RENDERING AND LIGHTING 24
mirrored ball can see in all directions, such as in figure 6.1. That is, anything visible fromthe viewpoint of the mirrored ball will be visible to the camera as a reflection in the ball.
(a)
Figure 6.1: How the rays of the world are reflected into mirrored ball assuming an ortho-graphic camera. The blue rays are the reflections of the green scene rays.
Unfortunately, things that are reflected near the edge of the ball will become extremelystretched and distorted, giving a poor image when it is unwarped. Additionally, in thecenter of the ball will be a reflection of the camera used to take the photograph, whichwill obscure some of the background.
To alleviate these problems, we can take two pictures of the mirrored sphere fromdifferent angles and blend them together to remove the camera and the regions of poorsampling.
Since the two bad spots in the mirrored ball are directly towards the camera, anddirectly away from the camera, the two pictures should be taken from positions 90◦ apartfrom each other. This way the regions of bad sampling and camera interference will be indifferent locations in the two images. (Note that taking the images from opposite sidesof the ball will not work, as the region of bad sampling in one image will be the locationof the camera in the other image, and vice versa.)
In our case we use only one point of view to get the HDR image. The camera was placedso that it does not obstruct any light source, the poor sampling region is a black curtainand the map will be used only to illuminate an object that does not contain mirroredreflections. The previous method is recommended in scenes containing several objectswith interreflections, where any problem on the map will be seen in these reflections.
Taking LDR Photos and assembling the HDR image
Since we need an HDR image of the mirrored ball, we should proceed according to Debevecand Malik [20], building an HDR image from a series of LDR photos, by reconstructingthe response curve. The used camera is not orthogonal, but placing it at a distance about1.5m and zooming it we can obtain an very small angle of view (fov) approaching anorthogonal projection (figure 6.2). We took care to place the camera in a position thatdoes not obstruct the reflection of none light in mirrored ball and the lights stay in thecentral area of the ball, where the sampling is better. In the peripheral zone of the ball

CHAPTER 6. RENDERING AND LIGHTING 25
was a reflection of the black curtain background. Thus it was only enough to take photoswith a single camera position.
(a)
Figure 6.2: The relative position of the camera an mirrored ball.
First, with the camera fixed on the tripod took several photos of the mirrored ballusing a fixed aperture ( F8.0 ) and varying the exposure time (doubling the time betweeneach exhibition from 1/500Sec to 15Sec). We used 14 photographs for construc the map.(figure 6.4(b)).
After the photos were taken, the next step is construct an HDR image with them,using Pfstools package. Opening the Qtpfsgui graphical interface and clicking on “NewHdr...”it will open a window where we click it on “load images”and select the 14 imagesof the pictures we took. The program will load the pictures and automatically fill in valuesfor the exhibition EV of each image (figure 6.3(a)). This still can be edited by the user ifhe deems it necessary. Then we click on “next”and move to another screen (figure 6.3(b))where it is possible to align the images to eliminate possible tripod and camera movementsduring the series of photographs. Completed the alignment clicking on “next”to pass tothe next stage.
This is the last window (figure 6.4(a)), where we choose the function of weights, themodel of response curve and HDR model construction desired. Made the choice we click in“finish”and return to the main window where will appear the HDR image resulting fromthe process. Finally keep this file in .hdr format to continue editions in other software.
Crop the Mirrored Ball of the result HDR image
The next step is to crop the result HDR image to the very edge of the mirrored ball:First make sure that the “Circle”option is checked. This can be found in the Select
menu under Draw Options. Checking this will draw an ellipse inscribed in your selectionrectangle, which can be useful for matching up the edge of the mirrored ball with yourselection.
If the mirrored ball goes off some of the edges in your photograph, make sure that the“Restrict Selection to Image”option is unchecked. This can be found in the Selectmenu under Select Options. Unchecking this will allow the selection tool to select regionsoutside the bounds of the image.
Select the region around the mirrored ball, and adjust it until the circle borders theedge of the ball (figure 6.5(a)). It should look something like the image below.

CHAPTER 6. RENDERING AND LIGHTING 26
(a) (b)
Figure 6.3: (a) Select the mirror ball with the circle option cheked in the crop tool,(a)The panoramic transformation window, used to transform from the Mirrored Ball formatto Latitude/Longitude format.
(a) (b)
Figure 6.4: (a) Select the mirror ball with the circle option cheked in the crop tool,(b)TheHDR image of mirrored ball assembled with the 14 LDR photos of the left and right side.
When you have the circle lined up, crop the image using the Crop command in theImage menu.
Apply the mirrored to latitude-longitude transform
Finally, when we have the crop of the mirrored ball, we transfomer it to latitude-longitudeformat. We chose the menu “Image”→“Panorama”→“Panoramic Transformations”willopen a window like the figure 6.5(b) where we put the desired transformation, of “MirroredBall”to “Latitude/Longitude”and clicking on “ok”. Thus we get a new image in thedesired format (Figure 6.6(b)).

CHAPTER 6. RENDERING AND LIGHTING 27
(a) (b)
Figure 6.5: (a) Select the mirror ball with the circle option cheked in the crop tool,(b)The panoramic transformation window, used to transform from the Mirrored Ball formatto Latitude/Longitude format.
(a) (b)
Figure 6.6: (a) The Light Probe in mirrored format, (b) The Light Probe in Latitude-Longitude format.
Calibrating Sphere reflectivity
We should note that the materials commomly used in mirrored spheres can’t reflect the100% of incident illumination, so the ball used has a coefficient of reflection that we mustcalculate to correct the obtained illumination map.
To calculate the reflection coefficient of the mirrored ball and fix the map we followthese steps:
• We set a patch on a sheet of white diffuse paper and put it near the mirrored sphere.So we took a picture that contains both the paper and the sphere (figure 6.7).
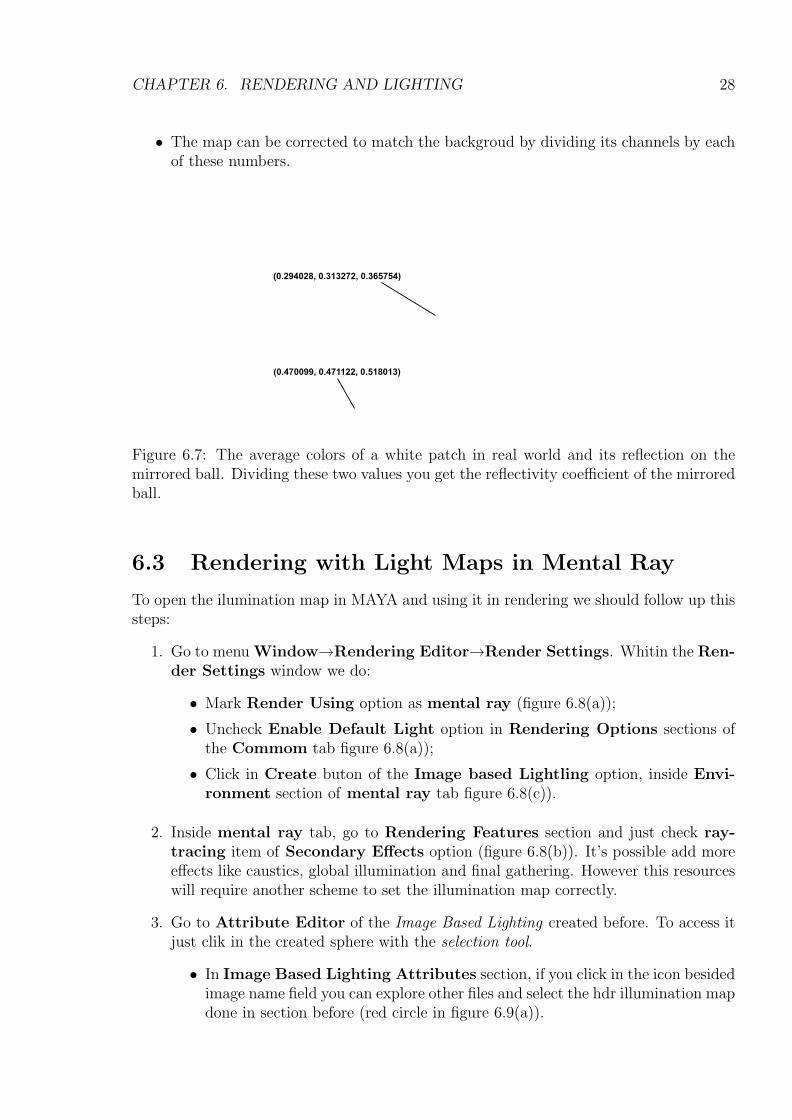
• We can thus divide the average pixel value of the patch in the reflection by theaverage pixel value in the direct view to obtain the coefficient of reflection in eachcolor channel. In our case the result is (0.625460, 0.664949, 0.706071).
CHAPTER 6. RENDERING AND LIGHTING 28
• The map can be corrected to match the backgroud by dividing its channels by eachof these numbers.
(0.470099, 0.471122, 0.518013)
(0.294028, 0.313272, 0.365754)
Figure 6.7: The average colors of a white patch in real world and its reflection on themirrored ball. Dividing these two values you get the reflectivity coefficient of the mirroredball.
6.3 Rendering with Light Maps in Mental Ray
To open the ilumination map in MAYA and using it in rendering we should follow up thissteps:
1. Go to menu Window→Rendering Editor→Render Settings. Whitin the Ren-der Settings window we do:
• Mark Render Using option as mental ray (figure 6.8(a));
• Uncheck Enable Default Light option in Rendering Options sections ofthe Commom tab figure 6.8(a));
• Click in Create buton of the Image based Lightling option, inside Envi-ronment section of mental ray tab figure 6.8(c)).
2. Inside mental ray tab, go to Rendering Features section and just check ray-tracing item of Secondary Effects option (figure 6.8(b)). It’s possible add moreeffects like caustics, global illumination and final gathering. However this resourceswill require another scheme to set the illumination map correctly.
3. Go to Attribute Editor of the Image Based Lighting created before. To access itjust clik in the created sphere with the selection tool.
• In Image Based Lighting Attributes section, if you click in the icon besidedimage name field you can explore other files and select the hdr illumination mapdone in section before (red circle in figure 6.9(a)).

CHAPTER 6. RENDERING AND LIGHTING 29
(a) (b) (c)
Figure 6.8: The Render Settings menu.
(a) (b)
Figure 6.9: The Attribute Editor of the Image Based Lighting.
• If it’s necessary you can adjust the map Gain in Color Gain option. Clickingin the white rectangle you will open the Chooser Color in wich we can choosethe color and the gain intesity (green X in figure 6.9(a)). Usually we willmaintain white color and just change it intensity, which can be done changingthe parameter V value (if the color chooser is set as HSV).
• In Light Emission section, check the Emit Light item (figure 6.9(b)). The Qual-ity U and Quality V attributes set the size of a control texture that generatesthe virtual lights. For each pixel of the ocntrol texture, one light is creted. Tomake the render feasible, the Samples attribute places a cap of the number oflights used. The first Samples field determines the minimum number of lightsgenerated. The second Samples field determines the maximum number of ad-ditional lights that are randomly added to make the lighting less regular. Toset these parameters you must consider the desired quality and rendering time.

Chapter 7
Camera Calibration
Camera calibration techniques are methods used for finding the intrinsic and extrinsicparameters of cameras. These methods are very important whenever we intend to su-perimpose synthetic images over real ones in a realistic way. It holds because the effectapplied by the camera model used in the rendering process must correspond to the effectapplied by the real camera.
7.1 Introduction
There are two types of methods for calibrating cameras:
• Methods that use correspondences of 3D points to 2D points,
• Methods that use correspondences between 2D points.
The first type uses some kind of 3D pattern, which have markers placed in knownpositions. Correspondences between these markers and theirs 2D projections over animage are established. Then the method finds a camera model defined relatively to the3D pattern.
This is a good choice if we want to superimpose a 3D model over a single frame. Inthis case we take two pictures without moving the camera. One picture must show the3D pattern in order to be used by the calibration method, the other one does not showthe pattern, this is the picture that is superimposed by the 3D model (see Figure 7.1).
Figure 7.1: (a) The picture of a scene showing a 3D planar pattern, (b) the scene afterremoving the 3D pattern, (c) a 3D model superimposed to the scene.
30

CHAPTER 7. CAMERA CALIBRATION 31
The second type is more sophisticated. Correspondences are established betweenprojections of static points over many images using image processing techniques. Thenthe method finds a camera model associated to each image. It is good because no patternis needed, but the absence of 3D markers implies that the correspondence of points caneasily fail. Thus, robust techniques must be added to the process. This process is calledMatchmove by 3d artists. We will not talk about them here, examples of algorithms thatdo it can be found in [21] and [22].
7.2 Calibration Techniques
There are different algorithms for solving calibration problems based on 3D patterns. Themost important are:
Tsai’s Algorithm The Tsai’s algorithm makes use of a single planar pattern, usuallya checkerboard. It is the algorithm used in the Figure 7.1. It is a simple algorithm, but itdoes not allow us to find all camera parameters. It cannot find the aspect ratio of pixelsneither the principal point. In general it is not a big trouble since we usually assumethat pixels are squared and the principal point is placed in the center of the image. Animplementation of it can be found in http://www.cs.cmu.edu/~rgw/TsaiCode.html.
DLT Algorithm The Direct Linear Transformation algorithm solves the problem ofcalibrating cameras using correspondences of 3D known points to theirs respective pro-jections. Compared to the previous algorithm it consider 3D points in a more unbiasedform, since they do not have to be placed over a plane. Another advantage is the factthat it can find all the camera parameters. The disadvantage to Tsai’s algorithm is thefact that it needs a non planar pattern, what is in general more difficult to be built withgood precision. Details of this algorithm can be found in [23].
Zhang’s Algorithm The Zhang’s algorithm makes use of a planar pattern that isphotographed from many different poses. Like Tsai’s algorithm checkerboards are usuallyused. It combines two good properties from the previous methods. It uses a planarpattern, what is easily built, and the 3D markers are not placed over a plane , whatmakes the calibration unbiased. An implementation is available in http://www.vision.
caltech.edu/bouguetj/calib_doc/index.html.
7.3 Calibration and MoCap
In this project we faced a very specific calibration problem. We needed to superimposea 3D character over the image of a dancer whose movements were being used to animatethis character (see Fig 7.2). The solution for this problem is calibrating the camera inthe same reference used by the MoCap system.
The first idea that we had was placing markers over a checkerboard and combine thevalues of rotation and translation given by the MoCap system with the camera parametersestimated by Tsai’s or Zhang’s algorithm. It would have been complicated, and we were

CHAPTER 7. CAMERA CALIBRATION 32
Figure 7.2: 3D characters superimposed to the the dancer.
not completely confident that we were able to interpret the information of translation androtation given by the Arena software exactly.
We decided to solve it in a more direct way. We took many pictures showing markersused by the MoCap system (see Figure 7.3). For each pose we registered those 3D coor-dinates given by the MoCap system. After that, we registered the 2D coordinates of eachmarker using an ordinary image editor. Then we used the DLT algorithm to calibrate thecamera using the 3D-2D correspondences established.
Figure 7.3: Each picture shows three different markers used by the calibration algorithm.
After performing the DLT algorithm we found that the camera is K[R|t] where:
K =
−2186 0 9460 2191 5010 0 1
, (7.1)
R =
−0.006 −0.028 0.999−0.091 0.995 0.027−0.995 −0.091 −0.009
(7.2)
andt =
(−8.660 −79.719 403.274
)T. (7.3)
The extrinsic parameters can be calculated by:
CameraCenter = −RT t =(
394.214 115.940 14.594)T
, (7.4)

CHAPTER 7. CAMERA CALIBRATION 33
V iewDirection = RT (0, 0, 1)T =(−0.995 −0.091 −0.009
)T(7.5)
andV iewUp = RT (0, 1, 0)T =
(−0.091 0.995 0.027
)T. (7.6)
We can set all these parameters in Maya using the following MEL command:
viewPlace -eye 394.214 115.940 14.594 -viewDirection -0.995 -0.091 -0.009
-up -0.091 0.995 0.027;
After setting the position and orientation, we must set the intrinsic parameters. It canbe done by changing the attributes of cameraShape. We must adjust the Focal Length,the Camera Aperture and the Film Translate parameters ( see Figure 7.4).
Figure 7.4: CameraShape attributes. Focal Length, Camera Aperture and Film Translateare marked.
The Focal Length and the Camera Aperture are related, if we multiply both by thesame scalar factor the result is an equivalent camera. This fact is very important becauseMaya only accepts focal lengths from 2.5” to 3500”. Thus we must choose a factor thatgive us an acceptable value. Another issue is that the Focal Length is specified in inches,but the Camera Aperture field is specified in mm. The expressions to calculate them are:
FocalLength = −25.4×K11 × ScaleFactor
HorizontalCameraAperture = ResX × ScaleFactor

CHAPTER 7. CAMERA CALIBRATION 34
V erticalCameraAperture = ResY × ScaleFactor
,where K is the matrix of intrinsic parameters and ResX and ResY are the horizontal andvertical image resolution respectively.
In our example we chose 0,01 as the scalar factor, what results in:
FocalLength = 555.41′′
HorizontalCameraAperture = 19.2mm
V erticalCameraAperture = 10.8mm.
Film Translate is the parameter that encodes the principal point coordinates. Theyare the coordinates measured in pixels of the point where the view direction crosses theimage plane. Maya assumes, as default, that the principal point is placed in the middleof the image, in the case of an image with resolution 1920× 1080 it would be (950, 540)T .On the other hand, we can read the principal point associated to our camera reading thetwo top right values of the matrix K in 7.1, which give us (946, 501)T . The differencebetween the calibrated coordinates and the center of the image must be encoded in theFilm Translate parameter. The following expressions adjust the values to what Mayaexpects:
HorizontalF ilmTranslate =(ResX/2−K13)
ResX/2
V erticalF ilmTranslate =(ResY/2−K23)
ResX/2
Considering our example it results in:
HorizontalF ilmTranslate = 0.014
V erticalF ilmTranslate = 0.040
After setting all the parameters we can check if the camera is correct. Looking throwthe camera, the projection of 3D points whose vertices had been used by the calibrationprocess must match the image of these points in a image plane assigned to the camera(see Figure 7.5).
Figure 7.5: The 2D projections of 3D points match the projection in the picture used asimage plane.

Chapter 8
Music
In this chapter we will describe the motion scoring procedure, ie, the pipeline for musiccomposition. There are five steps:
1. Some songs are composed.
2. A dancer performs listening to the songs, and the dance is captured.
3. A graph of the dancer’s motion (coreo.graph) is built.
4. A new motion is synthesized by random-walking on the coreo.graph.
5. A new song, based on the walk on the graph, is composed.
8.1 Automatic Composition
We have chose to compose songs in the brazilian samba style, specially because of itssimplicity regarding the number os musical instruments to use and the complexity ofimplementing tracks for them. Essentially, we need just an instrument for each one ofthe percussion, harmony and melody categories. In samba, cavaquinho and pandeiro(in english, tambourine) are classically used for harmony and percussion, respectively.Regarding melody, there is the cavaquinho, the flute, the mandolin and other choices(like the human voice, for instance).
As everything else in music, there is no rigorous rule for composing a samba song,and in fact we are not experts in the subject. That said, given the human build-incapability to produce music, some knowledge we have about music theory and a littlebit of previous experience we brought from other styles, it’s not too difficult to becomecapable of composing samba songs after hearing a couple of samples, talking to a friendwhich likes samba and, of course, taking some video lessons on YouTube.
We have composed three music pieces to be performed by the dancer. Each music isorganized in a 4-levels multi-resolution structure, consisting of cycles, bars (measures),beats and clocks : 16 bars per cycle, 2 beats per bar and 12 clocks per beat.
For each song we have varied the melodic instrument, using the flute, the cavaquinhoand the clarinet. All songs were composed to have 3 cycles, the second (resp. first) beingthe more (resp. the less) musically intense. “Intensity” of a song is a highly subjective
35

CHAPTER 8. MUSIC 36
concept, but we can simulate it reasonably by putting intensity in direct proportion withthe number of notes per bar which are played. The presence or not of a percussioninstrument affects music intensity as well.
Drum loops (ie, pandeiro loops) were composed manually, as well as cavaquinho loops.We have chosen to use G, E7, Am, D7 as the chord progression. The melody is organizedin phrases, each phrase extending a bar (measure). Notes for each phrase are not pickedmanually. Instead, we specify just the number of notes that must be played for each oneof the (two) beats of the phrase.
Beats can be filled with 0, 1, 2, 3, 4 or 6 equally spaced notes, what explains whywe are using 12 clocks as the resolution for the beat. This way, composing for a phrasemeans calling a functions saying something like:
fill beat 1 with m notes,fill beat 2 with n notes.
In fact sometimes another slightly different method is called:
fill beat j with m notes, the first note being of type x.
The type of the note has to do with the current chord being played, but we will notget into the details (which are related to music theory concepts). This extra restrictionis usually observed in the first beat of the measure, because, in our implementation, thatis when the chord of the harmony is changing (there is a chord change every new bar).
In the particular implementation used for this project, for the
fill beat j with m notes
method the new note is simply one step above or bellow the chosen musical scale (which,by the way, is the diatonic major), while for the method
fill beat j with m notes, the first note being of type x
the algorithm skips up or down the scale until a note which “sounds good” with thecurrent chord is reached.
If the algorithm will search for a note up or down the scale is a matter of
• a random sample taken from a uniform distribution in the interval [0, 1] being greateror smaller than 1/2 and
• a note in the chosen direction being available.
Notes are confined in a 4 × 9 grid, as shown in Figure 8.1. The distribution of thediatonic scale notes in the grid are described in [24].
Since in the grid the same musical note can be associated with more than one point,the algorithm decides which point to use by, again, tossing a fair coin.

CHAPTER 8. MUSIC 37
Figure 8.1: Grid of notes for the automatic composition. Gray filled circles representscale-root notes.
8.2 Motion Scoring
After the songs are composed, the dancer performs listening to them. As mentionedin Chapter 4, the captured motion of the dancer is segmented according to the lengthof a musical phrase, which is equal to the length of a measure (bar), as described in theprevious section. That is why the motion graph so built is said to be measure-synchronous.Once a new dance is obtained by random-walking on such a graph (the choreo.graph), thenext step is to compose the music score for it.
Let us suppose that we have constructed a new dance consisting of 4 segments,
(c1|s4), (c3|s12), (c3|s13), (c2|s10),
where (cI|sJ) means the segment J of clip (song) I. Now let us say that (c1|s4) wascomposed using the high-level command:
fill beat 1 with 4 notes, the first note being of type x
fill beat 2 with 2 notes
and that the tambourine was omitted in that phrase. Then the first phrase of the scorefor the re-synthesized dance will be composed the same way: the first beat will be filledwith 4 notes, the first of which being of type x, the second beat will be filled with 2 notes,and the percussion will be omitted.
The chord progression can be set manually, or we can simply use the same sequenceof chords for the pre-dance songs and for the re-synthesized dance.

Chapter 9
Motion Graphics
The graphics in the video were created for the opening title sequence and to annotate thelive perfomance clip as well as the cg animation generated by the dance graph.
9.1 Opening Title
Figure 9.1: Opening Title
The opening title, shown in Figure 9.1, was produced using the Live Type software,part of the Final Cut Studio, from Apple.
38

CHAPTER 9. MOTION GRAPHICS 39
9.2 Live Action Clip
The live action dance performance in the first part of the video was annotated withsuperimposed graphical elements created with the program After Effects, from Adobe.(See Figure 9.2)
Figure 9.2: Live Performance Annotations.
9.3 Dance Graph
The computer generated animation in the second part of the video was annotated with agraphical layer that showed the progression of the dance graph. This effect was generatedby a custom program developed using the Apple Quartz graphics. (See Figure 9.3)
Figure 9.3: Dance Graph Annotations.

Appendix A
BVH File Format
In this Appendix We will describe the BVH file format by means of a simple example.Consider the following BVH file:
HIERARCHY
ROOT A
{
OFFSET 0.000000 0.000000 0.000000
CHANNELS 6 Xposition Yposition Zposition Zrotation Xrotation Yrotation
JOINT B
{
OFFSET 10.000000 0.000000 0.000000
CHANNELS 3 Zrotation Xrotation Yrotation
End Site
{
OFFSET 0.000000 -20.000000 0.000000
}
}
}
MOTION
Frames: 3
Frame Time: 0.040000
30.0 80.0 20.0 0.0 0.0 0.0 0.0 0.0 0.0
30.0 80.0 20.0 60.0 0.0 0.0 0.0 0.0 0.0
30.0 80.0 20.0 60.0 0.0 0.0 -30.0 0.0 0.0
The first part of the file describes the skeleton, which has a root node A, a joint B andand ending node C, as illustrated in Figure A.1. Notice that the the distance betweenthe nodes are given by the offsets described in the file. In this example OA = [0 0 0],OB = [10 0 0], and OC = [0 − 20 0].
This part of the file also details the channels associated to each node and thereforeindicates the size of the motion data and what is the information of each entry of themotion vector. In this case, node A has 6 channels and node B, 3 channels. This means
40

APPENDIX A. BVH FILE FORMAT 41
A B
C
(0,0,0) (10,0,0)
(10,0,-20)
Figure A.1: Articulated body.
that the motion data (second part of the file) will be a series of vectors of size 9, eachcorresponding to a single frame.
Consider, for example, the third frame (third line of the file after MOTION). The firstthree components are the translation of node A (TA = [30 80 20]), the second three arethe rotations associated to this node, RA, and the last three are the rotations associatedto node B, RB. Notice that the order of rotations are given in the first part of the file. Inthis example we first rotate 60o around the z axis, than 0o around the x axis, and, finally,the 0o around the y axis. Therefore, R = RyRxRz.
Finally, we calculate the position of each node using the following equations:A = OA + TA
B = A + ObRA
C = B + OcRBRA
Figure A.2 illustrates the arm position in frames 2 and 3.
B (35,20,88.66)
C (52.32,20,78.66)
A (30,20,80)
(a) Frame 2
C (10,0,-20)
B (10,0,0)
A (30,20,80)
(b) Frame 3
Figure A.2: Articulated body motion.

Bibliography
[1] Chris Bregler. Motion capture technology for entertainment [in the spotlight]. SignalProcessing Magazine, IEEE, 24(6):160–158, November 2007.
[2] Jessica Hodgins and Zoran Popovic. Animating Humans by Combining Simulationand Motion Capture. SIGGRAPH’00 Course Notes 33, SIGGRAPH-ACM publica-tion, New Orleans, Louisiana, USA, July 2000.
[3] Michael Gleicher. Animation from observation: Motion capture and motion editing.SIGGRAPH Comput. Graph., 33(4):51–54, 2000.
[4] Jessica Hodgins. Animating human motion. Scientific American, 278(3), March1998.
[5] Charlotte Belland, James W. Davis, Michael Gleicher, and Barbara Helfer. Mo-tion Capture: Pipeline, Applications, and Use. SIGGRAPH’02 Course Notes 28,SIGGRAPH-ACM publication, San Antonio, Texas, USA, July 2002.
[6] Rick Parent. Computer animation: algorithms and techniques. Morgan KaufmannPublishers Inc., San Francisco, CA, USA, 2002.
[7] Margaret S. Geroch. Motion capture for the rest of us. J. Comput. Small Coll.,19(3):157–164, 2004.
[8] Maureen Furniss. Motion Capture. MIT Communications Forum,http://web.mit.edu/comm-forum/papers/furniss.html.
[9] Andrew Witkin and Zoran Popovic. Motion warping. In SIGGRAPH ’95: Proceed-ings of the 22nd annual conference on Computer graphics and interactive techniques,pages 105–108, New York, NY, USA, 1995. ACM.
[10] Armin Bruderlin and Lance Williams. Motion signal processing. In SIGGRAPH ’95:Proceedings of the 22nd annual conference on Computer graphics and interactivetechniques, pages 97–104, New York, NY, USA, 1995. ACM.
[11] Yan Li, Tianshu Wang, and Heung-Yeung Shum. Motion texture: a two-level sta-tistical model for character motion synthesis. In SIGGRAPH ’02: Proceedings ofthe 29th annual conference on Computer graphics and interactive techniques, pages465–472, New York, NY, USA, 2002. ACM.
42

BIBLIOGRAPHY 43
[12] Matthew Brand and Aaron Hertzmann. Style machines. In SIGGRAPH ’00: Proceed-ings of the 27th annual conference on Computer graphics and interactive techniques,pages 183–192, New York, NY, USA, 2000. ACM Press/Addison-Wesley PublishingCo.
[13] Lucas Kovar and Michael Gleicher. Automated extraction and parameterization ofmotions in large data sets. ACM Trans. Graph., 23(3):559–568, 2004.
[14] Lucas Kovar, Michael Gleicher, and Frederic Pighin. Motion graphs. In SIGGRAPH’02: Proceedings of the 29th annual conference on Computer graphics and interactivetechniques, pages 473–482, New York, NY, USA, 2002. ACM.
[15] Autodesk Maya Press. Getting Started with Maya 7. 2005.
[16] Autodesk Maya Press. Learning Autodesk Maya 2009 The Modeling & AnimationHandbook: Official Autodesk Training Guide (Autodesk Maya Techniques Offical Au-todesk Training Guides). SYBEX Inc., Alameda, CA, USA, 2008.
[17] Eric Allen and Kelly L. Murdock. Body Language: Advanced 3D Character Rigging.SYBEX Inc., Alameda, CA, USA, 2008.
[18] Lee Lanier. ADVANCED MAYA - TEXTURING AND LIGHTING 2nd Edition.SYBEX Inc., Alameda, CA, USA, 2008.
[19] Paul Debevec. Rendering synthetic objects into real scenes: Bridging traditional andimage-based graphics with global illumination and high dynamic range photography.In SIGGRAPH, pages 189–198, 1998.
[20] Paul Debevec and Jitendra Malik. Recovering high dynamic range radiance mapsfrom photographs. In SIGGRAPH, pages 369–378, 1997.
[21] Bruno Madeira, Luiz Velho, and Paulo Cezar Carvalho. Calibracao robusta de videopara realidade aumentada. In Proceedings of IX Symposium on Virtual and Aug-mented Reality. SBC, 2007.
[22] J. Cook T.L.J. Howard R. J. Hubbold S. Gibson and D. Oram. Accurate cameracalibration for off-line, video-based augmented reality. In International Symposiumon Mixed and Augmented Reality (ISMAR 2002). IEEE and ACM, 2002.
[23] R. I. Hartley and A. Zisserman. Multiple View Geometry in Computer Vision. Cam-bridge University Press, ISBN: 0521540518, second edition, 2004.
[24] Marcelo Cicconet, Tertuliano Franco, and Paulo Cezar Carvalho. Plane tessellationwith musical scale tiles and bidimensional automatic composition. In InternationalComputer Music Conference, 2010.