technical requirements for the fortification of edible oils in … · 2014-06-03 · i | p a g e...
TRANSCRIPT

i | P a g e
Technical Requirements for the Fortification of Edible Oils in Ethiopia Training Manual Jennifer Head Institute of International Education (Fulbright Program) Besufekad Getachew Mekelle University 2014

ii

iii
Table of Contents
List of Tables ............................................................................................................................. vii
List of Figures .......................................................................................................................... viii
Abbreviations ............................................................................................................................. ix
Glossary ....................................................................................................................................... x
Acknowledgements ................................................................................................................... xii
Foreword .................................................................................................................................. xiv
Chapter 1: ........................................................................................................................................ 1
Introduction ..................................................................................................................................... 1
1.1 Background ........................................................................................................................... 2
1.2 The Situation in Ethiopia....................................................................................................... 3
1.2.1 Vitamin A Deficiency ..................................................................................................... 4
1.2.2 Vitamin D Deficiency ..................................................................................................... 5
1.2.3 Iron Deficiency Anemia ................................................................................................. 6
1.2.4 Zinc and Folic Acid Deficiencies .................................................................................. 6
1.2.5 Iodine Deficiency Disorder ............................................................................................ 7
1.2.6 Government Response .................................................................................................... 7
1.3 Choosing the Proper Food Vehicle ....................................................................................... 8
1.4 Why Fortify Oil? ................................................................................................................... 9
Chapter 2: ...................................................................................................................................... 11
Regulatory Framework ................................................................................................................. 11
Chapter 3: ...................................................................................................................................... 14
How to Implement ........................................................................................................................ 14
3.1 Simplified Refining Process Introducing Fortification ....................................................... 15

iv
3.2 Fortification Methods .......................................................................................................... 16
3.2.1. Batch Mixing ............................................................................................................... 16
3.2.2 Continuous Mixing ....................................................................................................... 16
3.2.3. Two-Stage Mixing ....................................................................................................... 17
Chapter 4: ...................................................................................................................................... 18
Fortification Equipment and Control Options .............................................................................. 18
4.1 Dosifiers .............................................................................................................................. 19
4.1.1 Screw Feeder ................................................................................................................ 19
4.1.2 Rotating Cup Feeder ..................................................................................................... 20
4.2 Mixers and Blenders............................................................................................................ 22
4.2.1 Built in-country with manual controls .......................................................................... 22
4.2.2 Built in-country with automatic controls ...................................................................... 26
4.2.3 Other Impeller Types .................................................................................................... 26
4.2.4 International Equipment suppliers ................................................................................ 27
4.3 Food Grade Metal Requirements ........................................................................................ 28
4.3.1 Stainless Steel vs. Aluminum ....................................................................................... 28
4.3.2 Stainless Steel ............................................................................................................... 29
4.3.3 Aluminum ..................................................................................................................... 32
4.4 Additional Equipment Materials ......................................................................................... 34
4.4.1 Motors and Motor Drives ............................................................................................. 34
4.4.2 Power Transmission: Pulleys and Pulley Belts ............................................................ 35
4.4.3 Additional Supplies ...................................................................................................... 37
4.5 Mixing Tank Sizing Requirements ..................................................................................... 37
4.6 Cost Comparisons ............................................................................................................... 38
Chapter 5: ...................................................................................................................................... 39
v
Premix Options ............................................................................................................................. 39
5.1 Addition Amounts ............................................................................................................... 40
5.1.1 Calculations .................................................................................................................. 41
5.2 Cost Comparison ................................................................................................................. 43
5.3 List of Suppliers .................................................................................................................. 44
Chapter 6: ...................................................................................................................................... 47
Chemical Analysis ........................................................................................................................ 47
6.1 Qualitative Method .............................................................................................................. 48
6.2 Semi-Quantitative Method .................................................................................................. 49
6.3 Quantitative Method for Vitamin A .................................................................................... 51
6.4 Quantitative Method for Vitamin D .................................................................................... 53
6.5 Local Laboratory Suppliers ................................................................................................. 58
6.6 Rapid Testing Kits ............................................................................................................... 59
6.7 External Analysis ................................................................................................................ 60
Chapter 7: ...................................................................................................................................... 62
Packaging ...................................................................................................................................... 62
Chapter 8: ...................................................................................................................................... 64
Further Reading ............................................................................................................................ 64
Chapter 9: ...................................................................................................................................... 67
Conclusions ................................................................................................................................... 67
Appendix ....................................................................................................................................... 72
Appendix A: About vitamin and minerals .................................................................................. 1
A-1: Role of vitamin and minerals .......................................................................................... 1
A-2: Notable micronutrient levels among select subpopulations ........................................... 7
A-3: Regional and demographic data for vitamin A deficiency within Ethiopia .................... 9

vi
Appendix B: Food Fortification Programs ................................................................................ 11
B-1: Wheat Flour Fortification Programs in Sub-Saharan Africa ......................................... 11
B-2: Impact of Folic Acid Fortification ................................................................................. 12
Appendix C: Local Manufacture ............................................................................................... 13
Appendix D: Scale-Up costs of local tanks ............................................................................... 15

vii
List of Tables Table 1. Deficiency rates in Ethiopia ............................................................................................. 4
Table 2. Fortification programs in sub-Saharan Africa ................................................................ 10
Table 3. Mixing options for oil fortification ................................................................................. 16
Table 4. Parts and description of an oil mixing tank. ................................................................... 23
Table 5. Comparison of Stainless Steel and Aluminum ............................................................... 29
Table 6. Options for food grade stainless steel ............................................................................. 29
Table 7. Stainless steel treatment techniques ................................................................................ 31
Table 8. Common grades of aluminum and aluminum alloys used in food processing industries.
....................................................................................................................................................... 32
Table 9.Locally purchased motor costs ........................................................................................ 34
Table 10. Sample tank dimensions ............................................................................................... 38
Table 11. Estimated scale up costs for locally built agitation tanks ............................................. 38
Table 12. Cost Estimate of Select Fortificants ............................................................................. 43
Table 13. Cost of Select Premix Option ...................................................................................... 44
Table 14. Companies selling rapid test its for fortified oil ........................................................... 60
Appendix
Table A-1: Role of Vitamins………………………………………………………………………1
Table A-2: Role of Minerals………………………………………………………………………4
Table A-3: Tolerable Upper Intake Levels for select micronutrients………………….………….7
Table A-4: Estimated Average Requirement (EAR) for select subpopulations…………………..8
Table A-5: Regional rates of VAD …………………………………………………………….…9
Table A-6: Demographic distribution of VAD…………………………………………………..10
Table B-1: Wheat flour fortification programs in sub-Saharan Africa…………………………..11
Table B-2: Impact of Folic Acid fortification……………………………………………………12
Table C-1: Experimental results for homogeneity in locally built mixer………………………..14
Table D-1: Breakdown of estimated costs for local mixing tank manufacture………………….15

viii
List of Figures Figure 1. Bitot's spot and conjunctival xerosis ............................................................................... 5
Figure 2. Screw feeder angled and front views ............................................................................. 20
Figure 3. Example screw dimensions for screw feeder ................................................................ 20
Figure 4. Rotating cup feeder........................................................................................................ 21
Figure 5. Vertical agitation tank ................................................................................................... 22
Figure 6. Ribbing added to the stainless steel tank ....................................................................... 24
Figure 7. Schematic of vertical agitation tank . ............................................................................ 24
Figure 8. 4-blade pitched blade impeller. ..................................................................................... 25
Figure 9. Suggested dimensions for vertical agitation tank .......................................................... 25
Figure 10. Impeller Types ............................................................................................................. 26
Figure 11. The EAR-cut point method for determining feasible fortification levels .................... 41
Appendix:
Figure 12. As-built vertical mixing tank ....................................................................................... 13
Figure 13. Power transmission and inlet for built tank ................................................................. 13
Figure 14. Mixing time experimental results from locally built vertical mixer............................ 14

ix
Abbreviations
MOH Ministry of Health
EHNRI Ethiopian Health and Nutrition Research Institute
MOI Ministry of Industry
FMHACA Food, Medicine and Health Care Administration and Control Authority
GAIN Global Alliance for Improved Nutrition
MI Micronutrient Initiative
MaNHEP Maternal and Newborn Health in Ethiopia Partnership
MND Micronutrient Deficiency
VAD Vitamin A Deficiency
WHO World Health Organization
IDD Iodine Deficiency Disorder
NNP National Nutrition Program
NNS National Nutrition Strategy
RNI Recommended Nutrient Intake
SS Stainless Steel
Al Aluminum
HP Horsepower
kW Kilowatt
ETB Ethiopian Birr
USD U.S. Dollar
FAO Food and Agriculture Organization (of the United Nations)
EAR Estimated Average Requirement
RDA Recommended Daily Allowance
UL Tolerable Upper Intake Level
LC Liquid Chromatography
HPLC High Performance Liquid Chromatography

x
Glossary
Micronutrient A chemical element of substance required in trace amounts for the normal
growth and development of living organisms.
Vitamin An organic substance that is essential in minute quantities to the nutrition of
animals, especially with respect to coenzymes and metabolic processes, but
do not provide energy or serve as building units.
Mineral An inorganic substance that occurs naturally in certain foods and is needed
for good health.
Supplementation The provision of relatively large doses of micronutrients, usually in the form
of pills, capsules, or syrups.
Fortification The addition of micronutrients to processed foods.
Fortificant The vitamin or mineral added to the fortified food.
Mandatory
Fortification
Government-run program that legally obliges certain food producers to
fortify dictated foods or food groups with specified micronutrients.
Mass Fortification Fortification programs aimed at the general public by stipulating
fortification of a food commonly consumed across all sub-populations.
Targeted
Fortification
Fortification programs aimed at increasing micronutrient consumption of a
particular sub-population, such as children under 24 months or pregnant and
lactating women.
Voluntary
Fortification
The free choice of a food manufacturer to fortify its products, with or
without government encouragement.
Gear Box An enclosed system of assembled gears that transmits mechanical energy
from the motor to the agitator.
Motor Controller Devices that, via an electric connection, govern the performance of an
electric motor, from starting to stopping the motor, selecting forward or
reverse motion, selecting and regulating the speed, and protecting against
overloads and faults.
EAR cut-point
method
A method used by the WHO for estimating the concentration of a particular
fortificant that should be added to a specified food matrix.

xi
Recommended
Nutrient Intake
The daily dietary intake level necessary to meet the nutrient requirements of
almost all (i.e. 97-98%) healthy individuals within a particular age, gender,
and physiological status group.
Recommended
Daily Allowance Equivalent to the recommended nutrient intake.
Estimated
Average
Requirement
The average dietary intake level needed to meet the nutrient requirement of
healthy individuals within a certain sub-group of the population. Usually it
is about two standard deviations lower than the RNI.
Tolerable Upper
Intake Level
The highest average daily nutrient level unlikely to pose risk of adverse
health effect to almost all (97.5%) of healthy individuals in an age and sex
specific population group.
Feasible
Fortification
Level
The level of fortification that will provide the greatest number of at-risk
individuals with an adequate intake without causing an unacceptable risk of
excessive intake in other population groups.

xii
Acknowledgements
Funds for this research was provided by a Fulbright Fellowship grant awarded to Jennifer
Head by the United States Department of State and administered by the Institute of International
Education in collaboration with the Public Affairs Section of the United States Embassy in Addis
Ababa. A special thanks goes to Program Manager Jermaine Jones at the Institute for
International Education.
Technical support in the designing and manufacturing of fortification equipment was
provided by Besufekad Getachew, lecturer in the Department of Mechanical Engineering at
Mekelle University. Logistical support and collaboration came from Mitiku Gabrehiwot
Tesfaye, lecturer in the Department of Anthropology at Mekelle University. Laboratory
equipment and space for machine testing was provided by the Mekelle University Department of
Chemistry.
Credit for construction of small scale mixers and feeders for the purposes of laboratory
testing goes Abratu Maraya and Sons’ Engineering with the assistance of Brother’s Engineering
in Mekelle, Ethiopia. Further input regarding the construction of the vessels was made by
Robert Heider, adjunct professor in the Department of Energy, Environmental, and Chemical
Engineering at Washington University in St. Louis as well as Emily Lewis, Program Manager at
Patheon Pharmaceuticals in Cincinnati, Ohio.
Valuable insight into existing and successful fortification programs in Ethiopia was
provided by Zeco Ebro, General Manager at Faffa Foods, PLC in Addis Ababa; Zeratsion
Tsigaye, General Manager at Health Care Food Manufacturers in Addis Ababa; and Abiy
Kasahun, Research and Quality Assurance Manager at Hilina Enriched Foods in Addis Ababa.
Insight into existing conditions and capabilities of oil processing companies in general was
gained through interviews at Addis Modjo Edible Oil Complex, S.C.
Support from the Ethiopian Federal Government comes from Israel Haile at the Federal
Ministry of Health (MOH), Adamu Belay at the Ethiopian Health and Nutrition Research
Institute (EHNRI), Yared Nega at the Federal Ministry of Industry (MOI), and Kidane Michael

xiii
at the Ethiopian Food, Medicine and Health Care Administration and Control Authority
(FHMACA).
Finally, a thorough understanding of the extent of malnutrition in Ethiopia as well as
efforts to combat malnutrition in Ethiopia was gleaned though interviews with the Ethiopian
branch of Global Alliance for Improved Nutrition (GAIN), the Micronutrient Initiative (MI),
conversations with Dr. Jemal Heider, professor of Public Health at Addis Ababa University,
conversations with Dr. Afeworke, professor in the Department of Health Sciences at Mekelle
University, and the Maternal and Newborn Health in Ethiopia Partnership (MaNHEP).

xiv
Foreword
The purpose of this document is to provide a comprehensive overview on the dangers of
micronutrient deficiencies (MND’s) as well as the rationale behind using fortification as an
effective means of prevention. It is aimed primarily at building the technical capacities of oil
processing facilities producing on both the large and the small scale. While it addresses the
regulatory framework created by the Ethiopian Federal Ministry of Health and its partners, it can
be used as a guide for all nations who are currently fortifying or hoping to fortify.
A primary goal of this document is to inform manufacturers of the technical requirements
surrounding the implementation of a food fortification program. It addresses options for types of
equipment to be added as well as encourages ways to produce such equipment using local labor
and materials. It further discusses laboratory methods for analysis of the vitamin and mineral
concentration in the fortified food. Overall, it is hoped that this document can be used as a
manual for edible oil factories to smoothly and successfully implement their own fortification
programs according to the guidelines set by FMHACA and the MOH.

1 | P a g e
Chapter 1:
Introduction

2
1.1 Background
A diet adequate in the essential vitamins and minerals is necessary for proper growth and
development. While minute amounts are required, on the order of micrograms to milligrams a
day, deficiencies in such micronutrients may have serious consequences for reproduction,
immune system response, physical and mental growth, and energy
metabolism. In many developing nations, including Ethiopia,
malnutrition coupled with high rates of disease results in elevated
instances of micronutrient deficiencies. Micronutrient deficiencies
(MND’s) are responsible for an estimated 7.3% of the global burden
of disease. (1) The 2002 World Health Report ranked deficiencies
in iodine, iron, vitamin A, and zinc among the world’s most serious
health risk factors. (2) The roles and required amounts of each
vitamin and mineral are seen in Appendix A.
There are three main strategies to combat micronutrient deficiencies, which can and should
be used in conjunction with each other:
1. Maintenance of a balanced diet rich in essential vitamins and minerals
2. Supplementation
3. Fortification
While preferred, maintenance of a balanced diet is most difficult to attain, as it necessitates
a transformation in both the accessibility and affordability of a wide range of food products, from
cereals to fruits and vegetables to animal products. Moreover, it requires the establishment and
propagation of nutrition education programs and as well as increased marketing of micronutrient-
rich foods. Thus, for vulnerable and at risk populations, activities to promote lasting food
security should be coupled with supplementation or fortification initiatives.
Supplementation is defined as the provision of relatively large doses of micronutrients,
usually in the form of pills, capsules, or syrups. (1) It has the advantage of being the fastest way
to distribute needed amounts of vitamins and minerals to already deficient or at risk populations
and is proven to be a relatively cost effective strategy for reducing cases of MND. However, it is
Micronutrient deficiencies
are responsible for 7.3% of
the global burden of disease,
with vitamin A, iodine, iron
and zinc deficiencies being
among the most severe.

3
generally thought of as a short-term strategy to compliment a long-term solution.
Supplementation has been used widely in Ethiopia through the Health Extension Worker
Program, which provides doses of vitamin A to children under 5, folic acid to pregnant woman,
and zinc to those suffering from diarrheal disease. Because vitamin A stores in the body for 4-6
months, a single high dose of vitamin A twice a year helps reduce rates of deficiencies.
Lastly, fortification is a term used to describe the addition of
micronutrients to processed foods. Fortification has been used in the
developed nations since the 1930’s with fortification of cereals, flours,
margarine, and milk. Fortification is particularly suited to developing
countries as the cost of fortified food is less than 2% more than the cost
of unfortified food. (1) For instance, fortification of sugar with vitamin
A has been used extensively in Latin America since 1970, resulting in
the near eradication of vitamin A deficiency (VAD) in the Western
Hemisphere. Through the UN’s Global Alliance for Improved
Nutrition (GAIN), food fortification is now common in many Sub-
Saharan African countries, as shown through the flour fortification
programs displayed in Table 2 and Appendix B-1: Wheat Flour
Fortification Programs in Sub-Saharan Africa
1.2 The Situation in Ethiopia
Ethiopia is one of the poorest and least developed countries in the world, ranking 173rd
out of 187 countries on the 2013 United Nation Programme’s Human Development Report, with
29.6% of the population living below the poverty line. (3; 4) 70% of the average rural diet is
cereal-based, which, combined with a history of drought and famine, insufficient agricultural
production, and infectious disease, contributes to a reported 46% of Ethiopians that are
undernourished, the second highest rate in sub-Saharan Africa. (5) The four most prevalent
forms of malnutrition are acute and chronic malnutrition, iron deficiency anemia, iodine
deficiency disorder, and vitamin A deficiency. (6) Other common micronutrient deficiencies
● ● ●
Food Fortification, the
practice of adding
vitamins and minerals
to processed foods, has
helped eliminate MND’s
in both developed and
developing nations.
● ● ●

4
include folic acid, zinc, and vitamins B and D. Table 1 shows levels of common MND’s within
Ethiopia.
Table 1. Deficiency rates in Ethiopia (7)
Study Subjects Indicators Prevalence (%)
Vitamin A
Children, 6 – 59 months Night Blindness 4.3 – 7.3
Bitot’s Spot 2.2
<0.7 SRC μmol/L 37.6
Iron Deficiency - Anemia
Children, 6 – 59 months Hb <11.0 g/dL 54.0
Hb <4.0 g/dL 4.0
Women, 15 – 49 years Hb <11.0 g/dL 30.4
SF <50 μg/L 50.1
Folic Acid
Women of child bearing age SFA <2 ng/mL (severe) 46.0
SFA <4.9 ng/mL (marginal) 21.2
Iodine
Children Goiter rate 35.8
Women Goiter rate 27.0
SRC = Serum Retinol Concentration; Hb = Hemoglobin; SF = Serum Ferritan; SFA = Serum Folic Acid
1.2.1 Vitamin A Deficiency
Vitamin A is a fat soluble vitamin found in green, leafy vegetables, orange vegetables
such as carrots and pumpkins, or animal products. Vitamin A is found in animal products in the
form of retinols and in vegetables in the form of pro-vitamin A β-carotene, which must be
converted to retinol before absorption by the body. Vitamin A is essential for the development
of the eyes and immune system response.
An estimated 40% of Ethiopian children are deficient in vitamin A. Studies indicated
that improving the vitamin A status of deficient populations could improve childhood mortality
by 23% and pregnancy-related mortality among women by 40% as well as raise the national
GDP by 1.23% (8). Vitamin A deficiency (VAD) is the leading cause of childhood blindness in
Ethiopia. In some areas, the prevalence of Bitot’s Spot reaches over 6 times that of the World

5
Vitamin A Deficiency is responsible for Bitot’s
Spot [a characteristic clouding of the eye caused
by a buildup of karatin debris in the conjunctiva]
and xerophthalmia, [a condition where the eye
produces no tears] both of which can result in
permanent blindness. 40% of Ethiopian children
are deficient in vitamin A.
Figure 1. Bitot's spot and conjunctival xerosis, caused by VAD
Health Organization’s (WHO) cutoff for defined public health problem. Studies show that
giving vitamin A to children with diarrhea or measles reduces rates of illness by 15% and 50%,
respectively. (9)
Surveys conducted between 1957 and 1959 in various Ethiopian towns first revealed
VAD as a serious national public health problem. Since then, the Ministry of Health along with
various local and international supporters have attempted a series of intervention methods,
ranging from small-scale projects to national supplementation programs. First implemented in
1989, vitamin A supplements were
originally distributed as part of the
primary health care system. Over the
years, the program was modified to
distribute capsules through the Extended
Program on Immunization, National
Immunization Days, or as part of health
packages including deworming, measles
vaccines, mosquito nets, etc. Now,
vitamin A capsules are distributed twice a
year to children under the age of 5
through the Health Extension Worker
Program, which trains and employs two
female health care providers per kebelle.
While supplementation programs have
shown to be effective and coverage rates
are reported at 80%, problems with patient tracking, adequate supply, or reduced potency have
kept VAD rates high. (10)
1.2.2 Vitamin D Deficiency
Vitamin D is another fat soluble vitamin crucial in immune system response and bone and
muscular development. Healthy adults obtain about 10-20% of vitamin D through dietary
sources such as cheese, milk, or meat, and the remaining 80-90% through conversion of UVB
light from the sun. Vitamin D deficiencies are common in areas with little sunlight or among

6
dark-skinned populations, because the dark pigment in the skin can prevent absorption of the
UVB light. Vitamin D deficiency exacerbates severity of pneumonia, results in weak bones and
teeth, and causes rickets, a bone-softening disease. One study found that 42% of Ethiopian
children hospitalized with pneumonia also had rickets from severe vitamin D deficiency. (11)
1.2.3 Iron Deficiency Anemia
Iron, an essential mineral, is an important component of hemoglobin, the substance in red
blood cells responsible for transporting oxygen from the lungs to the rest of the body. Without
enough iron, the amount of oxygen-carrying red blood cells will diminish, resulting in a
condition called iron-deficiency anemia. (12) Without an adequate supply of oxygen in all parts
of the body, people feel exhausted and worker productivity plummets. Iron deficiency is
especially common in women, as they lose iron through blood during menstruation. A diet low
in foods of animal origins is the main cause of iron deficiency, but it is compounded by high
incidence of malaria and other parasitic diseases.
Iron is present in meat and fish in the form of heme iron, of which up to 40% can be
absorbed by the body. Other sources such as teff or other grains,
nuts, or vegetables contain non-heme iron, which is only about 10-
20% absorbed by the body. Additionally, commonly consumed
phenolic compounds (i.e. coffee), oxalates (i.e. tea), and foods
high in phytates (i.e. lentils or dried beans) limit iron adsorption.
(13) In Ethiopia, more than half of children under five as well as over a quarter of women are
anemic. (14) Iron deficiency anemia depresses a country’s GDP by resulting in a less effective
workforce and lowering concentration levels in school children, thus preventing maximum
progress through education. Iron deficiency also hinders the immune system response.
1.2.4 Zinc and Folic Acid Deficiencies
Zinc deficiencies are widespread in areas where diets lack animal-based foods. Zinc is
crucial for immune system response; case studies show that zinc supplements can reduce
duration of diarrhea by 20% and stool frequency by 62%. (15) In Ethiopia, zinc supplements are
distributed free of charge to those with diarrhea through the Health Extension Worker Program.
Consumption of foods such as
coffee, tea, lentils, and beans
inhibits iron absorption.

7
Folic acid is necessary for proper development of the fetus. Nearly two-thirds of
Ethiopian women are deficient in folate, a condition which results in birth defects such as spinal
bifida, anencephaly and encephalocele. Folate capsules may
be distributed to pregnant women through the Health
Extension Worker Program. However, as with vitamin A and
zinc, problems with supply, potency, and coverage plague the
system.
1.2.5 Iodine Deficiency Disorder
Iodine deficiency disorder (IDD) has severe
consequences, resulting in impaired thyroid hormone synthesis
or enlargement, also known as goiter. IDD is responsible for
mental retardation, cretinism, and infant mortality. While very minute amounts of iodine are
required by the body, on the order of micrograms, the only natural source of iodine is from
vegetables grown in iodine-containing soils or fish from seawaters. As such, fortification of salt
with iodine is recognized as the most cost effective solution to treating Iodine deficiency. At the
1990 World Summit on Children, leaders of most countries pledged to universally iodize all salt.
(16) Ethiopia began its own salt fortification program in 2009. (17)
1.2.6 Government Response
Despite the abovementioned supplementation efforts, food fortification in Ethiopia
remains constricted to only a few private companies, such that Ethiopia is one of only 27 sub-
Saharan African countries without a legal program. (18) Programs and food vehicles chosen by
other countries are shown in Table 2.
In the 2011 National Nutrition Program (NNP), the MOH outlined a National Nutrition
Strategy (NNS) for the elimination of VAD and other micronutrient deficiencies by 2015. The
NNS listed food fortification as a key strategy, identifying flour, oil, and sugar as promising food
vehicles for fortification. After the publication of the NNP, the MOH mobilized a task force to
investigate matters concerning food fortification. This task force included its subordinate bodies
at the Food, Medicine, and Health Care administration and Control Authority (FMHACA) and
the Health and Nutrition Research Institute (HNRI) as well as stakeholders at the Ministry of
Existing structures in
Ethiopia for the prevention of
MND’s include the provision
of free vitamin A, zinc, and
folate supplements as well as
mandatory salt iodization.

8
Industry, Ministry of Trade, Ministry of
Commerce, and several non-governmental
organizations. From there, FMHACA, the
branch of the MOH responsible for passing
legislation concerning food and drugs,
initiated an investigation into the
capabilities of various food processing
facilities chosen semi-randomly from all regions of Ethiopia. The investigation helped those
involved determine the current feasibility of the fortification program as well as what resources,
whether educational, financial, or technological, were needed. Further specifics involving
government regulations are included in chapter 2 of this paper.
1.3 Choosing the Proper Food Vehicle
An effective vehicle for food fortification fulfills the following criteria:
1. Is consumed by a majority of the targeted population in quantities large enough to
provide at least a substantial percentage of the added fortificant,
2. Is processed in a centralized facility,
3. Is unaltered (taste, smell, chemical composition), by the fortificant,
4. Is technically feasible to fortify, in terms of cost and available technology.
Commonly fortified foods around the world include:
Flours (i.e. wheat, maize)
Fats (i.e. margarine) and oils
Milk and dairy products
Sugar
Salt
Ethiopia’s 2011 National
Nutrition Program outlines
food fortification as a key
strategy for the elimination
of VAD and other MND’s.

9
1.4 Why Fortify Oil?
Edible oil is the number one recommended carrier of vitamin A by the MOH. Refined
oils are consumed by an estimated 55% of the Ethiopian population in such quantities that an
average woman could receive 47% of her recommended nutritional intake of vitamin A and an
average child could receive 10-35% from
fortified oil. Because vitamin A is fat-soluble, it
will readily dissolve in oil, thereby simplifying
the fortification process. The price to fortify oil
is only $0.02/person/year. About 80% of the
refined oil consumed nationally is imported palm
oil, so import standards should be adjusted to
require imported oil to contain vitamin A. (19)
Oil is an ideal vehicle for
fortification because it can be
processed centrally, is consumed by
a large percentage of the
population, and is technically easy
to fortify.

10
Table 2. Fortification programs in sub-Saharan Africa
Country Wheat Flour Vegetable Oil Sugar Maize Flour Year
(in effect)
1 Benin A, M A, M 2008
2 Burkina Faso A, V S, V 2008
3 Burundi NA
4 Cameroon A, M A, M 2012
5 Chad NA
6 Congo S, V
7 Congo, Dem.
Rep.
S, V
8 Cote d’Ivoire A, M A, M 2007
9 Ethiopia NA
10 Ghana A, M A, M 2009
11 Guinea A, M A, M 2007
12 Guinea Bissau NA
13 Kenya A, M A, M S, V S, M 2013
14 Liberia A, M A, M A, M 2013
15 Madagascar NA
16 Malawi A, M A, M A, M S, M 2014
17 Mali A, M S, V S, M 2007
18 Mauritania A, M A, M 2010
19 Mozambique Decree Pending Decree Pending NA
20 Niger A, M A, M S, V
21 Nigeria A, M A, M A, M S, M 2002
22 Rwanda A, M A, M A, M S, M 2014
23 Senegal A, M A, M 2009
24 South Africa S, M S, M 2003
25 South Sudan
26 Tanzania A, M S, M S, M S, M 2012
27 Uganda A, M A, M S, M (size
criterion)
2013
28 Zambia S, V A, M S, V 1998
A: All; S: Some; M: Mandatory; V: Voluntary
*Year may vary by vehicle; recorded year indicated year of first legislation/ regulation
Source: (18)

11
Chapter 2:
Regulatory Framework
12
Successful and sustainable fortification programs require the support of governing
bodies. In order to ensure fortified foods are safe and reliable for consumption, the government
is responsible for setting regulations and quality control and assurance stipulations concerning
the addition of vitamins and minerals to processed foods. Fortification programs can be
classified into one of two groups: mandatory and voluntary. (1)
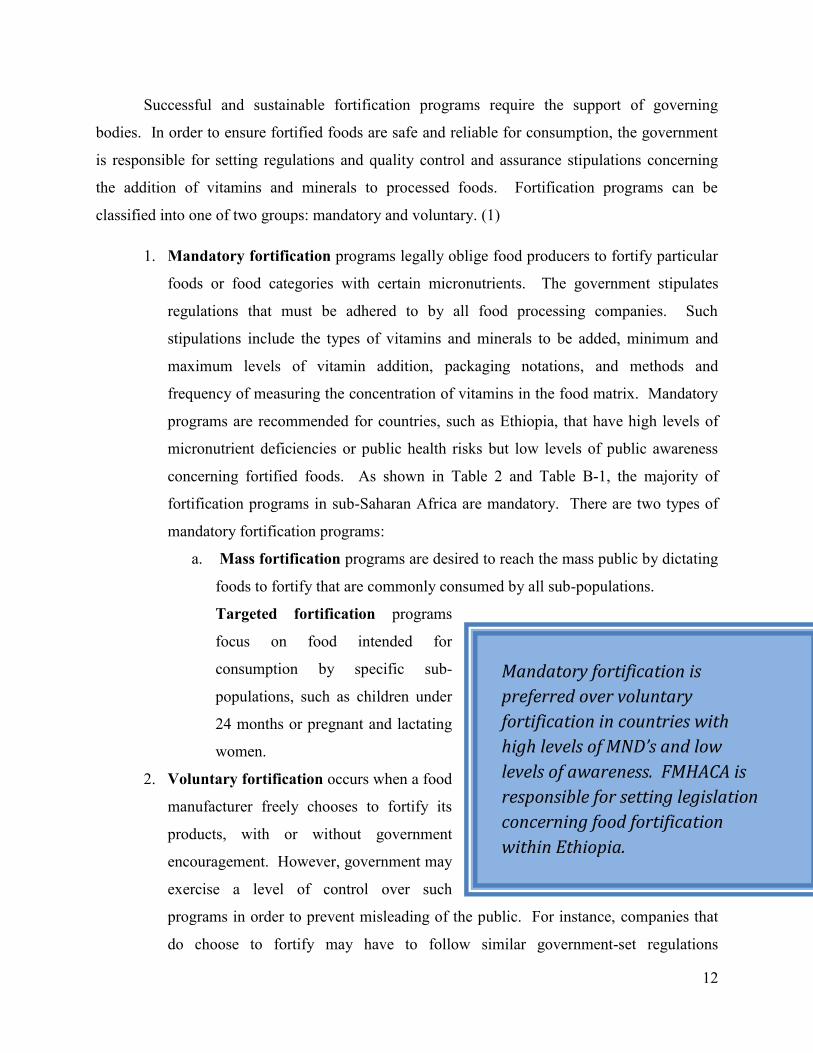
1. Mandatory fortification programs legally oblige food producers to fortify particular
foods or food categories with certain micronutrients. The government stipulates
regulations that must be adhered to by all food processing companies. Such
stipulations include the types of vitamins and minerals to be added, minimum and
maximum levels of vitamin addition, packaging notations, and methods and
frequency of measuring the concentration of vitamins in the food matrix. Mandatory
programs are recommended for countries, such as Ethiopia, that have high levels of
micronutrient deficiencies or public health risks but low levels of public awareness
concerning fortified foods. As shown in Table 2 and Table B-1, the majority of
fortification programs in sub-Saharan Africa are mandatory. There are two types of
mandatory fortification programs:
a. Mass fortification programs are desired to reach the mass public by dictating
foods to fortify that are commonly consumed by all sub-populations.
Targeted fortification programs
focus on food intended for
consumption by specific sub-
populations, such as children under
24 months or pregnant and lactating
women.
2. Voluntary fortification occurs when a food
manufacturer freely chooses to fortify its
products, with or without government
encouragement. However, government may
exercise a level of control over such
programs in order to prevent misleading of the public. For instance, companies that
do choose to fortify may have to follow similar government-set regulations
Mandatory fortification is
preferred over voluntary
fortification in countries with
high levels of MND’s and low
levels of awareness. FMHACA is
responsible for setting legislation
concerning food fortification
within Ethiopia.

13
concerning minimum and maximum nutrient levels, quality assurance and control,
and identification of fortified goods. Voluntary programs work well in societies with
a specific demand for fortified goods, such that the company itself chooses to fortify
in order to satisfy the market demand.
The Food, Medicine and Health Care Administration and Control Authority (FMHACA)
is the branch of the Federal Ministry of Health responsible for passing legislation regarding the
fortification of edible oils.

14
Chapter 3:
How to Implement

15 | P a g e
3.1 Simplified Refining Process Introducing Fortification
Crude Oil Degumming Neutralizing Decolorizing
Deodorizing Dewashing (optional)
Fortifying
Mixing oil + vitamin premix
Packaging of refined oil

16 | P a g e
3.2 Fortification Methods Table 3 lists common options for achieving uniformly fortified oil in the factory.
Methods are applicable for small to large size faculties. Several other methods exist for
fortifying, such as adding the vitamin pre-mix during the pressing and extraction of the oil, but
such methods are not as well documented. Refer to the literature to learn about alternate
methods.
Table 3. Mixing options for oil fortification
Method Description Equipment
Needed
Recommended
For…
3.2.1. Batch
Mixing
Flour and vitamin pre-
mix are mixed together
in a batch operation.
Vertical agitation tank Small companies who
chose low cost over fast
mixing time or
automation.
3.2.2 Continuous
Mixing
Flour and vitamin pre-
mix are mixed together
under continuous flow
of both ingredients.
1. Method of
continuous addition of
oil and vitamin pre-mix,
i.e. valves and dosifier.
2. Agitation Tank for
Liquid-solid mixing
fitted with inlet and
outlet valves that can be
controlled manually or
through PID controls.
Companies willing to pay
a higher price to process
flour at a higher rate
while ensuring accuracy.
Fortified Oil
Vitamin Pre-Mix Oil
Batch Vertical Agitation Tank

17
3.2.3. Two-Stage
Mixing
Because the vitamin
pre-mix is very
concentrated, a pre-
mixing step to mix the
oil and the vitamin for
a first dilution helps
reduce the mixing time
of the second mixing
stage and ensure
uniformity.
Agitator/Mixer, batch
or continuous, that is
smaller in size than
second mixer.
Output from the mixer
will feed into the input
of the second mixer or
dosifier.
Companies with variable
oil flow that desire high
accuracy.
Fortified Oil
Vitamin Pre-Mix
Feeder/Dosifier
Oil
Input Regulator(s)
(i.e. pump, valve, or
rotometer)
Vertical Agitation Tank
Outlet Valve
Oil
Fortified Oil
Oil Pre-Mix
Concentrated
Oil
Preliminary Mixing Tank
Main Mixing Tank
Input/Output Regulators
Optional; for continuous
flow

18
Chapter 4:
Fortification Equipment and Control
Options

19
4.1 Dosifiers
Feeders/dosifiers allow for the continuous addition of the vitamin premix to the oil
matrix. Several types exist including gravimetric, volumetric, loss-in-weight and pneumatic.
Only a few are discussed here.
Volumetric feeders operate under the principle that, given a media with constant density, adding
a consistent volume of that media is the same as adding a constant mass. The screw feeder,
mentioned below, is the most common type; other types of volumetric feeders include a
revolving disk feeder and a drum feeder.
Gravimetric feeders add an additional level of precision to the feeding process by comparing
discharge weights to set-point values, and sending a signal to a controller to any needed
adjustments. Examples include loss-in weight or gain-in-weight feeders, which measure the
weight loss or the weight gain, respectively. The weight sensing device is coupled with another
feeding mechanism, such as the volumetric screw feeder.
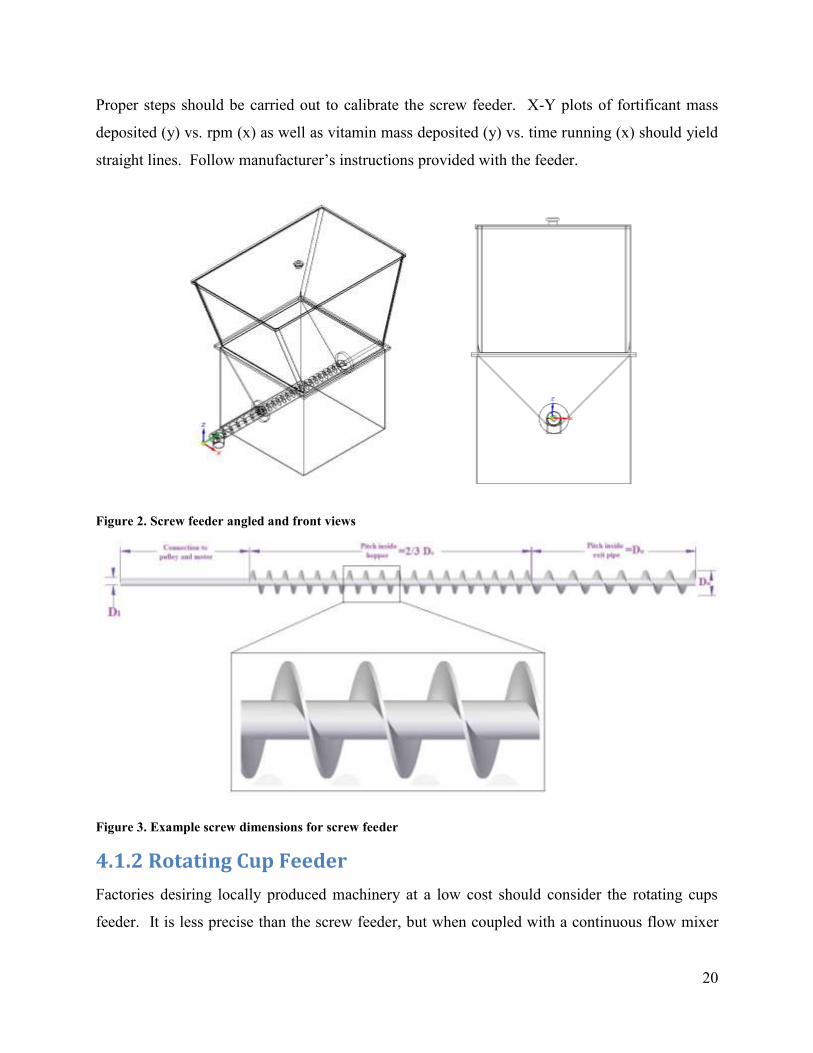
4.1.1 Screw Feeder
The most commonly used feeder for controlled additions of vitamin premixes is the screw
feeder. The screw feeder deposits consistent volumes of vitamins that are carried along a
rotating screw.
The flow rate of the screw feeder is defined as:
Where:
- Q = flow rate
- D = hydraulic diameter = DO - DI
- S = pitch (i.e. D, ¾ D, ½ D, etc.)
- n = rotation speed
- = density
- inclination factor (= 0 for horizontally oriented feeders)
- = loading efficiency
20
Proper steps should be carried out to calibrate the screw feeder. X-Y plots of fortificant mass
deposited (y) vs. rpm (x) as well as vitamin mass deposited (y) vs. time running (x) should yield
straight lines. Follow manufacturer’s instructions provided with the feeder.
Figure 2. Screw feeder angled and front views
Figure 3. Example screw dimensions for screw feeder
4.1.2 Rotating Cup Feeder
Factories desiring locally produced machinery at a low cost should consider the rotating cups
feeder. It is less precise than the screw feeder, but when coupled with a continuous flow mixer

21
will have good accuracy. As shown in Figure 4, the cups scoop up small amounts of vitamin
premix and dump them out as they are turned upside down. It is a cost effective device to
consider to make a mixer, such as the one shown in section 4.2, operate by continuous flow
instead of batch flow.
The shaft of the rotating disk should be attached to a motor to provide the mechanical energy for
rotation. The top half of the tank can be removed and the disk extracted for easy filling, cleaning
and maintenance. There should be a tight fitting between the top and bottom of the tank. The
tank should be filled less than half way up with vitamin premix. A hopper can also be fitted to
the tank for easy refill.
The flow rate of the rotating cups feeder is defined as:
Where:
- N = number of cups on the disk
- r = radius of the cup
- h = height of the cup
- n = rotation speed
- Figure 4. Rotating cup feeder

22
4.2 Mixers and Blenders
4.2.1 Built in-country with manual controls
The following design is based off a small-scale stainless steel machine manufactured in country
at Mebratu Araya and Sons’ Engineering in Mekelle, Tigray. The machine was tested and
proved to be possible for local manufacturers to produce and capable of uniformly mixing the
vitamin premix with the food vehicle.
Oil factories may wish to consider purchasing similar designs from local metal workshops.
Other designs exist for purchase internationally.
4.2.1.1 Batch or Continuous Vertical Agitation Tank
Figure 5. Vertical agitation tank
23
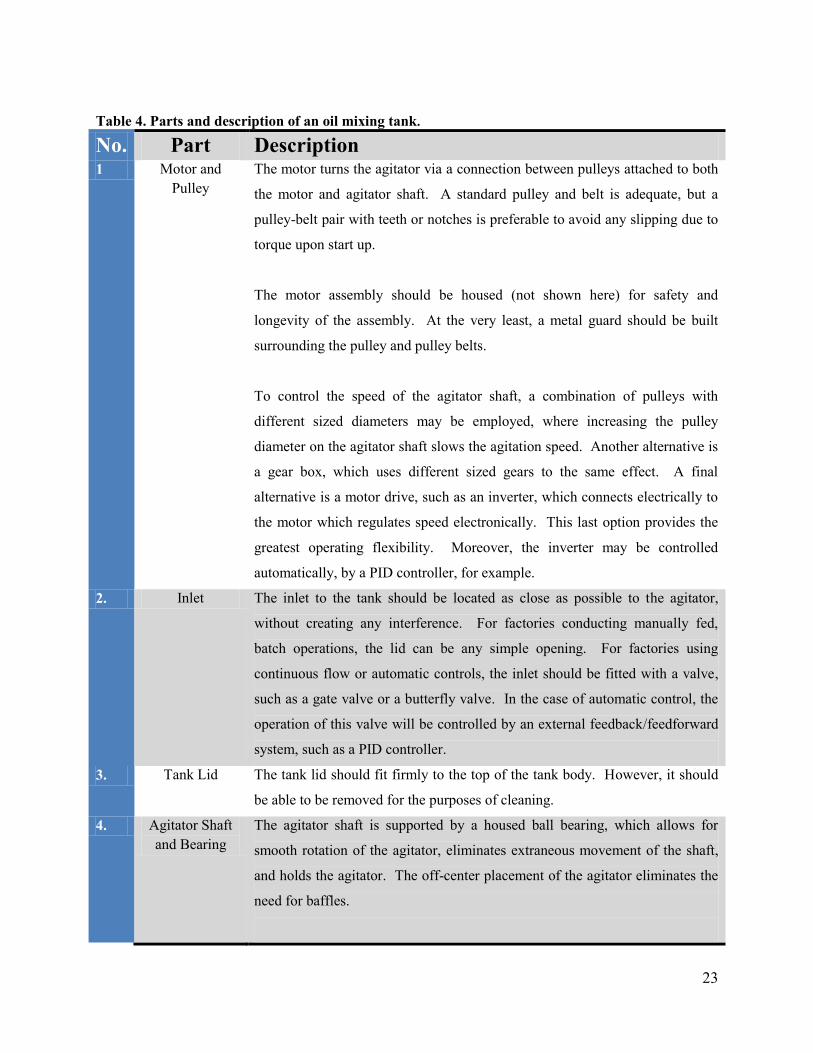
Table 4. Parts and description of an oil mixing tank.
No. Part Description 1 Motor and
Pulley
The motor turns the agitator via a connection between pulleys attached to both
the motor and agitator shaft. A standard pulley and belt is adequate, but a
pulley-belt pair with teeth or notches is preferable to avoid any slipping due to
torque upon start up.
The motor assembly should be housed (not shown here) for safety and
longevity of the assembly. At the very least, a metal guard should be built
surrounding the pulley and pulley belts.
To control the speed of the agitator shaft, a combination of pulleys with
different sized diameters may be employed, where increasing the pulley
diameter on the agitator shaft slows the agitation speed. Another alternative is
a gear box, which uses different sized gears to the same effect. A final
alternative is a motor drive, such as an inverter, which connects electrically to
the motor which regulates speed electronically. This last option provides the
greatest operating flexibility. Moreover, the inverter may be controlled
automatically, by a PID controller, for example.
2. Inlet The inlet to the tank should be located as close as possible to the agitator,
without creating any interference. For factories conducting manually fed,
batch operations, the lid can be any simple opening. For factories using
continuous flow or automatic controls, the inlet should be fitted with a valve,
such as a gate valve or a butterfly valve. In the case of automatic control, the
operation of this valve will be controlled by an external feedback/feedforward
system, such as a PID controller.
3. Tank Lid The tank lid should fit firmly to the top of the tank body. However, it should
be able to be removed for the purposes of cleaning.
4. Agitator Shaft
and Bearing
The agitator shaft is supported by a housed ball bearing, which allows for
smooth rotation of the agitator, eliminates extraneous movement of the shaft,
and holds the agitator. The off-center placement of the agitator eliminates the
need for baffles.

24
The agitator itself consists of blades angled at 45°. Depending on tank size,
there may be between 4 and 6 blades.
5. Tank Body The body consists of a cylindrical piece of
stainless steel sheet metal with a rounded bottom.
For large tanks, radial ribs should be added for
strength (right). Such features will allow the tank
to be scaled up without needing to increase the
thickness of the sheet metal used for construction.
6. Outlet The outlet for the oil is controlled by a valve, such as a gate valve or a
butterfly valve. For factories conducting manually fed, batch or continuous
operations, the valve will be opened and closed by hand at the stop and start of
operation, respectively. For factories using automatic controls, the operation
of this valve will be controlled by an external feedback/feedforward system,
such as a PID controller.
7. Mixer and
Motor Stand
The tank and the motor assembly should be supported externally to prevent
unnecessary load on the mixer itself. The stand can be fabricated from any
steel or iron.
Figure 7. Schematic of vertical agitation tank with offset agitator, eliminating the need for baffles.
Figure 6. Ribbing can be
added to the stainless steel
tank for strength.

25
Figure 8. 4-blade pitched blade impeller. As the tank gets larger, the number of blades may increase.
Figure 9. Suggested dimensions for vertical agitation tank

26
4.2.2 Built in-country with automatic controls
For a fully automated system, the following variables must be controlled:
Inlet flow rate of all inputs (for continuous system)
o For solids, will be dictated by a feeder, such as the screw or rotating cup feeder.
o For liquids, will be dictated by a controlled valve or rotometer. A pump may be
used to provide flow at the inlet, while gravity will be the main force for exit
flow.
Outlet flow rate of all outputs (for continuous system)
Residence time
o For continuous systems, will be determined indirectly by tank size and inlet and
outlet flow rates.
o For batch systems, will be set by mixer operator/automated control system
Mixing speed (for both batch and continuous)
Therefore, it is possible to retrofit locally made designs with automatic controls given that an
experienced engineer and technician trained in automatic controls are involved. The following
equipment is needed:
1. Motor Drive (i.e. inverter) to determine speed and run time of the motor
2. Feeders with controllable flow rates (for solids)
3. Valves with controllable flow rates (i.e. rotometer; for liquids)
4. Pump with controllable rate (for liquid transport)
4.2.3 Other Impeller Types
Figure 10. Impeller Types
A. B. C. D.

27
A. 3-vane Propeller 3-dimenstionally twisted imepeller for high speed mixing. It is very
efficient and obtains a large circulation volume.
B. Anchor Paddle This horse-shoe shaped vane matches the surface of the tank bottom for
efficient mixing at low speeds
C. Disk Turbine Obtains axial, radial, and shearing flow with its 6 blades oriented at 45°
angles. It is ideal for high viscosity mixing or high concentration solid-
liquid mixing. Rotation speeds vary.
D. Spiral Ribbon The inner screw stirs the liquid upwards while the outer screw pushes it
down, for an effective circulatory flow through a tall horizontal tank.
4.2.4 International Equipment suppliers
ABC Hansen Africa
PO Box 25354
Pretoria, South Africa
Microfeeders
Tel: +27 12 803 0036
+27 861 472 461
Email: [email protected]
www.abchansenafrica.co.za
Buhler Group
Gupfenstrasse 5
9240 Uzwil
Switzerland
Mixers, weighers, controllers
Tel: +41 71 955 11 11
Fax: +41 71 955 33 79
www.buhlergroup.com
Gramec Pty LTD
PO Box 89380
Lyndhurst, South Africa
High speed industrial mixers and blenders
Tel: +27 (0)11 882 1919
+27 (0)82 330 3955
Fax: +27 (0)86 615 1547
Email: [email protected]
For local equipment, contact local metal workshops to ask about capabilities. Follow
advice given in section 4.3 on use of food grade metals. VonallCo in Mexico, Addis Ababa
(contact information in section 4.3.2.2) is another option for a local company skilled in
equipment for food mixing

28
Metalfab Inc.
P.O. Box 9
Prices Switch Road
Vernon, NJ 07462 USA
Feeders, conveyors, hoppers
Tel: +1-973-764-2000
+1-800-764-2999 (toll free)
Fax: +1-973-764-0272
Email: [email protected]
www.metalfabinc.com
Powder Technologies Inc.
3800 Sylon Blvd. Suite 3854
Hainesport, NJ 08036 USA
High-speed, continuous powder and liquid
mixing, feeders
Tel: +1-609-914-0521
Fax: +1-609-914-0318
www.powdertechusa.com
Sanku
Berkeley, California, USA &
Dar es Salaam, Tanzania
Micro-feeders/dosifiers for vitamins
Tel: +1-510-898-6013 (USA)
+255-764-765-976
Email: [email protected]
www.sanku.com
Silverson
Distributors in over 50 countries, including Europe,
Africa, and the Middle East
Batch or continuous mixers for oil, in-line
powder-liquid mixers with feeder
Tel: +1(413)525-4825
www.silverson.com
Tacmina Corporation
Offices in 19 countries, including Saudi Arabia,
Indai, U.S. and Germany
Pumps and agitators for liquid mixing
Tel: +81-6-6208-3974
Email: [email protected]
www.tacmina.com
4.3 Food Grade Metal Requirements
4.3.1 Stainless Steel vs. Aluminum
Stainless steel and aluminum are the two metals safe for food processing units. Table 5
provides a direct comparison between stainless steel and aluminum, which may be useful in
choosing equipment material. In general, facilities operating at a large capacity may require
stainless steel for its greater strength and resistance to wear. Smaller facilities may find

29
aluminum more suitable for its lower cost and greater availability. Aluminum may also be
chosen for specialized shapes, since aluminum is soft and can be shaved into the proper shape, or
melted and poured into a mold. However, it is difficult to polish and smooth, making it generally
less desirable for oil as nicks in the surface may hinder thorough cleaning of the mixing tank.
Table 5. Comparison of Stainless Steel and Aluminum
Stainless Steel Aluminum
Corrosion resistant; weld lines must be treated to
avoid rusting
Corrosion resistant; weld lines will not rust
Relatively easy to weld Difficult to weld; requires high amperage
High strength Light weight
Lower strength to weight ratio High strength to weight ratio
Surface more resistant to wear Easily scratched or dented; surface requires
polishing to smooth
More expensive Less expensive
Good conductor of heat Poor conductor of heat
Available in Addis Ababa Available in regional cities
4.3.2 Stainless Steel
4.3.2.1 Grades Stainless Steel is classified based on its relative percentages of nickel and chromium,
which both provide strength and rust resistance. There are 150 grades of stainless steel, but only
304 and 316 are recommended for use in food equipment:
Table 6. Options for food grade stainless steel
Grade Description
304 There are two types of 304 grade stainless steel, 18/8 and 18/10, which correspond to
the percentages of chromium and nickel, respective. 18/10 has a slightly higher nickel
content (10% compared to 8%) so is slightly more durable and shiny than 18/8. 304
grade stainless steel must also contain less than 0.8% carbon and at least 50% iron.
304 grade is easier to roll and weld, more common, and less expensive.
316 316 grade contains a slightly higher nickel content than 304, so is more resistant to
rust, especially in chloride environments. It is generally more expensive than 304 and
therefore less common.

30
4.3.2.2 Suppliers
Stainless Steel (304) metal and accessories such as welding electrodes and pickling and
passivating (cleaning and preserving) agents may be purchased from VonallCom PLC., located
near the Coffee and Tea Authority in the Mexico, Addis Ababa.
Vonall Com PLC
Tel: 251 (0)55 116 59/69
Fax: 251 (0)55 116 47
Email: [email protected]
Web: www.vonall.com
Mexico, south of Coffee and Tea Authority
4.3.2.3 Proper Welding Techniques and Treatment
Stainless Steel must be welded with a proper stainless steel electrode which is equal to or
higher in grade than the metal to be welded. For instance, a 308 SS electrode is appropriate for
welding 304 SS, but would not be appropriate for welding 316 SS. Using the wrong electrode
could damage the surface of the SS sheet metal, or cause rusting along the weld.
Stainless steel is known for its corrosion-resistant properties, which are due to the
relatively high percent (16-36%) of chromium (Cr). However, many are surprised to know that
stainless steel does rust, and certain steps must be taken to avoid
this phenomenon. The concentration of chromium in stainless
steel is so high that it forms a thin, tightly adhering, and
impervious layer of mostly chromium oxide (CrO) when exposed
to oxidizing surfaces such as air, water, or caustics. The
formation of this protective layer is called passivation, and it
occurs naturally over the course of over 14 days. However, the
process may be disrupted by the presence of dirt; inorganic
compounds such as oils and grease, ferrous metals, copper, etc.; and other impurities. (20) When
the passivation process is impeded, the CrO layer does not fully form, leaving the surface open
and vulnerable to rusting.
● ● ●
Stainless steel does
rust, and certain steps
must be taken to avoid
this phenomenon.
● ● ●

31
Furthermore, stainless steel may rust if any iron-containing particles rub off on the
surface of the metal. This may occur if any equipment (i.e. grinders, cutting blades) used on the
stainless steel had been previously used on regular steels or iron alloys. In this situation, the iron
particles on the surface will rust. However, after oxidation of these surface particles, no further
rusting will occur.
It is therefore recommended to undertake the following treatments:
1) Cleaning/Pickling
2) Passivation Encouragement
These two steps can be carried out either mechanically or chemically, as represented by Table 7
Table 7. Stainless steel treatment techniques
Chemical Treatment Mechanical Treatment
Cleaning Involves the use of pickling agents such as
hydrochloric or hydrofluoric acid. Because
these are very strong, caustic acids, they
must be dealt with by trained personnel
wearing protective equipment.
Cleaning shines the surface, removes
darkening of the surface due to weld burns,
and eliminates rust or scale from ferrous,
copper, or aluminum alloys, inorganic
compounds such as oils/grease, and dirt.
Pickling sludge is a hazardous waste, so
must be neutralized prior to disposal. It is
imperative to wash off all acidic residues
with ample amounts of water.
Pickling agents on the market include
brands such as Antox or WonderGel.
The surface may be cleaned through
mechanical abrasion, which removes
surface particles and weld burns.
A stainless steel brush is one
acceptable tool for mechanical
abrasion. The brush should be applied
only to weld lines to avoid scratching
or damaging the main surface.
The other alternative for mechanical
abrasion is to use a grinder that has
not been previously used on any
iron-containing metals, such as
regular steel.

32
Encouraging
Passivation
Involves the use of passivation agents, such
as nitric acid or citric acid to encourage the
formation of the chromium oxide layer.
Passivation agents available on the market
include brands such as Antox or
WonderGel.
Passivation can also be encouraged by
submerging parts into a heated dilute acid
bath, (i.e. citric or nitric acid).
Mechanical abrasion techniques such
as the ones described above will help
passivation occur naturally by
removing any inorganic or dust
particles that may have inhibited the
formation of the chromium oxide
layer. However, it will not actively
speed up the passivation process as
chemical treatment does.
4.3.3 Aluminum
4.3.3.1 Grades
Table 8. Common grades of aluminum and aluminum alloys used in food processing industries.
Grade Description
1100 This grade is pure aluminum and is easiest to work with because it is soft, ductile, and
has lower welding requirements than the other alloys. It is not heat-treatable and ideal
for molding into intricate shapes because it hardens less quickly than other types of
aluminum. It has excellent corrosion-resistance properties.
3003 The most widely used of all aluminum alloys, the addition of manganese to this
aluminum increases its strength by 20% as compared to 1100 grade. It has excellent
corrosion resistance and workability and it is possible to be welded, drawn, spun, or
brazed.
5005 This grade is an improved version of grade 3003. It has similar characteristics, but is
less likely to streak or discolor.
4.3.3.2 Suppliers
Vonall Com PLC
Tel: 251 (0)55 116 59/69
Fax: 251 (0)55 116 47
Email: [email protected]
Web: www.vonall.com
Mexico, south of Coffee and Tea Authority

33
Yared Building Materials Shop
Downtown Mekelle, near Tea-Chat Café
4.3.3.3 Welding and Shaping Techniques
Aluminum is more difficult to weld than steel because it has a lower melting point, higher
thermal conductivity, and doesn’t change color before it begins to melt. Because aluminum is a
good heat conductor, it requires a lot of heat to weld aluminum. It is helpful to heat the
aluminum before welding to achieve a stronger weld that is less susceptible to cracking. It is
also crucial to remove the aluminum oxide layer that may have formed over time on the surface
of the aluminum because the oxide has a melting point
three times as high as the melting point of aluminum
(higher even than its boiling point!) so may sink into
the aluminum layer during welding.
Before contracting an aluminum design, check
with the metal workshop to ensure they have
aluminum welding capabilities. If not, they may be able to contract the work out to another local
workshop with capabilities. Machines for welding aluminum are also available for rent in the
regions. There are several methods for welding aluminum. TIG welding, using Tungsten gas is
most common, followed by MIG welding or Gas Metal Arc Welding. However, if such gases
are not commonly available (as is often the case in Ethiopia), stick welding can be used.
An alternative to aluminum welding is aluminum molding, by which raw aluminum is
melted at high temperatures and poured into a pre-fabricated mold. This process is common
around Ethiopia and, while it may be costly or technically difficult to mold large shapes (i.e.
tanks), it is a good option for lids, pulleys, or agitator blades. Such items may also be formed
from aluminum shaping, by which an aluminum bar is cut into shape using a variety of
mechanical or hand tools, such as a lathe.
Compared to stainless steel,
aluminum is more difficult to
weld and polish, but easier to
mold and shape.

34
4.4 Additional Equipment Materials
4.4.1 Motors and Motor Drives
For many factories, electrical agitation is preferred. Motors may be acquired in country through
several whole-sellers. Table 9 provides a summary of power requirements and estimated cost,
where power is calculated by:
Where:
- P = power (Watts)
- Np = power number, as function of the Reynolds number ( 3 for pitched blade impeller
at speeds of ~100 rpm)
- n = speed of agitator (revolutions per second)
- Di = impeller diameter (meter)
Table 9.Locally purchased motor costs
Motor Required (HP/kW)1 Cost (ETB/USD)
2
0.75/ 0.56 2,850/ $1463
1.0/ 0.75 3,200/ $164
1.5/ 1.12 3,700/ $190
2.0/ 1.49 3,980/ $204
3.0/ 2.24 4,550/ $234
4.0/ 2.98 5,250/ $270
5.5/ 4.10 6,200/ $318
7.5/ 5.59 6,980/ $358
10/ 7.46 7,990/ $410
15/ 11.49 12,550/ $640
20/ 14.91 13,900-19,900/ $714-1,068
30/ 22.37 20,800-26,900/ $1,068-1,381
50/ 37.28 47,200/ $2,424
1 A ratio of diameter to height of tank of 0.8 was used. To lower power requirements as volume increases, lower the
diameter to height ratio, while keeping the tank diameter to impeller diameter the same. 2 Cost estimates are provided by Jimma Enterprises (located in Piazza, Addis Ababa) for normal speed, copper
wired motors reaching up to 1500 rpm. Reduced speed motors have somewhat higher costs, while aluminum wired
motors have lower costs. It is generally cheaper to purchase a motor from Addis Ababa than regional cities. 3 Conversion accurate as of May 13, 2014

35
75/ 55.93 79,100/ $4,062
100/ 74.57 114,990/ $5,905
150/ 111.85 116,750/ $5,996
180/ 134.23 194,500/ $9,988
215/ 160.33 224,500/ $11,529
Ideal motor speed for oil mixing is generally less than 100 rpm. Motor speed may be set with the
addition of a gear box or a motor controller.
A gear box is an enclosed system of assembled gears that transmits mechanical energy from the
motor to the agitator. A gearbox can be designed to change speed, direction, or torque of the
mechanical energy through mechanical methods. There is less flexibility in setting speed and
direction than is provided with motor controllers, but is a lower cost alternative.
Motor controllers are devices that, via an electric connection, govern the performance of an
electric motor, from starting to stopping the motor, selecting forward or reverse motion, selecting
and regulating the speed, and protecting against overloads and faults. Types include motor
starters (simple starting and stopping of the motor), adjustable-speed drives (start and stop as
well as set speed and rotation), and intelligent controllers (uses a microprocessor to match motor
torque to load for energy efficiency). An invertor is an example of an adjustable-speed drive.
4.4.2 Power Transmission: Pulleys and Pulley Belts
Vee Belts/ Wedge Rope
The V-belt is the basic belt for power transmission. Its cross-sectional shape is trapezoidal, such that the
belt cannot slip off the pulley. Slippage is low but can occur.

36
Multi Groove Belts/ Poly V Belts
These belts consist of 5 or 6 V shapes alongside each other for greater belt flexibility. This belt may last
longer than the single v-belt.
Timing Belts
(aka toothed, notch, cog, synchronous belts)
These belts have teeth that fit into a matching toothed pulley. If correctly tensioned, they have no
slippage, run at constant speed, and are often used to transfer direct motion for indexing or timing
purposes.

37
4.4.3 Additional Supplies
Additional supplies for processing equipment may include:
Pulley and motor belt with proper safety shield
Aluminum or stainless steel screws, bolts or nuts
Steel or iron metal for stand
Bearings for smooth rotation of agitator shaft
Automatic controls, as desired
4.5 Mixing Tank Sizing Requirements
Step 1: Determine daily production rate
Step 2: Determine actual operating time per day
Step 3: Decide if batch or continuous operation is desired
Step 4: If batch, decide how many times per day (batch) or total minutes per day you want
to run the tank. If continuous, flow rate of the tank should be the same as oil
production flow rate.
Step 5: Guess a tank size and assume a reasonable mixing/residence time for complete
mixing
Step 6: Calculate initial tank size needed using residence time from step 5.
Step 7: Guessed and calculated volume should be similar. If not, guess a new tank size (and
thus new residence time) and recalculate tank volume.
Note: Use sections 4.1 and 5.1.1 to determine feeder size, if needed

38
Table 10. Sample tank dimensions based on Figure 9
Mixer Capacity (L) 50 100 500 1,000 5,000 10,000 25,000 50,000
Height (m) 0.56 0.58 1.00 1.26 2.15 2.71 3.68 4.63
Diameter (m)1 0.34 0.47 0.80 1.01 1.72 2.17 2.94 3.71
Impeller Diameter (m)2 0.13 0.19 0.32 0.40 0.69 0.87 1.18 1.48
Blade Length (cm)3 5.24 7.84 14.47 18.62 32.91 41.85 57.34 72.63
Blade Width (cm)4 0.87 1.31 2.41 3.10 5.49 6.98 9.56 12.11
*If tank is ribbed, tank thickness can be ~ 1mm, assuming stainless steel. Impeller blade
thickness can be ~3 mm.
4.6 Cost Comparisons
Please see Appendix D for a complete breakdown of costs. Please note that numbers
shown in Table 11 are calculated assuming each machine is made individually and no reduction
in material costs or labor is given by buying in bulk. The cost listed includes motor and motor
drive (inverter) to set speed and duration of mixing. Cost will be somewhat reduced by using a
gear box instead.
Table 11. Estimated scale up costs for locally built agitation tanks
Size Tank (L) Est.
Material +
Electrode
Costs (ETB)
Est. Motor +
Accessory
Costs (ETB)
Total Estimated
Cost plus labor
(ETB)
Estimated Cost
(USD)
50 4,283 14,780 24,063 1,266
100 5,474 14,780 25,754 1,355
500 12,150 14,780 32,930 1,733
1,000 17,509 14,780 38,789 2,041
5,000 42,894 16,770 66,664 3,508
10,000 64,257 22,480 94,737 4,986
25,000 111,217 40,560 160,777 8,461
50,000 170,004 126,370 306,374 16,124
1Assuming DT/H = 0.80. For larger tanks, use a smaller ratio to lower power requirements.
2 Assuming DI/DT = 0.40
3 Assuming an agitator thickness of 25 mm
4 Assuming BW/BL = 1/6

39
Chapter 5:
Premix Options

40
5.1 Addition Amounts
The World Health Organization (WHO) recommends an approach to calculating the
amount of fortificant that should be added to each food matrix, called the EAR-cut point
method. It assumes that the distribution of nutrient intake among a population can be
approximated by a bell curve. In deficient populations, there is a large proportion of the
population consuming below the Recommended Nutrient Intake (RNI) level. The WHO
together with the Food and Agriculture Organization (FAO) define RNI as “the daily dietary
intake level necessary to meet the nutrient requirements of almost all (i.e. 97-98%) healthy
individuals within a particular age, gender, and physiological status group.” In order that the
requirements of nearly every person in the group are met, it is set about two standard deviations
higher than the Estimated Average Requirement (EAR) of the subpopulation. The EAR is the
“average amount required by a population group.” As shown in Figure 11, the principle of the
EAR-cut point method is to shift the bell curve such that only about 2-3% of the population
consumes less than his/her respective EAR value.
It is important to note that the curve shifts based on the EAR and not the RNI. This is to
avoid risk of the population exceeding the tolerable upper intake level (UL), which is the
“highest average daily nutrient level unlikely to pose risk of adverse health effect to almost all
(97.5%) of healthy individuals in an age and sex specific population group.” Once it is
determined how far the curve can be shifted, the Feasible Fortification Level, the level that
satisfies the above defined goal of fortification programs, is set. How far the curve shifts is
based upon data collected for populations concerning consumption and purchasing habits. Such
habits for Ethiopia were listed in chapter 1 of this paper.
Values of RNI, EAR, and UL for select vitamins and subpopulations are listed in
Appendix A.
The dietary goal of fortification, as defined by the World Health Organization, is to provide
97.5% of individuals in the population group(s) at greatest risk of deficiency with an adequate
intake of micronutrients, without causing a risk of excessive intakes in other groups.

41
Figure 11. The EAR-cut point method for determining feasible fortification levels
5.1.1 Calculations
1. Batch Operation
Ex: We have a tank that holds 5,000 L of oil. We wish to fortify the oil such that the final
product has 20 ppm vitamin A. How much mix should we add, if our premix is 40%
vitamin A?
Refer to the guidelines set by FMHACA to determine the desired vitamin concentration in the
fortified food matrix.
Nutrient Intake Level
EAR RNI
Original distribution
Shifted distribution
(after fortification)
Population
frequency ~2.5%

42
2. Continuous Operation
Ex: Under normal operating conditions, our factory produces 5 L oil per minute. We wish to
fortify the oil such that the final product has 15 ppm vitamin A. At what rate should we set
our pre-mix feeder, if our premix is 50% vitamin A?
3. Two-Stage Mixing
Ex: We desire to produce oil with a concentration of 20 ppm using a two-stage batch tank setup.
The tanks hold 500 L and 5,000 L of oil, respectively and our premix contains 50% vitamin
A. How much premix should we add to the first tank?
Note: either of the above equations for one tank operation could have been used with the same
result. These set of equations are useful only if the intermediate concentration is desired.

43
5.2 Cost Comparison
Table 12. Cost Estimate of Select Fortificants (1)
Adult
EAR
Nutreint
content of
fortificant
(%)
Cost of
fortificant
(US$/kg)
Overage
(%)1
Annual
cost of
fortificant
(US$)2
Vitamin A
Vitamin A (SD-250) 429 μg 7.5 42 50 0.136
Vitamin A palmitate,
1 million IU
429 μg 30 52 30 0.042
Vitamin D, in oil; 1 million IU/g 5 μg 2.5 80 20 0.008
Vitamin E 8 mg 67 26 20 0.163
Vitamin C 37 mg 100 10 2503 0.567
Thiamine (vitamin B1) 1.0 mg 81 24 40 0.018
Riboflavin (vitamin B2) 1.1 mg 100 38 30 0.024
Niacin (vitamin B3) 12 mg 99 9 10 0.053
Folic acid 188 μg4 100 90 50 0.011
Iron5
NaFeEDTA 7.0 mg 13 15.45 5 0.383
Ferrous bisglycinate 7.0 mg 20 25 5 0.402
Ferrous fumarate 10.5 mg 33 5.12 5 0.075
FeSO4, dried 10.5 mg 33 2.35 5 0.034
FeSO4, encapsulated 10.5 mg 16 12.28 5 0.371
Electrolytic iron 21.1 mg 97 5.76 5 0.058
Zinc (as oxide) 6 mg6 80 3.35 5 0.012
Calcium (as phosphate) 833 mg 39 2.7 5 2.652
Iodine (as potassium iodate) 107 μg 59 20 25 0.002
1 Overage is the additional amount that is added to account for losses in storage, production, and distrubtion.
2 The cost of supplying enough micronutrient to meet 100% of the EAR of an adult male, daily for one year. It
includes a +20% overage to account for variability in the fortification process. 3 Vitamin C is one of the least stable fortificants and a high overage is needed. However, if the fortified food is not
subject to heat of oxidation, the overage can be much lower. 4 Folic acid is 1.7 times more bioavailable than naturally-occurring food-folates, so the EAR is divided by 1.7.
5 The EAR for iron depends on its bioavailability from the diet. If the diet contains large amounts of iron absorption
inhibitors, it may need to be multiplied by 2. The value given here assumes a food matrix of wheat flour. 6 Assuming a moderate bioavailability of zinc.

44
Table 13. Cost of Select Premix Option (19)
Premix Composition Active Ingredient
Vitamin A (retinol palmitate) 60 IU
Vitamin D 6 IU
Addition Rate, g/MT oil 93
Premix Cost , US$/kg $11.32
Fortification Cost, US$/MT oil $1.05
5.3 List of Suppliers
The GAIN premix facility works with 18 premix blenders and 40 vitamin and mineral
manufacturers. Contact the GAIN office in Ethiopia to learn more about acquiring vitamins or
premixes from one of their many partners.
Ethiopia GAIN contact info:
TK International Building, across from the line taxi station in Bole
Addis Ababa
Ethiopia Branch Manager, Dr. Alem
Email: [email protected]
Web: gpf.gainhealth.org
List of GAIN Premix Blenders
AQC Chem Lab Pvt Ltd
Bio-Organics Nutrient Systems Ltd
Caravan Ingredients
DSM Nutritional Products LTd
Eurogerm
Fortitech
Glambia Nutritionals Duetschland Gmbh
Granotec Chile SA
Hexagon Nutrition
List of Vitamin and Mineral Manufacturers
Ajay Europe, SARL
Aland (Jiangsu) Nutraceuticals Co Ltd.
Akzo Nobel Functional Chemicals Pte Ltd
BASF SE
Beijing Vita Sci-Tech Co Ltd
Calibre Chemicals
Canton Laboratories Pvt Ltd
Chemische Fabrik Budenheim KG
Crown Technology, Inc

45
LycoRed
Muhlenchemie/ SternVitamin
Piramal Enterprise Ltd
Pristine Organics Pvt Ltd
Research Products Company
Shree Additives (Pharma and Foods) Ltd
The Wright Group
Ufuk Kimya Llac San. Tic. Ltd. Stl
Dr. Paul Lohman GmbH KG
DSM Nutritional Products Ltd
Industrial Metal Powders Pvt Ltd
Israel Chemical Ltd
Jiangsu Brother Vitamins Co Ltd
Jiangxi tianxin Phamaceutical Co Ltd
Jubilant Organosys Ltd
K&S Kali and Eire Ltd
Lasons Intia Pvt Ltd
Lehmann and Voss
Lianyungang and Debang
Lonza Ltd
Etc.
Select premix blenders are shown below.
BASF Corp.
Offices in Europe, Africa (Kenya), America,
and Asia
www.basf.com
Tel: +49 (0)621 60-0
+1 800 526-1072 (Toll free)
Fax: +49 (0)621 60-42525
DSM Nutritional Products
Offices in Europe, Africa (Egypt), South
Africa), America, and Asia
www.dsm.com
Tel: +31 (0)45 578 8111 (Netherlands)
+27 11 398 6900 (South Africa)
Fortitech Co.
Offices in Europe, Africa (South Africa),
America and Asia
www.fortitechpremixes.com
Tel: +1 518 372 5155 (USA, headquarters)
+27 11 398 6900 (South Africa)
Hexagon Chemical Corporation
1335 G. Araneta Avenue, SMH
Quezon City, Philippines, 1100
Hexagonchemical.com.ph
Tel: +632 781-5835/781-1447
+632 740-7604/731-4875
Email: [email protected]
46
Watson Inc.
301 Herrernan Drive
West Haven CT 06516 USA
Several international distributors
www.watson-inc.com
Tel: +1-800-388-3481
Email: [email protected]
The Wright Group
P.O. Box 821
Crowley, LA 70526 USA
Several international distributors
www.thewrightgroup.net
Tel: +1 (337) 783-3096 (customer service)
+1 (337) 783 3096 ext. 158 (sales)
+1 (800) 201-3096 (toll free)

47
Chapter 6:
Chemical Analysis

48
6.1 Qualitative Method1
Principle
This method determines if there is vitamin A in the oil, at concentrations above the cut-
off point of 10 mg/L (ppm). Retinol acetate or palmitate in oil will react with a colorimetric
solution of trifluoroacetic acid (TFA) in dichloromethane (DCM) to form anhydroretinol. This
compound has a fleeting blue color that can be observed within ten seconds after the reaction.
Safety Precautions
Trained laboratory technicians should wear proper personal protective equipment at all times.
Critical Points
The chromogenic reagent (TFA dissolved in DCM) is unstable and should be used within
5 days if stored at room temperature, or within 14 days if stored in a refrigerator. Acetic
anhydride may be added to the solution to keep it stable at room temperature for 18 days. The
solution should be removed from the refrigerator at least 2-3 hours prior to use to let it warm to
room temperature.
Because vitamin A is unstable in light, amber flasks and bottles are recommended.
Materials
1. Test tube
2. Pipette
3. 1-L glass amber bottle
Chemical Reagents
1. Chromogenic reagent
- Dissolve about 30 mL of triflouroacetic acid in 60 mL dichloromethane. Store in
a brown bottle.
Methods
1. Place about 0.5 mL of oil in a test tube
1 Source: (34; 35)

49
2. Add 3 mL of chromogenic reagent to the tube.
3. Look for the development of a blue color
Interpretation
If the solutions turns blue or light blue shortly after adding the chromogenic reagent,
vitamin A is present in the solution, above the cut-off level of 10 mg/L. The intensity of the
color corresponds to the concentration of vitamin A in the oil.
If no blue color develops, or if it is barely visible, vitamin A is either absent or below the
cut-off point of 10 mg/L.
6.2 Semi-Quantitative Method1
Principle
Retinol acetate or palmitate in oil will react with a colorimetric solution of trifluoroacetic
acid (TFA) in dichloromethane (DCM) to form anhydroretinol. This compound has a blue color
whose intensity is proportional to the concentration of vitamin A in the sample. The color of the
sample can be compared to colors from a known set of standards.
Critical Points
The chromogenic reagent (TFA dissolved in DCM) is unstable and should be used within
5 days if stored at room temperature, or within 14 days if stores in a refrigerator. Acetic
anhydride may be added to the solution to keep it stable at room temperature for 18 days. The
solution should be removed from the refrigerator at least 2-3 hours prior to use to let it warm to
room temperature.
Because the blue color is fleeting, the comparison should be made within the first 10
seconds of reaction.
While TFA in DCM is recommended, TFA can be replaced by tricloroacetic acid (TCA)
or antimony trichloride, and DCM can be replaces by hexane or chloroform. TCA is generally
cheaper and more readily available, but is more corrosive and less stable.
Because vitamin A is unstable in light, amber flasks and bottles should be used.
1 Source: (34; 35)

50
Materials
1. Balance
2. Beaker (50-100 mL)
3. Colorimetric scale of standard copper sulfate solutions
4. Dark glass bottle with stopper
5. Rubber gloves
6. Glass syringe (5-10 mL) with tip resistant to dichloromethane (i.e. Teflon)
7. Glass test tubes
8. Graduated pipettes (5-10 mL)
9. Pasteur pipettes and bulbs
10. 50 mL amber volumetric flask
Chemical Reagents
1. Chromogenic reagent
- Dissolve 30 mL of triflouroacetic acid in 60 mL dichloromethane. Store in a
brown bottle in a cool environment for up to 4 months.
2. Colorimetric Standards
- Prepare the following dilutions from a 300 g/L stock solution of copper sulfate
(CuSO4·5H2O):
Volume CuSO4·5H2O
300 g/L stock (mL)
Volume distilled water
(mL) to make total
volume to 10 mL
Concentration of
CuSO4·5H2O
Approximate
concentration of
retinol (mg/kg)
1 9 30 10
2 8 60 20
3 7 90 30
4 8 120 40
- Add 5 mL of each copper sulfate standard into a test tube indicating the concentration of
retinol it represents. Close the tubes tightly to prevent evaporation.
3. Optional alternate colorimetric reagents
- Tricholoracetic acid: Dissolve 25 g TCA in 35 mL of dichloromethane and heat gently
to dissolve. Make up the solution to 50 mL with solvent. 15 mL acetic anhydride may be

51
added to increase the stability of the solution, which is otherwise affected by moisture.
Store in a brown bottle.
- Antimony trichloride (Carr Price Solution): Dissolve 100 g antimony trichloride
(SbCl3) in 300 mL chloroform. 15 mL acetic anhydride may be added to increase the
stability of the solution, which is otherwise affected by moisture. Store in a brown bottle
away from light, and keep as dry as possible.
Methods
1. Dilute oil samples
a. In an amber 50 mL volumetric flask, add 10.0 g of oil using a Pasteur Pipette and
a mass balance.
b. Make up the volume of the flask using DCM.
2. React with chromogenic solution
a. In a test tube similar to the ones holding the copper sulfate standards, pipette 3.0
mL of the chromogenic reagent. Stand tube next to the standards.
b. Inject rapidly. 1.0 mL of the diluted oil sample and mix quickly on a vortex. A
syringe is recommended for rapid injection.
3. Interpret the result
a. Within 5-10 seconds, compare the color intensity developed against the set of
standard copper sulfate tubes. Do not interpolate values.
b. Discard the residual chromogenic reagent and oil mixture into a bottle containing
dissolved sodium bicarbonate. Label the bottle as waste and dispose of according
to local regulations for hazardous waste.
6.3 Quantitative Method for Vitamin A1
Principle
Retinol and its esters absorb a maximum of UV light at a wavelength of 325 nm. Other
substances naturally in oils absorb light at a similar wavelength, so blanks of unfortified oil must
be read to correct for this phenomenon. Alternatively, the absorbance of the fortified oil could
1 Source: (34; 36; 37)

52
be read and then the sample subjected to 35 minutes of UV radiation. The radiation will destroy
the retinol esters, so the difference between the absorbance before and after irradiation tells the
absorbance of vitamin A.
Critical Points
Protect samples from light as much as possible by wearing black clothing and covering
samples with foil or dark material.
Ensure spectrophotometer is calibrated frequently according to manufacturer instructions.
Materials
1. UV Spectrophotomter (325 nm) and quartz cuvettes
2. Vortex mixer
3. Beaker (250 mL)
4. Pasteur pipettes
5. 50 mL amber volumetric flasks
6. Graduated pipettes (to measure 2, 3, and 8 mL)
Chemical Reagents
1. Dicholoromethane – OR –
2. Hexane, AR
Methods
1. Dilute the oil sample
a. Use a 50 mL volumetric flask. The flask should be amber because vitamin A is
light sensitive.
b. Transfer 1.0 g of oil into the flask using a Pasteur pipette. Record the mass to 4
decimal places.
c. Add solvent (dichloromethane or hexane) to the flask to dissolve oil and make up
to volume.
d. Repeat the dilution using unfortified oil from the same batch as a standard.

53
2. Read the absorbance of samples and unfortified controls
a. Turn on the spectrophotometer and allow it to warm up. Set absorbance
wavelength to 325 nm.
b. Zero the absorbance of the pure solvent (dichoromethane or hexane). Use 1 cm
quartz cuvettes.
c. Read the absorbance of the fortified and unfortified oil samples at 325 nm.
3. Calculate
a. Correct readings of the samples by subtracting the absorbance of the unfortified
oil from the absorbance of the fortified oil. This value is Abscorrected below.
b. Calculate retinyl palmitate concentration using the following equation:
Where:
Parameter Explanation Value
a Retinyl palmitate absorption coefficient in…
…dichloromethane (mg-1
cm-1
L)
…hexane (mg-1
cm-1
L)
0.094
0.092
Vf Final volume (mL) ~50
w Weight of the sample (g) ~1
CF Correction factor of spectrophotometer Ideally 1
6.4 Quantitative Method for Vitamin D1
Principle
After the addition of an internal standard (vitamin D2) and basic hydrolysis, vitamin D3 is
extracted with n-heptane. The fraction that contains vitamin D2/D3 is separated by preparative
normal-phase liquid chromatography (LC). After evaporation and dilution in acetonitrile-
1 Source: (33)

54
methanol, vitamin D3 is determined by reversed-phase LC with UV detection at 265 nm. A
separatee test portion is analyzed in parallel to confirm the absence of endogenous vitamin D2.
Equipment
1. Liquid chromatograph for semipreparative cleanup – with an autoinjector or loop
injector, a fraction collector, a UV detector, an integrator, and a column thermostat.
Operating conditions: injection volume, 500 μL; column temperature, 35°C; wavelength,
265 nm; flow rate, 1.5 mL/min
2. LC column for semipreparative cleanup – Silica 250 x 4.6 mm, particle size (dp) = 5 μm
(Nucleosil 50-5, or equivalent) with precolumn, silica, 30 x 40 mm, dp = 5μm (Nucleosil
50-5, or equivalent).
3. Liquid chromatograph for qualitative analysis – with autoinjector or loop injector, a UV
detector, and an integrator or data processor. Operating conditions: injection volume,
100 μL; wavelength, 265 nm; and flow rate, 1.3 mL/min.
4. LC column for quantitative analysis – C18, 250 x 4.6 mm, dp = 5μm with precolumn,
C18, 4.0 x 4.0 mm, dp = 5μm (LiChroCART 4-4, or equivalent).
5. UV spectrophotometer – Measure absorbance at 265 nm in 1 cm quart cuvettes
6. Reflux apparatus – to fit 300 mL Erlenmeyer flasks with ground-glass neck, condenser
length ca 50 cm, with heated water bath, or equivalent.
7. Rotary evaporator – to fit 50 and 500 mL round-bottom flask, with heated water bath.
Critical Points
Stock solutions are stable in the dark at -18°C. Discard after 12 months or if purity decreases to
<90% as determined by LC. Stock solutions should be brought to room temperature before use.
Repeated cooling and warming does not affect stability. Working and intermediate standards
should be prepared monthly and stored at 4-8°C.
Chemical Reagents
1. Solvents – Methanol, n-heptane, metyl-tert-butyl ether (MTBE), cyclohexane,
isopropanol, and acetonitrile.
2. Ascorbic Acid
3. Ethanol – Absolute, 99.5%
4. Ethanol – 40%
a. Dilute 400 mL ethanol to 1 L with water
5. Potassium hydroxide (KOH) solution - 50% w.w and 1 M
a. Dissolve 500 g KOH pellets in 500 mL water
b. Dissolve 56 g KOH pellets in water and dilute to 1 L

55
6. Phenolphthalein Solution – 1% w/w
a. Dissolve 1 g phenolphthalein in ethanol and dilute to 100 mL
7. 2,6-Di-tert-butly-4-methylphenol – BHT
8. Cyclohexane-n-heptane (1+1)
a. Dilute 500 mL cyclohexane to 1 L with n-heptane
9. Mobile phase 1 – 0.5% isopropanol and 2% MTBE in cyclohexane-n-heptane
a. Mix 5 mL isopropanol and 20 mL MTBE with 1 L cyclohexane-n-heptane (1+1)
10. Mobile phase 2 – Isopropanol-n-heptane (20+80)
a. Dilute 200 mL isopropanol to 1 L with n-heptane
11. Mobile phase 3 – Methanol-acetonitrile (20+80)
a. Dilute 200 mL methanol to 1 L with acetonitrile
12. Vitamin D2, ergocalciferol – purity of >98%
13. Vitamin D2 standard solutions
a. Stock standard solution – 1.00 mg/mL (0.100 g vitamin D2 in 100 mL ethanol)
b. Working standard solution – 20 μg/mL (Dilute 2.0 mL stock to 100 mL with
ethanol)
c. Internal standard solution – 0.8 μg/mL (Dilute 4.0 mL working standard to 100
mL with ethanol)
d. Internal standard solution – 0.2 μg/mL (Dilute 1.0 mL working standard to 100
mL with ethanol)
14. Vitamin D3, cholecalciferol – crystalline form, purity of >98%
15. Vitamin D3 standard solutions
a. Stock standard solution – 1.00 mg/mL (0.100 g vitamin D3 in 100 mL ethanol)
b. Working standard solution – 20 μg/mL (Dilute 2.0 mL stock to 100 mL with
ethanol)
c. Internal standard solution – 0.6 μg/mL (Dilute 3.0 mL working standard to 100
mL with ethanol)
16. Vitamin D2 and D3 working standard solutions
a. 5 μg/mL of both vitamins
i. Transfer 0.5 mL of each stock solution to a 50 mL round-bottom flask.
ii. Evaporate to dryness and dissolve residue in cyclohexane-n-heptane
(1+1).
iii. Dilute to 100 mL.
b. 0.8 μg/mL of both vitamins
i. Dilute 2.0 mL of each working standard solution to 50 mL with
acetonitrile.
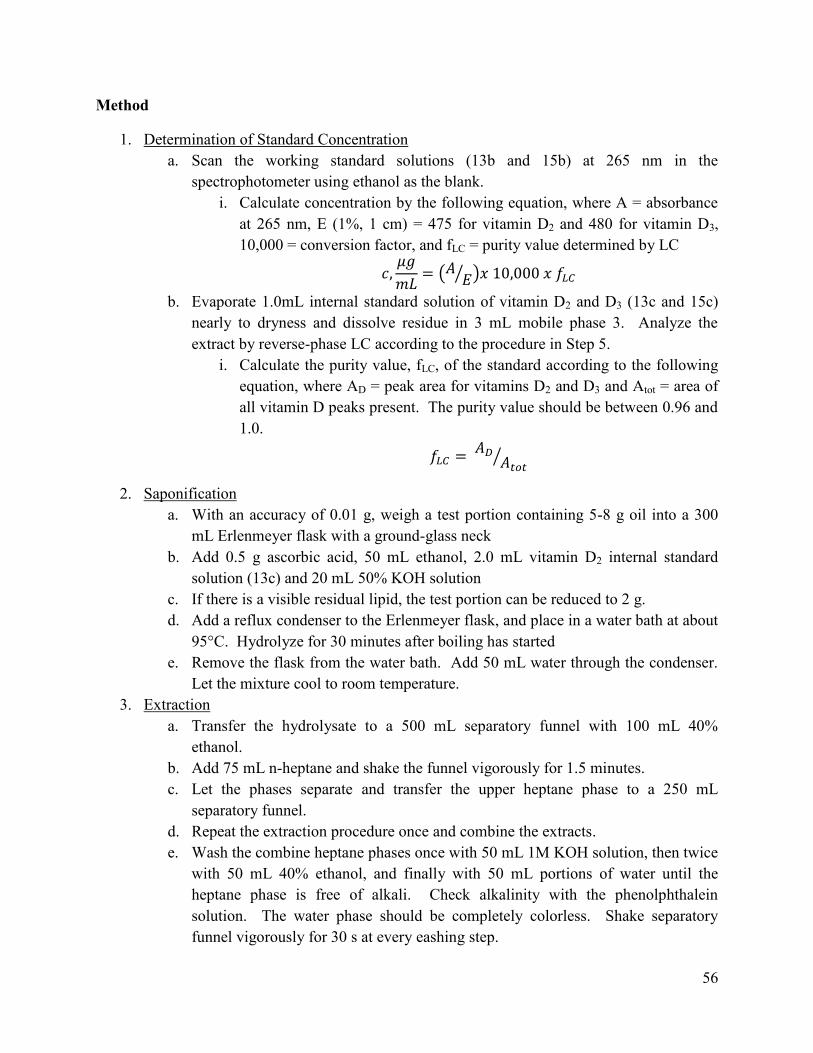
56
Method
1. Determination of Standard Concentration
a. Scan the working standard solutions (13b and 15b) at 265 nm in the
spectrophotometer using ethanol as the blank.
i. Calculate concentration by the following equation, where A = absorbance
at 265 nm, E (1%, 1 cm) = 475 for vitamin D2 and 480 for vitamin D3,
10,000 = conversion factor, and fLC = purity value determined by LC
b. Evaporate 1.0mL internal standard solution of vitamin D2 and D3 (13c and 15c)
nearly to dryness and dissolve residue in 3 mL mobile phase 3. Analyze the
extract by reverse-phase LC according to the procedure in Step 5.
i. Calculate the purity value, fLC, of the standard according to the following
equation, where AD = peak area for vitamins D2 and D3 and Atot = area of
all vitamin D peaks present. The purity value should be between 0.96 and
1.0.
2. Saponification
a. With an accuracy of 0.01 g, weigh a test portion containing 5-8 g oil into a 300
mL Erlenmeyer flask with a ground-glass neck
b. Add 0.5 g ascorbic acid, 50 mL ethanol, 2.0 mL vitamin D2 internal standard
solution (13c) and 20 mL 50% KOH solution
c. If there is a visible residual lipid, the test portion can be reduced to 2 g.
d. Add a reflux condenser to the Erlenmeyer flask, and place in a water bath at about
95°C. Hydrolyze for 30 minutes after boiling has started
e. Remove the flask from the water bath. Add 50 mL water through the condenser.
Let the mixture cool to room temperature.
3. Extraction
a. Transfer the hydrolysate to a 500 mL separatory funnel with 100 mL 40%
ethanol.
b. Add 75 mL n-heptane and shake the funnel vigorously for 1.5 minutes.
c. Let the phases separate and transfer the upper heptane phase to a 250 mL
separatory funnel.
d. Repeat the extraction procedure once and combine the extracts.
e. Wash the combine heptane phases once with 50 mL 1M KOH solution, then twice
with 50 mL 40% ethanol, and finally with 50 mL portions of water until the
heptane phase is free of alkali. Check alkalinity with the phenolphthalein
solution. The water phase should be completely colorless. Shake separatory
funnel vigorously for 30 s at every eashing step.

57
f. Transfer the washed heptanes phase to a 500 mL round-bottom flask. Add some
granules of BH and 15 mL ethanol.
g. Evaporate with a rotary evaporator at about 45°C. Stop immediately withn phase
is dry.
h. Dissolve the residue in cyclo-hexane-n-heptane (1+1)
i. Transfer the extract to a 2 mL volumetric flask, rinsing twice, and dilute to
volume. Use this dilution for semipreparative cleanup of vitamin D. At this
stage, extracts may be stored at 4-8°C overnight.
4. Chromatographic Semipreparative Cleanup
a. System setup
i. Equilibrate the system with mobile phase 1
ii. Check the stability of the rentention time by injecting the working
standard solution (16) 2 or 3 times. Normally the rention times fluctuate
less than ±1%. If there is larger variation, check the pumping unit, the
homogeneity of the mobile phase, temperature stability, and the injection
solution (must be free of water). Under the above conditions, the retention
time for vitamins D is about 17 min. The composition of the mobile phase
may have to be altered to suit the column in use.
iii. Determine the collection window from the retention time and the peak
volume.
b. Mobility phase purity
i. Evaporate 5 mL mobile phase 1 in the same way as for the test extract and
perform a reversed-phase LC run with the analytical system.
ii. If there are interfering components eluting at the same time as either
vitamin D, evaporate each solvent present in mobile phase 1, analyze by
LC, and change the possibly contaminated batch.
c. Chromatography
i. Inject the test extract, and collect the vitamin D2/D3 fraction in a 50 mL
round-bottom flask.
ii. Evaporate to dryness with a rotary evaporator at around 45°C.
iii. Dissolve the residue in 0.5 mL mobile phase 3. These residues are stable
and may be stored overnight at 4-8°C.
iv. Clean the silica column at the end of each run with mobile phase 2 for 15
minutes to eliminate any polar lipids.
5. Chromatographic Determination
a. Equilibrate the system with mobile phase 3.
b. Check the stability of the rentention time by injecting the working standard
solution (16) 2 or 3 times. Normally the rention times fluctuate less than ±1%.
c. Inject test extracts and measure peak areas. Under above conditions, the retention
time for vitamin D2 is 10 minutes and that for D3 is 11 min.

58
d. Note that the composition of the mobile phase may have to be altered to suit the
quality of the column in use. The vitamin D peaks should have a resolution value,
Rs of >1.5.
6. Calculations
Where: AD3 = peak area for vitamin D3; AD2 = peack area for vitamin D2; mD2 = weight
of vitamin D2 added to the test portion (μg); ms = weight of test portion (g); and F =
response factor (D3/D2) at 265 nm as determined from reversed-phase LC using working
standards (16).
Where: cD2 = concentration of vitamin D2 in the standard solution and cD3 =
concentration of vitamin D3 in the standard solution.
6.5 Local Laboratory Suppliers
FarMed PLC
Pastor, in front of St. Paul’s Hospital
Addis Ababa
Micron International Trading House PLC
Tel: 251-11-551 43 34
Fax: 251-11-551 14 93
Email: [email protected]
Mexico, near Coffee and Tea Authority
Addis Ababa
Neway PLC
Piazza, near St. George church
Addis Ababa
Star Avenue Chemicals
Tel: 251-11-663-12 54/251-91-163 76 84
Web: www.staravchem.com
Bole, Jema Blvd. Suite 401
Addis Ababa

59
Volumetric Educational Supply
Tel: 251-11-840 04 89/251-91-151 44 67
Email: [email protected]
Web: www.volumetric.com.et
Kirkos, in Cherkos Trading Center
Addis Ababa
6.6 Rapid Testing Kits
A variety of testing kits exists for fast, reliable analysis of certain chemicals, and can be good
alternatives given equipment limitations (i.e. no HPLC, spectrophotometer). Kits range from
quantitative to semi-quantitative.
1. BASF semi-quantitative kits for vitamin A concentrations in oil, flour, or sugar.
This kit uses a colorimetric method to determine vitamin A concentration. It operates off
the principle that retinol in an organic solution can be reacted with a chromogenic
solution to produce a blue color whose intensity is proportional to the concentration of
the retinol in the sample. There are three main steps: saponification, extraction, and
reaction with chromogenic solution. Saponification converts any ester forms to the free
alcohol form of retinol. This is done in the kit with water and 2-propanol, but it can be
done in the lab with a variety of reagents (i.e. NaOH, etc.). Next, the retinol is extracted
from the food matrix using an organic non-polar solvent. n-Hexane is used in the kit,
which is common in most laboratory methods. Salt can be added to improve the
separation. After the separation, the solution reacts with a solution of trichloroacetic acid
in dichloromethane (the chromogenic agent), similar to the Carr-Price Method. The blue
color of the sample is compared with the swatch of colors given in the kit to yield a semi-
quantitative result. The blue color is fleeting so the comparison must be made within the
few seconds of reaction with the chromogenic reagent. The blue color typically shows
only if the vitamin A concentration is above 0.5 mg/kg.
This kit is very affordable, at about 3 U.S. cents per sample.

60
2. iCHECK CHROMA by BioAnalyt: quantitative kit for vitamin A in vegetable oils.
This is a popular and trusted kit that shows good comparison with comparable
HPLC methods. It follows a similar procedure to that outlined above, but includes a
portable photometer that gives exact, quantitative results. It provides the exact level of
vitamin A in retinol equivalents per kg.
The kit costs around $7,000.
3. iCHECK CAROTENE by BioAnalyt: quantitative kit for total carotene content in
vegetable oils.
This is a popular and trusted kit that shows good comparison with comparable
HPLC methods. It is similar to the other kit provided by BioAnalyt for vitamin A
concentration, but gives total beta-carotene or carotenoid content.
Table 14. Companies selling rapid test its for fortified oil
Contact Information
BASF Corporation:
Tel: + 49 (0)621 60-0 (Germany headquarters)
+ 1-973-245-6000 (North America Branch)
+ 1-800-526-1072 (Toll free)
Web: www.basf.com
For more BASF rapid testing kits, visit:
http://www.food-fortification.com/Videos.aspx
BioAnalyt:
Tel: +49 (0)3328-35150-00
Email: [email protected]
Web: www.bioanalyt.com
Rheinstraβe 17, 14513, Teltow, Germany
For more BioAnalyt testing kits, visit:
http://www.bioanalyt.com/images/content/downloads/pro
ducts/BioAnalyt_Product_Catalogue_June_2013_EN.pdf
6.7 External Analysis
In the case of limited laboratory equipment, supplies, or personnel, samples may be sent
to external labs for analysis. In this case, the manufacturer must legally wait for test results
before the product may be shipped out for sale to ensure quality assurance of the product. The
following is a non-comprehensive list of labs specializing in food testing.

61
Domestic Laboratories
Bless Agri Food Laboratory Services, PLC
Tel: +251 (0)913 04 75 55
Web: www.blessagri.com
Legetafo, Addis Ababa
Ethiopian Conformity Assessment Enterprise
Tel: +251 (0)11 646 05 69
Web: www.eca-e.com
Bole, Addis Ababa
Branch offices in Adama, Hawassa, Bahir Dar, Dessie, Dire Dawa, Mekelle, and Jimma
International Laboratories
Campden BRI
Tel: +44 (0)1386 842000
Email: [email protected]
Web: www.campdenbri.co.uk
Campden, United Kingdom
Council for Scientific and Industrial Research (CSIR)
Tel: +27 (0)82 896 2314
Email: [email protected] (Michael Waldner)
Web: www.csir.co.za/food_and_beverage
Offices in Cape Town, Kwalazulu Natal and Pretoria, South Africa
InterTek Worldwide
Tel: +49 421 65727 390
Email: [email protected]
Web: www.intertek.com
Offices in Europe, the Middle East and Africa
Muriex NutriSciences (MicroChem Siliker)
Tel: +1-312-938-5151 (Headquarters)
Email: [email protected]
Web: www.merieuxnutrisciences.com
70 offices in 18 countries, including France, India, Italy, South Africa, and Turkey

62
Chapter 7:
Packaging

63
As is the case in all industrially processed foods, fortified foods must be correctly identified
in appropriate packaging. Such packaging must include clear information such as: Product brand name
Address of manufacturer
List of ingredients
Minimum levels of vitamins and minerals
Date of expiry
Certain vitamins and minerals are sensitive to environment conditions such as light or
heat. Packaging should be designed to avoid degradation of the vitamins due to external
influences, such as light. For instance, vitamin A in the form of retinyl palmitate, is unstable
under UV light, so dark or opaque packing is recommended for food containing vitamin A.
Several B vitamins as well as folic acid are also labile to light.

64
Chapter 8:
Further Reading

65
Guidelines on Food Fortification with Micronutrients
Produced by: World Health Organization/ Food and Agriculture Organization of the U.N.
Edited by: Lindsey Allen, Bruno de Benoist, Omar Dary, Richard Hurrall
This document explains the basic principles of food fortification and how to implement
successful fortification programs, from both the public to the private level. It gives detailed
discussions of each vitamin and mineral with its related deficiencies as well as the properties of
each vitamin and mineral that may be used in fortification. It may be useful for government
bodies seeking to choose which type of fortification program to implement, levels of fortificants
to mandate, the type of fortificant, and an estimated cost of the program. It also instructs
governments how to properly monitor and evaluate implemented programs. It is a very
comprehensive discussion of fortification in general.
Assessment of Feasibility and Potential Benefits of Food Fortification
By: The Ethiopian Federal Ministry of Health
This document is useful for Ethiopian consumers and producers alike in understanding
the government rationale for fortification. It provides a justification for fortification in Ethiopia
as presents several options for pre-mixes and technology. It provides country-specific
information with respect to the choice of a proper food vehicle as well as an estimated cost for
the new program.
Fortification Handbook: Vitamin and Mineral Fortification of Wheat Flour and Maize Meal
By: The Micronutrient Initiative
This document provides a helpful overview of the rational behind fortifying wheat flours
as well as helpful hints for how companies wishing to fortify flours should proceed. While it is
tailored toward flour producers, its discussion of micronutrient deficiencies or recommended pre-
mixes may be useful for factories wishing to fortify other foods (i.e. oil).
66
Capacity Building of Small Millers: Training Manual
Produced by: Health (South Africa), GAIN, Micronutrient Initiative, UNICEF
This manual provides a comprehensive overview for millers looking for fortify from
social, business, and technical perspectives. It is well designed and easy to read. Topics include
benefits of fortification, regulations, the fortification process and equipment, quality assurance,
proper packaging, and health and safety.
In addition, many textbooks exist dealing solely with fortification. Titles include:
Handbook of Food Fortification and Health: from Concepts to Public Health
Applications by Victor Preedy, Rajaventhan Srirajaskanthan and Vinood B. Patel
Food Fortification: Food fortification with micronutrients by Habtamu Fekadu Gemede
Food Fortification and Supplementation: Technological, Safety, and Regulatory Aspects
by Berry Ottaway

67
Chapter 9:
Conclusions

68
Final Guidelines for Edible Oil Refiners:
Food fortification of edible oils is a promising intervention method to reduce rates of
vitamin A and other micronutrient deficiencies in Ethiopia, a country with the 2nd
highest
rates of malnutrition in sub-Saharan Africa.
The Federal Ministry of Health, the Food, Medicine and Health Care Administration and
Control Authority, the Federal Ministry of Industry, the Federal Ministry of Trade, and
the Federal Ministry of Commerce are working together to pass legislation mandating
fortification of edible oils and wheat flour within Ethiopia.
The oil fortification process is simple: a mixing step is added before packaging in which
the refined oil is mixed with fat-soluble vitamins, such as vitamin A or D.
All equipment (mixing tank and optional feeder) may be imported or built locally. If the
latter, companies should consider the types of materials and designs appropriate as well
as the level of automation needed. Locally built designs offer lower prices at the expense
of greater sophistication.
Vitamin pre-mixes can be obtained through many suppliers. The GAIN office in Addis
Ababa can help in finding suppliers. The amount of vitamins to be added is dictated by
regulations set by FMHACA.
Quality assurance is necessary to determine levels of vitamins in fortified foods. Nutrient
analysis can be measured quantitatively in well-equipped laboratories, and select
vitamins may be measured quantitatively through BioAnalyt kits. Samples may be
outsourced to external laboratories for complete analysis. Several semi-quantitative
methods exist for fast, routine checks of fortificant levels.
Follow all guidelines set by FMHACA with respect to QA and packaging. More
guidelines with respect to fortification can be found in literature.

69
Works Cited
1. Allen, Lindsey, et al. Guidelines on Food Fortification with Micronutrients: World Health
Organization, Food and Agricultural Organization of the United Nations, 2006.
2. The World Health Report 2002: reducing risks, promoting healthy lives: overview. Geneva :
World Health Organization, 2002.
3. United Nations Development Programme. Human Development Report. New York : 2013.
4. The World Bank. Country Data: Ethiopia. World Development Indicators. New York : 2014.
5. Food Prices, Consumption and Nutrition in Ethiopia: Implicaions of Recent Price Shocks.
Dorosh, Paul: IFPRI. Institute of Medicine Workshop on Mitigating the Nutrition Impacts of the
Global Food Crisis, July 2009.
6. Market-Based Solutions to Promote Non-Emergency Nutrition in Ethiopia. Jessica Garrels, et
al. New York : Columbia University and TechnoServe, May 2012.
7. Common micronutrient deficiencies among food aid beneficiaries: Evidence from refugees in
Ethiopia. Heider, Jamal, Addis Ababa : Ethiop J Health Dev., 2011, Vol. 25.
8. Bagariansky, Jack. An Economic Analysis of Flour and Oil fortification in Ethiopia: Damage
Assessment Report and Benefit Cost Calculation : Wolrd Bank, September 2010.
9. Thurnham, David. Vitamin A Supplementation: Beneficial effects on mortality and morbidity
in children aged six months to five years. Sight and Life. Special Vitamin A Issue, 2011, Vol. 25,
3.
10. Magnitude and Distribution of Vitamin A Deficiency in Ethopia. Demisse, Tsegaye, et al.:
Health, Population, Nutrition, 2009.
11. World Health Organization. Vitamin D supplementation to imporve treatment outcomes
among children diagnosed with respiratory infection.: e-Library of Evidence for Nutrition
Actions, 2011.
12. Watson, Stephani. Vitamins and Supplements Lifestlye Guide: Why do you need iron? :
WedMD, 2014.
13. Chaudhary, Roshan. Basics of Food Chemistry. New Delhi : Mehra Offset Press, 2008.
14. Food and Agriculture Organization. Nutrition Country Profiles. Federal Democratic
Republic of Ethiopia. 2010.
15. Role of Zinc in Pediatric Diarrhea. Bajait, Chaitali and Thawani, Vijay.: Indian Journal of
Pharmacology, 2011, Vol. 43.
16. UNICEF. Iodine Deficiency Disorders and Universal Salt Iodization. Nepal : 2002.

70
17. USAID. Ethiopia National Nutrition Strategy: Review and Analysis of Progress and Gaps:
One Year On. Addis Ababa : 2009.
18. Sablah, Mawuli, Grant, Fred and Fiedler, John L. Food Fortification in Africa. Sight and Life.
27, 2013, Vol. 3.
19. Assessment of Feasibility and Potential Benefits of Food Fortification. Addis Ababa :
Government of the Federal Democratic Republic of Ethiopia, 2011.
20. Sperko, Walter. Rust on Stainless Steel. Greensboro : Sperko Engineering Services, Inc,
December 2009.
21. Demographic and Health-Related Factors of Subclinical Vitamin A Deficiency in Ethiopia.
Demisse, Tsegaye et al. : Health, Population, Nutrition, 2009.
22. Zimmerman, Sarah. Fifteen Years of Fortifying with Folic Acid: Birth defects are reduced
and healtcare expenses are averted. Sight and Life. Vitamin A, 2011, Vol. 25, 3.
23. E., Bauernfeind J.C. and DeRitter. Cereal Grain Products in Nutrient Addition to Foods.
Trumbull, CT : Food and Nutrition Press, 1991.
24. Flour Foritification Initiative. Capacity Building of Small Millers: Training Manual.
25. AAOC Methods. 12 ed. Ferrous Salts. Official Final Action (7.74).
26. Colorimetric determination of vitamin A with trichloroacetic acid. Bayfield, R.F. and Cole,
E.R. New York : Methods in Enzymology, 1980, Vol. 67.
27. Official Methods of Analysis of AOAC International. Cunnif, D. Gaithersburg : AOAC
International, 1997, Vol. 16. 944.02.
28. Analysis of Vitamin A and E by High Performance Liquid Chromatography. 86-06, AACC.
29. USAID. Manual of Methods for Determing Micronutrients in Fortified Foods. Washington
D.C : 2010.
30. Liquid Chromatographic Determination of Total Niacin in Beef, Semolina, and Cottage
Cheese. JA, Tyler TA and Genzale. 3: J Assoc of Anal Chem, 1990, Vol. 73.
31. Determination of Vitamin B2 in Complete Feeds and Premixes with HPLC. Schuep, W and
Steiner, K. Roche, Switzerland : Animal Nutrition and Health Vitamins and Fine Chemicals
Division.
32. Folic Acid (pteroylglutamic Acid) in Vitamin Preparations. Horwitz, W and Latimer, GW.
Maryland : Official Methods of Analyis of AOAC International, 2007, Vol. 8th Ed.
33. AOAC Method 2002.05. Determination of Cholecalciferol (vitamin D3) in Selected Foods.
Liquid Chromatography. First Action. 2002.

71
34. Guamuch, Monica, Makhumula, Philip and Dary, Omar. Manual of Laboratory Methods for
Fortified Foods (Vitamin A, Riboflavin, Iron, and Iodine). Addis Ababa : Ethiopian Health and
Nutrition Research Institute, 2007.
35. Bayfield, R.F. and Cole, E.R. Colorimetric determination of vitamin A with tricghloroacetic
acid. [book auth.] D.B. and Wright, L.D. McCormick. Methods in Enymology. New York :
Academic Press, 1980.
36. Spectrophotometric Determination of Vitamin A in Oils and Fats. Kambargar, T. and Fawzi,
A.B. 3,: J Assoc Off Anal Chem, 1978, Vol. 61.
37. Colorimetric Reagents for Determining Vitamin A in Feeds and Foods. Subramahyam, G.B.
and Parrish, D.B. 5: J Assoc Off Anal Chem, 1976, Vol. 59.

72
Appendix

1 | P a g e
Appendix A: About vitamin and minerals
A-1: Role of vitamin and minerals
Table A- 1. Role of Vitamins
Vitamin Chemical
Form
Soluble
In..
Role Effects of Deficiency Range of
RNI (varies
w/ age/sex)
Natural Sources Toxicity
Vitamin A Retinols
(retinyl esters
or palmitates);
Pro-vitamin A
carotenoids
(converted to
retinols in
body)
Fat Function in visual
cycle in eye retina;
function in body
tissues to maintain
growth and
soundness of cells
Blindness or
xerophthalamia;
increased severity of
infections, measles,
diarrhea; increased
mortality
375-850
μg/d
Animal products
(retinols); green
leafy vegetables,
yellow vegetables,
yellow and orange
fruits
(carotenoids)
Liver damage,
bone
abnormalities,
joint pain,
headaches,
vomiting; at
concentrations
above 900
mg/day or
60,000 mg/4-6
mos.
B Vitamins
Thiamin (B1) Water Co-enzyme
functions in
metabolism of
carbohydrates and
branched chain
amino acids
Beriberi (affected
cardiovascular system-
wet, or affected
nervous system – dry;
may be accompanied
by trouble speaking,
walking, or lower leg
paralysis);
polyneuritis,
Wernicke-Korsakoff
0.1-1.5 mg/d Pork, organ
meats, whole
grains, legumes
No

2
Syndrome, affected
nervous system);
Riboflavin
(B2)
Water Co-enzyme
functions in redox
reactions
Stunted bone growth,
angular cheilitis or
stomatitis (mouth
inflammations),
dermatitis
0.3-1.6 mg/d Milk and dairy,
meats, green
vegetables
No
Niacin Nicotinic
acid;
Nicotinamide
Water Needed for
hydrogen transfer
in numerous
dehydrogenases
Pellagra (chronic
wasting disease),
diarrhea, dementia,
dermatitis
2-17 mg
NE/d
Liver, lean meats,
whole grains,
legumes
No
Vitamin B6 Pyridoxine,
Pyridoxamine,
Pyridoxal
Water Reacts to riboflavin
to form PLP,
needed for
metabolism of
amino acids,
glycogen, and
sphingold bases
Nasolateral seborrhea
(skin inflammation),
glossitis (tongue
inflammation)
peripheral neuropathy,
infantile convulsions
0.1-2.0 mg/d Meats, vegetables,
whole grain
cereals
At
concentrations
above 100
mg/day
Pantothenate Water Needed for fatty
acid metabolism,
component of CoA
Fatigue, sleep
disturbances, impaired
coordination, nausea
1.7-7.0 mg/d Animal tissues,
whole grain
cereals, legumes
No
Bitoin Water Co-enzyme
functions with
bicarbonate-
dependent
carboxylations
Fatigue, depression,
nausea, dermatitis,
muscular pains
5-35 mg/d Liver, yeast, egg
yolks, soy flour,
cereals
No
Vitamin B12 Cobalamin
and
derivatives
Water Needed for folate
cycle; needed for
conversion of
propionate and
amino acids to CoA
Demyelination of
peripheral nerves and
spinal column
0.4-2.8 mg/d Synthesized by
microorganisms
that are ingested
through foods of
animal origin
No

3
Vitamin C Ascorbic acid,
Ascorbate
Water Electron donor for
11 enzymes,
promotes iron
absorption,
stabilizes folate in
food, good
antioxidant
Scurvy (can cause
death, pseudo-
paralysis,
hemorrhages, or
gingivitis), anemia
30-80 mg/d Citrus fruits and
veggies. Vitamin
C easily lost in
heating,
transporting, and
storage
Risk of gastric
cancer, diarrhea,
and hemolysis
above 2-3 g/day
Vitamin D Cholecaliferol
(D3);
Ergocalciferol
(D2)
Fat Maintains blood
levels of calcium
and phosphate,
needed for
transcription of cell
cycle proteins
Problems with bone
mineralization, muscle
contractions, nerve
conduction, and
cellular function
5-15 μg/d Synthesized in the
skin from UV
exposure
Hypercalcuria or
hypercalcemia
Vitamin E 8 forms (--
tocophenol);
synthesized
by plants from
homogentisic
acid
Fat Antioxidant;
protects
polyunsaturated
fatty acids,
proteins, and DNA
from free radical
oxidation
Rare; Oxidative stress,
damage to cell
membranes, leaking of
cell contents to
external fluids, cardiac
or skeletal myopathies,
neuropathies, liver
necrosis, muscle and
neurological problems
Unknown
(estimated
around 7mg
TE/d)
Plants and animal
products
Low
Vitamin K Phylloquinone
(K1 – plant
source);
Menaquinone
(K2 – bacteria
source)
Fat Maintenance of
blood coagulation,;
chemical
modification of
proteins with
calcium binding
properties
Rare but serious;
hemorrhagic disease in
infants (Vitamin K
Bleeding Disease)
causes death and brain
damage
5-55 μg/d Green leafy
vegetables, liver,
fermented foods
(i.e. cheeses)
Low; fear of
liver damage or
neonatal
hemorrhages

4
Table A- 2. Role of Minerals
Mineral Purpose Deficiency Range of RNI
(varies w/ age
and sex)
Natural Sources Toxicity
Calcium 5th most prevalent element in
human body, 99% found in
skeleton, 1% found in teeth and
soft tissues; ion form has role in
most metabolic processes; stores
in bone mineral
Osteroperosis 300-1000
mg/day
Milk and dairy
product; is easily
lost through the
hair, skin, and
nails
Low, some calcium
deposits
Iodine Needed for synthesis of thyroid
hormones by the thyroid gland;
role in growth and development
of brain and central nervous
system
Fetus: abortions, stillborns,
mental deficiency/cretinism,
spastic diplegia, dwarfism,
psychomotor defects
Neonate: goiter,
hypothyroidism
Child/adolescent: goiter,
impaired mental function or
physical development
Adult: impaired mental
function, goiter,
hypothyroidism
2-30 μg/kg/day Food grown in
soils rich in iodine
or in seawater
(fish)
Iodine-induced
hypothyroidism’
levels above 40-150
μg/kg/day
Iron Carries oxygen from the lungs
to the tissues by red blood cell
hemoglobin; part of enzyme
systems in tissues
Most common deficiency;
growth stunting, lowered work
ability, decreased brain
function, anemia, depressed
immune system, mood
changes, impairment of
memory and learning ability
5-50 mg/day
(assuming a
10% iron
bioavailability
of food)
Absorption
increased by
vitamin C and
inhibited by
phenolic
compounds (tea,
coffee, coca) and
phytates (cereals,
legumes, roots,
nuts); heme iron
Possible

5
(up to 40%
absorption): red
meat, poultry, fish;
non-heme iron
(about 10-20%
absorption):
cereals, pulses,
legumes,
vegetables
Magnesium Co-factor in enzymes needed for
energy metabolism, protein
synthesis, RNA and DNA
synthesis and maintenance of
electrical potential of nervious
tissues and cell membranes. 60-
70% of magnesium stored in
skeleton, 30-40% in muscles
and soft tissues
Infrequent; nausea, anorexia,
muscular weakness, lethargy,
staggering, weight loss,
neurologic and neuromuscular
defects
26-224 mg/day Green vegetables,
legume seeds,
peas, beans, nuts;
inhibited by fibre
Above 380 mg/day;
hypermagnesium,
nausea,
hypertension,
diarrhea
Selenium Protects body tissues againt
oxidative stress; maintains
defenses against infection;
needed for growth and
development; needed for thyroid
hormone metabolism
Muscular weakness, myalgia,
congestive heart failure;
Kaschin-Beck Disease (bone
and join disease: shortening of
fingers and long bones with
growth retardation); Keshan
Disease (fatigue, cardiac
carrhythmia, loss of appetite,
cardiac insufficiency, heart
failure); increased mortality
due to AIDs
13-42 μg/day Food grown in
selenium-rich solis
Above 400 μg/day;
hair loss, structural
changes in keratin of
hair and nails,
icteroid skin,
gastrointestinal
disturbances
Zinc Central role in immune system;
component of a large number of
enzymes needed for synthesis
Growth retardation, delayed
sexual and bone maturation,
skin lesions, diarrhea, impaired
1.0-1.4 mg/day Lean red meat
whole-grain
cereals, pulses,
Above 28-45 mg/day
rare instances of
nausea, vomiting,

6
and degredation of
carbohydrates, lipids, proteins,
nucleic acids and metabolism of
micronutrients; stabilizes
molecular structure of cell
components and cell
membranes; needed for genetic
expression
appetite, increased
susceptibility to infections,
behavioral changes
legumes diarrhea, fever,
lethargy; real
concern of affecting
copper status
Folate and
Folic Acid
Essential for DNA and
biosynthesis cycle; needed
along with B6 and B12 for
methylation cycle
Nueral tube defects (improper
closure of spinal cord and
cranium resulting in spinal
bifida, anencphaly, etc.) in
pregnant women
400 μg/day Present in a low
density in most
foods; high density
in liver; adequate
in green leafy
vegetables (if
consuming three
servings/day)
Above mg amounts.
Concerns of masking
levels of pernicious
anemia (result of
Vitamin B12
deficiency)
Source: derived from (13)

7 | P a g e
A-2: Notable micronutrient levels among select subpopulations
Table A- 3. Tolerable Upper Intake Levels for Select Micronutrients
Nutrient (unit) 1-3 years 4-8 years 9-13 years 19-70 years
Vitamin A (μg RE)1 600 900 1,700 3,000
Vitamin D (μg)2 50 50 50 50
Vitamin E (mg α-tocopherol) 200 300 600 1,000
Vitamin C (mg) 400 650 1,200 1,000
Niacin (vitamin B3) (mg NE) 10 12 20 35
Vitamin B6 (mg) 30 40 60 100
Folic acid (μg DFE)3 300 400 600 1,000
Choline (mg) 1,000 1,000 2,000 3,500
Iron (mg) 40 40 40 45
Zinc (mg) 7 12 23 45
Copper (mg) 1 3 5 10
Calcium (mg) 2,500 2,500 2,500 3,000
Phosphorus (mg) 3,000 3,000 4,000 4,000
Manganese (mg) 2 3 6 11
Molybdenum (μg) 300 600 1,100 2,000
Selenium (μg) 90 150 280 1,100
Iodine (μg) 200 300 600 1,100
Fluoride (μg) 1,300 2,200 10,000 10,000
Source: (1) The FAO/WHO recommends the following UL’s for vitamins A, B3, B6, C, D, and E,
and calcium, selenium, and zinc. The remaining values are recommended by the United States
Food and Nutrition Board of the Institute of Medicine.
1 1μg RE = 3.33 IU vitamin A
2 As calciferol, where 1μg = 40 IU vitamin D
3 Refers to folic acid derived from fortified foods, or supplemental folic acid

8 | P a g e
Table A- 4. Estimated Average Requirements (EAR1) for Select Subpopulations
Nutrient (unit) 1-3 years 4-6 years 19-50 years, female Pregnant women,
second trimester
Lactating women,
0-3 months
19-50 years, male
Vitamin A (μg RE)2 286 321 357 571 607 429
Vitamin D (μg)3 5 5 5 5 5 5
Vitamin E (mg α-
tocopherol)
4 4 6 6 6 8
Vitamin C (mg) 25 25 37 46 58 37
Thiamine (vitamin B1) (mg) 0.4 0.5 0.9 1.2 1.3 1.0
Riboflavin (vitamin B2) (mg) 0.4 0.5 0.9 1.2 1.3 1.1
Niacin (vitamin B3) (mg NE) 5 6 11 14 13 12
Vitamin B6 (mg) 0.4 0.5 1.1 1.6 1.7 1.1
Folate (μg DFE)4 120 160 321 480 400 320
Vitamin B12 (mg) 0.7 1.0 2.0 2.2 2.3 2.0
Iron (mg)
15% bioavailable 3.9 4.2 19.6 >40.0 7.8 7.2
10% bioavailable 5.8 6.3 29.4 >40.0 11.7 10.8
5% bioavailable 11.6 12.6 58.8 >40.0 23.4 21.6
Zinc (mg)
High bioavailability 2.0 2.4 2.5 3.5 4.8 3.5
Moderate bioavailability 3.4 4.0 4.1 5.8 7.9 5.8
Low bioavailability 6.9 8.0 8.2 11.7 15.8 11.7
Calcium (mg) 417 500 833 833 833 833
Selenium (μg) 14 17 22 23 29 28
Iodine (μg) 64 64 107 143 143 107
Source: (1)
1 RNI is set two standard deviations above the EAR
2 1μg RE = 3.33 IU vitamin A
3 As calciferol, where 1μg = 40 IU vitamin D
4 Refers to folic acid derived from fortified foods, or supplemental folic acid

9 | P a g e
A-3: Regional and demographic data for vitamin A deficiency
within Ethiopia
Table A- 5. Regional Rates of VAD.
Regional
States
Predominantly
Urban or rural
Main Foods %
VAS*
% VAD**
Afar Rural - pastoral Livestock products, cereals
(sorghum, maize)
21.5 57.3
Tigray Rural -
agriculture
Cereals (teff), legumes
(peas, lentils, beans)
79.2 14.3
Amhara Rural -
agriculture
Cereals (teff), legumes
(peas, lentils, beans)
16.0 40.7
Addis Ababa Urban Cereals (teff), legumes
(peas, lentils, beans)
15.0 29.3
Oromiya Rural – diverse
geography
Cereals, root crops (yam,
potatoes, cassava, etc.)
10.2 56.0
SNNPR Rural – diverse
geography
Cereals, root crops (yam,
potatoes, cassava, etc.),
fruits and vegetables
33.9 11.3
Beneshengul-
Gumuz
Rural – diverse
geography
Cereals, root crops (yam,
potatoes, cassava, etc.)
7.3 27.8
Harari Urban Cereals (teff), legumes
(peas, lentils, beans)
1.1 35.8
Dire Dawa Urban Cereals (teff), legumes
(peas, lentils, beans)
11.6 48.0
National 22.6 37.7
* VAS = has received vitamin A supplementation within the past 6 months
** VAD = shows subclinical deficiency, with retinol serum levels >0.7μmol/L
Source: (21; 10)

10
Table A- 6. Demographic Distribution of VAD
Variable % VAD Deficient Sex
Female 33.5
Male 34.8
Age (months)
24 and below 33.9
25-48 34.0
49-72 35.0
Vaccination Status
None/incomplete 39.3
Complete 29.7
Vit. A supplementation
in last year
At least once 28.2
Not at all 38.2
Overall illness in last 15
days
None 31.2
At least one illness 38.0
Residence
Rural 32.8
Urban 37.3
Religion
Christian 25.6
Muslim 47.5
Household Size
5 and below 31.7
6 and above 38.2
No. under 5 children
1 or none 30.4
2 and above 38.6
Literacy of mothers
Illiterate 37.4
Literate 29.6
Parity
2 and below 29.2
3 and above 38.1
Knowledge of vit. A
Not at all 37.3
At least one fact 23.4
Age (years) of mothers
24 or below 36.2
25-35 33.7
Above 35 33.9
Source: (21; 10)

11
Appendix B: Food Fortification Programs
B-1: Wheat Flour Fortification Programs in Sub-Saharan Africa
Table B- 1. Wheat Flour Fortification Programs in sub-Saharan Africa
Country M,V,S* Dosage
(g/t flour)
Vitamin and Minerals
Nigeria M 250 Vitamin A, vitamin B1 and B2, niacin, folate, iron
Morocco M 90-120 Vitamin B1, vitamin B2, niacin, folate, iron
Cote
d’Ivoire
M 100 Iron and folate
South Africa M 200 Vitamin A, vitamin B1, vitamin B2, vitamin B6, niacin, folate,
iron, zinc
Ghana M 350 Vitamin A, vitamin B1, vitamin B2, niacin, folate, vitamin B12,
ferrous fumerate, zinc
Sudan S 200 Ferrous sulphate and folate
Congo V 250 Iron and folate
Uganda M 350 Vitamin A, vitamin B1, vitamin B2, vitamin B6, vitamin B12,
niacin, folate, ferrous fumerate, zinc
Egypt S 200 Ferrous sulphate and folate
Zambia M 200 Vitamin A, vitamin B2, vitamin B6, vitamin B12, niacin, folate,
sodium iron EDTA, zinc
- *Mandatory (all), voluntary, or some mandatory

12
B-2: Impact of Folic Acid Fortification
Table B- 2. Impact of Folic Acid Fortification
Country NTD1 prevalence pre-
fortification per 1,000 births
NTD prevalence post-
fortification per 1,000 births
Percent decrease
in NTD prevalence
Argentina
Spinal bifida2 1.27 0.66 48
Anencephaly 30.86 0.37 57
Brazil
Spinal bifida 1.45 1.42 24
Anencephaly 1.12 0.69 38
Canada
Spinal bifida 0.86 0.40 53
Anencephaly 0.52 0.32 38
Chile
Spinal bifida 1.02 0.46 55
Anencephaly 0.63 0.37 41
Costa Rica
Spinal bifida 0.73 0.29 60
Anencephaly 0.37 0.12 68
Iran
(all NTD’s)
3.16 2.19 31
Saudi Arabia
(all NTD’s)
1.9 0.76 60
South Africa
Spinal bifida 0.93 0.54 42
Anencephaly 0.41 0.37 10
United States
Spinal bifida 0.50 0.35 30
Anencephaly 0.26 0.18 31
Source: (22)
1 NTD = Neural Tube Defect
2 Spinal bifida is malformation of the spine.
3 Anencephaly is a fatal malformation of the brain.
4 This study was conducted over three months only. The authors concluded they needed more time.

13
Appendix C: Local Manufacture
Figure 12. As-built vertical mixing tank
Figure 13. Power transmission and inlet for built tank

14
Figure 14. Mixing time experimental results from locally built vertical mixer
Table C- 1. Experimental results for homoegenity in locally built vertical mixer.
0 RPM 200 RPM
Range (mg/L) 15.0 – 184.2 118.2 – 122.7
Standard
Deviation
459.0 1.61
0
0.2
0.4
0.6
0.8
1
1.2
0 20 40 60 80 100
Ta
rtra
zin
e C
on
cen
tra
tio
n (
%)
Time (s)
Mixing Time Profile
100 rpm 200 rpm 300 rpm

15 | P a g e
Appendix D: Scale-Up costs of local tanks
Table D- 1. Breakdown of estimated costs for local tank manufacture
Mixer Capacity
(L) Price (ETB)/Unit Unit Price (ETB) Price (USD)
304 Stainless Steel Sheet Metal - m2
50 1750.001 0.88 1,541.57 79.05
100 1750.00 1.31 2,298.27 117.86
500 1750.00 3.84 6,720.19 344.62
1,000 1750.00 6.10 10,667.63 547.06
5,000 1750.00 17.82 31,192.34 1,599.61
10,000 1750.00 28.29 49,514.75 2,539.22
25,000 1750.00 52.12 91,206.95 4,677.28
50,000 1750.00 82.73 144,782.00 7,424.72
304 SS Pipe - m
50 431.032 0.56 241.94 12.41
100 431.03 0.58 251.63 12.90
500 431.03 1.00 430.27 22.07
1,000 431.03 1.26 542.11 27.80
5,000 431.03 2.15 927.00 47.54
10,000 431.03 2.71 1,167.94 59.89
25,000 431.03 3.68 1,585.14 81.29
50,000 431.03 4.63 1,997.16 102.42
SS electrodes - per 90 sticks
50 2500.00 1.00 2,500.00 128.21
100 2500.00 1.173 2,925.00 150.00
1 Assuming no cost reduction in SS sheet metal for buying in bulk
2 Assuming no cost reduction in SS bar for buying in bulk
3 Units based on ratios of summed height and diameter – the areas to be welded

16
500 2500.00 2.00 5,000.00 256.41
1,000 2500.00 2.52 6,300.00 323.08
5,000 2500.00 4.31 10,775.00 552.56
10,000 2500.00 5.43 13,575.00 696.15
25,000 2500.00 7.37 18,425.00 944.87
50,000 2500.00 9.29 23,225.00 1,191.03
Motor, Motor Drive
50 14,000.00 0.75 HP1 14,000.00
2 717.95
100 14,000.00 0.75 HP 14,000.00 717.95
500 14,001.00 0.75 HP 14,001.00 718.00
1,000 14,000.00 0.75 HP 14,000.00 717.95
5,000 15,990.00 3.0 HP 15,990.00 820.00
10,000 21,700.00 10.0 HP 21,700.00 1,112.82
25,000 39,780.00 50.0 HP 39,780.00 2,040.00
50,000 125,590.00 100.0 HP 125,590.00 6,440.51
Parts and Accessories
Bearings, all sizes 260.00 2 520.00 26.67
Valves, all sizes 30.00 1 60.00 3.08
Pulley 100 2 200 10.26
Labor
50 5,000.00 - 5,000.00 256.41
100 5,500.00 - 5,500.00 282.05
500 6,000.00 - 6,000.00 307.69
1,000 6,500.00 - 6,500.00 333.33
5,000 7,000.00 - 7,000.00 358.97
10,000 8,000.00 - 8,000.00 410.26
25,000 9,000.00 - 9,000.00 461.54
50,000 10,000.00 - 10,000.00 512.82
1 HP calculated using equation in body of text, assuming rotation speed of 100 rpm and power number of 3.
2 Price includes motor plus inverter to control speed and duration. Using a gear box would result in a cheaper cost

17
Total
50 - - 24,063.51 1,266.50
100 - - 25,754.90 1,355.52
500 - - 32,931.46 1,733.23
1,000 - - 38,789.74 2,041.57
5,000 - - 66,664.34 3,508.65
10,000 - - 94,737.69 4,986.19
25,000 - - 160,777.09 8,461.95
50,000 - - 306,374.16 16,124.96
