technical report no.4_review existing methodology
TRANSCRIPT

7/31/2019 Technical Report No.4_review Existing Methodology
http://slidepdf.com/reader/full/technical-report-no4review-existing-methodology 1/56
REVIEW EXISTING METHODOLOGY OF RESOURCE BASEDINVENTORY FOR MEASURING, REPORTING AND VERIFYING(MRV) CARBON ACCOUNTING FOR REDUCING EMISSIONS
FROM DEFORESTATION AND FOREST DEGRADATION ANDENHANCING CARBON STOCKS IN MERU BETIRI
NATIONAL PARK (MBNP), INDONESIA
Rizaldi BoerKirsfianti GinogaNur Masripatin
ITTO PD 519/08/Rev.1 (F):
In Cooperation withForestry Research and Development Agency
Ministry of Forestry, IndonesiaBogor, 2010

7/31/2019 Technical Report No.4_review Existing Methodology
http://slidepdf.com/reader/full/technical-report-no4review-existing-methodology 2/56
REVIEW EXISTING METHODOLOGY OF RESOURCE BASED INVENTORY FORMEASURING, REPORTING AND VERIFYING (MRV) CARBON ACCOUNTING FORREDUCING EMISSIONS FROM DEFORESTATION AND FOREST DEGRADATION ANDENHANCING CARBON STOCKS IN MERU BETIRI NATIONAL PARK (MBNP),INDONESIA
ISBN 978-602-95842-5-7
Technical Report No 4/2010, May 2010.
By: Rizaldi Boer, Kirsfianti Ginoga, and Nur Masripatin
This Report of Activity 2.1.1 Is a Part of Program ITTO PD 519/08 Rev.1 (F): TropicalForest Conservation For Reducing Emissions From Deforestation And Forest DegradationAnd Enhancing Carbon Stocks In Meru Betiri National Park, Indonesia.Collaboration Between:
• Pusat Penelitian Sosial Ekonomi dan Kebijakan Departemen Kehutanan(Center For Socio Economic and Policy on Forestry Research Ministry of Forestry)Jl. Gunung Batu No. 5 Bogor West Java IndonesiaPhone : +62-251-8633944Fax. : +62-251-8634924Email : [email protected]
Website : http://ceserf-itto.puslitsosekhut.web.id• LATIN – the Indonesian Tropical Institute
Jl. Sutera No. 1 Situgede Bogor West Java IndonesiaPhone : +62-251-8425522/8425523Fax. : +62-251-8626593Email : [email protected] and [email protected] Website : www.latin.or.id
• Meru Betiri National Park Department of ForestryJalan Siriwijaya 53, Jember, East Java, IndonesiaPhone : +62-331-335535
Fax. : +62-331-335535Email : [email protected] : www.merubetiri.com
This work is copyright©2010.
Published by:Center for Socio-Economic Research and Policy on Forestry-ITTO PD 519/08 Rev.1 (F).Jl. Gunung Batu No. 5 Bogor 16610Phone/Fax. : +62-251-8633944Email : [email protected]
Web site : http://ceserf-itto.puslitsosekhut.web.id
7/31/2019 Technical Report No.4_review Existing Methodology
http://slidepdf.com/reader/full/technical-report-no4review-existing-methodology 3/56
iii
LIST OF CONTENT
LIST OF CONTENT ............................................................................................. iiiLIST OF TABLE ...................................................................................................... iv
LIST OF FIGURE .................................................................................................. iv
SUMMARY ........................................................................................................... v
RINGKASAN ......................................................................................................... vii
I. INTRODUCTION .......................................................................................... 11.1. Background ........................................................................................ 1
1.2. Objective ............................................................................................ 2
II. CONCEPTUAL FRAMEWORK .................................................................. 3
III. OVERVIEW OF EXISTING APPROACH AND METHODS ..................... 63.1. Voluntary Carbon Standard (VCS) ............................................... 73.2. IPCC GL ............................................................................................. 13
VI. APPROACH FOR THE MERU BETIRI NATIONAL PARK ........................ 204.1. Overview of Meru Betiri National Park ...................................... 214.2. Approach for MRV in MBNP ......................................................... 23
4.2.1. Determining Boundary ..................................................... 234.2.2. Developing Baseline ......................................................... 244.2.3. Stratifying The area ......................................................... 284.2.4. Determining the Carbon Pool ......................................... 294.2.5. Designing the sampling Framework .............................. 354.2.6. Assesing and Managing Laekage ................................... 37
4.2.7. Estimating and monitoring greenhouse gas emision andremoval ................................................................................ 40
V. INSTITUTIONAL ARRANGEMENT FOR MONITORING ANDREPORTING .................................................................................................. 42
VI. CONCLUSION ............................................................................................. 44
REFERENCES ......................................................................................................... 45

7/31/2019 Technical Report No.4_review Existing Methodology
http://slidepdf.com/reader/full/technical-report-no4review-existing-methodology 4/56
iv
LIST OF TABLE
Table 1. Level of emission reductions and deviations from baseline
for various stabilization levels for Annex I and non-Annex Icountries (IPCC, 2007, Box 13.7) ................................................ 6
Table 2. Risks Assessment to reduce leakage ........................................... 12
Table 3. Land Representation and Accounting .......................................... 13
Table 4. Development of IPCC Methods 1996, IPCC GPG 2003,and the IPCC GL 2006 .................................................................. 14
Table 5. Adjustment of Land Category With IPCC GL 2006 ................ 16
Table 6. IPCC 2006 GL Worksheet AFOLU .............................................. 17
Table 7. Mitigation action for MRV ............................................................. 20Table 8. Forest Types by Zonation in MBNP, 1999 ................................. 22
Table 9. Advantage and disadvantage of several estimationmethods for forest carbon (Gibbs et al., 2007) ....................... 27
Table 10. The amount and Number of PSP in Each Zone in MBNP ......... 36
Table 11. Reducing potential leakage in MBNP ......................................... 39
Table 12. Reporting Format for GRK Inventory for LULUCF .................... 41
Table 13. Institutional Arrangement for Monitoring and Reporting in
MBNP ................................................................................................ 42
LIST OF FIGURE
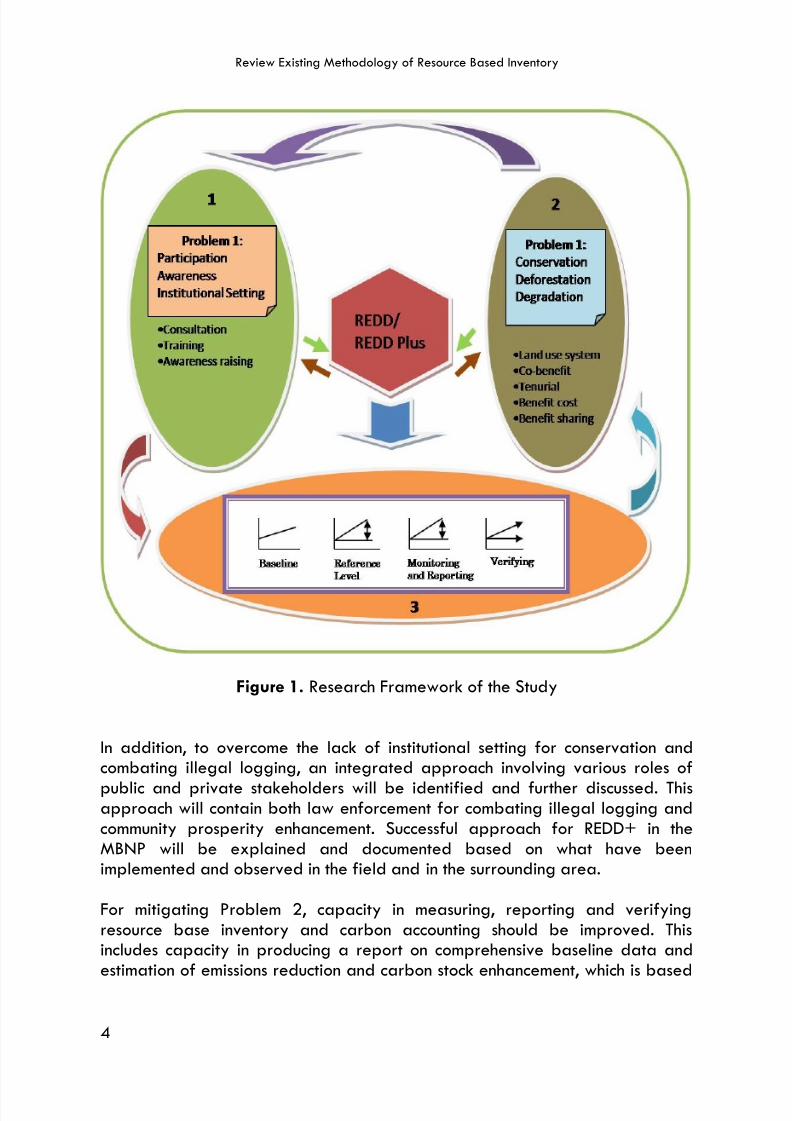
Figure 1. Research Framework of the Study .............................................. 4
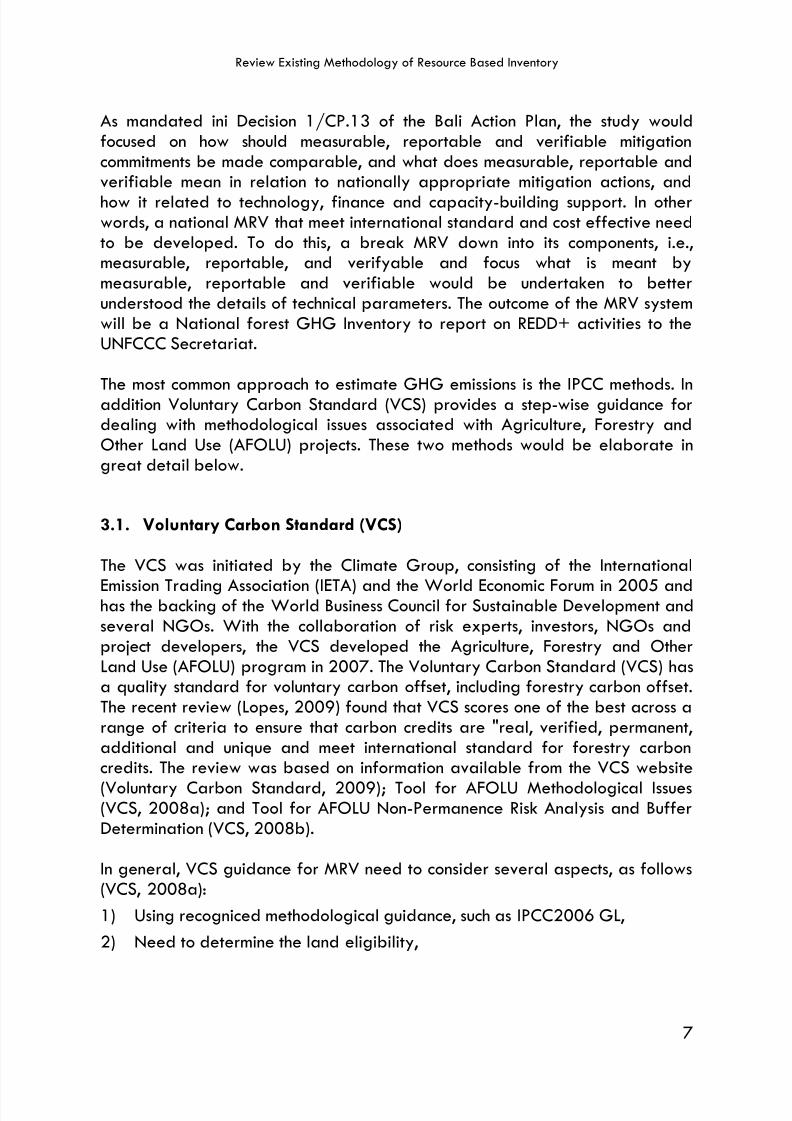
Figure 2. Baselines constructed on annual area of forest loss versuspercent of remaining forest lost (Skutsch, 2007) ...................... 11
Figure 3. Step of GRK Inventory ................................................................... 15
Figure 4. Accounting Approaches (IPCC, 2007) ........................................ 18
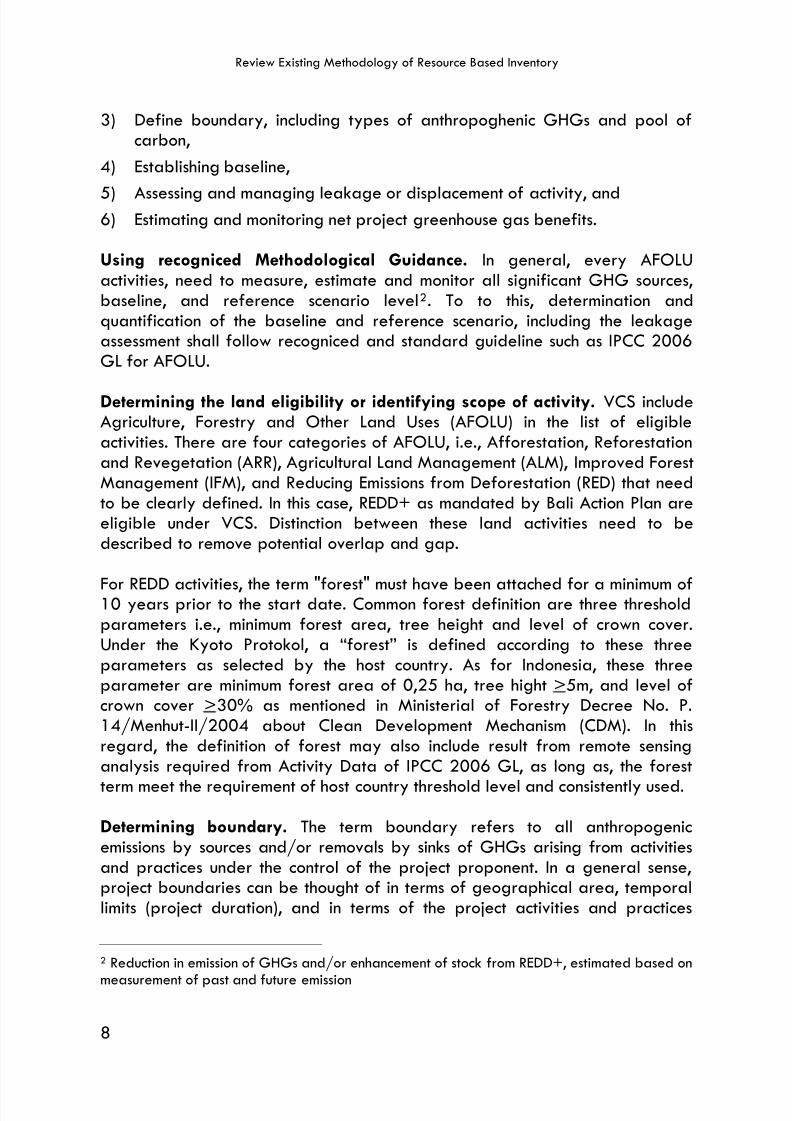
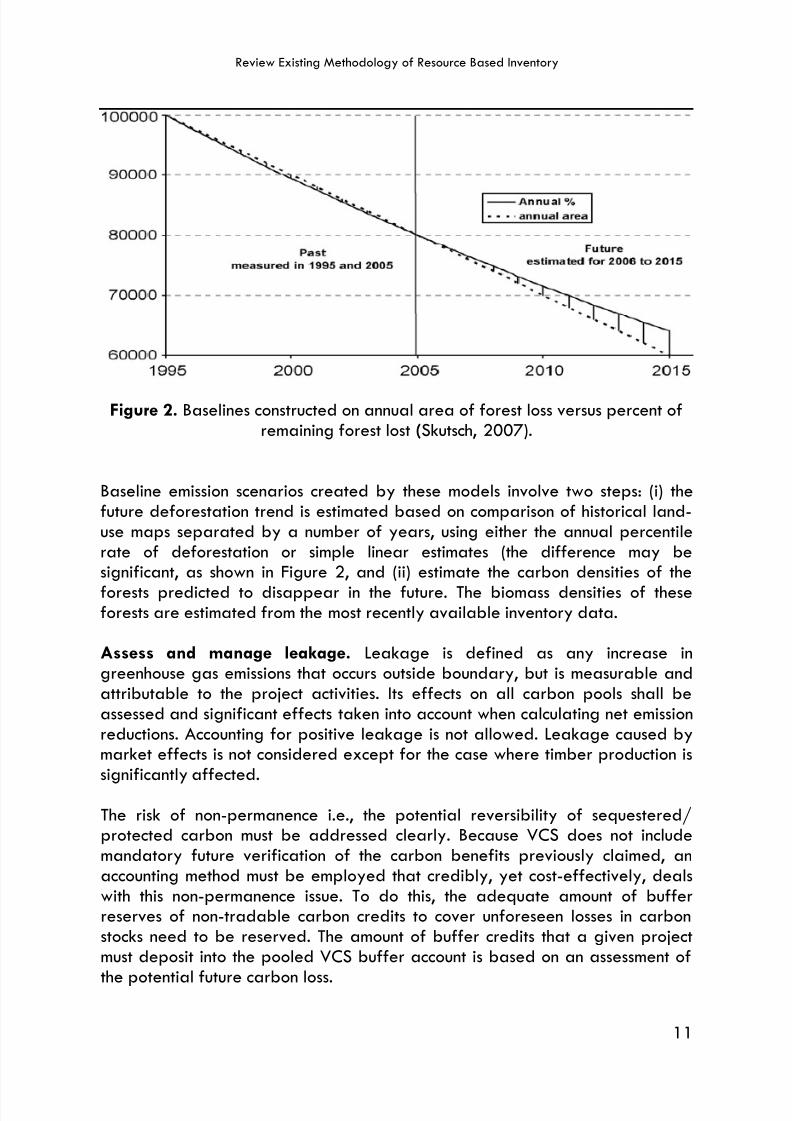
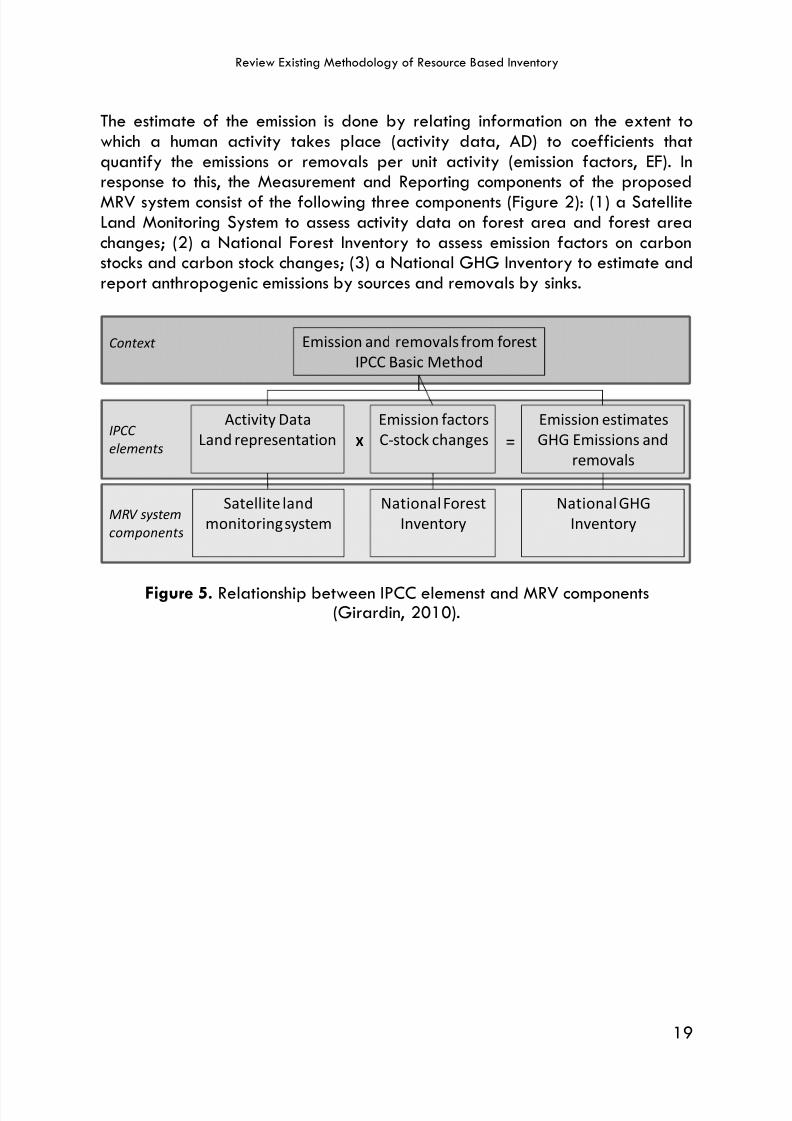
Figure 5. Relationship between IPCC elemenst and MRV components(Girardin, 2010) ............................................................................. 19
Figure 6. Zoning System within MBNP.......................................................... 22
Figure 7. Aerial photo of MBNP in 2009 (a), vegetation map (b) andland use map (c) ............................................................................. 24
Figure 8. REDD+ Intervention ........................................................................ 25
Figure 9. Example of Cluster from PSPs ...................................................... 36
Figure 10. Institutional Structure for MRV in MBNP ..................................... 43

7/31/2019 Technical Report No.4_review Existing Methodology
http://slidepdf.com/reader/full/technical-report-no4review-existing-methodology 5/56
v
SUMMARY
One of the key elements for REDD+ implementation is the development oftransparent, comparable, coherent, complete and accurate measurement,reporting and verification (MRV) systems. These systems are a guarantee thatparties will effectively meet their respective mitigation commitments. A majorchallenge in implementing this is to find ways of ensuring that local communities,can continue their livelihood or path of economic development open sustainablyfrom the forests, while simultaneously building awaraness raising and capacityfor measurable, and reportable verifiable mitigation actions from rehabilitationand conservation. The objectives of this study are to review a credible MRVsystem for monitoring emission reductions for REDD+, which would be aplicable
to implement elsewhere, including Meru Betiri National Park (MBNP). Forapllication of MRV the whole potentials stakeholders shall be engaged in theprocess and develop this MRV system. The study would focused on how shouldMRV mitigation commitments can be implementable and made comparable, andwhat does measurable, reportable and verifiable mean in relation to nationallyappropriate mitigation actions (NAMA), and how it related to technology, andcapacity-building support. In other words, how to develop a national MRV thatmeet international standard and cost effective need to be established. As astarting point, Ministerial of Forestry Decree No. 30/2009 about Mechanism for
REDD in Indonesia provides a general answers to this questions.
Several methods that meet international standards for MRV are explained ingreat detail, including Intergovernmental Panel Climate Change (IPCC), andVoluntary Carbon Standard (VCS) for further investigation and feasibility forapplication. For IPCC methods, there are two basic elements needed for theinventory, namely (i) activity data, i.e. Data on the magnitude of a humanactivity resulting in emissions or removals taking place during a given period oftime and and (ii) emission factor, a coefficient that quantifies the emissions orremovals of a gas per unit activity. Emission factors are often based on a
sample of measurement data, averaged to develop a representative rate ofemission or removal for a given activity level under a given set of operatingconditions. Activity data is grouped six land use categories i.e., Forest Land,Cropland, Grassland, Wetlands, Settlements, and Other Land. These landcategories are further sub-divided into land remaining in the same categoryand land converted from one category to another.
In brief VCS guidance are as follows: (i) Determining the geographic boundarywithin which the activities will be implemented, and the types of greenhouse
gases (i.e., CO2, N2O, CH4) and sources and sinks that would be covered, andthe carbon pools that will consider, (ii) Establishing baseline, (iii) Proving
7/31/2019 Technical Report No.4_review Existing Methodology
http://slidepdf.com/reader/full/technical-report-no4review-existing-methodology 6/56
vi
additionality, (iv) Assesing and managing risk to reduce uncertainty or leakage,and (v) Estimating and monitoring net greenhouse gas benefits, using IPCC GL.Uses of full greenhouse gas accounting, providing annual estimates of overallGHG impacts expressed in terms of CO2 equivalents employing globalwarming potentials (gwps). For monitoring net emissions reductions and GHGremovals, to be eligible under the VCS, a robust and credible monitoringprotocols as denned in the approved methodologies, (vi) Crediting period, forAFOLU should be the same as the life of the project, with a minimum of 20years and a maximum of 100 years.
It is obvious that to establish system MRV, use of IPCC GL, taking intoconsideration step wise guidelines fromVoluntary Carbon Standard (VCS) isneeded to provide simpler, high certainty, and verifyable. VCS explained in
great detail steps by steps guidelined for designing MRV involving communitiesand relevant stakeholders, while IPCC 2006 GL provide guideline on how toundertake forest inventory and estimate emission reduction or removal ofGHGs.
It is proposed that MRV system need to undertake steps as follows: (i)determination boundary of activity, including carbon pool that would bemeasured, (ii) established baseline, (iii) stratify the area, (iv) identify relevantcarbon pool, (v) design sampling framework, (vi) assess and manage potentialleakage, particularly from socio and economic driven factors, and (vii)estimation, monitoring and reporting emission reduction or enhancement ofremoval GHGs. To determine boundary of activity, a visualisation of mediumand high resolution of remote sensing data need to be undertaken. In addition,a representative amount of permanent sample plot need to be established forground truthing to check the accuracy, and increase reliability of data.Approached to determine baseline vary from the simplest to the complexmethods. However they are linked to historic emission. Potential risk for leakageneed to be assessed and managed. While estimation and reporting of emissionreduction or removal are guided by IPCC 2006 method.

7/31/2019 Technical Report No.4_review Existing Methodology
http://slidepdf.com/reader/full/technical-report-no4review-existing-methodology 7/56
vii
RINGKASAN
Salah satu faktor penting untuk pelaksanaan REDD+ adalah pengembanganpengukuran, pelaporan dan verifikasi (MRV) yang transparan, komparabel,koheren, lengkap dan akurat. MRV merupakan jaminan komitmen negara-negaradalam implementasi REDD+. Tantangan untuk membangun MRV adalahbagaimana masyarakat dan para pihak terkait dapat meneruskan danmeningkatkan pembangunan ekonomi secara berkelanjutan dan sekaligusterbangun peningkatan kesadaran dan kapasitas dari kegiatan konservasi danrehabilitasi. Kajian ini bertujuan untuk mengetahui bagaimana membangun MRV yang kredibel dalam pemantauan penurunan emisi dan penambahan serapan untukREDD+ yang dilakukan pada Taman Nasional Meru Betiri. Studi ini akan
memfokuskan pada bagaimana sistem MRV dapat dilaksanakan dengan metodeyang ada, dan komparabel dengan kegiatan mitigasi nasional, serta bagaimanakaitannya dengan teknologi, dan peningkatan kapasitas pendukung yangdiperlukan bagi para pihak yang terlibat? Sebagai langkah awal, PeraturanMenteri Kehutanan No. 30/2009 tentang tata cara REDD di Indonesiamemberikan gambaran umum untuk menjawab pertanyaan ke arah sana.
Beberapa metode untuk mendukung sistem MRV telah dikaji secara menyeluruhdalam study ini untuk aplikasi MRV, seperti Intergovernmental Panel Climate
Change (IPCC), dan Voluntary Carbon Standard (VCS). Untuk metoda IPCC adadua elemen yang diperlukan untuk inventory, yaitu (i) Data kegiatan, data yangmenunjukkan besarnya kegiatan manusia dalam penurunan atau peningkatan emisipada periode tertentu, (ii) Faktor emisi, suatu koefiesien yang menunjukkan tingkat emisi atau serapan per unit kegiatan. Faktor emisi umumnya didasarkan padaperhitungan emisi atau serapan data rata-rata sampel per kegiatan per periode.Data kegiatan dikelompokan dalam enam kategori lahan, yaitu lahan hutan, lahanpertanian, padang rumput, lahan basah, pemukiman dan lahan lainnya. Kelompoklahan ini kemudian dibagi lagi kedalam bagian lahan yang dikonversi ke lahanlainnya atau tetap.
Untuk Voluntary Carbon Standard pada Pertanian, Kehutanan, dan PerubahanPenggunaan Lahan (AFOLU), proses untuk MRV terdiri dari beberapa tahap.Pertama, identifikasi skope kegiatan termasuk menentukan batasan geografispelaksanaan kegiatan, tipe gas rumah kaca yang akan diukur (CO2, N2O, CH4 ),dan pool perhitungan emisi dan serapan. Kedua, menentukan baseline termasukmemperkirakan unit voluntary carbon yang akan dihasilkan. Ketiga, membuktikanadanya penambahan atau additionality, termasuk validasi dari metodologi, yangmerupakan urutan bagaimana memperkirakan emisi atau serapan. Keempat,
menelaah dan mengelola resiko untuk mengurangi ketidakpastian atau kehilangankarena kebocoran. Kelima, memperkirakan dan memantau perbedaan bersih emisi

7/31/2019 Technical Report No.4_review Existing Methodology
http://slidepdf.com/reader/full/technical-report-no4review-existing-methodology 8/56
viii
atau serapan dibandingkan dengan tingkat baseline, dan keenam,mengidentifikasikan dampak potensi negatif terhadap lingkungan dan sosialekonomi serta upaya untuk menguranginya. Karena itu secara umum, untuk VCSperlu ditetapkan sebagai berikut: (i) pool karbon yang akan dihitung,memperkirakan emisi atau serapan per tahun dalam CO2e, (ii) kejelasan dankredibilitas metodologi pemantauan penurunan emisi, (iii) periode kredit untukpemantauan, untuk AFOLU minimum 20 tahun dan maximum 100 tahun.
Untuk membangun sistem MRV, aplikasi metoda IPCC 2006 GL, dengan dukunganstep tahapan kegiatan dari Voluntary Carbon Standard diharapkan akanmemberikan sistem MRV yang sederhana, akurat dan dapat diverifikasi. VCSmenjelaskan secara rinci langkah yang perlu dilakukan untuk merancang sistemMRV yang sekaligus dapat melibatkan parapihak dalam pelaksanaannya
sementara IPCC 2006 GL menerangkan bagaimana untuk melakukan inventarisasiGHG dan memperkirakan serta melaporkan pengurangan emisi dan peningkatanserapan GHG.
Karena itu diusulkan untuk sistem MRV dilakukan langkah langkah sebagaiberikut: (i) menentukan batas kegiatan, termasuk pool karbon yang akan dihitung,dalam hal ini perlu dilakukan visualisasi pengindraan jauh dengan resolusi sedangdan tinggi yang didukung oleh data lapang dari permanen sample plot,(ii)menentukan baseline berdasarkan beberapa pendekatan, (iii)stratifikasi area,(iv) identifikasi pool of carbon, (v) desain untuk sampling, (vi) identifikasi danmenentukan cara minimisasi potensial resiko dan kebocoran, dan (vii)memperkirakan, memantau dan melaporkan pengurangan emisi atau peningkatanserapan GHG dengan menggunakan IPCC 2006 GL.

7/31/2019 Technical Report No.4_review Existing Methodology
http://slidepdf.com/reader/full/technical-report-no4review-existing-methodology 9/56
I. INTRODUCTION
1.1. Background
At the global level, loss of tropical forest is often associated with the increasinglevel of atmospheric carbon-dioxide, which in turn accelerates the process ofglobal warming. Forest analysts agree that the reasons for forest clearing arecomplex. However, it is widely accepted that increasing population pressure,combined with others social, economic and institutional pressures, play role incausing deforestation, forest degradation and non-conservation behaviour. Inthis case, it is worth to note that a substantial portion of deforestation can beattribute to farmers, communities, and related stakeholders. It is also importantto understand why and under what mechanism communities clear forest, andwhat incentives would increase their participation to conserve the forest, andinduce awareness of how serious the effects of clearing the forest on erosion,flooding, and hydrological balance.
REDD+1, which hopefully would take into action in 2012, are the globalmechanism that would provide positive incentive for communities, public andprivate stakeholders through their participation in reducing emission fromdeforestation and degradation, forest conservation, sustainable forest
management and enhancement of forest carbon stocks. Natural parks asconservation forests are good places for for understanding reducing emissionfrom deforestation and degradation as well as conserving and enhancingcarbon stocks. One of national parks, Meru Betiri National Park (MBNP), is arepresentative areas with many of the challenges usually faced in reducingillegal logging, forest encroachment and managing forest conservation in oneside and poverty reduction of community living surrounding the forest on theother side. This is important as Indonesia has large areas of conservation forest,amounting to about 18 per cent of the forest jurisdiction area of 126.8 hectares(Forestry Statistic, 2006).
1Reducing emissions from deforestation and forest degradation (REDD); and the role ofconservation, sustainable management of forests and enhancement of forest carbon stocks (+) indeveloping countries. Scope of activities include all activities which result in reducing emissions,increasing removals, and stabilization of carbon stocks in forestry sector at national level. Withinsub national level include reduction in deforestation rate, reduction in forest degradation,maintaining and enhancing forest carbon stocks through forest conservation, incremental changein forest cover, sustainable management of forest, increase forest cover due to afforestation
and reforestation, and other land management.
1
7/31/2019 Technical Report No.4_review Existing Methodology
http://slidepdf.com/reader/full/technical-report-no4review-existing-methodology 10/56
Review Existing Methodology of Resource Based Inventory
One of the key elements for REDD+ implementation is the development oftransparent, comparable, coherent, complete and accurate measurement,reporting and verification (MRV) systems. These systems are a guarantee thatparties will effectively meet their respective mitigation commitments. A majorchallenge in implementing this is to find ways of ensuring that local communities,can continue their livelihood or path of economic development open sustainablyfrom the forests, while simultaneously building awaraness raising and capacityfor measurable, and reportable verifiable mitigation actions from rehabilitationand conservation. Local communities are dependent on the species diversity andecosystem services of natural forests to maintain their way of life, and they alsoplay a crucial role in conservation of forests, including maintaining andmonitoring activities to manage forests sustainably. It is therefore essential tomitigate climate change, and safeguard the interests of local communities.
1.2. Objective
The objectives of this study are (i) to review a credible MRV system formonitoring emission reductions from REDD+, (ii) to review existing approachesand methods to assess and monitor forestry and other natural resources, landuse and management practices (iii) to develop an MRV approach appropriatefor Meru Betiri National Park (MBNP), one of conservation forest facing theabove challenges, and (iv) to briefly assess the effective institutional system forthe MRV.
2

7/31/2019 Technical Report No.4_review Existing Methodology
http://slidepdf.com/reader/full/technical-report-no4review-existing-methodology 11/56
II. CONCEPTUAL FRAMEWORK
The first part of this report decribes general conceptual framework of the study
on MBNP on how to improve the livelihoods of local communities living insideand in the surrounding area of MBNP through participation in avoidingdeforestation, degradation, biodiversity conservation as well as developingMRV system. The second part provide overview of the MRV system and existingapproaches and methods to assess and monitor forestry and other naturalresources, land use and management practices, in order to provide a qualitativeand quantitative information on the state, use, management and trends of theseresources and the ecosystems. The assessment covers a wide range ofbiophysical and socio-economic variables, and thus provides a holistic view of
land use and its impacts for the forest ecosystem as a whole. In particular, theinformation can be used to plan, design and implement national andinternational policies and strategies for REDD+ and REDD+, and to understandthe relationship between resources and users of resources. The third partdescribes MRV system suitable for MBNP, taking into consideration relevantCOP decision and REDD strategy in Indonesia and possible institutionalarrangement for the MRV.
The general framework and approach of the study is presented in Figure 1. Onthe left hand side of the Figure 1 shows local problems (Problem 1). These
include lack of participation, awareness and institusional problem that creates ademand for improvement of participatory mechanism from local, national andglobal level. On the right hand side is a problem within natural park areas,which tend to have lack of conservation behavioural activities from thecommunities, deforestation and forest degradation (Problem 2).
To mitigating Problem 1, a process to deal with communities, public and privatestakeholders in the management of MBNP in relation to its conservation goal,has to be developed. In this study the steps followed by the process is thefollowing: (i) conduct consultation process participated by all local stakeholders,
and assess how the future risk might look like and impact on the livelihood of thecommunity, (ii) promote existing initiatives to empower community involvement inconservation through various schemes, (iii) enhance community-forest partnership,and self controlling for development of goods and services which providevarious alternative benefits including sources of income to community, and (iv)scale up and replicate the successful lessons learnt and good practices of agro-forestry to wider communities and areas of the MBNP. Potential risk that mayemerge from the conflict of interest between local communities and themanagement of the Park would be minimised through for example the
utilization of goods and services from the area, in traditional and commercialperspectives.
3
7/31/2019 Technical Report No.4_review Existing Methodology
http://slidepdf.com/reader/full/technical-report-no4review-existing-methodology 12/56
Review Existing Methodology of Resource Based Inventory
Figure 1. Research Framework of the Study
In addition, to overcome the lack of institutional setting for conservation and
combating illegal logging, an integrated approach involving various roles ofpublic and private stakeholders will be identified and further discussed. Thisapproach will contain both law enforcement for combating illegal logging andcommunity prosperity enhancement. Successful approach for REDD+ in theMBNP will be explained and documented based on what have beenimplemented and observed in the field and in the surrounding area.
For mitigating Problem 2, capacity in measuring, reporting and verifyingresource base inventory and carbon accounting should be improved. This
includes capacity in producing a report on comprehensive baseline data andestimation of emissions reduction and carbon stock enhancement, which is based
4

7/31/2019 Technical Report No.4_review Existing Methodology
http://slidepdf.com/reader/full/technical-report-no4review-existing-methodology 13/56
Review Existing Methodology of Resource Based Inventory
on a established and validated robust system for monitoring emission reductionand enhancement of carbon stocks.
As a whole, programs for addressing the two problems is divided into threephases. Phase 1 will be from 2010-2011. The main activities in this 1st Phaseare to establish comprehensive framework for stakeholders engagement and toestablish Permanent Sampling Plot (PSP)-Data collection for Carbon Accounting.Phase 2 from 2011-2012 is to consolidate Phase 1 and to develop activities forPhase 2 (applied methods for carbon accounting). Phase 3 from 2012-2013 isto develop comprehensive capacity (communities, public and private) andcomprehensive capability (all pools and applied tool), and to disseminate lessonlearnt and good practices.
5

7/31/2019 Technical Report No.4_review Existing Methodology
http://slidepdf.com/reader/full/technical-report-no4review-existing-methodology 14/56
III. OVERVIEW OF EXISTING APPROACHAND METHODOLOGY
Stabilization levels of atmospheric carbon-dioxide to avoid further impact ofclimate change is clearly set in the IPCC AR 4. It is clear that to avoid theincrease of atmospheric tempherature beyond 2oC need the lowest stabilizationlevel of 450 ppm CO2-eq. For achieving that level, developed countries needto reduce their aggregate emissions by 25-40% from 1990 levels by 2020,and 80-95% by 2050 (Table 1). While developing countries have to takeaction to reduce emission growth, i.e. keep emissions below business as usual(BAU) emission trend, and increasing the gap between BAU and the actual
emissions path. In this case both developed and developing countries needNational Appropriate Mitigation Actions (NAMAs), combined with policy andpositive insentives.
Table 1. Level of emission reductions and deviations from baseline forvarious stabilization levels for Annex I and non-Annex I countries(IPCC, 2007, Box 13.7)
Scenario Region 2020 2050
440 ppmCO2-eq
Annex 1 -25% to – 40% -80% to – 95%
Non-Annex Substantial deviationfrom baseline in LatinAmerica, Middle East,East and Asia
Substantial deviationfrom baseline in allregions
550 ppmCO2-eq
Annex 1 -10% to – 30% - 40%to – 90%
Non-Annex 1 Deviation from
baseline in LatinAmerica and MiddleEast, East Asia
Deviation from
baseline in mostregions, especially inLatin America andMiddle East
650 ppmCO2-eq
Annex 1 0% - 25% -30% to - 80%
Non-Annex 1 Baseline Deviation from baselinein Latin America andMiddle East, East Asia
6
7/31/2019 Technical Report No.4_review Existing Methodology
http://slidepdf.com/reader/full/technical-report-no4review-existing-methodology 15/56
Review Existing Methodology of Resource Based Inventory
As mandated ini Decision 1/CP.13 of the Bali Action Plan, the study wouldfocused on how should measurable, reportable and verifiable mitigationcommitments be made comparable, and what does measurable, reportable andverifiable mean in relation to nationally appropriate mitigation actions, andhow it related to technology, finance and capacity-building support. In otherwords, a national MRV that meet international standard and cost effective needto be developed. To do this, a break MRV down into its components, i.e.,measurable, reportable, and verifyable and focus what is meant bymeasurable, reportable and verifiable would be undertaken to betterunderstood the details of technical parameters. The outcome of the MRV systemwill be a National forest GHG Inventory to report on REDD+ activities to theUNFCCC Secretariat.
The most common approach to estimate GHG emissions is the IPCC methods. Inaddition Voluntary Carbon Standard (VCS) provides a step-wise guidance fordealing with methodological issues associated with Agriculture, Forestry andOther Land Use (AFOLU) projects. These two methods would be elaborate ingreat detail below.
3.1. Voluntary Carbon Standard (VCS)
The VCS was initiated by the Climate Group, consisting of the InternationalEmission Trading Association (IETA) and the World Economic Forum in 2005 andhas the backing of the World Business Council for Sustainable Development andseveral NGOs. With the collaboration of risk experts, investors, NGOs andproject developers, the VCS developed the Agriculture, Forestry and OtherLand Use (AFOLU) program in 2007. The Voluntary Carbon Standard (VCS) hasa quality standard for voluntary carbon offset, including forestry carbon offset.The recent review (Lopes, 2009) found that VCS scores one of the best across arange of criteria to ensure that carbon credits are "real, verified, permanent,additional and unique and meet international standard for forestry carbon
credits. The review was based on information available from the VCS website(Voluntary Carbon Standard, 2009); Tool for AFOLU Methodological Issues(VCS, 2008a); and Tool for AFOLU Non-Permanence Risk Analysis and BufferDetermination (VCS, 2008b).
In general, VCS guidance for MRV need to consider several aspects, as follows(VCS, 2008a):
1) Using recogniced methodological guidance, such as IPCC2006 GL,
2) Need to determine the land eligibility,
7
7/31/2019 Technical Report No.4_review Existing Methodology
http://slidepdf.com/reader/full/technical-report-no4review-existing-methodology 16/56
Review Existing Methodology of Resource Based Inventory
3) Define boundary, including types of anthropoghenic GHGs and pool ofcarbon,
4) Establishing baseline,
5) Assessing and managing leakage or displacement of activity, and6) Estimating and monitoring net project greenhouse gas benefits.
Using recogniced Methodological Guidance. In general, every AFOLUactivities, need to measure, estimate and monitor all significant GHG sources,baseline, and reference scenario level2. To to this, determination andquantification of the baseline and reference scenario, including the leakageassessment shall follow recogniced and standard guideline such as IPCC 2006GL for AFOLU.
Determining the land eligibility or identifying scope of activity. VCS includeAgriculture, Forestry and Other Land Uses (AFOLU) in the list of eligibleactivities. There are four categories of AFOLU, i.e., Afforestation, Reforestationand Revegetation (ARR), Agricultural Land Management (ALM), Improved ForestManagement (IFM), and Reducing Emissions from Deforestation (RED) that needto be clearly defined. In this case, REDD+ as mandated by Bali Action Plan areeligible under VCS. Distinction between these land activities need to bedescribed to remove potential overlap and gap.
For REDD activities, the term "forest" must have been attached for a minimum of10 years prior to the start date. Common forest definition are three thresholdparameters i.e., minimum forest area, tree height and level of crown cover.Under the Kyoto Protokol, a “forest” is defined according to these threeparameters as selected by the host country. As for Indonesia, these threeparameter are minimum forest area of 0,25 ha, tree hight >5m, and level ofcrown cover >30% as mentioned in Ministerial of Forestry Decree No. P.14/Menhut-II/2004 about Clean Development Mechanism (CDM). In thisregard, the definition of forest may also include result from remote sensing
analysis required from Activity Data of IPCC 2006 GL, as long as, the forestterm meet the requirement of host country threshold level and consistently used.
Determining boundary. The term boundary refers to all anthropogenicemissions by sources and/or removals by sinks of GHGs arising from activitiesand practices under the control of the project proponent. In a general sense,project boundaries can be thought of in terms of geographical area, temporallimits (project duration), and in terms of the project activities and practices
2 Reduction in emission of GHGs and/or enhancement of stock from REDD+, estimated based onmeasurement of past and future emission
8

7/31/2019 Technical Report No.4_review Existing Methodology
http://slidepdf.com/reader/full/technical-report-no4review-existing-methodology 17/56
Review Existing Methodology of Resource Based Inventory
responsible for greenhouse gas emissions and removals that are significant andreasonably attributable to the activities undertaken within.
Spatial boundaries of the lands need to be clearly established so as tofacilitate accurate measuring, monitoring, accounting, and verifying of activities.These boundaries need to be identifiable by all stakeholders includingproponents and stakeholders. When describing physical boundaries, thefollowing information is worthy to include (IPCC, 2003): (i) Name of the area,(ii) Map(s) of the area (paper format and/or digital format, if available), (iii)Geographic coordinates, (iv) Total land area, (v) Details of ownership/jurisdiction and (vi) Land use and management history of the selected site(s).
It is expected that the boundaries remain unchanged during the duration of the
project. In the event that boundary changes are inevitable, subject to the rulesagreed for projects, then these would need to be reported and inclusionsand/or exclusions of physical land area need to be surveyed using the abovedescribed methods.
There are several methods and tools employed to identify and delineatephysical project boundaries. These include, amongst others, the following: (i)Permanent boundary markers (e.g., fences, hedgerows, walls, etc.), (ii) Remotesensing data e.g., satellite imagery from optical and/or radar sensor systems,aerial photographs, etc., (iii) ground-based surveys to delineate propertyboundaries, (iv) Global Positioning Systems, (v) National certified topographicmaps with clearly defined topographic descriptions (e.g., rivers/creeks,mountain ridges); and (vi) Other nationally recognized systems (e.g., Nationalpark, etc). Any or combination of these methods or tools can be chooseprovided accuracy is maintained.
In determining boundary, the crediting period need also to be estimated, aswell as sources and sinks of emission reduction or removal from greenhousegases (GHG) such as CO2, N2O, CH4. The types of the carbon pools that will
consider need to be clearly set. The selection of carbon pool and type of GHGincluded will depend on the significance of the pool and selected tier for eachland category.
For estimating GHG emission or removal from each carbon pool, therepresentative permanent sample plots (PSPs) need to be established forground truthing. There are some guidelines for establishing PSPs (Cf., Asmoro,2009, Hairiah and Rahayu, 2007, Hairiah et al., 2001a and b).
Establishing baseline.Baseline refers to the scenario that reasonablyrepresents the anthropogenic emissions by sources and anthropogenic removals
9

7/31/2019 Technical Report No.4_review Existing Methodology
http://slidepdf.com/reader/full/technical-report-no4review-existing-methodology 18/56
Review Existing Methodology of Resource Based Inventory
by sinks of greenhouse gases that would occur in the absence of the proposedactivities. Baselines can also be seen as the future projection of emissions fromdeforestation and degradation under the absence of REDD or a reference formeasuring reductions in emissions from deforestation and degradation. Thisimplies the need to assess potential greenhouse gas emissions and removals in amanner and consistent with associated activities in the project. A baseline shallcover emissions from all gases, and source categories within the projectboundary.
In general, there are three approach for baseline methodology, i.e., (i)Historical approach, including a straight projection of the past, and an averageof the past, (ii) Modeling approach, it is modeled on planned land use spatialand non spatial model, and (iii) Other approaches, this approach to be
discussed and negotiated in SBSTA.
On the regional scale, modelling is proving successful for predicting futureemissiom from deforestation and degradation, once the drivers were correctlyidentified. Various models are already available and others are underdevelopment, with a view to identifying the vulnerability of forest areas todeforestation and degradation. Factors that have been identified as importantare accessibility (closeness to roads, rivers, settlements, agricultural areas andslope) and pressure on land (population density, markets, tenure, among others).Various studies found a close relationship between deforestation and one ormore of these factors expressed spatially in maps, and the degree ofcorrelation between deforestation and its drivers can be analysed (Castillo-Santiago et al., in press). With these tools, a vulnerability index could becreated for each forest area (de Jong et al., 2005; Castillo-Santiago et al., inpress). Brown (2007) compared various modelling approaches and found thatthey gave comparable results over short time scales of 5–10 years and thatspatially specific models could improve the prediction of where deforestationwould take place as can be seen in Figure 2 (Skutsch, et al., 2007).
Soares-Filho et al. (2006) have used such a model to estimate futuredeforestation rates over the whole Amazon Basin under different managementscenarios, including not only traditional conservation measures, but also differentlevels of enforcement of environmental legislation, the paving or non-paving ofmajor roads, etc., and from this have estimated carbon emissions per scenario(using the approximation that 85% of the carbon contained in forest trees isreleased on deforestation). This demonstrates the enormous carbon gains thatcan be made through different management regimes, but more particularly, thevalue of such modeling as a tool for making predictions.
10
7/31/2019 Technical Report No.4_review Existing Methodology
http://slidepdf.com/reader/full/technical-report-no4review-existing-methodology 19/56
Review Existing Methodology of Resource Based Inventory
Figure 2. Baselines constructed on annual area of forest loss versus percent ofremaining forest lost (Skutsch, 2007).
Baseline emission scenarios created by these models involve two steps: (i) thefuture deforestation trend is estimated based on comparison of historical land-use maps separated by a number of years, using either the annual percentilerate of deforestation or simple linear estimates (the difference may be
significant, as shown in Figure 2, and (ii) estimate the carbon densities of theforests predicted to disappear in the future. The biomass densities of theseforests are estimated from the most recently available inventory data.
Assess and manage leakage. Leakage is defined as any increase ingreenhouse gas emissions that occurs outside boundary, but is measurable andattributable to the project activities. Its effects on all carbon pools shall beassessed and significant effects taken into account when calculating net emissionreductions. Accounting for positive leakage is not allowed. Leakage caused bymarket effects is not considered except for the case where timber production issignificantly affected.
The risk of non-permanence i.e., the potential reversibility of sequestered/protected carbon must be addressed clearly. Because VCS does not includemandatory future verification of the carbon benefits previously claimed, anaccounting method must be employed that credibly, yet cost-effectively, dealswith this non-permanence issue. To do this, the adequate amount of bufferreserves of non-tradable carbon credits to cover unforeseen losses in carbonstocks need to be reserved. The amount of buffer credits that a given project
must deposit into the pooled VCS buffer account is based on an assessment ofthe potential future carbon loss.
11

7/31/2019 Technical Report No.4_review Existing Methodology
http://slidepdf.com/reader/full/technical-report-no4review-existing-methodology 20/56
Review Existing Methodology of Resource Based Inventory
To minimise leakage, it is needed to: (1) undertaking the initial risk assessment,which must consider both transient and permanent potential losses in carbonstocks; and (2) determining the appropriate buffer reserve based on guidanceprovided in this document. This self risk assessment must be clearly documentedand substantiated where possible. During verification, the VCS verifier willevaluate the risk assessment and adjust it as appropriate before VoluntaryCarbon Units (VCUs) can be issued. The risk assessment can be seen in Table 2.
Table 2. Risks Assessment to reduce leakage
Type of Risk Driver
General Unclear land tenure and potential for dispute
Financial failureTechnical ProblemMis-management
Economic Land encroachment, Income shortage, rising landprice
Regulatory and social Political instability, Social instabilityLack for monitoring and enforcement
Natural disturbance Forest fireIncidence of pest and diseaseExtreme climatic events (e.g. floods, drought, winds)Volcanoes, earthquakes, landslides
Estimate and monitor net project greenhouse gas benefits. The IPCC 2006Guidelines shall be used for estimating CO2-e, sink enhancement, and reductionsin forest carbon stocks caused by removals of biomass exceeding regrowth.These Guidelines shall also be followed in terms of quality assurance/controland uncertainty analysis.
In addition to approving complete methodologies, the VCS will supportinnovation by approving new simple, consessive and transparent tools with costeffeftive. Community and/or environmental impacts of projects are anotherimportant factors to take into account under this process. The VCS encouragestakeholders consultation process, and to use relevant tools and best-practicestandards to ensure that projects are appropriately designed, and wherepossible generate social and environmental benefits beyond climate changemitigation.
Therefore, steps for MRV based on VCS guidance are as follows: (i)Determining the geographic boundary within which the activities will be
12

7/31/2019 Technical Report No.4_review Existing Methodology
http://slidepdf.com/reader/full/technical-report-no4review-existing-methodology 21/56
Review Existing Methodology of Resource Based Inventory
implemented, and the types of greenhouse gases (i.e., CO2, N2O, CH4) andsources and sinks that would be covered, and the carbon pools tha will consider,(ii) Establishing baseline, (iii) Proving additionality, (iii) Assesing and managingrisk to reduce leakage, and (iv) Estimating and monitoring net greenhouse gasbenefits, using IPCC GL. Uses of full greenhouse gas accounting, providingannual estimates of overall GHG impacts expressed in terms of CO2 equivalents employing global warming potentials (GWPs). For monitoring netemissions reductions and GHG removals, to be eligible under the VCS, a robustand credible monitoring protocols as denned in the approved methodologies,(v) Crediting period, for AFOLU should be the same as the life of the project,with a minimum of 20 years and a maximum of 100 years.
3.2. IPCC GL
IPCC methods as international recognised standard, has been used formeasuring GhGs inventory in Indonesia National Communication 2009. Thismethods provide choice of land representation approach and emissionestimation (tier), as can be seen in Table 3. While the most demandingapproach is using spatially specific data from interpretation of remotesensing data and tier 3 for estimating emission.
Table 3. Land Representation and Accounting
Approach for activitydata: Area Change
Tiers for emission factors: change in C stocks
1. Non-spatial countrystatistics (e.g. FAO) – generally gives netchange in forest area
Tier 1 (basic). IPCC default mean annual increment (fordegradation) and/or forest biomass stock (fordeforestation) values for broad continental forest types— includes six classes for each continental area to encompassdifferences in elevation and general climatic zone; defaultvalues given for all vegetation-based pools
2. Based on maps,surveys and othernational statisticaldata
Tier 2 (intermediate). Country specific data: Mean annualincrement and/or forest biomass values from existingforest inventories and/or ecological studies. Default valuesprovided for all non-tree pools.
Newly-collected forest biomass data.
3. Spatially specificdata frominterpretation ofremote sensing data
Tier 3 (most demanding). Repeated measurements oftrees from permanent plots and/or calibrated processmodels. Can use default data for other pools stratified byin-country regions and forest type, or estimates from
process models.
13

7/31/2019 Technical Report No.4_review Existing Methodology
http://slidepdf.com/reader/full/technical-report-no4review-existing-methodology 22/56
Review Existing Methodology of Resource Based Inventory
For inventory of GHG, IPCC has developed methods that have been broadlyapplied by countries ratifying the UNFCCC. This method provides steps anddata required for measurement, monitoring, and reporting changes in emissions.This method can also be used as a tool to determine the emission level (REL) orthe reference level of emissions (baseline). In this way the IPCC has developedmethods for 3 times, the method of the IPCC in 1996, the revised 1996 IPCCGuideline, the IPCC Good Practice Guidance (GPG) in 2003 and 2006 IPCCGuideline. IPCC method development can be seen in Table 4.
Table 4. Development of IPCC Methods 1996, IPCC GPG 2003, and the IPCCGL 2006
Description IPCC 1996 IPCC GPG 2003 IPCC 2006
Name LUCF LULUCF AFOLUThe number ofcategories of land/Source emission orabsorption
5 6 6
carbon pool 6 carbon poolMethod Simple More Complete CompleteComplete CompleteAccuracy/
Tier 1 Tier 1- Tier 3 Tier 1-Tier3
Data and information Global Specific Location Global andSpecific Location
GHGs CO2 CO2 and Non CO2 CO2 and NonCO2 from soil,
Significant differences occurred from 1996 to the IPCC revised 2003 IPCCGPG mainly because land cover changes to 6 categories of Forest Land, CropLand, Grass Land, Wet Land, Settlement, and Other Land. It is expected that by
implementing these six categories of land will produce an inventory of landcover changes more accurately, and reduce uncertainty (reduced uncertainty),and consistent in the distribution of land categories. This method also requiresthe need to estimate absorption/emission for all categories of land, stock andnon-CO2 carbon relevant.
Processes or stages required to conduct an inventory of emissions by IPCC GL2006 can be seen in Figure 3. In general, there are two basic elements neededfor the inventory, namely (i) the activities of data from land uses changes on 6
categories of land, namely a land change matrix (LCM) or a matrix of landchanges, and (ii) emission factor/removal, the ability of vegetation/forest/
14

7/31/2019 Technical Report No.4_review Existing Methodology
http://slidepdf.com/reader/full/technical-report-no4review-existing-methodology 23/56
Review Existing Methodology of Resource Based Inventory
carbon pool to grow and store carbon. Databases for LCM is the mappingresult from satellite data. Inventory process begins with the interpretation andanalysis of remote sensing. Then made adjustments to land cover categories inaccordance with the IPCC GL 2006 of 6 categories of land, as shown inTable 5.
Data interpretation
and analysis of
spatial
Citra Landsat + 7 ETM
Land Use Change Matrix
Land use/cover changes
6 categories of land Periode analisis (yr)
Area (ha)
Figure 3. Step of GRK Inventory
Activities of data analysis on each land category start with: i) visualinterpretation of remote sensing data, ii) ground truthing, iii) assessment ofaccuracy (Accuracy assessment), re-interpretation, iv) activities to improve thereinterpretation of the results that have been made based on groundtruthing
information, and v) making land cover change matrix or LCM. In this analysed,land cover are analysed for every 3 years, according to the condition ofinventory data that have been done in the Directorate General of Planning,Ministry of Forestry. The data included in the calculation are based on formatedExcel worksheet of IPCC Table amounted to 39, as shown in Table 6.
Emission Level/ Removal
Emission
Factor/
Removal
Activities of
Data
The average
carbon stock
changes
6 categories of land
39 tables spreadsheet based on IPCC GL 2006
Stocks and carbon changes
6 pool carbon
1 2
3
uncertainty
4
5 uncertainty
15

7/31/2019 Technical Report No.4_review Existing Methodology
http://slidepdf.com/reader/full/technical-report-no4review-existing-methodology 24/56
Review Existing Methodology of Resource Based Inventory
Table 5. Adjustment of Land Category With IPCC GL 2006
Forestry Department statistic Adjustment with IPCC GL 2006
23 categories of land 6 categories of land
1. Forest (7 categories):1) Primary Dryland Forest2) Econdary Dryland Forest3) Mangrove Forest Primary4) Secondary Mangrove Forest5) Swamp Forest Primary6) Swamp Forest Secondary7) Forest Plantation
2. Non-forest (14 categories):8) Agriculture dryland9) Dry land Agriculture and
shrubs10) Plantation11) Rice12) Shrub/scrub13) Savana
14) Kingfisher swamp15) Swamp16) Transmigration17) Settlement18) Pond19) Land open20) Mining21) Port of air/sea
3. No data (category 2),22) Cloud23) No data
1. Forest land (4 sub categories)1) Dryland Forest2) Mangrove Forest3) Swamp Forest4) Forest Plantation
2. Crop land (3 subcategories),5) Dryland Agriculture6) Plantation7) Rice
3. Grass Land (1 sub categories),:8) Grass Land
4. Wetlands (1 sub categories),9) Swamp
5. Settlements (1 sub categories),10) Settlement
6. Other Lands (1 sub categories),11) Pond, Cloud
16

7/31/2019 Technical Report No.4_review Existing Methodology
http://slidepdf.com/reader/full/technical-report-no4review-existing-methodology 25/56
Review Existing Methodology of Resource Based Inventory
Table 6. IPCC 2006 GL Worksheet AFOLU
No Category Table Calculation
1 Forest Land A1. Forest – Remaining Forest (AG and BG biomass)2 A1. Forest – Remaining Forest (Harvest )3 A1. Forest – Remaining Forest (Fuel wood)4 A1. Forest – Remaining Forest (Disturbance)5 A1. Forest – Remaining Forest (Peat soils)6 A2. Land – Converted Forest (AG and BG biomass)7 A2. Land – Converted Forest (Harvest )8 A2. Land – Converted Forest (fire wood)9 A2. Land – Converted Forest (Disturbance)
10 A2. Land – Converted Forest (DOM)11 A2. Land – Converted Forest (Mineral soils)12 A2. Land – Converted Forest (Organic soils)13 Crop land B1. Crop land – Remaining Crop land (AG and BG)14 B1. Crop land – Remaining Crop land (mineral)15 B1. Crop land – Remaining Crop land (Organik)16 B2. Land – Converted Crop (AG dan BG Biomasss)17 B2. Land – Converted Crop (DOM dan serasah)18 B2. Land – Converted Crop (Mineral)19 B2. Land – Converted Land Petanian (Organik)
20 Grass land C.1 Grass land – Remaining Grass land (Mineral )21 C.1 Grass land – Remaining Grass land (Organik)22 C2. Land – Converted Grass land (AG dan BG biomass)23 C2. Land – Converted Grass land (DOM dan serasah)24 C2. Land – Converted Grass land (mineral)25 C2. Land – Converted Grass land (organik)26 Wet land D1. Wet Land – Remaing Wet land (CO2 _peat)27 D1. Land – Converted Wet land (CO2 _peat)28 D1. Land – Wet Land (CO2 _peat)29 D1. Land – Wet Land (N
2O_peat)
30 D2. Land – Converted Wet land (N2O_peat)31 D2. Land – Converted Wet land(CO2 _Flooded)32 Settlement E.1. Settlement – Remaining Settlement (Organik 1 of 1)33 E.2. Land – Converted Settlement (Biomasss1 of 1)34 E.2. Land – Converted Settlement (DOM, necromas)35 E.2. Land – Converted Settlement (Mineral)36 E.2. Land – Converted Settlement (Organik)37 Other Use F.2. Land – Converted to others land use (Biomass)38 F.2. Land – Converted to other land use (Mineral)
39 F.2. Land – Converted to other land use (Organik)
17

7/31/2019 Technical Report No.4_review Existing Methodology
http://slidepdf.com/reader/full/technical-report-no4review-existing-methodology 26/56
Review Existing Methodology of Resource Based Inventory
IPCC Guidelines provide options for measuring transparent, consistent,comparable, complete, accurate, verifiable, and efficient recording andreporting carbon stocks and change by sources and removals from land usechange in which either one or combination of the two approaches, i.e., landbased approaches and activities based approaches could be adopted. (Figure3) (IPCC, 2006). A "land-based" approach in carbon accounting, stars withunderstanding the change of carbon stock in six carbon pools on landscontaining activities. This involves first defining the applicable activities, and inthe next step identifying the land units on which these activities occur. Next, thechange in carbon stocks on these land units during the relevant period isdetermined. It needs also to be clear whether a non-CO2 greenhouse gasemission estimates would also need to take into acount. Some modificationscould be made regarding, for example, baselines, leakage, timing issues,
permanence, and uncertainties.
Activity-Based AccountingLand-Based Accounting
STEP 1Definition of ApplicableLULUCF Activities under
Kyoto Protocol for
specific Land Areas
Definition of ApplicableLULUCF Activities under
the Kyoto Protocol
STEP 2
Land Units per ActivityChanges in Carbon Stocksper Unit of Area per Time
Period
STEP 3
Land Area per ActivityChanges in Carbon Stocks
per Land Unit/TimePeriod
STEP 4Sum over Land Unit and
Commitment periodSum over Activities and
Commitment Period
Figure 4. Accounting Approaches (IPCC, 2006).
18
7/31/2019 Technical Report No.4_review Existing Methodology
http://slidepdf.com/reader/full/technical-report-no4review-existing-methodology 27/56
Review Existing Methodology of Resource Based Inventory
The estimate of the emission is done by relating information on the extent towhich a human activity takes place (activity data, AD) to coefficients thatquantify the emissions or removals per unit activity (emission factors, EF). Inresponse to this, the Measurement and Reporting components of the proposedMRV system consist of the following three components (Figure 2): (1) a SatelliteLand Monitoring System to assess activity data on forest area and forest areachanges; (2) a National Forest Inventory to assess emission factors on carbonstocks and carbon stock changes; (3) a National GHG Inventory to estimate andreport anthropogenic emissions by sources and removals by sinks.
Figure 5. Relationship between IPCC elemenst and MRV components(Girardin, 2010).
Emission and removals from forest
IPCC Basic Method
Activity Data
Land representation
Emission factors
C‐stock changes
Emission estimates
GHG Emissions and
removals
Satellite land
monitoring system
National Forest
InventoryMRV system components
IPCC elements
Context
X =
National GHG
Inventory
19

7/31/2019 Technical Report No.4_review Existing Methodology
http://slidepdf.com/reader/full/technical-report-no4review-existing-methodology 28/56
IV. APPROACH FOR THE MERU BETIRINATIONAL PARK
The study in Meru Betiri National Park would focused on how shouldmeasurable, reportable and verifiable mitigation commitments be madecomparable, and how it related to technology, finance and capacity-buildingsupport. In other words, a sub national MRV that meet international standardand cost effective need to be developed. To do this, a break MRV down into itscomponents, i.e., measurable, reportable, and verifyable and focus what ismeant by measurable, reportable and verifiable would be undertaken tobetter understood the details of technical parameters. At this sub national level,
The outcome of the MRV system will be a Sub National forest GHG Inventory toreport on REDD+ activities to the national, and UNFCCC Secretariat.
To measure 'deviations from baseline' and recognize relative emissionreductions, one effectively needs to establish baselines, supported byfundamental data, from forest inventory, and institutional capacity building.While the unit of measurement is tonnes of CO2-equivalent. In general thenecessary elements needed for MRV can be seen in Table 7.
Table 7. Mitigation action for MRV
MRV on Supported by Activity needed
Baseline (CO2-e) Data (Satelite and Groundbase), Communities andinstitutional CapacityBuilding
Permanent Sample Plots(PSP) and Inventory,Consultation, Training
Deviations fromBaseline
Data (Satelite and groundbase), Communities, Public
and Private Participation
Policies, zone enforcementlaws
Reportableemmisions
Regular Communication Updated Inventoryand`report
Reportable. Under UNFCCC convention, all parties have existing reportingcommitments, such as national communications, which provide an obvious profilefor reporting. Mitigation action undertaken by non Annex 1 countries, includingGHGs inventory need to be reported through National Communication asmandated by Article 12.1 (b) for every 2 years based on COP decision.Changes in inventories would reflect not only mitigation supported from
20

7/31/2019 Technical Report No.4_review Existing Methodology
http://slidepdf.com/reader/full/technical-report-no4review-existing-methodology 29/56
Review Existing Methodology of Resource Based Inventory
multilateral sources, but also unilateral action. MRV would require separatetracking of domestically financed and internationally supported action. Changesin inventories would reflect reductions only if all actions are considered. Thequestion of whether such inventories would be reviewed must be addressedunder the verification procedures. Another format for reporting might beconsidered, for example sustainable development policies and measures (SD-PAMs) to give recognition to mitigation actions.
Verifiable. If emission reductions are to be real, long-term and measurable, thenverification is crucial. The necessary questions are then, what can be verified,how, and by whom? These questions would be explained below, starting fromapproach for MRV in MBNP.
4.1. Overview of Meru Betiri National Park
MBNP was established through the enactment of Ministerial Decree No277/Kpts-VI/1997. Based on this decree, the area of MBNP covered about58000 ha, as can be seen in Tabel 9 and Figure 6. Within the area, nucleuszone is the largest proportion of the MBNP, amounting to 48.13 percent,followed by forest zone, accounting to 39 per cent and rehabilitation zone,amounting to 6.94 per cent. While intensive use zone and buffer zone, whichhave already been used by communities inside MBNP, amounting to 5, 94 percent. Nevertheles, this figure was established in 1999, more than ten years ago.A changed must have occurred during this period that need to be examined.This would be undertaken through a series of analyses using historical andremote sensing anaysis. As can bee seen in Figure 7.
In this study, a land zoning system within MBNP would take into consideration.The zoning system within MBNP can be seen in Figure 6. Zoning systems inMBNP consists of Nucleus zone, Forest zone, Rehabilitation zone, Buffer zone,and intensive utilization zone. Each zone has its own characteristics and function.
Based on Ministerial Decree No. 56/2006, nucleus zone is a pristine and densesforest, characterised by indegenous flora and fauna of thea area. While forestzone is a buffer for nucleous zone, and situated between nucleous zone andutilization zone. Rehabilitation zone is a degraded area that need to berehabilitated. Buffer zone is zone managed specially for accomodatingprotection and conservation of natural park, including ecotourism. Utilizationzone, is a zone to be utilised for ecoutorism and other environemental servicespurposes. For MBNP, the area of zoning system can be seen in Table 8.
21

7/31/2019 Technical Report No.4_review Existing Methodology
http://slidepdf.com/reader/full/technical-report-no4review-existing-methodology 30/56
Review Existing Methodology of Resource Based Inventory
Table 8. Forest Types by Zonation in MBNP, 1999
NoForest
Ecosystem
Zone (Ha)Total
Area Nucleus Forest IntensiveUtilization
Buffer Rehabili-tation
1 Mangrove - 7
(0.03)
- - - 7
(0.01)
2 Coastal 620
(2.22)
675
(2.98)
925
(71.98)
- - 2.220
(3.83)
3 Swamp - 25 (0.11) - - - 25
(0.04)
4 Tropical
Rainforest
23.870
(85.51)
20.340
(89.91)
- 2.155
(100.00)
3.573
(88.81)
49.938
(86.10)5 Bamboo
Forest
3.425
(12.27)
1.575
(6.96)
360
(28.02)
- 450
(11.19)
5.810
(10.02)
Area (Ha)27.915
(48.13)
22.622
(39.00)
1.285
(2.22)
2.155
(3.72)
4.023
(6.94)
58.000
(100.00)
Source : Based on Directorate Jenderal Decree No.185/99.Note : Number in parantheses is percentage from total.
Figure 6. Zoning System within MBNP.
22

7/31/2019 Technical Report No.4_review Existing Methodology
http://slidepdf.com/reader/full/technical-report-no4review-existing-methodology 31/56
Review Existing Methodology of Resource Based Inventory
4.2. Approach for MRV in MBNP
Approach and steps for measuring, reporting, and verifying (MRV) which is anunderlying condition for REDD+ would be explained as follows:
(i) determining the boundary of activity;
(ii) developing baseline;
(iii) stratifying the area;
(iv) identifying relevant carbon pools and non-CO2 GHGs;
(v) designing the sampling framewok;
(vi) assessing and managing leakage or displacement of activity;
(vii) identifying the methods for estimating and monitoring including qualityassurance and quality control plan.
4.2.1. Determining boundary of activity
Determining boundary of activities can be seen in terms of geographicallocation, duration of activities, and in terms of the activities and practicesresponsible for greenhouse gas emissions and removals that are significant andreasonably attributable to the activities undertaken. There amny tools for
identifying physical boundary in MBNP. The easiest one, is to use nationalrecognized system such as Ministry of Forestry decree. In 1997, the area wasappointed as a national park through the Ministry of Forestry Decree No277/Kpts-VI/1997, covers area of 58.000 hectares which located in twodistricts: Jember and Banyuwangi (GoI MoF, 1997). Therefore a boundary ofactivity for MBNP would be 58 000 ha. In addition, a remote sensing analysisand ground bases surveyed have also been undertaken to support and markthe boundary of the area as can be seen in Figure 7.
23

7/31/2019 Technical Report No.4_review Existing Methodology
http://slidepdf.com/reader/full/technical-report-no4review-existing-methodology 32/56
Review Existing Methodology of Resource Based Inventory
(a)
(b) (c)
Figure 7. Aerial photo of MBNP in 2009 (a), vegetation map (b)and land use map (c)
4.2.2. Developing baseline
IPCC GPG (2003) mention that the baseline is the scenario that reasonablyrepresents the anthropogenic emissions by sources and anthropogenic removals
24

7/31/2019 Technical Report No.4_review Existing Methodology
http://slidepdf.com/reader/full/technical-report-no4review-existing-methodology 33/56
Review Existing Methodology of Resource Based Inventory
by sinks of greenhouse gases that would occur in the absence of the proposedactivities. Which implies the need to assess potential greenhouse gas emissionsand removals in a manner consistent with those associated with the activitieswithin the project. In addition, it is related to which pools, gases, and activitiesthe baseline shall include, how the baseline will be established, and choices of abaseline methodology.
Changes in the carbon stocks in the relevant carbon pools and the non-CO2greenhouse gas emissions associated with the project need to be measured andmonitored and then compared to those of the project’s baseline. REDD+intervention need to show reduced emission or increase enhancement frombaseline (Figure 8).
REDD+
C-emissions
Past Future
How is past
emissions?
How to
estimatefuture
emissions ?
Reference level
Baseline
? ?
Figure 8. REDD+ Intervention
The development of a baseline is a crucial step in the implementation ofdemonstration activities, to ensure accurate crediting of their carbon impacts orreference level. Reference scenario of GHG benefits are computed as the gap
in carbon stocks and other GHG emission levels of the activity and the baseline.A key issue therefore, is how to develop a baseline that would represents thenet emissions in the absence of activity.
There are currently no standard practices for developing baselines forconservation activities. However, a baseline has two major components, which is(i) the projected land-use or land-cover change, and (ii) the associated carbonstocks in the pool. Brown (2007) argues, the projections of land use change arethe most important and yet the most difficult to address because many
socioeconomic and environmental factors affect the way people use land andthese are difficult to predict. Existing estimate changes in land use and baselines
25

7/31/2019 Technical Report No.4_review Existing Methodology
http://slidepdf.com/reader/full/technical-report-no4review-existing-methodology 34/56
Review Existing Methodology of Resource Based Inventory
were determined on a project-by-project approach using simple logicalargument that assumed continuation of observed past trends for the limitedproject area or a region. Brown (2007) argues to use analytically rigorous andtransparent agreed methods. For the carbon stocks, it would be measured atthat local from the PSP, to produce a more specific baseline.
There are several approached for baseline, i.e (i) historical approach, (ii)modelling approach, and (iii) other approach. Historical approach range fromrelatively simple model of extrapolation of historical trend in land use based onsimple drivers of degradation and deforestation such as population growth, tomore complex extrapolation of past trend using spatial explicit model of landuse change driven by biophisical and socio-economic factors such as the ForestArea Change (FAC) model, the Land Use and Carbon Sequestration (LUCS)
model, and Geographical Modeling (Geomod) model (Brown, et.al., 2007). Ingeneral, FAC model produce the highest amount of forest loss projection, whileLUCS provide the least amount of loss. They proposed three main steps todevelop baseline. First, In the first step, an historic land-use change anddeforestation estimate is made by determining the size of the region relative tothe size of proposed project, obtaining historic data, analyzing candidatehistoric baseline drivers, and identifying three to four major drivers. Second,produce a potential land-use change (PLUC) map using for example a spatialmodel such as GEOMOD that uses the key drivers from step one. Then rates ofdeforestation are projected over a 10-year baseline period using any of thethree models. Third, the baseline assumptions about baseline drivers be re-assessed. This step reviews the viability of the 10-year baseline in light ofchanges in one or more key baseline drivers (e.g., new roads, new communities,new protected area, etc). Brown (2007) further mentioned that the baselinesshould be projected over a 10 year period to be more realistic. Griscom, et.al.(2009) also suggest that the most credible approach for estimating baselinelinked to historic emission data such as that from FAO-FRA.
There are two aspects that have to be considered: (i) The relevant carbon pools
and non-CO2 greenhouse gas emissions prior to the project activity need to beestimated (historical). This estimation should preferably be based onmeasurements made on the same site where the project will be established. It ispossible to use alternative ways for estimating carbon stocks and non-CO2greenhouse gas emissions, including for example, measurements on sites that areconsidered to reproduce, as far as possible, the initial condition of the projectsite (i.e., sites with similar soil type, vegetation cover and land-use history).
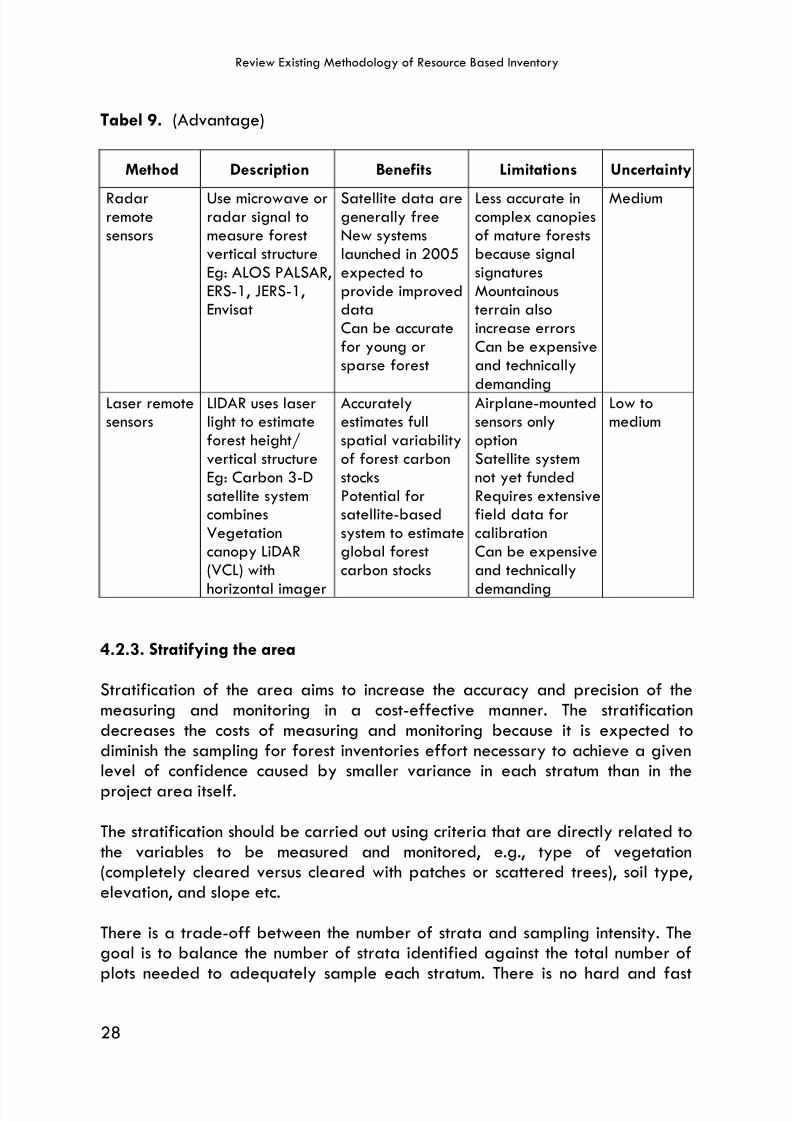
In addition, Gibb, et al. (2007) provide guidelines on advantage and
disadvantage for estimating carbon stock as can be seen in Table 9.
26

7/31/2019 Technical Report No.4_review Existing Methodology
http://slidepdf.com/reader/full/technical-report-no4review-existing-methodology 35/56
Review Existing Methodology of Resource Based Inventory
Tabel 9. Advantage and disadvantage of several estimation methods forforest carbon (Gibbs et al., 2007)
Method Description Benefits Limitations Uncertainty
Biomeaverages
Estimates ofaverage forestcarbon stocks forbroad forestcategoriesbased on avariety of inputdata sources
Immediatelyavailable at nocostData refinementscould increaseaccuracyGloballyconsistent
Fairly generalizedData sources notproperly sampledto describe largeareas
High
Forest
inventory
Relates ground
basedmeasurements oftree diameters orvolume to forestcarbon stocksusing allometricrelationships
Generic
relationshipsreadily availableLow-tech methodwidely understoodCan be relativelyinexpensive asfield-labor islargest cost
Generic
relationshipsnot appropriatefor all regionsCan be expensiveand slowChallenging toproduce globallyconsistent results
Low
Opticalremote
sensors
Uses visible and infrared
wavelengthsto measurespectralindices andcorrelateto ground-basedforest carbonmeasurementsEg: Landsat,MODIS
Satellite dataroutinely collected
and freelyavailable atglobal scaleGloballyconsistent
Limited ability todevelop goods
models fortropical forestSpectral indicessaturated atrelatively low CstocksCan be technicallydemanding
High
Very highresolutionAirboneopticalRemotesensors
Uses very highresolution (10-20cm) images tomeasure treeheight and crownarea andallometry toestimate carbonstocksEg: Aerial photos,3D aerial
imagery
Reduces time andcost of collectingforest inventorydataReasonableaccuracyExcellent groundverification fordeforestationbaseline
Only covers smallareas (10.000sha)Can be expensiveand technicallydemandingNo allometricrelations based oncrown area areavailable
Low tomedium
27
7/31/2019 Technical Report No.4_review Existing Methodology
http://slidepdf.com/reader/full/technical-report-no4review-existing-methodology 36/56
Review Existing Methodology of Resource Based Inventory
Tabel 9. (Advantage)
Method Description Benefits Limitations Uncertainty
Radarremotesensors
Use microwave orradar signal tomeasure forestvertical structureEg: ALOS PALSAR,ERS-1, JERS-1,Envisat
Satellite data aregenerally freeNew systemslaunched in 2005expected toprovide improveddataCan be accuratefor young orsparse forest
Less accurate incomplex canopiesof mature forestsbecause signalsignaturesMountainousterrain alsoincrease errorsCan be expensiveand technically
demanding
Medium
Laser remotesensors
LIDAR uses laserlight to estimateforest height/vertical structureEg: Carbon 3-Dsatellite systemcombinesVegetationcanopy LiDAR
(VCL) withhorizontal imager
Accuratelyestimates fullspatial variability of forest carbonstocksPotential forsatellite-basedsystem to estimateglobal forest
carbon stocks
Airplane-mountedsensors onlyoptionSatellite systemnot yet fundedRequires extensivefield data forcalibrationCan be expensive
and technicallydemanding
Low tomedium
4.2.3. Stratifying the area
Stratification of the area aims to increase the accuracy and precision of themeasuring and monitoring in a cost-effective manner. The stratificationdecreases the costs of measuring and monitoring because it is expected todiminish the sampling for forest inventories effort necessary to achieve a given
level of confidence caused by smaller variance in each stratum than in theproject area itself.
The stratification should be carried out using criteria that are directly related tothe variables to be measured and monitored, e.g., type of vegetation(completely cleared versus cleared with patches or scattered trees), soil type,elevation, and slope etc.
There is a trade-off between the number of strata and sampling intensity. The
goal is to balance the number of strata identified against the total number ofplots needed to adequately sample each stratum. There is no hard and fast
28

7/31/2019 Technical Report No.4_review Existing Methodology
http://slidepdf.com/reader/full/technical-report-no4review-existing-methodology 37/56
Review Existing Methodology of Resource Based Inventory
rule, and project developers need to use their expert judgement in deciding onthe number of strata to include.
In MBNP, stratification would be undertaken, using 3 main criteria, i.e, zoningsystem, type vegetation, and type of land use. The sub criteria would be thearea within each category, that would be representatively sampled.
As a national park, zoning system is used to manage through differentapproach. Within core zone area, human-interventions are prohibited, since itwill causes change in the national park ‘s ecosystem; while in utilization zone it ispossible for human-intervention. Nucleus or core zone is the largest area withinthe national park, accounting for more than 48 per cent. Within this zone, thelargest ecosystem is the tropical rainforest, amounting to 85.5 per cent,
followed by bamboo and coastal ecosystems, amounting to 12.3 per cent and2.2 percent, respectively. Rehabilitation and utilization zone amounting to about6.9 percent and 2.2 per cent, respectively. In 1999, most of the rehabilitationzone is covered by tropical rainforest, amounting to 88.8 per cent and bambooforest amounting to 11.2 per cent. At the current condition, changes might hadoccurred to facilitate the need of local communities, as can be seen in landcover changed described in the analysis.
4.2.4. Determining the carbon pool
Ground check involves measuring 5 pool of carbon of:
• Aboveground living biomasso Tree and Non-Tree
• Belowground living biomasso Tree and Non Tree
• Woody necromass (dead organic matter)
• Litter (non woody necromass)
• Soilso Mineralso Organic
Not all pools are likely to be acceptable as sources of enhancement, and not allpools need to be measured at the same level of precision or accuracy or atsame frequency during the life of the project. In the initial inventory, therelevant carbon poools must be measured (Brown, 2001).
29

7/31/2019 Technical Report No.4_review Existing Methodology
http://slidepdf.com/reader/full/technical-report-no4review-existing-methodology 38/56
Review Existing Methodology of Resource Based Inventory
Three general methods for evaluating cahnges in carbon stocks andtheir`respective baseline exist (Vine et al. 1999, Bron, 2002), computermodelling, remote sensing and field/site measurements. Modelling is aconvenient way of estimating the size of carbon pools in periods betweeninventories to minimise the cost of doing field measurements. Sampling of PSPwould be combined with these models to validate the changes in carbon stockspredicted by the model.
4.2.4.1. Above Ground Biomass
Tree Component. The simplest procedure for measuring aboveground biomassconsists of measuring a sample of trees in PSP and using allometric equations toestiamte biomass. Allometric methods have been shown to be robust amongspecies and genera, and can predict biomass of closed-canopy forests to withinabout 10%. The assumption that biomass contains 50% carbon (on a dry weightbasisi) is well accepted (Hamburg, 2000; Brown 2002), so it is straightforwarded to convert measured biomass to carbon units. The popular allometricequation for tropical trees is that proposed by Brown (1995):
B = 0.049 ρ D2H ……………………………………. (i)
Where B is biomass (kg per tree), D is diameter at breast height (cm), ρ is wood
density (g/cm3) and H is tree height (m). Ketterings et al. (2001) proposed theallometric equation:
B = 0.11 ρ D 2+c ................................................................. (ii)
Where c is a parameter that can be estiamted for the site. Ketterings et al.(2001) estimated c = 0.59 for forest in Sumatra.
The biomass of a tree equal the product of its volume and its density, so it is
also possible to estiamte the carbon content of trees when their volume is known.This is useful for commercially important timber species for which measurementsare available. Biomass is estimated from volume by first estimating the biomassof the measured trees and the expanding this value to take into account thebiomass of the other aboveground components (leaves and branches):
B = ρ V δ ……………………………………………(iii)
Where V is timber volume (m3), and δ is the biomass expansion factor, and B is
now measured in tonnes. If it is known that the stem represents ¾ of the tree
30

7/31/2019 Technical Report No.4_review Existing Methodology
http://slidepdf.com/reader/full/technical-report-no4review-existing-methodology 39/56
Review Existing Methodology of Resource Based Inventory
biomass, for example, then δ = 4/3. Density ( ρ )generally ranges between 0.5and 0.7.
In Vademicum Kehutanan (Direktorat Jenderal Kehutanan, 1976) is widely usedto estimate volume from diameter and heights data. D and H are measured inmetres.
V = ( π ).(D/2)2 ρH...................................................(iv)
B = 4/3V ρ C = 0.5 B
Modelling of biomass accumulation can be based on simple single-equationmodels, or on process based models of different level of complexity. Twocommon mathematical functions for predicting tree growth are the Richards-Chapman equation (v) and the Gompertz equations (vi).
( )( )γ β α t C t P
⋅−−= exp1, ………………………….(v)
( )t
C
⋅−
⎟ ⎞
⎜⎛
=
γ
α β
exp
t P ⎟ ⎠
⎜⎝ β
,
………………………………. (vi)
Where α , β , and γ are parameters to be estimated for a particular species andsite, and t represents time generally measured in years. These equationsgenerally represents only aboveground biomass. Belowground biomass (roots) isdifficult to measure so this pool of carbon is often estimated from root/shootratios (Brown, 2002). Mean root/shoot ratios from a number of studies are0.26, with an inter-quartile range of 0.18-0.30. Therefore, multiplying theabove equations by 1.26 can provide a rough estimate of total biomass. Inaddition IPCC (2006) also provide a default value of several types of forest intropics.
Non-Tree Component. Shrubs and other large non-tree vegetation biomass ismeasured by destructive harvesting techniques. A small sub-plot depending onthe size of the vegetation is established and all the shrub vegetation isharvested and weighed. An alternative approach, if the shrubs are large, is todevelop local shrub allometric equations based on variables such as crown areaand height or diameter at base of plant or some other relevant variable (e.g.,number of stems in multi-stemmed shrubs). The equations would then be basedon regressions of biomass of the shrub versus some logical combination of theindependent variables. The independent variable or variables would then be
measured in the sampling plots.
31

7/31/2019 Technical Report No.4_review Existing Methodology
http://slidepdf.com/reader/full/technical-report-no4review-existing-methodology 40/56
Review Existing Methodology of Resource Based Inventory
4.2.4.2. Below Ground Biomass
Tree Component. The belowground biomass (roots) is difficult and time-consuming to measure and estimate in most ecosystems, and methods aregenerally not standardized (IPPC, 2003). This guideline provides the averagebelowground to aboveground dry biomass ratios based on these studies was0.26, with a range of 0.18 (lower 25% quartile) to 0.30 (upper 75% quartile).The belowground to aboveground dry biomass ratios did not vary significantlywith latitudinal zone (tropical, temperate, boreal), soil texture (fine, medium,coarse), or tree type (angiosperm, gymnosperm).
Ritson and Sochacki (2003) reported that belowground to abovegroundbiomass ratios of plantations of Pinus pinaster varied between 1.5 and 0.25,
decreasing with increasing tree size and/or age. use an estimate forbelowground biomass by using the average belowground to abovegroundbiomass ratios, such as those in Annex 3A.1, Table 3A.1.8.
Non Tree Component. Direct measurement of belowground biomass requirescollecting soil samples, usually in the form of cores of known diameter anddepth, separating the roots from soil, and oven-drying and weighing the roots.The following steps for direct measurement of belowground biomass in the fieldare recommended (IPPC, 2003):
• Because a large proportion of non-tree root biomass is usually present inthe upper soil layers, in most situations sampling to a depth of 0.3-0.4 mshould suffice. In cases where samples are collected at deeper depths, it isrecommended to split the sample into two or more layers, clearly recordingthe depth of each layer.
• Separation of roots from soil can be performed by using root washingdevices for maximum recovery. If these devices are not available, simplerprocedures (e.g., placing soil samples on a sieve and washing roots withhigh pressure water) may yield recovery of a relatively large proportion
of root biomass.
• Non-root belowground biomass (e.g., rhizomes and tubers) should beconsidered as part of the belowground biomass pool.
• Roots should be oven-dried at 70oC until dry and then weighed. Theresulting weight should be divided by the cross sectional area of thesample core to determine belowground biomass on a per-area basis.
32

7/31/2019 Technical Report No.4_review Existing Methodology
http://slidepdf.com/reader/full/technical-report-no4review-existing-methodology 41/56
Review Existing Methodology of Resource Based Inventory
4.2.4.3. Dead organic matter (woody necromass)
IPCC (2003) categorized dead wood as all non-living woody biomass notcontained in the litter, either standing, lying on the ground, or in the soil. Deadwood includes wood lying on the surface, dead roots, and stumps larger than orequal to 10 cm in diameter or any other diameter used by the country.
Methods for estimation can be follow IPCC (2003) as follows:
ΔCFFDOM = ΔCFFDW + ΔCFF LT
ΔCFFDOM = annual change in carbon stocks in dead organic matter (includesdead wood and litter) in forest land remaining forest land,
tonnes C yr-1ΔCFFDW = change in carbon stocks in dead wood in forest land remaining
forest land, tonnes C yr-1ΔCFFLT = change in carbon stocks in litter in forest land remaining forest
land, tonnes C yr- 1
4.2.4.4. Litter (non woody necromass)
IPCC (2003) described “litter as all non-living biomass with a diameter less thana minimum diameter chosen by the country (for example 10 cm), lying dead, invarious states of decomposition above the mineral or organic soil. This includesfumic, and humic layers. Live fine roots (of less than the suggested diameter limitfor below-ground biomass) are included in litter where they cannot bedistinguished from it empirically”.
Litter can be sampled using a small frame (either circular or square) and isplaced in the sample plot and all litter within the frame is collected andweighed. A well-mixed sub-sample is collected to determine oven dry-to-wet
weight ratios to convert the total wet mass to oven-dry mass.
An alternative approach for systems where the litter layer is well-defined anddeep (more than 5 cm), is to develop a local regression equation that relatesdepth of the litter to the mass per unit area. This can be done by sampling thelitter in the frames as mentioned above and at the same time measuring thedepth of the litter. At least 10-15 such data points should be collected, ensuringthat the full range of the expected litter depth is sampled (IPCC, 2003).Methods for estimation can be seen above, similar to those for dead wood.
33
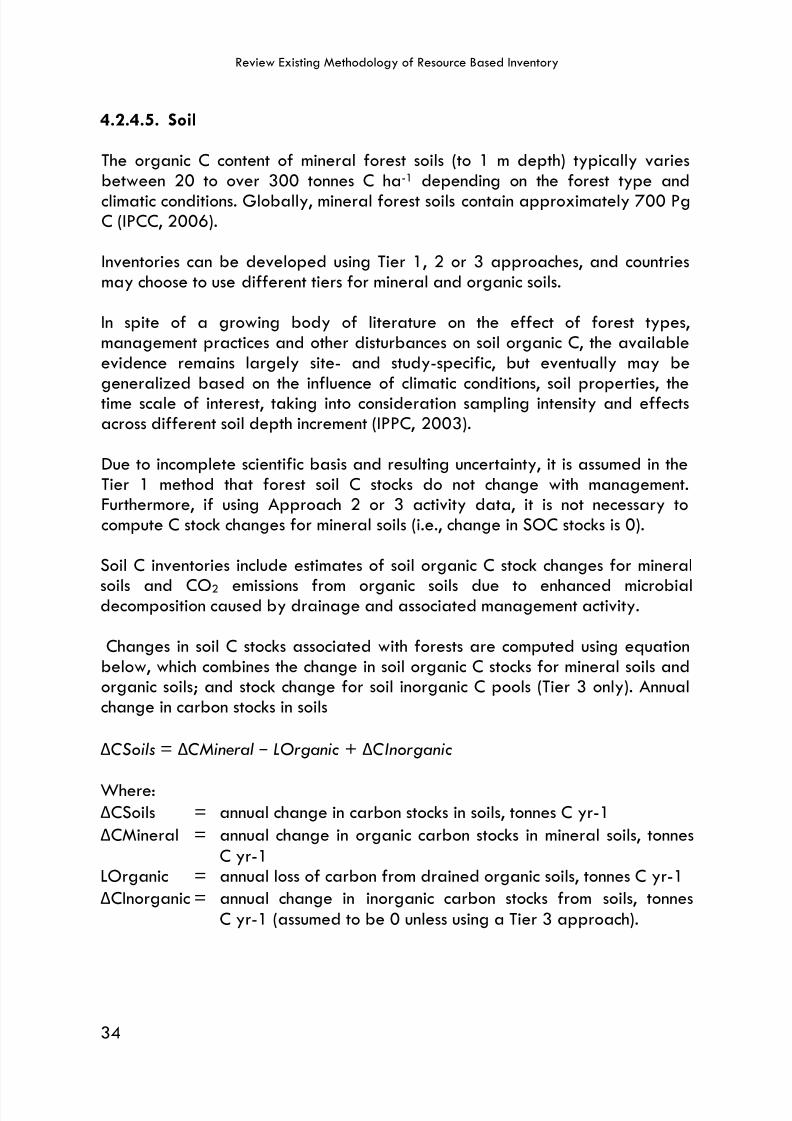
7/31/2019 Technical Report No.4_review Existing Methodology
http://slidepdf.com/reader/full/technical-report-no4review-existing-methodology 42/56
Review Existing Methodology of Resource Based Inventory
4.2.4.5. Soil
The organic C content of mineral forest soils (to 1 m depth) typically variesbetween 20 to over 300 tonnes C ha-1 depending on the forest type andclimatic conditions. Globally, mineral forest soils contain approximately 700 PgC (IPCC, 2006).
Inventories can be developed using Tier 1, 2 or 3 approaches, and countriesmay choose to use different tiers for mineral and organic soils.
In spite of a growing body of literature on the effect of forest types,management practices and other disturbances on soil organic C, the availableevidence remains largely site- and study-specific, but eventually may be
generalized based on the influence of climatic conditions, soil properties, thetime scale of interest, taking into consideration sampling intensity and effectsacross different soil depth increment (IPPC, 2003).
Due to incomplete scientific basis and resulting uncertainty, it is assumed in theTier 1 method that forest soil C stocks do not change with management.Furthermore, if using Approach 2 or 3 activity data, it is not necessary tocompute C stock changes for mineral soils (i.e., change in SOC stocks is 0).
Soil C inventories include estimates of soil organic C stock changes for mineralsoils and CO2 emissions from organic soils due to enhanced microbialdecomposition caused by drainage and associated management activity.
Changes in soil C stocks associated with forests are computed using equationbelow, which combines the change in soil organic C stocks for mineral soils andorganic soils; and stock change for soil inorganic C pools (Tier 3 only). Annualchange in carbon stocks in soils
ΔCSoils = ΔCMineral − LOrganic + ΔCInorganic
Where:ΔCSoils = annual change in carbon stocks in soils, tonnes C yr-1
ΔCMineral = annual change in organic carbon stocks in mineral soils, tonnesC yr-1
LOrganic = annual loss of carbon from drained organic soils, tonnes C yr-1
ΔCInorganic = annual change in inorganic carbon stocks from soils, tonnesC yr-1 (assumed to be 0 unless using a Tier 3 approach).
34

7/31/2019 Technical Report No.4_review Existing Methodology
http://slidepdf.com/reader/full/technical-report-no4review-existing-methodology 43/56
Review Existing Methodology of Resource Based Inventory
For Tier 1 and 2 methods, soil organic C stocks for mineral soils are computed toa default depth of 30 cm. Greater depth can be selected and used at Tier 2 ifdata are available, but Tier 1 factors are based on 30 cm depth.
4.2.5. Designing the sampling framewok
Permanent sampling plots is plot to estimate changes of relevant carbon poolsand non-CO2 GHGs over time. Permanent sample plots are generally regardedas statistically more efficient in estimating changes in forest carbon stocks thantemporary plots because typically there is high covariance betweenobservations at successive sampling events (IPPC, 2003). Disadvantages ofpermanent plots are that their location could be known and they could be
treated differently (such as by special attention), or that they could bedestroyed or lost by disturbances over the project interval.
The sample size (number of sample plots) needed can be calculated based onthe estimated variance in each stratum, area of each stratum, targeted precisionlevel (based on sampling error only), and estimation error are known (IPPC,2003).
The main considerations for determining PSP are: (i) Location, the plot must berepresentative of the system and easily relocated. Their location must besurveyed and marked on maps, their geographyical position need also to beidentified, (ii) Demarcation, most of sample plots are rectangular, (iii) Plot sizeand shape, ideally all plots should be the same size. Various size of sampleplots have been applied for measurement of carbon stock in forestry project,including 40 x 30 m as used by JICA-Forda Project in 2009, 100 m x 100 m(National Forest Inventory), 200 m x 200 m (PSP for monitoring of increment inmineral soil, Badan Litbang, 1993), 30 m x 30 m (Dahlan et al, 2005), and20 m x 100 m (Asmoro, 2009, Hairiah and Rahayu, 2007, Hairiah et al.,2001a and b), (iv) Tree identity, all trees should be labeled individually and
their positions marked on a plot chart. Numbered aluminum tags fastened withan aluminum nail are effective, (v) Calculations, the form of calculations, analysisand summary must be decided. Usually this will include the determination of anyvolume equations to be used.(vi) Measurements, often all trees are measuredfor DBH. Other additional measurements will be needed for estimating volume,(vii) Check in, the previous records should be available to the field teams inorder to spot and recheck inconsistent records.
The number of PSP need to be representative to the large area, existing land
use, and other factors (topography, soil, etc). In MBNP, PSP would be selectedbased on three criteria, i.e., zoning system, type of vegetation, and type of
35
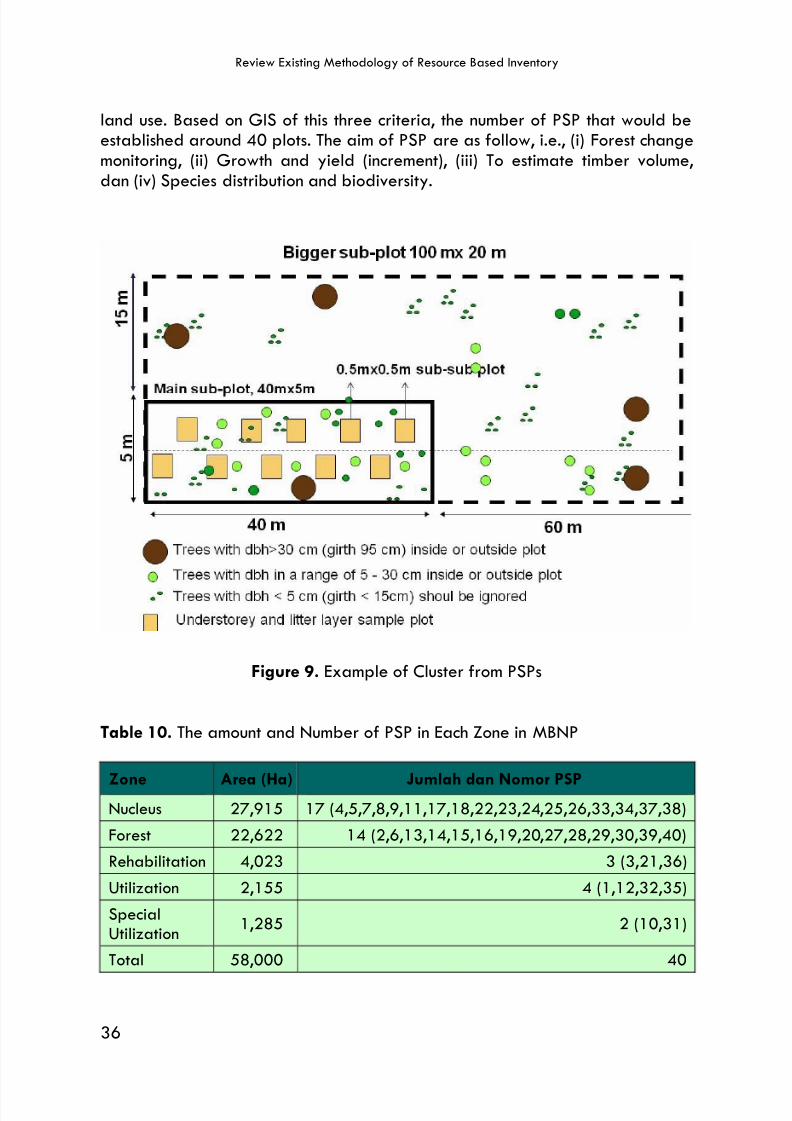
7/31/2019 Technical Report No.4_review Existing Methodology
http://slidepdf.com/reader/full/technical-report-no4review-existing-methodology 44/56
Review Existing Methodology of Resource Based Inventory
land use. Based on GIS of this three criteria, the number of PSP that would beestablished around 40 plots. The aim of PSP are as follow, i.e., (i) Forest changemonitoring, (ii) Growth and yield (increment), (iii) To estimate timber volume,dan (iv) Species distribution and biodiversity.
Figure 9. Example of Cluster from PSPs
Table 10. The amount and Number of PSP in Each Zone in MBNP
Zone Area (Ha) Jumlah dan Nomor PSP
Nucleus 27,915 17 (4,5,7,8,9,11,17,18,22,23,24,25,26,33,34,37,38)
Forest 22,622 14 (2,6,13,14,15,16,19,20,27,28,29,30,39,40)
Rehabilitation 4,023 3 (3,21,36)
Utilization 2,155 4 (1,12,32,35)
SpecialUtilization
1,285 2 (10,31)
Total 58,000 40
36

7/31/2019 Technical Report No.4_review Existing Methodology
http://slidepdf.com/reader/full/technical-report-no4review-existing-methodology 45/56
Review Existing Methodology of Resource Based Inventory
Forest inventory refer to the inventory methodology determining growth byrepeated measurement of permanent sample plots (PSP). A series of periodicmeasurements give a complete historical record of stand growth. It providesinformation of individual trees and their relationship to their environment.Periodic and continues forest inventory are the tool of management at the forestlevel providing information on the result of treatment applied and the growth ofthe trees in order to compare the field results with predictions made from yieldtables or other form of growth model such as allometric model.
The purposes of forest inventory are as follows: (i) Provide volumes by species,tree grades, and size classes for the different timber types consideredsignificant, (ii) Assess relative economic availability of trees and areas ofvarying qualities, (iii) Provide growth information for the different timber types
that will give a basis for calculating allowable cut, (iv) Evaluate results ofsilvicultural practices, including planting, in terms of survival, quality, and growthof regeneration, (v) Evaluate need for timber stand improvements, (vi) Provide abasis for determining areas to be planted, area of non-productive land, andratio of mortality to cut, and (vii) Provide values, volumes and growth rates fordepletion and other purposes in accounting for timberlands. The concept ofutilizing a continuous forest inventory system provides more than growth andvolume data, it also provides a means of periodically assessing change in theforest so that management decisions can be adaptive in nature and consistent
with continuous improvement of resource management. Field plot would providebaseline data including type of vegetation, diameter and height of tree. Otherdata that need to be recorded are type of tree inventory, condition of thelocation, such as topography, soil, land use system, etc. By doing this, baselinedata would be able to determine. Based on the area and existing type offorest, the number and amount of plot in each zone can be seen in Table 10.
4.2.6. Assessing and managing leakage or displacement of activity
Leakage or displacement of activity is defined as loss or gain of net greenhousegas benefits outside a project boundary (Boer et al., 2006). Leakage refersonly to the increase of all greenhouse gases outside the project boundary,measurable and attributable to the project. CIFOR (2001) mentioned thatleakage occur when one of the following phenomena occurs outside the projectboundary: (i) Unallocated forested lands are harvested, (ii) Protected areas areconverted into production forest areas, (iii) Illegal logging increases in protectedand production forests, and (iv) Land is converted to lower C stocking rates dueto emissions reductions elsewhere. Furthermore, establishment of boundary, may
result from protection of an area which previously was the source of timber andwoodfuel for communities.
37

7/31/2019 Technical Report No.4_review Existing Methodology
http://slidepdf.com/reader/full/technical-report-no4review-existing-methodology 46/56
Review Existing Methodology of Resource Based Inventory
In order to predict whether leakage will occur or not, Boer et al. (2006) statedthat baseline drivers, baseline agents, causes and motivations, and indicatorsthat exist in the project sites should be well understood. Baseline drivers aredefined as activities predominantly taking place in the absence of the project,and that the project will replace. Baseline agents are actors who are engagedin those activities. Causes and motivations refer to factors that drive thebaseline agents to do the activities and these can be represented by indicators.By knowing the interrelationship between these factors, we can predict whetherleakage would occur or not. The following example illustrates the definitionsmentioned above.
In this case identifying potential leakage, and adress the socio-economic factorsthat could drive degradation in the other side need to be undertaken. These can
be done by providing for example economic opportunities for communitieswithin and beyond the boundary of activities that encourages protections to theland resources, such as agricultural based proccesing industry, agriculturetourism, ecotourisme, and developing medicinal plant industry.
To minimise leakage, risk assessment would be undertaken, followed bydetermining the appropriate buffer reserve based on guidance provided in thisdocument. This self risk assessment must be clearly documented andsubstantiated where possible. During verification, the VCS verifier will evaluatethe project's leakage assessment and adjust it as appropriate before VoluntaryCarbon Units (VCUs) can be issued. Assessment for leakage can be outlined asfollows (Table 11).
38

7/31/2019 Technical Report No.4_review Existing Methodology
http://slidepdf.com/reader/full/technical-report-no4review-existing-methodology 47/56
Review Existing Methodology of Resource Based Inventory
Table 11. Reducing potential leakage in MBNP
Leakage Driver Location Prevention
General Unclear land tenureand potential fordispute
Rehabilitation zone Land legallygranted andEnforcement
Financial failure All zone • Income security• Fund
management• Regular
monitoring andreporting
Technical failureManagement failure
Economic Land encroachment Rehabilitation andrimba zone Education andcommunicationIncome shortage Communities Alternatives incomeWood theft Communities and
others partyCommunities selfpunishment
Biodiversity theft Communities andothers party
Communities selfpunishment
Regulatoryand social
Unclear role andresponsibilities
All zone Robust and clearguidelines
Lack of monitoringand enforcement All zone Robust and clearguidelinesNaturaldisturbance
Forest fire All zone Monitoring anddeveloping earlydetection system
Pest and diseaseattacks
Rehabilitation andother zone
Technique forcombating pestand disease
Risk of extremeclimatic events(e.g. floods,drought, winds)
All zone Education andpreventionactivities
Geological risk(e.g. volcanoes,earthquakes,landslides)
All zone Safety training
39

7/31/2019 Technical Report No.4_review Existing Methodology
http://slidepdf.com/reader/full/technical-report-no4review-existing-methodology 48/56
Review Existing Methodology of Resource Based Inventory
4.2.7. Estimating and monitoring greenhouse gas emision and removal
IPCC 2006 GL provides tool for for estimating emission reduction or removal.To do this, ones need to determine activity data from representative land usechange and associate carbon changes. In this regard, a matrix of land usechange due to human activities need to be filled. A Land Change Matrix (LCM)can be made started with: i) visual analysis of remote sensing data, ii) groundtruthing, iii) accuracy assessment, re-interpretation, iv) re-analysis of remotesensing data based on ground truthing, and v) determine land change matrix.Activity data is made in worksheet format Excel IPCC amounting to 39 Table, ascan be seen in Tabel 6 above.
Ones need to have figure on coeficient of emission and removal of factor
emission to estimate on reduction of GHG emission and removal. This data couldbe provided by series of research undertaken in the field, for example frommeasuring data from permanent sample plot.
Guidance for estimating CO2 emission, including recommendation for accountingfor emissions of non-CO2 gas, quality assurance, quality control, and uncertaintyanalysis is provided in the IPCC 2006 GL. Reporting format of GRK inventory ingeneral can be seen in Tabel 12.
40

7/31/2019 Technical Report No.4_review Existing Methodology
http://slidepdf.com/reader/full/technical-report-no4review-existing-methodology 49/56
Review Existing Methodology of Resource Based Inventory
Tabel 12. Reporting Format for GRK Inventory for LULUCF
GHG Source and sinkcategories
Net CO2 Emission/removals
CH4 N2O NOx CO
(Gg/ha)
Total Land Use Categories
A. Forest Land
A.1. FL remaining FL
A.2. Land converted to FL
B. Crop Land
B.1. CL remaining CLB.2. Land converted to CL
C. Grass Land
C.1. GL remaining GL
C.2. Land converted to GL
D. Wet Land
D.1. WL remaining WL
D.2. Land converted to WL
E. Settlements
E.1. Set. Remaining Set.
E.2. Land converted to Set.
F. Other Lands
F.1. OL. Remaining OL.
F.2. Land converted to OL.
G. Other (specify)
Biomass burning
Liming
41

7/31/2019 Technical Report No.4_review Existing Methodology
http://slidepdf.com/reader/full/technical-report-no4review-existing-methodology 50/56
V. INSTITUTIONAL ARRANGEMENT FOR MONITORINGAND REPORTING
Institutional arrangements for carbon accounting, monitoring, and reportingneed to be established within the MBNP. Role and responsibilities for potentialinstitutions, including communities, public and private stakeholders need to beidentified and engaged. Based on stakeholders consultation, organisationresponsible that can be identified for each zones in MBNP can be explained inTable 13.
Table 13. Institutional Arrangement for Monitoring and Reporting in MBNP
No
Zone
Nucleus Forest SpecialUtilization
BufferRehabili-
tation
1 Mainagency
Nationalpark officer
Nationalpark officer
Estate andCommunities
Communities Nationalpark officerandcommunities
2 Supportingagencies
Communities,Local
Government,StateForestryCorporation(Perhutani),
Communities,Local
Government,StateForestryCorporation(Perhutani),
Nationalpark officer,
LocalGovernment,StateForestryCorporation(Perhutani)
NGO,National
park officer,LocalGovernment,StateForestryCorporation(Perhutani)
NGO,National
park officer,LocalGovernment,StateForestryCorporation(Perhutani)
Table 13 shows that for nucleous and forest zone, domination role of MBNPofficial is needed, however, for rehabilitation, intensive utilization and special
utilization zone, partnership with communities and estate crops are required.
Institutional structure in general can be seen in Figure 10. Starting from subnational level at MBNP to national level. Law No. 41/1999 about forestry,Regulation No. 6/2007, Regulation No. 3/2008, and Ministerial of ForestryDecree No. 30/2009 about Mechanism for REDD in Indonesia provides ageneral answers to institutional matters. Where it mentiones the requirementsfor independence, acceptability of the verifying institutions, accuracy, andbuilding on existing capacity and experience. With this regards, domesticinstitutional capacity in developing countries to undertake both measurementand verification will be significant. Within the Ministry of Forestry, Directorate
42

7/31/2019 Technical Report No.4_review Existing Methodology
http://slidepdf.com/reader/full/technical-report-no4review-existing-methodology 51/56
Review Existing Methodology of Resource Based Inventory
General of Forest Planology (DG Plan) would be the responsible agency forsetting activity data, supported by LAPAN and Bakosrutanal. The DG Plan willbe supported by others sectoral institution, i.e, ministry of agriculture, ESDM,Public Work, which need to coordinate with provincial government, and unitimplementation, in this case MBNP. DG Plan is backed up by ResearchInstitutions and University for scientific data and technical guidance to developemission factor and carbon stock change. The Ministry of Forestry would thencoordinate with Ministry of Environment and Council for Climate Change as anational coordination. Ministry of Environment or Council of Climate Change,then, communicate with UNFCCC Secretariat for validation.
Figure 10. Institutional Structure for MRV in MBNP
Manajemen Unit
(Institutions and Rules)
Technical Unit(Data Base and Remote
Sensing)
NationalSecretariat
Private andPublic
Provincial and
District
Meru Betiri NationalPark Government(TNMB) Secretariat
UNFCCC
Secretariat
Field
Staff
Field
Staff
Field
Staff
Field Field
Staff Staff
Consultation LineCoordination Line
43

7/31/2019 Technical Report No.4_review Existing Methodology
http://slidepdf.com/reader/full/technical-report-no4review-existing-methodology 52/56
44
VI. CONCLUSION
This paper explores general research framewok for measuring, monitoring andreporting carbon, including how to engaged communities, public and privatepartnership sustainably. Measuring and monitoring of carbon involved technicalguidance, and starting from designing and establishing PSP.
As mandated ini Decision 1/CP.13 of the Bali Action Plan, the study wouldfocused on how to develop a national MRV that meet international standardand cost effective need to be established. As a starting point, Ministerial ofForestry Decree No. 30/2009 about Mechanism for REDD in Indonesia providesa general answers to this questions.
It is obvious that to establish MRV system, combination of methods such as IPCC2006 GL, and taking into consideration step wise procedure for MRV inVoluntary Carbon Standard (VCS) is needed to provide simpler, high certainty,and verifyable. VCS explained in great detail steps by steps guidelined fordesigning MRV involving communities and relevant stakeholders, while IPCC2006 GL provide guideline on how to undertake forest inventory and estimateemission reduction or removal of GHGs.
MRV system need to undertake steps as follows: (i) determination boundary ofactivity, including carbon pool that would be measured, (ii) established baseline,(iii) identification and assessment on how to manage potential leakage,particularly from potential socio and economic driven factors, and (iv)estimation, monitoring and reporting emission reduction or enhancement ofremoval GHG. To determine boundary of activity, a visualisation of mediumand high resolution of remote sensing data need to be undertaken. In addition,a representative amount of permanent sample plot need to be established forground truthing to check the accuracy, and increase reliability of data.Approached to determine baseline vary from the simplest to the complexmethods. However they are linked to historic emission. Potential risk for leakageneed to be assessed and managed. While estimation and reporting of emissionreduction or removal are guided by IPCC 2006 method.

7/31/2019 Technical Report No.4_review Existing Methodology
http://slidepdf.com/reader/full/technical-report-no4review-existing-methodology 53/56
45
REFERENCES
Asmoro, J.P.P. 2009. Quantification of Carbon Sequestration on Production,Conservation and Protected Forest. Balai Penelitian Kehutanan Manokwari.
Badan Litbang Kehutanan. 1993. Pedoman Pembuatan dan Pengukuran PUP UntukPemantauan Pertumbuhan dan Riap Hutan Alam Tanah Kering Bekas Tebangan.Badan Litbang Kehutanan. Jakarta. Baumert, K.A, T. Herzog and J. Pershing.2005. Navigating the Numbers : Greenhouse Gas Data and InternationalClimate Policy. World Resource Institute.
Boer, R., A.N. Gintings, A. Wahyudi., I. Setiawan, A. Bey, M.B. de Rozari dan J.S.Baharsjah. . 1998. 'Economic assessment of GHG abatement options for forestrysector', in A. Sugandhy, A. Bey., R. Boer and Gunardi (eds.). Proceedings ALGAS-
Final National Workshop. Jakarta.
Boer, R., Upik R. Wasrin, Perdinan, Hendri, Bambang D.Dasanto, Willy Makundi, JuliusHero, M. Ridwan, and Nur Masripatin. 2006 Assessment of Carbon Leakage InMultiple Carbon-Sink Projects: A Case Study In Jambi Province, Indonesia.
Bowman, A.F. 1990. Exchange of greenhouse gases between terrestrial ecosystem andthe atmosphere. In: soils and the greenhouse effect. A.F. Bowman edited byWiley, Chichester, U.K.
Brown, S. 1997. Estimating biomass and biomass change of tropical forests: A primer.FAO Forestry paper 134.
Brown, S. 1997. Estimating biomass and biomass change in tropical forests: A primer.FAO Forestry Paper 134, FAO, Rome.
Brown, S. 2002. Measuring carbon in forests: curent status and future challenges.Environmentla pollution. 116:363-372.
Bowman, A.F. 1990. Exchange of greenhouse gases between terrestrial ecosystem andthe atmosphere. In: soils and the greenhouse effect. A.F. Bowman edited byWiley, Chichester, U.K.
Brown, S. 1997. Estimating biomass and biomass change of tropical forests: A primer.FAO Forestry paper 134.
Brown, S. Myrna Hall, Ken Adrasko, Fernando Ruiz, Walter Marzoli, GabrielaGuererro, Omar Masera, Aaron Dushku, Ben Dejong, and Joseph Cornell. 2007.Baselines for Landuse Change in the Tropics: Aplication to Avoid DeforestationProject. Mitigation Adaptation Strategies Global Change. Winrock International,VA.
Budiharto. 2009. Penentuan Rujukan Dan Skenario Pengurangan Emisi Karbon DariDeforestasi Dan Degradasi Hutan Di Indonesia. [tesis]. Pasca Sarjana InstitutPertanian Bogor. Bogor

7/31/2019 Technical Report No.4_review Existing Methodology
http://slidepdf.com/reader/full/technical-report-no4review-existing-methodology 54/56
Review Existing Methodology of Resource Based Inventory
46
CIFOR. 2001. Developing a Shared Research Agenda for LUCF and CDM; ResearchNeeds and Opportunities after COP 6’, Centre for International ForestryResearch, Bogor.
Castillo-Santiago, M.A., Hellier, G., Tipper, R., de Jong, B.H.J., in press. Carbonemissions from land-use change: a regional analysis of causal factors in Chiapas,Me´xico. Mitigat.Adapt. Strategies Global Change.
Cowie, A., Pingoud, K., Robertson, K., Schlamadinger, B., et al., 2005. Key terms used ingreenhouse gas reporting andaccounting for the land use, land use change andforestry sector. IEA Bioenergy Task 38.
Dahlan, I.N. Surati Jaya and Istomo. 2005. Estimasi Karbon Tegakan Acacia mangiumWilld Menggunakan Citra Landsat ETM+ dan SPOT-5: Stusi Kasus di BKPHParung Panjang KPH Bogor. Pertemuan Ilmiah Tahunan MAPIN XIV”Pemanfaatan Efektif Penginderaan Jauh Untuk Peningkatan Kesejahteraan
Bangsa” Gedung Rektorat lt. 3 Kampus Institut Teknologi Sepuluh NopemberSurabaya, 14 – 15 September 2005.
DeFries, R., Asner, G., Achard, F., Justice, C., Laporte, N., Price, K., Small, C., Townsend,J., 2005. Monitoring tropical deforestation for emerging carbon markets. In:Moutinho, P., Schwartzman, S. (Eds.), Tropical Deforestation and Climate ChangeBelem. Instituto de Pesquisa Ambiental da Amazonia and Environmental Defense,Brazil.
DeFries, R., Achard, F., Brown, S., Herold, M., Murdiyarso, D., Schlamadinger, B., deSouza, C., 2007. Reducing greenhouse gas emissions from deforestation indeveloping countries: Considerations for monitoring and measuring. Environ. Sci.Policy 10, 385–394.Dutschke, M., 2007. CDM.
Fahrizal. 2002. Pendugaan Biomasa Pohon Bagian Bawah Tanah di Hutan Primer danHutan Bekas Tebangan (Studi Kasus di Hutan Tri Dharma IPB Dusun Aro Jambi).[skripsi]. Jurusan Manajemen Hutan. Fakultas Kehutanan. Institut Pertanian Bogor.Bogor
FAO. 1996. Forest resources assessment 1990, Survey Of Tropical Forest Cover AndStudy Of Change Processes. [online]. [Dikutip: 14 Februari 2009].http://www.fao.org/document.
FAO. 2006. Global Forest Resource Assessment 2005: Global Assessment of GrowingStock, Biomass and Carbon Stock. Rome.
FAO. 2008. National Forest Monitoring and Assessment – Manual for integrated fielddata collection. National Forest Monitoring and Assessment Working PaperNFMA 37/E. Rome
First National Communication. 1999. The Indonesia First National Communication to theUNFCCC. KLH. Indonesia.
Garsetiasih R. dan Heriyanto N.M. 2007. Keanekaragaman Jenis Tumbuhan Bawah anPotensi Kandungan Karbonnya pada Hutan Agahis di Baturraden. JurnalPenelitian Hutan dan Konservasi Alam Vol. IV No. 2 Tahun 2007. Bogor

7/31/2019 Technical Report No.4_review Existing Methodology
http://slidepdf.com/reader/full/technical-report-no4review-existing-methodology 55/56
Review Existing Methodology of Resource Based Inventory
47
Gibbs et al. 2007. Monitoring and estimating tropical forest carbon stocks: makingREDD a reality. Environment Research Letters IOP Publishing. Available athttp://www.sage.wisc.edu/pubs/articles/F-L/Gibbs/gibbsERLarticle 2007. pdf.
Girardin, Cecile. 2010. Reports and Analysis UN-REDD/FAO to Publish National ForestMRV System Recommendation. Available at http://www.unredd.org/Newsletter8_MRV_System Recommendations/tabil/4551/language/enus/Default.aspx.
Griscom, B., David Shcoh, Bill Stanley, Rane Cortez, Nicole Virgilio. 2009. Implicationsof REDD baseline methods for different country circumstances during an initialperformance period. The Nature Conservancy, VA.
Hairiah K, Dewi S, Agus F, van Noordwijk M and Rahayu S. 2009. Measuring CarbonStocks Across Land Use Systems: A Manual. Bogor, Indonesia. WorldAgroforestry Centre (ICRAF), SEA Regional Office, Brawijaya University and
ICALRRD (Indonesian Center for Agricultural Land Resources Research andDevelopment). 127 p. DRAFT VERSION.
Hairiah K, Rahayu S. 2007. Pengukuran ‘karbon tersimpan’ di berbagai macampenggunaan lahan. Bogor. World Agroforestry Centre - ICRAF, SEA RegionalOffice, University of Brawijaya, Unibraw, Indonesia. 77 p.
Hairiah,K., Sitompul, SM, van Noordwijk, M. and Palm, C.A., 2001 (a). Carbon stocks oftropical land use systems as part of the global C balance: effects of forestconversion and options for ‘clean development’ activities. ASB_LN 4A. In: VanNoordwijk, M, Williams, S.E. and Verbist, B. (Eds.) 2001.Towards integratednatural resource management in forest margins of the humid tropics: local actionand global concerns. ASB-Lecture Notes 1 – 12. International Centre forResearch in Agroforestry (ICRAF), Bogor, Indonesia.
Hairiah, K., Sitompul, SM, van Noordwijk, M. and Palm, C.A., 2001 (b). Methods forsampling carbon stocks above and below ground. ASB_LN 4B. In: VanNoordwijk, M, Williams, S.E. and Verbist, B. (Eds.) 2001.Towards integratednatural resource management in forest margins of the humid tropics: local actionand global concerns. ASB-Lecture Notes 1 – 12. International Centre forResearch in Agroforestry (ICRAF), Bogor, Indonesia.
IPCC. 2001. IPCC Third Assessment Report. Available at http://www.grida.no/
publications/other/ipcc_tar/IPCC. 1996. Revised 1996 IPCC Guidelines for National Greenhouse Gas Inventories.
IGES, Japan. IPCC
IPCC. 2003. Good Practice Guidance for Land Use, Land-Use Change and Forestry.Intergovernmental Panel on Climate Change. IPCC National Greenhouse GasInventories Programme. IGES. Japan.
IPCC. 2006. IPCC Guidelines for National Greenhouse Gas Inventories. IPCC NationalGreenhouse Gas Inventories Programme. IGES, Japan.

7/31/2019 Technical Report No.4_review Existing Methodology
http://slidepdf.com/reader/full/technical-report-no4review-existing-methodology 56/56
Review Existing Methodology of Resource Based Inventory
IPCC. 2007. Fourth Assessment Report. Available at http://www.ipcc.ch/ publications_and_data/publications_ipcc_fourth_assessment_report_wg3_ report_ mitigation_of_climate_change.html
IPCC. 2007. Box 13.7. The Range of difference between emissions in 1990 andemissions allowances in 2020/2050 for various GHG concentration levels forannex 1 and non annex 1 countries as a group. Available at http://www.ipcc.ch/publications_and_data/ar4/wg3/en/ch13-ens13-3-3-3.html
Masripatin, N. 2007. APA ITU REDD ?. [Online] [Dikutip: 10 Maret 2009]http://www.forda-mof.org/uploads/File/climate%20change/isi%20 buku%20apa%20itu%20REDD.pdf
Ketterings, Q.M., Coe, R., van Noordwijk, M. Ambagau, Y. and Palm, C.A. 2001.Reducing uncertainty in the use of allometric biomass equations for predictingabove-ground tree biomass in mixed secondary forestr. Forest Ecology and
management, 146:199-209.Lopes, Paulo. 2009. Review of Forestry Carbon Standards – Development of a tool for
organizations to identify forestry carbon credits. Imperial College London,Centre for Environmental Policy. Available from:http://reducecarbon.wordpress.com/“
Skutsch, M.N., Bird, E. Trines, M. Dutschke, P. Frumhoff, B.H.J. de Jong, P. van Laake, O.Masera h, D. Murdiyarso. 2007. Clearing the way for reducing emissions fromtropical deforestation. Environmental science & policy 10 (2007): 322-334.Available at www.sciencedirect.com
Soares-Filho, B.S., Nepstad, D.C., Curran, L.M., Cerqueira, G.C., Garcia, R.A., Ramos,C.A., Voll, E., McDonald, A., Lefebvre, P.,Schlesinger, P., 2006. Modellingconservation in the Amazon basin. Nature 440, 520–523.
Vine, E. Sathaye, J., and Makundi, W. 1999. Guidelines for the monitoring, evaluation,reporting, verification and certification of forestry projects for climate change
mitigatin, prepared for the US EPA Environment by Lawrence BerkeleyNational Laboratory.
VCS. 2008a. Guidance for AFOLU Projects. [Online] Available from: http://www.v-c-s.org/docs/Guidance for AFOLU Projects.pdf. [Accessed 04/08/2010].
VCS. 2008b. Tool for AFOLU Methodological Issues. [Online] Available from:http://www.v-c-s.org/docs/Tool for AFOLU Methodological Issues.pdf.[Accessed 04/08/2010].
VCS. 2008c. Tool for AFOLU Non-Permanence Risk Analysis and Buffer Determination.[Online] Available from: http://www.v-c-s.org/docs/Tool for AFOLU Non-Permanence Risk Analysis and Buffer Determination.pdf. [Accessed04/08/2010].