technical report no. 1 national center for research in policy and...
TRANSCRIPT

Technical Report No. 1National Center for Research in Policy and Practice
Findings from a National Study on Research Use Among
School and District Leaders
William R. PenuelDerek C. Briggs
Kristen L. DavidsonCorinne HerlihyDavid Sherer
Heather C. HillCaitlin C. FarrellAnna-Ruth Allen
April 2016

ACKNOWLEDGEMENTS
The authors would like to thank the large team that helped us develop and administer the research use survey. Guiding the project in its early phases, attendees at “item camp” included Pam Buffington, Kara Finnigan, Ritu Khanna, Marco Muñoz, and Laura Wentworth. Our practice board, Valerie Mills, Juan-Carlos Aguilar, and Sergio Paez, reviewed survey items, and our technical advisory board, Larry Hedges, Lawrence Palinkas, and Tom Smith, provided feedback on the survey instrument and research design.
At the University of Colorado Boulder, Charles Bibilos and Leah Teeters provided much support during survey development, and Zane Brink conducted data analysis of open-ended items.
At Northwestern University, NCRPP colleagues Cynthia Coburn and James Spillane helped write items and contributed to overall guidance of the project.
At Harvard University, Cynthia Pollard, Robert Pollard, Lauren Yoshikawa, Kenyon Maree, and Eryn Heying were part of the early development team that drafted items and tested versions of the survey through cognitive interviews. Barb Gilbert, Michael O’Neil, and Sophie Houston led the rostering and participant calling effort. Eric Anderson provided crucial technical support necessary to manage the sample and online survey instrument. Fallon Blossom was central to managing multiple waves of survey administration and in designing the final report. Fallon Blossom was central to managing multiple waves of survey administration. She and Ashley Dixon did a beautiful job executing design and layout for this report.
For more information, please visit our website www.ncrpp.org,or follow us on @ncrpp.
Preferred citation for this report: Penuel, W.R., Briggs, D.C., Davidson, K.L, Herlihy, C., Sherer, D., Hill, H.C., Farrell, C.C., & Allen, A-R. (2016). Findings from a national survey of research use among school and district leaders (Technical Report No. 1). Boulder, CO: National Center for Research in Policy and Practice.
This work has been supported by the Institute of Education Sciences, U.S. Department of Education, through Grant RC305C140008. The opinions expressed are those of the authors and
do not represent views of the Institute or the U.S. Department of Education.
Report Updated: July 5, 2016

TABLE OF CONTENTS
EXECUTIVE SUMMARY
INTRODUCTION
CONCEPTUAL FRAMEWORKMultifaceted Nature of Research Use
Hypotheses About Individual Characteristics That Shape Research UseHypotheses About How Organizational Contexts Shape Research Use
STUDY DESIGNPopulation
SampleInstrument: NCRPP Survey of Research Use
Survey AdministrationEvidence of Structural Validity of Survey Scales and
Coding of Open-Ended Responses
RESULTSInstrumental Uses of Research
Conceptual Uses of ResearchSymbolic Uses of Research
Analysis of Research Leaders Find UsefulSources Leaders Use to Obtain Research
Attitudes Toward ResearchEffort to Acquire Research
Knowledge of How to Interpret Conclusions from Research
KEY CONCLUSIONS AND NEXT STEPS
LIMITATIONS OF THE STUDY
ENDNOTES
REFERENCES
APPENDIX
2
5
7778
1010101419
20
212122242532343738
44
45
46
48
51

Technical Report No. 1 National Center for Research in Policy and Practice | 2
EXECUTIVE SUMMARY
This study reports on results of a nationally representative survey of principals and district leaders in the nation’s mid-sized and large school districts. The survey focused primarily on how these educational leaders use research to inform their decision-making. In addition, the study examined leaders’ attitudes toward research, their efforts to acquire it, and the culture of research use in their organizations. The National Center for Research in Policy and Practice, a center funded by the Institute of Education Sciences at the U.S. Department of Education, conducted the study.
A total of 733 different leaders responded to the survey from 45 states and 485 different school districts. The response rate for the survey was 51.5%.
An extensive survey development process to establish the validity and reliability of measures preceded the study reported here. Two different groups of advisors with practical and research expertise in the use of research reviewed items. The team conducted cognitive interviews with 40 different educational leaders to ensure items were comprehensible and to determine whether items elicited the focal constructs. We assessed the internal consistency of scales used and used item response theory to evaluate scales’ ability to discriminate amongst different respondents. Overall, all of the scales showed good reliability.
Definition of Research Used in the Study Our survey provided respondents with a definition of research as “an activity in which people employ systematic, empirical methods to answer a specific question.” For this study, we differentiated between research, which involves systematic inquiry to answer a specific question, and the practice of looking at data from the district, school, or classroom, which is more open-ended and seldom addresses specific research questions. For instance, looking at state standardized test results to identify students who need extra support in the classroom would not be research. However, asking the question, “What is the relationship between fourth grade state standardized test results and high school graduation?” would be research.
Uses of Research The study distinguished among three types of research use identified in earlier studies:
Instrumental use: Research is applied to guide or inform a specific decision.
Conceptual use: Research induces changes in the way a person views either a problem or the possible solution space for a problem.
Symbolic/political use: Research is used to validate a decision or legitimate a decision already made.
Instrumental use was the most commonly reported type of research use. With respect to instrumental use, survey respondents were most likely to be involved with activities related to (1) designing professional development for teachers and administrators and (2) directingresources to programs. Among respondents involved with each activity, the vast majorityindicated that research was used frequently or all of the time to make decisions in that activity.

Technical Report No. 1 National Center for Research in Policy and Practice | 3
With respect to conceptual use, 71% of respondents indicated that the research they encountered had expanded their understanding of an issue. Respondents were more mixed in reporting whether research provided a framework for structuring improvement efforts or that research provided a common language and set of ideas for discussions with colleagues. Respondents were least likely to indicate that the research they encountered often changed the way they looked at a problem or brought attention to a new issue that had not previously been under consideration in their district.
Of the symbolic uses presented to respondents, leaders reported using research most frequently to get others to agree with a point of view (68% said they did so “frequently” or “all of the time”) and that they used research selectively to support a particular decision (67% said they did so “frequently” or “all of the time”). Respondents were much less likely to indicate that they frequently used research either to mobilize support for important issues or to discredit a policy or program.
Specific Pieces of Research Leaders Found Useful The survey asked school and district leaders to name a specific piece of research they found useful. The pieces of research that school and district leaders named as useful were most often books, research or policy reports, or peer-reviewed journal articles. Most named research focused on instructional practices and learning in the classroom, though few mentioned research pertaining to teaching and learning in specific subject matter content areas. Despite educational leaders’ professed use of research to select curriculum materials and other programs elsewhere on the survey, this was the least common reason named for why the research was useful. Much more frequently, respondents claimed to use research to support their own learning, inform the design of programs, and provide instructional leadership.
Sources Leaders Used to Obtain Research The survey listed 14 different sources where leaders might obtain research and asked leaders to indicate from which sources they obtained research relevant to their work. Leaders were most likely to access research through professional associations and professional conferences. Leaders were less likely to access research through individual researchers or from three U.S. Department of Education resources: What Works Clearinghouse, the National Center for Education Statistics, or the Regional Educational Laboratories.
Attitudes Toward Research We asked leaders questions about the perceived relevance, value, and credibility of education research. Leaders who responded to the survey endorsed the idea that research can be relevant to practice, but they indicated that the time lag between conducting research and publication of research can decrease its usefulness to them. Survey respondents reported very positive attitudes about the value of educational research, with nearly all endorsing the ideas that research can address practical problems facing schools and that researchers provide a valuable service to educational practitioners. Leaders were more mixed in their perceptions of the credibility or trustworthiness of research. Over three-quarters agreed that research findings were trustworthy and objective, but were split as to whether researchers were biased. One in three agreed that researchers framed their results to make a political point.

Technical Report No. 1 National Center for Research in Policy and Practice | 4
Effort to Acquire Research We asked leaders to indicate whether they would seek out research under different conditions. Although a majority of leaders said they would look for research to inform a new problem or decision, few said they would contact researchers directly under these or other circumstances.
Knowledge of How to Interpret Conclusions from Research We asked leaders to respond to scenarios that presented summaries of quantitative or qualitative research studies. Leaders’ application of their knowledge of research to assess the validity of study conclusions varied widely across topic areas. The majority of responses indicated understanding of the role of purposeful sampling in qualitative research and how to interpret effect sizes. Few leaders drew accurate conclusions about what can be learned from a case study. A little more than half of respondents did not accurately identify a key advantage of random assignment.
Culture of Research Use Although most leaders reported that research is viewed as a useful source of information in their district or department, a majority disagreed with the statement that people expected claims made in meetings to be backed up by research.

Technical Report No. 1 National Center for Research in Policy and Practice | 5
INTRODUCTION
High quality educational research that could shed light on effective policies and practices is increasingly accessible to districts and schools. Since its establishment in 2002, the Institute of Education Sciences (IES) at the U.S. Department of Education has funded dozens of field-initiated efficacy and scale-up studies of interventions, released multiple evaluation studies of major policy initiatives, supported rigorous studies of programs through the Regional Educational Laboratories, and funded training grants to prepare new scholars to conduct high quality research in education. Efforts such as the What Works Clearinghouse aim to increase educational leaders’ access to findings from education research.
We still have limited understanding of how educational leaders access and use research. Developing knowledge about when leaders seek out research, where leaders find it, and the purposes for which they use it is critical if education research is to inform policy and practice. Such knowledge is especially important for supporting efforts focused on evidence-based policymaking at the local level. The new Every Student Succeeds Act (ESSA) increased demands that states and local education agencies adopt evidence-based programs, but it will be up to leaders in states and districts to find research evidence related to programs they are considering and use it to inform their decision-making.
To date, a key obstacle to studying research use at scale has been the absence of valid survey measures. Though a number of studies have examined uses of research through interview, observation, and case study methods, survey measures adequate for drawing inferences about how leaders use research have not been developed. This report presents results of the efforts of the National Center for Research in Policy and Practice (NCRPP) to address this need. The NCRPP is an IES-funded center focused on the study of knowledge utilization among school and district leaders in the United States.
To develop an understanding of how school and district leaders use research, we developed a survey of research use and administered it to a nationally representative sample of school and district leaders. We asked:
• How frequently do school and district leaders use research and for what purposes?
• What research do school and district leaders find useful?
• What are leaders’ attitudes toward research?
We also report on where leaders access research, the efforts they make to find relevant research, and the organizational contexts of research use.
In this report, we describe the instrument development process, the generation of our sample, the reliability of survey scales used and the ability of scales to discriminate among respondents with different types of attitudes, and the frequency distributions for responses to most items. It is our hope that this report will be useful to those seeking to either replicate or build upon our study and those seeking basic information on research use among educators in U.S. school systems.

Technical Report No. 1 National Center for Research in Policy and Practice | 6
Our center research activities also are examining the validity of respondents’ scores—e.g., the extent to which those scores represent respondents’ views and actions relating to research use. Further, we will investigate the correspondences between theoretically related variables, for instance, access to research and uses of research. A future report will present more detailed validity evidence regarding the survey used.

Technical Report No. 1 National Center for Research in Policy and Practice | 7
CONCEPTUAL FRAMEWORK
Our conceptual framework emphasizes that research use is an interactive process that is shaped by both individual characteristics and organizational contexts. Individuals interact across settings to define problems, interpret research, and identify solutions in a process that involves deliberation, negotiation, and persuasion.1 Research can be used in many ways, too, not just for making decisions as we describe below.
Multifaceted Nature of Research Use There are different ways to use research. When policy makers and others encourage school and district leaders to use research, they often imply that leaders should use research directly and centrally to make decisions related to policy or practice.2 However, research can also influence decision making by focusing attention on issues that were previously unknown to decision makers,3 identifying opportunities for improving current programs and policies,4 or by providing information about the plausibility of policy theories of action.5
Measurement of research use therefore must attend to the variety of ways that decision makers use research. Our survey study draws on a typology of research use developed by Weiss and Bucuvalas6 that identified three main types of use: instrumental, conceptual, and symbolic/political. These are defined as:
Instrumental use: Research is applied to guide or inform a specific decision.
Conceptual use: Research induces changes in the way a person views either a problem or the possible solution space for a problem.
Symbolic/political use: Research is used to validate a decision or legitimate a decision already made.
Other scholars have used this framework to characterize research use among school and district leaders. For example, researchers have used it to develop claims about the relative frequency of different types of use.7 They have also used it to characterize research use in varied contexts, such as when leaders are deliberating about contentious issues8 and when districts partner with external groups to develop reform strategies.9 What we do not know is just how prevalent different types of research use are or how research use varies across school and district at a larger scale.
Through a nationally representative sample, this study was designed to find out how often principals and district central office leaders use research for different purposes. Our survey study also documented where and when leaders accessed research and their attitudes toward educational research.
Hypotheses About Individual Characteristics That Shape Research Use In the framework guiding this study, we assume that a number of individual characteristics are likely to shape research use. In this report, we present descriptive statistics from the survey study regarding each of these characteristics; however, we will explore relationships of these constructs to research use in a future report.

Technical Report No. 1 National Center for Research in Policy and Practice | 8
How leaders differ in their level of access to research is a potentially important source of variation in individual research use. Both district and school leaders report that they have limited access to research findings that are timely and that address their immediate needs and questions.10 We also know that connections to outside sources of research (such as universities, research intermediaries, consultants, libraries, and so on) can increase access to research11 and, under some conditions, facilitate its use.12
Leaders’ attitudes toward research, that is, the degree to which educational leaders see research as valuable, credible, and relevant may also influence their use. Individuals differ in their attitudes about the value of using research to guide decision-making. These include judgments about qualities that have been linked to research use: the relevance, usefulness, and trustworthiness or credibility of research.13 An individual’s disposition to seek out research is another potential support to research use. Studies of research use by government professionals in Canada have linked research use to “acquisition effort,” which refers to an individual’s initiative to acquire research relevant to particular problems and to establish relationships with researchers.14
Individuals’ knowledge of how to interpret conclusions from research is likely to explain some variation in their use of research. The skills required to interpret research findings include the ability to identify research that can answer leaders’ questions, to distinguish different kinds of research designs with respect to their adequacy to answer those questions, to recognize issues related to sampling, to judge the appropriateness of measures, and to judge whether conclusions and recommendations are warranted by the evidence presented. A number of studies of data use show that school and district leaders’ skills in posing questions about and making sense of patterns in achievement data can either support or impede the use of data in decision making.15
Similarly, variation in practitioners’ knowledge and skills in interpreting research may play a role in whether and how research is used.
While some of these factors have been explored in education, many have not. To date, there is not evidence from nationally representative samples regarding the nature of leaders’ access to research, their attitudes toward research, or leaders’ knowledge of research.
Hypotheses About How Organizational Contexts Shape Research Use Our framework also emphasizes the potential importance of organizational contexts that shape research use. In our survey study, we examine specifically the ways that roles of individuals in organizations are linked to research use. We also document the presence of routines in which research are used, as well as the cultures of departments and districts.
People in different roles have different kinds of opportunities to use research in decision-making and for other purposes. Most districts have highly complex and departmentalized organizational structures. Decision making related to instruction is often stretched across multiple units in the central office and levels of the system. Different district subunits have individuals with different disciplinary backgrounds and connections to external sources of research,16 which may result in attitudes toward research use that vary systematically by division and level.17 Patterns of within-level (e.g., district office) and cross-level (e.g., between districts and individual schools) interaction may support or impede research use. For example, Finnigan and colleagues found that

Technical Report No. 1 National Center for Research in Policy and Practice | 9
limited interaction between the central office and schools led to superficial uses of research at the school level.18
The presence and frequency of organizational routines where research is used may also be associated with research use. Routines (such as meeting structures and procedures for selecting materials) and can play important roles in influencing when and how evidence enters into decision-making deliberations.19 To date, organizational factors have been studied either outside education or in specific educational practices (e.g., routines in the practice of data use). While there is limited research on the routines and tools in enabling and constraining research use, research on data use provides a compelling argument for their import.20
A number of scholars posit that a “culture of research use” is an important condition for research use and evidence-based policymaking at the local level. A culture of research use is one in which organization members value research as a resource for decision making,21 select strategies using evidence,22 remain open to change in light of evidence,23 and enact multiple social supports and norms promoting evidence use.24

Technical Report No. 1 National Center for Research in Policy and Practice | 10
STUDY DESIGN
In our study, we surveyed a nationally representative sample of school and central office leaders from mid- and large-size U.S. urban districts using questionnaires we developed and refined through multiple pilot studies. Below, we describe the population targeted, our sampling procedures and the final sample achieved, the development process for and content of our survey items and scales, and the procedures for data collection.
Population Our target population for survey respondents was instructional policymakers from mid- and large-size U.S. urban districts who were likely to be involved in K–8 instructional decision-making. We chose K–8 because there is more research available on effective programs and interventions at these grade levels and because more variety exists in the curricular materials, assessments, and other instructional programs districts may adopt. We focused on instructional policymakers at the local level because principals and central office leaders make the vast majority of decisions regarding what programs and interventions to adopt in schools.
In keeping with our focus on individuals with instructional decision-making responsibility, we targeted the following roles:
(1) deputy, associate and network superintendents;
(2) curriculum supervisors, including coordinators of English Language Arts (ELA),mathematics and science;
(3) Special Education supervisors;
(4) accountability, assessment, research, and development supervisors;
(5) elementary, middle school and K–8 principals;
(6) directors of federal programs, including Title I, Title II, Title V, as well as bilingual andEnglish as a Second Language (ESL) programs; and
(7) district leaders classified in more than one of the above roles, or “multi-role” leaders.
We chose these roles because we suspected that research use and attitudes toward research may vary across divisions within districts. We bounded this population by focusing on the 1,000 largest school districts, which serve more than 9,000 students each according to NCES Common Core data. We reasoned that smaller districts may not have the funds to staff many of the positions included in our sampling frame.
Sample We initially identified a set of district leaders based on their job role as of March 2015 using a dataset purchased from MDR, a private education marketing firm that develops databases of educator and institution information across K–12, higher education, public libraries, and early childhood education. We asked MDR for a list of individuals in the above seven roles in each eligible district. This approach generated a sampling frame consisting of over 41,000 individuals

Technical Report No. 1 National Center for Research in Policy and Practice | 11
in the 1,000 largest school districts, from which we selected our final sample. The vast majority of individuals in the sampling frame, 80%, were school principals. We pruned the target population to 14,276 by taking a random sample of 10 principals for any school district with more than 10 principals in the district. The 21,852 principals excluded form the target population were used instead as part of a pool of candidates (that also included district leaders) to receive a pilot test survey prior to the field test described in this report.
Because we planned to make comparisons of our survey results by role, we chose role as one of two strata prior to the random selection of our sample. The second stratum was district enrollment, under the assumption that survey responses by district size would also be of analytical interest. We initially considered defining 28 strata by crossing professional role of respondent by quartile of district enrollment. We abandoned this approach when it became evident that certain strata would be sparsely populated. Instead, we created 14 strata by crossing role with districts that were above and below student enrollment of 17,860—the median of our accessible population of school districts.
Given resource constraints, our target was a final survey sample with 100 responses for each role and 50 responses for each role-by-size stratum. Assuming a 60% response rate, typical of well-designed survey research with systematic follow-up, we established two stratified random samples, our primary field test sample and a reservoir field test sample, each containing 168 potential respondents by role or 84 for each role by size stratum. All stratified random sampling was done using the function strata in the R package sampling. The reservoir sample was created in case we were unable to achieve our target of a 60% response rate by stratum. In fact, it was necessary to pull some cases from the reservoir sample to pursue additional respondents in the deputy, associate and network superintendents, curriculum and instruction supervisors, school principals and multi-role leaders strata. Additional cases were pulled from the reservoir sample either because of lower-than-anticipated response rates or because we were not able to obtain up-to-date contact information or a replacement for some members of the primary target sample.
Once we identified individuals in our sample, we searched district websites and contacted districts by phone to confirm our roster and to acquire email addresses for respondents. During the process of compiling email addresses and during follow-up calls during administration, the team found that some respondents had left their district or changed positions. If a respondent left the district or if their new position was outside of the target role category, they were replaced, when possible, by whomever had taken over the target role. If a contact remained in the district and their new position was still in the same target category, they remained in the sample, and their new title was noted.
Accuracy of the MDR Classifications Because there was a gap between the time of our efforts to roster participants and our mailing of the first survey link, and because individuals often fill more than one role within a district, one would not necessarily expect to see a perfect match between the role on the MDR list and the role reported by a respondent at the time of the survey. Our survey included items asking respondents to indicate their role in the district, so we could assess the accuracy of the classifications of leaders into different role categories. As expected, there was some discrepancy between the reported

Technical Report No. 1 National Center for Research in Policy and Practice | 12
roles and MDR’s assigned roles, but we find evidence of strong matches for the roles of deputy, associate and network superintendents, curriculum and instruction coordinators/ supervisors, special education directors, principals, and those with multiple roles in the district (See Appendix Table A1). The match is not as clear for those shown in the MDR list as directors of assessment and federal programs.
Response Rate The overall response rate was 51.5% but varied from a low of 33% and 37% for deputy, associate and network superintendents and principals in larger school districts, to a 66% and 71% for assessment and special education directors in smaller school districts. We fell short of our target sample sizes of 100 for the deputy, associate and network superintendents, assessment and federal programs roles. However, we decided that the marginal benefit of adding an additional 10 cases per role was not worth the cost in time and resources that would have been required. Table 1 below compares sampling frame population sizes, the numbers of randomly sampled respondents who were invited to respond to the NCRPP survey, and the number of people per stratum that completed the survey.
Sampling Frame Field Test Sample Field Test Responders
Role
Below Med Size
Above Med Size
Total by
Role
Below Med Size
Above Med Size
Total by
Role
Below Med Size
Above Med Size
Total by
Role1. Deputy/Associate/Network Superintendents 432 872 1,304 112 90 202 60 30 90
2. Curriculum & Instruction 611 1,330 1,941 125 114 239 56 59 115
3. Special Education 343 399 742 87 80 167 62 40 102
4. Assessment 260 485 745 76 66 142 50 41 91
5. School Principals 1,691 5,432 7,123 156 169 325 75 63 138
6. Federal Programs 418 720 1,138 79 65 144 48 41 89
7. Multi-Role 624 659 1,283 109 94 203 62 46 108
Total 4,379 9,897 14,276 744 678 1,422 413 320 733
Table 1. NCRPP Field Test Sampling Frame and Samples

Technical Report No. 1 National Center for Research in Policy and Practice | 13
We summarize the differences in the proportions of personnel by role in the sample frame and sample of field test responders for each conceptualization of the target population below in Table 2.
Weighting of the Data To allow for unbiased inferences to either a combined target population or to two separate target populations (district staff and principals, respectively), we created two sets of sampling weights to include as part of the survey data. However, empirical investigation suggests that the impact of changing sampling weights on inferences about the population means is trivial for a variety of survey variables. This indicates that variability in responses within our role-by-size strata is as big or bigger than variability across the strata.
Characteristics of the NCRPP Sample The full sample for the NCRPP survey consists of 733 individuals from 485 unique school districts disbursed across 423 cities and 45 states. The only states not represented in the sample are Hawaii, Maine, New Hampshire, Rhode Island, and Vermont.
The chart in Figure 1 characterizes the distribution of student enrollment in the districts represented in the NCRPP sample. The modal respondent to the NCRPP survey comes from a district with an enrollment between 10,000 and 20,000 students. The unique sample of 485 districts appears to be representative of the larger population of 904 districts found in the MDR list with respect to district size. This total is less than the 1,000 we initially identified, because some districts had no leaders whose roles fit our categories of roles.
Table 2. NCRPP Field Test Sampling Frame and Samples
CombinedTarget Population
District OfficTarget Population
Role Population %Field Trial Sample % Population %
Field Trial Sample %
1. Deputy/Associate/Network Superintendents 9.1% 12.3% 18.2% 15.1%
2. Curriculum & Instruction 13.6% 15.7% 27.1% 19.3%
3. Special Education 5.2% 13.9% 10.4% 17.1%
4. Assessment 5.2% 12.4% 10.4% 15.3%
5. School Principals 49.9% 18.8% NA NA
6. Federal Programs 8.0% 12.1% 15.9% 15.0%
7. Multi-Role 9.0% 14.7% 17.9% 18.2%

Technical Report No. 1 National Center for Research in Policy and Practice | 14
Instrument: NCRPP Survey of Research Use Below, we describe the development of the survey instrument used in the study and describe the processes we engaged in to increase the validity and reliability of our measures.
Instrument Development Process We began instrument development in July 2014 by bringing together project staff and a group of five scholars and educational leaders with interest and expertise in the area of research use. We selected researchers who had familiarity with the topic to ensure that our definitions of constructs reflected past research, and we included leaders who could bring their own experiences of research use to the task of defining constructs. Over a series of two days, we worked to refine our initial survey constructs and to develop items associated with each construct. We drew from existing item banks as well as the expertise of those present to develop new items that we could pilot test in the field.
Early in the development process, we conducted two sets of cognitive interviews with samples of educational leaders. We intended results from these interviews to serve two purposes: to improve the comprehensibility of items and to gather substantive validity evidence25 regarding the survey—that is, to determine whether respondents’ interpretation of and process for generating answers for an item was congruent with our hypotheses about what the item measured. An initial set of pilot interviews in October 2014 (n = 15) was intended principally to identify major misunderstandings of items, to generate ideas for how to address them, and to provide material for additional items based on the ways respondents talked about research use. We also used these interviews to generate distractors for the knowledge items. In a second set of cognitive interviews (n = 25) in December 2014, we again focused on whether items were interpreted as intended by respondents. We also collected timing data, information about the distribution of responses
Figure 1. Distribution of District Enrollment by NCRPP Sample Responders
6
11
10
28
42
48
116
429
23
0 50 100 150 200 250 300 350 400 450 500
80,000 or more
70,000–79,999
60,000–69,999
50,000–59,999
40,000–49,999
30,000–39,999
20,000–29,999
10,000–19,999
0–9,999
Number of Respondents
Dis
tric
t Siz
e

Technical Report No. 1 National Center for Research in Policy and Practice | 15
across Likert-type scales, and basic statistics that allowed us to estimate the potential difficulty level of the knowledge items. To aid in this work, we transcribed responses and systematically analyzed issues relating to items. All issues were discussed by the team as a whole, and we made revisions to items on the basis of those discussions.
As part of the development process, we also solicited expert feedback from two sets of advisors to gather evidence of content validity. Content validity pertains to whether an instrument’s content is representative of and relevant to the target domain, and expert review is one source of evidence for content validity.26 We solicited this feedback formally through a survey as well as through discussion with advisors about the best ways to add or revise items to better represent the domain of research use.
We next piloted a revised instrument with 265 educational leaders. We used this pilot test to generate initial scale reliabilities and likely distribution of responses to the national survey as well as to identify additional issues with the survey content. On the basis of our analyses, we created additional items aimed at improving the internal consistency of selected scales, made revisions to items to improve clarity, and shortened the survey. We also made decisions about which sets of items would be asked of the entire district and national samples and which sets of items would be asked of a sub-sample of respondents at random.
Final Instrument: Constructs and Items For each survey construct, we provide a definition, sample items, item response choices, and the total number of items for that construct. The survey versions that were administered are available at http://ncrpp.org/pages/our-work.
Our survey provided respondents with a definition of research as “an activity in which people employ systematic, empirical methods to answer a specific question.” Our survey text also provided the following elaboration for respondents:
Research bases its conclusions in investigations involving statistical data, interviews, observations, and case studies, or a combination of these. Research can appear in books, academic journal articles, practitioner-oriented journals, and analyses of program implementation developed by researchers external to the district. It can also appear in policy and evaluation reports or presentations developed by researchers within a district.
For this study, we differentiate between research, which involves systematic inquiry to answer a specific question, and the practice of looking at data from the district, school, or classroom, which is more open-ended and seldom addresses specific research questions. For instance, looking at state standardized test results to identify students who need extra support in the classroom would not be research. However, examining the question, “What is the relationship between fourth grade state standardized test results and high school graduation?” would be research.
Instrumental Research Use. Instrumental research use occurs when research is applied to guide or inform a specific decision. Our survey scale sought to measure the extent to which research directly and centrally provides guidance to decisions related to policy or practice. To elicit

Technical Report No. 1 National Center for Research in Policy and Practice | 16
respondents’ instrumental use of research, we first provided a list of eight different potential decisions in which the respondent might have been involved, then asked if they had been involved in each. The list of decisions included curriculum adoption, scaling up a pilot program, designing professional development, and other activities. If a respondent indicated they were involved in an activity, they were subsequently asked how often they had used research as part of that activity. Item response choices were: Never (1), Sometimes (2), Frequently (3), All of the time (4).
Conceptual Research Use. Conceptual use refers to research that is applied to induce changes in the way a person views a problem or space of possible solutions. In our survey, we sought to elicit the extent to which research informs leaders’ ways of looking at problems or their approaches to solving a district problem. The six-item scale included such questions as “How often have you encountered research that changed the way you look at problems facing your school/district?” and “How often have you encountered research that suggested alternative solutions to a district problem?” As with the instrumental use scale, item response options were: Never (1), Sometimes (2), Frequently (3), All of the time (4).
Symbolic Research Use. This type of research use occurs when research is applied as a political tool to influence a decision or legitimate a decision already made. It is sometimes referred to as political use of research. The four-item scale for this construct asked respondents to report their engagement in activities such as using research to mobilize support for important issues or to selectively use research to support a decision. Item response choices were: Never (1), Sometimes (2), Frequently (3), All of the time (4).
Research Leaders Found Useful. Following an approach some NCRPP team members used in an earlier study, we sought to identify individual pieces of research that leaders found useful in their work. For each study leaders identified as useful, we asked them why it was useful.
Respondents randomly received one of two versions of this item pertaining to either instrumental use or conceptual use. Both versions asked respondents to identify (if they could) the title, author, year published, topic, and why they found the piece of research useful.
The text for the instrumental use item read:
Think about a time when you used research to inform a decision in your district or school. What is the single most valuable piece of research you used to inform your decision? Please provide as much information as you can about this piece of research so we can locate it ourselves.
The text for the conceptual use item read:
Think about a time when a piece of research you encountered changed your thinking or opinions about possible solutions to your district’s/school’s problems. What was that piece of research? Please provide as much information as you can about this piece of research so we can locate it ourselves.

Technical Report No. 1 National Center for Research in Policy and Practice | 17
We included both options to explore whether there were any differences by type of use. We anticipated that the type of use might be associated with different types of research, though we did not have a hypothesis about how responses might differ by type of use.
Sources Where Leaders Obtain Research. These items pertain to the sources where individuals obtain their research and the frequency with which they consult those sources. Sources included traditional ones, such as university researchers, as well as peer networks (e.g., professional associations) and media. For each of the different sources, we asked how often individuals had sought out or acquired research in the past twelve months. Item response choices for each were: Never (1), Rarely (2), Sometimes (3), Often (4), All of the time (5).
Attitudes: Relevance. We constructed three sub-scales of attitudes: relevance, value, and credibility. The relevance of research refers to the degree to which an individual believes research can be relevant to the problems their school or district faces, even when the context of the research is not perfectly aligned to the context of the respondent. The four-item scale for relevance included items such as “Education researchers work in an ivory tower and are isolated from practice,” and “By the time research findings are published, they are no longer useful to me.” For each statement, respondents were asked to indicate their agreement with the statement using the following scale: Strongly disagree (1), Disagree (2), Agree (3), Strongly agree (4).
Attitudes: Value. The value of research refers to the degree to which an individual finds research to be potentially useful in informing decisions. The eight-item scale for value of research included statements such as “Researchers provide a valuable service to education practitioners,” and “Education research provides results that can help leaders improve educational outcomes.” For each statement, respondents were asked to indicate their agreement with the statement using the following scale: Strongly disagree (1), Disagree (2), Agree (3), Strongly agree (4).
Attitudes: Credibility. The credibility of research is the degree to which an individual has confidence in the accuracy of research findings. The eight-item scale for credibility included items such as “Education research reports are rarely consistent with each other,” and “Education research is generally conducted to improve the careers of researchers, not to improve schools.” For each statement, respondents were asked to indicate their agreement with the statement using the following scale: Strongly disagree (1), Disagree (2), Agree (3), Strongly agree (4).
Acquisition Effort. This construct refers to the extent to which an individual exerts effort to acquire research or to develop relationships with researchers in the hope of addressing school or district problems. The scale we developed for acquisition effort consisted of five items, which asked leaders to indicate how often they engaged in activities such as looking for research studies that might be relevant or contacting researchers who have relevant expertise when confronted with a new problem or decision. Item response choices were: Never (1), Rarely (2), Sometimes (3), Often (4), All of the time (5).

Technical Report No. 1 National Center for Research in Policy and Practice | 18
Knowledge of How to Interpret Conclusions from Research. Our original intent in eliciting knowledge of research focused on a range of topics pertaining to research methodology and interpretation of results of studies, and we wrote items across this wide variety of topics. We had hoped to construct a single measure from these items, but results from our pilot test suggested that the items did not form a coherent scale; inter-item correlations and reliability estimates were generally quite low. After some deliberation, we included a set of three knowledge items related to quantitative research and two items related to qualitative research. The quantitative research knowledge items pertained to leaders’ interpretation of the effect size statistic, analysis of threats to internal validity, and the value of random assignment. The qualitative research knowledge items pertained to theoretical sampling and to what conclusions can be drawn from descriptive case studies. Each of the items presented leaders with a scenario and a question that required them to draw a conclusion from the scenario or to select an appropriate interpretation of results of the study presented in the scenario. All five items appear in the results section, along with the frequency with which respondents chose particular answers.
Role. Role refers to the job title that best captures an individual’s set of professional responsibilities within a school district. We developed this list of roles in close consultation with members of our practice advisory board, and we revised the list on the basis of our pilot test results. Altogether, we identified nine different roles that leaders could choose from:
• Supervisor of teaching, learning, and curriculum across multiple subject areas
• Mathematics coordinator
• Science coordinator
• Reading or ELA coordinator
• Accountability, research or assessment director
• Special education director
• Assistant superintendent or other district administrator who supervises schools
• Principal or assistant principal
• Federal programs director
Respondents could choose more than one role, and they could also indicate “other” if needed. Where possible, we re-coded other into one of our nine categories.
Organizational Routines. An organizational routine is “a repetitive, recognizable pattern of interdependent actions, involving multiple actors.”27 We operationalized routines as the frequency with which an individual participates in various types of meetings, and the frequency with which research is brought up in those meetings. For these items, respondents were first asked how often they were involved in various types of meetings. If they indicated they were involved in a type of meeting, they were asked to indicate how often research was brought up in that type of meeting. Types of meetings we asked about included meetings related to:

Technical Report No. 1 National Center for Research in Policy and Practice | 19
instruction, designing new programs or adapting programs for use, strategic planning, and parent or community issues. For items about meeting frequency, answer choices were: Never (1), Less than once a month (2), Monthly (3), Weekly or daily (4). For items about frequency of research occurrence during meetings: Never (1), Occasionally (2), Often (3), All of the time (4).
Culture of Research Use. This construct refers to the extent to which the culture in a district or department is one in which people value research as a resource for decision making, where there is a commitment to evaluating strategies using evidence, where organizations are open to change in light of evidence, and where there are multiple social supports and strong norms promoting evidence use. For this set of items, if individuals indicated they were the only members of their departments, they were asked about the culture of research use in their districts. Otherwise, individuals were asked about the culture of research use in their departments, using the same four items that make up this scale. Examples of items included, “Research is seen as a useful source of information,” and “We are genuinely encouraged to use research as part of our ongoing work.” Answer choices were: Never (1), Occasionally (2), Often (3), All of the time (4).
Survey Administration We administered the survey via Qualtrics, an online survey administration platform, with an eight-week recruitment window for each respondent. We began by sending each respondent a pre-letter explaining the study, and we enclosed a $10 gift card as an incentive for participation. We then emailed with a link to the survey. We had up to six follow-up contacts with respondents, including a postcard, an email reminder, three phone calls, and a hard-copy survey. The phone calls were particularly helpful in assessing whether the email with the survey link had been blocked by spam filters and to flag additional new changes in positions and movement out of districts.
The initial (not reservoir) sample was divided into three waves of about 400 contacts each, in order to make survey administration and follow-up manageable to the survey administration team. We pursued the same eight-week recruitment strategy for each wave. Wave 1 began on September 15, 2015; Wave 2 began September 29, 2015; and Wave 3 began on October 6, 2016. To reach our target sample size, we added a fourth wave to include all “replacement” contacts from waves 1–3. Based on low response rates, we also added 85 additional respondents from the second replicate sample for four roles that yielded low response rates in the early waves—deputy, associate and network superintendents; curriculum and instruction supervisors; school principals; and multi-role leaders. Wave 4 began on November 3, 2015 and included nearly 500 contacts. We did not mail hard-copy surveys to Wave 4 non-responders because we reached our sample size goals by mid-December 2015.
On the basis of Qualtrics data, the average respondent spent roughly 20 minutes answering the survey.
Technical Report No. 1 National Center for Research in Policy and Practice | 20
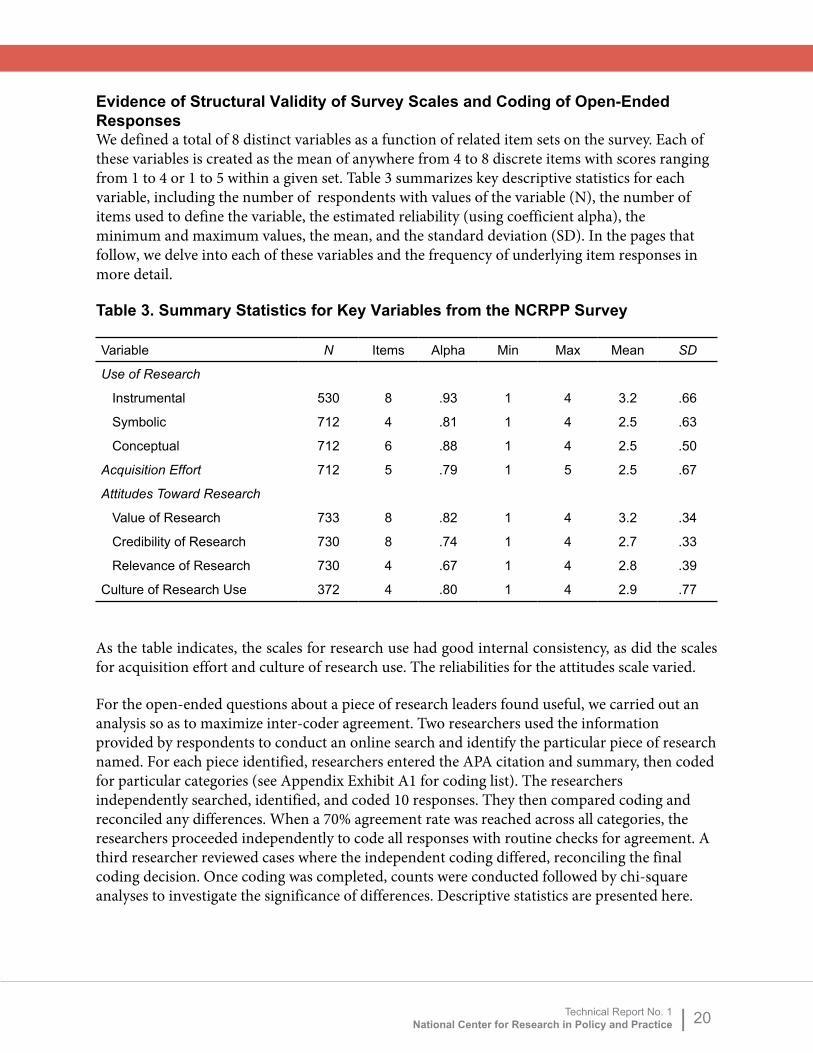
Evidence of Structural Validity of Survey Scales and Coding of Open-Ended Responses We defined a total of 8 distinct variables as a function of related item sets on the survey. Each of these variables is created as the mean of anywhere from 4 to 8 discrete items with scores ranging from 1 to 4 or 1 to 5 within a given set. Table 3 summarizes key descriptive statistics for each variable, including the number of respondents with values of the variable (N), the number of items used to define the variable, the estimated reliability (using coefficient alpha), the minimum and maximum values, the mean, and the standard deviation (SD). In the pages that follow, we delve into each of these variables and the frequency of underlying item responses in more detail.
Table 3. Summary Statistics for Key Variables from the NCRPP Survey
Variable N Items Alpha Min Max Mean SD
Use of Research
Instrumental 530 8 .93 1 4 3.2 .66
Symbolic 712 4 .81 1 4 2.5 .63
Conceptual 712 6 .88 1 4 2.5 .50
Acquisition Effort 712 5 .79 1 5 2.5 .67
Attitudes Toward Research
Value of Research 733 8 .82 1 4 3.2 .34
Credibility of Research 730 8 .74 1 4 2.7 .33
Relevance of Research 730 4 .67 1 4 2.8 .39
Culture of Research Use 372 4 .80 1 4 2.9 .77
As the table indicates, the scales for research use had good internal consistency, as did the scales for acquisition effort and culture of research use. The reliabilities for the attitudes scale varied.
For the open-ended questions about a piece of research leaders found useful, we carried out an analysis so as to maximize inter-coder agreement. Two researchers used the information provided by respondents to conduct an online search and identify the particular piece of research named. For each piece identified, researchers entered the APA citation and summary, then coded for particular categories (see Appendix Exhibit A1 for coding list). The researchers independently searched, identified, and coded 10 responses. They then compared coding and reconciled any differences. When a 70% agreement rate was reached across all categories, the researchers proceeded independently to code all responses with routine checks for agreement. A third researcher reviewed cases where the independent coding differed, reconciling the final coding decision. Once coding was completed, counts were conducted followed by chi-square analyses to investigate the significance of differences. Descriptive statistics are presented here.

Technical Report No. 1 National Center for Research in Policy and Practice | 21
RESULTS
In this section, we present descriptive statistics for each of the survey scales and items described above. We focus on frequency distributions by item in this technical report. Future reports will explore the between-variable relationships hypothesized as important in our conceptual framework.
Instrumental Uses of Research
Table 4 shows leaders’ responses to the questions about research use in decision making. The column on the far right indicates the fraction of respondents who did not participate in the activity; the four columns on the left show the frequency with which respondents used research to make different types of decisions. A majority of leaders said they used research “frequently” or “all of the time” when purchasing an intervention or program and when designing professional development for administrators and teachers. Leaders were least likely to use research when considering eliminating a program.
Notably, as the last column indicates, a large percent of leaders did not engage in certain activities. Leaders were least likely to have reported conducting a major curriculum adoption or to have considered scaling up a program in the past year.
Key Findings:
• Survey respondents were most likely to be involved in activities related to(1) the design of professional development for teachers and administrators; and(2) directing resources to programs.
• Among respondents involved in each activity, the vast majority indicated that research was used frequently or all of the time in the support of the activity.
• The proportion of respondents indicating that they used research frequently or all the time ranged from a high of 88% to a low of 70%; the median was 79%.
• Almost no respondents indicated that research was never used in support of a given activity.

Technical Report No. 1 National Center for Research in Policy and Practice | 22
n = 733
*Includes respondents who indicated this activity did not take place or that they were not involved in the activity
Conceptual Uses of Research
Never Sometimes Frequently All the time
Did Not Engage in Activity*
Purchased an intervention or program 1% 7% 24% 31% 37%
Designed professional development for teachers 1% 13% 36% 29% 20%
Designed professional development for administrators 2% 15% 32% 26% 25%
Conducted major adoption of a curriculum 2% 9% 23% 25% 42%
Considered scaling up a program 2% 10% 24% 23% 42%
Redesigned a program 1% 13% 22% 23% 40%
Directed resources to a program 2% 17% 31% 23% 28%
Considered eliminating a program 2% 16% 23% 20% 39%
Table 4. Frequency of Instrumental Uses of Research
Key Findings:
• Seventy-two percent of respondents indicated the research that theyencountered had expanded their understanding of an issue.
• Few respondents indicated that they “never” or “always” encountered researchthat served one of the six conceptual purposes we listed as options. Instead,respondents tended to be split between those who selected “sometimes” andthose who selected “frequently.”
• Respondents were least likely to agree with statements indicating that theresearch they encountered changed the way they looked at a problem or broughtattention to a new issue that had not previously been under consideration in theirdistrict.
Conceptual uses of research pertain to how research influences leaders’ thinking about issues and their search for solutions to problems faced by their schools and districts. Conceptual uses, while less often reported than instrumental uses, were widely reported by leaders in the sample. The most commonly endorsed item (i.e., answered “frequently” or “all of the time”) was one indicating that research expanded their understanding of an issue. Other items endorsed at high levels by respondents included those indicating that research provided a common language and/or framework for guiding reform efforts in leaders’ schools and districts.
Conceptual uses appeared less likely to change leaders’ minds in significant ways, though. Leaders were least likely to endorse items representing the claims that research changed the way they looked at a problem or brought a new issue to their attention. Figure 2 below shows the distribution of conceptual uses by item.

Technical Report No. 1 National Center for Research in Policy and Practice | 23
Figure 2. Frequency of Conceptual Uses of Research
67%
65%
52%
49%
44%
29%
8%
1%
2%
3%
3%
59%
64%
49%
46%
41%
28%
28%
31%
43%
45%
49%
61%
4%
4%
5%
7%
8%
10%
33%
35%
48%
51%
56%
71%
Brought Attention toNew Issue
Changed Way Look atProblem
Suggested AlternativeSolution
Provided Framework
Provided CommonLanguage
ExpandedUnderstanding
Never Sometimes Frequently All the timePercentage
Response
726 ≤ n ≤ 733Note: In all figures, not all categories may total 100% due to rounding

Technical Report No. 1 National Center for Research in Policy and Practice | 24
Symbolic Uses of Research
Key Findings:
• Of the symbolic uses presented to respondents, leaders reported using researchmost frequently to convince others of a particular point of view (68% said they didso “frequently” or “all of the time”) or that they used research selectively becauseit would support a particular decision (67% said they did so “frequently” or “all ofthe time”).
• Respondents were much less likely to indicate that they frequently used researcheither to mobilize support for important issues or to discredit a policy or program.
Symbolic or political uses of research are often contrasted with instrumental uses of research, because many symbolic uses occur after a decision has been made, rather than before. Our sample of leaders reported that symbolic uses were less common than instrumental uses. Even so, a large majority reported that they had used research for persuasive purposes and that they had used research selectively to mobilize support for a program. They were least likely to say that they had used research to discredit a program in their school or district. Figure 3 presents data on the frequency with which leaders reported using research for symbolic purposes.
Figure 3. Frequency of Symbolic Uses of Research
79%
60%
33%
32%
25%
16%
4%
3%
53%
44%
29%
29%
16%
29%
50%
51%
5%
11%
17%
17%
21%
40%
67%
68%
Discredit aProgram
MobilizeSupport
UseSelectively
ConvinceOthers
Never Sometimes Frequently All the timePercentage
Responsen = 733

Technical Report No. 1 National Center for Research in Policy and Practice | 25
Analysis of Research Leaders Find Useful
As noted above, in addition to asking leaders to report how often they used research for different purposes, we asked leaders to identify specific pieces of research that they found useful (see p. 16 for the two versions of this open-ended item).
Of the 733 survey participants across 485 districts, 429 (59%) across 329 districts responded to at least one part of the six-part item. Within these 429 responses, 379 across 308 districts provided enough information to identify the specific piece of research referenced. The proportion of respondents who completed the open-ended item by role category paralleled the response rate for the entire survey. Of the 429 individuals who responded to any part of the open-ended item, 229 received "version A" pertaining to instrumental use; 200 received "version B" pertaining to conceptual use.
The following findings reflect the entire sample of 429 responses, followed by an explanation of differences in patterns of responses for versions A and B of the item. Each table is based on the number of responses that provided enough information to code for that category; the relevant sample size (n) is provided for each category. For some responses, we were able to identify an author or topic but not the specific piece of research. When that was the case, we included the information in our coding.
Key Findings:
• Of leaders surveyed, 59% named a piece of research that had proven useful tothem.
• The research named most often focused on instructional practices.
• The pieces of research named as useful were most often books, research orpolicy reports, or peer-reviewed journal articles.
• Participants in special education and federal programs roles primarily namedresearch focused on students with special needs, English learners, and/or theneeds of specific socioeconomic or racial/ ethnic groups. Participants in otheroles typically named research that did not focus on a particular content area orsubgroup of students.
• School and district leaders reported that the pieces of research they namedwere useful for a variety of reasons, especially developing their own knowledge,providing instructional leadership for others, and designing policies andprograms.

Technical Report No. 1 National Center for Research in Policy and Practice | 26
Focal Topics of Research Leaders Found Useful Of the 429 respondents to the open-ended item, 424 provided information about the topic of the research. Of these, we coded 260 responses for one topic and another 164 responses for two topics, for a total of 588 instances of topics represented. We combined the information to develop Figure 4, which presents the topics of research included. Participants most frequently named pieces of research that focused on teachers and teaching in the classroom (39%), followed by students and learning in the classroom (28%), school organization, improvement and reform (20%), school system organization, improvement and reform (8%), and assessment (7%). Figure 4 shows the breakdown of all topics represented in these responses.
Figure 4. Focal Topics of Research Leaders Found Useful
35.7%
36.4%
28.8%
41.2%
16.2%
27.8%
54.1%
34.3%
26.8%
29.1%
26.0%
26.3%
32.4%
26.4%
22.4%
25.7%
22.5%
21.8%
27.4%
21.9%
29.4%
29.2%
11.2%
21.4%
8.3%
5.5%
8.2%
7.0%
11.8%
11.1%
5.1%
12.9%
6.8%
7.3%
9.6%
3.5%
10.3%
5.6%
7.1%
5.7%
0% 20% 40% 60% 80% 100%
All Respondents
Multi-Role
Federal Programs
Principals
Assessment
Special Education
Curriculum &Instruction
Deputy/ Associate/Network
Superintendents
Teachers & teaching in the classroom Student learning & student outcomesSchool organization, improvement & reform School system organization, improvement & reformAssessment
n = 588

Technical Report No. 1 National Center for Research in Policy and Practice | 27
Most pieces of research within the topic coded as "teachers and teaching in the classroom" focused on instructional practices (73% of this category). Examples also focused on teachers’ professional learning (18%), curriculum and standards (5%), and evaluation of teacher effectiveness (4%).
Research on "student learning and student outcomes" most often focused on how to improve student achievement and academic learning outcomes (60% of this category). Other areas of focus included learning and identity development (17%), social/emotional/behavioral outcomes (8%), “mindset” or beliefs about one’s capabilities (6%), graduation rates (2%), and college/career readiness (3%).
Research related to "school organization, improvement or reform" most often focused on interventions tailored to particular groups of students, such as those with special needs, with low test scores, and/or living in poverty (29% of this category). Pieces in this category also focused on school leader practices and professional learning (22%), school improvement (12%), bilingual and English as a Second Language programs (9%), scheduling (7%), discipline policies (8%), school climate (7%), community engagement initiatives (4%), and de-tracking reforms (3%).
Pieces focused on "school system organization, improvement and reform" most commonly addressed district leader practices and professional learning (45% of this category). Pieces cited by leaders as useful here also focused on system-wide improvement (33%), district-wide early childhood education programs (8%), large-scale policies such as funding and school choice (8%), and district-wide interventions such as dropout prevention and college/career readiness programs (6%).
Finally, research cited as useful on the topic of "assessment" focused primarily on classroom assessment (39% of this category), followed by placement and screening practices (32%), standardized testing (15%), and grading practices (15%).

Technical Report No. 1 National Center for Research in Policy and Practice | 28
Content Areas and Student Subgroups Of the 429 responses, 404 responses could be coded for content area (see Figure 5). The majority of the research named did not focus on a specific content area (81% of 404 responses). Of those that did, literacy was the most common (10%). Differences in the content area focus by role category were statistically significant, (Χ2 [24, n = 410] = 38.184, p = 0.033). Those in curriculum and instruction roles were more likely than others to name research with a content area focus, such as literacy (15%), mathematics (14%), or science/engineering (7%), but still largely named research without a disciplinary focus (64%).
Figure 5. Content Areas of Research Leaders Found Useful
80.5%
81.7%
80.0%
85.3%
91.1%
78.0%
63.9%
89.4%
10.2%
8.5%
18.0%
9.3%
2.2%
12.0%
15.3%
4.3%
5.9%
7.0%
2.0%
2.7%
4.4%
6.0%
13.9%
2.1%
2.4%
1.4%
1.3%
4.0%
6.9%
2.1%
1.0%
1.4%
1.3%
2.2%
2.1%
0% 20% 40% 60% 80% 100%
All Respondents
Multi-Role
Federal Programs
Principals
Assessment
Special Education
Curriculum &Instruction
Deputy/ Associate/Network
Superintendents
No Content Area Focus Literacy MathematicsScience/ Engineering Technology
n = 404

Technical Report No. 1 National Center for Research in Policy and Practice | 29
In 410 responses, we were able to code for a focus on particular student subgroups. Because some pieces focused on multiple subgroups, Figure 6 reflects 439 instances of subgroups represented in these responses. Differences in the subgroup focus by role category were statistically significant (X2 [36, n = 430] = 142.377, p < 0.001). Respondents in special education and federal programs roles primarily named research focused on students with special needs, English learners, and/or students’ socioeconomic or racial/ ethnic groups. Respondents in other roles typically named research that did not focus on a particular subgroup (see Figure 6).
Figure 6. Subgroup Focus of Research Leaders Found Useful
67.9%
70.7%
37.7%
77.6%
72.3%
50.9%
81.6%
74.0%
8.4%
9.3%
7.5%
9.2%
4.3%
24.5%
3.9%
7.2%
6.7%
11.3%
1.3%
8.5%
15.1%
3.9%
8.0%
7.0%
5.3%
13.2%
6.6%
4.3%
1.9%
5.3%
14.0%
6.7%
6.7%
30.2%
3.9%
3.8%
3.9%
1.6%
1.3%
10.6%
2.0%
1.2%
1.3%
3.8%
1.3%
2.0%
0% 20% 40% 60% 80% 100%
All Respondents
Multi-Role
Federal Programs
Principals
Assessment
Special Education
Curriculum &Instruction
Deputy/ Associate/Network
Superintendents
No Subgroup Focus Special education Race/ ethnicity SES/ povertyEnglish learners Urban students Gender
n = 439

Technical Report No. 1 National Center for Research in Policy and Practice | 30
Format of Research Named We also examined the format of research as it may be helpful to researchers to be aware of formats that may help them connect better with leaders. This analysis relied on the 379 responses that were complete. Participants most frequently named books (58%), followed by research or policy reports (17%), and peer-reviewed journal articles (14%). Other types of research named included research-based tools or programs (6%), practitioner-oriented magazines (such as Educational Leadership) (4%), online media (1%), and dissertations (1%). Differences in the format of research by role were statistically significant (X2 [36, n = 382] = 63.944, p = 0.003). As shown in Table 5, principals especially named books, while federal program leaders shared a wider variety of types of sources.
Table 5. Format of Research Leaders Cited as Useful
BookResearch/Policy
ReportPeer-reviewed Journal Article All Other
Deputy/Associate/ Network Superintendents 64% 12% 12% 12%
Curriculum & Instruction 59% 12% 11% 18%
Special Education 57% 17% 15% 11%
Assessment 42% 26% 19% 14%
Principals 73% 6% 10% 11%
Federal Programs 35% 30% 17% 17%
Multi-Role 63% 19% 13% 4%
All Respondents 58% 17% 14% 12%
n=379
Reasons Leaders Gave For Why Piece of Research Was Useful In the last part of this item, we asked leaders to answer the question, “Why was it useful?” Responses from 325 participants provided enough information to identify reasons for the usefulness of the research. An additional 69 respondents provided an answer that provided a description of the piece (e.g., “Study of formative assessment practices”) rather than a reason, and 23 others merely stated “yes” or “very useful.” These 92 responses were excluded from the analysis presented here.
Consistent with the multifaceted nature of research use described in our conceptual framework, respondents’ reasons related to supporting leaders’ learning by developing their knowledge (30%); designing policies, programs, and initiatives (28%); providing instructional leadership for others in central offices or schools (23%); supporting and monitoring implementation (11%);

Technical Report No. 1 National Center for Research in Policy and Practice | 31
and selecting programs (9%). Reasons for usefulness did not vary significantly by role category (X2[24, n = 325] = 22.166, p = 0.569).
Differences in Responses by Item Version: Instrumental Versus Conceptual Use The reasons for usefulness given by leaders who received the "instrumental use" and "conceptual use" versions of the open-ended item differed significantly (X2[4, n = 325] = 10.945, p = 0.027). Those who responded to the instrumental use prompt were more likely to give reasons related to selecting programs (13.2%) and supporting implementation (12.1%). Those who responded to the conceptual use prompt were more likely to give reasons related to supporting their own professional learning (34.4%) and designing programs (29.1%).
In addition, a focus on student subgroups differed significantly by version received (X2[6, n = 430] = 14.696, p = 0.023). Responses to the instrumental use prompt were more likely to not focus on a subgroup (71.7% vs. 63.5%), to focus on students with special needs (9.1% vs. 7.5%), or to focus on English learners (8.3% vs. 5%). Leaders who answered the conceptual use prompt were more likely to name a piece of research focused on race/ethnicity (10.5% vs. 4.3%), SES/poverty (9.5% vs. 4.8%), urban students (2% vs. 1.3%), or gender (2% vs. 0.4%).
However, there were not significant differences by item version for the topic, content area focus, or format of research named.

Technical Report No. 1 National Center for Research in Policy and Practice | 32
Sources Leaders Use To Obtain Research
A set of survey questions asked respondents to report the places they had sought out or acquired research in the past twelve months. Respondents show a clear tendency to access research through their affiliations with professional associations and, relatedly, by attending conferences (Figure 7). Colleagues in other school districts and staff in state departments of education represent other prevalent sources for accessing research. Consultants to the district were another source for research findings, with 31% of respondents indicating that they had “often” or “all of the time” sought out or acquired research from consultants, and with another 41% indicating they did so “sometimes.” Leaders were less likely to report frequently accessing the resources available from the What Works Clearinghouse (WWC), the National Center for Education Statistics, the Regional Educational Laboratories, or university researchers. A majority of respondents indicated that they rarely or never acquired research from these sources.
Key Findings:
• Leaders were most likely to access research through professional associationsand professional conferences.
• Leaders were less likely to access research through individual researchers orfrom three U.S. Department of Education resources: What Works Clearinghouse,the National Center for Education Statistics, or the Regional EducationalLaboratories.

Technical Report No. 1 National Center for Research in Policy and Practice | 33
Figure 7. Sources Leaders Use to Access Research
89%
62%
60%
57%
65%
47%
58%
57%
41%
27%
27%
20%
14%
8%
63%
26%
28%
29%
39%
13%
29%
37%
16%
10%
10%
5%
4%
2%
26%
36%
32%
28%
26%
34%
29%
20%
25%
17%
17%
15%
10%
6%
9%
31%
28%
30%
22%
38%
25%
25%
41%
41%
39%
39%
44%
37%
2%
6%
11%
11%
10%
13%
14%
14%
15%
26%
27%
30%
36%
41%
1%
1%
2%
4%
2%
3%
4%
3%
5%
7%
10%
6%
14%
2%
7%
12%
13%
14%
15%
17%
18%
18%
31%
34%
40%
42%
55%
Wikipedia
Vendors
Regional EducationalLaboratories
National Center forEducation Statistics
Social Media
University Researchers
County Offices ofEducation
What WorksClearinghouse
Newspapers/ Magazines
Consultants
State Departmentsof Education
People in OtherSchool Districts
Conferences
ProfessionalAssociations
Never Rarely Sometimes Often All the Time
PercentageResponse
706 ≤ n ≤ 713

Technical Report No. 1 National Center for Research in Policy and Practice | 34
Relevance of Research Most survey respondents appear to view research as relevant to educational practice. Three-quarters (76%) of respondents disagreed or strongly disagreed that there was a disconnect between research and educational practice; 87% disagreed or strongly disagreed that educational researchers work in an “ivory tower.” The time lag between conducting a research study and the publication of results provoked some concern: a sizeable percentage of respondents (52%) agreed or strongly agreed that “by the time research is published it is no longer useful to me.” Figure 8 summarizes the responses to questions about the relevance of research to school and district leaders.
Attitudes Toward Research
Key Findings:
• Respondents agreed that research can be relevant to practice, but they indicated that the time lag between conducting research and publication of research can decrease its usefulness.
• Survey respondents report very positive attitudes about the value of educational research, with nearly all endorsing the ideas that research can address practical problems facing schools and that researchers provide a valuable service to educational practitioners.
• Leaders were more mixed in their perceptions of the credibility or trustworthiness of research.
Figure 8. Perceived Relevance of Research
90%
87%
76%
48%
11%
12%
11%
3%
79%
75%
65%
45%
9%
11%
21%
41%
1%
3%
11%
10%
13%
24%
52%
Education research is too narrow tobe useful to district and school leaders.
Education researchers work in an ivorytower and are isolated from practice.
There is a disconnect between theresearch world and the educational world.
By the time research findings arepublished, they are no longer useful to me.
Strongly Disagree Disagree Agree Strongly Agree720 ≤ n ≤ 725
PercentageResponse

Technical Report No. 1 National Center for Research in Policy and Practice | 35
Value of Research Leaders consistently endorsed items asserting the positive value of research and rejected a negatively worded item about its value (Figure 9). They were most likely to strongly agree with the statement, “Research helps identify solutions to problems.” Of these items, the only one to receive less positive ratings related to the value of consulting researchers when confronted with a new problem. But even for this item, 85% of respondents responded either “agree” or “strongly agree.”
Figure 9. Perceived Value of Research
99%
16%
6%
5%
4%
3%
3%
1%
35%
1%
1%
64%
15%
6%
4%
3%
3%
2%
1%
67%
75%
73%
75%
57%
68%
74%
1%
18%
19%
22%
21%
40%
29%
25%
1%
84%
94%
95%
96%
97%
97%
99%
When confronted with a new problem, it is valuable to speak with education
researchers.
Education research is a waste of money.
Research can address practicalproblems facing schools.
Researchers provide a valuableservice to educational practitioners.
A well-designed study withstrong findings can change minds.
Research helps identify solutions toproblems.
Research addresses questions thathelp make better decisions.
Education research provides results thatcan help improve educational outcomes.
Strongly Disagree Disagree Agree Strongly Agree721 ≤ n ≤ 729
Percentage
Response

Technical Report No. 1 National Center for Research in Policy and Practice | 36
Credibility of Research Attitudes of leaders were more mixed with respect to the credibility or trustworthiness of research. For example, respondents were roughly evenly split about whether education researchers are unbiased. Over one-third of respondents agreed that researchers frame their results to make political points, that educational research can be used to support any opinion, and that one can find evidence to contradict any study’s findings. At the same time, large majorities agreed that research studies’ claims are trustworthy, objective, and consistent and disagreed that educational research is conducted to improve the careers of researchers (Figure 10).
Figure 10. Perceived Credibility of Research
85%
84%
66%
55%
51%
41%
22%
16%
11%
3%
3%
5%
3%
2%
1%
1%
75%
82%
62%
50%
48%
39%
21%
14%
13%
15%
32%
44%
46%
53%
75%
80%
2%
1%
2%
2%
3%
6%
3%
4%
15%
16%
34%
45%
49%
59%
78%
84%
Education research isconducted to improve thecareers of researchers.
Education research reportsare rarely consistent with
each other.
Researchers frame theirresults to make political
points.
Education researchers areunbiased.
I can find evidence tocontradict the findings of
any study.
Education research can beused to support any
opinion.
Education research isusually objective.
The claims that researchstudies make are
trustworthy.
Strongly Disagree Disagree Agree Strongly AgreeResponsePercentage
694 ≤ n ≤ 718

Technical Report No. 1 National Center for Research in Policy and Practice | 37
Effort to Acquire Research
A little over half of respondents indicated that they are likely to look for education research “often” or “all of the time” when confronted with a new problem or decision, and that they find it valuable to consult this research. However, these decision makers rarely contact researchers directly, though they are more likely to do so “sometimes” or “often” if they have a personal connection to a researcher (Figure 11).
Figure 11. Effort to Acquire Research
Key Finding:
• Although a majority of leaders say they would look for research to inform a new problem or decision, few say they contact researchers directly under these circumstances.
85%
84%
66%
15%
13%
53%
46%
36%
5%
3%
32%
37%
30%
10%
10%
14%
14%
26%
35%
34%
1%
2%
7%
38%
42%
1%
12%
11%
1%
2%
8%
50%
53%
When confronted with a new problem or decision, I contact
researchers I already know who have relevant expertise.
When confronted with a new problem or decision, I contact researchers to find out more
about articles they have written.
When confronted with a new problem or decision, I contact
researchers I don't already know who have relevant expertise.
When confronted with a newproblem or decision,
I find it valuable to consulteducation research.
When confronted with a newproblem or decision,
I look for research studies thatmight be relevant.
Never Rarely Sometimes Often All the TimePercentage
Response710 ≤ n ≤ 712

Technical Report No. 1 National Center for Research in Policy and Practice | 38
Knowledge of How to Interpret Conclusions from Research
Key Findings:
• Leaders’ familiarity with methods for drawing conclusions from research and to assess conclusions of research studies varied widely across topic areas.
• The majority of leaders understood the role of purposeful sampling in qualitative research and how to interpret effect sizes.
We asked leaders to respond to items that assessed their familiarity with ways of interpreting results from both quantitative and qualitative education research studies. Leaders responded to two of five items assigned at random by the survey software.
Nearly two-thirds of respondents (65%) correctly answered an item about how inferences from qualitative research can be strengthened by purposeful sampling, while a majority (52%) correctly interpreted the meaning of effect size presented in the context of a randomized study.
Respondents had more trouble identifying the threats to internal validity in an item in which teachers self-selected into a treatment group and outcomes from that set of volunteers were compared with outcomes from non-volunteers. A little more than half of respondents did not identify a key advantage of random assignment: increasing the likelihood that treatment and control groups with equivalent baseline characteristics will result. Just over a quarter approved of a validly stated inference drawn from a single case study; a majority thought nothing could be concluded from a case study. Table 6 below summarizes results by item. The specific scenarios and leaders’ responses follow.
Table 6. Summary of Results Across Items
Note: Correct or Best Option in Bold. Sample Size between 263 and 291 per item. Items were randomly split across two forms of survey.
Item Concept Option A Option B Option C Option D Option E
Effect Size 15% 10% 52% 23%
Threats to Internal Validity 44% 22% 33% 1%
Random Assignment 46% 11% 36% 6%
Conclusions from Case Studies 7% 63% 28% 2%
Purposeful Sampling 14% 18% 65% 3% 6%
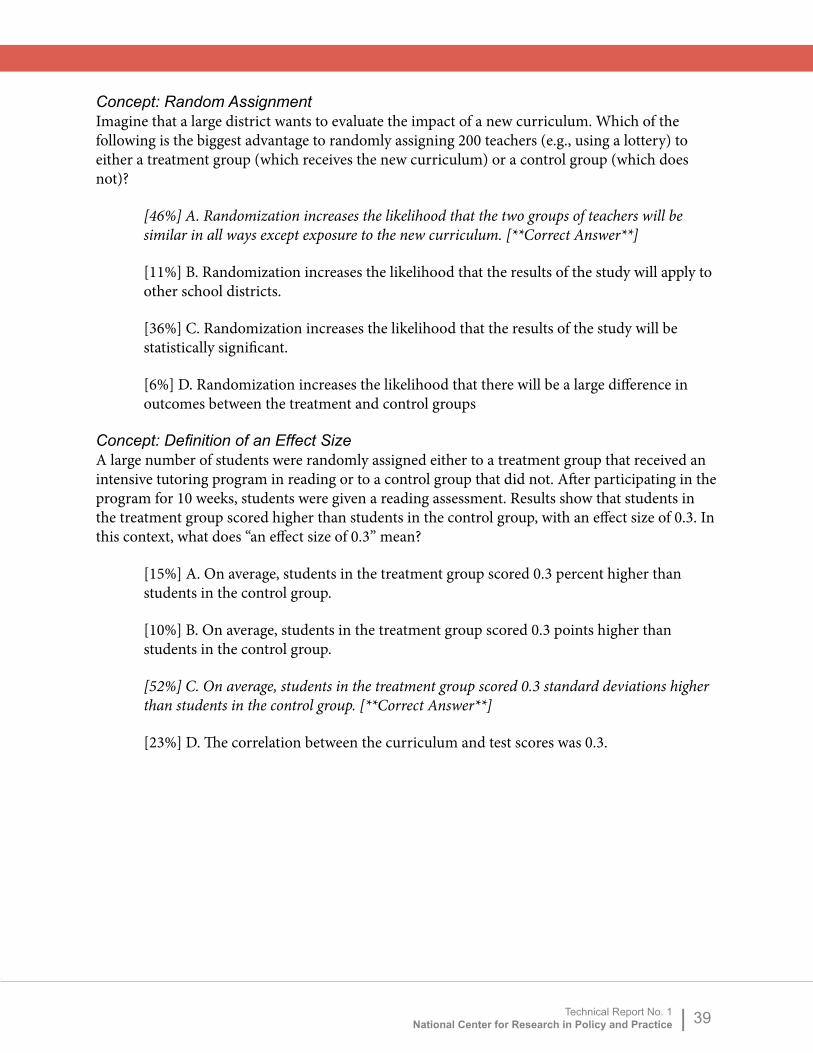
Technical Report No. 1 National Center for Research in Policy and Practice | 39
Concept: Random Assignment Imagine that a large district wants to evaluate the impact of a new curriculum. Which of the following is the biggest advantage to randomly assigning 200 teachers (e.g., using a lottery) to either a treatment group (which receives the new curriculum) or a control group (which does not)?
[46%] A. Randomization increases the likelihood that the two groups of teachers will be similar in all ways except exposure to the new curriculum. [**Correct Answer**]
[11%] B. Randomization increases the likelihood that the results of the study will apply to other school districts.
[36%] C. Randomization increases the likelihood that the results of the study will be statistically significant.
[6%] D. Randomization increases the likelihood that there will be a large difference in outcomes between the treatment and control groups
Concept: Definition of an Effect Size A large number of students were randomly assigned either to a treatment group that received an intensive tutoring program in reading or to a control group that did not. After participating in the program for 10 weeks, students were given a reading assessment. Results show that students in the treatment group scored higher than students in the control group, with an effect size of 0.3. In this context, what does “an effect size of 0.3” mean?
[15%] A. On average, students in the treatment group scored 0.3 percent higher than students in the control group.
[10%] B. On average, students in the treatment group scored 0.3 points higher than students in the control group.
[52%] C. On average, students in the treatment group scored 0.3 standard deviations higher than students in the control group. [**Correct Answer**]
[23%] D. The correlation between the curriculum and test scores was 0.3.

Technical Report No. 1 National Center for Research in Policy and Practice | 40
Concept: Selection Bias as Biggest Threat to Internal Validity In a large district, a group of 1000 math teachers was offered the opportunity to take an intensive professional development (PD) course. Of these teachers, 575 chose to take the course, and 425 did not. Over the following three years, researchers determined that average student achievement scores were higher for teachers who took the PD course than for those who did not; this difference was statistically significant.
Which of the following is the biggest threat to the district’s ability to draw conclusions based on this study?
[44%] A. Other education interventions may have occurred in the district during this period.
[22%] B. It is unclear how student achievement was measured.
[33%] C. Teachers who chose to participate in the PD course may be different from those who did not. [**Correct Answer**]
[1%] D. A majority of eligible teachers took the PD course, making the group sizes unequal.
Concept: Conclusions That Can Be Drawn from Case Study Research Researchers studied one elementary school teacher’s efforts to change her teaching in mathematics and English Language Arts (ELA) in response to new state standards. In ELA, she sought out and actively participated in professional development, asked for advice from colleagues, and created opportunities for collaboration around ELA instruction at her school. In mathematics, she relied exclusively on required professional development workshops and focused on memorizing the material presented so she could apply it in her classroom. Which of the following inferences can you draw from this case?
[7%] A. Elementary school teachers’ learning experiences may differ depending upon the school subject, and this accounts for why elementary teachers often excel in teaching one subject but not another.
[63%] B. Nothing, because the study only involves one teacher.
[28%] C. Elementary school teachers’ engagement in learning may differ by school subject, and these differences may contribute to very different opportunities to learn depending on the school subject. [**Best Answer**]
[2%] D. Elementary teachers typically change their ELA teaching more easily than their mathematics teaching in response to reform initiatives.

Technical Report No. 1 National Center for Research in Policy and Practice | 41
Concept: Purposeful Sampling in Qualitative Research Researchers randomly sampled six middle school classrooms in order to study the implementation of a new middle school science curriculum. They observed and interviewed over the first three years of using the curriculum.
They found that teachers who implemented the curriculum with fidelity worked in schools where leaders learned about the curriculum and allocated time for teachers to talk with one another about it. They concluded that school leadership for instruction was essential for helping teachers to implement the new curriculum with high fidelity. The researchers have funds to continue the study in six more schools. What would be the best way to provide better support for this conclusion?
[14%] A. Randomly sample six more schools to ensure that they can generalize appropriately to the population of middle schools.
[18%] B. Select schools not implementing the new science curriculum to provide a comparison group.
[65%] Select a purposeful sample of teachers from schools with different levels of leadership for instruction. [**Best Answer**]
[3%] The study does not need to be improved, as the design is already rigorous.
[6%] Collect survey data to standardize the kinds of questions asked of teachers during the study.

Technical Report No. 1 National Center for Research in Policy and Practice | 42
Organizational Routines in Which Research Is Used
We asked leaders to indicate how often they attended meetings focused on different kinds of activities and, when they did, how often research came up in the meetings. Respondents reported participating most frequently in meetings about instruction (62% said they did so weekly or daily). They also reported frequent meetings about strategic planning (30% said they did so weekly or daily) and with parents or to discuss community issues (26% said they did so weekly or daily). Least frequent were meetings to select curricula and interventions (see Table 7).
Of these meetings, research was most often likely to come up when discussing instruction, when selecting curricula and interventions, and when designing or adapting programs. Research was less frequently a part of meetings involving parents or community issues.
Key Findings:
• Respondents reported that research was most likely to come up “all of the time”when in meetings focused on instruction, curricula or intervention selection, orprogram design or adoption.
• Respondents said research was least likely to come up in meetings with parentsor when discussing community issues.
Table 7. Organizational Routines In Which Research Is Used
Thinking about the past year, how often did research come up in these meetings? N Never Occasionally Often
All of the time
Instruction 721 1% 22% 48% 28%
Designing/adapting programs 699 2% 25% 46% 21%
Strategic Planning 712 5% 33% 40% 19%
Parents or Community Issues 698 11% 44% 30% 9%
How well program was implemented 701 6% 34% 41% 14%
Selecting curricula or interventions 685 2% 26% 42% 23%

Technical Report No. 1 National Center for Research in Policy and Practice | 43
Culture of Research Use
Four questions relevant to a district's or department’s culture around the use of research were posed to a random subset of 372 respondents. We randomized these items because each took 2–4 minutes to complete and we sought to minimize response burden on participants. A large majority of respondents indicated that research was viewed as useful and that they were encouraged to use research as part of their work. However, it was less common for respondents to indicate that their districts or departments frequently conduct studies on the programs they implement or that staff are expected to back up claims with research evidence (Figure 12).
Figure 12. Culture of Research Use in Leaders’ Organizational Units (Department or Central Office
56%
46%
24%
13%
16%
10%
3%
40%
36%
20%
13%
30%
34%
36%
40%
14%
20%
40%
47%
44%
54%
76%
87%
It is expected that if you makea claim at a meeting, you will
be able to cite researchevidence to back it up.
We conduct studies onprograms we select
and implement to see howthey work.
We are genuinely encouraged to use research as part of our
ongoing work.
Research is seen as a useful source of information.
Never Occasionally Often All the TimePercentage
Responsen = 372
Key Finding:
• Although leaders reported research is viewed as a useful source of informationin their department or central office, a majority disagreed with the statement thapeople expected claims made in meetings to be backed up by research.

Technical Report No. 1 National Center for Research in Policy and Practice | 44
Key Conclusions and Next Steps
The overall portrait of research among school and district leaders that emerges from our study is one of a population that is generally positive about the value of research and that reports using research regularly. Where past research has found instrumental uses of research for decision making to be relatively rare,28 leaders in our study reported using research when making decisions for a variety of purposes. And although education research is often criticized for a lack of relevance to practice,29 the leaders who completed this survey generally agreed that education research was relevant to a number of issues facing their schools and district and that education research was valuable for practice. In many respects, these findings run counter to widely held views about how little research seems to influence practice.
At the same time, some of the findings from the study suggest ways that research could be more useful to school and district leaders. For one, when asked to name a piece of research that had been useful to them in the past year, more than 40% did not name any research. Future analyses will examine the low response rate to this item. And when it comes to credibility, while over three-quarters agreed that research findings were trustworthy and objective, over half did not agree that researchers are unbiased. When confronted with new problems or issues, not many leaders said they consulted with researchers.
Evidence regarding some of the individual and organizational characteristics we identified in our conceptual framework may help explain our results. The analyses presented here show that some district leaders may draw inappropriate conclusions from research based on their understanding of quantitative and qualitative research methods. In addition, less than half of school and district leaders said they were part of organizations where it was expected that they support their proposals with evidence from research. In future analyses, we plan to explore associations between research use as reported on surveys and these individual and organizational correlates.
Our next steps as NCRPP are to conduct a set of case studies to investigate more deeply how these individual characteristics and organizational processes figure in research use. We will be conducting interviews, observations, and surveys in four districts that vary with respect to their external connections to research and routines for research use. Findings, as they become available, will be posted at http://ncrpp.org.
Technical Report No. 1 National Center for Research in Policy and Practice | 45
LIMITATIONS OF THE STUDY
Our study focused on the largest school districts in the United States, that is, those with roughly 9,000 students or more. There are many more school districts that have fewer students, especially in rural areas. We focused on larger districts because we wanted to understand the link between roles in the central office and research use; larger districts tend to have larger central offices with more variation in roles. But our choice means that we cannot draw inferences about how leaders use research in smaller districts.
Another limitation is that our study relied on self-report. Self-report on surveys involving socially desirable behaviors like ours are always subject to bias. Research use is an interactive process that is best understood using multiple methods that include observations of how research is used in district meetings. We have planned a set of case studies as part of NCRPP to help us contextualize survey findings and triangulate results of our survey study.
Technical Report No. 1 National Center for Research in Policy and Practice | 46
ENDNOTES
1Asen (2013); Coburn, Toure, and Yamashita (2009).
2Johnson, Jr. (1999); Sharkey and Murnane (2006); Weiss and Bucuvalas (1980).
3Penuel and Means (2011).
4Hubbard (2010).
5Dwyer and Makin (1997).
6Weiss and Bucuvalas (1980).
7Birkeland, Murphy-Graham, and Weiss (2005); Coburn, Honig et al. (2009); David (1981); Finnigan et al. (2013); Kennedy (1982); Nutley, Davies, and Smith (2001).
8Asen, Gurke, Solomon, Connors, and Gumm (2011).
9Coburn, Toure et al. (2009).
10Corcoran et al.(2001); David (1981b); West and Rhoton (1994).
11Coburn (2010); Hubbard (2010).
12Bickel and Cooley (1985); Hubbard (2010); Palinkas et al. (2009).
13Johnson et al. (2009).
14Landry et al. (2003).
15Makar and Confrey (2005); Means, Padilla, DeBarger, and Bakia (2009).
16Spillane (1998).
17Coburn and Talbert (2006).
18Finnigan, Daly, and Che (2013).
19Corcoran, Fuhrman, and Belcher (2001); Ikemoto and Honig (2010); Spillane, Parise, and Sherer (2011).
20Anderson, Leithwood, and Strauss (2010); Kerr, Marsh, Ikemoto, Darilek, and Barney (2006); Little (2012).
21Helmsley-Brown (2005).

Technical Report No. 1 National Center for Research in Policy and Practice | 47
22Dwyer, Millett, and Payne (2006).
23Gerrish and Clayton (2004).
24Fitzsimmons and Cooper (2012).
25Messick (1995).
26Kane (2006).
27Feldman and Pentland (2003).
28Coburn et al. (2009).
29Government Accounting Office (2013).

Technical Report No. 1 National Center for Research in Policy and Practice | 48
REFERENCES
Anderson, S., Leithwood, K., & Strauss, T. (2010). Leading data use in schools: Organized conditions and practices at the school and district levels. Leadership and Policy in Schools, 9(3), 292–327.
Asen, R., Gurke, D., Solomon, R., Conners, P., & Gumm, E. (2011). “The research says”: Definitions and uses of a key policy term in federal law and local school board deliberations. Argumentation & Advocacy, 47(4), 195.
Asen, R. (2013). Deliberation and trust. Argumentation and Advocacy, 50, 2–17.
Birkeland, S., Murphy-Graham, E., & Weiss, C. (2005). Good reasons for ignoring good evaluation: The case of the drug abuse resistance education (D.A.R.E.) program. Evaluation and Program Planning, 28, 247–256.
Coburn, C. E. (2010). Partnership for District Reform: The challenges of evidence use in a major urban district. In C. E. Coburn & M. K. Stein (Eds.), Research and practice in education: Building alliances, bridging the divide (pp. 167–182). New York, NY: Rowman & Littlefield Publishing Group.
Coburn, C. E. Honig, M. I., & Stein, M. K. (2009). What is the evidence on districts’ use of evidence? In J. D. Bransford, D. J. Stipek, N. J, Vye, L. M. Gomez & D. Lam, The role of research in educational improvement (pp. 67–86). Cambridge, MA: Harvard Education Press.
Coburn, C. E., & Talbert, J. E. (2006). Conception of evidence use in school districts: Mapping the terrain. American Journal of Education, 112, 469–495.
Coburn, C. E., Toure, J., & Yamashita, M. (2009). Evidence, interpretation, and persuasion: Instructional decision making at the district central office. Teachers College Record, 111(4), 1115–1161.
Corcoran, T., Fuhrman, S., & Belcher, C. (2001). The district role in instructional improvement. Phi Delta Kappan, 83, 78–84.
David, J. L. (1981). Local uses of Title I evaluations. Educational Evaluation and Policy Analysis, 3, 27–39.
Dwyer, C. A., Millett, C. M., & Payne, D. G. (2006). A culture of evidence: Postsecondary assessment and learning outcomes. Recommendations to policymakers and the higher education community. Princeton, NJ: Educational Testing Service.
Dwyer, J. J. & Makin, S. (1997). Using a program logic model that focuses on performance measurement to develop a program. Canadian Journal of Public Health, 88(6), 421–425.

Technical Report No. 1 National Center for Research in Policy and Practice | 49
Feldman, M. & Pentland, B. (2003). Reconceptualizing organizational routines as a source of flexibility and change. Administrative Science Quarterly, 48, 94–118.
Finnigan, K., Daly, A., & Che, J. (2013). Systemwide reform in districts under pressure: The role of special networks in defining, acquiring, using, and diffusing research evidence. Journal of Educational Administration, 51(4), 476–497.
Fitzsimmons, E., & Cooper, J. (2012). Embedding a culture of evidence-based practice. Nursing Management, 19(7), 14–19.
Gerrish, K., & Clayton, J. (2004). Promoting evidence-based practice: An organizational approach. Journal of Nursing Management, 12(2), 114–123.
Government Accounting Office. (2013). Education research: Further improvements needed to ensure relevance and assess dissemination efforts. Report to the Committee on Education and the Workforce, House of Representatives. Washington, DC: Author.
Hemsley-Brown, J. (2005). Using research to support management decision making within the field of education. Management Decision, 43(5), 691–705.
Hubbard, L. (2010). Research to practice: The case of Boston Public Schools, Education Matters and the Boston Plan for Excellence. In C. E. Coburn & M. K. Stein (Eds.), Research and practice in education: Building alliances, bridging the divide (pp. 55–72). Lanham, MD: Rowman & Littlefield.
Ikemoto, G. S., & Honig, M. I. (2010). Tools to deepen practitioners’ engagement with research: The case of the Institute for Learning. In C. E. Coburn & M. I. Honig (Eds.), Research and practice in education: Building alliances, bridging the divide (pp. 93–108). Lanham, MD: Rowman & Littlefield.
Johnson, K., Greenseid, L. O., Toal, S. A., King, J. A., Lawrenz, F., & Volkov, B. (2009). Research on evaluation use: A review of the empirical literature from 1986 to 2005. American Journal of Evaluation, 30(3), 377–410.
Kane, M. T. (2006). Validation. In R. L. Brennan (Ed.), Educational measurement (4th ed., pp. 17–64). Westport, CT: National Council on Measurement in Education and American Council on Education.
Kennedy, M. M. (1982). Evidence and decision. In M. M. Kennedy (Ed.), Working knowledge and other essays (pp. 59–103). Cambridge, MA: The Huron Institute.
Landry, R., Lamari, M., & Amara, N. (2003). The extent and determinants of the utilization of university research in government agencies. Public Administration Review, 63(2), 192–205.
Little, J. W. (2012). Understanding data use practice among teachers: The contribution of micro-process studies. American Journal of Education, 118(2), 143–166.

Technical Report No. 1 National Center for Research in Policy and Practice | 50
Makar, K., & Confrey, J. (2005). Secondary teachers’ statistical reasoning in comparing two groups. In D. Ben-Zvi & J. Garfield (Eds.), The challenge of developing statistical literacy, reasoning, and thinking (pp. 353–374). New York: Kluwer.
Means, B., Padilla, C., & Bakia, M. (2009). Implementing data-informed decision making in schools-- Teacher access, supports and use. Report prepared for U.S. Department of Education, Office of Planning, Evaluation and Policy Development. Prepared by SRI International, Menlo Park, CA.
Messick, S. (1995). Validity of psychological assessment: Validation of inferences from persons’ responses and performances as scientific inquiry into score meaning. American Psychologist, 50(9), 741–749.
Nutley, S. M., Davies, H. T. O., & Smith, P. C. (2001). What works? Evidence-based policy and practice in public services. Bristol, UK: The Policy Press.
Palinkas, L., Aarons, G., Chorpita, B., Hoagwood, K., Landsverk, J., & Weisz, J. (2009). Cultural exchange and the implementation of evidence-based practices. Research on Social Work Practice, 19(5), 602–612.
Penuel, W. & Means, B. (2011). Using large-scale databases in evaluation: Advances, opportunities, and challenges. American Journal of Evaluation, 32, 118–133.
Sharkey, N. & Murnane, R. (2006). Tough choices in designing a formative assessment system. American Journal of Education, 112(4), 572–588.
Spillane, J. P. (1998). State policy and the non-monolithic nature of the local school district: Organizational and professional considerations. American Educational Research Journal, 35(1), 33–63.
Spillane, J.P., Parise, L.M., & Sherer, J.Z. (2011). Organizational routines as coupling mechanisms: Policy, school administration, and the technical core. American Educational Research Journal, 48(3), 586–620.
Weiss, C. H., & Bucuvalas, M. J. (1980). Social science research and decision-making. New York, NY: Columbia University Press.
West, R. F., & Rhoton, C. (1994). School district administrators’ perceptions of educational research and barriers to research utilization. ERS Spectrum, 12(1), 23–30.

Technical Report No. 1 National Center for Research in Policy and Practice | 51
APPENDIX
Table A1. Comparison of MDR Roles (Sampling Frame) to Reported Roles of Respondents
Role Defined by MDR List
1.Deputy/
Associate/ Network
Superinten-dents
2. Curriculum
& Instruction
3.Special
Education
4. Assessment
5.Principals
6.Federal
Programs
7.Multi-Role
Unique count 90 115 102 91 138 89 108
Role as reported in survey
Supervisor of Teaching 9 42 10 9 18 13 35
Math Coordinator 0 22 0 0 0 1 2
Science Coordinator 0 22 0 0 0 0 0
Reading Coordinator 0 11 0 0 2 3 2
Assessment Coordinator 0 3 1 62 1 4 14
Special Education Director 1 0 83 0 1 0 7
Assistant Superintendent 73 26 6 10 0 10 69
Principal or Assistant Principal 1 3 1 0 135 0 2
Federal Programs Director 0 0 1 2 2 47 22
Other 14 17 13 21 3 38 13
Total # Checked 98 146 115 104 162 116 166

Technical Report No. 1 National Center for Research in Policy and Practice | 52
Exhibit A1. Coding Categories for Open-Ended Item: Research that Leaders Find Useful
1. Identification coding:a. APA citation b. Author(s)c. Summary/ abstract
2. Descriptive coding:a. Author Type
i. Internal to the districtii. External to the districtiii. Both internal and external authorsiv. Can’t tell
b. Type:i. Bookii. Journal articleiii. Practitioner-oriented magazine articleiv. Research-based tool or program v. Technical report or Working papervi. Research/ Policy brief or reportvii. Standards documentviii. Dissertationix. Mediax. Otherxi. Can’t tell
c. Peer-review status:i. Peer-reviewii. Editorial reviewiii. Thesis reviewiv. No reviewv. Can’t tell
d. Topic/ Subtopic:
i. Assessment1. Standardized testing2. Classroom assessment3. Grading4. Placement/ screening5. Other
ii. Student learning and student outcomes1. Student achievement/ learning outcomes2. Social/ emotional/ behavioral outcomes

Technical Report No. 1 National Center for Research in Policy and Practice | 53
3. Graduation rates4. College/ career readiness5. Learning/ identity development6. Mindset7. Other
iii. Teachers and teaching in the classroom1. Pedagogical practices2. Teacher professional learning3. Teacher preparation4. Teacher effectiveness/ evaluation5. Curriculum/ Standards6. Other
iv. School organization, improvement and reform1. School leader practices and professional learning2. School improvement3. School-level interventions4. Organization (including scheduling)5. School climate6. Family/ community engagement7. Bilingual education/ ESL8. Detracking9. Discipline10. Other
v. School system organization, improvement and reform1. District leader practices and professional learning2. System improvement3. District-level interventions4. Early childhood education5. Large-scale policies6. Other
e.Why usefuli. Supporting leaders’ own professional learningii. Providing instructional leadership for othersiii. Designing policies, programs and initiativesiv. Selecting programsv. Supporting and monitoring implementationvi. Persuading others on policies, programs and initiativesvii. Verifying/ validating programs on policies, programs and initiativesviii. Otherix. Descriptive onlyx. No responsexi. Can’t tell