technical report n
TRANSCRIPT


Technical Report N° 58 September 1994 Animal Protein Sources for Rural and Urban Populations in Ghana
by Ute Heinbuch IDAF Community Development Officer FOOD AND AGRICULTURE ORGANIZATION OF THE UNITED NATIONS Cotonou, September 1994

The designations employed and the presentation of material in this publication do not imply the expression of any opinion whatsoever on the part of the Food and Agriculture Organization or the financing agency concerning the legal status of any country or territory, city or area, or of its authorities, or concerning the delimitation of its frontiers or boundaries.
For bibliographic purposes this document should be cited as follows: Heinbuch, U., Animal protein sources for rural and urban populations in Ghana. Cotonou, 1994
Programme for the Integrated Development of Artisanal Fisheries in West Africa, 25 p. + annex, IDAF/WP/58
IDAF Project FAO P.O. Box 1369 Cotonou, Republic of Benin Telex: 5291 FOODAGRI Fax: (229) 33.05.19 Tel: (229) 33.09.25
IDAF Technical Report N° 58 i
Executive Summary
In many developing countries in Africa as well as elsewhere, fish is generally considered a cheap source of animal protein, affordable also for poorer groups of the population. The purchase and consumption of fish, however, depends on the availability and price of fish and of alternative animal protein sources, as well as on non-economic factors influencing consumer preference and behaviour.
In order to look into the role of fish in dietary patterns and the underlying determinants of consumption, IDAF undertook a case study in Ghana specifically aiming to (i) summarize recent trends of the availability and affordability of fish and other animal protein sources; (ii) examine producer-consumer interactions and consumer behaviour regarding the selection or choice for fish vis-a-vis other foods of animal origin; and (iii) assess the current and future role of fish in the Ghanaian diet and identify ways of sustaining it.
The study comprised a secondary data review and a field survey for data collection using individual interviews. Study sites were selected along the coast, i.e. the rural market of Mankessim and two urban markets in Accra, i.e. Tuesday market and 31 December market. During April 1994, a total of 64 traders of animal food products were interviewed to illustrate the supply side, and a total of 68 consumers to illustrate the demand side respectively.
During the last decades Ghana could increase its domestic fish production continuously, finally reaching about 420,000 mt in 1992. By this, the supply of fish could keep pace with the growth of the population which increased at an average annual rate of 2 to 3% during the same period. In 1990, per caput fish supply was about 27 kg, and fish contributed 64% to total animal protein intake. But the fishery resources is currently fully- if not over-exploited. Hence, prospects for further substantial increases in fish production are unfavourable. Though livestock production increased as well during the eighties, it could however not keep pace with population growth.
During the time of the investigation a large variety of animal protein sources was available in the markets in the urban as well as in the rural setting. Supply of marine fish comprised mainly small pelagics like sardines, anchovy, and mackerels, but demersal species like seabream or barracuda were also available. The fish on sale was usually processed, the majority being smoked, but salted/sundried and fried products could also be found. The meat available in the markets comprised beef, mutton, goat meat and pig feet. Contrary to fish, the meat was to a large extent sold fresh.
The removal of the fuel subsidy for artisanal fishermen, implemented by the Ghanaian authorities in the beginning of the year, led to a sharp increase in fish prices at the landing sites as well as in the markets. Nevertheless, small pelagics were found to be the cheapest source of animal protein in both the rural and the urban markets. For 100 g of protein from smoked sardinella, for instance, the consumer had to pay only half as much as for the cheapest meat source, i.e. goat meat. The most expensive animal protein source was beef, particularly in the rural setting.
Ghana is well known as a fish eating nation and fish is generally enjoying a high consumer preference all over the country. Though its fine taste and high nutritional value are
ii IDAF Technical Report N° 58
contributing to its favourite role in the Ghanaian diet, the single most important factor for the purchase of fish is its comparative cost advantage towards other animal protein sources. In the rural setting the economic aspect, i.e. the lower price was almost exclusively determining consumers' choice to buy fish rather than meat. Though the cost of a product remains an important consideration among urban consumers as well, health and nutritional aspects are apparently gaining more and more prominence in the selection of food of animal origin in this setting. Overall, fish is consumed daily by the majority of people, while meat is eaten on average two to three times a week.
The findings of the study reveal that the price of a product is playing a crucial role in the selection of food of animal origin both between as well as within product groups. In addition, there is some evidence that the recent price increase of fish apparently threatens consumer budgets and leads to changes in the demand structure of fish. Consumers are still buying fish regularly, but are partly demanding smaller pieces and are bargaining more than they did before. This change in behaviour may be taken as an indication that not all consumers do have the purchasing power to compensate for higher prices, but rather a fixed budget which can be adapted to increased prices only by reducing the amount bought and,hence, consumed. For the lower income groups such a trend may indeed mean that even fish as the cheapest source of animal protein is becoming less and less affordable, with all its possible negative implications for nutritional status.
In order to maintain the supply of animal protein sources at an acceptable level for all population groups, increased efforts are inevitable. Potential strategies comprise (i) incentives to increase domestic production where possible, or to maintain it in a sustainable way; (ii) increasing food imports; (iii) reducing post-harvest losses; (iv) increasing purchasing power particularly of lower income groups; and (v) strengthening consumer education.

IDAF Technical Report N° 58 iii
List of Abbreviations EIU Economic Intelligence Unit ERP Economic Recovery Programme FAO Food and Agriculture Organisation of the United Nations GDP Gross Domestic Product GNP Gross National Product IFAD International Fund for Agriculture PCI Protein Cost Index PEM Protein Energy Malnutrition UNDP United Nations Development Programme WHO World Health Organisation
iv IDAF Technical Report N° 58
Table of Contents Executive Summary List of Abbreviations Table of Contents List of Tables List of Figures. Map: The study sites. Table of Contents 1 Introduction
1.1 Background of the study 1.2 Objectives 1.3 Study methods 1.4 Sample sites and size 1.5 Limitations of the study
2 Socio-economic context
2.1 Macro-economic situation 2.2 Population 2.3 Nutritional situation
3 Food supply
3.1 Food production 3.1.1 Agricultural production 3.1.2 Fish production
3.2 Food imports 3.3 Food supply
4 Marketing pattern
4.1 Channels 4.2 Main products 4.3 Prices
4.3.1 Beach prices of fish 4.3.2 Market prices of animal food items 4.3.3 The cost of protein
5 Consumer's choice: fish vs. meat
5.1 General dietary pattern 5.2 Consumer preferences 5.3 Consumer behaviour and consumption pattern
5.3.1 Food purchases 5.3.2 Consumption pattern
6 Concluding remarks
i iii iv v v
vi
1 1 1 1 1 2 3
4 4 5 5
6 6 6 6 7 8
11 11 13 13 13 14 17
18 18 19 20 20 21
22
References
24
IDAF Technical Report N° 58 v
Annex I: Questionnaire marketing survey Questionnaire consumer survey
List of Tables Table 1: Number of traders interviewed, by commodity Table 2: Number of consumers interviewed, by age group Table 3: Sector shares in total food imports (%) Table 4: Imports of food of animal origin, 1987 - 1992 Table 5: Per capita food supply, 1961 - 1988 Table 6: Chain of fish production, processing and marketing Table 7: Average retail prices of fish and meat, April 1994 Table 8: Rural - urban price differences, April 1994 Table 9: Protein cost indices for major food items List of Figures Figure 1: Domestic fish production (in mt), 1970 – 1992 Figure 2: Contributions of fish and meat to daily energy intake (%),
1961-88 Figure 3: Contribution of fish and meat to daily protein intake (%),
1961-88 Figure 4: Beach prices of selected fish species (cedis/kg), January
1993 - January 1994 Figure 5: Wholesale prices of selected fish species (cedis/kg), 1990-
1994 Figure 6: Preference for fish and meat Figure 7: Preference for fish by reason Figure 8: Preference for fish by species
2 2 7 8 9
12 16 16 17
7
10
11
14
15 19 19 20

vi IDAF Technical Report N° 58
MAP: The study sites

IDAF Technical Report N° 58 1
1 Introduction 1.1 Background of the study
In West African countries the artisanal fisheries sector is playing a vital role in providing food and employment to the increasing populations. Fish is generally considered a cheap source of animal protein, affordable also for poorer groups of the population. The validity of this general observation is, however, dependent on the value of the fish species available in domestic markets. Particularly in urban markets the supply of higher value and, hence, more expensive fish may dominate. The purchase and consumption of fish further depends on the availability and price of alternative animal protein sources like meat, eggs, milk and milk products. Apart from economic factors there are also other factors which play an important role for consumer preferences, in particular in a fish eating country like Ghana.
The general economic environment and governmental policies regarding the food producing sector have an impact on food decisions as well. The recent removal of the fuel subsidy for artisanal fishermen in Ghana, for instance, has led to an increase in fish prices in the local markets. The investigation of related changes in consumer behaviour and marketing adaptations can help to deepen the knowledge on producer - consumer interactions. This in turn could pave the way for recommendations on how to assure the importance and potential of fish in the Ghanaian diet. 1.2 Objectives
The present study was planned and conducted with the overall aim of (i) summarizing recent trends of the availability and affordability of fish and other animal protein sources; (ii) examining producer-consumer interactions and consumer behaviour regarding the selection or choice for fish vis-a-vis other foods of animal origin in rural and urban areas; and (iii) assessing the current and future role of fish in the Ghanaian diet and identifying ways of sustaining it. 1.3 Study methods
The study comprised two major activities. First, a secondary data review on macro-economic aspects like national food production and imports, and food supply was mainly based on statistics of FAO and the Department of Fisheries. Second, a field survey for data collection was carried out from 11 to 26 April 1994 by using individual interviews in selected rural and urban markets in which the target groups were traders to illustrate the local supply side, and consumers to illustrate the demand side respectively.
Two different questionnaires had been developed for the two distinct target groups (see Annex I). All interviews took place in the selected markets and were done by one female and two male senior staff of the Department of Fisheries under the supervision of the IDAF Community Development Officer.
2 IDAF Technical Report N° 58
1.4 Sample sites and size
In close collaboration with respective authorities an urban and a rural setting had been identified for the field work. One limiting factor for the selection was found to be the ban on travel of UN staff to inland regions up north for security reasons. Hence, it was agreed upon selecting sites in the coastal area.
For the urban setting the choice was made for Accra, that is, more specific, the Tuesday Market and the 31 December Market. While the former is mainly a wholesale market of regional importance at the western outskirts of the city, the latter is a big retail market in the heart of the city centre.
For the rural setting the choice was made for Mankessim, a non-coastal village along the Accra-Cape Coast road. Being located a bit in-land, the village does not have a fishery industry itself, but depends on the existing fish marketing system.
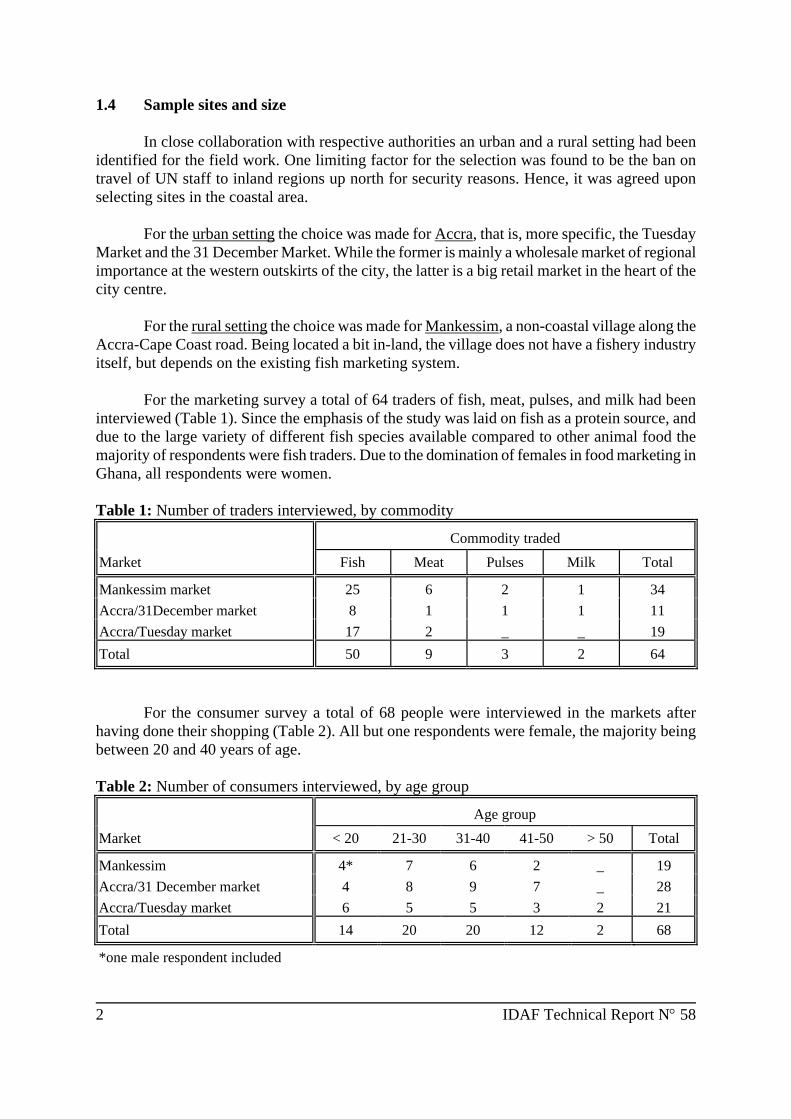
For the marketing survey a total of 64 traders of fish, meat, pulses, and milk had been interviewed (Table 1). Since the emphasis of the study was laid on fish as a protein source, and due to the large variety of different fish species available compared to other animal food the majority of respondents were fish traders. Due to the domination of females in food marketing in Ghana, all respondents were women. Table 1: Number of traders interviewed, by commodity
Commodity traded Market
Fish
Meat
Pulses
Milk
Total
Mankessim market
25
6
2
1
34
Accra/31December market
8
1
1
1
11 Accra/Tuesday market
17
2
_
_
19
Total
50
9
3
2
64
For the consumer survey a total of 68 people were interviewed in the markets after having done their shopping (Table 2). All but one respondents were female, the majority being between 20 and 40 years of age. Table 2: Number of consumers interviewed, by age group
Age group Market
< 20
21-30
31-40
41-50
> 50
Total
Mankessim
4*
7
6
2
_
19
Accra/31 December market
4
8
9
7
_
28 Accra/Tuesday market
6
5
5
3
2
21
Total
14
20
20
12
2
68 *one male respondent included
IDAF Technical Report N° 58 3
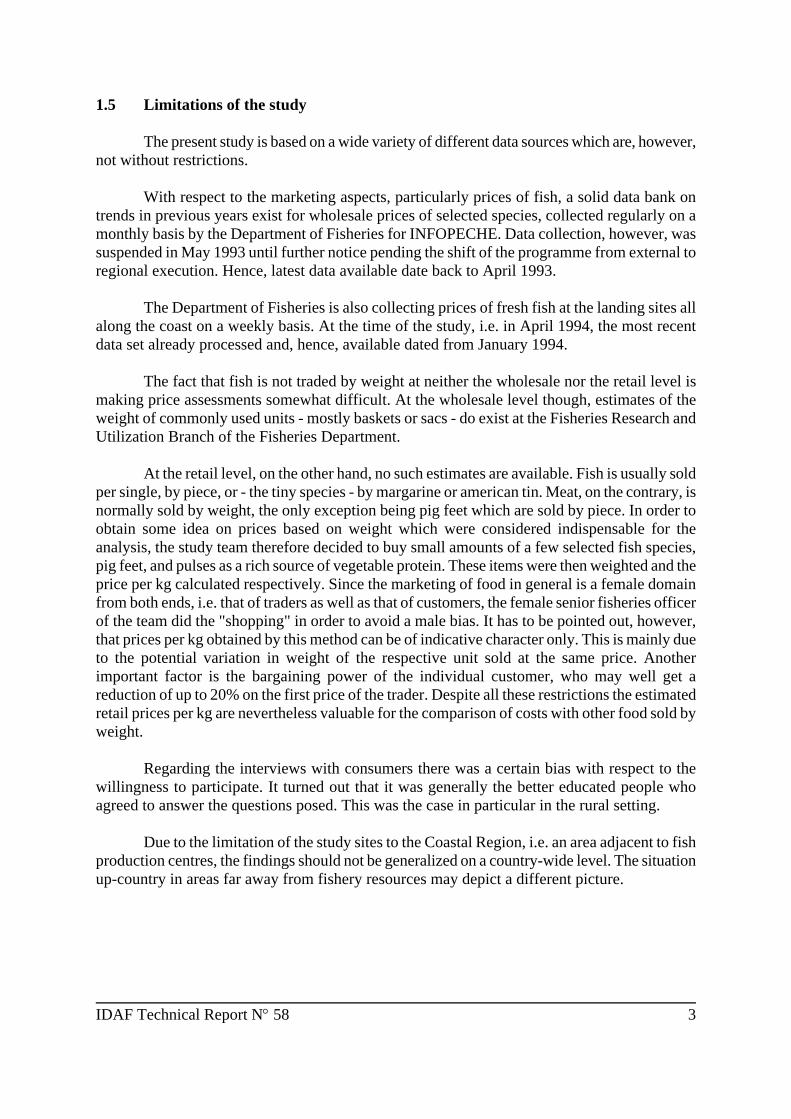
1.5 Limitations of the study
The present study is based on a wide variety of different data sources which are, however, not without restrictions.
With respect to the marketing aspects, particularly prices of fish, a solid data bank on trends in previous years exist for wholesale prices of selected species, collected regularly on a monthly basis by the Department of Fisheries for INFOPECHE. Data collection, however, was suspended in May 1993 until further notice pending the shift of the programme from external to regional execution. Hence, latest data available date back to April 1993.
The Department of Fisheries is also collecting prices of fresh fish at the landing sites all along the coast on a weekly basis. At the time of the study, i.e. in April 1994, the most recent data set already processed and, hence, available dated from January 1994.
The fact that fish is not traded by weight at neither the wholesale nor the retail level is making price assessments somewhat difficult. At the wholesale level though, estimates of the weight of commonly used units - mostly baskets or sacs - do exist at the Fisheries Research and Utilization Branch of the Fisheries Department.
At the retail level, on the other hand, no such estimates are available. Fish is usually sold per single, by piece, or - the tiny species - by margarine or american tin. Meat, on the contrary, is normally sold by weight, the only exception being pig feet which are sold by piece. In order to obtain some idea on prices based on weight which were considered indispensable for the analysis, the study team therefore decided to buy small amounts of a few selected fish species, pig feet, and pulses as a rich source of vegetable protein. These items were then weighted and the price per kg calculated respectively. Since the marketing of food in general is a female domain from both ends, i.e. that of traders as well as that of customers, the female senior fisheries officer of the team did the "shopping" in order to avoid a male bias. It has to be pointed out, however, that prices per kg obtained by this method can be of indicative character only. This is mainly due to the potential variation in weight of the respective unit sold at the same price. Another important factor is the bargaining power of the individual customer, who may well get a reduction of up to 20% on the first price of the trader. Despite all these restrictions the estimated retail prices per kg are nevertheless valuable for the comparison of costs with other food sold by weight.
Regarding the interviews with consumers there was a certain bias with respect to the willingness to participate. It turned out that it was generally the better educated people who agreed to answer the questions posed. This was the case in particular in the rural setting.
Due to the limitation of the study sites to the Coastal Region, i.e. an area adjacent to fish production centres, the findings should not be generalized on a country-wide level. The situation up-country in areas far away from fishery resources may depict a different picture.

4 IDAF Technical Report N° 58
2 Socio-economic context 2.1 Macro-economic situation
After a decade of relative wealth just after independence in 1957, the economy of Ghana started to deteriorate in the 1970's, a trend which continued until the beginning of the 1980's. Since 1983 the Ghanaian economy is recovering steadily. Between 1980 and 1990 it grew at an average rate of 2,8% per year. In 1992 annual average growth of GNP reached 3,9%, estimates for 1993 indicate a 5,0% and forecasts for 1994 a 5,2% growth respectively. Average annual growth of GNP per capita, however, declined during the last two decades. Between 1960 and 1982 the average annual growth rate stood at - 1.3%, but this trend diminished during the 1980's with an annual average growth of GNP/capita of - 0.3%. In absolute terms, GNP per capita was US$ 400 in 1991 (EIU 1993, UNDP 1993, World Bank 1984 and 1993).
The recovery of the economy can be attributed to the Economic Recovery Programme (ERP), launched in 1983. The objectives of this programme comprised the lowering of inflation; increasing the flow of foreign exchange into Ghana; restructuring the country's economic institutions; restoring production incentives; rehabilitating the infrastructure; and last but not least increasing the availability of essential consumer goods. Though the ERP had undoubtedly a positive effect on the Ghanaian economy as a whole, the cost of this programme has mainly been felt by the poorer sections of the population. Real wages in 1988, for instance, were less than half of those in the mid 1970's (EIU 1993). There is some evidence that the rural poor, constituting 80% of all poor people in the country (World Bank 1990), are particularly affected. According to a recent study on living conditions in rural communities the standard of living was felt to be worse in 1992 compared to that of 1982. This situation was attributed mainly to the high cost of living and the lack of job opportunities (Ghana Statistical Service 1993).
Agriculture including forestry and fishing is the backbone of the Ghanaian economy providing employment for almost 60% of the work force. Though the contribution of the sector to GDP declined from 59.7% in 1983 to 47.9% in 1990 its share is still almost as big as that of industries and services together. Within agriculture the contribution of the fishery sector to GDP increased from 1.1 to 1.3% during the same period (EIU 1993).
Overall consumer prices increased steadily during the past decade. The single most important item of total household consumption is food with a share of 50% (World Bank 1993). Poor households however are spending relatively more on food than do household of the middle or higher income strata. They are therefore much more affected even by slight increases in food prices. The national consumer price index for food, for instance, increased by 33% per year between 1987 and 1990. Overall, price increases were generally higher in urban than in rural areas.
In January 1994, the Government removed the subsidy of fuel for fishermen. Hence, the fuel price increased from 500 cedis per gallon to 1900 cedis per gallon respectively1. Based on the estimate that an average fishing trip requires 55 litres (= 12 gallons) of fuel (Gulbrandsen 1991) costs per trip increased from 6000 cedis to 22800 cedis, i.e. by 380%. Fishermen reacted to this substantial increase by reducing the number of fishing trips and/or the distance to fishing
1 Exchange rate in April 1994: 1 US$ = 930 cedis

IDAF Technical Report N° 58 5
grounds steered for, in particular if catches are bad. Thus fishing may become irregular which would have negative implications for the post-harvest sector as well. A direct effect of decreased fishing effort was a short supply of fish in the markets, which in turn led to increased prices of the product. 2.2 Population
Between 1960 and 1991 the total population of Ghana more than doubled, increasing from 6.8 million to 15.5 million. With its given land area of 238,537 km² population density increased from 29 to 65 inhabitants per km² during the same period. In 1991 about 67% of the population were living in rural areas (UNDP 1993).
The annual average growth of the population was 2.2% during 1970 - 1980, but increased to 3.2% during 1980 - 1990 and is estimated to continue at this rate towards the year 2000, resulting in a total population of 20 million. Corresponding to the high population growth is the age structure of the population. 1991 almost 47% of the Ghanaian population were below 15 years of age (World Bank 1993). Rapid population growth is also increasing the number of people entering the labour market each year. The annual average growth of the labour force was 2.4% during 1970-1980, increased to 2.7% during 1980-1992 and is estimated to increase to 3.0% towards the year 2000 (World Bank 1994). 2.3 Nutritional situation
The problem of protein energy malnutrition (PEM) particularly among children below five years of age is prevalent all over Ghana. In 1980 some 35% of pre-school children were described as underweight (i.e. less than 80% of standard weight-for-age). This percentage rose to more than 50% in the mid 1980s, declined to less than 35% after 1986, but started to rise again at the end of the 1980s. In 1990 more than one third of all Ghanaian children, i.e. 36%, suffered from PEM. While the majority of children suffered from mild or moderate forms of PEM, about 8% showed severe protein deficiency (Kwashiorkor) or severe energy deficiency/signs of starving (Marasmus) (FAO 1993a, World Bank 1993).
The children are affected by both acute as well as chronic undernutrition. There are, however, considerable geographical differences in terms of PEM severity and prevalence. The most seriously affected region is the northern savanna zone where seasonal food shortages occur on a regular basis. The best nutritional situation is found in the coastal region where children weigh heaviest compared to the northern and the forest zones (Ghana Ministry of Health 1992).
Generally, rural children suffer much more from chronic undernutrition than children in urban areas. Fishing communities along the coast are apparently better off in terms of nutrition where prevalence of PEM was found to be lower than in farming communities (UNICEF 1990). The reason for the more favourable nutritional situation in fishing communities lies in the higher availability of protein-rich fish and seafood products. However, poor purchasing power and inadequate nutritional knowledge among fisherfolk is yet a major constraint to overcome PEM completely.

6 IDAF Technical Report N° 58
3 Food supply 3.1 Food production 3.1.1 Agricultural production
The main food crops grown in Ghana are cereals like maize, rice, millet and sorghum, and starchy staples like cocoyam, cassava, yam and plantain.
The overall picture shows a decline in total food production by 2.7% per year during the years 1971 to 1983. Food self-sufficiency decreased from 83% in 1961-66 to 71% in 1978-80. In 1983, Ghana was self-sufficient only in plantains and bananas. Since then, agricultural production has shown a steady increase due to favourable weather conditions and improved production incentives initiated under the Economic Recovery Programme. Though a severe drought in 1990 resulted in a sharp decline in agricultural production, total output was still higher than ten years before. In 1991 a record harvest could be achieved due to adequate rainfalls (EIU 1993).
In absolute figures total cereal production reached 1,176,000 mt in 1991. Calculated on a per capita basis the production index for cereals increased from 100 in 1979-81 (base year) to 137.8 in 1991. There is, however, some indication that production figures decreased again in 1992 when total harvest reached 1,000,000 mt, and the corresponding per capita index fell to 88.7. The production of starchy staples doubled between 1979-81 and 1992 from 4,740,000 mt to 9,400,000 mt respectively (FAO 1993a).
Domestic livestock production increased during the same period as well reflected in a production index of 135.8 in 1992 compared to 100 in the base year. The number of cattle rose from 864,000 in 1979-81 to 1,400,000 in 1992, the number of sheep from 1,942,000 to 2,500,000, the number of goats from 1,934,000 to 2,600,000, and the number of pigs from 379,000 to 500,000 respectively. Correspondingly, the number of slaughtered livestock increased. 1992 almost two million animals were officially slaughtered for human consumption. Domestic livestock production could, however, not keep pace with the growth of the Ghanaian population. During the period from 1979-81 and 1992 the per capita production index fell constantly and reached finally 91.5 (FAO 1993a). 3.1.2 Fish production
Ghana is one of the major fish producing countries in West Africa. Total fish catches showed a continuous increase over the last three decades, amounting to 417,099 mt in 1992 (see Figure 1). Marine production is holding the biggest share with 86% of total catches. The most

IDAF Technical Report N° 58 7
important marine species caught are small pelagics which comprised about 75% of the marine catch in 1992 (FAO 1994). Figure 1: Domestic fish production (in mt), 1970 - 1992
The fish production index increased from 100 in the base year 1979-81 to 176,7 in 1992. Contrary to livestock production, the increase in fish production was not thwarted by the increase in the Ghanaian population during the same period, but the fish production index per capita increased from 100 to 115,4 respectively. Prospects for future increases are, however, poor given the fact that the production of the last years is already exceeding the indicative fisheries potential of Ghana which is estimated to stay at 345,500 mt (Seki and Bonzon 1993). 3.2 Food imports
Ghana is dependent on food imports in order to meet the food demand of its growing population. Main commercial food commodities imported include cereals (particularly rice and wheat), fish and meat. Altogether, food and live animals form about 5% of total imports.
During the last three decades the share of imports in overall food supply was rather constant at 10 to 11% (IFAD 1992). The composition of imports, however, changed (Table 3). The share of livestock increased substantially during the 1960's and made up a quarter of total food imports in 1969-71. The economic recession in the seventies, however,
Crops
Livestock
Fishery
1961 - 63
83
11
6
1969 - 71
71
25
4 1979 - 81
88
8
4
1988 - 90
95
4
1 Source: Food Security Profile Ghana. IFAD, Rome 1992
8 IDAF Technical Report N° 58
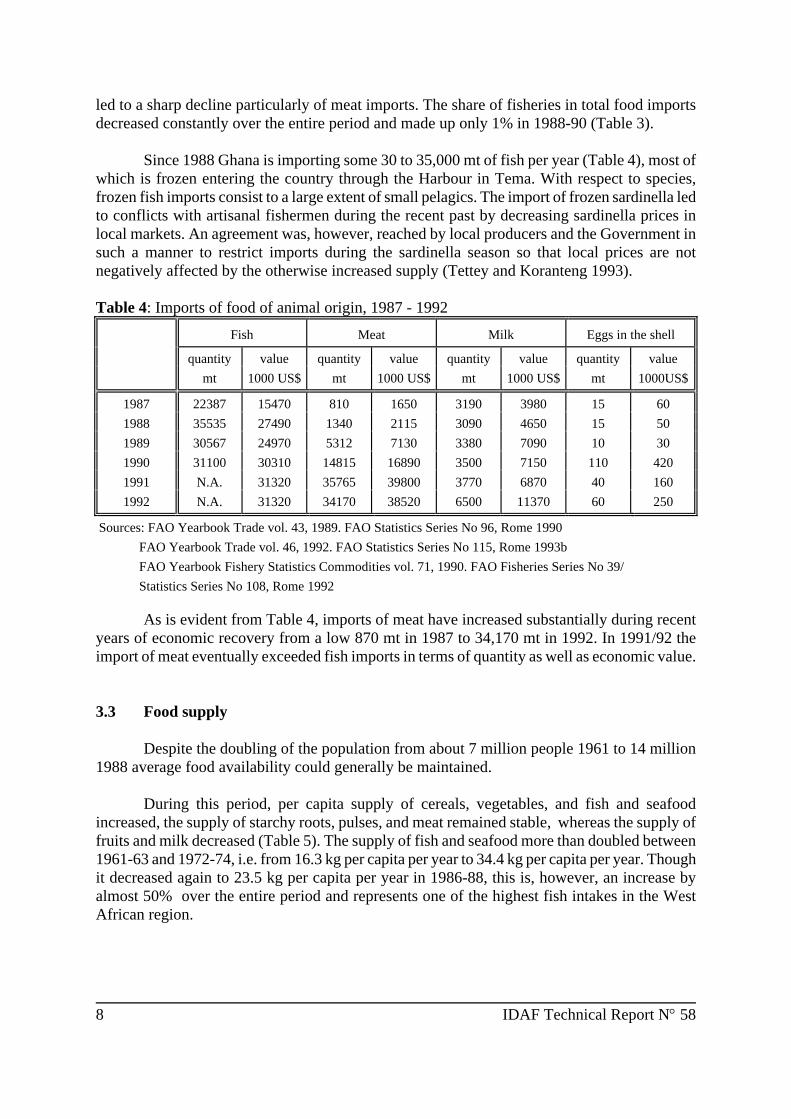
led to a sharp decline particularly of meat imports. The share of fisheries in total food imports decreased constantly over the entire period and made up only 1% in 1988-90 (Table 3).
Since 1988 Ghana is importing some 30 to 35,000 mt of fish per year (Table 4), most of which is frozen entering the country through the Harbour in Tema. With respect to species, frozen fish imports consist to a large extent of small pelagics. The import of frozen sardinella led to conflicts with artisanal fishermen during the recent past by decreasing sardinella prices in local markets. An agreement was, however, reached by local producers and the Government in such a manner to restrict imports during the sardinella season so that local prices are not negatively affected by the otherwise increased supply (Tettey and Koranteng 1993). Table 4: Imports of food of animal origin, 1987 - 1992
Fish
Meat
Milk
Eggs in the shell
quantity
value
quantity
value
quantity
value
quantity
value mt
1000 US$
mt
1000 US$
mt
1000 US$
mt
1000US$
1987
22387
15470
810
1650
3190
3980
15
60
1988
35535
27490
1340
2115
3090
4650
15
50 1989
30567
24970
5312
7130
3380
7090
10
30
1990
31100
30310
14815
16890
3500
7150
110
420 1991
N.A.
31320
35765
39800
3770
6870
40
160
1992
N.A.
31320
34170
38520
6500
11370
60
250 Sources: FAO Yearbook Trade vol. 43, 1989. FAO Statistics Series No 96, Rome 1990
FAO Yearbook Trade vol. 46, 1992. FAO Statistics Series No 115, Rome 1993b
FAO Yearbook Fishery Statistics Commodities vol. 71, 1990. FAO Fisheries Series No 39/ Statistics Series No 108, Rome 1992
As is evident from Table 4, imports of meat have increased substantially during recent years of economic recovery from a low 870 mt in 1987 to 34,170 mt in 1992. In 1991/92 the import of meat eventually exceeded fish imports in terms of quantity as well as economic value. 3.3 Food supply
Despite the doubling of the population from about 7 million people 1961 to 14 million 1988 average food availability could generally be maintained.
During this period, per capita supply of cereals, vegetables, and fish and seafood increased, the supply of starchy roots, pulses, and meat remained stable, whereas the supply of fruits and milk decreased (Table 5). The supply of fish and seafood more than doubled between 1961-63 and 1972-74, i.e. from 16.3 kg per capita per year to 34.4 kg per capita per year. Though it decreased again to 23.5 kg per capita per year in 1986-88, this is, however, an increase by almost 50% over the entire period and represents one of the highest fish intakes in the West African region.

IDAF Technical Report N° 58 9
Table 5: Per capita food supply, 1961 - 1988
1961-63 1964-66
1969-71
1972-74
1974-76
1976-78
1979-81
1982-84
1984-86
1986-88
Kilogram per year
Cereals
61.1
58.4
71.1
74.6
69.3
71.2
71.9
58.8
68.7
72.5
Starchy roots
325.0
320.5
319.3
286.5
287.2
286.6
278.5
300.2
320.5
322.5
Pulses
1.5
1.0
1.2
1.3
1.6
1.3
1.0
0.9
0.9
1.2
Vegetables
22.8
21.5
30.3
48.8
41.3
29.7
25.4
29.1
46.8
47.7
Fruits
90.1
88.9
104.5
107.6
124.9
101.1
80.7
91.6
119.7
80.8
Vegetable oils
4.9
5.5
6.0
6.2
6.5
6.4
5.9
5.9
7.4
8.6
Meat & offal
10.3
9.5
10.7
9.9
9.7
9.8
11.2
11.9
11.3
11.0
Eggs
0.5
0.6
0.7
0.8
0.8
0.9
0.9
0.6
0.6
0.7
Fish & seafood
16.3
14.0
27.4
34.4
33.6
32.5
22.9
21.8
22.7
23.5
Milk
6.4
7.8
9.6
7.4
7.4
7.3
2.0
3.8
4.1
3.0
Animal fats
0.2
0.2
0.2
0.3
0.3
0.3
0.2
0.2
0.2
0.2
Calories per day (number)
Grand total
2018
1969
2200
2182
2164
2070
1953
1945
2196
2201
Vegetable products
1923
1880
2070
2052
2036
1943
1852
1844
2096
2102
*cereals
474
456
564
589
545
561
563
462
549
577
*starchy roots
888
878
870
778
788
804
785
844
898
907
*pulses
14
10
11
12
15
13
10
9
9
11
*nuts & oilseeds
97
87
103
126
116
72
105
113
95
88
*vegetables
18
17
22
36
30
21
18
20
30
31
*fruits
202
199
223
231
276
231
173
199
274
182
*vegetable oils
115
129
140
146
153
151
138
137
175
204
*miscellaneous
115
104
137
134
113
90
60
60
66
102
Animal products
95
89
130
130
128
127
101
101
100
99
*meat & offal
42
37
43
39
38
37
42
44
42
41
*eggs
2
2
2
3
3
3
3
2
2
2
*fish & seafood
35
31
61
74
72
72
49
47
48
48
*milk
12
15
20
8
8
8
3
4
5
4
*animal fats
4
4
4
6
7
7
4
4
4
4
Protein per day (%)
Protein g/day
41.6
39.1
48.6
51.2
49.6
47.4
43.8
41.9
46.3
46.2
% from:
* cereals
29.8
30.4
30.5
30.3
29.0
31.2
33.6
28.9
31.1
32.5
* starchy roots
28.6
29.2
23.3
19.5
19.8
19.4
20.3
23.2
22.7
22.7
* pulses
2.2
1.5
1.4
1.6
1.8
1.7
1.4
1.4
1.3
1.5
* others
12.2
12.0
13.1
15.6
15.9
13.1
14.1
14.7
16.4
14.9
total vegetable
72.9
73.4
68.5
67.0
66.7
65.5
69.3
68.0
71.5
71.7
* meat & offal
10.8
10.5
9.5
8.2
8.3
8.6
12.1
12.6
10.8
10.4
* eggs
0.2
0.5
0.4
0.4
0.4
0.6
0.7
0.5
0.4
0.4
* fish & seafood
14.7
13.8
20.2
23.0
23.2
23.8
18.5
17.9
16.4
16.9
* milk
1.4
1.8
1.4
1.4
1.4
1.5
0.5
1.0
0.9
0.6
total animal
27.1
26.2
31.5
33.0
33.3
34.5
30.7
32.0
28.5
28.3
Source: FAO Food Balance Sheets 1986-88. FAO, Rome, 1991
10 IDAF Technical Report N° 58
The share of fish in total domestic food supply increased from 1% in 1961-63 to 2% in 1988-90, while the share of meat decreased from 3% to 2% respectively. On a per capita basis fish could increase its share from 3.2% to 4.1%, while the share of meat remained at 1.9% during the respective period.
Average energy supply during all these years reached 2000 to 2200 calories per person per day, covering only between 78% to 87% of the requirement (FAO 1993a). The bulk was coming from vegetable products (Table 5). The two single most important energy sources were cereals and starchy roots. These two alone were providing more than half of the total daily energy supply.
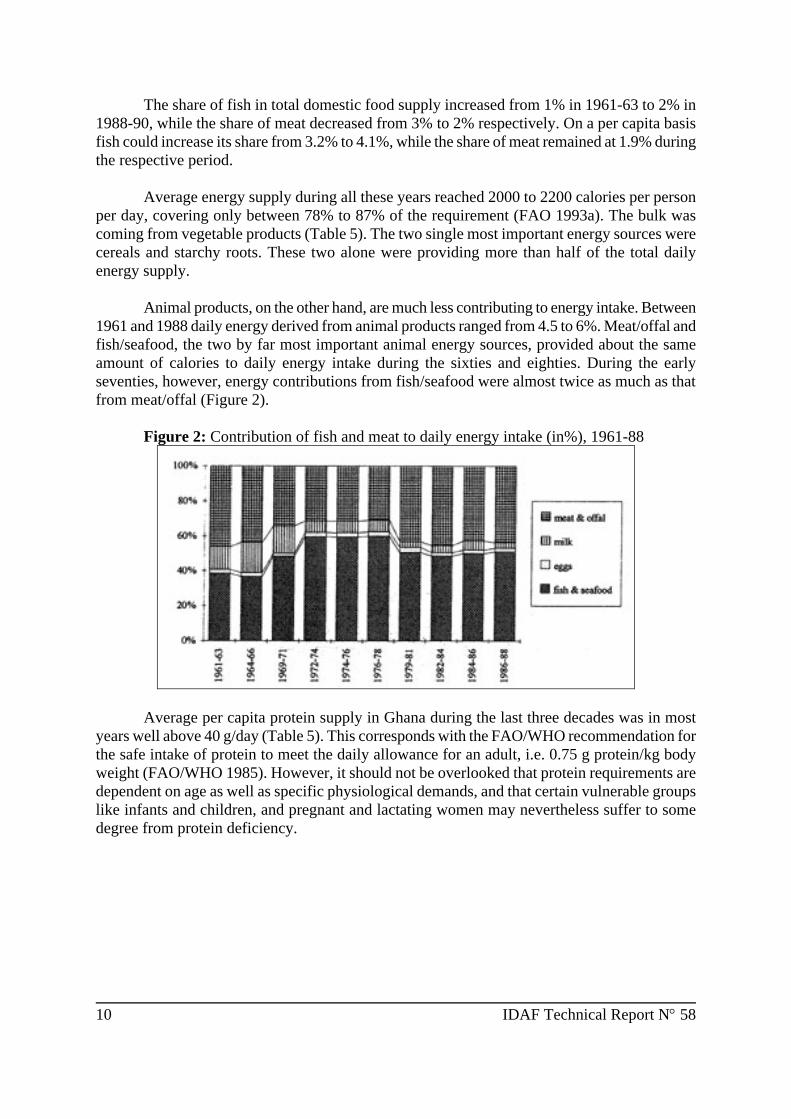
Animal products, on the other hand, are much less contributing to energy intake. Between 1961 and 1988 daily energy derived from animal products ranged from 4.5 to 6%. Meat/offal and fish/seafood, the two by far most important animal energy sources, provided about the same amount of calories to daily energy intake during the sixties and eighties. During the early seventies, however, energy contributions from fish/seafood were almost twice as much as that from meat/offal (Figure 2).
Figure 2: Contribution of fish and meat to daily energy intake (in%), 1961-88
Average per capita protein supply in Ghana during the last three decades was in most
years well above 40 g/day (Table 5). This corresponds with the FAO/WHO recommendation for the safe intake of protein to meet the daily allowance for an adult, i.e. 0.75 g protein/kg body weight (FAO/WHO 1985). However, it should not be overlooked that protein requirements are dependent on age as well as specific physiological demands, and that certain vulnerable groups like infants and children, and pregnant and lactating women may nevertheless suffer to some degree from protein deficiency.

IDAF Technical Report N° 58 11
The importance of animal products as a source of protein is much more pronounced than their role in providing energy for human consumption. As can be seen in Table 5, in Ghana about one third of protein was coming from animal sources during 1961-1988. Broken down by item it becomes evident that fish is the major supplier of animal protein (Figure 3).
Figure 3: Contribution of fish and meat to daily protein intake (in%), 1961-88
In all the years fish provided always more than half of total animal protein supply. During the peak years of supply in the early seventies its share rose up to more than two thirds. In 1990, fish contributed 64% to total animal protein intake (Laureti 1992). 4 Marketing pattern 4.1 Channels
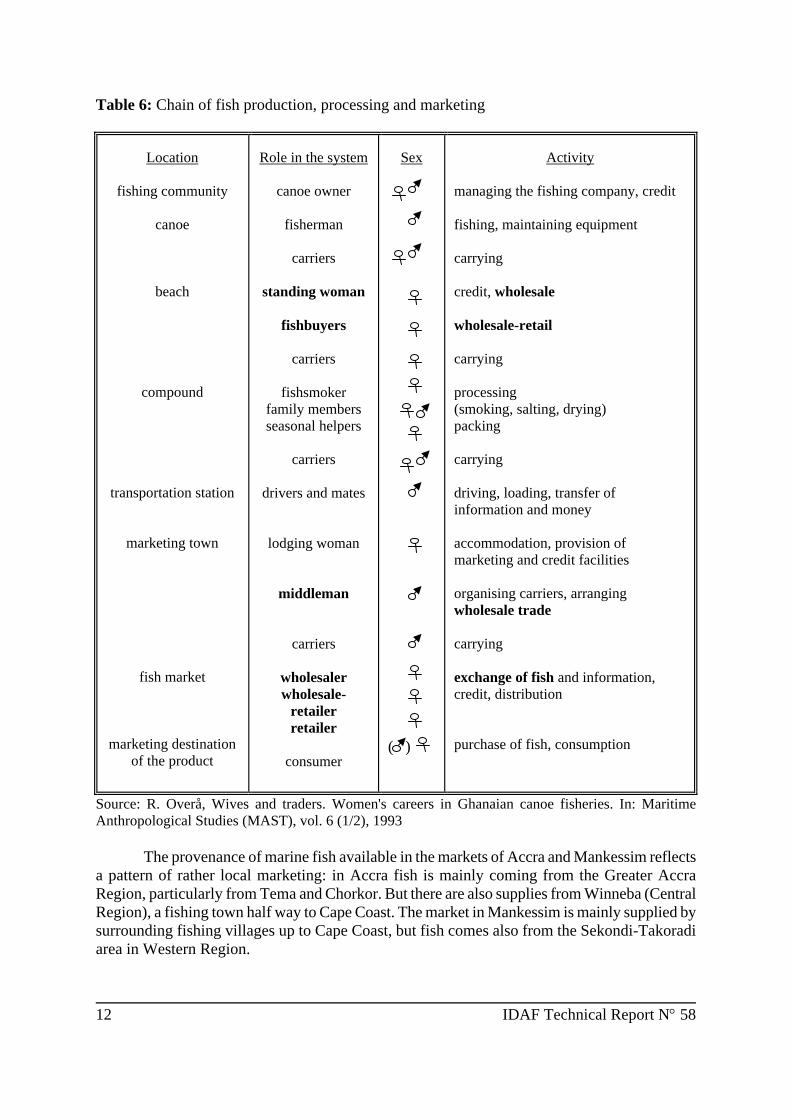
The marketing of fish in Ghana is strongly dominated by women. It starts already at the landing site where women carry fish from the boats to the beach (together with males). The wholesale-retail area is an almost exclusive female activity while males often act as middleman in market towns (Table 6).
12 IDAF Technical Report N° 58
Table 6: Chain of fish production, processing and marketing
Location
fishing community
canoe
beach
compound
transportation station
marketing town
fish market
marketing destination of the product
Role in the system
canoe owner
fisherman
carriers
standing woman
fishbuyers
carriers
fishsmoker
family members seasonal helpers
carriers
drivers and mates
lodging woman
middleman
carriers
wholesaler wholesale-
retailer retailer
consumer
Sex
( )
Activity
managing the fishing company, credit fishing, maintaining equipment carrying credit, wholesale wholesale-retail carrying processing (smoking, salting, drying) packing carrying driving, loading, transfer of information and money accommodation, provision of marketing and credit facilities organising carriers, arranging wholesale trade carrying exchange of fish and information, credit, distribution purchase of fish, consumption
Source: R. Overå, Wives and traders. Women's careers in Ghanaian canoe fisheries. In: Maritime Anthropological Studies (MAST), vol. 6 (1/2), 1993
The provenance of marine fish available in the markets of Accra and Mankessim reflects a pattern of rather local marketing: in Accra fish is mainly coming from the Greater Accra Region, particularly from Tema and Chorkor. But there are also supplies from Winneba (Central Region), a fishing town half way to Cape Coast. The market in Mankessim is mainly supplied by surrounding fishing villages up to Cape Coast, but fish comes also from the Sekondi-Takoradi area in Western Region.
IDAF Technical Report N° 58 13
Marine fish from the Ghanaian coast is distributed widely within the country as well as in the region. The Tuesday Market in Accra (Mamprobi) is well known as a regional supply centre for smoked or dried fish, mainly sardinella and anchovy. It plays a prominent role in providing its eastern neighbours Togo and Benin with this important source of animal protein (see Tettey 1993 for a detailed description of this market).
The Mankessim market is playing a comparable role in providing fish to inland areas of the country. Wholesale trading is taking place two times a week, i.e. on wednesdays and saturdays. Pick ups and lorries loaded with huge fish baskets (each of 60 kg) are going directly as far as Techiman (Brong Ahafo Region) and Beraku or Dominase (Northern Region).
With respect to meat the Accra based official slaughter house is an important source for locally produced meat for the city markets. Mankessim market is furnished by meat from Ashiaman (Tema). Imported meat is finding its way from Tema to the different markets. 4.2 Main products
During the time of the investigation a large variety of marine fish was available in the markets. Supply ranged from small pelagics like round sardinella (Sardinella aurita), flat sardinella (Sardinella maderensis), european anchovy (Engraulius encrasicolus), false scad (Decapterus rhonchus), atlantic horse mackerel (Trachurus trachurus), and chub mackerel (Scomber japonicus), to demersal species like seabream (Dentex filosus), African red snapper (Lutjanus agennes), and barracuda (Sphyranea b.). Freshwater fish available was mainly tilapia s.p.p.
Most of the fish available in the markets was processed. Sardinella, tuna, mackerels, barracuda and seabream were almost exclusively smoked, while anchovy, bigeye grunt, atlantic bumper and tilapia were found in a smoked as well as sundried/salted form. There was also some fried fish available. Species used for this type of processing were sardinella, atlantic bumper, and bigeye grunt.
Contrary to fish, the meat available in the markets was to a large extent sold fresh. Beef, mutton, goat meat, and pig feet were in supply in the two urban markets as well as in the rural one. Chicken and some local poultry were sold alive. In addition, imported canned Corned Beef was available in all markets investigated. 4.3 Prices 4.3.1 Beach prices of fish
The price of fish at the landing site depends on the volume of the catch which can change tremendously from one year to another as well as in the course of the year depending on the season, and even during the day depending on the time of the landing. At landing sites close to cold store facilities, like particularly in Tema, abundant catches can be held back to avoid drastical price drops or even to increase prices by creating an artificial shortage in supply. In rural fishing areas without access to such facilities like in the Central Region, the catch has to be

14 IDAF Technical Report N° 58
sold entirely at landing in order to avoid spoilage, even if prices fall heavily in case of a big supply.
Most recent beach prices available for 1994 dated from January. As can be seen in Figure 4 average prices for all regions in January '94 were higher than prices in January '93. Only frigate mackerel and anchovy sold at comparable prices in both months. It is also evident that prices in April, the middle of the lean season, are generally higher than those ones at the beginning of the year. This may give reason to expect that beach prices in April '94 will also be higher than one year ago. In addition, the effect of the increase in the fuel price after the removal of the fuel subsidy in January could be felt more. Fish prices at landing sites around Cape Coast, for example, apparently doubled. In Elmina a crate of round sardinella (26 kg) sold at 10 to 12000 cedis in February/March '94, compared to 5000 cedis one year ago.
Figure 4: Beach prices of selected fish species (cedis/kg), January 1994
With respect to species, anchovy is fetching the lowest price in any given months.
Seabreams like Dentex filosus, on the contrary, are on the higher price end. The high price of spanish mackerel in April '93 can be explained by the very high price this species fetched in the Greater Accra Region, i.e. in both months almost double as much as in the Central Region, probably due to a hold back of part of the catch (see above). 4.3.2 Market prices of animal food items
As in most other West African countries cured fish is traded not by weight but by amount. The most common unit for wholesale trade is the use of baskets. Smoked sardinella is sold in small to medium sized baskets. The weight of a small basket can be estimated at round 3 - 4 kg (Tettey 1993). Anchovy is traded in baskets of an estimated 10 - 12 kg. The 10 kg may rather refer to the lean season, when baskets are not filled completely. For transport to longer distances after the market transaction, however, the products are repacked to large 60 kg baskets, but even baskets of 120 - 160 kg may be used (Tettey 1993).
Another common unit in the smoked sardinella trade is to fix the price per 100 singles of average size. This unit is applied, for example, by the Ministry of Food and Agriculture in its commodity statistics.
IDAF Technical Report N° 58 15
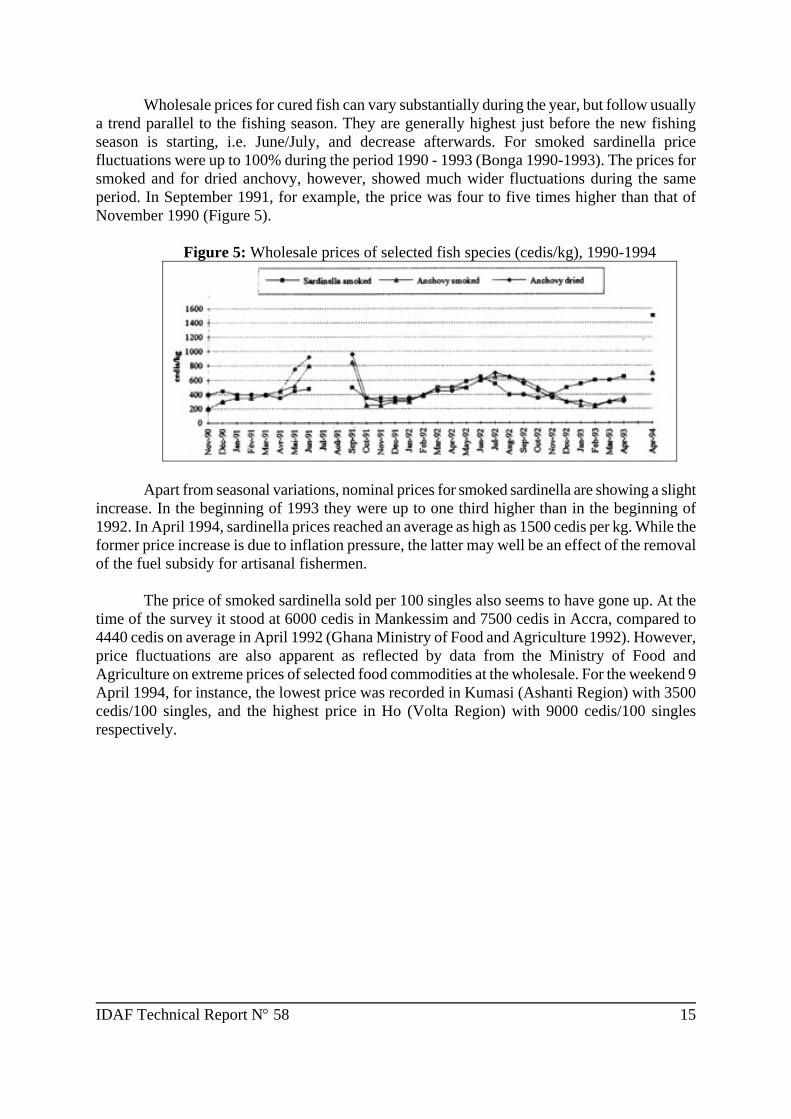
Wholesale prices for cured fish can vary substantially during the year, but follow usually a trend parallel to the fishing season. They are generally highest just before the new fishing season is starting, i.e. June/July, and decrease afterwards. For smoked sardinella price fluctuations were up to 100% during the period 1990 - 1993 (Bonga 1990-1993). The prices for smoked and for dried anchovy, however, showed much wider fluctuations during the same period. In September 1991, for example, the price was four to five times higher than that of November 1990 (Figure 5).
Figure 5: Wholesale prices of selected fish species (cedis/kg), 1990-1994
Apart from seasonal variations, nominal prices for smoked sardinella are showing a slight increase. In the beginning of 1993 they were up to one third higher than in the beginning of 1992. In April 1994, sardinella prices reached an average as high as 1500 cedis per kg. While the former price increase is due to inflation pressure, the latter may well be an effect of the removal of the fuel subsidy for artisanal fishermen.
The price of smoked sardinella sold per 100 singles also seems to have gone up. At the time of the survey it stood at 6000 cedis in Mankessim and 7500 cedis in Accra, compared to 4440 cedis on average in April 1992 (Ghana Ministry of Food and Agriculture 1992). However, price fluctuations are also apparent as reflected by data from the Ministry of Food and Agriculture on extreme prices of selected food commodities at the wholesale. For the weekend 9 April 1994, for instance, the lowest price was recorded in Kumasi (Ashanti Region) with 3500 cedis/100 singles, and the highest price in Ho (Volta Region) with 9000 cedis/100 singles respectively.

16 IDAF Technical Report N° 58
Retail prices of smoked fish in April 1994 ranged from 1660 to 2140 cedis per kg depending on the species. Surprisingly, Anchovy and Sardinella fetched higher prices per kg than mackerel and tuna (Table 7). It has to be pointed out that from the consumer's point of view of choosing to buy fish or meat in the market, smoked fish is competing with fresh rather than with smoked meat due to the common supply structure. Though one kg of smoked fish is on average almost as expensive as one kg of fresh meat, the price of one kg fresh fish equivalent is only one quarter to one third of the price for beef and goat meat and about two thirds of that for pig feet.
Prices of fish and meat differ between rural and urban areas. While fish shows a tendency to sell at higher prices in urban markets the contrary holds true for meat (Table 8). Higher fish prices in Accra may be explained by higher demand (Tuesday market as a regional supply centre) and higher purchasing power. Meat, on the other hand, is easily available in Accra supplied by the Accra slaughterhouse, whereas most of the meat available in the Mankessim market is coming from Tema. Hence, transportation costs are adding to the price of meat making it more expensive in Mankessim. Table 8: Rural - urban price differences, April 1994
Price in cedis per unit
Mankessim (rural)
Accra (urban) Fish
Sardinella, smoked
5000/medium basket
6-7000/medium basket Sardinella, smoked
8000/100 singles
9000/100 singles
Anchovy, smoked
5000/medium basket
7000/medium basket Bumper juv., smoked
2000/small basket
2500-3500/small basket
Meat
Beef, boneless
2400/kg
1700/kg
Beef, with bones
1800-2000/kg
1600/kg Corned Beef, canned
1400/340 g tin
1300/340 g tin
Table 7: Average retail prices of fish and meat, April 1994
Cedis per kg
cured
fresh
(equiv.) Fish
Sardinella, smoked
1870
(623)
Mackerel, smoked
1670
(557)
Tuna, smoked
1660
(553)
Anchovy, smoked
2140
(713)
Anchovy, dried
1760
(587)
Meat
Beef
2000*
2200 Goat meat
na
2000
Pig feet
na
1000 Mutton
2000*
na

IDAF Technical Report N° 58 17
4.3.3 The cost of protein
For consumers, particularly those belonging to the lower income groups, it is important/vital to make the best possible use of their money, i.e. to get the highest nutritional value in terms of energy, protein and nutrients at the lowest cost. For protein the cost indices for major food items have been calculated based on retail prices in the markets in April '94. As can be seen from Table 9, small pelagics (here: sardinella) are indeed the cheapest source of animal protein in Ghanaian markets. Table 9: Protein cost indices for major food items
Protein Cost
Protein cost Product
Price
Protein content
Index (PCI)
equivalent to fish
cedis/kg
%
g/kg
cedis/100g
(smoked sardinella)
Fish
Sardinella, smoked
1870
63
630
297
1.0
Sardinella, fresh
623
18
180
346
1.2 Seabream, fresh
1800
18
180
1000
3.4
Meat
Beef, fresh
1700 - 2400
19
190
895 - 1263
3.0 - 4.3
Pig feet, fresh
1000
12
120
833
2.8 Goat meat, fresh
950
17
170
559
1.9
Other animal
Milk, powder
2150
26
260
827
2.8
Eggs
1340
13
130
1031
3.5 Vegetable
Beans, dried
400
22
220
182
0.6 Groundnuts, dried
550
26
260
212
0.7
The best economical bargain is fish in its smoked form. For 100 g of protein from smoked sardinella the consumer has to pay only half the price for the cheapest meat source, namely goat meat. The protein from beef is the most expensive alternative particularly in the rural setting. There, protein from beef costs more than four times as much as that from smoked small pelagics. But it is evident as well that fish is not just fish and that the PCI can vary substantially with respect to species and its value. Seabream, for instance, a high value species has a PCI which is comparable to that of beef.
For comparative reasons the table is also showing the PCIs for two protein-rich vegetable sources, i.e. beans and groundnuts. Though they come out best in economic terms it has to be kept in mind that vegetable protein generally does not show the well-balanced mix of all amino acids necessary for optimum utilization by the human body as does animal protein. Hence, a proper combination of different vegetable protein sources is usually required.
18 IDAF Technical Report N° 58
In order to relate the recommended daily protein intake with the cost of protein from fish, the average Ghanaian adult consumer could buy the recommended 40 g of protein entirely from smoked small pelagics for about 120 cedis. 5 Consumer's choice: fish vs. meat 5.1 General dietary pattern
The composition of the traditional diet in Ghana varies along ecological zones depending mainly on locally grown crops. In the northern savannah zone cereals like maize, sorghum and rice constitute the basis of the dishes, supplemented by beans, groundnuts and various vegetables. In the forest belt starchy staples like cassava, yams and cocoyams as well as plantains dominate, supplemented usually by green leafy vegetables. In the coastal zone the main staples comprise particularly maize and cassava.
Animal protein in the Ghanaian diet is mostly coming from fish. Ghana is well known as a fish eating nation, and (smoked) fish can be found in nearly all villages throughout the country. Supply is however best and, hence, consumption highest in areas close to production centres along the coast and around Lake Volta. In areas far away from fishery resources the effective distribution of fish and fish products is hampered by poor infrastructure. People along the coast generally prefer hot smoked fish because of its succulent nature and high fat content. The vicinity to the fish processing centres guarantees easy access to this highly perishable product with a shelf life of only 2 to 3 days. The population up-country, on the other hand, rather prefers smoke-dried fish with a shelf life of up to 9 months for reasons of better storage (INFOPECHE 1990).
Meat is generally more available in urban areas but also in rural northern Ghana in those areas with animal husbandry or access to game. However, small ruminants like goats and sheep kept in the villages are usually sold alive, but not slaughtered and marketed piece by piece.
There is some evidence that certain beliefs regarding the consumption of food of animal origin may exist in some of the Ghanaian societies. Such beliefs, where existing, are often applied to pregnant or lactating women and to children, i.e. to those groups of the population most in need of high quality food. Children, for instance, are believed to become thieves if they are given regularly meat, fish, or eggs. Fish, in addition, is believed to cause diarrhoea or to make children's stomachs big. In areas further away from fishery resources families may also try to avoid that the children are getting used to eating fish too often or too much as there may be shortages in supply. This pattern of beliefs is, however, not prevalent over the entire country. To the contrary, health workers encourage the use of fish powder in certain areas to complement the diet of breastfed infants (FAO-ESN 1989, Ghana Ministry of Health 1992).
IDAF Technical Report N° 58 19
5.2 Consumer preferences
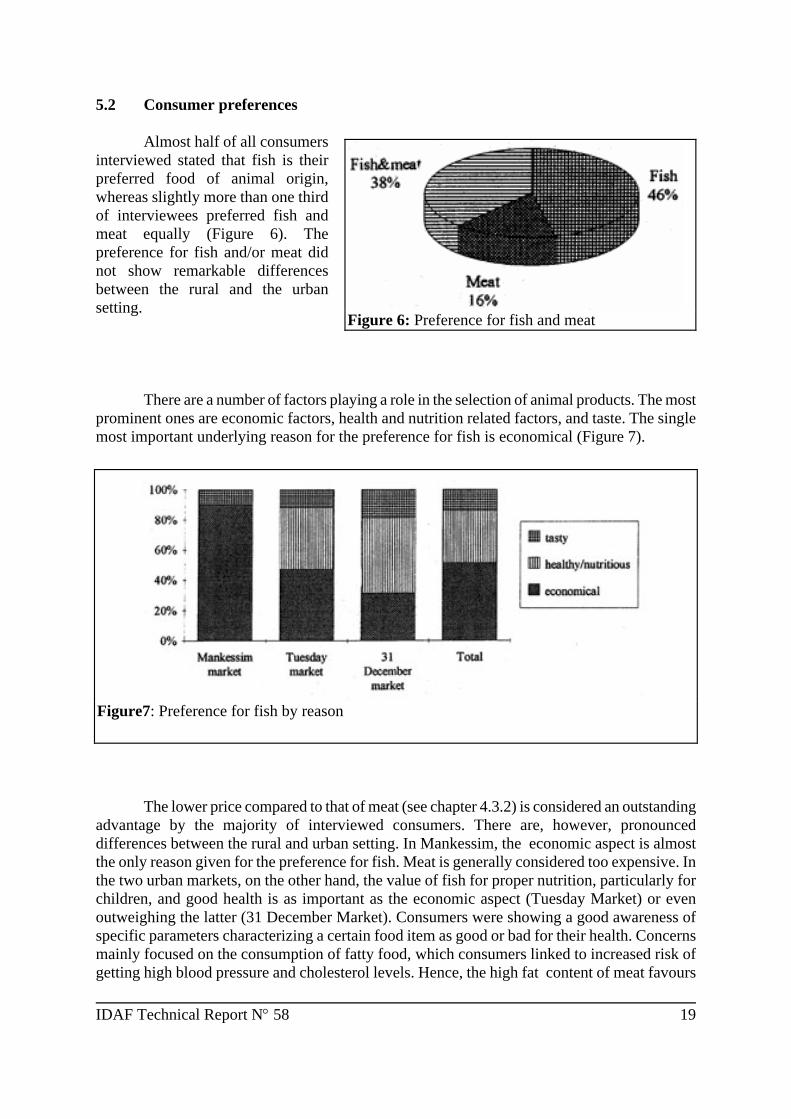
Almost half of all consumers interviewed stated that fish is their preferred food of animal origin, whereas slightly more than one third of interviewees preferred fish and meat equally (Figure 6). The preference for fish and/or meat did not show remarkable differences between the rural and the urban setting.
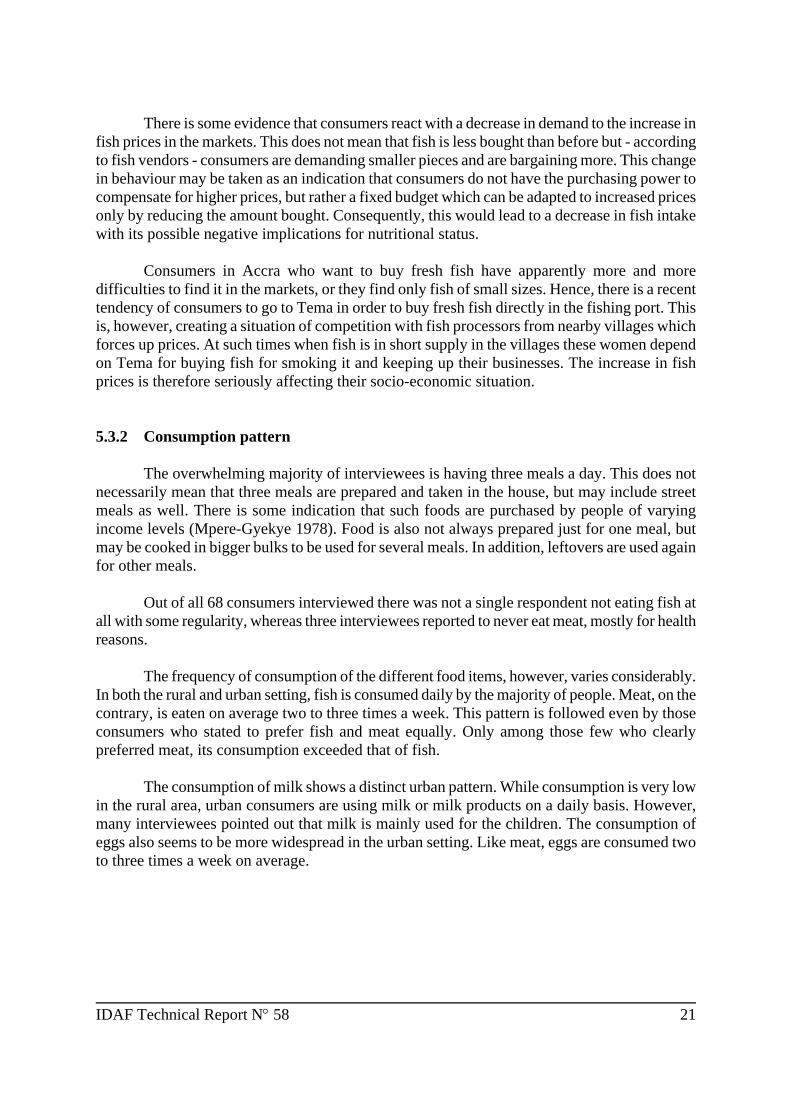
There are a number of factors playing a role in the selection of animal products. The most prominent ones are economic factors, health and nutrition related factors, and taste. The single most important underlying reason for the preference for fish is economical (Figure 7).
The lower price compared to that of meat (see chapter 4.3.2) is considered an outstanding
advantage by the majority of interviewed consumers. There are, however, pronounced differences between the rural and urban setting. In Mankessim, the economic aspect is almost the only reason given for the preference for fish. Meat is generally considered too expensive. In the two urban markets, on the other hand, the value of fish for proper nutrition, particularly for children, and good health is as important as the economic aspect (Tuesday Market) or even outweighing the latter (31 December Market). Consumers were showing a good awareness of specific parameters characterizing a certain food item as good or bad for their health. Concerns mainly focused on the consumption of fatty food, which consumers linked to increased risk of getting high blood pressure and cholesterol levels. Hence, the high fat content of meat favours
Figure 6: Preference for fish and meat
Figure7: Preference for fish by reason

20 IDAF Technical Report N° 58
the preference for fish in this context. While taste is playing only a minor role in the preference for fish, it is the most important reason among those preferring meat.
Despite the wide supply of different fish species in the markets the preference for fish is concentrated on mainly six species, namely anchovy, sardinella, tilapia, sea-bream, tuna and mackerel. The latter three species are by far the most favourite ones (Figure 8). Remarkable is the high preference, even in the rural setting, for seabream, which is one of the more expensive species in the markets. A possible explanation is that seabream, which is usually hot-smoked, looks better and is more tasty than other species. So far, the preference for a certain species was the most important factor influencing the selection of fish, followed by costs (Sefa-Dedeh and Nketsia-Tabiri 1993). There is some evidence though that this pattern of choice is undergoing changes. The cost factor is gaining more and more importance for the choice which fish to buy. The example of the high preference for seabream illustrates that "preference" as stated in this context does not necessarily reflect actual behaviour regarding the purchase of fish. Particularly in the rural area most people do not have the purchasing power to buy higher value species even though they may favour them for reasons other than economical.
Regarding the selection of meat most consumers in the urban area were showing a clear favour for beef. In the rural setting, on the other hand, choice was more equally distributed among beef, pig feet, and goat meat. This may well reflect economic considerations of consumers, since pig feet and goat meat were only about half the price of beef. 5.3 Consumer behaviour and consumption pattern 5.3.1 Food purchases
In both rural and urban settings the market is the main food source for the majority of interviewees. Though in Mankessim, the rural area, food items like staples and vegetables are often grown on the farm or in backyard gardens, the market remains important for a number of people. Also for fish the market is the primary source of purchase. Only very few interviewees mentioned the landing sites as their points of purchase.
Among the total of 68 interviewed consumers 82% had bought fish and 49% had bought meat on the respective days of interviewing. In Mankessim two thirds of the consumers had purchased smoked sardinella. In the two urban markets, on the other hand, sardinella hardly played a role, but smoked mackerel, smoked tuna, and -in the 31 December Market- smoked seabream were the favourite species bought. However, in many cases consumers had bought more than one species.
Figure 8: Preference for fish
IDAF Technical Report N° 58 21
There is some evidence that consumers react with a decrease in demand to the increase in
fish prices in the markets. This does not mean that fish is less bought than before but - according to fish vendors - consumers are demanding smaller pieces and are bargaining more. This change in behaviour may be taken as an indication that consumers do not have the purchasing power to compensate for higher prices, but rather a fixed budget which can be adapted to increased prices only by reducing the amount bought. Consequently, this would lead to a decrease in fish intake with its possible negative implications for nutritional status.
Consumers in Accra who want to buy fresh fish have apparently more and more difficulties to find it in the markets, or they find only fish of small sizes. Hence, there is a recent tendency of consumers to go to Tema in order to buy fresh fish directly in the fishing port. This is, however, creating a situation of competition with fish processors from nearby villages which forces up prices. At such times when fish is in short supply in the villages these women depend on Tema for buying fish for smoking it and keeping up their businesses. The increase in fish prices is therefore seriously affecting their socio-economic situation. 5.3.2 Consumption pattern
The overwhelming majority of interviewees is having three meals a day. This does not necessarily mean that three meals are prepared and taken in the house, but may include street meals as well. There is some indication that such foods are purchased by people of varying income levels (Mpere-Gyekye 1978). Food is also not always prepared just for one meal, but may be cooked in bigger bulks to be used for several meals. In addition, leftovers are used again for other meals.
Out of all 68 consumers interviewed there was not a single respondent not eating fish at all with some regularity, whereas three interviewees reported to never eat meat, mostly for health reasons.
The frequency of consumption of the different food items, however, varies considerably. In both the rural and urban setting, fish is consumed daily by the majority of people. Meat, on the contrary, is eaten on average two to three times a week. This pattern is followed even by those consumers who stated to prefer fish and meat equally. Only among those few who clearly preferred meat, its consumption exceeded that of fish.
The consumption of milk shows a distinct urban pattern. While consumption is very low in the rural area, urban consumers are using milk or milk products on a daily basis. However, many interviewees pointed out that milk is mainly used for the children. The consumption of eggs also seems to be more widespread in the urban setting. Like meat, eggs are consumed two to three times a week on average.

22 IDAF Technical Report N° 58
6 Concluding remarks
Per capita fish consumption in Ghana is among the highest in the West African region. Fish is mainly consumed in a hot-smoked or smoke-dried form and contributes about 64% to total animal protein intake. A major reason for the widespread popularity of fish particularly in rural areas is its relative cheapness compared to meat and other sources of animal protein. For higher income groups in urban areas the preference for fish vs. meat is also based on nutrition and health-related considerations. Many of these consumers are aware of the nutritional advantages of fish compared to meat, above all its lower fat content, and the resulting positive implications for their health. For them the relative cost advantage of fish is playing only a secondary role in the decision to buy fish or meat.
The cost advantage of fish however is dependent on species. With a given budget the consumer can buy up to four times as much protein from smoked small pelagics like sardinella, mackerel or tuna than from beef, for example. Such cheap small pelagics form not only the bulk of the supply in rural areas, but can be found in substantial amounts as well in urban markets. Hence, poor urban dwellers also have principally access to a cheap source of animal protein. Higher value species like seabream, on the contrary, have a protein cost index comparable to that of meat.
The study findings indicate that the price of a product is playing a more and more prominent role in the selection of the animal food source. This holds not only true for the choice between fish or meat, but for the choice within each product group as well. Particularly in the rural area consumers buy the cheaper species or type of meat even though they may prefer the more expensive ones for reasons of better taste and the like. This clearly indicates that there is a difference between what people may want and what they can actually afford.
The study findings further reveal that the most recent price increases apparently threaten consumer budgets. Consumers react by buying smaller amounts and bargain more for a good price. The latter affects in particular fish vendors. Their product is not sold by weight but by single, piece, or other weight-independent units, leaving much room for the consumer to bargain for the biggest possible unit at the lowest agreeable price. Meat, on the contrary, is usually sold by weight at more or less fixed prices. The bargaining power of consumers however is finding its limit where the price of a product is coming close to its cost of production. It has to be kept in mind here that those consumers who were willing to participate in the interviews were the generally better educated ones and can, hence, be considered to be economically better off as well. If this group is feeling the economic pressure brought about by higher consumer prices already as described above, the situation of the low income groups can be expected to be much worse.
The implications of the study for the future role of fish in the Ghanaian diet differ by income group. Consumer from higher income strata with the necessary purchasing power may increasingly switch from fish to meat should fish prices further rise and eventually approximate to those of meat. This tendency may reveal inevitably for those consumers who already prefer fish and meat equally, but currently still rather buy fish because it is cheaper. This trend could perhaps be halted by encouraging and strengthening efforts of consumer education emphasizing the nutritional value of fish.
IDAF Technical Report N° 58 23
For lower income groups, on the other side, even fish as the cheapest source of animal protein currently available in the markets may indeed become less and less affordable. Adaptation alternatives of poor households to decreasing purchasing power are quite limited. One household strategy, which actually seems to be followed already, is to reduce the purchase of fish in terms of quantity, quality and frequency. But the resulting reduced intake of fish is further deteriorating the nutritional situation of just that group of the population which is already under severe nutritional stress and seriously exposed to the risks of protein-energy malnutrition. The other alternative for poor households is to compensate losses in animal protein intake by increased use of high value vegetable protein sources like pulses, for instance. In this context, a wider use of wing beans may present a practicable way. Apart from processing problems, however, strong efforts of consumer education would be necessary in order to promote the most efficient use of vegetable protein sources.
The rapid growth of the Ghanaian population which is expected to continue for the years to come is challenging the food supply situation substantially. Increased efforts at the national level are inevitable to meet the nutritional requirements. The challenge is not only to maintain current levels of consumption but - in view of the existing prevalence of malnutrition - to rather increase it in order to improve overall nutritional status. Consequently, the supply and use of - among others - animal protein sources has to be improved. Potential strategies comprise (i) incentives to increase domestic production where possible, or to maintain it in a sustainable way; (ii) increasing food imports; (iii) reducing post-harvest losses; (iv) increasing the purchasing power particularly of lower income groups; and (v) strengthening consumer education.
24 IDAF Technical Report N° 58
REFERENCES EIU (1994) Country Profile Ghana 1993/94. The Economic Intelligence Union. FAO (1990) Yearbook Trade vol. 43, 1989. FAO Statistics Series No 96, Rome. FAO (1991) Food Balance Sheets 1986 - 88. Rome. FAO (1992) Yearbook Fisheries Statistics Commodities vol. 71, 1990. FAO Fisheries Series No 39/Statistics Series No 108. Rome. FAO (1993a) Food - Health - Better Life. Summary of country papers prepared for the Interna-
tional Conference on Nutrition, Africa Region, Anglophone Countries. FAO Regional Office for Africa, Accra/Ghana.
FAO (1993b) Yearbook Trade vol. 46, 1992. FAO Statistics Series No 115, Rome. FAO (1994) Report of the study on Exploitation and use of small pelagic species in Western Africa. (Draft) FIPP Regular Programme Activity. FAO - ESN (1989) Nutrition Country Profile Ghana. FAO, Rome. Ghana Ministry of Food and Agriculture (1992) Wholesale fish prices in Ghana Nov. 1991
to Oct. 1992. Data set. Policy Planning, Monitoring and Evaluation Department. Ghana Ministry of Health (1992) Health, Food, Better Life. International Conference on Nutrition. Country Paper Ghana. Ghana Statistical Service (1993) Rural communities in Ghana. Report of a national rural
community survey carried out as part of the third round of the Ghana Living Standards Survey 1991/92.
Gulbrandsen, O. (1991) Canoes in Ghana. Cotonou, Programme for the Integrated
Development of Artisanal Fisheries in West Africa, 82 p., IDAF/WP/37. IFAD (1992) Food Security Profile. IFAD, Rome. INFOPECHE (1990) Marketing of artisanal fish products. FAO-INFOPECHE, Abidjan/Côte d'Ivoire. INFOPECHE (1990-1993) Bonga. Monthly bulletin on the marketing of artisanal fish products in West Africa. FAO-INFOPECHE, Abidjan/Côte d'Ivoire. Impere-Gyeke, P. (1978) The nutritional importance of "street food" in Central Accra. Bsc.
Dissertation, University of Ghana, Legon.
IDAF Technical Report N° 58 25
Overå, R. (1993) Wives and traders. Women's careers in Ghanaian fisheries. In: Maritime Anthropological Studies (MAST), vol. 6 (1/2) 1993. Sefa-Dedeh, S. and J. Nketsia-Tabiri (1993) Post-production issues and aquaculture develop-
ment in Ghana. Paper presented at the IAB/ICLARM/UH Workshop on Genetic Resources of Ghana and Options for the Future Development of Aquaculture in Ghana. Institute of Aquatic Biology, Accra, March 11-13, 1993.
Seki, E. and A. Bonzon (1993) Selected aspects of African fisheries: a continental overview. FAO Fisheries Circular No. 810 Revision 1. FAO, Rome. Tettey, E.O. (1993) West African markets for small pelagics. Paper presented at the Scientific
Meeting on Sardinellas: Dynamics and uses of sardinella resources from upwelling off Ghana & Côte d'Ivoire (DUSRU). Accra/Ghana, 5-8 October 1993.
Tettey, E.O. and K.A. Koranteng (1993) Sardinella market trends in the West African sub-
region. Paper presented at the Scientific Meeting on Sardinellas: Dynamics and uses of sardinella resources from upwelling off Ghana & Côte d'Ivoire (DUSRU). Accra/Ghana, 5-8 October 1993.
UNDP (1993) Human Development Report. Oxford Press. UNICEF (1990) Children and women in Ghana: A situational analysis. WHO (1985) Energy and Protein Requirements. Technical Report Series 724. Geneva. World Bank (1990) World Development Report. Oxford Press. World Bank (1993) World Development Report. Oxford Press. World Bank (1994) World Development Report. Oxford Press.

ANNEX 1
MARKETING SURVEY QUESTIONNAIRE
City/Village:_____________________ Market:_______________________ Date:___________________________ Name of interviewer:_______________ Name of salesperson:________________________________ Commodity: _______________________________________
Price Cedis/weight unit Cedis/kg
Product/Species Provenance
wholesale consumer wholesale consumer

Which product/species do you sell best?______________________________________ _________________________________________________________________________________________________________________________________________________________________________________________________________________________________ Have you realised any changes in consumer behaviour during the last months? (please explain) ____________________________________________________________________________________________________________________________________________________________________________________________________________________________________________________________________________________________________________

CONSUMER SURVEY QUESTIONNAIRE
City/Village:_____________________ Market:_______________________ Date:___________________________ Name of interviewer:_______________ Name of respondent: _________________________________________________________ Sex:________________________________________________________________________ Total number of persons in the household: _________________________________________ Occupation of respondent:_____________________________________________________ Occupation of household head:__________________________________________________ Main source of income: ________________________________________________________ What are your food sources (market, home production, donation from relatives/friends, etc?) Please specify the food and respective source ______________________________________ ____________________________________________________________________________________________________________________________________________________________________________________________________________________________________________________________________________________________________________ Food preferences What are the preferd food items of you and your family and why? (please explain) _________________________________________________________________ __________________________________________________________________________________________________________________________________________________________________________________________________________________________________________________________________________________________________________________________________________________________________________________________________________________________________________________________________ How many meals do you and your family take during the day? _________________________ _________________________________________________________________________________________________________________________________________________________________________________________________________________________________ How often (per day, week or month) do you and your family eat the following food items? Fish _______________________________________________________________________ Meat/meat products ___________________________________________________________ Eggs _______________________________________________________________________ Milk/milk products ___________________________________________________________ Pulses _____________________________________________________________________ Roots/tubers ________________________________________________________________ Others _____________________________________________________________________

Which product/species do you sell best? _______________________________________ _________________________________________________________________________________________________________________________________________________________________________________________________________________________________ Have you realised any changes in consumer behaviour during the last months? (please explain) __________________________________________________________________ ____________________________________________________________________________________________________________________________________________________________________________________________________________________________________________________________________________________________________________
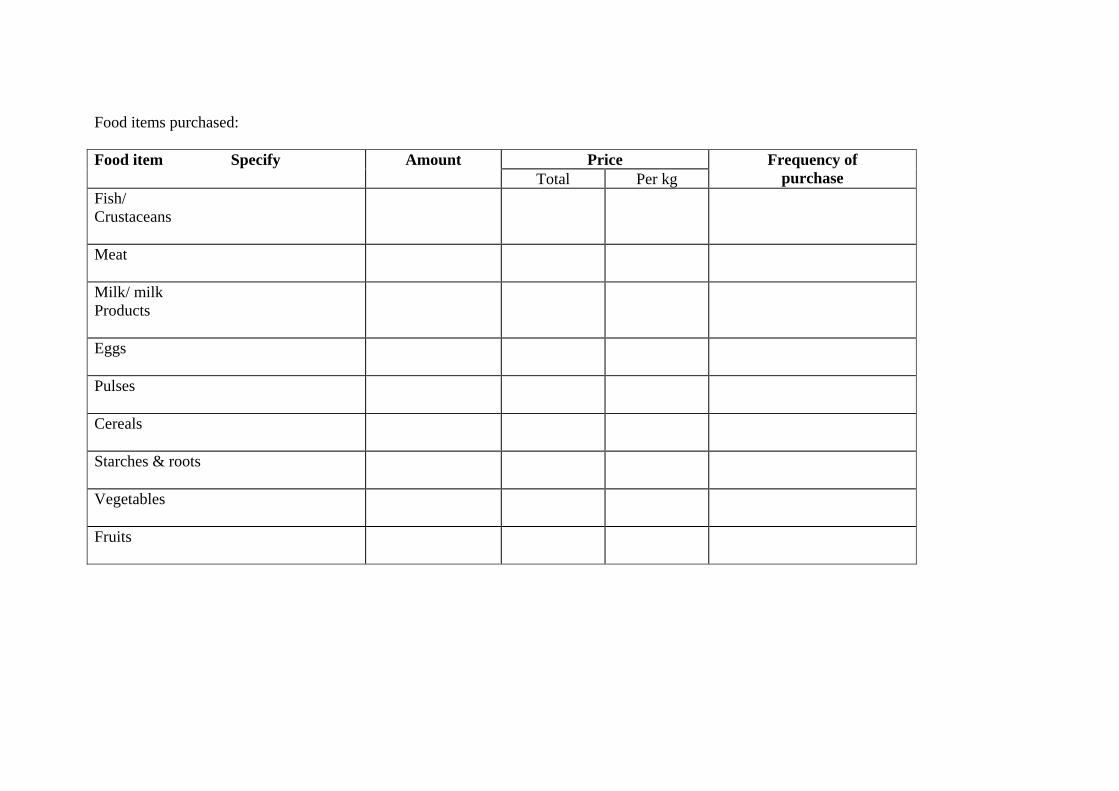
Food items purchased:
Price Food item Specify Amount Total Per kg
Frequency of purchase
Fish/ Crustaceans
Meat
Milk/ milk Products
Eggs
Pulses
Cereals
Starches & roots
Vegetables
Fruits