technical report internal reference no.: tt17/182 date … report...heatsaver wall underliner...
TRANSCRIPT

Technical Report Internal Reference No.: TT17/182 Date of Issue: 12 July 2017 Page 1 of 14
UKAS Testing No. 1660, Thermal Measurement Laboratory, University of Salford
________________________________________________________________________________
________________________________________________________________________________
This report may not be reproduced other than in full, except with the prior written approval of the issuing laboratory.
This is not a UKAS report and we are not a UKAS accredited for the calculations detailed. However, the Thermal
Measurement Laboratory is a UKAS accredited laboratory for the measurement of thermal resistance to EN 12664 / 12667
and ISO 8301 / 8302.
Thermal Measurement Laboratory
School of Computing, Science & Engineering
Newton Building, University of Salford
Salford, M5 4WT, England.
Tel: 0161 295 5172 or 3114
E-mail: [email protected] i.g.rattigan@salford .ac.uk
Dr.A.Simpson, Head of Laboratory I.G.Rattigan, Quality Manager
_______________________________________________________________________________
Assessment of Relative Risk of Mould Growth on Warmcoat Anti Condensation Coating in
Dwellings
1. Client Pure Efficiency Ltd, Suite 12, Princes Court, Silver Street, Ramsbottom, BL0 9ND.
2. Introduction and Client Requirement
The client intends to market a surface coating product known as Warmcoat anti condensation coating,
designed to reduce the incidence of mould growth in a building. It claims to achieve this by raising the
surface temperature of a wall/ceiling, keeping the treated surfaces warmer for longer than for ordinary
emulsion paint.
The purpose of the project is to test this claim, by measuring surface temperatures and assessing the
relative effectiveness of reducing vulnerability to mould growth over a realistic range of indoor relative
humidity. The client requires that Warmcoat is assessed against 1) standard Emulsion paint, and 2)
Heatsaver wall underliner (including an emulsion painted liner paper). The client has also requested
an assessment of the relative performance of Warmcoat to Heatsaver in combating mould growth.
A temperature cycle test to simulate intermittent heating in dwellings under winter conditions has been
applied to determine the surface temperatures for the three coatings on 12mm plasterboard in a poorly
insulated test configuration. The 24 hour air temperature cycle consisted of 19oC for 17 hours and 14oC
for 7 hours, whilst maintaining the cold face at 4oC. A high-risk example of an external building
element such as an uninsulated plastered double brick wall having a typical U value of 2 W/m2K, has
been simulated.
Moulds do not require the presence of water, but can germinate and grow if the RH at a surface rises
above a critical point. The results of the physical test have been used to predict the relative risk of
mould growth at indoor relative humidity values up to 70% RH, assuming a critical mould point of
80% RH.
An assessment of potential thermal comfort improvements using Warmcoat coatings has also been
included.

Technical Report Internal Reference No.: TT17/182 Date of Issue: 12 July 2017 Page 2 of 14
UKAS Testing No. 1660, Thermal Measurement Laboratory, University of Salford
________________________________________________________________________________
________________________________________________________________________________
This report may not be reproduced other than in full, except with the prior written approval of the issuing laboratory.
This is not a UKAS report and we are not a UKAS accredited for the calculations detailed. However, the Thermal
Measurement Laboratory is a UKAS accredited laboratory for the measurement of thermal resistance to EN 12664 / 12667
and ISO 8301 / 8302.
3. Project Background
The literature on mould and environmental conditions in buildings located in UK climates has been
reviewed in order to develop the test criteria and a model for mould growth and RH dependence.
3.1 Incidence of Mould Growth
Mould growth problems are widespread in all housing sectors, especially in low income, hard-to-heat,
hard-to-treat and tenanted properties. The English House Condition Survey of 1981 estimated that 15%
of the dwellings in England were affected by mould or damage to decorations(1). In 1992 approximately
2.5 million UK residences (250,000 in Scotland) were estimated to be affected (2). The English House
Condition Survey 1996 reported 14.6% of the total English stock to have mould growth (3). BS 5250 (4) stated that “condensation and mould problems are widespread, affecting about 15 % of homes in
the United Kingdom to some degree”. A study in 2003 of over 3,000 low income dwellings in English
urban areas by the Warm Front Study Group (5) showed an even higher proportion of mould at between
17.1% and 22.5%.
High surface RH conditions on the internal surfaces of building elements is an important cause of
mould growth. The surface RH is affected by the thermal insulating properties of the building fabric,
heating, ventilation, moisture sources and the use of the dwelling. It increases when warm moist air is
in contact with a cold surface. Condensation occurs when the surface is below the dewpoint
temperature. Sometimes localised cold spots on surfaces occur due to cold bridging members.
Householders may not be aware of high RH or even condensation on the surfaces of building elements,
particularly if it is mild and intermittent. Once mould growth becomes visible it can result in
deterioration of decorations, a musty smell and possible health hazards.
BRE guidance (1) suggests that mould growth will be sustained if the indoor relative humidity is
maintained above 70%. The nature of the surface, especially the extent to which it can absorb and
retain water, and whether it provides particular nourishment, can be very important in initiating and
supporting mould growth. Public Health England (6) state “Relative humidity above 60% has been
linked to respiratory and allergic conditions, as well as fungal growth and house dust mite infestations”.
Internal surfaces of external building elements will be colder than the air temperature within the
building in winter, and the RH at the internal surface will be higher than in the centre of a room. The
temperature and relative humidity differences will be reduced if the walls are well insulated. BS 5250 (4) guidance suggests that if the average relative humidity within a room stays at 70 % for a long period
of time, the relative humidity at the external wall surfaces will be high enough to support the growth
of moulds.
3.2 Mould Growth Limits
Moulds do not require the presence of water, but can germinate and grow if the RH at a surface rises
above a critical point.
The speed of mould development over a range of surface RH was determined from a series of tests
carried out in in a Scottish Homes research programme (2). It took only 2 days for mould growth to
appear on the 98.9% RH plates, 7 days for growth to appear at 94.5% RH, 16 days for growth at 88.5%,

Technical Report Internal Reference No.: TT17/182 Date of Issue: 12 July 2017 Page 3 of 14
UKAS Testing No. 1660, Thermal Measurement Laboratory, University of Salford
________________________________________________________________________________
________________________________________________________________________________
This report may not be reproduced other than in full, except with the prior written approval of the issuing laboratory.
This is not a UKAS report and we are not a UKAS accredited for the calculations detailed. However, the Thermal
Measurement Laboratory is a UKAS accredited laboratory for the measurement of thermal resistance to EN 12664 / 12667
and ISO 8301 / 8302.
RH, 20 days for growth at 85.5% RH, 58 days for growth at 81% RH and 97 days for growth at 78.5%
RH. No mould development occurred at a RH value lower than 78.5% over a 120 day incubation
period. A literature survey of other investigators, by the Scottish Homes report, concluded that each
mould type has separate RH and temperature requirements for germination under the right surface
conditions.
Other research (7) has shown that a surface surrounded by and at equilibrium with a surface RH greater
than 80% for a prolonged period (a month or longer) is adequate to cause germination and allow mould
to grow on most common building surface materials, such as emulsion-coated plaster or wallpaper.
National, European and International standards BS 5250 (4) and BS EN ISO 13788 (10) recommend that
to avoid mould growth the monthly mean relative humidity at the surface should not exceed a critical
relative humidity of 80%.
Guidance from Building Regulations Approved Document ADF1 2010 (8) indicate somewhat more
onerous surface RH limits for no mould on external walls during the heating season. For all dwellings
(existing and new) the moisture criterion is likely to be met if the moving average surface water activity
of the internal surfaces of external walls is less than the 75% RH for 1 month, 85% RH for 1 week or
95% RH for 1 day.
For the purposes of this assessment a critical surface relative humidity (mould point) of 80% RH has
been applied.
The internal surfaces of poorly insulated external building elements exposed to winter conditions are
particularly vulnerable to high surface RH values, and possibly surface condensation. A worst-case
scenario say of uninsulated external walls of U value 2 W/m2 K, such as plastered double brick walls
in older terrace type housing, pose a considerably greater risk than do walls meeting the current
requirement of 0.16 W/m2K for new build walls. Low insulation levels increase the risk of surfaces
falling near to or even below dew point temperatures, resulting in mould or even condensation on the
surfaces.
3.3 Internal Climatic Data
The Warm Front Study Group (5) provided one of the most comprehensive sets of dwelling-related
humidity and mould data for low income English homes in urban areas. The results for relative
humidity provided valuable insights into the dwelling and household conditions and the characteristics
that determine mould risk. The evidence of their analysis was that there is a clear gradient of increasing
risk of mould growth with increasing indoor air RH values. The survey of living rooms in more than
3,000 dwellings, over the winters of 2001-2 and 2002-3, was based on the daytime hours of 8 a.m. to
8 p.m, during the heating period. The median standardised living room RH was 42.8%, with 90% of
the dwellings being between 32.3% and 59.8%. The median standardised living room temperature was
19.1°C, with 90% of the dwellings between 13.5 to 23.0°C.
The Welsh School of Architecture (9) carried out a household monitoring study of 99 dwellings in
Wales, in the heating season of 2013-14. The internal conditions were monitored in hard-to-heat, hard-
to-treat houses during the winter. It was found that 87% of spot-measured RH values were 40 to 60%,
and 77% of the spot-measured indoor air temperatures were in the range 16 to 22oC.

Technical Report Internal Reference No.: TT17/182 Date of Issue: 12 July 2017 Page 4 of 14
UKAS Testing No. 1660, Thermal Measurement Laboratory, University of Salford
________________________________________________________________________________
________________________________________________________________________________
This report may not be reproduced other than in full, except with the prior written approval of the issuing laboratory.
This is not a UKAS report and we are not a UKAS accredited for the calculations detailed. However, the Thermal
Measurement Laboratory is a UKAS accredited laboratory for the measurement of thermal resistance to EN 12664 / 12667
and ISO 8301 / 8302.
On average households had a daily weighted amount of indoor air temperatures < 16oC of 7oC.Hours,
the maximum length of sub-standard internal conditions in the night being 7 hours (11pm – 6am). This
suggests household temperatures being an average 1oC less than 16oC for 7 hours. A WSA model for
sub-standard temperatures considered internal temperatures down to a minimum 14oC.
The studies by Warm Front and WSA provide a realistic basis on which to model indoor conditions
for low income housing stock during the winter. For the purposes of the test a simulated air temperature
of 19oC has been taken to represent indoor conditions during the heating part of the daily cycle, and a
minimum temperature of 14oC during the cooling part of the cycle. The 19oC indoor temperature is in
line with World Health Organisation (WHO) recommendations of a minimum indoor air temperature
of 18˚C for healthy sedentary occupants, and a minimum temperature of 20˚C for rooms occupied by
vulnerable groups (6). The Warm Front and WSA studies suggest that up to 90% of the low income
housing investigated was below 60% RH during the winter. Predictive calculations have been carried
out for indoor conditions of 19oC for RH values up to 70%, which would lie at the upper end of the
risk spectrum of air moisture contents for dwellings which pose some risk of surface mould formation
during cold weather.
BS 5250 (4) gives recommendations and guidance on avoiding problems with high moisture levels and
condensation in buildings. Indoor conditions of 50 to 60% RH are considered appropriate to dwellings
with low occupancy (class 4), and 60 to 70% RH for dwellings with high occupancy (class 5), at 20oC.
3.4 External Test Condition
For the calculation of surface mould growth BS EN ISO 13788 (10) requires monthly mean values of
external temperature derived from national standards. Table D.1 in BS 5250 summarizes long term
mean temperature and relative humidity for London, Manchester and Edinburgh. The values are
considered to be appropriate for assessing the risk in most buildings if a correction of -1oC is applied
to the mean temperature to allow for the worst climate to occur in 10 years. Based on the data in Table
D.1 for the winter months a temperature of 4oC has been taken to be the mean external temperature. A
steady state cold temperature of 4oC has been applied for test purposes.
3.5 Risk Model & Critical Mould Growth Level
A risk model based on the time that the surface RH is above and below a critical surface relative
humidity (mould point) of 80% RH has been developed.
Consider for example, a high-risk situation of an external building element such as an uninsulated
plastered double brick wall having a typical U value of 2 W/m2K, under winter conditions. Under
steady state conditions of indoor temperature of 19oC and outdoor temperature 4oC, the plaster surface
temperature would be depressed to about 16.2oC. For constant indoor water vapour conditions of 19oC
/ 63% RH, over a 24 hour period, the RH at the surface would be elevated to about 75%. This is
however, safely below an assumed mould point surface RH of 80%. Condensation will not occur on
surfaces above the dew point temperature of 11.8oC.
For intermittent heating cycles and prolonged periods of cold weather, internal surfaces of poorly
insulated external building elements will cool significantly and the surface RH will increase. If for
example, the overnight indoor temperature fell to 14oC during the off-heating period, whilst the

Technical Report Internal Reference No.: TT17/182 Date of Issue: 12 July 2017 Page 5 of 14
UKAS Testing No. 1660, Thermal Measurement Laboratory, University of Salford
________________________________________________________________________________
________________________________________________________________________________
This report may not be reproduced other than in full, except with the prior written approval of the issuing laboratory.
This is not a UKAS report and we are not a UKAS accredited for the calculations detailed. However, the Thermal
Measurement Laboratory is a UKAS accredited laboratory for the measurement of thermal resistance to EN 12664 / 12667
and ISO 8301 / 8302.
external temperature is maintained at 4oC, the internal surface temperature would fall to about 12.1oC.
During this period the surface would be 3.1oC below the mould point surface temperature of 15.2oC
for several hours. This “mould point deficit”, i.e. the time during which the surface temperature is
below the mould point temperature and the difference between the two; presents a risk of mould
growth.
For daily heating and cooling cycles, surfaces will be below the mould point for a limited period of
time during winter conditions. In the above case the surface is below the mould point of 80% RH for
nearly 7 hours in a 24 hour cycle. However, the potential for mould growth is de-risked during the
much longer 17 hour warm period when the surface temperatures increases above the mould point.
The effect of reducing surface RH conditions, effectively “drying” the surface, offsets the build-up of
mould growth, and the net effect is taken into account in the model.
In the simplified schematic shown in Figure 1, the time weighted mould point deficit over a 24 hour
cycle would be about 17oC.hr above, and 18oC.hr below the mould point. For the purposes of this
assessment, the net 1oC.hr below the 80% RH mould point is taken to represent a risk of mould growth.
This does not necessarily mean that visible mould will occur, but there is a risk. The potential risk of
mould growth increases for more humid indoor conditions, and decreases to zero for less humid
conditions. The schematic is a simplified representation of the cyclical temperature profile. In reality
the heating and cooling temperature profiles are more complex, and must be determined empirically.
Figure 1 Schematic of surface temperature due to daily heating cycle under winter conditions, and
relative length and weighted amounts above and below the mould point for 80% surface RH.
.

Technical Report Internal Reference No.: TT17/182 Date of Issue: 12 July 2017 Page 6 of 14
UKAS Testing No. 1660, Thermal Measurement Laboratory, University of Salford
________________________________________________________________________________
________________________________________________________________________________
This report may not be reproduced other than in full, except with the prior written approval of the issuing laboratory.
This is not a UKAS report and we are not a UKAS accredited for the calculations detailed. However, the Thermal
Measurement Laboratory is a UKAS accredited laboratory for the measurement of thermal resistance to EN 12664 / 12667
and ISO 8301 / 8302.
4. Test Results
4.1 Test Samples & Temperature Regime
The client supplied three samples of coated 12mm plasterboard samples 305mm square. Each panel of
plasterboard had been cut from the same original stock board. The coatings were described by the
client as:-
1) Standard emulsion.
2) Warmcoat anti condensation coating.
3) Heatsaver wall underliner – polystyrene underliner. This was coated by the laboratory with a
liner paper and the painted with 2 coats of standard emulsion.
The samples were conditioned to constant mass at 23oC and 50% RH, before testing.
For testing purposes the coated 12mm plasterboard samples were attached to a composite of retained
39mm samples. The total sample thermal resistance of the composite sample with Emulsion coated
plasterboard was ~0.37 m2K/W. The effective U value of ~ 2 W/m2K for Emulsion coating, when air
surface resistances are included, would be similar to that for poorly insulated external building
elements. A double leaf solid brick wall typical of older terraced housing in the UK, with a matt spray
painted plaster finish would have a similar U value. The composite sample had a bulk density ~ 900
kg/m3 to give some thermal mass characteristics.
A 50mm airspace was maintained between the hot face of the test apparatus and the coated plasterboard
surfaces. The surface temperature of the coatings was measured with calibrated thermocouples taped
to the surface. The air temperature was measured using a calibrated thermocouple mounted in the
centre of the 50mm airspace.
The sample testing arrangement between the hot and cold test plates was therefore as follows:-
Cold plate face
39mm retained sample
12mm plasterboard
50mm airspace
Hot plate face.
Steady state surface temperatures of the three types of plasterboard coating on the composite sample
were measured when subjected to a realistic temperature gradient of 19oC air temperature and 4oC cold
face temperature to simulate winter conditions.
Cyclic surface temperatures of the three types of plasterboard coating on the composite sample were
then measured when subjected to a 24 hour air temperature cycle of 19oC for 17 hours and 14oC for 7
hours, whilst maintaining the cold face at 4oC cold to simulate winter conditions.
4.1 Steady State Surface Temperature Comparison of Coatings
Initial measurements were conducted under steady state conditions of 19oC air temperature and 4oC
cold face temperature to determine the surface temperature of the coatings. The tests were carried out
using an in-house procedure (non-UKAS) for a single specimen FOX 304 heat flow meter apparatus.
Technical Report Internal Reference No.: TT17/182 Date of Issue: 12 July 2017 Page 7 of 14
UKAS Testing No. 1660, Thermal Measurement Laboratory, University of Salford
________________________________________________________________________________
________________________________________________________________________________
This report may not be reproduced other than in full, except with the prior written approval of the issuing laboratory.
This is not a UKAS report and we are not a UKAS accredited for the calculations detailed. However, the Thermal
Measurement Laboratory is a UKAS accredited laboratory for the measurement of thermal resistance to EN 12664 / 12667
and ISO 8301 / 8302.
The air temperature was measured at the centre of the airspace. The heat flux direction was horizontal.
The FOX 304 apparatus is UKAS accredited to ISO 8301, EN 12667 and EN 12664.
Steady state conditions were achieved by running the tests at constant temperature overnight, and
continuously monitoring the heat flow and temperatures of the hot and cold test plates. The
temperatures were maintained constant to better than 0.02oC.
The additional air and coating surface temperatures were monitored using ancillary equipment
comprised of:
i) Two calibrated chromel/alumel thermocouples 0.2mm diameter.
ii) A thermocouple reference temperature block with thermocouple / copper wire junctions
inserted to the same depth in concentric holes in a heavy (8kg) cylindrical copper block. The
temperature of the centre of the copper block was monitored by a calibrated thermometer.
iii) A calibrated data acquisition unit (HP3497A) to monitor the copper wire outputs from the
thermocouples.
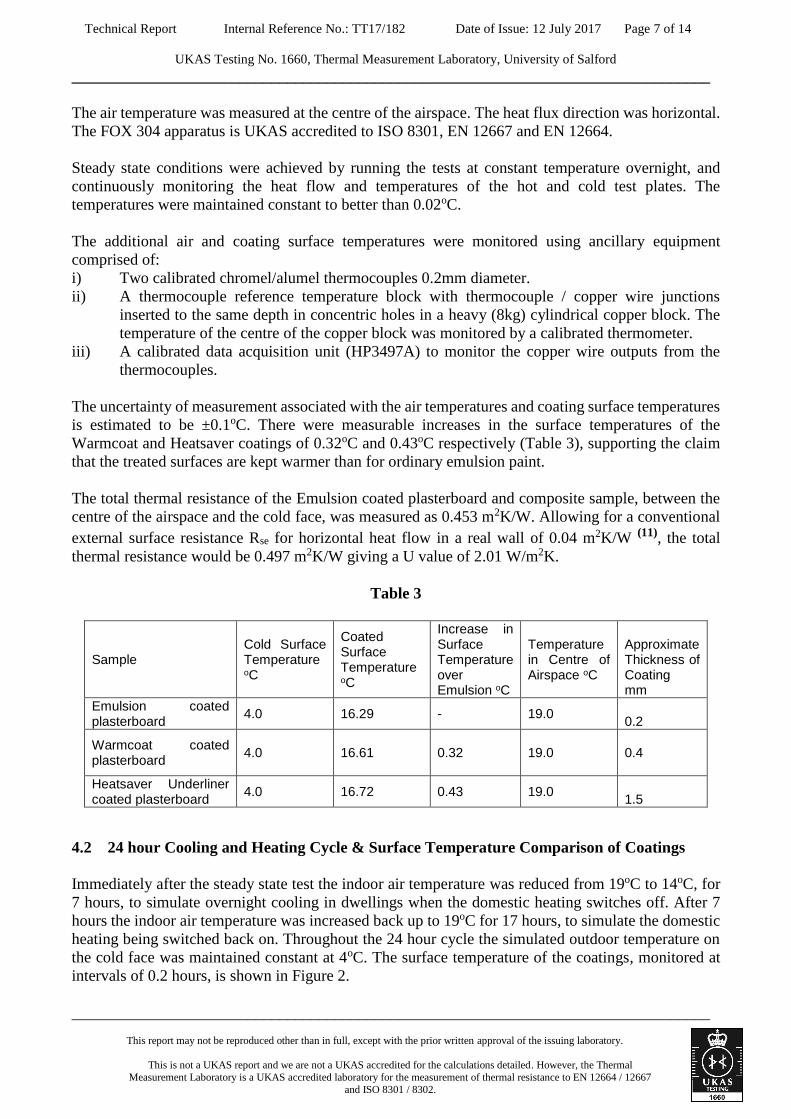
The uncertainty of measurement associated with the air temperatures and coating surface temperatures
is estimated to be ±0.1oC. There were measurable increases in the surface temperatures of the
Warmcoat and Heatsaver coatings of 0.32oC and 0.43oC respectively (Table 3), supporting the claim
that the treated surfaces are kept warmer than for ordinary emulsion paint.
The total thermal resistance of the Emulsion coated plasterboard and composite sample, between the
centre of the airspace and the cold face, was measured as 0.453 m2K/W. Allowing for a conventional
external surface resistance Rse for horizontal heat flow in a real wall of 0.04 m2K/W (11), the total
thermal resistance would be 0.497 m2K/W giving a U value of 2.01 W/m2K.
Table 3
Sample Cold Surface Temperature oC
Coated Surface Temperature oC
Increase in Surface Temperature over Emulsion oC
Temperature in Centre of Airspace oC
Approximate Thickness of Coating mm
Emulsion coated plasterboard
4.0 16.29 - 19.0 0.2
Warmcoat coated plasterboard
4.0 16.61 0.32 19.0 0.4
Heatsaver Underliner coated plasterboard
4.0 16.72 0.43 19.0 1.5
4.2 24 hour Cooling and Heating Cycle & Surface Temperature Comparison of Coatings
Immediately after the steady state test the indoor air temperature was reduced from 19oC to 14oC, for
7 hours, to simulate overnight cooling in dwellings when the domestic heating switches off. After 7
hours the indoor air temperature was increased back up to 19oC for 17 hours, to simulate the domestic
heating being switched back on. Throughout the 24 hour cycle the simulated outdoor temperature on
the cold face was maintained constant at 4oC. The surface temperature of the coatings, monitored at
intervals of 0.2 hours, is shown in Figure 2.

Technical Report Internal Reference No.: TT17/182 Date of Issue: 12 July 2017 Page 8 of 14
UKAS Testing No. 1660, Thermal Measurement Laboratory, University of Salford
________________________________________________________________________________
________________________________________________________________________________
This report may not be reproduced other than in full, except with the prior written approval of the issuing laboratory.
This is not a UKAS report and we are not a UKAS accredited for the calculations detailed. However, the Thermal
Measurement Laboratory is a UKAS accredited laboratory for the measurement of thermal resistance to EN 12664 / 12667
and ISO 8301 / 8302.
If for example the mould point was 15.2oC (80% surface RH and indoor climate of 19oC / 63% RH),
the mould point deficit for the surface temperature of the Emulsion coating would clearly be greater
than that for Warmcoat or Heatsaver during the cooling period. The surfaces of the Warmcoat and
Heatsaver coatings were measured as 0.21oC and 0.32oC warmer than the emulsion at minimum
overnight temperatures. It is noticeable that the surface temperature of the Heatsaver coating decreases
more rapidly during the early part of the cooling cycle due to the low thermal mass of the polystyrene
layer. This is offset over the 24 hour cycle by the surface temperature increasing more rapidly once
the heating period begins.
Figure 2

Technical Report Internal Reference No.: TT17/182 Date of Issue: 12 July 2017 Page 9 of 14
UKAS Testing No. 1660, Thermal Measurement Laboratory, University of Salford
________________________________________________________________________________
________________________________________________________________________________
This report may not be reproduced other than in full, except with the prior written approval of the issuing laboratory.
This is not a UKAS report and we are not a UKAS accredited for the calculations detailed. However, the Thermal
Measurement Laboratory is a UKAS accredited laboratory for the measurement of thermal resistance to EN 12664 / 12667
and ISO 8301 / 8302.
5. Project Outcomes
5.1 Time Weighted Mould Point Deficits and Risk Assessments
Figure 3
.
The risk, or potential vulnerability to mould growth, has been be assessed for 80% surface RH for
indoor RH values up to 70%, using the time weighted mould point deficit over a 24 hour cycle. Figure
3 shows the net mould point deficit time product values for the three coatings where there a risk of
mould growth. Above 62.6% indoor RH there is a rapidly increasing risk for Emulsion coating. For
the Warmcoat and Heatsaver coatings the risk is significantly less. For example at 65% indoor RH the
net product is 14.1 oC.hr for Emulsion and 4.1 oC.hr for Warmcoat. Over 24 hours this equates to an
average temperature deficit below the mould point of 0.59oC and 0.17oC respectively
The ratio of the time weighted mould point deficit values can be used to assess the % risk of mould
growth on Warmcoat and Heatsaver coatings compared to Emulsion. Figure 4 shows the % risk of
mould growth compared to Emulsion coated plasterboard for 80% surface RH mould point. The risk
on Warmcoat is less than 30% of that for Emulsion up to 65% indoor RH, increasing to 43% at 70%
indoor RH . Mould growth risk on Warmcoat is slightly greater than that on Heatsaver lining.
The data is also plotted as the % de-risk of mould growth compared to Emulsion in Figure 5. The
Warmcoat coating is 100% de-risked at 63.6% RH. The de-risk decreases to about 57% as the indoor
RH value approaches 70%.

Technical Report Internal Reference No.: TT17/182 Date of Issue: 12 July 2017 Page 10 of 14
UKAS Testing No. 1660, Thermal Measurement Laboratory, University of Salford
________________________________________________________________________________
________________________________________________________________________________
This report may not be reproduced other than in full, except with the prior written approval of the issuing laboratory.
This is not a UKAS report and we are not a UKAS accredited for the calculations detailed. However, the Thermal
Measurement Laboratory is a UKAS accredited laboratory for the measurement of thermal resistance to EN 12664 / 12667
and ISO 8301 / 8302.
Figure 4
Figure 5

Technical Report Internal Reference No.: TT17/182 Date of Issue: 12 July 2017 Page 11 of 14
UKAS Testing No. 1660, Thermal Measurement Laboratory, University of Salford
________________________________________________________________________________
________________________________________________________________________________
This report may not be reproduced other than in full, except with the prior written approval of the issuing laboratory.
This is not a UKAS report and we are not a UKAS accredited for the calculations detailed. However, the Thermal
Measurement Laboratory is a UKAS accredited laboratory for the measurement of thermal resistance to EN 12664 / 12667
and ISO 8301 / 8302.
The relative effectiveness of Warmcoat to Heatsaver, in de-risking mould growth, is shown in Figure
6. Above 64% RH indoors, Warmcoat is at least 85% effective as Heatsaver at de-risking mould
growth. On average Warmcoat is about 91% as effective as Heatsaver up to 70% indoor RH.
Figure 6
.
5.2. Thermal Comfort
Anecdotal reports suggest that after the application of Warmcoat to the indoor surfaces of buildings,
the occupants sense an increase in thermal comfort. Thermal comfort is a complex function which
depends on several variables such as air temperature, mean radiant temperature, emissivity, air
movement, humidity and clothing (12). It can be defined by the operative temperature Tc, which
combines the air temperature and the mean radiant temperature into a single value to express their joint
effect. For most practical purposes, the influence of humidity on warmth in moderate environments
may be ignored as RH in the range 40% to 70% is generally acceptable.
At low indoor air speeds below v = 0.1 m/s the operative temperature can be simplified to
Tc = Tai /2 + Tr /2 where
Tai is the indoor air temperature, and
Tr is the mean radiant temperature which can be taken to be the mean surface temperature.
Tr is determined by totalling the products of the areas and temperatures of the surrounding surfaces in
a room, and dividing this total by the sum of the areas. In poorly insulated solid brick wall buildings,
indoor surface temperatures of exposed walls may be up to 3oC less than the indoor air temperature,
which can result in large differences between air and radiant temperature and have a detrimental effect

Technical Report Internal Reference No.: TT17/182 Date of Issue: 12 July 2017 Page 12 of 14
UKAS Testing No. 1660, Thermal Measurement Laboratory, University of Salford
________________________________________________________________________________
________________________________________________________________________________
This report may not be reproduced other than in full, except with the prior written approval of the issuing laboratory.
This is not a UKAS report and we are not a UKAS accredited for the calculations detailed. However, the Thermal
Measurement Laboratory is a UKAS accredited laboratory for the measurement of thermal resistance to EN 12664 / 12667
and ISO 8301 / 8302.
on thermal comfort. Consequently, the sense of thermal comfort can respond positively to increases in
surface temperature resulting from surface coatings.
Consider a simple model of a cubic room in the poorly insulated dwelling described earlier, with two
exposed walls, consisting of a double leaf solid brick wall typical of older terraced housing in the UK
of U-value 2W/m2 K. Assumed temperature regime of air temperature 19oC, and external temperature
4oC. The surface temperature of the Emulsion coated exposed wall surface was found to be 16.29oC,
whereas for the Warmcoat surface was 16.61oC. Surfaces of non-exposed elements are taken to be the
same as the air temperature
The 0.32oC increase in temperature on the surface of an exposed wall is significant. However, this
effect would be diluted by the relatively low ratio of 2 exposed wall surfaces to 4 non-exposed room
surfaces. The mean surface temperature in the room for Warmcoat coated walls would be 18.20oC
compared to 18.09oC for Emulsion.
There is a slight increase of 0.11oC increase in mean surface temperature, with comfort temperatures
of 18.54oC for Emuslion and 18.60oC for Warmcoat. On the basis of this simple model there is
predicted to be only a small increase in the sense of thermal comfort.
6. Summary and Conclusions
The surface temperatures for Emulsion, Warmcoat and Heatsaver coatings on 12mm plasterboard, in
a poorly insulated test configuration, have been measured during a temperature cycle test simulating
intermittent heating in dwellings under winter conditions. The 24 hour cycle consisted of air
temperature of 19oC for 17 hours and 14oC for 7 hours, whilst maintaining the cold face at 4oC.
The test sample simulated a structure with a U value of about 2 W/m2K, such as an uninsulated external
plastered double brick walls in older terrace type housing. This is considered to be a worst-case
scenario under continuous winter conditions, assuming the worst climate to occur in 10 years.
Depressed internal surface temperatures on uninsulated walls are particularly vulnerable to high
surface RH values and the possibility of mould growth.
There were measurable increases in the surfaces treated with Warmcoat and Heatsaver coatings of up
to 0.32oC and 0.43oC respectively. This supports the claim that the treated surfaces are kept warmer
than ordinary emulsion paint. The enhanced surface temperatures also supports the claim that
Warmcoat helps to reduce mould and fungal growth on surfaces.
The risk of potential vulnerability to mould growth for indoor RH values up to 70%, was assessed
based on the measured surface temperature profiles, using a time weighted mould point deficit over a
24 hour cycle. A critical surface RH criteria of 80%, based on criteria suggested by research and
standard sources (2), (4), (7), (10) was used to determine the mould point.
The assessment indicated a rapidly increasing risk of mould growth for Emulsion coating at indoor RH
values above 62.6%. The risk is significantly less for the Warmcoat and Heatsaver coatings. The
potential for mould growth on the Warmcoat coating was found to be significantly de-risked by at least

Technical Report Internal Reference No.: TT17/182 Date of Issue: 12 July 2017 Page 13 of 14
UKAS Testing No. 1660, Thermal Measurement Laboratory, University of Salford
________________________________________________________________________________
________________________________________________________________________________
This report may not be reproduced other than in full, except with the prior written approval of the issuing laboratory.
This is not a UKAS report and we are not a UKAS accredited for the calculations detailed. However, the Thermal
Measurement Laboratory is a UKAS accredited laboratory for the measurement of thermal resistance to EN 12664 / 12667
and ISO 8301 / 8302.
57% at an indoor RH of 70%, increasing to 100% at lower RH values. Warmcoat was found to be at
least 85% effective as Heatsaver underliner at de-risking mould growth.
The degree to which reducing surface RH conditions during heating periods counters the build-up of
mould growth during the cooling periods, is simplified in this mathematical model. It is taken to be the
net difference between the time weighted mould point deficit above and below the mould point. A net
difference below the mould point is assumed to represent a risk of mould growth. It is not known if
mould growth will necessarily be sustained under intermittent conditions, if a risk is indicated for only
small average temperature deficits below the mould point. At 65% indoor RH, for example, over 24
hours the average temperature deficit for Warmcoat (0.17oC) would be less than one third of that for
Emulsion coating (0.59oC).
This assessment is based on hygro-thermal data obtained in the laboratory, and the various assumptions
that are described in section 3. It does not include consideration of the nature of the surface, especially
the extent to which it can absorb and retain water, and whether it provides particular nourishment,
which can be important in initiating and supporting mould growth.
A simple model of comfort temperature suggests there is only a small increase in the sense of thermal
comfort, when Warmcoat is applied to wall surfaces.
Dr. A. Simpson
This report represents the authors’ best professional judgement and should not be considered a guarantee or prediction of
results. This report, and any opinions expressed herein, relates specifically and solely to the subject assets and is conditional
upon the various assumptions that are described herein.

Technical Report Internal Reference No.: TT17/182 Date of Issue: 12 July 2017 Page 14 of 14
UKAS Testing No. 1660, Thermal Measurement Laboratory, University of Salford
________________________________________________________________________________
________________________________________________________________________________
This report may not be reproduced other than in full, except with the prior written approval of the issuing laboratory.
This is not a UKAS report and we are not a UKAS accredited for the calculations detailed. However, the Thermal
Measurement Laboratory is a UKAS accredited laboratory for the measurement of thermal resistance to EN 12664 / 12667
and ISO 8301 / 8302.
References
1) Building Research Establishment BRE Digest 297, May 1985
2) “Development of a technique for the prediction/ alleviation of conditions leading to mould
growth in houses”, Energy Systems Research Unit & Department of Bioscience and
Biotechnology, University of Strathclyde, Scottish Homes Research Programme 1995-6, Final
Report, Contract Number 68017.
3) English House Condition Survey 1996. Energy Report. London, The Stationery Office, 2000.
4) BS 5250:2011+A1:2016, “Code of practice for control of condensation in buildings”.
5) Indoor Built Environment 2006;15;2:125–135, “Mould and Winter Indoor Relative Humidity
in Low Income Households in England” Tadj Oreszczyn Ian Ridley, Sung H. Honga, Paul
Wilkinson Warm Front Study Group.
6) Public Health England (2014), Minimum home temperature thresholds for health in winter –
A systematic literature review. London: Public Health England.
7) Oreszczyn T, Pretlove S: Condensation Targeter II: modelling surface RH to predict mould
growth in dwellings. Building Serv Res Technol 1999;20/3:143–153.
8) Buiding Regulations, Approved Document F1 Means of Ventilation 2010.
9) WSA Working Paper 03-2015, “Winter Indoor Air Temperature and Relative Humidity in
Hard-To-Heat, Hard-To-Treat Houses in Wales: Results from a Household Monitoring Study”.
Shiyu Jiang, Charlotte Grey, Wouter Poortinga and Chris Tweed.
10) BS EN ISO 13788:2012, “Hygrothermal performance of building components and building
elements — Internal surface temperature to avoid critical surface humidity and interstitial
condensation — Calculation methods (ISO 13788:2012)”.
11) BR 443:2006, Conventions for U-value calculations, Brian Anderson, BRE Scotland.
12) CIBSE Guide A Environmental Design, 2006.