technical report cmre-fr-2013-025
TRANSCRIPT

SCIENCE AND TECHNOLOGY ORGANIZATION
CENTRE FOR MARITIME RESEARCH AND EXPERIMENTATION
Technical Report CMRE-FR-2013-025
GLider Acoustics Sensing of Sediments (GLASS): experiments and
data analysis
Peter L. Nielsen, Lanfranco Muzi, Martin Siderius, James H. Miller
December 2013
About CMRE
The Centre for Maritime Research and Experimentation (CMRE) is a world-class NATO scientific research and experimentation facility located in La Spezia, Italy.
The CMRE was established by the North Atlantic Council on 1 July 2012 as part of the NATO Science & Technology Organization. The CMRE and its predecessors have served NATO for over 50 years as the SACLANT Anti-Submarine Warfare Centre, SACLANT Undersea Research Centre, NATO Undersea Research Centre (NURC) and now as part of the Science & Technology Organization.
CMRE conducts state-of-the-art scientific research and experimentation ranging from concept development to prototype demonstration in an operational environment and has produced leaders in ocean science, modelling and simulation, acoustics and other disciplines, as well as producing critical results and understanding that have been built into the operational concepts of NATO and the nations.
CMRE conducts hands-on scientific and engineering research for the direct benefit of its NATO Customers. It operates two research vessels that enable science and technology solutions to be explored and exploited at sea. The largest of these vessels, the NRV Alliance, is a global class vessel that is acoustically extremely quiet.
CMRE is a leading example of enabling nations to work more effectively and efficiently together by prioritizing national needs, focusing on research and technology challenges, both in and out of the maritime environment, through the collective Power of its world-class scientists, engineers, and specialized laboratories in collaboration with the many partners in and out of the scientific domain.
Copyright © STO-CMRE 2013. NATO member nations have unlimited rights to use, modify, reproduce, release, perform, display or disclose these materials, and to authorize others to do so for government purposes. Any reproductions marked with this legend must also reproduce these markings. All other rights and uses except those permitted by copyright law are reserved by the copyright owner.
Single copies of this publication or of a part of it may be made for individual use only. The approval of the CMRE Information Services is required for more than one copy to be made or an extract included in another publication. Requests to do so should be sent to the address on the document data sheet at the end of the document.

CMRE–FR-2013-025
GLider Acoustics Sensing of Sediments (GLASS): Experimentsand data analysis
Peter L. Nielsen, Lanfranco Muzi, Martin Siderius,James H. Miller
This document, which describeswork performed under the ProjectGLASS – GLider Acoustics Sensingof Sediments of the STO-CMREProgramme of Work, has beenapproved by the Director.
– i –

CMRE–FR-2013-025
Intentionally blank page
– ii –

CMRE–FR-2013-025
GLider Acoustics Sensing of Sediments (GLASS): Experiments and data analysis
Peter L. Nielsen, Lanfranco Muzi, Martin Siderius, James H. Miller
Executive Summary: Seabed reflectivity and scattering properties are critical pa-rameters in sonar performance predictions for both Anti-Submarine Warfare and MineCounter Measures. Databases exist containing some bottom information, but thesedata are often unreliable resulting in poor performance predictions. Complex exper-imental and data analysis schemes have been demonstrated to provide high-fidelityseabed properties. These systems are often time consuming and expensive to deploy,limited to local measurements and require significant human interactions. The ad-vanced technological development of Autonomous Underwater Vehicles (AUVs) andgliders offers the opportunity to survey large areas of the ocean over long periodsof time. This has in particular been demonstrated during exercises where the objec-tive was to characterize the spatio-temporal water column properties. These typesof underwater vehicles have recently been equipped with low power consumptionmulti-channel data acquisition systems and an array of hydrophones. This additionalacoustic payload extents the capability to characterize the underwater environmentby acquiring passive and active acoustic signals. Seabed characterization has in thepast been demonstrated successfully by using natural-made ambient noise or noisesources of opportunity, such as distant shipping, received on long moored or driftingvertical arrays. The objective of the GLASS project is to investigate the feasibilityto transition this ambient noise methodology to autonomous vehicles equipped withcompact hydrophone arrays. In 2012 and 2013, CMRE conducted two experiments(GLASS’12 and GLASS’13, respectively) in different shallow-water areas deployingan underwater vehicle with a noise-mounted compact line and tetrahedral hydrophonearray. The aim during the experiments was to acquire sea surface generated noise anddistant shipping for seabed characterization. The experimental results with accompa-nying data analysis and numerical modeling are presented. Although the aperture ofthe compact arrays employed was short (and led to degraded resolution) they showsensitivity to the seabed properties, and potential for operational and on demand, effi-cient mapping of seabed properties in denied areas.
– iii –

CMRE–FR-2013-025
Intentionally blank page
– iv –

CMRE–FR-2013-025
GLider Acoustics Sensing of Sediments (GLASS): Experiments and data analysis
Peter L. Nielsen, Lanfranco Muzi, Martin Siderius, James H. Miller
Abstract:
Seabed characteristics (geoacoustic properties and scattering strength) are critical pa-rameters for sonar performance predictions. However, this bottom information is con-sidered very difficult and expensive to achieve in the scientific community. In thisreport, an efficient method for inferring the seabed properties is presented; it relieson a previous methodology using long moored or drifting hydrophone arrays. Resultsfrom the GLASS’12 and GLASS’13 sea trials demonstrate the feasibility of usingthe technique by deploying a hybrid autonomous underwater vehicle hosting a uniquehydrophone array consisting of a five-element vertical line array and a four-elementtetrahedral array. Seabed reflection and layering properties are estimated from seasurface generated ambient noise acquired during the two trials in different shallow-water areas. Results from numerical modeling, data analysis and experimental mea-surements are presented with emphasis on comparing the seabed characterization atdifferent locations with different bottom properties. Utilization of distant shippingwas only demonstrated for the GLASS’12 trial data. The results obtained from bothexperiments demonstrate the potential of using autonomous underwater vehicles forseabed characterization and surface vessel tracking.
Keywords: Seabed characterization ◦ ambient noise ◦ compact hydrophone array ◦autonomous underwater vehicles
– v –

CMRE–FR-2013-025
Intentionally blank page
– vi –

CMRE–FR-2013-025
Contents
Executive Summary ................................................................................................. iiiAbstract ................................................................................................................ vContents ................................................................................................................ viiList of Figures ........................................................................................................ viiiList of Tables.......................................................................................................... ix1 Introduction .................................................................................................. 12 Sensitivity analysis of array tilt and seabed properties ............................................ 43 Measured reflection loss and sub-bottom profiling ................................................. 94 Estimates of geoacoustic seabed properties .......................................................... 135 Synthetic extension of the GLASS array aperture .................................................. 166 Adaptive beamforming for reflection loss estimates ............................................... 187 Conclusion ................................................................................................... 198 Invention ...................................................................................................... 219 Publications and presentations .......................................................................... 22
9.1 Publications......................................................................................... 229.2 Presentations ....................................................................................... 22
10 Recommendations .......................................................................................... 2411 Acknowledgments .......................................................................................... 26References ............................................................................................................. 27
– vii –

CMRE–FR-2013-025
List of Figures
1 Clearance area (red box) defined for the TREX..................................................... 32 Bathymetry along the TREX main reverberation track............................................ 33 Reflection loss modeled for the vertical GLASS array ............................................ 54 Ambient noise derived reflection loss ................................................................. 65 Ambient noise derived reflection loss ................................................................. 76 Plane wave reflection loss ................................................................................ 87 Typical spectral amplitude................................................................................ 108 Conventional beamform response ...................................................................... 109 Ambient noise derived reflection loss ................................................................. 1110 Sub-bottom profiling derived from ambient noise .................................................. 1211 Ambiguity surface of the error function............................................................... 1412 Model and data comparison of the reflection loss .................................................. 1513 Reflection loss derived from ambient noise .......................................................... 1614 Magnitude of the first row of the cross spectral density matrix ................................. 17
– viii –

CMRE–FR-2013-025
List of Tables
1 Optimum seabed properties .............................................................................. 14
– ix –

CMRE–FR-2013-025
Intentionally blank page
– x –

CMRE–FR-2013-025
1Introduction
The properties of the seabed are critical parameters for reliable sonar performance predic-tions and for determining optimal sonar settings in a particular operational environment.However, the bottom properties are very difficult to obtain and are often required a pri-ori and in situ for performance predictions and mission planning purposes. Traditionallycomplex equipment and strong human interaction from surface vessels are necessary fordirect sampling (probes and acoustical remote sensing) of the seabed to provide estimatesof the geoacoustic properties. This methodology is cost ineffective, computationally inten-sive, time consuming, and likely to be limited to local measurements outside denied areas.Databases exist containing seabed information, but the quality of these data are unknownand generally considered unreliable.
Autonomous Underwater Vehicle (AUV) and glider technologies provide an efficient plat-form for operations below the sea surface. These platforms, combined with low-powerconsumption data acquisition and sensor systems offer long duration and can cover largeareas sampling the underwater environment covertly in denied areas. This has recentlybeen demonstrated theoretically and during an exercise comprising several autonomousvehicles adaptively sampling the water column properties (conductivity, temperature anddepth) [1,2]. A similar approach may be applied to map the seabed properties by mountingcompact hydrophone arrays accompanied with a data acquisition payload on these vehi-cles. The acoustic signals carrying information about the seabed properties originate fromsources of opportunity such as distant shipping and sea surface generated noise. Seabedcharacteristics have previously been determined successfully with sources of opportunityusing long moored and drifting hydrophone arrays [3–8].
The Centre for Maritime Research and Experimentation (CMRE) initiated a project en-titled “Seafloor Characterization using Gliders” in 2012 with the major objective to equipone of the CMRE AUVs/gliders, in this project the eFOLAGA, with a compact hydrophonearray for seabed characterization using noise sources of opportunity. The research effortwas financially supported by ONR-G (GRANT No. N62909-12-1-7040 and identified in-ternally as project USA000113) and fund-matched by Allied Command Transformationunder project ACT000207 in 2013. The project ran over two years with termination in2013.
Two experiments were planned, with GLASS’12 (acronym for GLider Acoustics Sensingof Sediments 2012) experiment [9] conducted locally in the Mediterranean Sea in 2012,and the GLASS’13 experiment performed in conjunction with the ONR sponsored Targetand Reverberation EXperiment (TREX) in the Gulf of Mexico off the coast of Panama Cityin 2013 [10].
The main objective of GLASS’12 was to demonstrate the feasibility of using a compactarray of hydrophones and ambient noise for seabed characterization under controlled con-
– 1 –

CMRE–FR-2013-025
ditions. Therefore, the eFOLAGA was mainly kept at fixed depth mounted on a bottom-moored frame, although an opportunity became available to perform measurements whilethe AUV was gliding through the water. The array, electronics and self-noise were con-cluded to perform extremely well during GLASS’12. One shortfall was the buoyancy ad-justment of the AUV, which is necessary to stay at fixed depth while acquiring the ambientnoise. Most of the data from GLASS’12 has been analyzed, and conclusions, recommen-dations, description of the equipment and experiments are provided in [9].
The vehicle buoyancy shortfall was addressed during the preparation for the GLASS’13 ex-periment by developing a closed-loop-feedback algorithm for the buoyancy system whichprovides a fixed-depth capability of the AUV. One of the objectives during the GLASS’13experiment was to measure reflection loss and sub-bottom profiling over a large area byemploying a stop-and-go sequence of the AUV. The eFOLAGA vehicle and hydrophonearray were the same as used in GLASS’12 [9]. However, initial measurements of the sys-tem performance were conducted by bottom-mooring the AUV as during the GLASS’12experiment. The quality of array and acquisition system was assessed to be of the highquality level as during GLASS’12. A total of approximately 45 minutes of ambient noisedata was identified as usable for seabed characterization during the GLASS’13. Of thistotal, 40 minutes of the data were acquired while the AUV was bottom moored (mooringsover a two day period), and only a few minutes of useful data while the vehicle was keptat constant depth and gliding through the water. The reminder of the data collected is con-taminated by vehicle noise, most likely from self-induced activation of electronic controlunits.
In this report, comparisons between experimental results from the GLASS’12 and GLASS’13,and supporting numerical analysis are performed. The description of equipment and theGLASS’12 experiment is provided in [9] and will not be repeated except where necessary.The GLASS’13 was conducted as a TREX post-trial activity to minimize any interferencefrom surface vessels and other acoustic equipment as it relies on measuring ambient noise.The clearance area was as defined during the TREX experiment and shown as the red boxin Fig. 1. The eFOLAGA was deployed in the yellow confined area in Fig. 1, which isabout 4.5 km from the coast and at the beginning of the TREX main reverberation trackrunning parallel to the coast line [10]. The GLASS’13 preparation leveraged significantlyfrom the TREX activities. In particular, high-resolution (1 m) multi-beam bathymetry map-ping (Fig. 2, data made available by Dr Christian de Moustier and Barbara Kraft by the linkin [10]) indicated variations of the water depth along the main reverberation track (red linein Fig. 2). This bathymetry variation correlates with acoustic backscatter intensity usingthe same multi-beam system. At shallower water depth the acoustic backscatter is high,and at deeper depth the backscattering is low. This is interpreted as a series of sand dunes(shallower areas) with mud-like patches (deeper areas) along the main reverberation track.Transition zones were identified (coordinates provided by Dr DJ Tang [10]) as TRANS01-TRANS03 in Fig. 2 with supporting core and diving activities at locations indicated byMud01, Sand01 etc., and a combinations of these (Fig. 2). The eFOLAGA was deployedclose to position VLA3 in Fig. 2 during the GLASS’13 experiment.
– 2 –

CMRE–FR-2013-025
Figure 1: Clearance area (red box) defined for the TREX experiment in the Gulf ofMexico off the coast of Panama City, Florida, USA. The yellow box indicates the operationalarea during the GLASS’13.
Figure 2: Bathymetry along the TREX main reverberation track (red line) obtained by acalibrated multi-beam system survey during the TREX experiment [10]. The undulationsin the bathymetry along the main reverberation track have been shown to correlate withbackscattering strength
– 3 –

CMRE–FR-2013-025
2Sensitivity analysis of array tilt and seabed properties
The test of the AUV control unit, array and acquisition system during GLASS’13 was per-formed while the vehicle was bottom moored as in GLASS’12. However, the AUV wastethered with rope and ballast during GLASS’13 in contrast to the specially manufacturedrigid frame used during GLASS’12. The tethering of the vehicle may cause current andwave induced tilt of the compact vertical line array and, therefore, possibly degrade the per-formance of the seabed characterization. To conduct these tests, two deployment sequenceswere employed during GLASS’13:
• The vehicle was bottom moored with only the acquisition system turned on to evaluatethe state of the array and self-noise of the acquisition system, and
• Bottom mooring with both acquisition system and control unit powered includinglogging of vehicle pitch and roll.
The latter would indicate any motion of the vehicle induced by current and waves whichwould alter the array orientation. However, the propeller of the vehicle turned on a coupleof minutes after the deployment in this mode and repeatedly contaminated the noise mea-surements and, therefore, changed the attitude of the vehicle. Prior to the propeller turningon, the attitude sensors indicated a roll of around 3◦ and pitch close to 8◦. Numerical mod-eling of the impact of vertical array tilt on seabed characterization was performed usingOASES [11]. The input parameters to the model were chosen to emulate the experimentalset-up during the GLASS’13. The result of changing the array tilt by 10◦ compared to ver-tical is shown in Fig. 3. The measured array tilt is not expected to have a strong impact onthe derived reflection loss and sub-bottom profiling, and a similar result was confirmed fora variety of bottom types. However, changing the array tilt to the extreme of 40◦ inducesan apparent increase of the critical angle and a lower loss at steeper grazing angles (resultsnot shown).
The seabed properties in part of the GLASS’12 experimental area may be characterized assilt-sand based on previous experimental activities [12] and by core data acquired duringthe GLASS’12 experiment [9]. The GLASS’13 site has been visited several times in thepast by the majority of the Principal Investigators of the TREX, and results from theseprevious experiments indicate that the seabed is composed mainly of sand with shell debrisand clay/silt inclusions [10, 13–15]. Therefore, the hydrophone-equipped eFOLAGA hasbeen deployed in two different shallow-water environments during the GLASS’12 (softbottom) and GLASS’13 (hard bottom) experiments. The OASES noise model was appliedto a series of synthetic test cases to predict the ambient noise derived reflection loss invarious shallow-water environments. The seabed is modeled as an infinite fluid halfspace,i.e., the bottom reflection loss is frequency independent and no fringes will appear as afunction of grazing angle and frequency. The ten different bottom types considered aredefined as in Table I in [16] with the associated geoacoustic properties. The results using
– 4 –

CMRE–FR-2013-025
Figure 3: Reflection loss modeled for the vertical GLASS array (left panel) and with anarray tilt of 10◦ (right panel).
the 0.4 m vertical array are shown in Fig. 4 for all bottom types ranging from clay to rock.Note the color scale changes after five bottom types.
In general the critical angle appears to increase from a soft (clay) to a harder (rock) bottomas one would expect. In addition, the lowest frequency at which this array provides sensi-ble results also seems to increase as the bottom becomes harder. The latter phenomenonis at present not fully understood, but both the critical angle and the minimum usable fre-quency for the applied array configuration are expected to be strongly affected by the widebeam pattern of the array. Nevertheless, the ambient noise derived reflection loss is clearlyaffected by changes in bottom properties. This behavior of the measured ambient noisereflection loss indicates that these measurements alone may provide insight into the type ofbottom being surveyed.
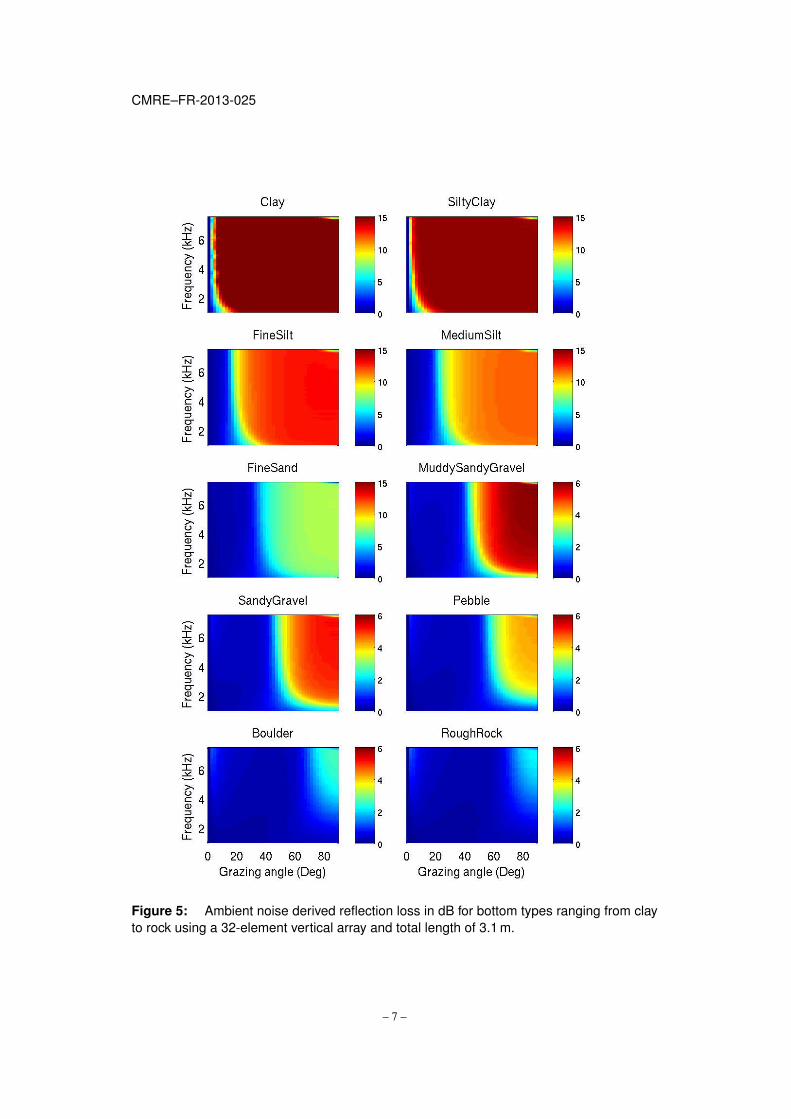
The same calculations were performed for a 32-element vertical array (total length 3.1 m),and the results are presented in Fig. 5. Clearly the length of the array and, therefore, the an-gular resolution has an impact on the ambient noise derived reflection loss. This reflectionloss converges toward the plane wave reflection loss (Fig. 6) as the number of elements atthe same hydrophone spacing increases, i.e., the length of the array increases. Althoughthe noise derived reflection loss determined by a 5-element array does not represent theplane wave reflection loss, it clearly shows dependence on the bottom type. Meaningfulseabed properties may therefore be obtained if the limitations of the short array ambientnoise measurements can be compensated for or deconvolved.
– 5 –

CMRE–FR-2013-025
Figure 4: Ambient noise derived reflection loss in dB for bottom types ranging from clayto rock using a 5-element vertical array and total length of 0.4 m.
– 6 –
CMRE–FR-2013-025
Figure 5: Ambient noise derived reflection loss in dB for bottom types ranging from clayto rock using a 32-element vertical array and total length of 3.1 m.
– 7 –

CMRE–FR-2013-025
Figure 6: Plane wave reflection loss in dB for bottom types ranging from clay to rock.
– 8 –
CMRE–FR-2013-025
3Measured reflection loss and sub-bottom profiling
The ambient noise data acquired during the GLASS experiments are processed to a levelthat provides insight about the seabed properties. The processing consists of conventionalplane wave beamforming of the vertical array data to provide seabed reflection loss inthe frequency band from 1 to 7.5 kHz (array design frequency). The power ratio of thebeamformer output between beams steered symmetrically down towards the seabed and uptowards the sea surface defines the seabed reflection loss as a function of grazing angle andfrequency. This technique is sensitive to loud interfering sounds such as shipping traffic asthe conventional beamformer does not suppress these sound sources.
The sub-bottom profiling processing indicates stratification of the seabed. This is obtainedby cross-correlating the downward endfire beam with the upward endfire beam of the ver-tical array and then transformation into time domain. In this case an adaptive beamformeris applied. It has better performance in suppressing loud interfering sounds and, therefore,increases the quality of the profiling.
Both beamformers require the cross-spectral density matrix of the ambient noise, and thismatrix is constructed over a certain integration time. The integration time depends on theconvergence of the seabed characterization, and may be affected by the level of ambientnoise, acoustic frequency, seabed type and the array specifications (hydrophone spacingand array aperture). It was found that integration time of 70 s was sufficient in the examplespresented in this report to represent the seabed reflection loss, while an integration time ofonly 30 s was applied for the sub-bottom profiling. The latter choice was mainly determinedbased on the presentation of the data, i.e., to utilize a sufficiently short integration time topresent the profiling as a function of depth and measuring time (Coordinated UniversalTime or UTC) and still preserve reflections off bottom layering if any.
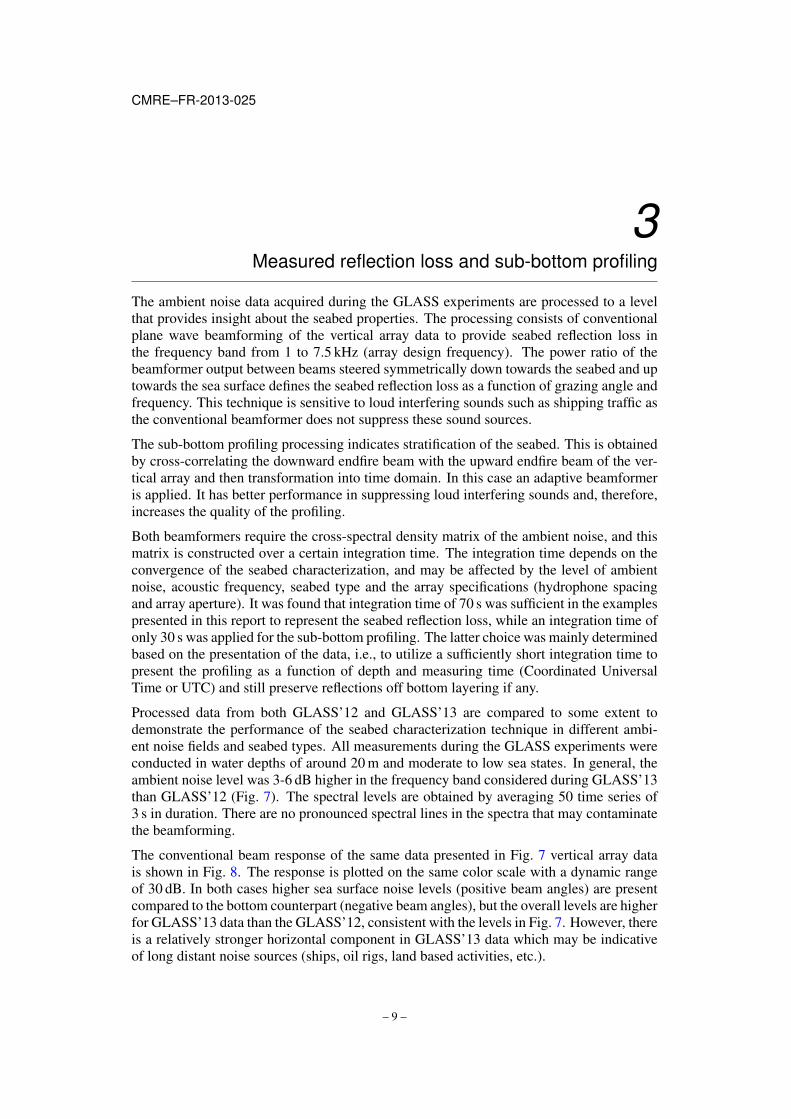
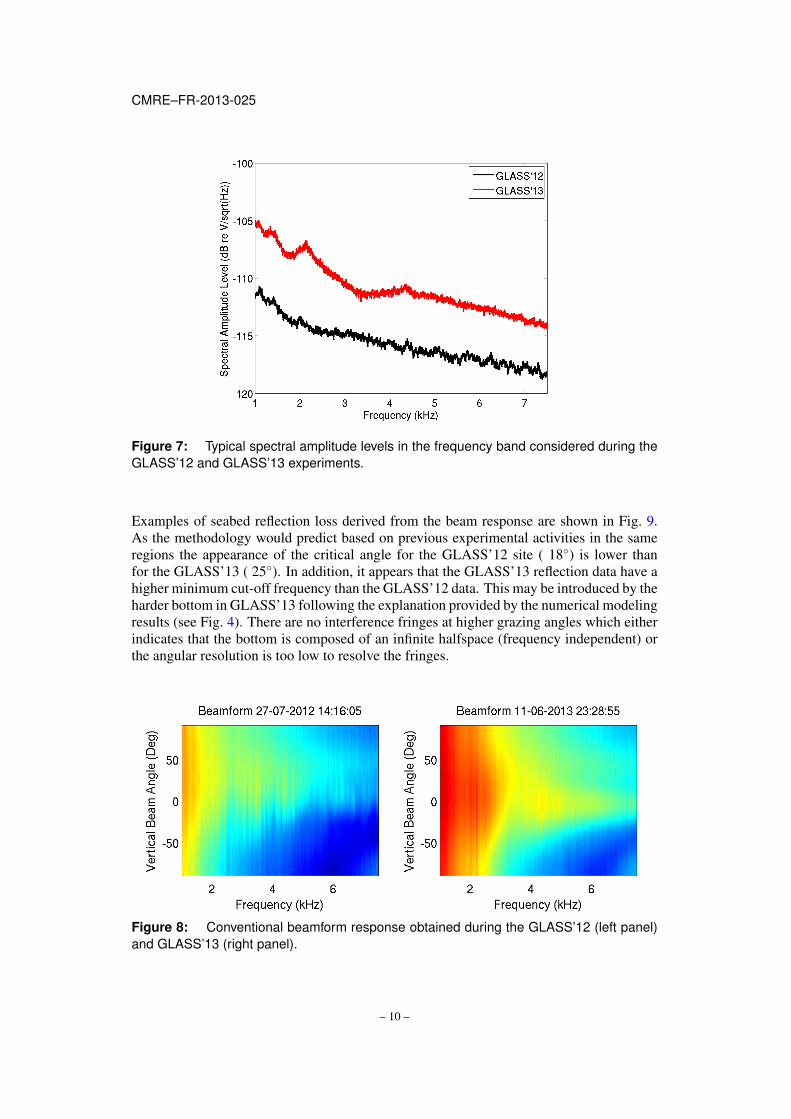
Processed data from both GLASS’12 and GLASS’13 are compared to some extent todemonstrate the performance of the seabed characterization technique in different ambi-ent noise fields and seabed types. All measurements during the GLASS experiments wereconducted in water depths of around 20 m and moderate to low sea states. In general, theambient noise level was 3-6 dB higher in the frequency band considered during GLASS’13than GLASS’12 (Fig. 7). The spectral levels are obtained by averaging 50 time series of3 s in duration. There are no pronounced spectral lines in the spectra that may contaminatethe beamforming.
The conventional beam response of the same data presented in Fig. 7 vertical array datais shown in Fig. 8. The response is plotted on the same color scale with a dynamic rangeof 30 dB. In both cases higher sea surface noise levels (positive beam angles) are presentcompared to the bottom counterpart (negative beam angles), but the overall levels are higherfor GLASS’13 data than the GLASS’12, consistent with the levels in Fig. 7. However, thereis a relatively stronger horizontal component in GLASS’13 data which may be indicativeof long distant noise sources (ships, oil rigs, land based activities, etc.).
– 9 –
CMRE–FR-2013-025
Figure 7: Typical spectral amplitude levels in the frequency band considered during theGLASS’12 and GLASS’13 experiments.
Examples of seabed reflection loss derived from the beam response are shown in Fig. 9.As the methodology would predict based on previous experimental activities in the sameregions the appearance of the critical angle for the GLASS’12 site ( 18◦) is lower thanfor the GLASS’13 ( 25◦). In addition, it appears that the GLASS’13 reflection data have ahigher minimum cut-off frequency than the GLASS’12 data. This may be introduced by theharder bottom in GLASS’13 following the explanation provided by the numerical modelingresults (see Fig. 4). There are no interference fringes at higher grazing angles which eitherindicates that the bottom is composed of an infinite halfspace (frequency independent) orthe angular resolution is too low to resolve the fringes.
Figure 8: Conventional beamform response obtained during the GLASS’12 (left panel)and GLASS’13 (right panel).
– 10 –

CMRE–FR-2013-025
The results in Fig. 9 were chosen out of a series of reflection loss curves acquired at eachsite showing sufficient sea surface generated ambient noise (Fig. 8) with minimum interfer-ing distant sources, and expectations on how the reflection loss depends on grazing angleand frequency. It should be noted that not all experimental reflection loss curves behavelike the those in Fig. 9.
Figure 9: Ambient noise derived reflection loss from the two shallow-water experimentalsites during GLASS’12 (left panel) and GLASS’13 (right panel).
As demonstrated in Figs. 4-6, the appearance of a frequency dependent critical angle (lowercritical angle at higher frequencies) may be an artifact from the beamforming when thebottom is truly a halfspace. Other possible causes of this frequency dependent criticalangle are unresolved gradients in the geoacoustic properties or layering, or sound speeddispersion. The latter is unlikely because the apparent decrease in critical angle as thefrequency increases would contradict previous results showing dispersion effects in whichsound speed (and hence critical angle) increases with frequency (not shown).
Sub-bottom profiling derived from ambient noise clearly showed a layer 3 m below thewater-seabed interface at 18 m depth for site P in GLASS’12 (Fig. 10 upper panels) anda layer 4 m below the 22-m depth at site G in GLASS’12 (Fig. 10 middle panels) [9, 17].This result was observed using both the tetrahedral and vertical array data (Fig. 10 left andright panels, respectively).
The sub-bottom profiling from the vertical array during GLASS’13 is shown in Fig. 10(lower panel) when the eFOLAGA was bottom moored at a fixed location. Returns fromthe water-seabed interface at 20-m depth are clearly observed although the strength varieswith measurement time (UTC). There is no indication of a layered bottom in the laterarrivals. This agrees, to some extent, with chirp sonar data collected during the GulfEx’11and GulfEx’12 experiments [10] (data not shown). The sub-bottom profile appears to benoisier for the GLASS’13 than the GLASS’12 data, and no profiling has yet been possibleusing the tetrahedral array for GLASS’13. The degradation could be caused by a loudinterferer arriving at near horizontal as seen in Fig. 8 (right panel).
– 11 –

CMRE–FR-2013-025
Figure 10: Sub-bottom profiling derived from ambient noise acquired on the tetrahedralarray (left panels) and the vertical array (right panels) while the eFOLAGA was moored.The upper panels are measurements at site P and middle panels site G visited duringthe GLASS’12 experiment, and the lower panel is measurements during the GLASS’13experiment. The color scales are in dB.
– 12 –

CMRE–FR-2013-025
4Estimates of geoacoustic seabed properties
Ideally the geoacoustic properties of the seabed could be inferred by the measured reflec-tion loss to provide more flexibility in the application of the seabed characterization. Thiscould be the case where the coherent transmission loss or full time series predictions haveto be performed at a high fidelity level. These predictions require phase information ofthe reflection loss when the acoustic field interacts with the seabed. This phase informa-tion is not available in the direct measurements of the reflection loss from ambient noisepresented here. Therefore, a sample of the derived reflection loss from the GLASS’12and GLASS’13 sites has been used in a model-based inference method to estimate thesegeoacoustic properties.
The seabed is assumed to be an infinite halfspace with only three unknown parameters,namely density, attenuation and sound speed. The reflection loss derived from ambientnoise is modeled by OASES [11], and the fitness of the modeling result to the experimen-tal data is measured by a least-mean-square error function. The search for the set of seabedparameters that provides the best matched between model and data is performed exhaus-tively, i.e., values of density, attenuation and sound speed are changed one at a time. Theparameter search space is discretized by 16 values for the attenuation covering the rangefrom 0. to 1.6 dB/λ , 53 values for the sound speed in the range from 1460 to 2500 m/s,and 26 density values in the range from 1.0 to 3.5 kg/m3. Grazing angles from 0 to 90◦
and frequencies from 1000 to 7500 Hz of the reflection loss were included in the search.Expectations are that the attenuation is the least sensitive parameter (mainly affecting thelow grazing angles), the sound speed controls the appearance of the critical angle and thedensity is the dominant parameter at steeper grazing angles above the critical angle. Anexample of the ambiguity surface obtained by sweeping through the values of density andsound speed, while keeping the attenuation at the optimum value, is shown in Fig. 11.Clearly there is an optimum combination of the three geoacoustic parameters which pro-vides the best match between model and data.
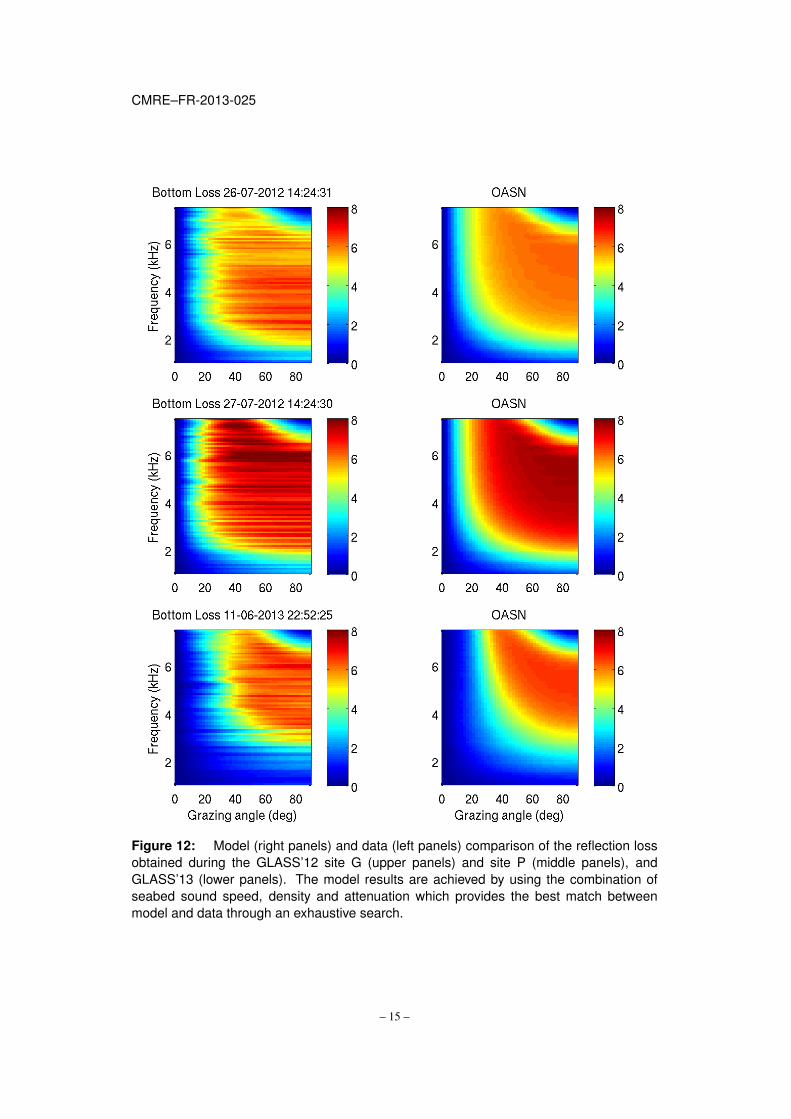
This inference of seabed properties has been obtained for both GLASS’12 and GLASS’13data, and a comparison between modeled and measured reflection loss for optimum geoa-coustic parameters is shown in Fig. 12. The optimum geoacoustic parameters determinedby matching the model results to the data are given in Table 1 using 70 s duration samplesfrom the two GLASS’12 sites (G and P [9]) and from the one site during the GLASS’13experiment. None of the unknown seabed properties have optimum values at the searchlimits.
– 13 –

CMRE–FR-2013-025
Figure 11: Ambiguity surface of the error function (cost or objective function) as a func-tion of sediment sound speed and density as the geoacoustic parameters are swept oneat a time. The attenuation is held at the optimum value of 0.7 dB/λ . Cross-sections passthrough the white dot, with sound speed fixed (lower left) and with density fixed (upperright).
Table 1: Optimum seabed properties obtained by exhaustive sweep of sound speed,density and attenuation defined as the best match between ambient noise modeling anddata as shown in Fig. 12.
Sound speed (m/s) Density (g/cm3) Attenuation (dB/λ )GLASS’12 site G 1560 2.8 0.70GLASS’12 site P 1560 2.3 0.70GLASS’13 1580 2.6 0.02
– 14 –
CMRE–FR-2013-025
Figure 12: Model (right panels) and data (left panels) comparison of the reflection lossobtained during the GLASS’12 site G (upper panels) and site P (middle panels), andGLASS’13 (lower panels). The model results are achieved by using the combination ofseabed sound speed, density and attenuation which provides the best match betweenmodel and data through an exhaustive search.
– 15 –

CMRE–FR-2013-025
5Synthetic extension of the GLASS array aperture
The reflection loss measured via ambient noise is negatively affected by the wide beamsof the physical aperture, and the loss is therefore limited in resolution and apparently alsoin the usable frequency band (Fig. 4). Processing approaches suggest that the physicalarray aperture can be extended synthetically by utilizing the properties of the noise crossspectral density matrix as described in [17]. This technique has been applied to syntheticdata produced by OASES simulating the GLASS’12 and GLASS’13 data. A comparisonof reflection loss obtained using an array with double the physical aperture of that used inthe GLASS experiments, with the reflection loss obtained by synthetically extending theGLASS array by two is shown in Fig. 13. The method introduces artifacts in its presentformulation for such short arrays, most likely caused by the abrupt truncation of the acrossdiagonal terms and zero padding of the cross-spectral density matrix. An example of thetruncation and zero padding is illustrated in Fig. 14. Sophisticated methods to extrapolatethe cross-spectral density matrix elements may exist and be used to improve this syntheticaperture extension.
Figure 13: Reflection loss derived from ambient noise by doubling the physical apertureof the array (left), and by synthetically extending the aperture by a factor of two (right).
– 16 –

CMRE–FR-2013-025
Figure 14: Magnitude of the first row of the cross spectral density matrix at 2020Hz (top),4518Hz (center) and 5996Hz (bottom) for a conventional beamformer (CBF) with 32 and10 physical sensors, and for a synthetic-array processor (SAP) with 5 physical sensors,extended to 10 sensors.
– 17 –

CMRE–FR-2013-025
6Adaptive beamforming for reflection loss estimates
Experience in the past using longer vertical arrays has shown that in certain cases the adap-tive beamformer can be applied to estimate reflection loss from ambient noise instead of theconventional plane wave beamformer applied in this report. The adaptive beamformer pro-vides, in general, narrower beams in the steering direction and suppresses strong interferingsound sources in directions other than the steering direction. Increased beam resolution inestimating the reflection loss might be achieved by applying the adaptive beamformer tothe short GLASS array data. Attempts have been made to gain resolution by applyingthe adaptive beamformer to synthetic data simulating the GLASS experiments, but no suc-cess has been achieved at present. One of the issues with the adaptive beamformer is thatthe beamwidth in the steering direction is unknown. For estimating the reflection loss, itis essential that the width of the up- and down-looking beams are the same, and this isnot necessarily the case for the adaptive beamformer. Further, the adaptive beamformerrequires inversion of the cross-spectral density matrix, which can be ill-conditioned, andthe number of degrees of freedom is very limited with a 5-element vertical array for thebeamformer to perform optimally.
– 18 –
CMRE–FR-2013-025
7Conclusion
The feasibility of characterizing the seabed in terms of reflectivity and stratification using acompact five-element line and tetrahedral (four hydrophones) array has been demonstrated.The array was mounted on a hybrid autonomous underwater vehicle bottom moored at threedifferent locations during the GLASS’12 and GLASS’13 experiments. During GLASS’13the vehicle was tethered resulting in a vehicle roll and pitch of 3◦ and 8◦, respectively. Anambient noise model was used to simulate the experiment and the numerical results indicatethat an array tilt up to 10◦ from vertical has little impact on the reflection loss derived fromambient noise.
The same noise model was applied to underwater scenarios with different classes of bottomtypes. The calculations of the reflection loss using the compact array indicate that thecritical angle and lower cut-off frequency increase as the bottom changes from a soft (lowsound speed) to a harder bottom type (high sound speed). The reason for the increase in thelower cut-off frequency for harder bottom types is at present unknown. However, reflectionloss modeling from ambient noise received on a compact array clearly shows sensitivity tothe bottom type even though it is not equivalent to the plane wave reflection loss. The noisederived reflection loss appears to converge towards the plane wave reflection loss if thelength of the array is increased (with hydrophone spacing remaining constant). Therefore,more reliable results can be obtained as the array length increases.
The bottom-type dependence of the noise derived reflection loss observed in the numericalmodeling is also observed in the experimental data. Two sites visited in the MediterraneanSea (GLASS’12) show similar ambient noise reflection loss corresponding to a silt-sandtype bottom. This is partly confirmed by previous activities in this area and core dataanalysis. The data analysis from the experiment in the Gulf of Mexico (GLASS’13) revealsa harder sand-type bottom similar to results obtained from independent experiments.
Geoacoustic properties were estimated at the GLASS’12 and GLASS’13 sites assumingthe bottom was an infinite halfspace by an exhaustive sweep through bottom sound speed,density and attenuation values. The combination of bottom properties resulting in the bestmatch between model and data for each site defines the best representation of the bottomproperties. In general, lower sound speed and higher attenuation values are determined inthe Mediterranean Sea than in the Gulf of Mexico.
Bottom stratification was successfully measured by sea surface generated ambient noiseusing both the line and tetrahedral arrays in the Mediterranean Sea. There are similaritiesbetween this result and bottom-layering measurements by a commercial sub-bottom pro-filer. However, the seabed appears inhomogeneous in both sets of observations making adirect comparison difficult. Only the bathymetry was detected by ambient noise in the Gulfof Mexico using the line array. Poor results were obtained using the tetrahedral array andwas most likely caused by strong interfering sound sources at shallow grazing angles.
– 19 –

CMRE–FR-2013-025
There are clear shortfalls in using compact arrays to infer seabed properties based on seasurface generated ambient noise measurements. The methodology is sensitive to stronginterfering sound sources which contaminate the up-down beam power ratios obtained byconventional beamforming and resulting in unreliable reflection loss estimates. This is lesscritical for the sub-bottom profiling as adaptive beamforming is applied to suppress stronginterferer from other directions than vertical.
The small aperture of the compact arrays also limits the angular resolution of the measuredreflection loss preventing the detection of seabed layering structure from these measure-ments. The seabed appears as an infinite halfspace from all the reflection loss measure-ments presented in this report even though independent measurements indicate a layeredseabed structure. This is in particular evident at the experimental sites where bottom layersare detected by ambient noise sub-bottom profiling but the noise derived reflection loss ap-pears without fringes. This indicates poor spatial resolution of the ambient noise processingfor seabed reflection properties. However, these reflection loss estimates still have seabedinformation contents as demonstrated in this report, which provide valuable insight into theseabed composition compared to unknown seabed parameters or poor bottom databases.
Despite this shortfall great potential is envisioned in combining autonomous vehicles,compact arrays and utilization of natural-made sound sources for seabed characterization.Smart design and signal processing may circumvent some of the drawbacks noted in thisreport.
– 20 –

CMRE–FR-2013-025
8Invention
In the context of the ONR-G grant, CMRE declares that no invention has been made duringthe project. No further reporting regarding this item.
– 21 –

CMRE–FR-2013-025
9Publications and presentations
In order to address the publications and acknowledgment of support to ONR-G grant,the following publications and presentations were performed during the execution of theproject.
9.1 Publications
• Peter L. Nielsen, Lanfranco Muzi, Martin Siderius and James H. Miller, “GLiderAcoustics Sensing of Sediments (GLASS): Experiments and data analysis”, NATOSTO-CMRE, CMRE-FR-2013-xxx (this report), 2013.
• Peter L. Nielsen, James H. Miller, Martin Siderius, Steven Crocker and Jennifer Giard,“Seabed characterization using ambient noise and compact arrays on an autonomousunderwater vehicle”, Proceedings of meetings on acoustics, Palais des Congress deMontreal, Montreal, Canada, 2-7 June, POMA 19, Ref. 070030, 2013.
• John Gebbie, Martin Siderius, Peter L. Nielsen, Steven Crocker and Jennifer Giard,“Small boat localization using adaptive three-dimensional beamforming on a tetra-hedral and vertical line array”, Proceedings of meetings on acoustics, Palais desCongress de Montreal, Montreal, Canada, 2-7 June, POMA 19, Ref. 070072, 2013.
• Peter L. Nielsen, James H. Miller, Martin Siderius, Steven Crocker and Jennifer Giard,“GLASS’12– The glider acoustics sensing of sediments experiment 2012”, NATOSTO-CMRE, CMRE-FR-2012-007, 2012.
9.2 Presentations
• Martin Siderius, Peter L. Nielsen and James H. Miller, “Extracting seabed propertiesusing ocean noise measured on an autonomous underwater vehicle mounted array”, J.Acoust. Soc. Am. 134, 4149, 2013.
• John Gebbie, Martin Siderius, Peter L. Nielsen, Steven Crocker and Jennifer Giard,“Small boat localization using adaptive three-dimensional beamforming on a tetrahe-dral and vertical line array”, J. Acoust. Soc. Am. 133, 3527, 2013.
• Peter L. Nielsen, James H. Miller, Martin Siderius, Steven Crocker and Jennifer Giard,“Seabed characterization using ambient noise and compact arrays on an autonomousunderwater vehicle”, J. Acoust. Soc. Am. 133, 3395, 2013.
• Peter L. Nielsen, Martin Siderius, Lanfranco Muzi, John Gebbie, Steven Crocker,James H. Miller and Jennifer Giard, “Seabed characterization using ambient noiseand compact arrays on an autonomous underwater vehicle (GLASS–GLider Acoustics
– 22 –

CMRE–FR-2013-025
Sensing of Sediments)”, Visit by ACT and ACO, NATO STO-CMRE, 20-22 August,2013.
• Peter L. Nielsen, Lanfranco Muzi, Martin Siderius and James H. Miller, “Seabed char-acterization with underwater glider platforms: Results from GLASS”, First CMREworkshop on military applications of underwater glider technology, NATO STO-CMRE, 8-10 October, (summarized in the NATO STO-CMRE report CMRE-MR-2013-013 by Alberto Alvarez) 2013.
– 23 –

CMRE–FR-2013-025
10Recommendations
• Further development and application of more sophisticated array processing algo-rithms to increase certainty and resolution of the derived seabed properties. This haspartly been investigated under the CMRE Visiting Research Program by Mr. Lan-franco Muzi (six weeks effort in 2013). Portions of his results are shown in thisreport.
• Modify the eFOLAGA control software to eliminate inconvenient behaviors duringcertain missions such as homing to deployment position if no instructions are providedto the vehicle. This may require involvement of GraalTech S.r.l. as CMRE does nothave full access to the control unit software.
• Allocate additional time for Engineering Department (ED) personnel to gain experi-ence in using the eFOLAGA with the newly developed closed-loop-feedback algo-rithm to automatically balance the vehicle at specific depth.
• Extend the localization capability of the eFOLAGA after ending a mission. This willsignificantly reduce the risk of losing the vehicle. ED has improved the localizationcapabilities after the GLASS’13 trial.
• Exercise the system in locations with different bottom properties including areas withknown seabed characteristics such as North and South of the Elba Island. Challengesare to detect layering structure in the measured reflection loss that will be consistentwith the complementary sub-bottom profiling. An attempt to deploy a compact arrayon different types of seabeds will be performed during the REP14-MED experimentplanned in June 2014.
• Eventually, equip a SLOCUM glider with a longer (approximately 2 m) line array.This will require specific mounting on the glider and employing the hovering capa-bility of the vehicle. Part of this activity may be investigated during the REP14-MEDexperiment planned in June 2014.
• Verify the approach for interpolating the cross spectral density matrix obtained froma long sparse array. This allows the utilization of a long array with few or limitednumber of hydrophones.
• Conduct controlled experiments with a proto-type AUV array together with a denseand long array moored at the same location. This will provide ground truth and verifythe applicability of the interpolation and extrapolation techniques mentioned above.This activity will be addressed during the REP14-MED experiment planned in June2014.
– 24 –
CMRE–FR-2013-025
• Establish ground truth consisting of coring, independent sub-bottom profiling, othermeans of acoustic remote sensing of the seabed parameters for comparison and toestablish credibility of derived seabed properties from natural-made ambient noisemeasurements.
• Conduct an ambient noise reflection loss and sub-bottom profiling survey between adeployed sound source and vertical line array. Assess added value by utilizing theambient noise derived seabed properties in long-range sound propagation predictionsfor comparison with measured sound propagation.
– 25 –

CMRE–FR-2013-025
11Acknowledgments
The authors would like to acknowledge the Engineering Coordinators Stefano Fioravantiand Alberto Grati, and Rod Dymond and Federico Cernich for their outstanding effortin preparing the eFOLAGA and hydrophone array for the experimental activities. Thepersonnel in the CMRE Engineering Department is gratefully acknowledged for their pro-fessionalism and efficiency in supporting the sea trials and making them a success. Greatappreciation is expressed to the Captain and crew on NRV Alliance and Fintastic for theirreadiness, flexibility and professionalism in deployment and recovery operations. Spe-cial thanks to the principal investigators Dr Dajun Tang, Dr Kevin Williams and Dr ToddHefner from APL-UW, and Dr Christian de Moustier and Dr Barbara Kraft at HLS Re-search, Inc., for sharing their knowledge during the preparation of the Gulf of Mexicoexperiment (GLASS’13). This work was supported by Allied Command Transformationunder project ACT000207, the Visiting Research Program at CMRE, and by ONR-G underGRANT No.: N62909-12-1-7040, and ONR through the N-STAR/ILIR program.
– 26 –

CMRE–FR-2013-025
References
[1] A. Alvarez and B. Mourre, “Assessment of the performance of coorporative and coor-dinated fleets of underwater gliders with Observing Systems Simulation Experiment”,Technical Report CMRE-MR-2013-008, NATO STO-Centre for Maritime Researchand Experimentation, La Spezia, Italy (2013).
[2] B. Mourre and J. Chiggiato, “A comparison of the performance of the 3-D super-ensample and an ensamble Kalman filter for short-range regional ocean prediction”,Tellus series A: Dynamic Meteorology and Oceanography (2013), in press, 2013.
[3] C. Harrison and D. Simons, “Geoacoustic inversion of ambient noise: A simplemethod”, J. Acoust. Soc. Am. 112, 1377–1389 (2002).
[4] C. H. Harrison, “Sub-bottom profiling using ocean ambient noise”, J. Acoust. Soc. Am.120, 1505–1515 (2004).
[5] M. Siderius, C. C. Harrison, and M. B. Porter, “A passive fathometer technique forimaging seabed layering using ambient noise”, J. Acoust. Soc. Am. 120, 1315–1323(2006).
[6] M. Siderius, H. Song, P. Gerstoft, W. S. Hodgkiss, P. Hursky, and C. C. Harrison,“Adaptive passive fathometer processing”, J. Acoust. Soc. Am. 127, 2193–2200 (2010).
[7] P. Gerstoft, W. S. Hodgkiss, M. Siderius, C.-F. Huang, and C. C. Harrison, “Passivefathometer processing”, J. Acoust. Soc. Am. 123, 1297–1305 (2008).
[8] J. E. Quijano, S. E. Dosso, J. Dettmer, L. M. Zurk, M. Siderius, and C. C. Harrison,“Bayesian geoacoustic inversion using wind-driven ambient noise”, J. Acoust. Soc.Am. 131, 2658–2667 (2012).
[9] P. L. Nielsen, J. H. Miller, M. Siderius, S. Crocker, and J. Giard, “GLASS’12 – theglider acoustics sensing of sediment experiment 2012”, Technical Report CMRE-FR-2012-007, NATO STO-Centre for Maritime Research and Experimentation, La Spezia,Italy (2012).
[10] “TREX13 website”, (2013), http://www.trex13.info/ (username and password re-quired).
[11] H. Schmidt, “OASES version 3.1, user guide and reference manual”, TechnicalReport, Department of Ocean Engineering, Massachusetts Institute of Technology(2011), download user’s guide from http://www.oalib.hlsresearch.com.
[12] B. Schmalfeldt and D. Rauch, “Explosion-generated seismic interface waves in shal-low water: Experimental results”, Technical Report, NATO Undersea Research Cen-tre, SR-71 (1983).
[13] M. D. Richardson et al., “Overview of SAX99: Environmental considerations”, IEEEJ. Ocean. Eng. 26, 26–53 (2001).
[14] J. E. Piper, R. Lim, E. I. Thorsos, and K. L. Williams, “Buried sphere detection usinga synthetic aperture sonar”, IEEE J. Ocean. Eng. 34, 485–494 (2009).
[15] J. A. Goff, “Now you see it and now you don’t: Chirp imaging of the intermittentlyshelly shoreface ravinement surface on the inner shelf of Panama City, Florida”, J.Acoust. Soc. Am. 130, 2339 (A) (2011).
– 27 –

CMRE–FR-2013-025
[16] D. R. Jackson, R. I. Odom, M. L. Boyd, and A. N. Ivakin, “A geoacoustic bottominteraction model (GABIM)”, IEEE J. Ocean. Eng. 35, 603–617 (2010).
[17] M. Siderius, L. Muzi, C. H. Harrison, and P. L. Nielsen, “Synthetic array processingof ambient noise for higher resolution seabed bottom loss estimation”, J. Acoust. Soc.Am. 133, EL149–EL155 (2013).
– 28 –

Document Data Sheet Security Classification
RELEASABLE TO THE PUBLIC
Project No.
USA00013/ACT000207
Document Serial No.
CMRE-FR-2013-025
Date of Issue
December 2013
Total Pages
38 pp.
Author(s)
Nielsen, P.L., Muzi, L., Siderius, M., Miller, J.H.
Title
GLider Acoustics Sensing of Sediments (GLASS): Experiments and data analysis.
Abstract
Seabed characteristics (geoacoustic properties and scattering strength) are critical parameters for sonar performance predictions. However, this bottom information is considered very difficult and expensive to achieve in the scientific community. In this report, an efficient method for inferring the seabed properties is presented; it relies on a previous methodology using long moored or drifting hydrophone arrays. Results from the GLASS’12 and GLASS’13 sea trials demonstrate the feasibility of using the technique by deploying a hybrid autonomous underwater vehicle hosting a unique hydrophone array consisting of a five-element vertical line array and a four-element tetrahedral array. Seabed reflection and layering properties are estimated from sea surface generated ambient noise acquired during the two trials in different shallow water areas. Results from numerical modeling, data analysis and experimental measurements are presented with emphasis on comparing the seabed characterization at different locations with different bottom properties. Utilization of distant shipping was only demonstrated for the GLASS’12 trial data. The results obtained from both experiments demonstrate the potential of using autonomous underwater vehicles for seabed characterization and surface vessel tracking.
Keywords
Seabed characterization, ambient noise, compact hydrophone array, autonomous underwater vehicles.
Issuing Organization
Science and Technology Organization Centre for Maritime Research and Experimentation
Viale San Bartolomeo 400, 19126 La Spezia, Italy [From N. America: STO CMRE Unit 31318, Box 19, APO AE 09613-1318]
Tel: +39 0187 527 361 Fax:+39 0187 527 700 E-mail: [email protected]