technical report - bidding zone review process
TRANSCRIPT

ENTSO-E AISBL • Avenue de Cortenbergh 100 • 1000 Brussels • Belgium • Tel + 32 2 741 09 50 • Fax + 32 2 741 09 51 • [email protected] • www. entsoe.eu
1
Technical Report
Bidding Zones Review Process
2 January 2014

Technical Report
2
ENTSO-E AISBL • Avenue de Cortenbergh 100 • 1000 Brussels • Belgium • Tel + 32 2 741 09 50 • Fax + 32 2 741 09 51 • [email protected] • www. entsoe.eu
Table of Contents 1. Introduction 5
1.1. Motivation and general background 5
1.2. The current bidding zone configuration 5
1.3. CACM NC requirements and envisaged process 6
1.4. Structure of the Technical Report 7
2. Present congestions and their future evolution 8
2.1. General background information on capacity calculation methodologies 8
2.2. Methodology and general descriptions 8
2.3. Congested areas in 2011 and 2012 and their future evolution 10
2.4. Day ahead market price analysis 20
3. Power flows not resulting from capacity allocation 22
3.1. Methodology and general descriptions 22
3.1.1. Real-Time Unscheduled Flows (RTUF) indicator 23
3.1.2. PTDF flow indicator 23
3.1.3. Day Ahead Unscheduled Flows (DAUF) indicator 24
3.2. Data sources 25
3.2.1. Vulcanus database 25
3.2.2. Computation of the PTDF matrix 26
3.2.3. DACF computation 27
3.3. Analysis of the indicators 27
3.3.1. Results of the Real-Time Unscheduled Flows (RTUF) Indicator for the years 2011 and 2012 on a bidding zone basis 28
3.3.2. Results of the PTDF Flow indicator for the years 2011 and 2012 on a bidding zone basis 32
3.3.3. Results of the Day Ahead Unscheduled Flows (DAUF) indicator for the years 2011 and 2012 on a bidding zone basis 36
3.3.4. Comparison of indicators and conclusion 39
3.3.5. Further individual analysis 44
4. Congestion incomes and firmness costs 48
4.1. Interpretation and survey set-up 48
4.1.1. Congestion incomes 48
4.1.2. Financial firmness costs 48
4.1.3. Physical firmness costs and internal congestion cost 48
4.2. Results 50
4.2.1. Congestions incomes 50
4.2.2. Financial firmness costs 52
4.2.3. Physical firmness costs and internal redispatch costs 53
5. Final Summary 57
Technical Report
3
ENTSO-E AISBL • Avenue de Cortenbergh 100 • 1000 Brussels • Belgium • Tel + 32 2 741 09 50 • Fax + 32 2 741 09 51 • [email protected] • www. entsoe.eu
Annex 1: Abbreviations 58
Annex 2: Bidding zone connections 60
Annex 3: Net Transfer Capacity between bidding zones 61
Annex 4: Monthly average graphs for non-allocated flow indicators 62
Annex 4.1. Individual border monthly averages RTUF indicator 62
Annex 4.2.: Individual border monthly averages PTDF indicator 79
Annex 4.3: Individual border monthly averages DAUF evolution 88
Annex 5: Statistical data related to the indicators 100
Annex 5.1.: Statistical data related to the RTUF indicator 100
Annex 5.2.: Statistical data related to the PTDF indicator 103
Annex 5.3.: Statistical data related to the DAUF indicator 106
List of Figures Figure 1: Current bidding zone configuration ............................................................................................. 6
Figure 2: Activities in the bidding zone Review Process ............................................................................ 7
Figure 3: Congestions in different planning / operational stages 9
Figure 4: Critical/Congested network element clusters: planning phase (D-1 and D-2 in 2011 and 2012) ....................................................................................................... 10
Figure 5: Congestion clusters: operational phase (real-time) .................................................................. 11
Figure 6: Network developments at the northern Italian borders ............................................................. 15
Figure 7: Day ahead market price analysis (percentages represent time shares)................................... 20
Figure 8: Day ahead market price analysis before and after CZ-SK-HU market coupling ...................... 21
Figure 9: Average realized scheduled exchanges & measured physical flows ...................................... 29
Figure 10: Average Real-Time Unscheduled Flows (RTUF) for the years 2011 and 2012 (in MW) ......................................................................................................................................... 30
Figure 11: Example time split arrow ......................................................................................................... 31
Figure 12: Time split arrows RTUF 2011 & 2012 (in MW) ....................................................................... 32
Figure 13: Average flows induced by all cross-border exchanges & measured physical flows for the years 2011 and 2012 (in MW) ..................................................................................... 33
Figure 14: Average PTDF Flow deviation (PTDFF) for the years 2011 and 2012 (in MW) ..................... 34
Figure 15: Time split arrows PTDF 2011 & 2012 (in MW) ....................................................................... 35
Figure 16: Average day ahead scheduled exchanges & day ahead calculated flows ........................... 37
Figure 17: Average Day Ahead Unscheduled Flows (DAUF) for the second half of 2012 (in MW) ......... 38
Figure 18: Time split arrows (DAUF) for the second half of 2012 (in MW) .............................................. 39
Figure 19: RTUF flow indicator for second half of 2012 (average values in MW) .................................... 40
Figure 20: PTDF flow deviation indicator for second half of 2012 (average values in MW) .................... 40
Figure 21: Comparison of the particular indicators of unscheduled flows (second half of 2012)................................................................................................................................... 41
Figure 22: Comparison of indicators for the CWE and CEE regions with an additional border between DE/LU and AT for the second half of 2012 .............................................................. 44

Technical Report
4
ENTSO-E AISBL • Avenue de Cortenbergh 100 • 1000 Brussels • Belgium • Tel + 32 2 741 09 50 • Fax + 32 2 741 09 51 • [email protected] • www. entsoe.eu
Figure 23: Values of the RTUF indicator for the CEE region with control area resolution for the years 2011 and 2012 ........................................................................................................ 45
Figure 24: Analysis of CEE region with control area resolution envisaged for the bidding zone study .............................................................................................................................. 47
Figure 26: Congestion incomes per bidding zone .................................................................................... 50
Figure 27: Total financial firmness costs .................................................................................................. 53
Figure 28: Physical firmness and internal redispatch costs ..................................................................... 54
Figure 29: Current bidding zone borders: control area resolution ............................................................ 60
Figure 30: Current bidding zone borders: country resolution ................................................................... 60
Figure 31: Net Transfer Capacity between bidding zones ....................................................................... 61
List of Tables Table 1: Names of the flows and indicators 22
Table 2: CGM and intervals used 26
Table 3: Advantages and limitations of the RTUF indicator 28
Table 4: Advantages and limitations of the PTDF flow indicator 33
Table 5: Advantages and limitations of the DAUF indicator 36
Table 6: Overview of physical flows, scheduled flows and RTUF 46
Table 7: TSO congestion management incomes 2011 and 2012 [in Mil. EUR] 51
Table 8: Statistical data related to the RTUF indicator 100
Table 9: Statistical data related to the RTUF indicator for a positive flow direction 101
Table 10: Statistical data related to the RTUF indicator for a negative flow direction 102
Table 11: Statistical data related to the PTDF indicator 103
Table 12: Statistical data related to the PTDF indicator for a positive flow direction 104
Table 13: Statistical data related to the PTDF indicator for a negative flow direction 105
Table 14: Statistical data related to the DAUF indicator 106
Table 15: Statistical data related to the DAUF indicator for a positive flow direction 107
Table 16: Statistical data related to the DAUF indicator for a negative flow direction 108

Technical Report
5
ENTSO-E AISBL • Avenue de Cortenbergh 100 • 1000 Brussels • Belgium • Tel + 32 2 741 09 50 • Fax + 32 2 741 09 51 • [email protected] • www. entsoe.eu
1. Introduction
1.1. Motivation and general background
The current and target model for the European Electricity Market is based on a zonal approach (i.e.
bidding zones with one wholesale electricity price). Consequently, the current European market
contains several bidding zones, usually based on a historical context corresponding to a member state.
However there are some exceptions, i.e. multiple bidding zones may exist within one member state, or
several member states may constitute one bidding zone (please see section 1.2. for further details).
The Network Code on Capacity Allocation and Congestion Management (CACM NC) drafted by
ENTSO-E and submitted to ACER on September 27th 2012 addresses the definition and configuration
of Bidding Zones in Articles 37 to 40.
The present report represents the first step of this bidding zone review process: according to Article 40
of the CACM NC, and in order to decide whether it is appropriate to proceed with the review of the
configuration, the involved TSOs are tasked with delivering a Technical Report containing several
analyses aimed at identifying the appropriateness and the robustness of the current bidding zone
structure.
1.2. The current bidding zone configuration
A bidding zone is the largest geographical area within which Market Participants are able to exchange
energy without Capacity Allocation. In other words, it is assumed that there are no major congestions
resulting from transactions within bidding zones. This implies that within bidding zones such
exchanges should be possible without any constraints. Exchanges between bidding zones may be
constrained when cross-zonal capacities are insufficient to facilitate them. This leads to the question of
where such cross-zonal capacities should be and how the geographical boundaries of the associated
bidding zones should be determined in relation to electrical borders.
As stated in Article 37(4) (c) of the CACM NC, the involved system operators performing the
assessment of the bidding zone configuration shall both assess the current bidding zone configuration
and alternative bidding zone configurations.
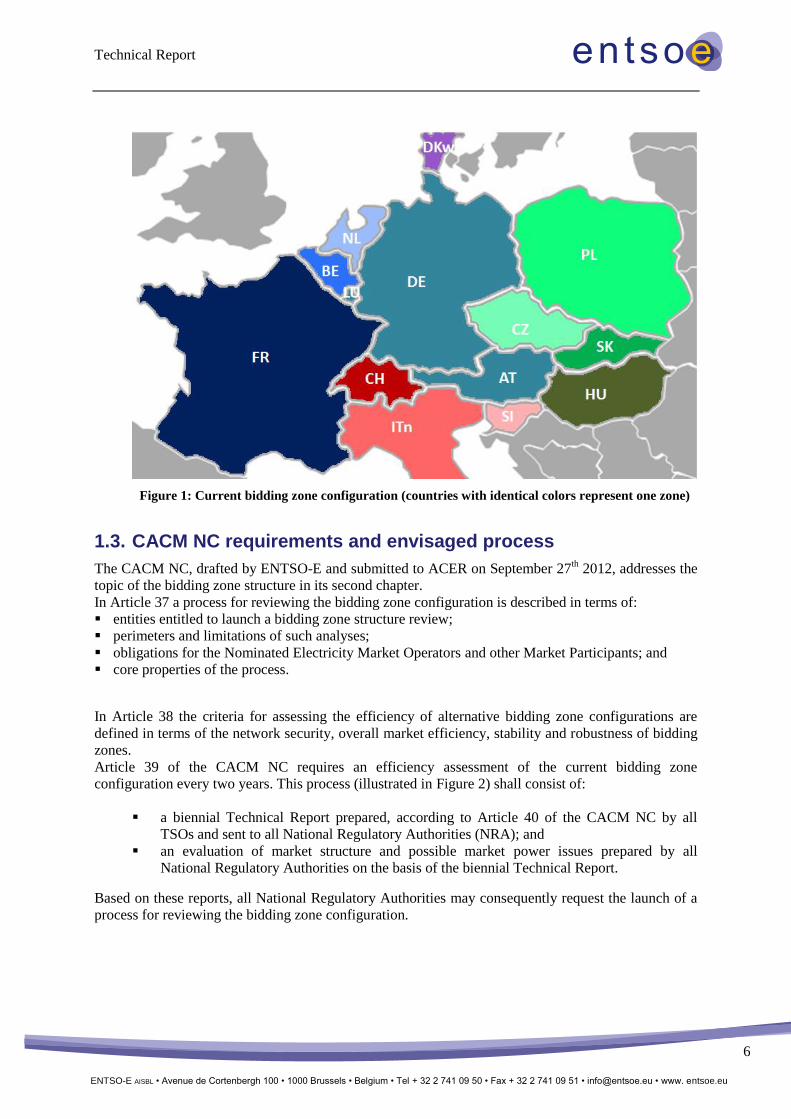
The current bidding zone configuration is described in Figure 1, where each colour represents a
different bidding zone.
From this figure it can be seen that currently Germany, Luxembourg and Austria represent a single
bidding zone and therefore this bidding zone comprises three member states and several TSOs.
With the exemption of the Belgian, the Austrian-German-Luxembourg, the Hungarian, the Slovenian
and the Slovakian bidding zones neighbouring bidding zones are all electrically connected to each
other. Annex 2 contains a diagram illustrating these bidding zone connections. The net transfer
capacity between bidding zones is also illustrated in Annex 3.
Furthermore, the current legal framework (Regulation (EC) 714/2009 and the associated Congestion
Management Guidelines) imposes an obligation to account for the impact of commercial transactions
between the member states on the neighbouring power systems.
“In cases where commercial exchanges between two countries (TSOs) are expected to affect physical
flow conditions in any third-country (TSO) significantly, congestion-management methods shall be
coordinated between all the TSOs so affected through a common congestion-management procedure.”
Reporting therefore concerns not only bidding zone borders but also where necessary member state
borders or even smaller areas (TSO control areas).
Technical Report
6
ENTSO-E AISBL • Avenue de Cortenbergh 100 • 1000 Brussels • Belgium • Tel + 32 2 741 09 50 • Fax + 32 2 741 09 51 • [email protected] • www. entsoe.eu
Figure 1: Current bidding zone configuration (countries with identical colors represent one zone)
1.3. CACM NC requirements and envisaged process
The CACM NC, drafted by ENTSO-E and submitted to ACER on September 27th 2012, addresses the
topic of the bidding zone structure in its second chapter.
In Article 37 a process for reviewing the bidding zone configuration is described in terms of:
entities entitled to launch a bidding zone structure review;
perimeters and limitations of such analyses;
obligations for the Nominated Electricity Market Operators and other Market Participants; and
core properties of the process.
In Article 38 the criteria for assessing the efficiency of alternative bidding zone configurations are
defined in terms of the network security, overall market efficiency, stability and robustness of bidding
zones.
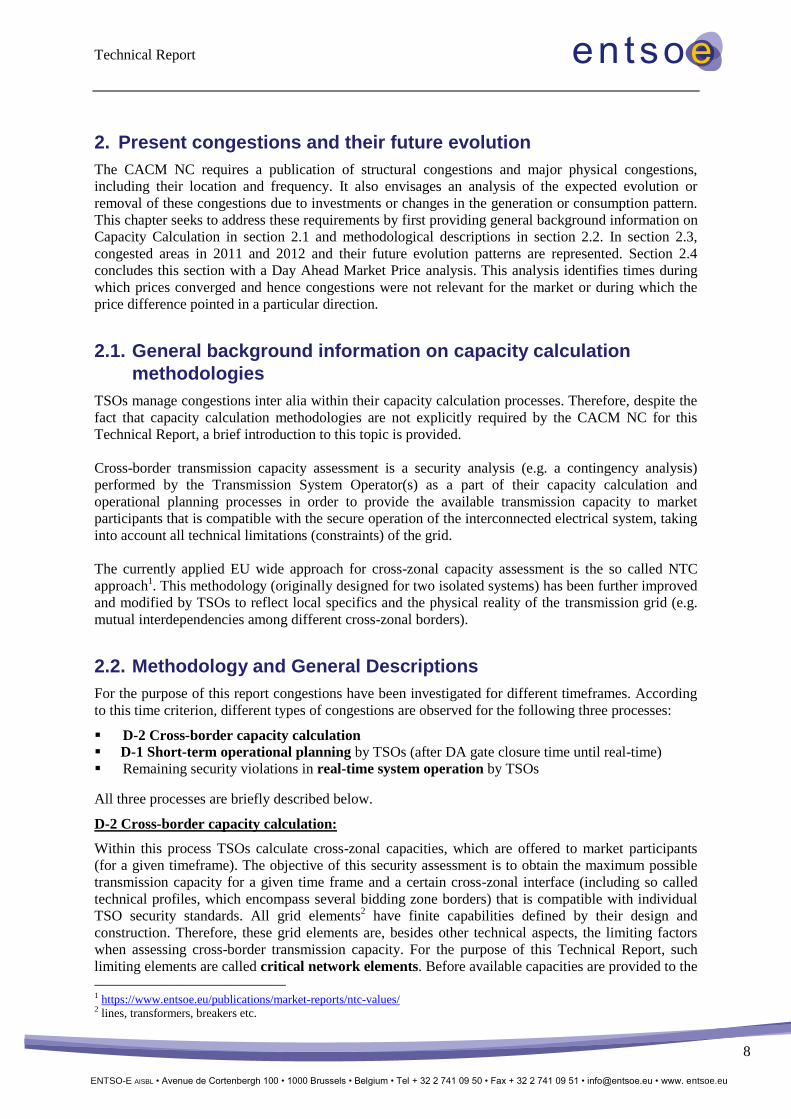
Article 39 of the CACM NC requires an efficiency assessment of the current bidding zone
configuration every two years. This process (illustrated in Figure 2) shall consist of:
a biennial Technical Report prepared, according to Article 40 of the CACM NC by all
TSOs and sent to all National Regulatory Authorities (NRA); and
an evaluation of market structure and possible market power issues prepared by all
National Regulatory Authorities on the basis of the biennial Technical Report.
Based on these reports, all National Regulatory Authorities may consequently request the launch of a
process for reviewing the bidding zone configuration.

Technical Report
7
ENTSO-E AISBL • Avenue de Cortenbergh 100 • 1000 Brussels • Belgium • Tel + 32 2 741 09 50 • Fax + 32 2 741 09 51 • [email protected] • www. entsoe.eu
Figure 2: Activities in the Bidding Zone Review Process
A bidding zone review process based on a legally binding CACM NC could be initiated upon
completion of the EU Comitology process for the CACM NC. However, in a letter dated August 30th
2012, ACER and NRAs invited ENTSO-E “to start an early implementation of the process for
reviewing the bidding zones as foreseen in the nearly finalised CACM NC”. Therefore, the present
Technical Report has been issued prior to the Comitology process and the entry into force of the
CACM NC.
This Technical Report is based on the provisions contained in the September 27th 2012 version of the
CACM NC and on the “Terms of Reference for the early implementation of the CACM NC
concerning a bidding zone review in CWE (Belgium, France, Germany, Luxembourg, the
Netherlands), Denmark-West, CEE (Austria, Czech Republic, Germany, Hungary, Poland, Slovenia,
Slovakia), Switzerland, and Italy”. These Terms of Reference were presented to the Florence Forum in
November 2012.
Any future amendments made to the CACM NC (e.g. during the Comitology process) are not
considered in this report but will have to be taken into account in future bidding zone reviews.
1.4. Structure of the Technical Report
The present Technical Report is subdivided into four main sections:
Present congestions and their future evolution (Chapter 2)
According to Articles 40.1.a and 40.1.b of the CACM NC, an analysis of the relevant congestions
in 2011 and 2012 and their expected evolution due to investments in networks or due to
significant changes in generation or consumption patterns is shown.
Power flows not resulting from capacity allocation (Chapter 3)
According to Article 40.1.c of the CACM NC, an analysis of the share of power flows that do not
result from the Capacity Allocation mechanism is shown for each Capacity Calculation Region
where appropriate.
Congestion incomes and firmness costs (Chapter 4)
According to Article 40.1.d of the CACM NC, a summary of Congestion Incomes and Firmness
Costs incurred in 2011 and 2012 is shown.
Final summary and main findings (Chapter 5)
An overview of the main evidences from the first three sections is presented and the main
conclusions are highlighted.
Technical Report
8
ENTSO-E AISBL • Avenue de Cortenbergh 100 • 1000 Brussels • Belgium • Tel + 32 2 741 09 50 • Fax + 32 2 741 09 51 • [email protected] • www. entsoe.eu
2. Present congestions and their future evolution
The CACM NC requires a publication of structural congestions and major physical congestions,
including their location and frequency. It also envisages an analysis of the expected evolution or
removal of these congestions due to investments or changes in the generation or consumption pattern.
This chapter seeks to address these requirements by first providing general background information on
Capacity Calculation in section 2.1 and methodological descriptions in section 2.2. In section 2.3,
congested areas in 2011 and 2012 and their future evolution patterns are represented. Section 2.4
concludes this section with a Day Ahead Market Price analysis. This analysis identifies times during
which prices converged and hence congestions were not relevant for the market or during which the
price difference pointed in a particular direction.
2.1. General background information on capacity calculation
methodologies
TSOs manage congestions inter alia within their capacity calculation processes. Therefore, despite the
fact that capacity calculation methodologies are not explicitly required by the CACM NC for this
Technical Report, a brief introduction to this topic is provided.
Cross-border transmission capacity assessment is a security analysis (e.g. a contingency analysis)
performed by the Transmission System Operator(s) as a part of their capacity calculation and
operational planning processes in order to provide the available transmission capacity to market
participants that is compatible with the secure operation of the interconnected electrical system, taking
into account all technical limitations (constraints) of the grid.
The currently applied EU wide approach for cross-zonal capacity assessment is the so called NTC
approach1. This methodology (originally designed for two isolated systems) has been further improved
and modified by TSOs to reflect local specifics and the physical reality of the transmission grid (e.g.
mutual interdependencies among different cross-zonal borders).
2.2. Methodology and General Descriptions
For the purpose of this report congestions have been investigated for different timeframes. According
to this time criterion, different types of congestions are observed for the following three processes:
D-2 Cross-border capacity calculation D-1 Short-term operational planning by TSOs (after DA gate closure time until real-time)
Remaining security violations in real-time system operation by TSOs
All three processes are briefly described below.
D-2 Cross-border capacity calculation:
Within this process TSOs calculate cross-zonal capacities, which are offered to market participants
(for a given timeframe). The objective of this security assessment is to obtain the maximum possible
transmission capacity for a given time frame and a certain cross-zonal interface (including so called
technical profiles, which encompass several bidding zone borders) that is compatible with individual
TSO security standards. All grid elements2 have finite capabilities defined by their design and
construction. Therefore, these grid elements are, besides other technical aspects, the limiting factors
when assessing cross-border transmission capacity. For the purpose of this Technical Report, such
limiting elements are called critical network elements. Before available capacities are provided to the
1 https://www.entsoe.eu/publications/market-reports/ntc-values/ 2 lines, transformers, breakers etc.
Technical Report
9
ENTSO-E AISBL • Avenue de Cortenbergh 100 • 1000 Brussels • Belgium • Tel + 32 2 741 09 50 • Fax + 32 2 741 09 51 • [email protected] • www. entsoe.eu
market, they are also subject to mutual harmonization and coordination between neighbouring TSOs.
A limited cross-border capacity does not necessarily decrease social welfare, as it might be the case
that the markets may not need more cross-border exchange capacity than they have been provided
with.
Short-term operational planning by TSOs
During this process (from day ahead towards intraday operational planning) TSOs use updated
available data for short-term forecasts (e.g. DACF3). In particular, information resulting from the
previous processes (cross-border as well as internal transactions), information about RES, updated
load forecasts and unforeseen events are taken into account. Grid security violations which occur
during these processes are caused by deviations from forecasts and they may be a consequence of
improper market design (e.g. market based dispatch of power plants, too many capacities offered to
and used by the market, loop flows etc.). Other reasons include unexpected changes in the grid
topology or the generation or load pattern. During this phase congested network elements are
identified. These processes also serve as a basis for identifying possible remedial measures to prevent
or mitigate the forecasted security violations in these congested network elements.
Real-time system operation by TSOs
In this process, congestions on grid elements caused by unscheduled flows and unexpected
(unplanned) events are identified. The aim of all previous congestion management procedures is to
avoid congestions at this stage. In contrast to the previous stages, they represent a more immanent
physical risk. Therefore, these physical congestions are treated as security violations.
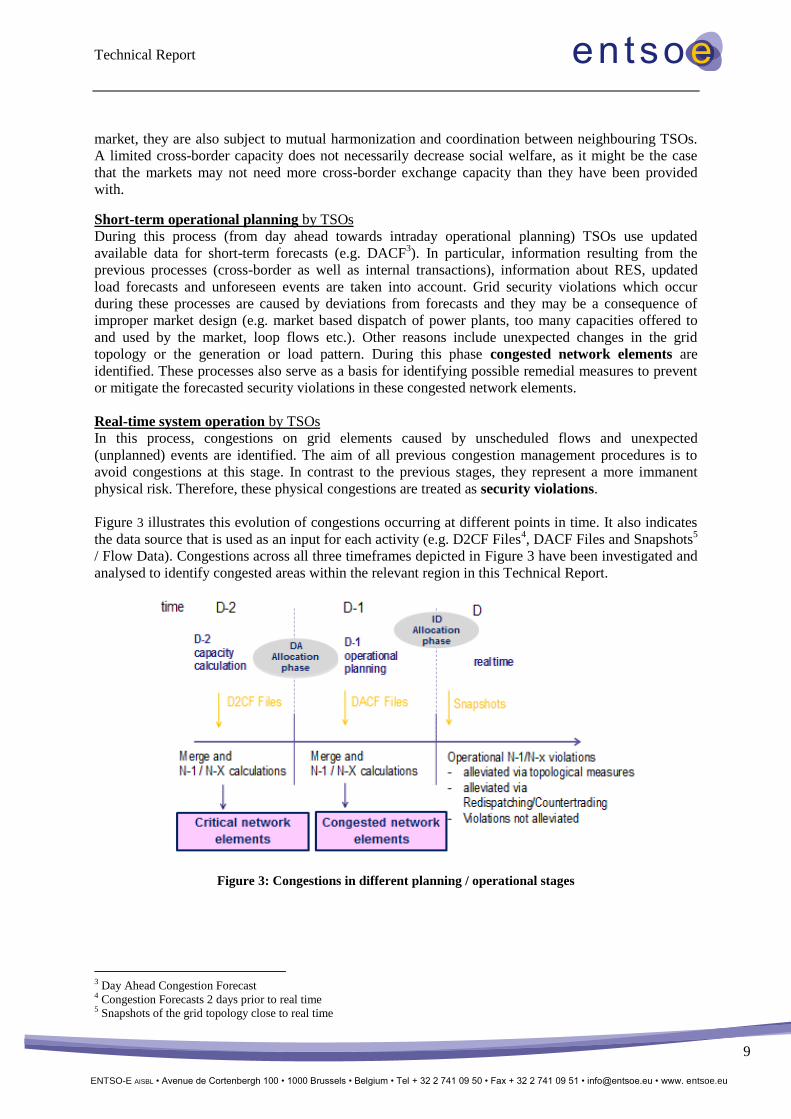
Figure 3 illustrates this evolution of congestions occurring at different points in time. It also indicates
the data source that is used as an input for each activity (e.g. D2CF Files4, DACF Files and Snapshots
5
/ Flow Data). Congestions across all three timeframes depicted in Figure 3 have been investigated and
analysed to identify congested areas within the relevant region in this Technical Report.
Figure 3: Congestions in different planning / operational stages
3 Day Ahead Congestion Forecast 4 Congestion Forecasts 2 days prior to real time 5 Snapshots of the grid topology close to real time

Technical Report
10
ENTSO-E AISBL • Avenue de Cortenbergh 100 • 1000 Brussels • Belgium • Tel + 32 2 741 09 50 • Fax + 32 2 741 09 51 • [email protected] • www. entsoe.eu
2.3. Congested areas in 2011 and 2012 and their future evolution
Congestions and congested areas can be identified based on available information and data related to
the processes described in section 2.2. Such information may encompass results of calculations,
recorded real-time data or a track record of measures related to remedial actions. With the help of
expert knowledge, critical and frequently congested network elements were aggregated into areas in
which congestions appear. These areas do not represent all congested network elements that have been
identified by the participating TSOs for the years 2011 and 2012. Only the most significant clusters
are represented.
TSOs follow different data gathering and data storing policies. Furthermore, the regional initiatives
employ not entirely homogeneous approaches to capacity calculation (from bilateral NTCs to technical
profiles). In this context, clustering the information into comparable congested areas represents a
cautious approach that considers the limited comparability of the available data.
For the purpose of this Technical Report, clusters of critical network elements in the D-2 capacity
calculation phase and congested network elements in the D-1 operational planning phase have been
combined. Both are represented in Figure 4. The presented congestion areas provide only a subset of
the network elements in which congestion occurred in the years 2011 and 2012.
Several TSOs which are within the scope of this Bidding Zone Review are part of the TSO Security
Cooperation (TSC). New projects for Mid- and Long Term Operational Planning as well as an
improved coordination for Short Term Operational Planning Procedures such as DACF and IDCF aim
at a further improvement of the grid situation and of the security of supply throughout the European
interconnected electricity system.
Figure 4: Critical/Congested network element clusters: Planning phase (D-1 and D-2 in 2011 and 2012)

Technical Report
11
ENTSO-E AISBL • Avenue de Cortenbergh 100 • 1000 Brussels • Belgium • Tel + 32 2 741 09 50 • Fax + 32 2 741 09 51 • [email protected] • www. entsoe.eu
Figure 5 represents congestions which have been identified in the real-time phase.
Figure 5: Congestion clusters: Operational phase (real-time)
Compared to congestions in the planning phase congestions in the operational phase last for a
significantly shorter duration. Each of the congested areas illustrated in Figure 4 and Figure 5 are
briefly described below.
Congested Area No. 1 [TenneT NL]
Due to the connection of new power plants before the completion of necessary grid reinforcements in
the region of Maasvlakte congestion management was needed. In case of potential congestion in the
planning phase, bids were collected and awarded to avoid actual congestions in the operational phase.
With the completion of the reinforcement projects in 2013 the matter has been resolved.
Congested Area No. 2 [TenneT NL, Elia, Rte]
This cluster expands from the Netherlands (Borssele region), crosses the north trunk of the Belgian
grid (via Zandvliet - Avelgem) and continues south-bound towards France (to the Avelin region).
Some years, the cluster also spreads out within France and parallel to the Belgian border, between
Areas 2 and 3.
This area limits the French-Belgium capacity about 15% of the time.
The main reason for this congestion is the 800-1000 MW expected unscheduled flow that partially
crosses this cluster (together with cluster 3). It does so both in the north (1.2 GW max., 100 MW min.)
and south direction (1.7 GW max., 100 MW min.). The forecasted direction changes depending on
various patterns. The most important of these are related to Renewable Energy Sources (RES),
generation expected profiles (wind, sun) and RES-related constraints (temperature and availability of
water for power plant cooling in certain areas). Unplanned outages play a much less important role. It
is important to note that the main drivers for this congestion are in almost all cases located outside of
the cluster itself.
Technical Report
12
ENTSO-E AISBL • Avenue de Cortenbergh 100 • 1000 Brussels • Belgium • Tel + 32 2 741 09 50 • Fax + 32 2 741 09 51 • [email protected] • www. entsoe.eu
There are no congestions in the operational phase; these disappear during the real-time phase due to
enhanced regional coordination, accompanied by several non-costly topological measures and (to a
much lesser extent) redispatch.
By 2016, the congestion reported and already anticipated for the planning stage is expected to decrease
due to the set up in of an additional phase shifter transformer Zandvliet (Belgium-Netherlands
Border). The relieving impact of this project on any planned congestion will be particularly
significant. Additionally, the Stevin Project6 will further reinforce the network in the Belgian north
during this same period. Reinforcement is also planned on the French grid between 2016 and 2018; the
Avelin-Gavrelle line will be rebuilt as a double circuit line7.
By 2018, the congestions reported and anticipated for the planning stage will also decrease due to the
completion of the following projects: as part of the general Project Brabo8 in Belgium, an investment
is expected on the Doel-Zandvliet axis by upgrading an existing 150 kV circuit to 380 kV which will
alleviate constraints on the existing network, and a DC link between Belgium and the United Kingdom
(Nemo Link ®)9 will be commissioned and built.
Congestions on the Dutch side during the D-2 planning phase (currently mainly during scheduled
maintenance) will be reduced with the completion of the Zuid-West 380 project, which is expected by
2019.
In 2023, the congestions reported and anticipated for the planning phase will be further reduced by an
upgrade and capacity reinforcement of the Belgian Avelgem-Doel10
line in order to accommodate
increased physical flows on the grid.
Congested Area No. 3 [TenneT NL, Elia, Rte]
This cluster extends from the Netherlands (Eindhoven region), crosses the central-south trunk of the
Belgian grid (via Van-Eyck - Gramme) and follows south-bound towards France (Lonny – Aubange
area). It continues within France (via Moulaine) towards Lonny-Vesle.
This area limits the French-Belgium capacity about 20% of the time.
6 The Stevin project addresses several major needs. It enables Belgian offshore wind power to be brought inland and
transmitted to the domestic market. It is necessary in order to create a further interconnection with the Belgian grid via a
subsea connection to the United Kingdom. This expansion of the 380 kV grid will significantly improve the electricity supply
for the West Flanders region, and make further economic development possible in the strategically important growth area in
and around the port of Zeebrugge. It enables the connection of additional decentralised electricity generation (wind, solar and
other forms of sustainable energy) in the coastal region. A strong 380 kV backbone between the coast and the inland parts of
the country, which Stevin will provide, is therefore necessary. For more information on this project please consult:
http://www.elia.be/en/projects/grid-projects/stevin
7 Overview of the planned grid development by RTE: http://www.rte-
france.com/uploads/Mediatheque_docs/vie_systeme/annuelles/Schema_developpement/Schema_decennal_2012_V2.pdf
8 The Brabo Project will shore up the high-voltage grid and will consolidate security of supply for both the port of Antwerp
and Belgium as a whole. This latter project is two-fold. On the right bank of the River Scheldt, in the Berendrecht-Zandvliet-
Lillo district of Antwerp, a new 380 kV line will be built between the high-voltage substations at Zandvliet (near BASF) and
Lillo (near the Liefkenshoek Tunnel). This will cross the River Scheldt to Liefkenshoek. On the left bank of the River
Scheldt, the existing 150 kV line between Liefkenshoek and the Mercator high-voltage substation will be modernised and
upgraded to 380 kV. For more information on this project please consult: http://www.elia.be/en/projects/grid-projects/brabo
9 Nemo Link® is the name of a project to lay high voltage electricity cables under the sea, improving the link between UK
and European electricity generation for consumers in the UK and across the continent. It is a joint project between National
Grid Nemo Link Limited, a subsidiary company of the UK’s National Grid PLC, and the Belgian Elia Group. The project
will give both countries improved reliability and access to electricity and sustainable generation. Nemo Link® will consist of
subsea and underground cables connected to a converter station and an electricity substation in each country, which will
allow electricity to flow in either direction. The proposed site for the converter station and electricity substation in the UK is
an eight hectare piece of land, formerly occupied by the Richborough Power Station, which now forms part of the
Richborough Energy Park proposals. A similar converter station and substation is proposed in Zeebrugge, Belgium. For more
information on this project please consult: http://www.nemo-link.com
10 TYNDP Projects 380.73+74.
Technical Report
13
ENTSO-E AISBL • Avenue de Cortenbergh 100 • 1000 Brussels • Belgium • Tel + 32 2 741 09 50 • Fax + 32 2 741 09 51 • [email protected] • www. entsoe.eu
The main reason for this congestion is the 800-1000 MW expected unscheduled flow that partially
crosses this area (together with Area 2). Please see the epigraph of Area 2 for an explanation of the
causes involved. Again, it is important to note that the main drivers for this congestion are in almost
all cases located outside of the cluster itself. As in Area 2, there are no congestions in the operational
phase. All the congestions that are registered during the planning phase effectively disappear thanks to
enhanced regional coordination accompanied by topological measures and (to a lesser extent)
redispatch.
During 2016, the congestion reported and already anticipated for the planning stages is expected to
decrease due to the reinforcement of the Belgian north-south axis (Gramme)11
. Reinforcement is also
planned on the French grid between 2016 and 2018. The Lonny-Vesle line will be rebuilt as a double
circuit line12
.
During 2018, the congestion reported and already anticipated by Elia for the planning stage is also
expected to decrease significantly due to the commissioning of an additional DC link with Germany
(Alegro)13
.
Congested Area No. 4 [TenneT NL, Amprion]
The lines indicated by cluster 4 were identified during the D2CF- and the DACF- processes. The
occurrence of congestion in this area is dependent on the amount of wind energy in the German grid.
However, due to a functioning congestion management system there are no congestions in the
operational phase at the DE-NL border.
In order to ensure a future reduction of congestions for this area, there are two new connections
planned. The first one is the new connection from Doetinchem to Niederrhein14
. The second one is a
new connection between Germany and Belgium (Alegro)13
which will also reduce the congestions at
the German-Netherlands border. Planning and coordination have been regionally enhanced by the
creation of SSC.
Congested Area No. 5 [Amprion, Rte]
The critical elements on the French-German border and internal elements of the French grid close to
the border limit the capacity. The lines are crucial elements for exchanges in the CWE MC area
between two large import/export bidding zones. The lines indicated by the cluster have been identified
during the D2CF- and DACF- processes.
The lines are not congested during the operational phase due to coordinated capacity calculation in the
CWE area and the use of non-costly topological measures.
11 The reinforcement of the Gramme-Zutendaal-Van Eyck line (region Genk-Kinrooi-Maaseik) will increase the transport
capacity of the Belgian network in order to guaranty security of supply and energy exchanges with the neighbouring
countries (via the Netherlands). This project contains a reinforcement and adaptation of the existing 380 kV and 150 kV
network between the existing substation at Van Eyck, the future substation at André Dumont and the existing substation at
Langerlo. The project starts in March 2013 and has scheduled completion by 2015. For more information on this project
please consult: http://www.elia.be/en/projects/grid-projects/~/media/files/Elia/Projects/Other/130517_Elia-Van-Eyck.pdf (in
Dutch only).
12 Overview of the planned grid development by RTE: http://www.rte-
france.com/uploads/Mediatheque_docs/vie_systeme/annuelles/Schema_developpement/Schema_decennal_2012_V2.pdf
13 The high-voltage electricity systems around the German city of Aachenand Liège in Belgium are relatively well developed
and close to each other but they are not yet directly connected. Therefore, the two transmission system operators (TSO) in
these areas, Elia (Belgium) and Amprion (Germany) have decided to lay an underground direct-current link between their
transmission systems. The whole route for this link, which will be known as ALEGrO (standing for the Aachen-Liège
Electric Grid Overlay) and will use direct-current technology, will be laid underground. The works are expected to start in
mid 2016 and to take around two years to complete, from constructing the converter stations to laying cables along the entire
route. The commissioning of the interconnection is anticipated in late 2018. For more information on this project please
consult: http://www.elia.be/en/projects/grid-projects/alegro/alegro-content and http://www.amprion.net/netzausbau/alegro-
hintergrund
14 TYNDP Project of pan European significance No. 103, http://www.amprion.net/netzausbau/wesel-niederlande-hintergrund

Technical Report
14
ENTSO-E AISBL • Avenue de Cortenbergh 100 • 1000 Brussels • Belgium • Tel + 32 2 741 09 50 • Fax + 32 2 741 09 51 • [email protected] • www. entsoe.eu
Planning and coordination have been regionally enhanced by the creation of CORESO and SSC.
Due to a functioning capacity management system at the German-French border there are no
congestions during real-time.
Rte and Amprion are observing and investigating the situation at the French-German border together.
With the decommissioning of French nuclear power plants (Fessenheim for example), the flow pattern
will change in the area. Furthermore, a reinforcement of the grid in the Alsace region is expected15
.
The new line that is going to be built between Germany and Belgium (Alegro)13
will also help to
further reduce the congestions at the German-French border.
Congested Areas in the North (No. 6 and A) and West (No. 7 and B) of Switzerland
[Rte, Swissgrid, TransnetBW, Amprion]
Imports and high north-south transit flows due to price differences and the demand situation in
Switzerland and Italy are causing congestions in northern Switzerland.
The grid in northern Switzerland is highly meshed and the appearance of congestions is dependent on
maintenance activities in the area of the bidding zone border. Maintenance activities can lead to a
decrease in the available cross-border capacity, especially in the planning phase.
Therefore, the occurrence of congestions in this area is influenced by national and also regional
characteristics.
The main reason for the congestions on the Swiss-French border is the high export situation from
France. This is often dependent on weather conditions, as France has a high level of production, but
less demand in case of early but warm winters. In general, the congested areas in the planning phase
correspond to those in the operational phase. Nevertheless, the ratio of security violations occurrences
compared with those in the planning phase is rather small (ten times lower than forecasted). Moreover,
Swissgrid pursues a comparatively strict policy with regard to reporting (n-1) situations. Every
element overloaded in the (n-1) case above 100% is reported as a security violation, even when
sufficient remedial actions are available.
Since numerous grid reinforcements are planned during the next ten years, the high north-south transit
situation and the following congestions might be relieved in particular areas. In any case, this depends
on the generation and demand situation within Switzerland and in adjacent countries, along with the
general development of IEM flows.
Furthermore, construction and extension of the transmission grid in the Bodensee area is being
investigated by APG, Swissgrid, TransnetBW, Amprion and also the VUEN16
. Further investigation of
the area will take place as part of the activities of ENTSO-E.
Congested Area No. 8, 9, 13, 14, D, C, I and J – Northern Italian Borders
[Terna, APG, Swissgrid, Rte]
With Italy being an importing country, the situation at the northern Italian borders is generally
characterized by high import flows from France, Switzerland, Austria and Slovenia. The situation can
be also influenced by specific outages in all the related countries.
In general, the congested areas at the northern Italian borders are more or less the same in the planning
phase as the ones in the operational phase. Nevertheless, the ratio of security violation occurrences
compared with the ones in the planning phase is rather small.
The Italian-French border (cluster 9 and D) is rarely congested. Furthermore, a thermal capacity
increase of the whole 380kV connection Albertville - La Coche - La Praz - Villarodin - Venaus -
Piossasco was completed in 2013, and this border will be also enhanced in the future thanks to the new
HVDC link Grand’Ile-Piossasco (2019). In addition, further internal developments are expected on
both the Italian and French sides.
The Italian-Swiss border (cluster 8, C) is generally the most congested of the northern Italian borders
(anyhow the occurrence of congestions, both in the planning and in operational phases, is not high).
15http://www.rtefrance.com/uploads/Mediatheque_docs/vie_systeme/annuelles/Schema_developpement/Schema_decennal_2
012_V2.pdf 16 TYNDP project number 90.136

Technical Report
15
ENTSO-E AISBL • Avenue de Cortenbergh 100 • 1000 Brussels • Belgium • Tel + 32 2 741 09 50 • Fax + 32 2 741 09 51 • [email protected] • www. entsoe.eu
Swissgrid applies a specific policy regarding the operational limits of their lines, which does not allow
any temporary overloading on Swiss lines. This means, that every element being overloaded in the (n-
1) case above 100% is reported as a security violation, even though remedial actions are available to
solve the problem. Furthermore, unscheduled flows in the area CH-DE-FR-IT affect this border. The
Italian-Swiss border is the only northern Italian border that has no PST installed, while all the other
borders (IT-FR; IT-AT; IT-SI) are controlled by this machinery. Therefore, the possibility of
controlling the power flows on the Swiss border is lower compared to the other borders. A new HVDC
link (Pallanzeno – Airolo) and internal reinforcements are under investigation to enhance the
interconnection between Italy and Switzerland.
The Italian-Austrian border (cluster 14, I) showed congestions in 2011 and 2012 on the sole
connection both in the planning and operational phases mainly due to high production in Carinthia, but
these congestions were quickly and easily resolved by a dedicated topological remedial action. In
order to solve these congestions a PST was installed in Lienz on the existing 220 kV line in the second
part of 2012, and in 2013 a new 150 kV connection was put in operation. Additionally, a new 220 kV
link between Italy and Austria (Curon – Nodrio) is under investigation to enhance the interconnection
in the north of Italy, and the reconstruction of the existing 220 kV Soverzene-Lienz line as 380 kV line
on an optimized route is anticipated.
The Italian-Slovenian border (cluster 13, J) sometimes showed congestions on the 220 kV
interconnection in (n-1)-security, but there is a special protection scheme operating on this border
designed to solve these congestions. Additionally, on both the 380 kV and 220 kV interconnections,
PSTs are installed in order to manage the flows at the border. In the future, a new double circuit 400
kV OHL between Okroglo(SI) and Udine(IT) with PST in Okroglo is anticipated. Furthermore, a New
HVDC link between Italy and Slovenia (Salgareda – Divacca) border is under investigation to enhance
the interconnection between these countries.
Figure 6: Network developments at the northern Italian borders
Congested Area No. 10 and M [50Hertz-TenneT East-West]
The cluster comprises the 380 kV Mecklar - Vieselbach and Helmstedt – Wolmirstedt lines directed
from west to east (inner German lines). The cluster has no relevance for D-2 cross-border capacity
calculation. D-1 congestions (DACF process) are healed in D-1 or by remedial actions in the
operational phase. The remaining congestion ((n-1)-violations) in the operational phase occurred in
single hours (real-time). The cluster is mainly historical, especially with regard to the line Helmstedt -
Wolmirstedt, due to the construction of a new 380 kV line in the north of Helmstedt - Wolmirstedt
(the line between Krümmel and Görries). The new line was commissioned in December 2012,
supporting power transmission between the east and west of Germany.
Technical Report
16
ENTSO-E AISBL • Avenue de Cortenbergh 100 • 1000 Brussels • Belgium • Tel + 32 2 741 09 50 • Fax + 32 2 741 09 51 • [email protected] • www. entsoe.eu
Congested Area No. 11 and E [PSE, 50Hertz]
The observed congestions are similar in the planning and operational phases. In the planning phase
necessary analyses are based first on individual estimations in capacity calculation and on the common
TSC approach in the day ahead process. As preparation for the operational phase, bilateral or
multilateral remedial actions may be needed to fulfil the security criteria for the profile between PSE
and 50Hertz.
The relevant, highly congested tie-lines are: 220 kV Krajnik - Vierraden (both circuits) and 380 kV
Hagenwerder-Mikułowa, the internal 400 kV Mikułowa – Czarna line and the 400/220 kV
transformers in Mikułowa. Other congested lines are the 220 kV Mikułowa - Świebodzice line (both
circuits), the 220 kV Mikułowa - Cieplice, line and the AT2 400 MVA autotransformer in Krajnik.
The congestions listed above are caused by high physical flows from 50Hertz to PSE. These flows are
correlated with periods of high generation in the 50 Hertz area. In the planning stage, the transmission
capacity offered to the market is limited as unscheduled flows have to be taken into account.
Unscheduled flows, composed of loop and transit flows, are influenced by various factors including
volatile injections and commercial schedules from northern to southern parts of Europe.
The congestions in the operational phase are eliminated by remedial actions (including bilateral and
multilateral actions).
The installation of phase shifters is planned in the coming years on all four tie-lines between PSE and
50Hertz to reduce the profile load. In addition, a new interconnector, a 400 kV double circuit line
between Eisenhüttenstadt and Plewiska (TYNDP project 58.140), is planned to be built.
Congested Area No. 12 and F [CEPS, 50Hertz]
In D-2 (capacity calculation stage) all elements (especially the cross border lines) that are relevant for
cross-border capacity calculation are monitored (contingency list according to ENTSO-E Operational
Handbook). NTC values at the CEPS-50Hertz border are determined in close coordination with the
CEPS-TenneT-D profile. In addition, the impact of the CEPS-PSE border is taken into account in case
of topology changes. The mutual interdependencies between the CEPS-TenneT-D and CEPS-50Hertz
profiles via the CEPS grid (subst. Hradec u Kadane, etc.) are important and the level of unscheduled
flows at the CEPS-50Hertz border has to be considered when the NTC between CEPS and 50Hertz is
assessed.
From CEPS’s side, elements monitored in D-2 appeared in the D-1 stage as well, with various
occurrences. Congestions are managed on the CEPS side by reducing NTCs (in the direction of CEPS)
for day ahead and intraday market time frames.
The assumed reason for congestions (common for all stages) on the CEPS side is the high level of
physical resp. unscheduled flows from the 50Hertz area to the CEPS area over this border in cases of
high transit (resp. loop) flows from north(west) to south(east).
From CEPS’ side, the same elements monitored in D-2 and D-1 appeared in this stage, with various
occurrences. Congestions are usually relieved by internal, bilateral or multilateral remedial actions. In
some limited cases (in 2011) however, remedial actions were either not available or exhausted, leading
to (n-1)-violations.
A phase shifting transformer at the CEPS-50Hertz cross-border connection is envisaged by 2016.
Congested Area No. 15 and L [CEPS, PSE, SEPS]
The CEPS-SEPS profile consists of three 400 kV lines and two 200 kV lines. This is the strongest
CEPS cross-border profile. However, there is a strong mutual interdependency with CEPS-PSE, and
the respective SEPS-PSE profiles. Highly congested tie-lines are the 220 kV Liskovec- Povazska
Bystrica line and the 400 kV Nosovice-Varin line.
The CEPS-PSE profile consists of two 400 kV lines and two 200kV lines. There is a high
interdependency with the PSE-SEPS profile. Highly congested tie-lines are the 220 kV Kopanina -
Liskovec and Bujaków – Liskovec, congested tie-lines are the 400 kV Wielopole - Nosovice, Krosno
and the Iskrzynia – Lemieszany.

Technical Report
17
ENTSO-E AISBL • Avenue de Cortenbergh 100 • 1000 Brussels • Belgium • Tel + 32 2 741 09 50 • Fax + 32 2 741 09 51 • [email protected] • www. entsoe.eu
From the perspective of CEPS, PSE and SEPS the assumed reason for congestion is unscheduled
flows and loop flows from Germany’s resp. common AT/DE/LU bidding zone. As the generation is
located in the northern part and load centers are located in southern parts unscheduled flows cross
PSE-50 Hertz profile, flow through Polish power system and further to CEPS grid. These flows are
modulated with PSE exchanges. The most critical situation occurs when the load centre is in the
Balkan peninsula and or if the PSE-SEPS profile is out of operation due to maintenance. In this case,
CEPS-PSE and CEPS-SEPS profiles are further congested.
The description of the congestions applies for both the planning phase and the operational phase.
A reduction of unscheduled flows due to the common AT/DE/LU bidding zone is envisaged by
installing Phase Shifting Transformers (PST) at the CEPS-50Hertz border. The greatest effect should
be achieved by installing PST on PSE-50Hertz border. The installation of phase shifters on all four tie-
lines between PSE and 50Hertz is planned in the coming years.
Congested Area No. 16 and N [50Hertz-TenneT North-South]
This cluster comprises the 380 kV lines Remptendorf - Redwitz and partially Mecklar - Vieselbach
(inner German lines). The Remptendorf - Redwitz line is considered in D-2 capacity calculation
(‘monitored branch’), but the line is not an active constraint (no D-2 congestion limiting cross-border
capacity). D-1 congestions (DACF process) are healed in D-1 or by remedial actions in the operational
phase. Remaining congestion ((n-1)-violations) in the operational phase occurred in single hours (real-
time). The transmission corridor has been strengthened by replacing the line cables between
Remptendorf - Redwitz in December 2012 (increasing the transmission capacity by 300 MW). In
addition, the construction of a new 380 kV Vieselbach - Redwitz line (TYNDP project 45.193) is
expected to be finished by 2016.
Congested Area No. 17 [TenneT NL]
This cluster reflects the internal Ens – Lelystad line. Potential congestions regularly appear in the
planning phase. Potential congestion arises in cases of high cross-border flows at the Dutch – German
border. Overload can be mitigated by remedial actions using PST steps. This bottle neck has been
identified in the recently published Quality and Capacity Plan for the Netherlands, where it is
discussed in more detail. Reinforcement has been planned.
Congested Area No. 18 and K [Mavir, Seps]
In a narrow sense, this congestion area consists of the existing two tie-lines between Slovakia and
Hungary. On the other hand, there is high interdependency among the lines of the so called CEE
profile. This profile consists of the tie-lines between Czech Republic and Austria, Slovakia and
Hungary and, Slovakia and Ukraine. The loading of this profile highly depends on loop and transit
flows in the CEE region.
The area is congested up to 3-8 % of the time, but the market demand is continuously higher than the
available network capacity.
From MAVIR’s and SEPS’s perspective (based on their expert knowledge), the reason for the
congestion is on one hand the large and volatile RES feed from the northern part of Germany and the
high level of import position in the southern CEE area (APG and MAVIR). On the other hand, the
loop and transit flows result in much higher actual north-to-south flows than the scheduled levels. This
causes the uncertainty in the network capacity determination and thus the restriction of the market
activities.
Congestions in the operational phase are handled with curative topological remedial actions.
There are new network investments planned on the SK-HU border (a double circuit Gabcikovo -
Gonyu 400 kV tie-line17
and double circuit Rimavska Sobota - Sajoivanka 400 kV tie-line equipped
17 TYNDP 2012 project number: 48
Technical Report
18
ENTSO-E AISBL • Avenue de Cortenbergh 100 • 1000 Brussels • Belgium • Tel + 32 2 741 09 50 • Fax + 32 2 741 09 51 • [email protected] • www. entsoe.eu
only by one circuit) by 2018. The expected effect is that the Győr - Gabcikovo tie-line will be critical
much less frequently.
Additional network investment is planned in connection with the SK-HU border (a double circuit
Velke Kapusany - Kisvarda 400 kV tie-line18
).
Congested Area No. 19 and G [CEPS, TenneT-D]
In D-2 (capacity calculation stage) all elements (especially the cross-border lines) that are relevant for
cross-border capacity calculation are monitored (contingency list according to ENTSO-E Operational
Handbook). NTC values at the CEPS-TenneT-D border are determined in close coordination with the
CEPS-50Hertz profile. Additionally, the impact of the CEPS-APG border is taken into account by
CEPS in case of topology changes. Due to mutual interdependencies between the CEPS-TenneT-D
and CEPS-50Hertz profiles via the CEPS grid (subst. Hradec u Kadane etc.) the level of unscheduled
flows at the CEPS-50Hertz border has to be taken into account from CEPS’ point of view when the
NTC between CEPS and TenneT-D is assessed.
D-1 Congestions (DACF process) are healed in D-1 or by remedial actions in the operational phase.
From CEPS’ side, some of the elements monitored in D-2 appeared in this stage, with various
occurrences. From CEPS’ point of view the high transit flows in northwest-southeast and southeast-
west directions have a non-negligible impact.
There are no relevant congestions in the operational phase (no (n-1)-violations in real-time) in the
TenneT-D control area. From CEPS’ side, some of the elements monitored in D-2 and D-1 appeared in
this stage, with various occurrences.
A phase shifting transformer at the CEPS-50Hertz cross-border connection is envisaged by 2016.
Congested Area No. 20 and O [CEPS, APG, SEPS]
The interface which causes the congestions in planning phase consists of two parallel 400kV lines
(380 kV line Slavetice - Dürnrohr) and two parallel 200kV lines (Sokolnice - Bisamberg). In D-2
(capacity calculation stage) all elements (especially the cross border lines) which are relevant for
cross-border capacity calculation are monitored (contingency list according to ENTSO-E Operational
Handbook). From CEPS’ side the impact of the border CEPS-TenneT-D and CEPS-SEPS is also taken
into account in case of topology changes. Further the level of unscheduled flows on CEPS-APG
border has to be considered when the NTC between CEPS and APG is assessed.
From CEPS’ side, monitored elements in D-2 appeared at the D-1 stage as well, with various
occurrences. And congestions are attempted to be relieved by reducing NTCs for day ahead and
intraday market time frames.The assumed reason for congestion (common for all stages) on CEPS side
is the high level of physical resp. unscheduled flows in north to south directions due to high
production in the north of Europe and high load in the south (Hungary, Balkan, Austria, Italy). This
becomes stronger in case of topological changes (e.g. maintenance).
From CEPS’ side, the same monitored elements in D-2 and D-1 appeared as well as congestions in the
operational phase, with various occurrences. Congestions are usually relieved by internal or bilateral
remedial actions.
From APG side there was no congestion in real time in 2011 and 2012. Only very rarely (n-1)-load of
about 103% occurred.
For the future evolution of the area there is an expected aggravation due to further renewables in the
north of Europe.
For the development planning in the operational phase is therefore an increase of capacity due to
thermal rating of cross border lines Slavetice - Dürnrohr planned for 2014 (probably not applicable for
D-2). With the planned 380 kV line St.Peter - Germany this congestion should be solved in D-1 and
real-time, as from APG’s point of view. Furthermore, after the installation of Phase Shifting
Transformer on CEPS-50Hertz border a reduction of unscheduled flows over this border is expected.
18 TYNDP 2012 project number: 54

Technical Report
19
ENTSO-E AISBL • Avenue de Cortenbergh 100 • 1000 Brussels • Belgium • Tel + 32 2 741 09 50 • Fax + 32 2 741 09 51 • [email protected] • www. entsoe.eu
Congested Area No. 21 Denmark West - Germany [EnDK / TenneT-D]
In D-2 (capacity calculation stage) all elements that are relevant for cross-border capacity calculation
are monitored (contingency list according to ENTSO-E Operational Handbook). D-1 congestions
(DACF process) are healed in D-1 or by remedial actions in the operational phase. The installation of
the new PST at Kassoe has improved the situation in D-1 and real-time. There are no relevant
congestions in the operational phase (no (n-1)-violations in real-time). In terms of future evolutions,
by 2016 a new 380 kV Dollern - Hamburg/Nord line will be built19
. By 2018, the following will be
constructed:
- a 380kV line Audorf - Flensburg – Kassoe20
- a DC-connection Brunsbüttel/Wilster/district Segeberg –
Großgartach/Goldshöfe/Grafenrheinfeld21
- a 380 kV line Hamburg/Nord – Audorf22
- a 380 kV line Dollern – Landesbergen23
Furthermore, by 2023 a new 380 kV line Brunsbüttel - Süderdonn - Heide - Husum - Niebül –
Denmark is planned24
.
Congested Area No. 22 Lehrte - Mehrum in 2012 [TenneT-D]
The Lehrte-Mehrum line has no D-2 congestion (not relevant for cross-border capacity calculation).
Reported congestions in the D-1 timeframe for the 220kV-line between Lehrte and Mehrum are
caused by local generation/load patterns. Moreover, load flows between the east and west on the 380
kV line between Wolmirstedt and Wahle influence the load flow situation in this region. There are no
relevant congestions in the operational phase (no (n-1)-violations in real-time). In terms of future
evolutions, a new 380 kV Wahle-Mecklar line is planned25
.
Congested Area No. 23 [APG, ELES]
With regard to the 220 kV line Obersielach – Podlog in the D-2 phase congestions are solved with few
restrictions of trading (daily capacity) and special switching for Sokolnice – Bisamberg. In 2011 &
2012 no cross border redispatch was needed. This profile is not highly congested and the assumed
reason of congestion is mostly generation/load situation near the border line and import of Balkan and
Italian Area. There was no congestion in the planning phase in 2011 and 2012.
Congested Area No. H [APG] only 2012 / 220 kV Salzburg - Tauern
Exclusively in 2012, there was a long unplanned outage of the Salzburg-Tauern line due to an
emergency (avalanche, snow slide).
The 220 kV line was out of operation for 6% of the time in 2012 due to an emergency (avalanche).
Regarding the future evolution of the area a 380 kV Salzburg line from St. Peter to Tauern is planned
for 2019.
19 TYNDP project 44.147 / present status: design & permitting phase 20 TYNDP project 39.144 / present status: planning phase 21 TYNDP project 43.A88 / present status: planning - district Segeberg - Goldshöfe under consideration 22 TYNDP project 44.148 / present status: design & permitting phase 23 TYNDP project 44.A157 / present status: planning phase 24 TYNDP project 43.A90 / present status: planning 25 TYNDP project 44.157 / present status: design & permitting
Technical Report
20
ENTSO-E AISBL • Avenue de Cortenbergh 100 • 1000 Brussels • Belgium • Tel + 32 2 741 09 50 • Fax + 32 2 741 09 51 • [email protected] • www. entsoe.eu
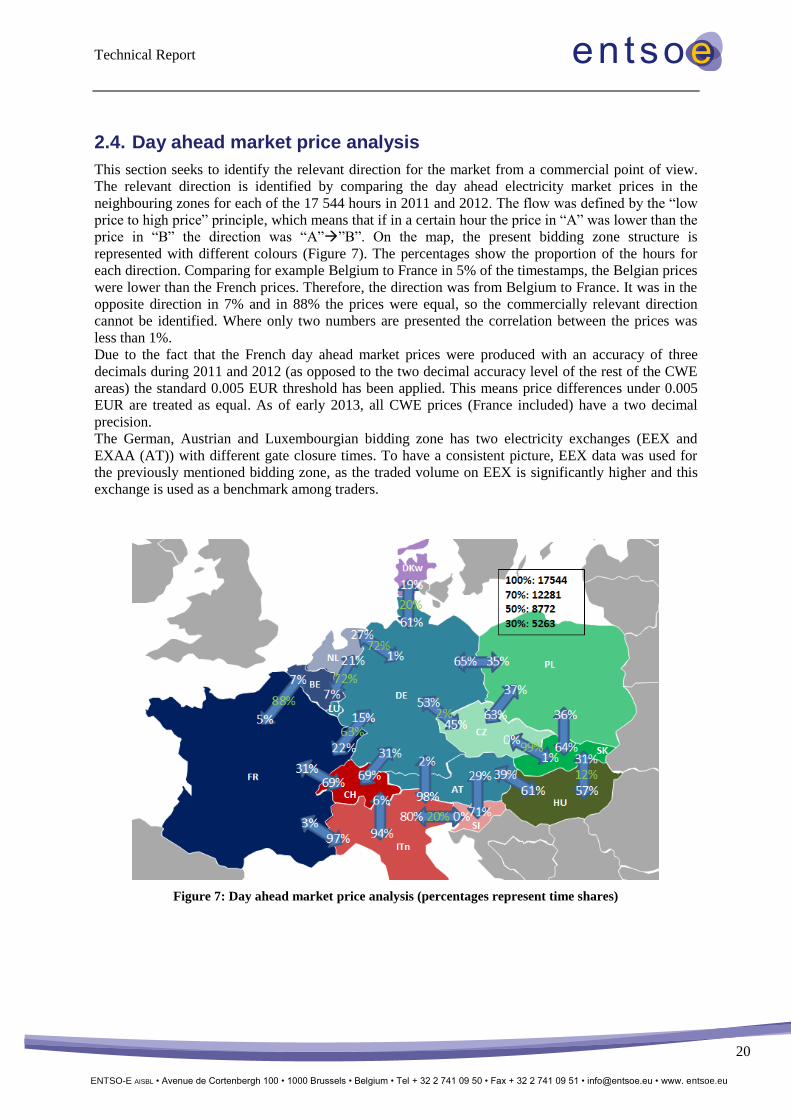
2.4. Day ahead market price analysis
This section seeks to identify the relevant direction for the market from a commercial point of view.
The relevant direction is identified by comparing the day ahead electricity market prices in the
neighbouring zones for each of the 17 544 hours in 2011 and 2012. The flow was defined by the “low
price to high price” principle, which means that if in a certain hour the price in “A” was lower than the
price in “B” the direction was “A””B”. On the map, the present bidding zone structure is
represented with different colours (Figure 7). The percentages show the proportion of the hours for
each direction. Comparing for example Belgium to France in 5% of the timestamps, the Belgian prices
were lower than the French prices. Therefore, the direction was from Belgium to France. It was in the
opposite direction in 7% and in 88% the prices were equal, so the commercially relevant direction
cannot be identified. Where only two numbers are presented the correlation between the prices was
less than 1%.
Due to the fact that the French day ahead market prices were produced with an accuracy of three
decimals during 2011 and 2012 (as opposed to the two decimal accuracy level of the rest of the CWE
areas) the standard 0.005 EUR threshold has been applied. This means price differences under 0.005
EUR are treated as equal. As of early 2013, all CWE prices (France included) have a two decimal
precision.
The German, Austrian and Luxembourgian bidding zone has two electricity exchanges (EEX and
EXAA (AT)) with different gate closure times. To have a consistent picture, EEX data was used for
the previously mentioned bidding zone, as the traded volume on EEX is significantly higher and this
exchange is used as a benchmark among traders.
Figure 7: Day ahead market price analysis (percentages represent time shares)

Technical Report
21
ENTSO-E AISBL • Avenue de Cortenbergh 100 • 1000 Brussels • Belgium • Tel + 32 2 741 09 50 • Fax + 32 2 741 09 51 • [email protected] • www. entsoe.eu
Since the Hungarian day-ahead electricity market joined (11.09.2012) the already coupled Slovak-
Czech market during the analysed period and it had significant impact on the prices, it is essential to
distinguish the period before and after the trilateral market coupling (cf. Figure 8).
Figure 8: Day ahead market price analysis before and after CZ-SK-HU market coupling

Technical Report
22
ENTSO-E AISBL • Avenue de Cortenbergh 100 • 1000 Brussels • Belgium • Tel + 32 2 741 09 50 • Fax + 32 2 741 09 51 • [email protected] • www. entsoe.eu
3. Power flows not resulting from capacity allocation
Within this chapter, an assessment of flows not resulting from capacity allocation is carried out based
on three different approaches. Each approach uses different indicators to calculate the power flows not
resulting from capacity allocation.
In section 3.1 the calculation methodologies and general descriptions are provided. Section 3.2 gives
an overview of the data used. In the first part of section 3.3, the assessment is then performed on a
bidding zone level as explicitly required by the draft CACM NC. Existing bidding zones may include
more than one control area (e.g. even in different member states). This means that bidding zone
borders may consist of borders of more than one TSO or member state. Therefore an additional
chapter is introduced in section 3.3.5, in which the indicators of flows not resulting from capacity
allocation are calculated both at member state level (according to EU regulation 714/200926
) and at
control area level.
3.1. Methodology and general descriptions
This chapter provides a description of the three indicators that are used within this report and how
these are calculated. For the purpose of this Technical Report all three indicators seek to identify
“Power Flows not resulting from Capacity Allocation”. All of them are calculated as the difference
between an “allocated flow” and a “physical flow”. However, for each indicator different
interpretations of “allocated flows” and “physical flows” are assumed. In Table 1, an overview of the
names of the three indicators and their corresponding non-allocated flows is provided:
Table 1: Names of the flows and indicators
Name of the indicator Name of the non-
allocated flow Allocated flows Physical flows
Real-Time Unscheduled
Flows (RTUF) Indicator
Real-Time Unscheduled
Flows (RTUF)
Realized Scheduled
Exchange (SE)
Measured
Physical Flows
(PF)
PTDF Flow Indicator PTDF Flow deviations
(PTDFF)
Flows induced by
all cross border
exchanges (CF)
Measured
Physical Flows
(PF)
Day Ahead
Unscheduled Flows
(DAUF) Indicator
Day Ahead
Unscheduled Flows
(DAUF)
Day Ahead
Scheduled
Exchange (DASE)
Day ahead
calculated Flows
(DACF)
The subsequent sections (3.1.1 until 3.1.2) describe the indicators in further detail.
26 Regulation (EC) No 714/2009 requires that in cases where commercial exchanges between two countries (TSOs) are
expected to affect physical flow conditions in any third-country (TSO) significantly, congestion-management methods
shall be coordinated between all the TSOs so affected through a common congestion-management procedure.
Technical Report
23
ENTSO-E AISBL • Avenue de Cortenbergh 100 • 1000 Brussels • Belgium • Tel + 32 2 741 09 50 • Fax + 32 2 741 09 51 • [email protected] • www. entsoe.eu
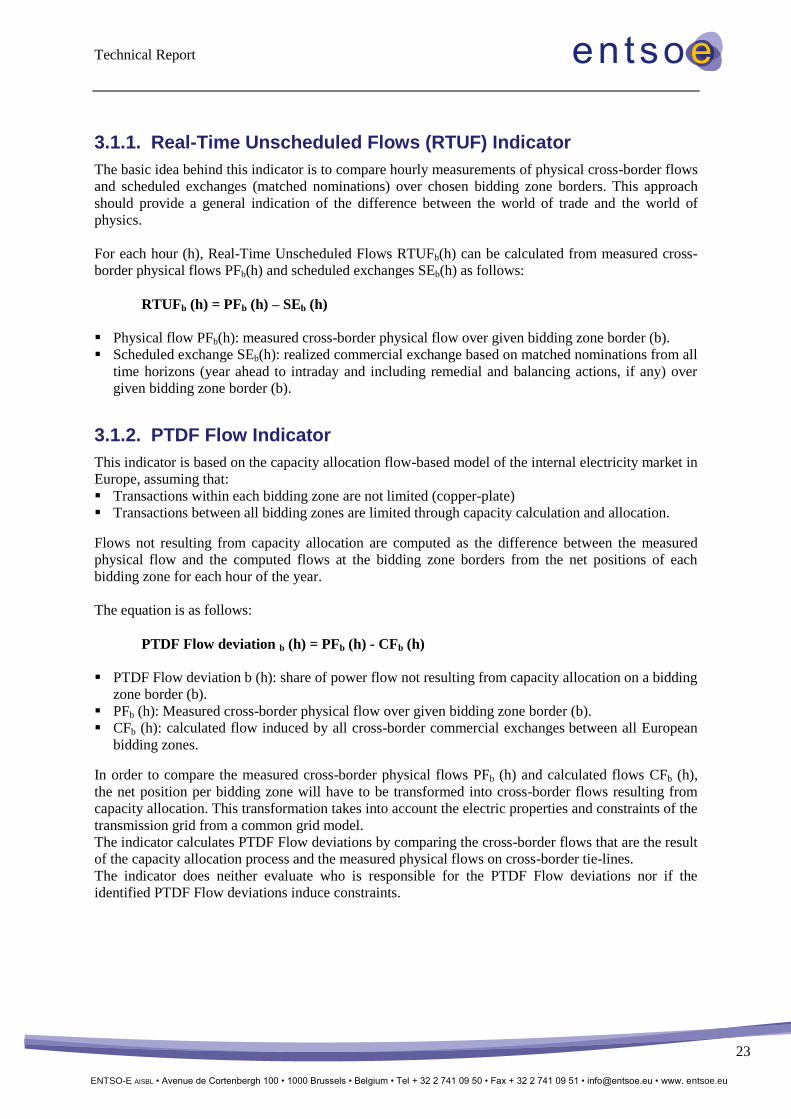
3.1.1. Real-Time Unscheduled Flows (RTUF) Indicator
The basic idea behind this indicator is to compare hourly measurements of physical cross-border flows
and scheduled exchanges (matched nominations) over chosen bidding zone borders. This approach
should provide a general indication of the difference between the world of trade and the world of
physics.
For each hour (h), Real-Time Unscheduled Flows RTUFb(h) can be calculated from measured cross-
border physical flows PFb(h) and scheduled exchanges SEb(h) as follows:
RTUFb (h) = PFb (h) – SEb (h)
Physical flow PFb(h): measured cross-border physical flow over given bidding zone border (b).
Scheduled exchange SEb(h): realized commercial exchange based on matched nominations from all
time horizons (year ahead to intraday and including remedial and balancing actions, if any) over
given bidding zone border (b).
3.1.2. PTDF Flow Indicator
This indicator is based on the capacity allocation flow-based model of the internal electricity market in
Europe, assuming that:
Transactions within each bidding zone are not limited (copper-plate)
Transactions between all bidding zones are limited through capacity calculation and allocation.
Flows not resulting from capacity allocation are computed as the difference between the measured
physical flow and the computed flows at the bidding zone borders from the net positions of each
bidding zone for each hour of the year.
The equation is as follows:
PTDF Flow deviation b (h) = PFb (h) - CFb (h)
PTDF Flow deviation b (h): share of power flow not resulting from capacity allocation on a bidding
zone border (b).
PFb (h): Measured cross-border physical flow over given bidding zone border (b).
CFb (h): calculated flow induced by all cross-border commercial exchanges between all European
bidding zones.
In order to compare the measured cross-border physical flows PFb (h) and calculated flows CFb (h),
the net position per bidding zone will have to be transformed into cross-border flows resulting from
capacity allocation. This transformation takes into account the electric properties and constraints of the
transmission grid from a common grid model.
The indicator calculates PTDF Flow deviations by comparing the cross-border flows that are the result
of the capacity allocation process and the measured physical flows on cross-border tie-lines.
The indicator does neither evaluate who is responsible for the PTDF Flow deviations nor if the
identified PTDF Flow deviations induce constraints.

Technical Report
24
ENTSO-E AISBL • Avenue de Cortenbergh 100 • 1000 Brussels • Belgium • Tel + 32 2 741 09 50 • Fax + 32 2 741 09 51 • [email protected] • www. entsoe.eu
( ∑ [
]
[ ])
For each hour the flows resulting from capacity allocation will be computed using a power transfer
distribution factor (PTDF) matrix and the net positions of the relevant bidding zones from the
synchronous area.
The measured hourly physical flow minus the above vector CFb (h) will be the indicator for each hour.
3.1.3. Day Ahead Unscheduled Flows (DAUF) Indicator
The goal of this indicator is to determine expected flows that do not result from capacity allocation
mechanisms at the day ahead planning stage. It takes into account the NTC based capacity allocation
mechanism as it is the only mechanism that has been used in the whole area covered by the study in
2011 and 2012.
Day Ahead Scheduled Exchanges (DASE) represent all cross-border transactions concluded by market
participants from the long term and day ahead perspectives as the outcome of cross-border capacity
allocation mechanisms.
The Day Ahead Congestion Forecast (DACF) procedure is described in the ENTSO-E RG CE
Operation Handbook – Policy 4: Coordinated Operational Planning. The DACF data sets are generated
after the gate closure of the Day Ahead Cross-Border Market. The results of DACF calculations
identify expected power flows, which are the outcome of all transactions concluded by market
participants within each bidding zone and between all bidding zones from the long term and day ahead
perspectives.
These forecasted flows on particular cross-border lines are aggregated per bidding zone border.
An hourly comparison of the results of DACF calculations and DASE per bidding zone border
determines the expected DAUF. These DAUFs are the result of transactions that cause cross-zonal
flows and at the same time are not subject to and therefore are not controlled by cross-border capacity
allocation mechanisms.
Expected flow that does not result from capacity allocation mechanisms at the day ahead planning
stage (DAUF) for bidding zone border (b) and hour (h) is calculated as follows:
DAUFb(h) = DACFb(h) – DASEb(h)
DACFb(h) – sum of expected power flows on tie-lines of the bidding zone border (b) as result of
the DACF model (h) calculation.
DASEb(h) – matched nominations for long term and day ahead transactions for the bidding zone
border (b) and hour (h) as a result of all cross-border transactions concluded by market participants.
PTDF matrix
(resolution per
bidding zone)
Sum of the flows created by all exchanges
between bidding zones in the synchronous area
at all bidding zone borders
Net positions of the
relevant bidding
zones
Technical Report
25
ENTSO-E AISBL • Avenue de Cortenbergh 100 • 1000 Brussels • Belgium • Tel + 32 2 741 09 50 • Fax + 32 2 741 09 51 • [email protected] • www. entsoe.eu
3.2. Data Sources
This chapter provides a description of the data used for the calculation of the three indicators used in
this Technical Report. The data sources are the “Vulcanus” Database, PTDF calculation and DACF
calculation.
3.2.1. Vulcanus Database
Vulcanus is a web IT platform used by TSOs to store and visualize matched data on control area27
and
control block level28
, amongst others Day Ahead Control Programs and schedules, Intraday Control
Programs and schedules, Realized Control Programs and schedules, and Measured Physical Flow. The
data suppliers (who collect data from the relevant TSOs) are Amprion for the northern part of
Continental Europe, Swissgrid for the southern part of Continental Europe and REE. Data on
measured physical flows, net positions and scheduled exchanges was taken from the Vulcanus
database.
Data is stored primarily in hourly resolution; however for some TSOs data is also available in ¼ hour
resolution.
Measured Physical Flow
These values represent the metered aggregated load flows at the border between two control blocks.
They are uploaded approximately at the end of the following week.
Scheduled exchanges
Day Ahead Scheduled Exchanges (DASE):
These values represent the planned bilateral exchange of each block for the following day. The day
ahead scheduled exchanges include the long term and day ahead matched cross-border
nominations.
Realized Scheduled Exchanges (SE):
These values are the realized schedules of the bilateral exchange of each block. The realized
schedules represent the day ahead schedules with additional intra-day modifications. The Realized
Scheduled Exchanges take into account the long term nominations, day ahead nominations, ID
nominations and potential remedial actions, and may include balancing exchanges. They are
updated as soon as the inadvertent deviation accounting is completed (approximately at the end of
the following week).
Control Programs (Net Position)
Realized control programs (net positions) are the sum of the realized scheduled exchanges of each
block. The realized control program takes into account the long term nominations, day ahead
exchanges, ID exchanges and potential remedial actions, and may include balancing exchanges.
27 A CONTROL AREA is a coherent part of the UCTE INTERCONNECTED SYSTEM (usually coincident with the
territory of a company, a country or a geographical area, physically demarcated by the position of points for measurement
of the interchanged power and energy to the remaining interconnected network), operated by a single TSO, with physical
loads and controllable generation units connected within the CONTROL AREA. A CONTROL AREA may be a coherent
part of a CONTROL BLOCK that has its own subordinate control in the hierarchy of SECONDARY CONTROL. Source:
Continental Europe Operation Handbook 28 A CONTROL BLOCK comprises one or more CONTROL AREAS, working together in the SECONDARY CONTROL
function with respect to the other CONTROL BLOCKS of the SYNCHRONOUS AREA it belongs to.
Source: Continental Europe Operation Handbook
Technical Report
26
ENTSO-E AISBL • Avenue de Cortenbergh 100 • 1000 Brussels • Belgium • Tel + 32 2 741 09 50 • Fax + 32 2 741 09 51 • [email protected] • www. entsoe.eu
3.2.2. Computation of the PTDF matrix
A power transfer distribution factor (PTDF) is an influence (sensitivity) factor in the modification of
the generation or load on the active power flow of a given element of the grid (or a zone). The PTDF
matrix is based on a DC load flow approach. More detailed information on the CWE flow based
initiative is available on the CASC website29
.
The PTDF matrix for all the relevant bidding zone borders is currently unavailable, but it will be
known on an hourly basis when the flow-based capacity calculation and allocation mechanism
becomes widespread in Europe. The PTDF matrix (resolution per bidding zone) has been computed
from a common reference grid model (CGM) and a generation shift key (GSK).
ENTSO-E RGCE (Network Model and Forecast Tool WG) provides two scenarios for CGM: one for
the winter and another for the summer. The files that have been used are from 2012 and 2013.
Table 2: CGM and intervals used
Interval CGM
1/1/2011 31/3/2011 Winter 2012
1/4/2011 31/10/2011 Summer 2012
1/11/2011 31/03/2012 Winter 2012
1/4/2012 31/10/2012 Summer 2012
1/11/2012 31/12/2012 Winter 2013
Only three files are used because of the data availability for 2011. For 2011, 2012 file is used (see
Table 2).
It is not possible to perfectly represent the grid topology as some aspects will not be taken into account
with this approach (e.g. maintenances, modification of topology, new lines, generation and load
pattern, load variation). Different rules are used in Europe for the determination of GSK (e.g. merit
order, linear GSK). For the indicator the computation of the GSK has to be standardized in order to
ensure the comparability of the PTDFs.
For this Technical Report, a GSK with a pro-rata of all generation units connected to the grid model
has been chosen. Non-linear phenomena, e.g. maximal power, are not taken into account. For
example, a bidding zone produces 2000 MW and a power plant in the bidding zone produces 100
MW. If the bidding zone production is increased by 30 MW, the power plant production will be
increased by 1.5 MW (100/2000x30=1.5).
The generation of a bidding zone is increased by 100 MW. If the load of an L line increases by 5 MW,
the PTDF of the bidding zone on the L line will be 0.05. This computation is made for each tie-line
and each bidding zone.
The PTDF matrix is computed on the bidding zone level but in the Vulcanus data base the resolution
can be different. The net position for the Austrian-German-Luxembourg bidding zone is not directly
available. The Vulcanus database provides (among many others) one net position for Germany-
Luxembourg-Denmark West and another net position for Austria. For the computation of the matrix,
the generation units are increased for all four areas at the same time. It is also not possible to compute
the allocated flows between the Austrian-German-Luxembourg bidding zone and the Denmark West
bidding zone.
29 For more information on the flow based approach, CWE FBMC reports are available on CASC website.
http://www.casc.eu/en/Resource-center/CWE-Flow-Based-MC/Documentation

Technical Report
27
ENTSO-E AISBL • Avenue de Cortenbergh 100 • 1000 Brussels • Belgium • Tel + 32 2 741 09 50 • Fax + 32 2 741 09 51 • [email protected] • www. entsoe.eu
The shape of the PTDF matrix is the following for k bidding zones and n borders:
[
]
3.2.3. DACF computation
The DACF (Day Ahead Congestion Forecast) procedure is established for short-term load flow
forecast and security analyses.
Each TSO collects the forecast data for the agreed timestamps (production schedules from the power
plant operators, grid topology, import/export programs etc.). According to the ENTSO-E Operational
Handbook (Policy 4) there are six mandatory data sets for each day (3:30, 7:30, 10:30, 12:30, 17:30,
19:30) for 2011 and 2012. After having collected the complete load flow data sets for all TSOs, these
data sets are merged into models covering the whole area of Continental Europe. These models are
used to improve the operational planning process and identify if – and in case of security violations to
what extent – remedial actions are needed. The first version of the mandatory models is used to
calculate the DACF indicator. These models are available for the second half of 2012 because of the
data storage rules of the common platform for merging all TSO data sets.
Due to the conditions mentioned above, the DAUF Indicator values are calculated for the second half
of 2012 and six mandatory DACF models per day. Instead of 1104 (184 days * six mandatory
models), 1103 values per border are calculated, because one model is missing (19.30 on 05.09.2012).
3.3. Analysis of the indicators
Schedules are a TSO tool for planning system operation after market closure and before real time.
Schedules are agreed plans from generation and consumption units as well as internal and external
commercial exchanges and exchanges between TSOs. Schedules provide the necessary information for
the TSO to operate and balance the system, as well as carry out security analysis. All Schedules in a
scheduling area should sum up to zero within a time period to keep the system in balance. If no faults
occur both consumption and production will be equal to the prognosis. This enables the TSO to
balance its system in real-time with a minimum level of reserves for balancing, compared to the
extensive level of reserves necessary if no schedules are available30
.
In this sense, the Load Frequency Control (although the LFC works on the control area level)
ensures that the sum of all differences between commercial and physical flows over all borders
of a bidding zone and the respective control area is very close to zero. From the bidding zone
perspective, control system differences between schedules and physical flow at one border net off
differences at other borders (netting effect).
In the ideal case of two isolated systems with a single AC interconnection the physical flow will also
always be equal to the schedule. However, in a meshed network and when looking at individual
borders of a bidding zone, differences between schedules and physical flows can be observed. In case
differences between cross-border schedules and measured cross-border physical flows occur the
30 Source: Supporting Document for the Network Code on Operational Planning and Scheduling, Chapter 5.7, Page: 44

Technical Report
28
ENTSO-E AISBL • Avenue de Cortenbergh 100 • 1000 Brussels • Belgium • Tel + 32 2 741 09 50 • Fax + 32 2 741 09 51 • [email protected] • www. entsoe.eu
resulting flow is called a Real-Time Unscheduled Flow which covers loop and transit flows, among
others.
In the following, the calculation of this indicator and two other complementary indicators (described
above) is carried out for each bidding zone border.
3.3.1. Results of the Real-Time Unscheduled Flows (RTUF)
Indicator for the years 2011 and 2012 on a bidding zone basis
The advantages and limitations of the RTUF indicator are shown in Table 3. This is followed by a
graphical representation of the indicator for both years 2011 and 2012. The values of each border for
2011, 2012 and the combined values of both years are given in Table 8, Table 9 and Table 10
respectively. These tables can be found in Annex 5.1 of this document.
Table 3: Advantages and limitations of the RTUF indicator
Advantages Limitations
Verifiable data from an agreed TSO
database, which is available for the whole
investigated period
Measured physical flows include both market and non-
market transactions (internal, bilateral, multilateral
redispatch, primary and secondary reserve power),
with some transactions not being scheduled (e.g.
primary and secondary reserve)
Simplicity of the approach (no CGM
used). No major modification of data is
necessary.
Degree of freedom for nomination paths/ calculation
of scheduled exchanges for similar source/sink
combinations affects the calculated unscheduled flows
(bilateral exchange calculation approach from net
positions in market coupling for example in CWE)
Allows for assessment on the cross border profile
level, not particular network elements. The influence
of (scheduled) transactions on third borders on
physical flows is unknown, but its share could be
considerable
Different capacity allocation mechanisms impact
scheduled exchanges/nominated capacities in different
regions (e.g. market coupling in the CWE region and
explicit capacity allocation in CEE).
Figure 9 shows the average values of the realized scheduled exchanges (blue arrows) and the
measured physical flows (green arrows) for the years 2011 and 2012 (in MW).

Technical Report
29
ENTSO-E AISBL • Avenue de Cortenbergh 100 • 1000 Brussels • Belgium • Tel + 32 2 741 09 50 • Fax + 32 2 741 09 51 • [email protected] • www. entsoe.eu
Figure 9: Average Realized Scheduled Exchanges (blue) & Measured Physical Flows (green)
for the years 2011 and 2012 (both in MW)
The values in Figure 9 should be read in the following way: at the Belgian-French border for example,
the average physical flow is 573 MW from France to Belgium for 2011 - 2012. On the same border,
the average realized scheduled exchange is 1012 MW from France to Belgium.

Technical Report
30
ENTSO-E AISBL • Avenue de Cortenbergh 100 • 1000 Brussels • Belgium • Tel + 32 2 741 09 50 • Fax + 32 2 741 09 51 • [email protected] • www. entsoe.eu
Figure 10 shows the average values of the Real-Time Unscheduled Flows (RTUF) for the years 2011
and 2012 (in MW). For the calculation methodology see Chapter 3.1.1.
Figure 10: Average Real-Time Unscheduled Flows (RTUF) for the years 2011 and 2012 (in MW)
The values in Figure 10 should be read in the following way: at the Belgium-Netherlands border for
example the RTUF flow is 435 MW from the Netherlands to Belgium.

Technical Report
31
ENTSO-E AISBL • Avenue de Cortenbergh 100 • 1000 Brussels • Belgium • Tel + 32 2 741 09 50 • Fax + 32 2 741 09 51 • [email protected] • www. entsoe.eu
Time Split Arrows SE-PF (2011&2012)
The Time Split Arrows shown in Figure 12 are based on the values of Figure 10, which were split
according to their flow direction.
As an example, the values in Figure 11 are explained for given RTUF between bidding zones A and B.
Figure 11: Example Time Split Arrow
a) Number of hours in which the calculated unscheduled flow is directed from bidding zone B
to A divided by total number of hours.
Example: In 97% of the hours the direction of the flow is from B to A.
b) Number of hours in which the calculated unscheduled flow is zero divided by total number
of hours.
Example: In 0% (<1%) of the hours there is no unscheduled flow.
c) Number of hours where the calculated unscheduled flow is directed from zone A to B
divided by total number of hours.
Example: In 3% of the hours the direction of the flow is from A to B.
d) Average value of the calculated unscheduled flow indicator from B to A [MWh/h]
e) Average value of the calculated unscheduled flow indicator from A to B [MWh/h]
The Time Split Arrows for the Real-Time Unscheduled Flows (RTUF) Indicator are shown in Figure
12.
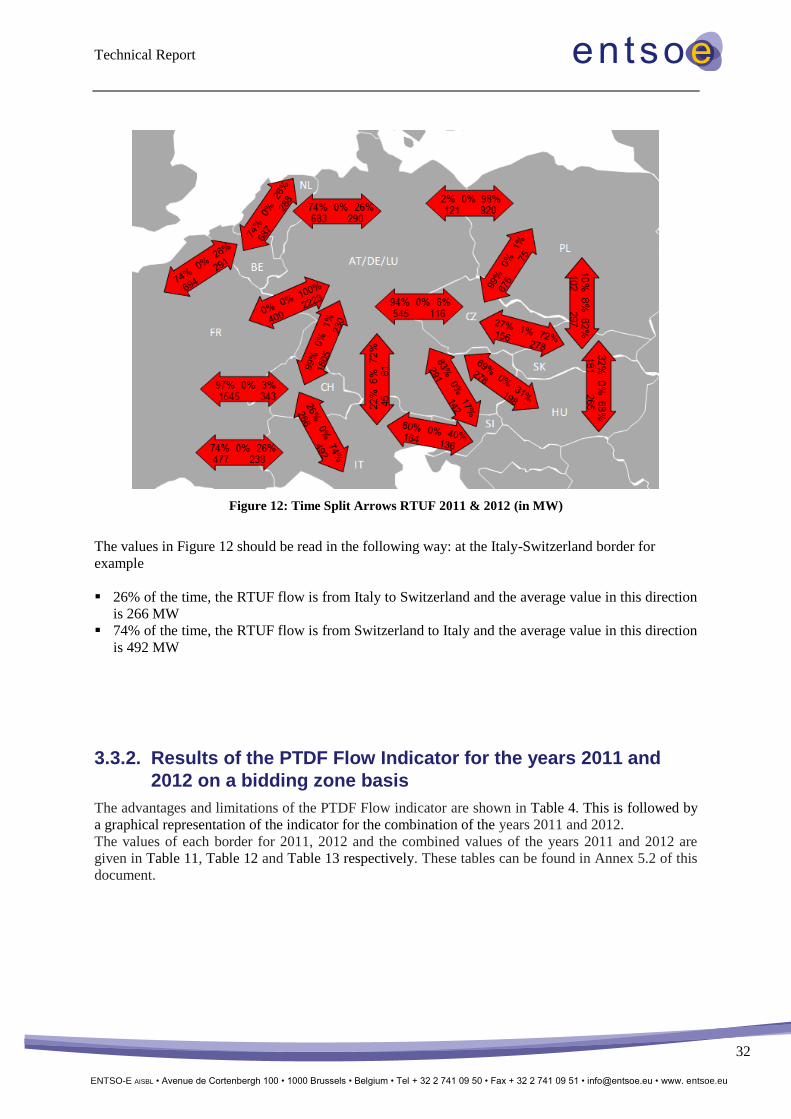
Technical Report
32
ENTSO-E AISBL • Avenue de Cortenbergh 100 • 1000 Brussels • Belgium • Tel + 32 2 741 09 50 • Fax + 32 2 741 09 51 • [email protected] • www. entsoe.eu
Figure 12: Time Split Arrows RTUF 2011 & 2012 (in MW)
The values in Figure 12 should be read in the following way: at the Italy-Switzerland border for
example
26% of the time, the RTUF flow is from Italy to Switzerland and the average value in this direction
is 266 MW
74% of the time, the RTUF flow is from Switzerland to Italy and the average value in this direction
is 492 MW
3.3.2. Results of the PTDF Flow Indicator for the years 2011 and
2012 on a bidding zone basis
The advantages and limitations of the PTDF Flow indicator are shown in Table 4. This is followed by
a graphical representation of the indicator for the combination of the years 2011 and 2012.
The values of each border for 2011, 2012 and the combined values of the years 2011 and 2012 are
given in Table 11, Table 12 and Table 13 respectively. These tables can be found in Annex 5.2 of this
document.

Technical Report
33
ENTSO-E AISBL • Avenue de Cortenbergh 100 • 1000 Brussels • Belgium • Tel + 32 2 741 09 50 • Fax + 32 2 741 09 51 • [email protected] • www. entsoe.eu
Table 4: Advantages and limitations of the PTDF flow indicator
Advantages Limitations
Loop flows are considered as a subset of
unscheduled flows (as other indicators also
include transit flows)
Only three CGM files are used (does not take
into account maintenances, modification of
topology, new lines, generation and load
pattern, variation of the load)
The physics of the flows are taken into
account by translating commercial exchanges
into physical flows between bidding zones.
Assumptions on pro-rata GSK do not consider
merit order and/or cross border portfolio
optimization; no maximum generation per
generator is considered when applying pro-
rata GSK
Data availability of net position (for
aggregation of countries see also subsection
3.2.2)
Measured physical flows include both market
and non-market transactions (internal,
bilateral, multilateral redispatch, primary and
secondary reserve power) with some
transactions not being scheduled (e.g. primary
and secondary reserve).
Figure 13 shows the average values of the flows induced by all cross-border exchanges (blue arrows)
and the measured physical flows (green arrows) for the years 2011 and 2012 (in MW).
Figure 13: Average flows induced by all cross-border exchanges (blue) & Measured Physical Flows
(green) for the years 2011 and 2012 (in MW)

Technical Report
34
ENTSO-E AISBL • Avenue de Cortenbergh 100 • 1000 Brussels • Belgium • Tel + 32 2 741 09 50 • Fax + 32 2 741 09 51 • [email protected] • www. entsoe.eu
The values in
Figure 13 should be read in the following way: at the Belgian-French border for example the average
physical flow is 573 MW from France to Belgium for the years 2011-2012. On the same border, the
calculated flow induced by all cross-border exchanges is 1192 MW from France to Belgium.
Figure 14 shows the average values of the PTDF Flow deviation for the years 2011 and 2012 (in
MW). For the calculation methodology see subsection 3.1.2.
Figure 14: Average PTDF Flow deviation (PTDFF) for the years 2011 and 2012 (in MW)
The values in Figure 14 should be read in the following way: at the Belgium-Netherlands border for
example the PTDF Flow deviation is 610 MW from the Netherlands to Belgium.
The Time Split Arrows for the PTDF indicator are shown in Figure 15. An explanation for these arrows
and how to read them can be found in subsection3.3.1.

Technical Report
35
ENTSO-E AISBL • Avenue de Cortenbergh 100 • 1000 Brussels • Belgium • Tel + 32 2 741 09 50 • Fax + 32 2 741 09 51 • [email protected] • www. entsoe.eu
Figure 15: Time Split Arrows PTDF 2011 & 2012 (in MW)
The values in Figure 15 should be read in the following way: at the Italy-Switzerland border for
example,
19% of the time, the PTDF Flow deviation is from Italy to Switzerland and the average value in
this direction is 230 MW
81% of the time, the PTDF Flow deviation is from Switzerland to Italy and the average value in
this direction is 437 MW

Technical Report
ENTSO-E AISBL • Avenue de Cortenbergh 100 • 1000 Brussels • Belgium • Tel + 32 2 741 09 50 • Fax + 32 2 741 09 51 • [email protected] • www. entsoe.eu
36
3.3.3. Results of the Day Ahead Unscheduled Flows (DAUF)
Indicator for the years 2011 and 2012 on a bidding zone basis
The advantages and limitations of the DAUF indicator are shown in Table 5. This is followed by a
graphical representation of the indicator for the second half of 2012. The values of each border for the
second half of 2012 are given in Table 14, Table 15 and Table 16. These tables can be found in the
Annex 5.3 of this document.
Table 5: Advantages and limitations of the DAUF indicator
Advantages Limitations
DAUF presents expected day ahead
unscheduled flows without non-market based
transactions, such as cross-border remedial and
balancing measures taken by TSOs, and only
internal remedial actions may be included in the
single DACF models depending on specific
TSO system operation security policy
No intraday market transactions are included
in DASF. A comparison of intraday plus
DASF with Intraday Congestion Forecast
(IDCF) calculation would be better because
they take into account all cross-zonal
transactions, but unfortunately IDCF files are
not available for the whole period of analysis
and whole area covered by the study
DASE is verifiable data from an agreed TSO
database which is available for the second half
of 2012. It represents all cross-border
transactions concluded by market participants
from the long term and day ahead perspectives
as the outcome of cross-border capacity
allocation mechanism
Internal remedial actions are planned
according to local (unharmonized) TSO
security policies
DACF procedure established in Operation
Handbook for short term security analyses.
Models are created in the framework of
coordinating regional initiatives, using the
common platform. They cover the whole area of
Continental Europe.
Planned physical flow depends on DACF
assumptions and is only available for Q3 and
Q4/2012 for six hours per day
Degree of freedom for nomination paths/
calculation of scheduled exchanges for similar
source/sink combinations affects calculated
unscheduled flows (bilateral exchange
calculation approach from net positions in
market coupling, for example in CWE)
Different capacity allocation mechanisms
affect scheduled exchanges/nominated
capacities in different regions (e.g. market
coupling in the CWE region and explicit
capacity allocation in CEE).
Figure 16 shows the average values of day ahead scheduled exchanges (blue arrows) and day ahead
calculated flows (green arrows) for the 2nd
half of 2012 (in MW).
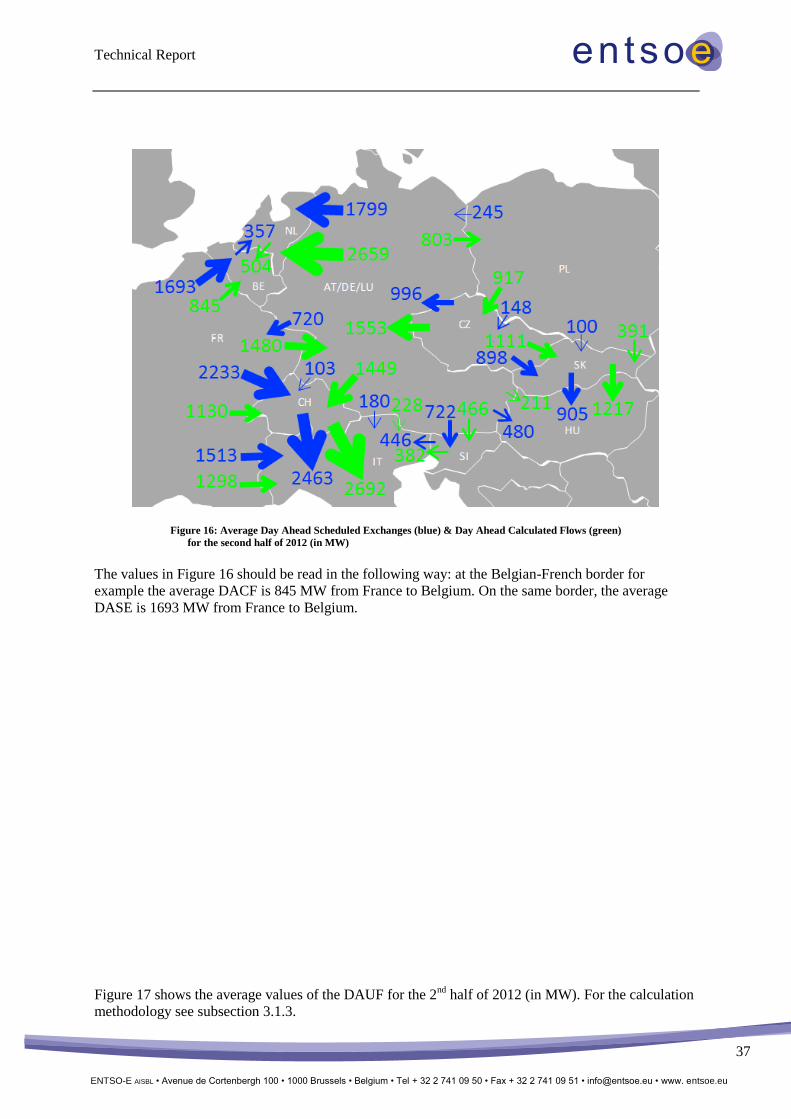
Technical Report
37
ENTSO-E AISBL • Avenue de Cortenbergh 100 • 1000 Brussels • Belgium • Tel + 32 2 741 09 50 • Fax + 32 2 741 09 51 • [email protected] • www. entsoe.eu
Figure 16: Average Day Ahead Scheduled Exchanges (blue) & Day Ahead Calculated Flows (green)
for the second half of 2012 (in MW)
The values in Figure 16 should be read in the following way: at the Belgian-French border for
example the average DACF is 845 MW from France to Belgium. On the same border, the average
DASE is 1693 MW from France to Belgium.
Figure 17 shows the average values of the DAUF for the 2nd
half of 2012 (in MW). For the calculation
methodology see subsection 3.1.3.
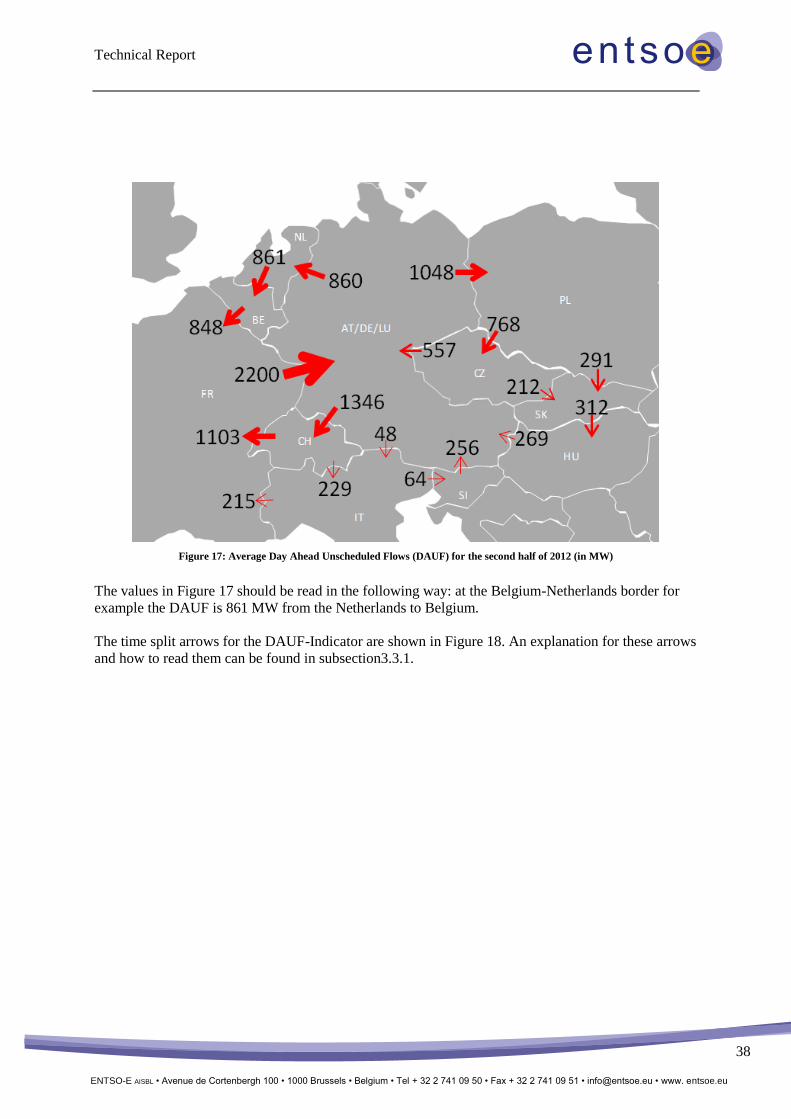
Technical Report
38
ENTSO-E AISBL • Avenue de Cortenbergh 100 • 1000 Brussels • Belgium • Tel + 32 2 741 09 50 • Fax + 32 2 741 09 51 • [email protected] • www. entsoe.eu
Figure 17: Average Day Ahead Unscheduled Flows (DAUF) for the second half of 2012 (in MW)
The values in Figure 17 should be read in the following way: at the Belgium-Netherlands border for
example the DAUF is 861 MW from the Netherlands to Belgium.
The time split arrows for the DAUF-Indicator are shown in Figure 18. An explanation for these arrows
and how to read them can be found in subsection3.3.1.

Technical Report
39
ENTSO-E AISBL • Avenue de Cortenbergh 100 • 1000 Brussels • Belgium • Tel + 32 2 741 09 50 • Fax + 32 2 741 09 51 • [email protected] • www. entsoe.eu
Figure 18: Time Split Arrows (DAUF) for the second half of 2012 (in MW)
The values in Figure 18 should be read in the following way: at the Italy-Switzerland border for
example:
28% of the time, the DAUF is from Italy to Switzerland and the average value in this direction is
225 MW
72% of the time, the DAUF is from Switzerland to Italy and the average value in this direction is
406 MW.
3.3.4. Comparison of indicators and conclusion
In the following a comparative description of the calculated non-allocated flow is given for all the
indicators. Furthermore, the main conclusions regarding the non-allocated flow are presented.
Considering that the DAUF indicator in subsection 3.3.3 has been calculated based on data for the
second half of 2012 and for six timestamps per day, the RTUF and PTDFF indicators have also been
recalculated for the same timestamps in order to facilitate a comparative assessment:
Recalculated average Measured Physical Flows (green) and Realised Scheduled Exchanges (blue)
are illustrated in Figure 19 (relevant for the RTUF indicator)
Recalculated average Measured Physical Flows (green) and flows induced by all cross-border
exchanges (blue) are illustrated in Figure 20 (relevant for the PTDF indicator)
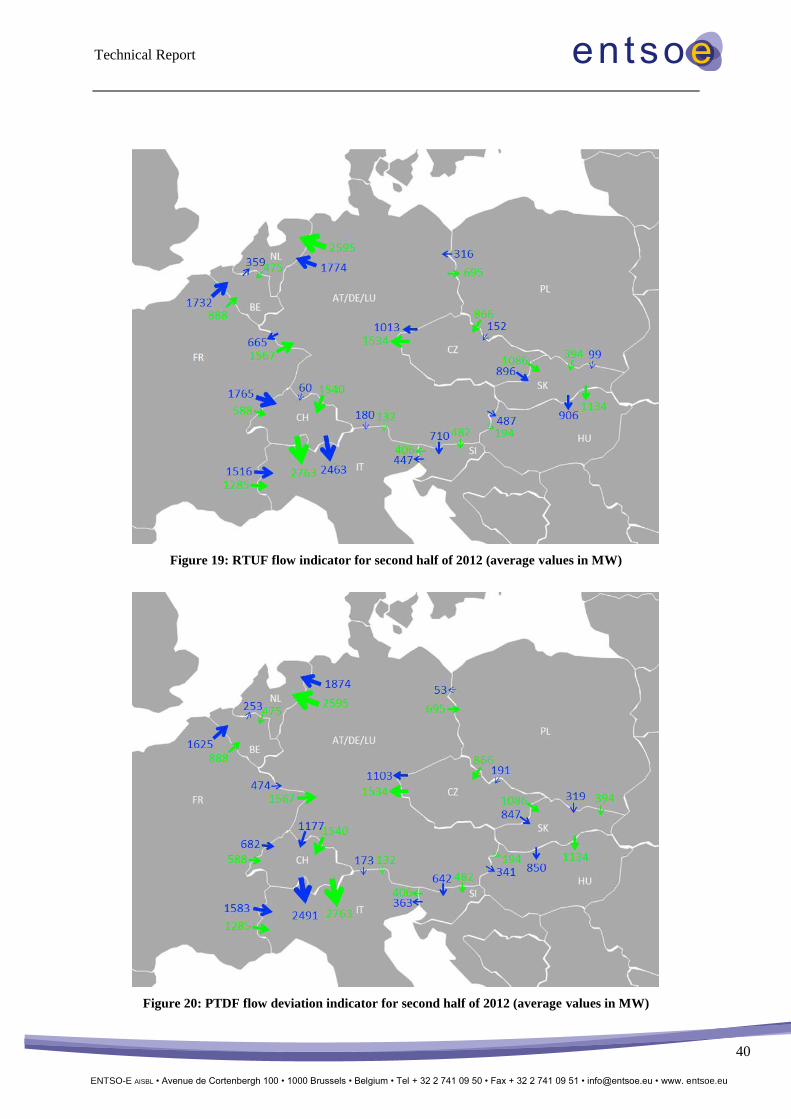
Technical Report
40
ENTSO-E AISBL • Avenue de Cortenbergh 100 • 1000 Brussels • Belgium • Tel + 32 2 741 09 50 • Fax + 32 2 741 09 51 • [email protected] • www. entsoe.eu
Figure 19: RTUF flow indicator for second half of 2012 (average values in MW)
Figure 20: PTDF flow deviation indicator for second half of 2012 (average values in MW)

Technical Report
41
ENTSO-E AISBL • Avenue de Cortenbergh 100 • 1000 Brussels • Belgium • Tel + 32 2 741 09 50 • Fax + 32 2 741 09 51 • [email protected] • www. entsoe.eu
The focus of the following analysis is on the second half of 2012 based on the average values. This is
because the data needed for the calculation of the DAUF-Indicator is only available from July 2012
onwards. The nature of the statements below is true for the years 2011 and 2012 as well; only the
magnitude of the different flows might be different. In Figure 21, the values for the calculated non-
allocated flows for all three indicators are shown for the second half of 2012.
Figure 21: Comparison of the particular indicators of unscheduled flows (second half of 2012)
The three indicators do not represent exactly the same kind of flows. This is for example due to the
fact that the RTUF Indicator and the DAUF Indicator compute non-allocated flows for two
different points in time.
For all three indicators the highest values of non-allocated flows occur at the border from the
French- to the AT/DE/LU bidding zone. At this border the physical flow and the allocated flows
point in opposite directions for the RTUF and DAUF indicators. Only the calculated allocated
flows of the PTDF Indicator point in the same direction as the physical flow.
For the RTUF and the DAUF Indicator the second highest values of non-allocated flows can be
found at the border of the AT/DE/LU and CH bidding zones. At this border the physical flow and
the allocated flows point in the same direction for all three indicators.
For the RTUF and the DAUF-Indicator the non-allocated flows at the border between the bidding
zones of Switzerland and France have roughly the same magnitude as at the bidding zone border of
AT/DE/LU and Switzerland. In contrast, the PTDF Flow deviations at this border are much
smaller.

Technical Report
42
ENTSO-E AISBL • Avenue de Cortenbergh 100 • 1000 Brussels • Belgium • Tel + 32 2 741 09 50 • Fax + 32 2 741 09 51 • [email protected] • www. entsoe.eu
For all three indicators high values of non-allocated flows can be observed at the AT/DE/LU- and
Polish bidding zone border. At this border the physical flow and the allocated flows point in the
opposite direction.
The biggest absolute differences of non-allocated flows calculated by the PTDF- and RTUF-
Indicator can be observed at the AT/DE/LU-CH and FR-CH borders. On the contrary, the borders
between AT/DE/LU-NL, NL-BE and BE-FR show almost identical values for all three indicators,
but the PTDF-Indicator is smaller than the RTUF- and DAUF-Indicator. The situation is the
opposite (i.e. PTDF-Indicator smaller than RTUF- and DAUF-Indicators) at the borders between
SK-CZ, SK-HU and FR-IT.
For nine out of the 18 bidding zone borders (PL CZ, PL SK, SK HU, CZ DE/AT/LU,
DE PL, DE/AT/LU CH, CH IT, NL BE, BE FR) the geographical orientation of non-
allocated flows is from north to south. This implies that electricity is flowing from these generation
centres located in the northern part of continental Europe to the above listed southern parts with
their load centres.
The non-allocated flows at the
o AT/DE/LU to Netherlands bidding zone,
o Netherland to Belgium bidding zone,
o Belgian to French bidding zone and
o Poland to Czech Republic bidding zone
borders have roughly the same magnitude for all three indicators.
The non-allocated flows at the border of the CZ to AT/DE/LU bidding zone have roughly the same
magnitude and direction for all three indicators. More detailed results for individual borders are
provided in the individual analyses of part 3.3.5.
The non-allocated flows at the
o Swiss to Italian bidding zone,
o Italian to French bidding zone,
o Slovenian to AT/DE/LU bidding zone,
o Hungary to AT/DE/LU bidding zone,
o Czech Republic to Slovakia bidding zone and
o Slovakia to Hungarian bidding zone
borders have roughly the same magnitude for all three indicators.
The smallest non-allocated flows for all indicators can be observed at the borders between
AT/DE/LU and the Italian bidding zone, as well as between the borders of the Italian and
Slovenian bidding zone.
The results of all three indicators provide average non allocated flows that are generally in the same
direction for all bidding zone borders. Only at the border of the AT/DE/LU bidding zone to the
Italian bidding zone and the Italian-Slovenian border, where the level of non-allocated flows is
very low, a different direction of the non-allocated flows can be observed among the three
indicators.
Besides the direction of the non-allocated flows, the computed values provide information about
the magnitude of these flows. The magnitude of the non-allocated flows is similar for the RTUF
and the DAUF Indicators. The PTDF indicator usually has the lowest value (except in some special
cases) when compared to the other indicators. This is because, contrary to the RTUF and DAUF
Technical Report
43
ENTSO-E AISBL • Avenue de Cortenbergh 100 • 1000 Brussels • Belgium • Tel + 32 2 741 09 50 • Fax + 32 2 741 09 51 • [email protected] • www. entsoe.eu
indicators, the calculated allocated flows in the PTDF indicator take into account the impact of all
exchanges at all borders.
For 14 out of 18 borders (exceptions are Czech Republic to Slovakia, Slovakia to Hungary and
Italy to France), the non-allocated flows calculated with the PTDF Indicator are smaller in relation
to the non-allocated flows calculated with both other indicators (RTUF- and DAUF-Indicator). In
one case (the border between Switzerland and Italy) the non-allocated flow of the PTDF Indicator
is larger than the DAUF Indicator
In terms of identifying sources, sinks and the causation of non-allocated flows:
o The calculated non-allocated flows at bidding zone borders do not per se allow for general
conclusions on concrete sources, sinks or causes of these flows. However, there may be
intuitive explanations on the zonal level:
long distance transmission of intermittent generation that is not appropriately
participating in the market and does not obtain sufficient market incentives to schedule
or balance its injections
lack of mapping or insufficient mapping of internal transactions at bidding zone borders
generation units and consumption units close to a bidding zone border may cause
physical flows which are completely independent from flows allocated via the market
market party choices of nomination paths for cross-border transactions and the
calculation approach for bilateral scheduled exchanges in market coupling affect the
size of the unscheduled flows for the RTUF and DAUF indicators
the RTUF and PTDF indicators inter alia comprise non-market based transactions (and
they might not be scheduled), which affect physical flows and therefore the size of
unscheduled flows as calculated for these indicators
o In order to assess concrete sources, sinks and cause, a more detailed analysis would have to
take place. Such an analysis must involve more detailed grid models and load-flow analyses.
o The non-allocated flows computed by the three indicators represent flows that can
potentially create constraints, both at a bidding zone border or inside a bidding zone.
Furthermore, a high or low average value of non-allocated flows does not necessarily
indicate a constraint; however, non-allocated flows have to be taken into account in the
capacity calculation process as an uncertainty (both loading/relieving) as they have an
impact (both decreasing/increasing) on the capacity available to the market.
o The analyses of the previous sections have been focused on average values. Annexes 4 and 5
of this document contain further information (e.g. minimum, maximum values and monthly
developments).
The above analysis refers to bidding zones. However the picture is different when looking at member
state level or even control area level. This topic is addressed in the next section for the CEE region.

Technical Report
44
ENTSO-E AISBL • Avenue de Cortenbergh 100 • 1000 Brussels • Belgium • Tel + 32 2 741 09 50 • Fax + 32 2 741 09 51 • [email protected] • www. entsoe.eu
3.3.5. Further individual analysis
In this subchapter special attention is given to borders between bidding zones, in particular member
states which consist of more than one control area. Therefore, a higher granularity than the “Bidding-
Zone-Granularity” (which is used in the previous chapters) is used here31
.
a) Comparison of the results of the three indicators with an additional border between the
DE/Lux and AT bidding zone and therefore also separate net positions for
Germany/Luxembourg and Austria
Figure 22: Comparison of indicators for the CWE and CEE regions with an additional border between
DE/LU and AT for the second half of 2012
The above figure shows a comparison of the three indicators (average half-year values) using member
state granularity (i.e. for borders between EU member states except Luxembourg). However, it must
be noted that the data basis for the PTDF indicator was changed by introducing separate net positions
for Germany/Luxembourg32
and Austria, in contrast to the PTDF indicator presented in Figure 21
where an aggregated net position for the AT/DE/LU bidding zone32
was used. Hence, there are
differences in the values of the PTDF indicators for all borders compared to Figure 21.
Within the CWE region the highest values are observed at the FR-DE border for all three indicators. In
the CEE region the highest values can be observed for the RTUF indicator at the DE-AT border
followed by the DE-PL border.
The directions of indicators observed on half-year averages shown in Figure 22 are generally the same,
meaning that for all three indicators the unscheduled flows point in the same direction33
.
31
only schedules between control block AT and control block DE are publically available – therefore analyses for any other
internal interface are not possible. 32
including Denmark West 33 Exceptions: IT-AT (the DAUF indicator is opposite to the others), IT-SI and CZ-DE (the direction of PTDF indicator is in
opposition to the remaining indicators)
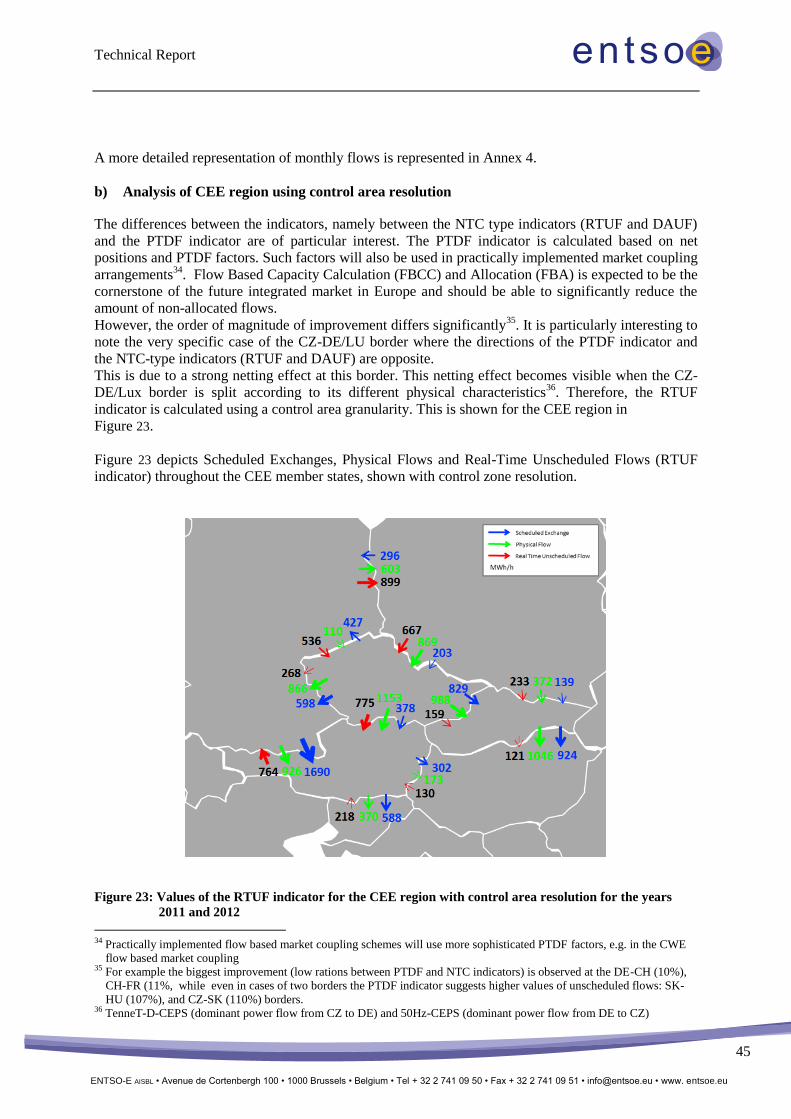
Technical Report
45
ENTSO-E AISBL • Avenue de Cortenbergh 100 • 1000 Brussels • Belgium • Tel + 32 2 741 09 50 • Fax + 32 2 741 09 51 • [email protected] • www. entsoe.eu
A more detailed representation of monthly flows is represented in Annex 4.
b) Analysis of CEE region using control area resolution
The differences between the indicators, namely between the NTC type indicators (RTUF and DAUF)
and the PTDF indicator are of particular interest. The PTDF indicator is calculated based on net
positions and PTDF factors. Such factors will also be used in practically implemented market coupling
arrangements34
. Flow Based Capacity Calculation (FBCC) and Allocation (FBA) is expected to be the
cornerstone of the future integrated market in Europe and should be able to significantly reduce the
amount of non-allocated flows.
However, the order of magnitude of improvement differs significantly35
. It is particularly interesting to
note the very specific case of the CZ-DE/LU border where the directions of the PTDF indicator and
the NTC-type indicators (RTUF and DAUF) are opposite.
This is due to a strong netting effect at this border. This netting effect becomes visible when the CZ-
DE/Lux border is split according to its different physical characteristics36
. Therefore, the RTUF
indicator is calculated using a control area granularity. This is shown for the CEE region in
Figure 23.
Figure 23 depicts Scheduled Exchanges, Physical Flows and Real-Time Unscheduled Flows (RTUF
indicator) throughout the CEE member states, shown with control zone resolution.
Figure 23: Values of the RTUF indicator for the CEE region with control area resolution for the years
2011 and 2012
34 Practically implemented flow based market coupling schemes will use more sophisticated PTDF factors, e.g. in the CWE
flow based market coupling 35 For example the biggest improvement (low rations between PTDF and NTC indicators) is observed at the DE-CH (10%),
CH-FR (11%, while even in cases of two borders the PTDF indicator suggests higher values of unscheduled flows: SK-
HU (107%), and CZ-SK (110%) borders. 36 TenneT-D-CEPS (dominant power flow from CZ to DE) and 50Hz-CEPS (dominant power flow from DE to CZ)

Technical Report
46
ENTSO-E AISBL • Avenue de Cortenbergh 100 • 1000 Brussels • Belgium • Tel + 32 2 741 09 50 • Fax + 32 2 741 09 51 • [email protected] • www. entsoe.eu
The data used for this analysis has been extracted from Vulcanus, from internal and publically
available TSO data available to CEPS, TenneT-D and 50Hertz. The netting effect between CZ and DE
mentioned in the previous paragraph becomes evident.
The efficiency of the future FB mechanism is dependent on several factors (e.g. architecture of
bidding zones, appropriateness of the parameters and scenarios used, coordination of grid topology
measures, coordination of remedial actions etc.). Of these factors the bidding zone configuration is the
focus of this report and also the subsequent Bidding Zone Study.
The magnitude of the non-allocated flows at the DE South/LU (Tennet-D) to AT, DE/LU North (50
Hertz) to Poland, Poland to CZ and CZ to DE/LU North (50 Hertz) borders are the highest in the CEE
area for the RTUF indicator. Scheduled flows at the border between DE/LU to AT are about 83%
higher than physical flows on that border. Table 6 below provides an overview of the other borders in
the region with regard to this analysis. As a comparison, the same analysis for the CZ-SK border
shows only a very small deviation between scheduled exchanges and physical flows, confirming the
historically strong interconnection between these two zones (one common state in the past).
Table 6: Overview of physical flows, scheduled exchanges and RTUF for the years 2011 and 2012 (in MW)
physical
flow
scheduled
exchanges RTUF
RTUF /
physical flow*
DE/LUX South (TenneT-D) AT 926 1690 764 83%
CZ DE/LUX South (TenneT-D) 866 598 268 31%
CZ DE/LUX North (50 Hertz) -110 427 537 488%
DE/LUX North (50 Hertz) PL 603 -296 899 149%
PL CZ 869 203 666 77%
PL SK 372 139 233 63%
SK HU 1046 924 121 12%
AT HU 173 302 128 74%
AT SL 370 588 218 59%
SK CZ 988 829 159 16%
* absolute
positive value
The above analysis raises the question of whether and how the impact of non-allocated flows on
market efficiency and network security should be assessed. In this context, the impact of intermittent
long distance transmission and its sources and sinks (transits37
and loop flows38
) needs particular
consideration (cf. Figure 24). These questions and whether a bidding zone configuration can alleviate
any relevant issues will form a core part of the Bidding Zone Study in 2014. Several TSOs have
already carried out studies related to this subject39
. These studies will be duly considered.
37 An energy flow that occurs in a country, that is neither the source nor the sink of the energy flow. The energy flow arrives
in the grid over one or more borders and leaves the country over one or more borders 38 The part of the physical flow on a border between two control areas observed even without any transaction, i.e. flows over
control areas caused by origin and destination within one control area. 39 CEPS/PSE/SEPS/MAVIR study:
http://www.ceps.cz/ENG/Media/Tiskove-zpravy/Documents/120326_Position_of_CEPS_MAVIR_PSEO_SEPS-
Bidding_Zones_Definition.pdf
APG study:
http://www.apg.at/de/Global/Pages/~/media/C50DB68C7337445C8077FC843B0DECD5.pdf

Technical Report
47
ENTSO-E AISBL • Avenue de Cortenbergh 100 • 1000 Brussels • Belgium • Tel + 32 2 741 09 50 • Fax + 32 2 741 09 51 • [email protected] • www. entsoe.eu
Figure 24: Analysis of CEE region with control area resolution envisaged for the bidding zone study
The flow sources and sinks and directions of Figure 24 are indicative and will be core subjects of the
further analysis.

Technical Report
48
ENTSO-E AISBL • Avenue de Cortenbergh 100 • 1000 Brussels • Belgium • Tel + 32 2 741 09 50 • Fax + 32 2 741 09 51 • [email protected] • www. entsoe.eu
4. Congestion incomes and firmness costs
As stated in the introduction and in the CACM NC, the Technical Report shall include congestion
incomes and firmness costs. Generally speaking, these parameters have relevance with regard to
bidding zones as they indicate to some extent internal and cross-border congestions. However,
additional clarification is required regarding the exact cost types that are to be considered. In the
following section, a discussion of the parameters and the performed survey is therefore given before
the actual results are presented. In section 4.1 a brief description of the TSO internal survey-setup is
provided. Section 4.2 contains the results and section 4.3 draws some general conclusions.
4.1. Interpretation and survey set-up
For the purpose of this Technical Report TSOs have surveyed their congestion incomes, financial
firmness costs and physical firmness costs.
4.1.1. Congestion incomes
Interpretation:
Congestion incomes refer to the revenues received as a result of capacity allocation40
Survey set-up:
The total yearly incomes were acquired on a country level for 2011 and 2012. The incomes were
gathered on a country and on a border level for those borders where capacity allocation
mechanisms exist. In the case of Italy, the income originating from the internal Italian bidding
zones is not taken into account.
4.1.2. Financial firmness costs
Interpretation
Firmness means arrangements guaranteeing that capacity rights remain unchanged or are
compensated when capacity reduction occurs. If there is curtailment of assigned capacity rights,
compensation costs are paid. These costs are classified as financial firmness expenses, which
include the reimbursement of the original price, compensation of the original price augmented with
a specified percentage or compensation in the form of market-spread. Different compensation cases
and rules are defined in the European regions.
Survey set-up:
Each TSO delivered the set of financial firmness rules that are applicable in its area. More
precisely, the different compensation cases and the associated compensation rules were supplied,
differentiating for example a “force majeure” case. The related financial firmness costs were
delivered on a TSO level for 2011 and 2012.
4.1.3. Physical firmness costs and internal congestion cost
Interpretation:
Firmness means arrangements to guarantee that capacity rights remain unchanged or the holders of
originally obtained transmission rights are compensated. Physical firmness costs are related to
arrangements that guarantee unchanged capacity rights. However, all measures that maintain
40
see CACM NC

Technical Report
49
ENTSO-E AISBL • Avenue de Cortenbergh 100 • 1000 Brussels • Belgium • Tel + 32 2 741 09 50 • Fax + 32 2 741 09 51 • [email protected] • www. entsoe.eu
system stability could be considered as measures that guarantee unchanged capacity rights.
Therefore the following classification has been applied in order to narrow down the scope of the
investigation
Physical firmness measures
o Only measures that alleviate congestion are considered as physical firmness measures.
The control of power flows is achieved by circuit switching or by changing the
generation and/or load pattern.
o Measures that are related to system stability such as the activation of market-wide
reserve capacities or emergency load shedding have not been considered.
Physical firmness costs
o Physical firmness costs are related to the physical firmness measures described above.
o As redispatch measures are taken to accommodate a secure flow resulting from all
transactions in a bidding zone, it is not possible to make a clear distinction between
measures taken for the firmness of cross border capacity or internal capacity. Therefore
all redispatch costs are included in the figures for physical firmness. 'Physical firmness',
as represented in the graphs and numbers in this chapter 4, should therefore be read as
'Physical firmness and internal redispatch measures'.
o Only costs that are direct payments to other actors or the market are considered as
physical firmness costs. This includes for example re-dispatch or counter-trading costs.
o Costs that are not clearly allocated as they are distributed over the system (losses) or are
not linked to one event (amortization, wearing) have not been considered.
In conclusion, only costs that are caused by changing the generation and/or load pattern are
considered as physical firmness costs or internal redispatch. These costs indicate congestions that
remain after the market-based capacity allocation process.
Survey set-up:
Each TSO indicated the costs for 2011 and 2012. Cost categories for internal redispatch, cross-
border redispatch and counter trading were given. Additional types of physical firmness costs could
be added by the TSOs if applicable.

Technical Report
50
ENTSO-E AISBL • Avenue de Cortenbergh 100 • 1000 Brussels • Belgium • Tel + 32 2 741 09 50 • Fax + 32 2 741 09 51 • [email protected] • www. entsoe.eu
4.2. Results
In general all TSOs were able to provide the data requested. However, the resulting data set made it
apparent that drawing hard conclusions regarding the adequacy of the bidding zone configuration
based on these numbers is treacherous as explained in the relevant sections.
4.2.1. Congestions incomes
The numbers on congestion income were found to be relatively reliable and comparable. Figure 25
provides the congestion incomes per bidding zone.
Figure 25: Congestion incomes per bidding zone
Apart from the Czech Republic, all bidding zones experienced higher congestion incomes in 2012 than
in 2011. This is primarily driven by a larger price differential between the implicitly coupled markets.
The competitiveness of various generation types (coal versus gas and renewable versus fossil fuels) in
the wholesale markets has become more distinct. This has increased price spreads and therefore
congestion incomes.
0
50
100
150
200
250
300
in M
€
2011 2012

Technical Report
ENTSO-E AISBL • Avenue de Cortenbergh 100 • 1000 Brussels • Belgium • Tel + 32 2 741 09 50 • Fax + 32 2 741 09 51 • [email protected] • www. entsoe.eu 51
Per border
Looking at the different borders in each of the bidding zones the picture is more differentiated, as can be seen in Table 7 below.
Table 7: TSO congestion management incomes 2011 and 2012 [in Mil. EUR]
2011TSO Country AT BE CZ DK FR DE HU IT LU NL PL SK SI CH
APG Austria AT 4,69 8,05 10,11 6,03 7,62
Elia Belgium BE 2,07 16,12
CEPSCzech
RepublicCZ 4,69 12,58 3,95 0,45
Energinet Denmark DK 3,85 15,94
RTE France FR 2,03 29,65 107,93 0,07
TSO of Amprion +50 HertzT +Tennet
+TransnetBW +VKW NetzGermany DE 12,48 16,79 28,31 9,81 6,50 24,06
Mavir Hungary HU 8,05 5,83
Terna Italia IT 10,11 104,90 26,28 63,69
CREOS Luxembourg LU
Tennet Netherlands NL 17,20 7,30
PSE Operator Poland PL 4,00 6,31 1,85
SEPSSlovak
RepublicSK 0,45 5,83 1,78
ELES Slovenia SI 6,03 26,28
Swissgrid Switzerland CH 7,62 25,20 44,74
36,49 19,23 21,62 20,63 135,28 96,98 13,88 189,06 0,00 25,93 12,23 8,12 32,31 95,44
2012TSO Country AT BE CZ DK FR DE HU IT LU NL PL SK SI CH
Verbund APG Austria AT 3,19 24,22 17,42 25,30 12,52
Elia Belgium BE 12,86 15,85
CEPSCzech
RepublicCZ 3,19 8,00 3,08 1,73
Energinet.dk Denmark DK 4,63 31,95
RTE France FR 12,14 47,88 146,78 15,16
TSO of TransnetBW +Amprion +50
Hertz +TenneT TSO GmbHGermany DE 8,03 31,08 48,30 31,62 8,70 25,20
Mavir Hungary HU 24,22 27,20
Terna Italia IT 17,42 148,44 32,59 112,10
CREOS Luxembourg LU
TenneT TSO B.V. Netherlands NL 15,14 34,17
PSE S.A. Poland PL 3,08 8,69 3,45
SEPSSlovak
RepublicSK 1,73 27,20 3,47
ELES Slovenia SI 25,30 32,59
Swissgrid Switzerland CH 12,52 15,17 24,98 78,67
82,65 27,28 16,03 35,72 224,77 155,66 51,42 275,45 0,00 47,47 15,25 32,38 57,89 164,98Total
Total
TSO's congestion management revenues on border with:

Technical Report
ENTSO-E AISBL • Avenue de Cortenbergh 100 • 1000 Brussels • Belgium • Tel + 32 2 741 09 50 • Fax + 32 2 741 09 51 • [email protected] • www. entsoe.eu
52
Increases larger than 100% between 2011 and 2012 were witnessed at the following borders: AT –
HU; AT – SI; BE – FR; CZ – SK; DE – DK; DE – NL; HU – SK and FR – CH.
Congestion incomes decreased at the following borders: CZ – AT; BE – NL; CZ – DE; CZ – PL and
CH – DE.
As it can be seen from Table 7, congestion incomes are most often shared 50/50 by the neighbouring
TSOs, but it also happens that the auction income share per border is different. Differences can
furthermore be explained by the different processes and agreements that are valid for the border in
question (e.g. one TSO ensures the physical firmness of capacity and the other one performs
curtailment and pays back 100% compensation from its own congestion management revenue) or by
different accounting policies.
4.2.2. Financial firmness costs
As financial firmness costs are relatively well defined, TSOs did not encounter difficulties in reporting
them. The comparability however is affected by the differences in the detailed auction rules:
CEE Auction rules: Compensation is paid if there is a curtailment of allocated Physical
Transmission Rights (PTRs) or a curtailment of nominated PTRs. The compensation is based on
the original auction price. There is no compensation in the case of force majeure.
CWE Auction rules41
: In this region, there is market-coupling in place but the financial firmness
rules depend on the borders and the origin of the reduction (safety of the power system or force
majeure). The reimbursed price can be based on the reason for the reduction, the marginal price of
auctions with compensation or the capped day ahead spot spread42
.
CSE Auction rules43
: In case of curtailment, the original auction price is paid back
(reimbursement). The only exception is the FR-IT border, at which 110% of the original auction
price is paid as compensation. Before the nomination deadline, the curtailments can be performed
for a certain number of hours per year (up to 35 equivalent days). If this limit per border is reached,
the capacity has to be physically firm.
Financial firmness costs for 2011 and 2012 are shown in Figure 27. For some bidding zones,
substantial financial firmness costs were experienced.
41 http://www.casc.eu/en/News--Events/News/CWE-Auction-Rules-v22 42 for more detailed information, please refer to the CWE auction rules V2.2. 43 one set of auction rules within CWE for 2012.

Technical Report
53
ENTSO-E AISBL • Avenue de Cortenbergh 100 • 1000 Brussels • Belgium • Tel + 32 2 741 09 50 • Fax + 32 2 741 09 51 • [email protected] • www. entsoe.eu
Figure 26: Total financial firmness costs
The financial firmness costs experienced by TSOs are incidental. In the first week of February 2011,
for instance, an incident was recorded in the CWE region. This accounts for all the costs in this year in
Belgium and the Netherlands, and for some in France and Germany. Due to this incidental character
no conclusions on trends or tendency can be drawn based on the numbers for 2011 and 2012.
Typically the order of magnitude is significantly smaller than the physical firmness costs discussed
below.
4.2.3. Physical firmness costs and internal redispatch costs44
The costs shown in Figure 28 represent the sum of the costs for 'cross-border redispatch measures',
'countertrading' and 'internal redispatch measures'.
It has to be noted that the comparison of the physical firmness costs can only be indicative. There are
substantial differences between the different countries.
Among other points, this relates to:
the categorization of measures as physical firmness measures
the interdependency to other grid management measures (e.g. congestion management, voltage
control, balancing)
the trigger for the measures (e.g. local vs. regional congestion)
the monitoring of measures and related costs
regulatory, system dispatch and market arrangements for the determination of redispatch costs
the availability of power plants and the respective cost structure and availability of alternatives to
the TSOs (e.g. topology measures)
A direct comparison is therefore hardly applicable. For this reason, the redispatch costs and measures
are described for each bidding zone separately in the following.
44 Two types of data were collected with regard to physical firmness and internal redispatch: volumes and costs. The volume
data was not sufficiently robust to be shown here.
0
200
400
600
800
1000
1200
1400
1600
1800C
Z SI
BE
DK
HU PL
FR
SK
CH
NL IT
AT
+ D
E +
LU
in k€
2011 2012
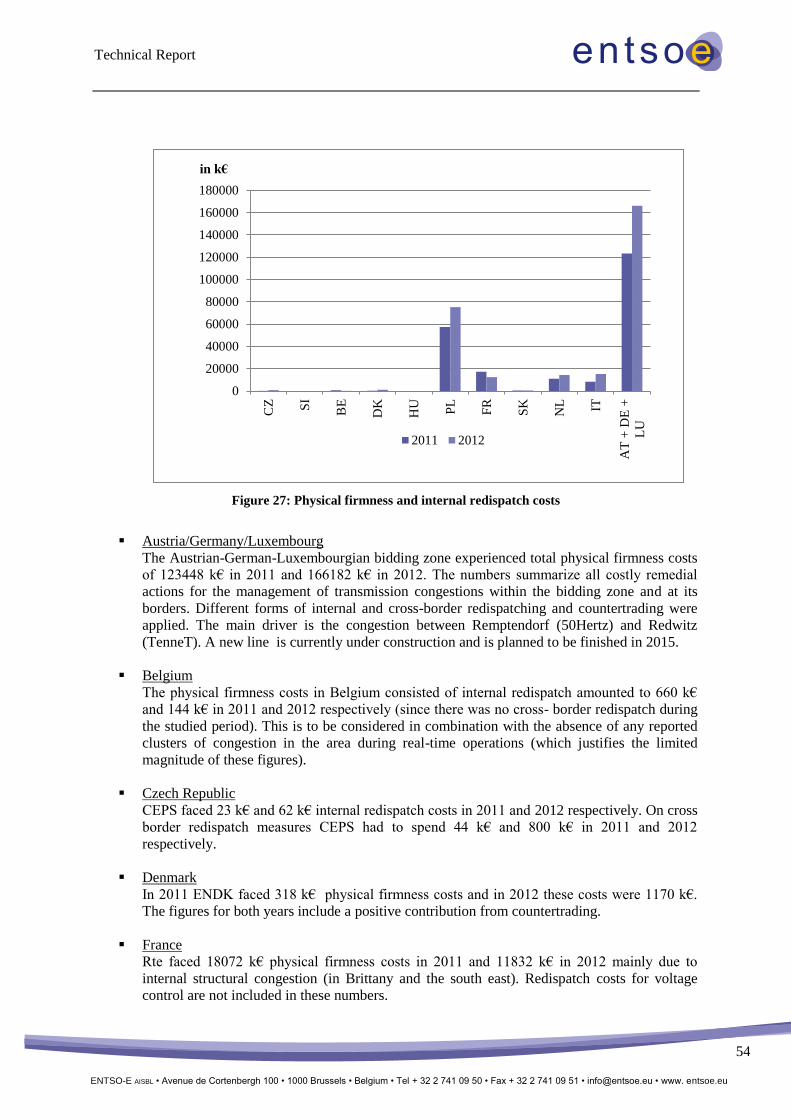
Technical Report
54
ENTSO-E AISBL • Avenue de Cortenbergh 100 • 1000 Brussels • Belgium • Tel + 32 2 741 09 50 • Fax + 32 2 741 09 51 • [email protected] • www. entsoe.eu
Figure 27: Physical firmness and internal redispatch costs
Austria/Germany/Luxembourg
The Austrian-German-Luxembourgian bidding zone experienced total physical firmness costs
of 123448 k€ in 2011 and 166182 k€ in 2012. The numbers summarize all costly remedial
actions for the management of transmission congestions within the bidding zone and at its
borders. Different forms of internal and cross-border redispatching and countertrading were
applied. The main driver is the congestion between Remptendorf (50Hertz) and Redwitz
(TenneT). A new line is currently under construction and is planned to be finished in 2015.
Belgium
The physical firmness costs in Belgium consisted of internal redispatch amounted to 660 k€
and 144 k€ in 2011 and 2012 respectively (since there was no cross- border redispatch during
the studied period). This is to be considered in combination with the absence of any reported
clusters of congestion in the area during real-time operations (which justifies the limited
magnitude of these figures).
Czech Republic
CEPS faced 23 k€ and 62 k€ internal redispatch costs in 2011 and 2012 respectively. On cross
border redispatch measures CEPS had to spend 44 k€ and 800 k€ in 2011 and 2012
respectively.
Denmark
In 2011 ENDK faced 318 k€ physical firmness costs and in 2012 these costs were 1170 k€.
The figures for both years include a positive contribution from countertrading.
France
Rte faced 18072 k€ physical firmness costs in 2011 and 11832 k€ in 2012 mainly due to
internal structural congestion (in Brittany and the south east). Redispatch costs for voltage
control are not included in these numbers.
0
20000
40000
60000
80000
100000
120000
140000
160000
180000
CZ SI
BE
DK
HU PL
FR
SK
NL IT
AT
+ D
E +
LU
in k€
2011 2012

Technical Report
55
ENTSO-E AISBL • Avenue de Cortenbergh 100 • 1000 Brussels • Belgium • Tel + 32 2 741 09 50 • Fax + 32 2 741 09 51 • [email protected] • www. entsoe.eu
Hungary
Hungary experienced no physical firmness costs in the years 2011 and 2012.
Italy
TERNA had 8274 k€ physical firmness costs in 2011 and 15.241 k€ in 2012. In addition,
TERNA reported 19115 k€ and 43386 k€ costs respectively for local congestion in the internal
grid.
The Netherlands
In the Netherlands, TenneT experienced high physical firmness costs because of internal
congestion not related to cross-border capacity. Due to the connection of new power plants
before the completion of necessary grid reinforcements in the Maasvlakte region, congestion
management was needed. These costs accounted for 85% and 57% respectively of the reported
physical firmness costs of 10976 k€ and 14230 k€ in 2011 and 2012. In 2013, the grid
reinforcement for the area concerned was completed.
Poland
PSE reported costs of 57319 k€ for 2011 and 75227 k€ in 2012 for physical firmness costs and
internal redispatch costs. Poland has a central dispatch system. PSE conducts an integrated
balancing and congestion management process. In this process, the influence of neighbouring
systems is taken into account. Therefore, internal congestion management costs include the
cost of preventive measures concerning cross-border flows. These actions are performed in an
integrated process. The reported internal redispatch costs encompass all costs borne by TSO
resulting from system balancing and congestion management, including the costs of measures
that are not relevant with regard to a bidding zone design.
Because of the reporting of all costs as mentioned earlier internal redispatch costs are
relatively high (56882 k€ in 2011 and 74038 k€ in 2012). On the other hand, cross-border
redispatching costs and countertrading costs are relatively low (437 k€ in 2011 and 1189 k€ in
2012).
Slovakia
SEPS experienced physical firmness costs of 364 k€ in 2011 and 397 k€ in 2012.
Slovenia
ELES experienced no physical firmness costs in 2011 and 2012.
Switzerland
Due to differences in the commercial redispatching arrangements, Swissgrid reported physical
volumes for firmness for both years. Internal redispatch volumes were 1989 MWh for 2011
and 2870 MWh for 2012. Cross-border redispatch measures for these years were 29510 MWh
and 86287 MWh.
4.3. Conclusions
The difference in reported numbers, notably on physical firmness, cannot be interpreted as a difference
in robustness of the various grids per se. Reported costs of firmness vary widely across the bidding
zones. This variation can come from a variation in the level of control over dispatching by the TSO in
the various countries, variation in robustness of the grid within the bidding zone and the differences in
redispatch options as well as the monitoring obligations.
Technical Report
56
ENTSO-E AISBL • Avenue de Cortenbergh 100 • 1000 Brussels • Belgium • Tel + 32 2 741 09 50 • Fax + 32 2 741 09 51 • [email protected] • www. entsoe.eu
Also specific (temporary) situations within a country can have substantial impact on firmness costs,
notably internal redispatch in a given period.
The following conclusions must therefore be considered to be of a general and indicative nature.
Congestion incomes have increased in 2012. This indicates a decreasing potential for enlarging
bidding zones. However, congestion incomes vary considerably from year to year. This variation
primarily stems from different fuel mixes and the varying competitiveness of the generation assets at
both sides of each border resulting from fluctuations in fuel prices (among other factors). For a
bidding zone review this means that no conclusions can be based on this indicator solely.
Physical firmness costs differ largely between countries. In most countries, they are zero or close to
zero. Relevant costs are only shown for PL, FR and DE/AT/LU. The highest costs are seen for the
DE/AT/LU zone. For all countries, an increase can be witnessed.
Financial firmness costs are of a magnitude lower than physical firmness costs. Their relevance is
therefore limited. In 2011, the financial firmness costs were generally higher than in 2012. For
example, in DE/AT/LU or FR there were nearly no costs in 2012 but relatively high costs in 2011.
The highest amount of financial firmness costs on the whole period 2011-2012 can be seen for Italy.
This phenomenon can be explained as a consequence of the different approaches of capacity
calculation and allocation methodologies which are applied at the Northern Italian border (top-down
approach). In general financial firmness costs are driven by infrequent events therefore changes cannot
be interpreted as a trend.
Technical Report
57
ENTSO-E AISBL • Avenue de Cortenbergh 100 • 1000 Brussels • Belgium • Tel + 32 2 741 09 50 • Fax + 32 2 741 09 51 • [email protected] • www. entsoe.eu
5. Final Summary
In this Technical Report
Present congestions and their main evolution;
Power flows not resulting from capacity allocation; and
Congestion incomes and firmness costs
have been analysed.
The present congestions have been represented graphically and descriptions have been provided.
These descriptions include outlooks on their future evolution.
Three indicators have been developed for the power flows not resulting from capacity allocation. They
have been applied to the bidding zone borders of the area under investigation. A complementary
analysis has been provided for the CEE region.
Congestion incomes and firmness costs have been supplied by all TSOs. The Report contains
overviews of the collected information.
In terms of the underlying data, both internal TSO information and externally available data has been
used. For upcoming Technical Reports further alignment of the collected data will be a core
requirement to further enhance the reliability and comparability of the analyses.
This Technical Report does not contain any explicit recommendation as to whether a bidding zone
review should be launched. In their letter dated August 30th 2012, ACER and NRAs invited ENTSO-E
“to start an early implementation of the process for reviewing the bidding zones as foreseen in the
nearly finalized Network Code on CACM”. Therefore, the bidding zone review process specified in
the CACM NC will be pursued by ENTSO-E.
The outcomes of the Technical Report analyses will be used as an input into this analysis of the
current bidding zone configuration and potential alternative scenarios. The bidding zone review study
may further encompass Load Flow Analyses, Market Studies, and Statistical and Regression Analyses.

Technical Report
ENTSO-E AISBL • Avenue de Cortenbergh 100 • 1000 Brussels • Belgium • Tel + 32 2 741 09 50 • Fax + 32 2 741 09 51 • [email protected] • www. entsoe.eu
58
Annex 1: Abbreviations
ACER Agency for the Cooperation of Energy Regulators
AT Austria
ATC Available Transfer Capacity
BE Belgium
CACM Capacity Allocation and Congestion Management
CASC Capacity Allocating Service Company
CEE Central and Eastern Europe
CGM Common reference Grid Model
CH Switzerland
CSE Continental South East
CWE Central Western Europe
CWE MC CWE Market Coupling
CZ Czech Republic
D-1 One day prior to real time
D-2 Two days prior to real time
D2CF Congestion Forecasts two Days prior to real time
DA Day Ahead
DACF Day Ahead Congestion Forecast
DC Direct Current
DE Germany
DEAT Germany and Austria
DK Denmark
EEX European Energy Exchange
ENTSO-E European Network of Transmission System Operators for Electricity
FBA Flow Based Allocation
FR France
GSK Generation Shift Key
HU Hungary
HVDC High-Voltage Direct Current
IDCF Intra Day Congestion Forecast
IEM flows Internal Electricity Market flows
IT Italy
LFC Load Frequency Control
LU Luxembourg
NC Network Code
NL Netherlands
NRA National Regulatory Authorities
NTC Net Transfer Capacity
OHL Overhead Line
PL Poland
PST Phase Shifting Transformers
PTDF Power Transfer Distribution Factor

Technical Report
59
ENTSO-E AISBL • Avenue de Cortenbergh 100 • 1000 Brussels • Belgium • Tel + 32 2 741 09 50 • Fax + 32 2 741 09 51 • [email protected] • www. entsoe.eu
PTR Physical Transmission Rights
RES Renewable Energy Sources
SI Slovenia
SK Slovakia
TSC TSO Security Cooperation
TSO Transmission System Operator
VUEN Vorarlberger Übertragungsnetze

Technical Report
ENTSO-E AISBL • Avenue de Cortenbergh 100 • 1000 Brussels • Belgium • Tel + 32 2 741 09 50 • Fax + 32 2 741 09 51 • [email protected] • www. entsoe.eu 60
Annex 2: Bidding zone connections
Figure 28: Current bidding zone borders: Control area resolution
Figure 29: Current bidding zone borders: Country resolution

Technical Report
ENTSO-E AISBL • Avenue de Cortenbergh 100 • 1000 Brussels • Belgium • Tel + 32 2 741 09 50 • Fax + 32 2 741 09 51 • [email protected] • www. entsoe.eu
61
Annex 3: Net Transfer Capacity between bidding zones
Figure 30: Net Transfer Capacity between bidding zones
(Source: TYNDP 2012)
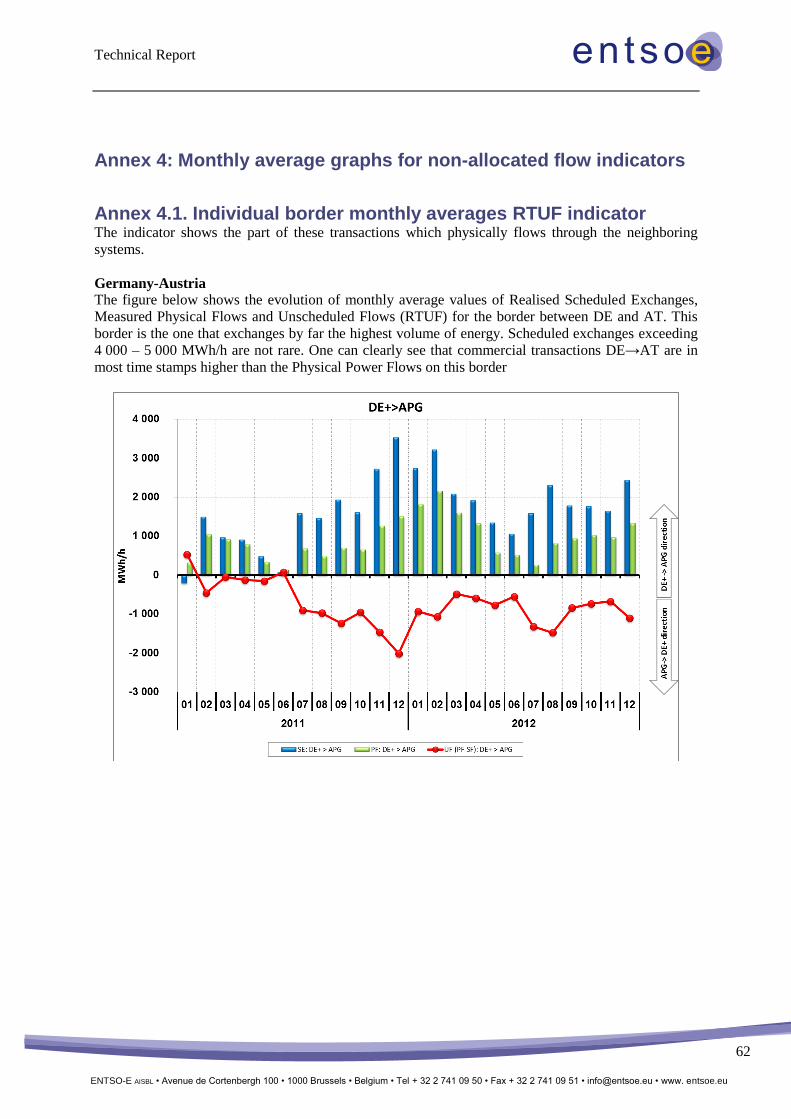
Technical Report
62
ENTSO-E AISBL • Avenue de Cortenbergh 100 • 1000 Brussels • Belgium • Tel + 32 2 741 09 50 • Fax + 32 2 741 09 51 • [email protected] • www. entsoe.eu
Annex 4: Monthly average graphs for non-allocated flow indicators
Annex 4.1. Individual border monthly averages RTUF indicator The indicator shows the part of these transactions which physically flows through the neighboring
systems.
Germany-Austria
The figure below shows the evolution of monthly average values of Realised Scheduled Exchanges,
Measured Physical Flows and Unscheduled Flows (RTUF) for the border between DE and AT. This
border is the one that exchanges by far the highest volume of energy. Scheduled exchanges exceeding
4 000 – 5 000 MWh/h are not rare. One can clearly see that commercial transactions DE→AT are in
most time stamps higher than the Physical Power Flows on this border

Technical Report
63
ENTSO-E AISBL • Avenue de Cortenbergh 100 • 1000 Brussels • Belgium • Tel + 32 2 741 09 50 • Fax + 32 2 741 09 51 • [email protected] • www. entsoe.eu
Germany-Poland
The Figure below shows the evolution of monthly averages values of Realised Scheduled Exchanges,
Measured Physical Flows and Unscheduled Flows (RTUF) for the border between Germany and
Poland. One can clearly see that the direction of the physical flow is usually in the opposite direction
to the commercial schedules (schedules: PL→DE, flow: DE→PL).
During the whole analysed period (January 2011 – December 2012) the measured physical flows on
the DE-PL border were much higher and had the opposite direction than the Realised Scheduled
Exchanges between these countries. There was a permanent and high level of monthly averages
unscheduled flows: 750 – 1 600 MWh/h in the period July 2011 – December 2012.
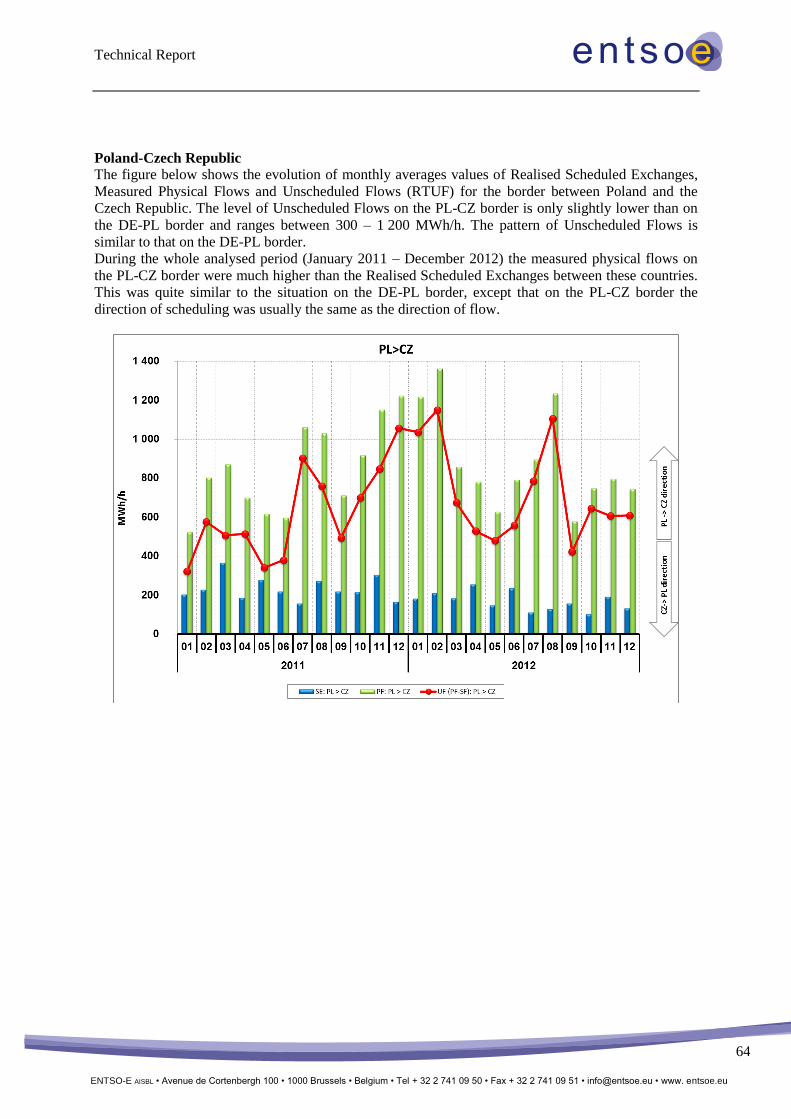
Technical Report
64
ENTSO-E AISBL • Avenue de Cortenbergh 100 • 1000 Brussels • Belgium • Tel + 32 2 741 09 50 • Fax + 32 2 741 09 51 • [email protected] • www. entsoe.eu
Poland-Czech Republic
The figure below shows the evolution of monthly averages values of Realised Scheduled Exchanges,
Measured Physical Flows and Unscheduled Flows (RTUF) for the border between Poland and the
Czech Republic. The level of Unscheduled Flows on the PL-CZ border is only slightly lower than on
the DE-PL border and ranges between 300 – 1 200 MWh/h. The pattern of Unscheduled Flows is
similar to that on the DE-PL border.
During the whole analysed period (January 2011 – December 2012) the measured physical flows on
the PL-CZ border were much higher than the Realised Scheduled Exchanges between these countries.
This was quite similar to the situation on the DE-PL border, except that on the PL-CZ border the
direction of scheduling was usually the same as the direction of flow.
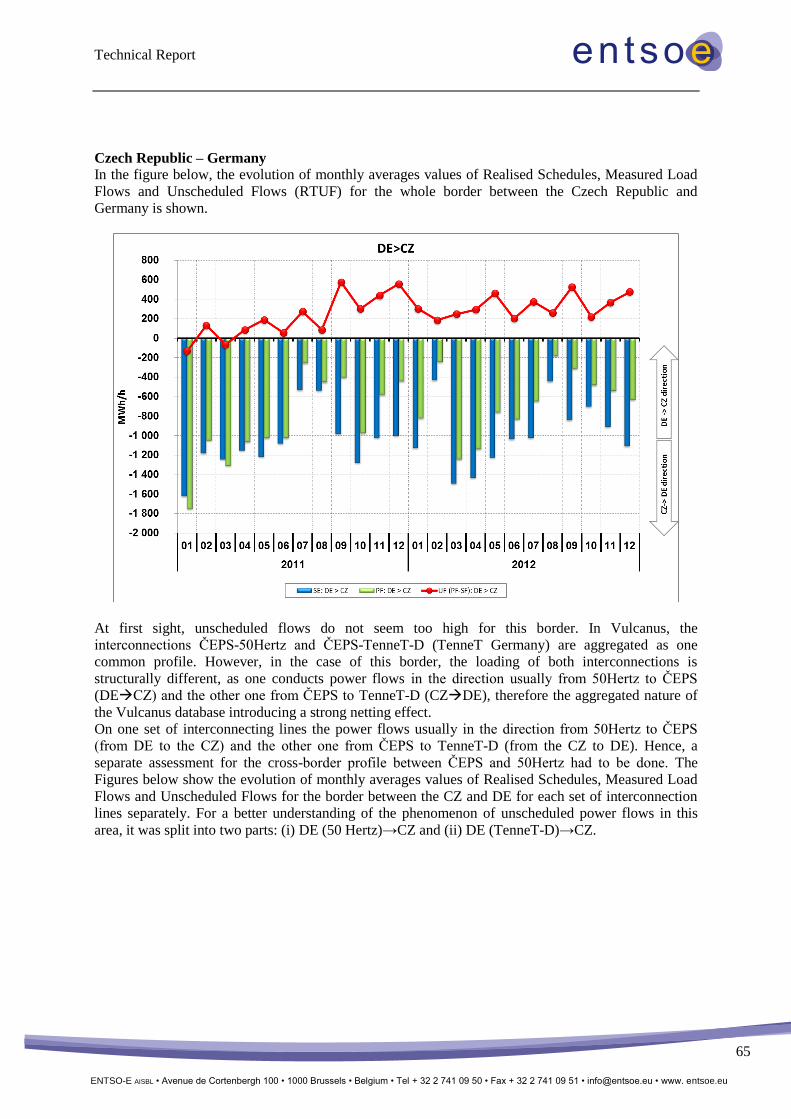
Technical Report
65
ENTSO-E AISBL • Avenue de Cortenbergh 100 • 1000 Brussels • Belgium • Tel + 32 2 741 09 50 • Fax + 32 2 741 09 51 • [email protected] • www. entsoe.eu
Czech Republic – Germany
In the figure below, the evolution of monthly averages values of Realised Schedules, Measured Load
Flows and Unscheduled Flows (RTUF) for the whole border between the Czech Republic and
Germany is shown.
At first sight, unscheduled flows do not seem too high for this border. In Vulcanus, the
interconnections ČEPS-50Hertz and ČEPS-TenneT-D (TenneT Germany) are aggregated as one
common profile. However, in the case of this border, the loading of both interconnections is
structurally different, as one conducts power flows in the direction usually from 50Hertz to ČEPS
(DECZ) and the other one from ČEPS to TenneT-D (CZDE), therefore the aggregated nature of
the Vulcanus database introducing a strong netting effect.
On one set of interconnecting lines the power flows usually in the direction from 50Hertz to ČEPS
(from DE to the CZ) and the other one from ČEPS to TenneT-D (from the CZ to DE). Hence, a
separate assessment for the cross-border profile between ČEPS and 50Hertz had to be done. The
Figures below show the evolution of monthly averages values of Realised Schedules, Measured Load
Flows and Unscheduled Flows for the border between the CZ and DE for each set of interconnection
lines separately. For a better understanding of the phenomenon of unscheduled power flows in this
area, it was split into two parts: (i) DE (50 Hertz)→CZ and (ii) DE (TenneT-D)→CZ.

Technical Report
66
ENTSO-E AISBL • Avenue de Cortenbergh 100 • 1000 Brussels • Belgium • Tel + 32 2 741 09 50 • Fax + 32 2 741 09 51 • [email protected] • www. entsoe.eu
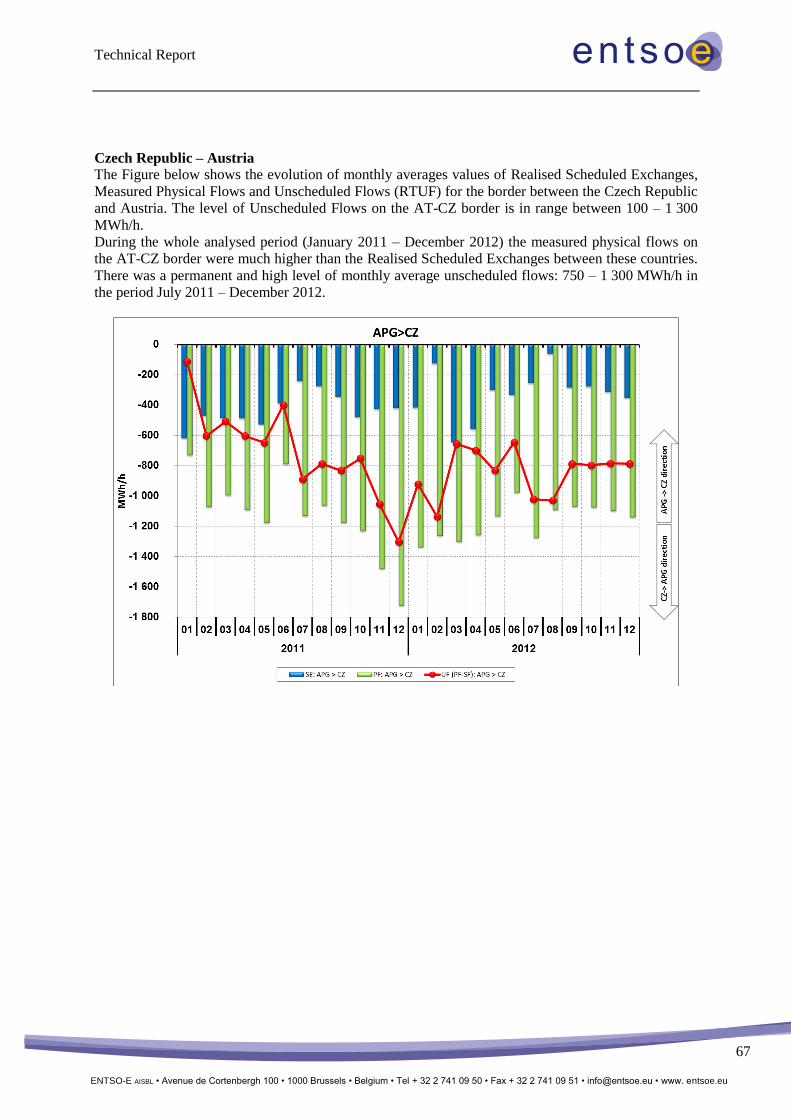
Technical Report
67
ENTSO-E AISBL • Avenue de Cortenbergh 100 • 1000 Brussels • Belgium • Tel + 32 2 741 09 50 • Fax + 32 2 741 09 51 • [email protected] • www. entsoe.eu
Czech Republic – Austria
The Figure below shows the evolution of monthly averages values of Realised Scheduled Exchanges,
Measured Physical Flows and Unscheduled Flows (RTUF) for the border between the Czech Republic
and Austria. The level of Unscheduled Flows on the AT-CZ border is in range between 100 – 1 300
MWh/h.
During the whole analysed period (January 2011 – December 2012) the measured physical flows on
the AT-CZ border were much higher than the Realised Scheduled Exchanges between these countries.
There was a permanent and high level of monthly average unscheduled flows: 750 – 1 300 MWh/h in
the period July 2011 – December 2012.

Technical Report
68
ENTSO-E AISBL • Avenue de Cortenbergh 100 • 1000 Brussels • Belgium • Tel + 32 2 741 09 50 • Fax + 32 2 741 09 51 • [email protected] • www. entsoe.eu
Slovakia-Hungary The Figure below shows the evolution of monthly average values of Realised Scheduled Exchanges,
Measured Physical Flows and Unscheduled Flows for the border between Slovakia and Hungary. Even
if this profile is not the most affected border, one can see a dominant unscheduled flow – with minor
exceptions – in the direction SK→HU in the second half of 2011 and the whole 2012. During this
period of time the average values of unscheduled power flows reach 200 - 300 MWh/h, which is less
compared to levels reached on the most affected borders. Irrespective of their comparatively moderate
magnitude these unscheduled flows have been the cause for operational remedial actions taken by
some TSOs in the concerned area (e.g. changes of the network topology by SEPS that have a negative
impact on operational security level and loses in the system). However, the SK-HU profile is the
major import direction for Hungary and as such is very important for ensuring a reliable power supply
for this structurally importing country.

Technical Report
69
ENTSO-E AISBL • Avenue de Cortenbergh 100 • 1000 Brussels • Belgium • Tel + 32 2 741 09 50 • Fax + 32 2 741 09 51 • [email protected] • www. entsoe.eu
Austria-Hungary The Figure below shows the evolution of monthly average values of Realised Scheduled Exchanges,
Measured Physical Flows and Unscheduled Flows for the border between Austria and Hungary. One
can see that in the first half of 2011 the direction of Unscheduled Flows was AT→HU and remained at
the level between (0, 200 MWh/h). From that time, in the second half of 2011 and the whole 2012, the
monthly average level of unscheduled flows was much higher, in the direction HU→AT, sometimes
reaching almost 400 MWh/h.
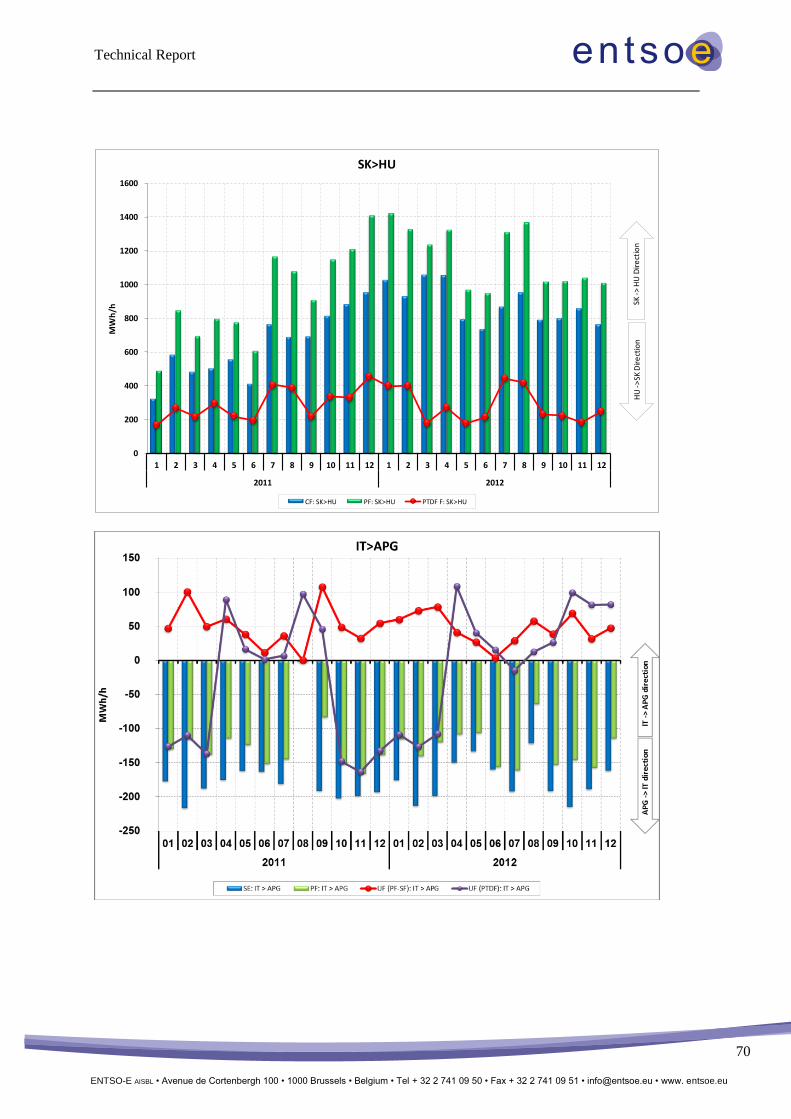
Technical Report
70
ENTSO-E AISBL • Avenue de Cortenbergh 100 • 1000 Brussels • Belgium • Tel + 32 2 741 09 50 • Fax + 32 2 741 09 51 • [email protected] • www. entsoe.eu
0
200
400
600
800
1000
1200
1400
1600
1 2 3 4 5 6 7 8 9 10 11 12 1 2 3 4 5 6 7 8 9 10 11 12
2011 2012
MW
h/h
SK>HU
CF: SK>HU PF: SK>HU PTDF F: SK>HU
HU
->SK
Dir
ect
ion
SK ->
HU
Dir
ect
ion
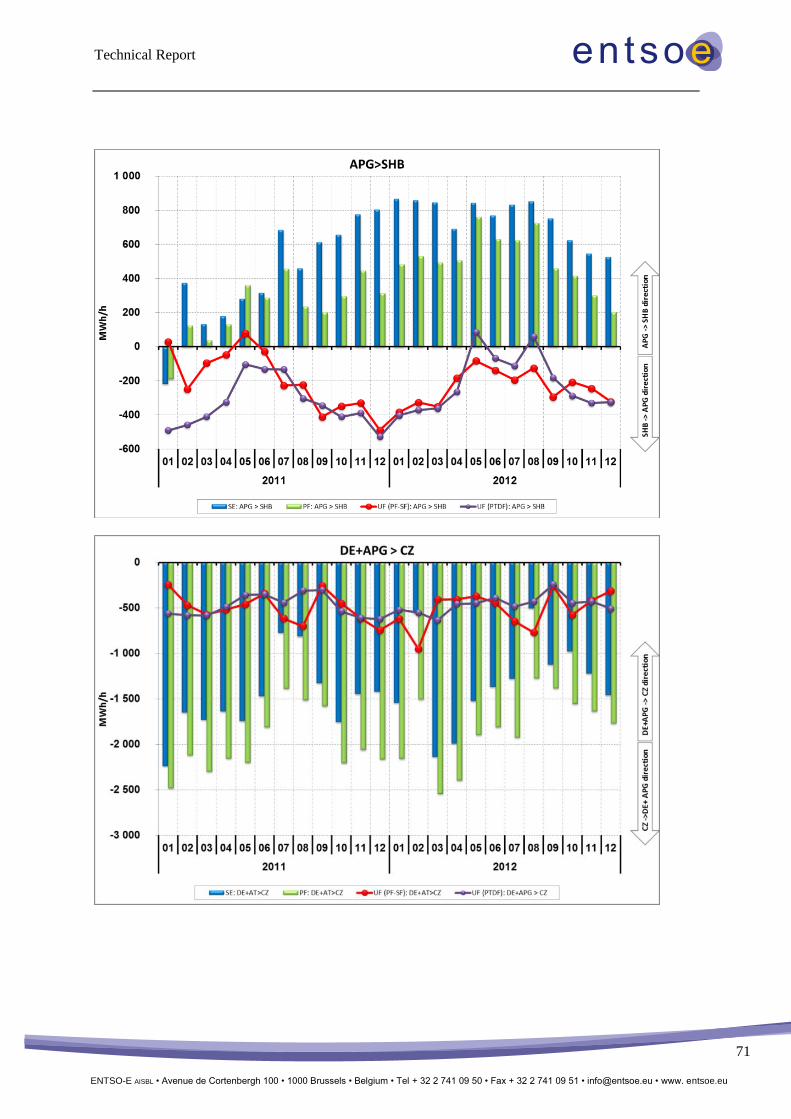
Technical Report
71
ENTSO-E AISBL • Avenue de Cortenbergh 100 • 1000 Brussels • Belgium • Tel + 32 2 741 09 50 • Fax + 32 2 741 09 51 • [email protected] • www. entsoe.eu

Technical Report
72
ENTSO-E AISBL • Avenue de Cortenbergh 100 • 1000 Brussels • Belgium • Tel + 32 2 741 09 50 • Fax + 32 2 741 09 51 • [email protected] • www. entsoe.eu

Technical Report
73
ENTSO-E AISBL • Avenue de Cortenbergh 100 • 1000 Brussels • Belgium • Tel + 32 2 741 09 50 • Fax + 32 2 741 09 51 • [email protected] • www. entsoe.eu

Technical Report
74
ENTSO-E AISBL • Avenue de Cortenbergh 100 • 1000 Brussels • Belgium • Tel + 32 2 741 09 50 • Fax + 32 2 741 09 51 • [email protected] • www. entsoe.eu

Technical Report
75
ENTSO-E AISBL • Avenue de Cortenbergh 100 • 1000 Brussels • Belgium • Tel + 32 2 741 09 50 • Fax + 32 2 741 09 51 • [email protected] • www. entsoe.eu
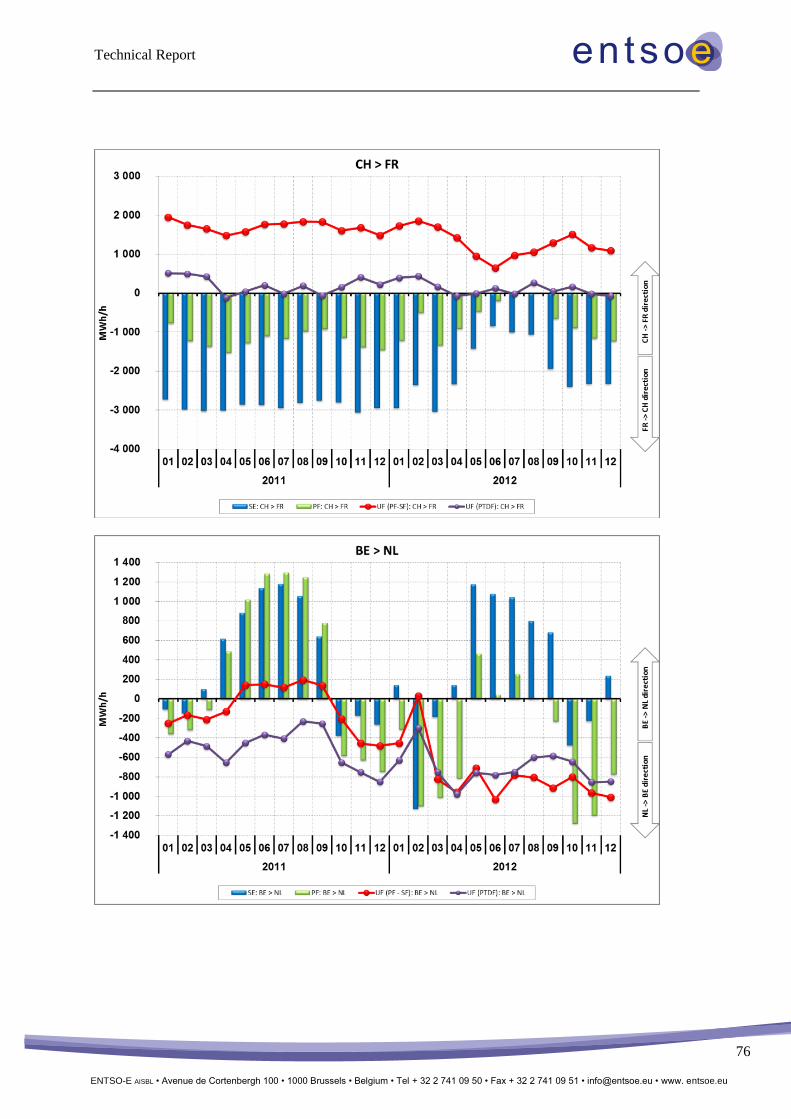
Technical Report
76
ENTSO-E AISBL • Avenue de Cortenbergh 100 • 1000 Brussels • Belgium • Tel + 32 2 741 09 50 • Fax + 32 2 741 09 51 • [email protected] • www. entsoe.eu
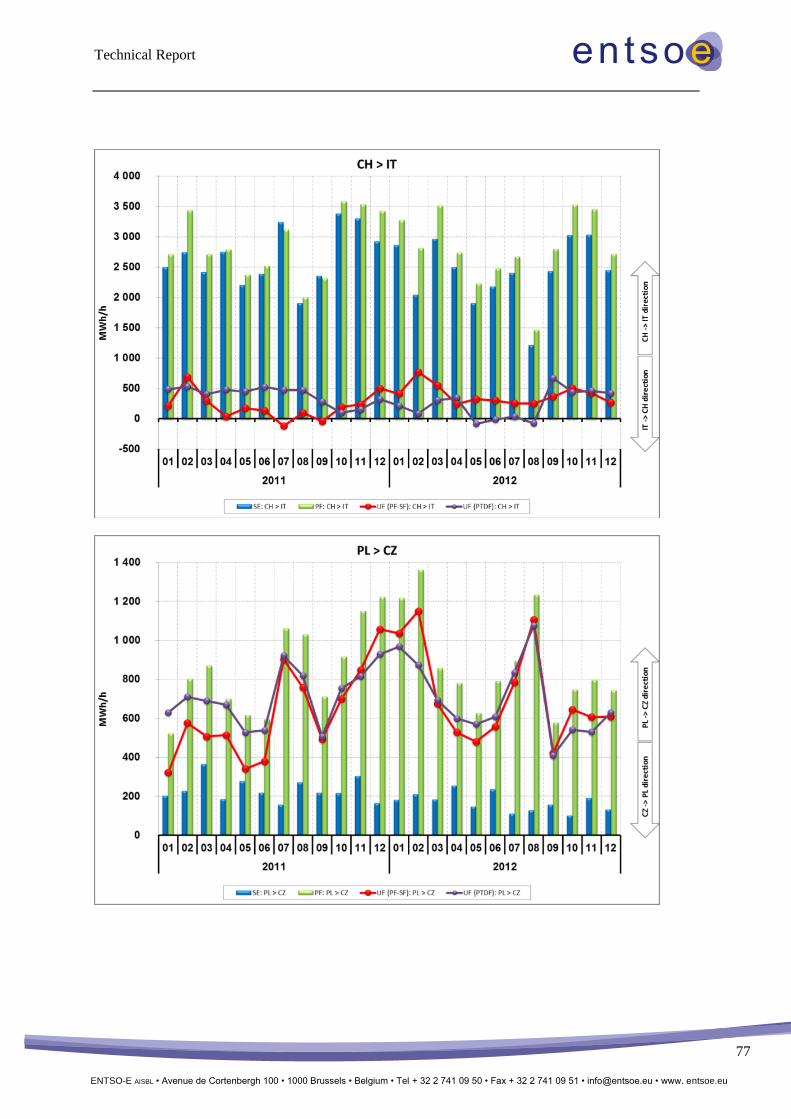
Technical Report
77
ENTSO-E AISBL • Avenue de Cortenbergh 100 • 1000 Brussels • Belgium • Tel + 32 2 741 09 50 • Fax + 32 2 741 09 51 • [email protected] • www. entsoe.eu
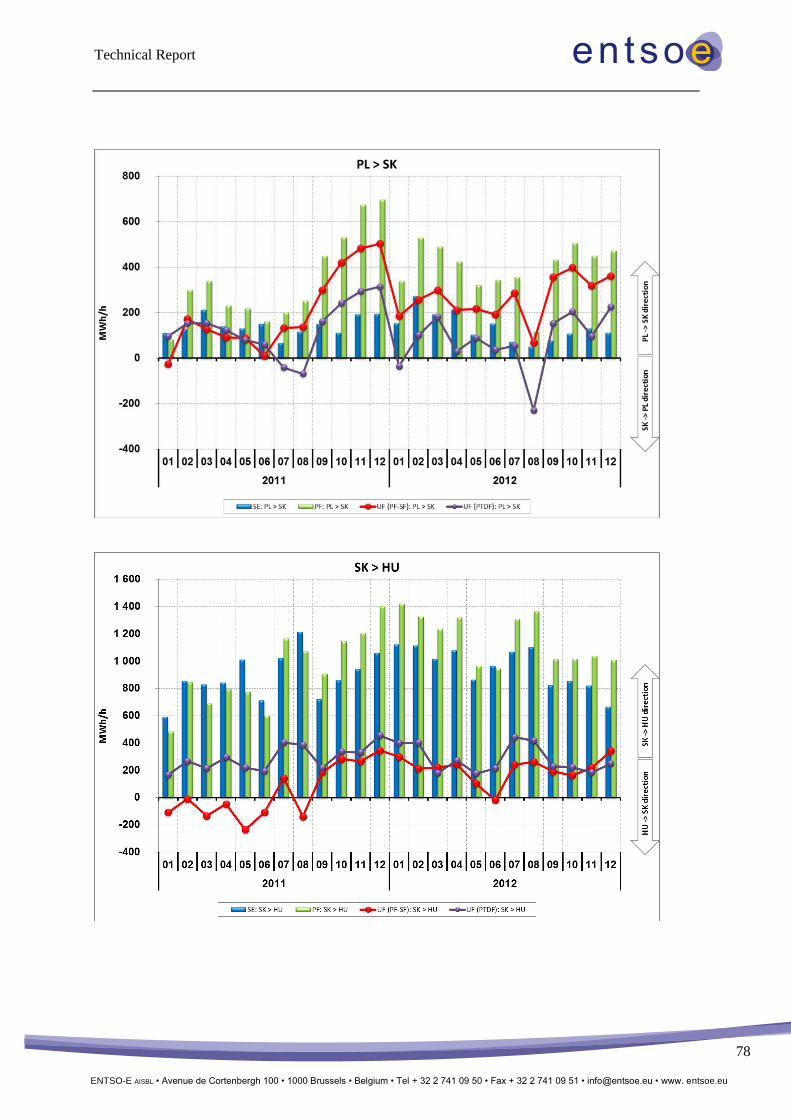
Technical Report
78
ENTSO-E AISBL • Avenue de Cortenbergh 100 • 1000 Brussels • Belgium • Tel + 32 2 741 09 50 • Fax + 32 2 741 09 51 • [email protected] • www. entsoe.eu

Technical Report
79
ENTSO-E AISBL • Avenue de Cortenbergh 100 • 1000 Brussels • Belgium • Tel + 32 2 741 09 50 • Fax + 32 2 741 09 51 • [email protected] • www. entsoe.eu
Annex 4.2.: Individual border monthly averages PTDF indicator
-2000
-1500
-1000
-500
0
500
1000
1 2 3 4 5 6 7 8 9 10 11 12 1 2 3 4 5 6 7 8 9 10 11 12
2011 2012
MW
h/h
CH>FR
CF: CH>FR PF: CH>FR PTDF F: CH>FR
CH
->FR
Dir
ect
ion
FR->
CH
Dir
ect
ion
-500
0
500
1000
1500
2000
2500
3000
3500
4000
1 2 3 4 5 6 7 8 9 10 11 12 1 2 3 4 5 6 7 8 9 10 11 12
2011 2012
MW
h/h
CH>IT
CF: CH>IT PF: CH>IT PTDF F: CH>IT
CH
->IT
Dir
ect
ion
IT->
CH
Dir
ect
ion
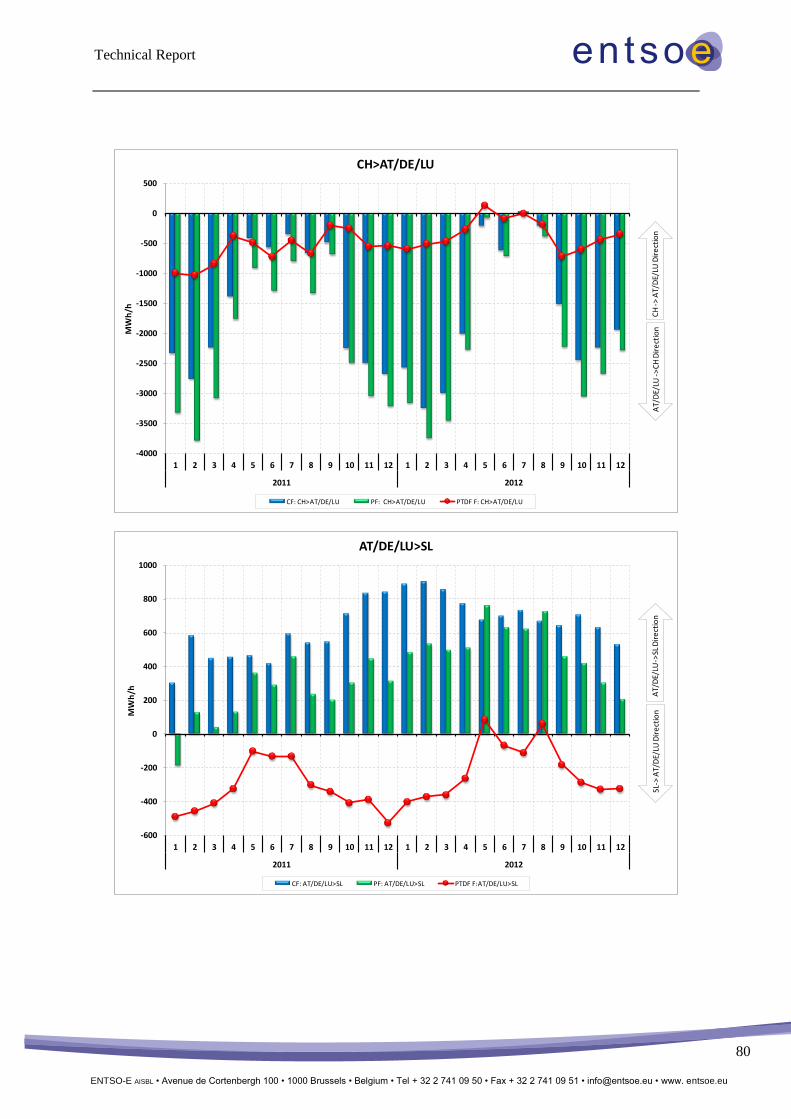
Technical Report
80
ENTSO-E AISBL • Avenue de Cortenbergh 100 • 1000 Brussels • Belgium • Tel + 32 2 741 09 50 • Fax + 32 2 741 09 51 • [email protected] • www. entsoe.eu
-4000
-3500
-3000
-2500
-2000
-1500
-1000
-500
0
500
1 2 3 4 5 6 7 8 9 10 11 12 1 2 3 4 5 6 7 8 9 10 11 12
2011 2012
MW
h/h
CH>AT/DE/LU
CF: CH>AT/DE/LU PF: CH>AT/DE/LU PTDF F: CH>AT/DE/LU
AT/
DE/
LU ->
CH
Dir
ect
ion
CH
-> A
T/D
E/LU
Dir
ect
ion
-600
-400
-200
0
200
400
600
800
1000
1 2 3 4 5 6 7 8 9 10 11 12 1 2 3 4 5 6 7 8 9 10 11 12
2011 2012
MW
h/h
AT/DE/LU>SL
CF: AT/DE/LU>SL PF: AT/DE/LU>SL PTDF F:AT/DE/LU>SL
SL->
AT/
DE/
LU D
ire
ctio
nA
T/D
E/LU
->SL
Dir
ect
ion

Technical Report
81
ENTSO-E AISBL • Avenue de Cortenbergh 100 • 1000 Brussels • Belgium • Tel + 32 2 741 09 50 • Fax + 32 2 741 09 51 • [email protected] • www. entsoe.eu
-1500
-1000
-500
0
500
1000
1500
2000
2500
1 2 3 4 5 6 7 8 9 10 11 12 1 2 3 4 5 6 7 8 9 10 11 12
2011 2012
MW
h/h
FR>BE
CF: FR>BE PF: FR>BE PTDF F: FR>BE
FR->
BE
Dir
ect
ion
BE
->
FR
Dir
ect
ion
-1000
-500
0
500
1000
1500
2000
2500
3000
3500
1 2 3 4 5 6 7 8 9 10 11 12 1 2 3 4 5 6 7 8 9 10 11 12
2011 2012
MW
h/h
FR>AT/DE/LU
CF: FR>AT/DE/LU PF: FR>AT/DE/LU PTDF F: FR>AT/DE/LU
FR->
AT/
DE/
LUD
ire
ctio
nA
T/D
E/LU
->
FR
Dir
ect
ion
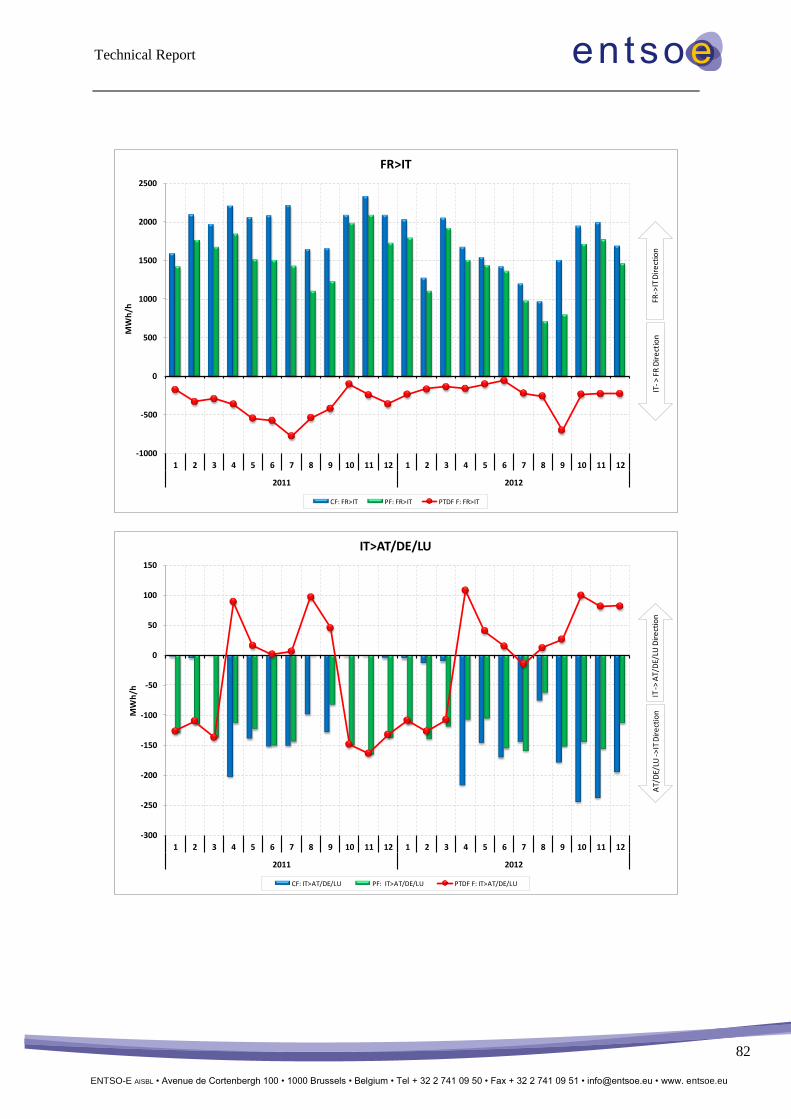
Technical Report
82
ENTSO-E AISBL • Avenue de Cortenbergh 100 • 1000 Brussels • Belgium • Tel + 32 2 741 09 50 • Fax + 32 2 741 09 51 • [email protected] • www. entsoe.eu
-1000
-500
0
500
1000
1500
2000
2500
1 2 3 4 5 6 7 8 9 10 11 12 1 2 3 4 5 6 7 8 9 10 11 12
2011 2012
MW
h/h
FR>IT
CF: FR>IT PF: FR>IT PTDF F: FR>IT
FR->
ITD
ire
ctio
nIT
-> F
R D
ire
ctio
n
-300
-250
-200
-150
-100
-50
0
50
100
150
1 2 3 4 5 6 7 8 9 10 11 12 1 2 3 4 5 6 7 8 9 10 11 12
2011 2012
MW
h/h
IT>AT/DE/LU
CF: IT>AT/DE/LU PF: IT>AT/DE/LU PTDF F: IT>AT/DE/LU
AT/
DE/
LU ->
IT D
ire
ctio
nIT
-> A
T/D
E/LU
Dir
ect
ion
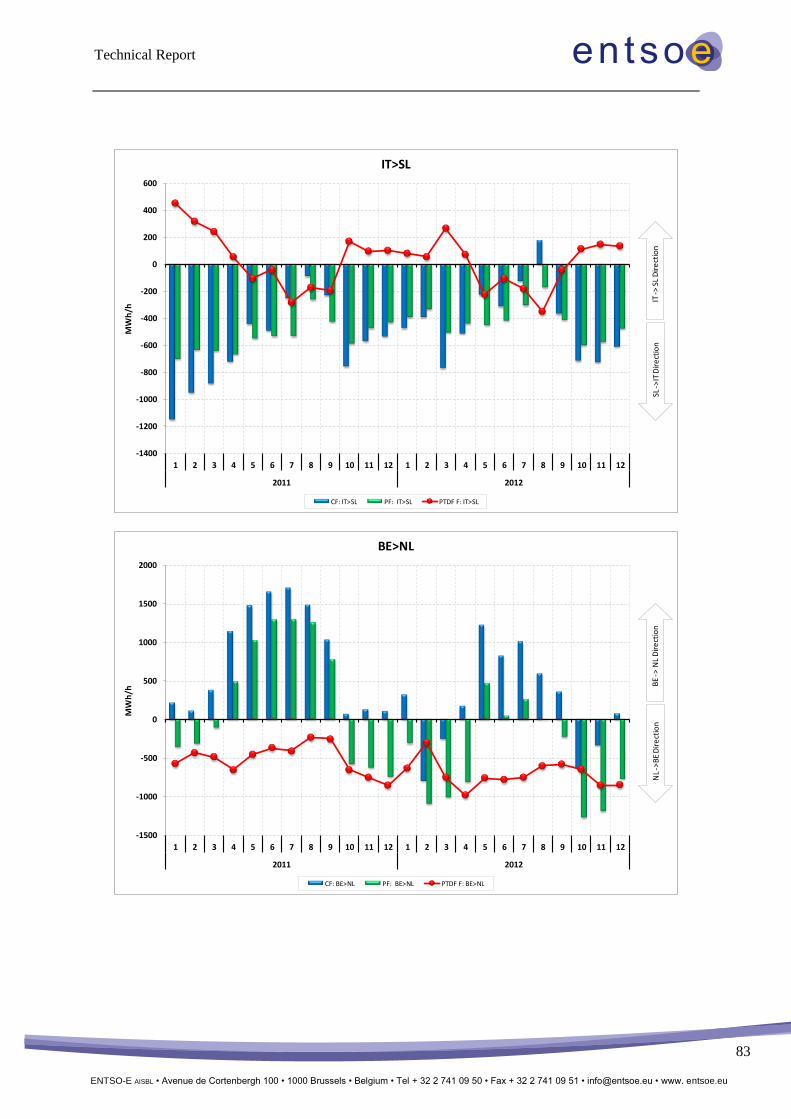
Technical Report
83
ENTSO-E AISBL • Avenue de Cortenbergh 100 • 1000 Brussels • Belgium • Tel + 32 2 741 09 50 • Fax + 32 2 741 09 51 • [email protected] • www. entsoe.eu
-1400
-1200
-1000
-800
-600
-400
-200
0
200
400
600
1 2 3 4 5 6 7 8 9 10 11 12 1 2 3 4 5 6 7 8 9 10 11 12
2011 2012
MW
h/h
IT>SL
CF: IT>SL PF: IT>SL PTDF F: IT>SL
SL ->
IT D
ire
ctio
nIT
-> S
L D
ire
ctio
n
-1500
-1000
-500
0
500
1000
1500
2000
1 2 3 4 5 6 7 8 9 10 11 12 1 2 3 4 5 6 7 8 9 10 11 12
2011 2012
MW
h/h
BE>NL
CF: BE>NL PF: BE>NL PTDF F: BE>NL
NL
->B
E D
ire
ctio
nB
E ->
NL
Dir
ect
ion

Technical Report
84
ENTSO-E AISBL • Avenue de Cortenbergh 100 • 1000 Brussels • Belgium • Tel + 32 2 741 09 50 • Fax + 32 2 741 09 51 • [email protected] • www. entsoe.eu
-1500
-1000
-500
0
500
1000
1500
2000
2500
3000
3500
1 2 3 4 5 6 7 8 9 10 11 12 1 2 3 4 5 6 7 8 9 10 11 12
2011 2012
MW
h/h
AT/DE/LU>NL
CF: AT/DE/LU>NL PF: AT/DE/LU>NL PTDF F: AT/DE/LU>NL
NL
->A
T/D
E/LU
Dir
ect
ion
AT/
DE/
LU ->
NL
Dir
ect
ion
-800
-600
-400
-200
0
200
400
600
800
1000
1200
1400
1 2 3 4 5 6 7 8 9 10 11 12 1 2 3 4 5 6 7 8 9 10 11 12
2011 2012
MW
h/h
AT/DE/LU>PL
CF: AT/DE/LU>PL PF: AT/DE/LU>PL PTDF F: AT/DE/LU>PL
PL
->A
T/D
E/LU
Dir
ect
ion
AT/
DE/
LU ->
PL
Dir
ect
ion

Technical Report
85
ENTSO-E AISBL • Avenue de Cortenbergh 100 • 1000 Brussels • Belgium • Tel + 32 2 741 09 50 • Fax + 32 2 741 09 51 • [email protected] • www. entsoe.eu
-3000
-2500
-2000
-1500
-1000
-500
0
1 2 3 4 5 6 7 8 9 10 11 12 1 2 3 4 5 6 7 8 9 10 11 12
2011 2012
MW
h/h
AT/DE/LU>CZ
CF: AT/DE/LU>CZ PF: AT/DE/LU>CZ PTDF F: AT/DE/LU>CZ
CZ
->A
T/D
E/LU
Dir
ect
ion
AT/
DE/
LU ->
CZ
Dir
ect
ion
-300
-200
-100
0
100
200
300
400
500
600
1 2 3 4 5 6 7 8 9 10 11 12 1 2 3 4 5 6 7 8 9 10 11 12
2011 2012
MW
h/h
AT/DE/LU>HU
CF: AT/DE/LU>HU PF: AT/DE/LU>HU PTDF F: AT/DE/LU>HU
HU
->A
T/D
E/LU
Dir
ect
ion
AT/
DE/
LU ->
HU
Dir
ect
ion
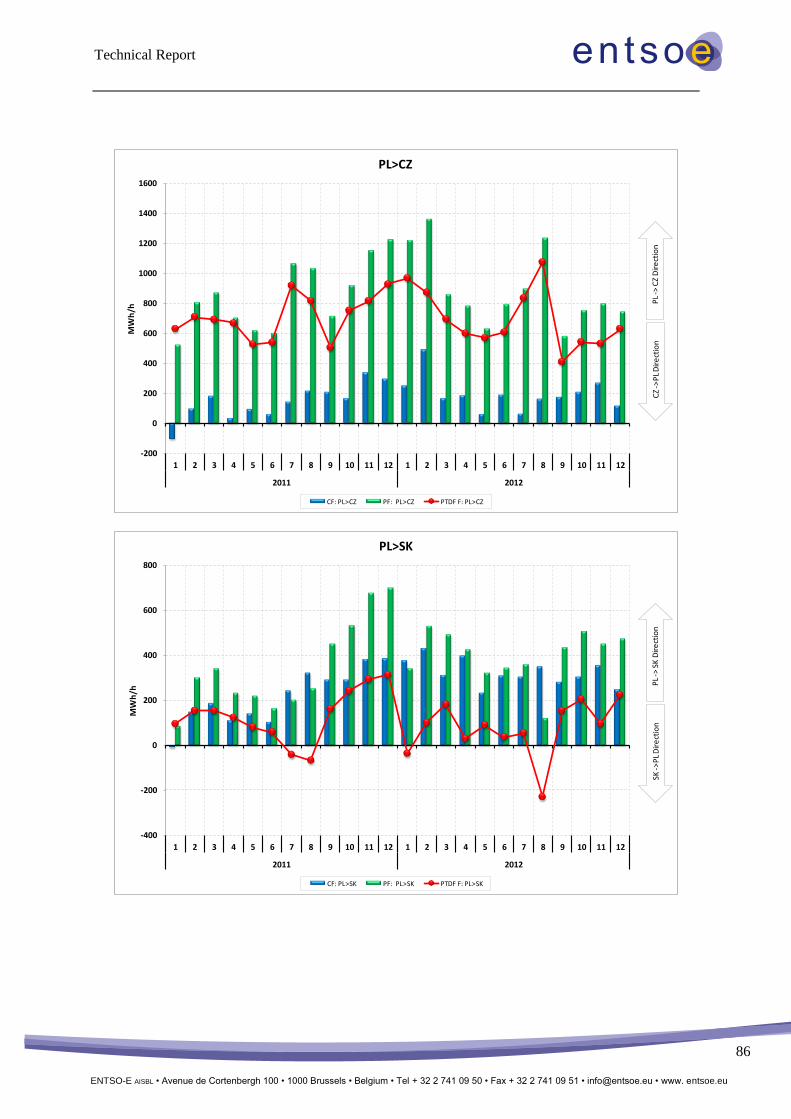
Technical Report
86
ENTSO-E AISBL • Avenue de Cortenbergh 100 • 1000 Brussels • Belgium • Tel + 32 2 741 09 50 • Fax + 32 2 741 09 51 • [email protected] • www. entsoe.eu
-200
0
200
400
600
800
1000
1200
1400
1600
1 2 3 4 5 6 7 8 9 10 11 12 1 2 3 4 5 6 7 8 9 10 11 12
2011 2012
MW
h/h
PL>CZ
CF: PL>CZ PF: PL>CZ PTDF F: PL>CZ
CZ
->P
L D
ire
ctio
nP
L ->
CZ
Dir
ect
ion
-400
-200
0
200
400
600
800
1 2 3 4 5 6 7 8 9 10 11 12 1 2 3 4 5 6 7 8 9 10 11 12
2011 2012
MW
h/h
PL>SK
CF: PL>SK PF: PL>SK PTDF F: PL>SK
SK ->
PL
Dir
ect
ion
PL
-> S
K D
ire
ctio
n
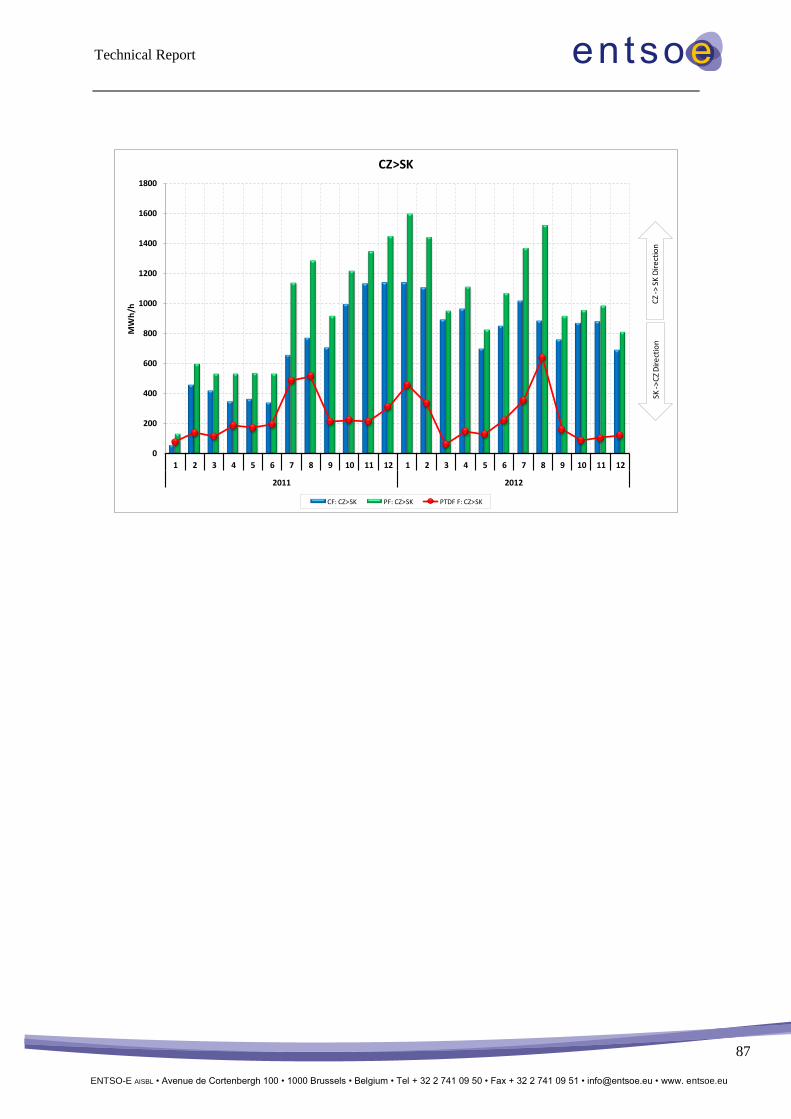
Technical Report
87
ENTSO-E AISBL • Avenue de Cortenbergh 100 • 1000 Brussels • Belgium • Tel + 32 2 741 09 50 • Fax + 32 2 741 09 51 • [email protected] • www. entsoe.eu
0
200
400
600
800
1000
1200
1400
1600
1800
1 2 3 4 5 6 7 8 9 10 11 12 1 2 3 4 5 6 7 8 9 10 11 12
2011 2012
MW
h/h
CZ>SK
CF: CZ>SK PF: CZ>SK PTDF F: CZ>SK
SK ->
CZ
Dir
ect
ion
CZ
-> S
K D
ire
ctio
n

Technical Report
88
ENTSO-E AISBL • Avenue de Cortenbergh 100 • 1000 Brussels • Belgium • Tel + 32 2 741 09 50 • Fax + 32 2 741 09 51 • [email protected] • www. entsoe.eu
Annex 4.3: Individual border monthly averages DAUF evolution
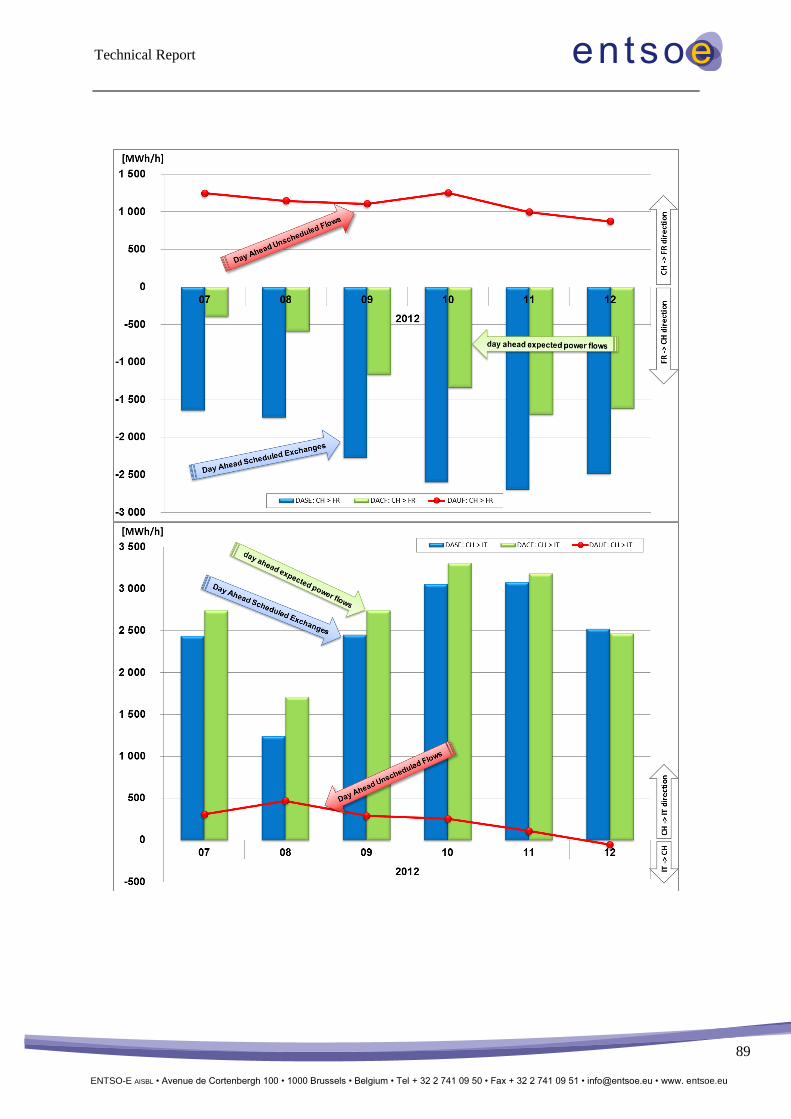
Technical Report
89
ENTSO-E AISBL • Avenue de Cortenbergh 100 • 1000 Brussels • Belgium • Tel + 32 2 741 09 50 • Fax + 32 2 741 09 51 • [email protected] • www. entsoe.eu

Technical Report
90
ENTSO-E AISBL • Avenue de Cortenbergh 100 • 1000 Brussels • Belgium • Tel + 32 2 741 09 50 • Fax + 32 2 741 09 51 • [email protected] • www. entsoe.eu

Technical Report
91
ENTSO-E AISBL • Avenue de Cortenbergh 100 • 1000 Brussels • Belgium • Tel + 32 2 741 09 50 • Fax + 32 2 741 09 51 • [email protected] • www. entsoe.eu
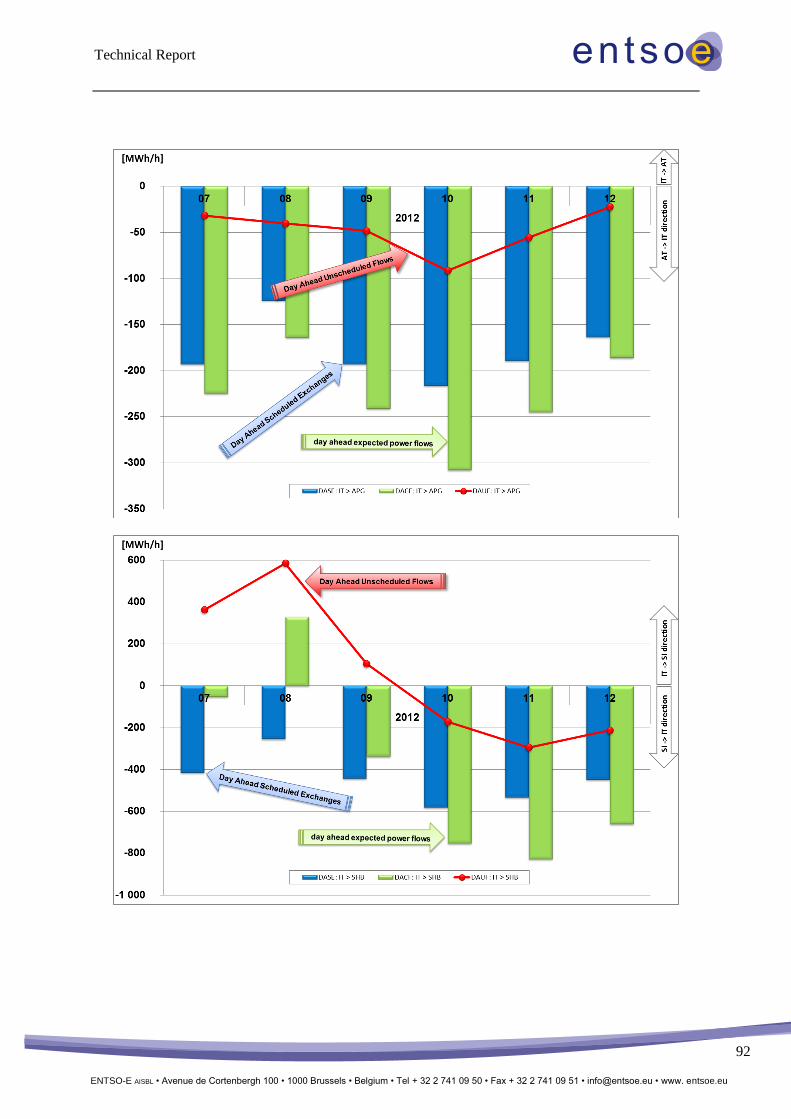
Technical Report
92
ENTSO-E AISBL • Avenue de Cortenbergh 100 • 1000 Brussels • Belgium • Tel + 32 2 741 09 50 • Fax + 32 2 741 09 51 • [email protected] • www. entsoe.eu

Technical Report
93
ENTSO-E AISBL • Avenue de Cortenbergh 100 • 1000 Brussels • Belgium • Tel + 32 2 741 09 50 • Fax + 32 2 741 09 51 • [email protected] • www. entsoe.eu

Technical Report
94
ENTSO-E AISBL • Avenue de Cortenbergh 100 • 1000 Brussels • Belgium • Tel + 32 2 741 09 50 • Fax + 32 2 741 09 51 • [email protected] • www. entsoe.eu
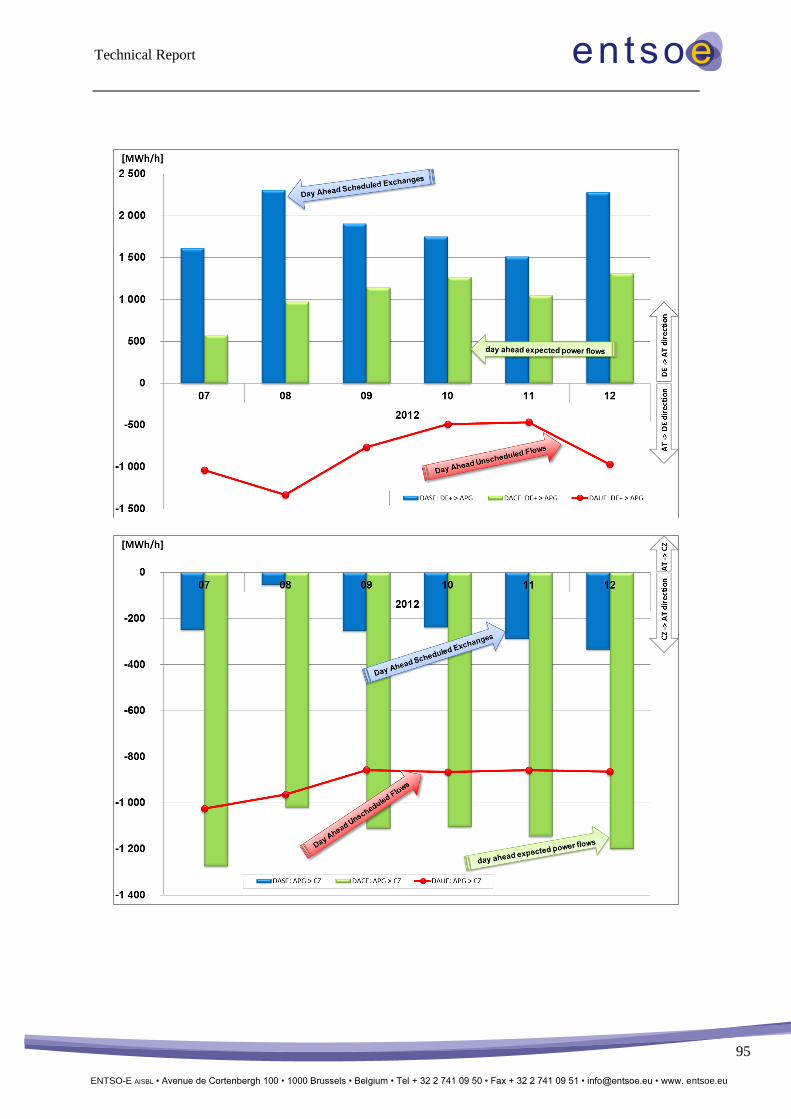
Technical Report
95
ENTSO-E AISBL • Avenue de Cortenbergh 100 • 1000 Brussels • Belgium • Tel + 32 2 741 09 50 • Fax + 32 2 741 09 51 • [email protected] • www. entsoe.eu

Technical Report
96
ENTSO-E AISBL • Avenue de Cortenbergh 100 • 1000 Brussels • Belgium • Tel + 32 2 741 09 50 • Fax + 32 2 741 09 51 • [email protected] • www. entsoe.eu

Technical Report
97
ENTSO-E AISBL • Avenue de Cortenbergh 100 • 1000 Brussels • Belgium • Tel + 32 2 741 09 50 • Fax + 32 2 741 09 51 • [email protected] • www. entsoe.eu
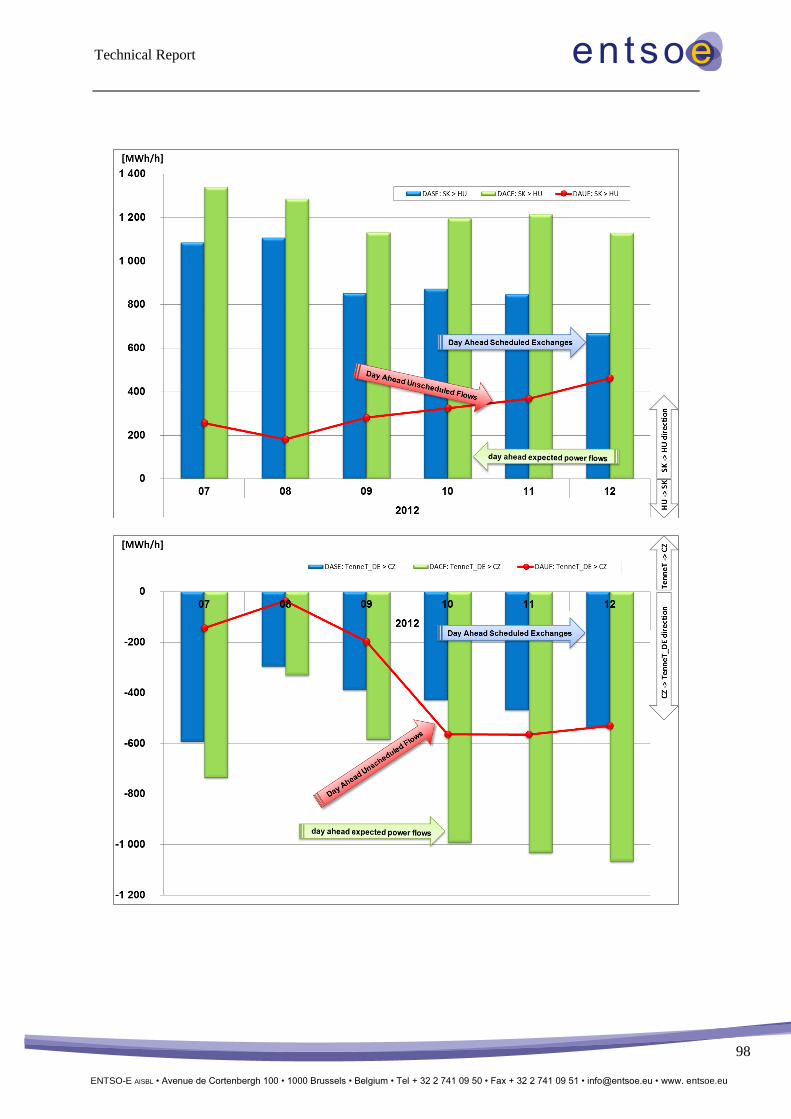
Technical Report
98
ENTSO-E AISBL • Avenue de Cortenbergh 100 • 1000 Brussels • Belgium • Tel + 32 2 741 09 50 • Fax + 32 2 741 09 51 • [email protected] • www. entsoe.eu

Technical Report
99
ENTSO-E AISBL • Avenue de Cortenbergh 100 • 1000 Brussels • Belgium • Tel + 32 2 741 09 50 • Fax + 32 2 741 09 51 • [email protected] • www. entsoe.eu

Technical Report
ENTSO-E AISBL • Avenue de Cortenbergh 100 • 1000 Brussels • Belgium • Tel + 32 2 741 09 50 • Fax + 32 2 741 09 51 • [email protected] • www. entsoe.eu
100
Annex 5: Statistical data related to the indicators
Annex 5.1.: Statistical data related to the RTUF indicator Table 8: Statistical data related to the RTUF indicator
max min10%
percentile
90%
percentileaverage median sum time time
[MW] [MW] [MW] [MW] [MW] [MW] [GWh] [h] [%]
PF 617 -2067 -1344 -226 -747 -719 -13110 17544 100%
SF 1086 -900 -483 128 -214 -275 -3746 17544 100%
UF 641 -1709 -957 -152 -534 -518 -9364 17544 100%
PF 2161 -4357 -2825 360 -1322 -1433 -23201 17544 100%
SF 4000 -1508 -1056 1540 -70 -500 -1224 17544 100%
UF 1008 -3448 -2058 -462 -1253 -1256 -21977 17544 100%
PF 1901 -2751 -1790 15 -953 -1038 -16716 17544 100%
SF 1100 -3600 -3200 -942 -2448 -2893 -42954 17544 100%
UF 3252 -1284 700 2219 1496 1561 26238 17544 100%
PF 5143 -1176 1474 4092 2842 2935 49857 17544 100%
SF 4240 -482 1370 3710 2550 2548 44734 17544 100%
UF 1855 -1721 -282 883 292 282 5123 17544 100%
PF 1245 -806 -45 766 370 392 6485 17544 100%
SF 952 -890 57 950 588 673 10308 17544 100%
UF 956 -941 -516 80 -218 -224 -3824 17544 100%
PF 3169 -2592 -704 1715 573 660 10060 17544 100%
SF 3601 -1985 -385 2421 1012 1068 17748 17544 100%
UF 1240 -2492 -1296 316 -438 -384 -7688 17544 100%
PF 4809 -1318 404 3342 1860 1860 32630 17544 100%
SF 2819 -3651 -2600 1815 -362 -347 -6345 17544 100%
UF 4562 -934 1215 3313 2222 2182 38975 17544 100%
PF 3235 -1273 643 2300 1489 1508 26131 17544 100%
SF 2956 -969 1027 2647 1778 2033 31193 17544 100%
UF 1287 -1727 -861 257 -289 -276 -5062 17544 100%
PF 211 -285 -212 0 -125 -141 -2185 17544 100%
SF 99 -221 -221 -72 -172 -201 -3023 17544 100%
UF 333 -234 -39 151 48 44 838 17544 100%
PF 442 -1430 -751 -184 -481 -499 -8446 17544 100%
SF 229 -775 -598 -203 -438 -460 -7688 17544 100%
UF 796 -1198 -284 194 -43 -41 -759 17544 100%
PF 2478 -2838 -1544 1372 -104 -124 -1829 17544 100%
SF 1455 -1459 -1157 1401 331 490 5798 17544 100%
UF 1313 -2388 -1286 312 -435 -383 -7628 17544 100%
PF 4898 -2897 -606 3402 1606 1839 28172 17544 100%
SF 2510 -2459 -734 2445 1178 1534 20667 17544 100%
UF 2447 -1305 -319 1271 428 378 7504 17544 100%
PF 2030 -1354 -26 1245 603 603 10581 17544 100%
SF 805 -1240 -647 0 -296 -295 -5198 17544 100%
UF 2690 -681 297 1500 899 893 15779 17544 100%
PF 1512 -2971 -1586 75 -756 -760 -13265 17544 100%
SF 1067 -2700 -1774 -193 -1025 -1069 -17979 17544 100%
UF 1815 -1071 -264 818 269 257 4714 17544 100%
PF 3700 -1546 -199 2049 926 919 16247 17544 100%
SF 6209 -2916 -109 3483 1690 1694 29646 17544 100%
UF 2291 -4182 -1903 365 -764 -764 -13399 17544 100%
PF 196 -2435 -1660 -664 -1153 -1144 -20228 17544 100%
SF 712 -800 -692 -46 -378 -396 -6626 17544 100%
UF 572 -2546 -1341 -220 -775 -769 -13602 17544 100%
PF 959 -634 -131 478 173 174 3027 17544 100%
SF 810 -800 -327 790 302 392 5303 17544 100%
UF 720 -922 -469 247 -130 -151 -2276 17544 100%
PF 2424 -266 339 1389 869 865 15250 17544 100%
SF 770 -405 0 539 203 162 3554 17544 100%
UF 2474 -353 223 1146 667 634 11696 17544 100%
PF 1184 -335 0 680 372 380 6523 17544 100%
SF 600 -200 0 370 139 98 2443 17544 100%
UF 910 -459 0 506 233 232 4080 17544 100%
PF 2510 -552 278 1616 988 1027 17326 17544 100%
SF 1896 -870 253 1386 829 858 14544 17544 100%
UF 1317 -659 -175 495 159 157 2782 17544 100%
PF 2041 -191 539 1507 1046 1073 18343 17544 100%
SF 1300 -526 500 1200 924 993 16217 17544 100%
UF 1115 -701 -232 462 121 129 2126 17544 100%
PF 1604 -1938 -756 491 -110 -82 -1928 17544 100%
SF 1353 -695 40 765 427 451 7484 17544 100%
UF 734 -2393 -1092 -38 -536 -504 -9412 17544 100%
PF 2038 -456 338 1347 866 895 15192 17544 100%
SF 1609 -951 88 1087 598 614 10495 17544 100%
UF 1647 -1115 -187 720 268 272 4697 17544 100%
PF 2886 -3372 -1493 719 -397 -412 -6962 17544 100%
SF 1779 -3406 -2404 -292 -1403 -1465 -24606 17544 100%
UF 5830 -4438 -937 2877 1006 1059 17643 17544 100%
PF 2684 -5543 -4003 37 -2070 -2195 -36311 17544 100%
SF 5046 -1842 -1440 1634 -283 -806 -4970 17544 100%
UF 916 -4156 -2785 -832 -1786 -1764 -31341 17544 100%
SK > HU
CEPS > 50HzT
CEPS > TTG
DE+APG > CZ
CH > DE+APG
DE+ > APG
APG > CZ
APG > HU
PL > CZ
PL > SK
CZ > SK
IT > APG
IT > SHB
BE > NL
DE > NL
DE > PL
DE > CZ
CH > FR
CH > IT
APG > SHB
FR > BE
FR > DE
FR > IT
All
CH > APG
CH > DE+

Technical Report
ENTSO-E AISBL • Avenue de Cortenbergh 100 • 1000 Brussels • Belgium • Tel + 32 2 741 09 50 • Fax + 32 2 741 09 51 • [email protected] • www. entsoe.eu
101
Table 9: Statistical data related to the RTUF indicator for a positive flow direction
max min10%
percentile
90%
percentileaverage median sum time time
[MW] [MW] [MW] [MW] [MW] [MW] [GWh] [h] [%]
PF 617 1 20 339 151 116 80 531 3%
SF 1086 1 26 484 215 163 644 2991 17%
UF 641 1 19 382 157 113 106 673 4%
PF 2161 1 83 1105 535 456 1591 2977 17%
SF 4000 1 173 2158 1085 961 7241 6673 38%
UF 1008 1 54 605 290 253 170 587 3%
PF 1901 1 50 936 405 300 738 1824 10%
SF 1100 1 68 1100 513 456 315 614 3%
UF 3252 1 815 2225 1545 1578 26396 17082 97%
PF 5143 5 1483 4093 2849 2938 49871 17504 100%
SF 4240 3 1370 3710 2555 2550 44741 17512 100%
UF 1855 1 96 971 492 441 6352 12914 74%
PF 1245 1 121 786 450 443 6911 15346 87%
SF 952 1 261 950 668 721 10718 16049 91%
UF 956 1 18 317 142 105 420 2966 17%
PF 3169 1 218 1843 997 936 13006 13041 74%
SF 3601 1 322 2495 1355 1302 19714 14544 83%
UF 1240 1 43 602 291 247 1322 4540 26%
PF 4809 1 564 3362 1954 1931 32887 16833 96%
SF 2819 1 262 2000 1258 1320 9718 7727 44%
UF 4562 49 1217 3314 2223 2182 38978 17535 100%
PF 3235 1 681 2303 1511 1518 26196 17338 99%
SF 2956 1 1028 2650 1792 2034 31235 17431 99%
UF 1287 1 35 501 238 194 1098 4615 26%
PF 211 1 7 85 48 42 33 698 4%
SF 99 4 11 99 53 54 1 11 0%
UF 333 1 15 176 81 67 1014 12583 72%
PF 442 1 14 214 99 75 52 531 3%
SF 229 1 17 176 87 67 14 157 1%
UF 796 1 18 302 136 102 960 7061 40%
PF 2478 1 153 1664 875 837 7162 8184 47%
SF 1455 1 221 1401 930 1074 10511 11300 64%
UF 1313 1 47 591 288 246 1305 4523 26%
PF 4898 1 567 3497 2118 2173 30789 14535 83%
SF 2510 1 513 2449 1651 1809 23733 14376 82%
UF 2447 1 120 1383 683 597 8836 12944 74%
PF 2030 1 177 1275 706 679 11025 15624 89%
SF 805 1 5 276 112 77 118 1046 6%
UF 2690 2 340 1505 920 906 15821 17190 98%
PF 1512 1 43 666 315 260 681 2158 12%
SF 1067 1 29 511 234 183 215 920 5%
UF 1815 1 89 889 452 402 5853 12944 74%
PF 3700 1 265 2132 1161 1098 17291 14894 85%
SF 6209 1 531 3574 1993 1897 30982 15543 89%
UF 2291 1 70 1102 498 390 1674 3361 19%
PF 196 12 16 193 96 99 1 15 0%
SF 712 1 19 294 134 102 176 1315 7%
UF 572 1 27 392 177 139 124 697 4%
PF 959 1 54 506 269 250 3589 13333 76%
SF 810 1 126 800 499 540 6581 13183 75%
UF 720 1 31 424 198 167 1081 5454 31%
PF 2424 2 351 1390 875 869 15259 17434 99%
SF 770 1 38 565 276 247 3657 13227 75%
UF 2474 1 242 1150 676 639 11712 17322 99%
PF 1184 1 151 697 419 412 6549 15622 89%
SF 600 1 25 406 198 175 2470 12451 71%
UF 910 1 78 528 297 285 4257 14332 82%
PF 2510 1 355 1621 1024 1049 17409 17009 97%
SF 1896 1 341 1395 874 882 14700 16820 96%
UF 1317 1 55 538 278 252 3532 12704 72%
PF 2041 2 541 1507 1047 1074 18344 17523 100%
SF 1300 1 500 1200 931 996 16231 17432 99%
UF 1115 1 53 518 265 236 3149 11879 68%
PF 1604 0 55 657 329 287 2514 7642 44%
SF 1353 1 166 770 479 480 7691 16062 92%
UF 734 0 18 312 137 105 194 1415 8%
PF 2038 0 365 1350 880 903 15225 17302 99%
SF 1609 1 191 1097 647 646 10648 16455 94%
UF 1647 0 87 772 403 369 5493 13647 78%
PF 2886 1 80 1234 576 458 3239 5621 32%
SF 1779 1 44 724 321 237 283 881 5%
UF 5830 1 344 3077 1647 1543 21688 13166 75%
PF 2684 1 73 1226 572 465 1056 1845 11%
SF 5046 1 209 2428 1226 1075 7391 6029 34%
UF 916 4 48 456 230 195 36 157 1%
CH > DE+APG
PL > SK
CZ > SK
SK > HU
CEPS > 50HzT
CEPS > TTG
DE+APG > CZ
DE > PL
DE > CZ
DE+ > APG
APG > CZ
APG > HU
PL > CZ
FR > DE
FR > IT
IT > APG
IT > SHB
BE > NL
DE > NL
CH > APG
CH > DE+
CH > FR
CH > IT
APG > SHB
FR > BE
+

Technical Report
ENTSO-E AISBL • Avenue de Cortenbergh 100 • 1000 Brussels • Belgium • Tel + 32 2 741 09 50 • Fax + 32 2 741 09 51 • [email protected] • www. entsoe.eu
102
Table 10: Statistical data related to the RTUF indicator for a negative flow direction
max min10%
percentile
90%
percentileaverage median sum time time
[MW] [MW] [MW] [MW] [MW] [MW] [GWh] [h] [%]
PF -1 -2067 -1354 -277 -776 -737 -13190 17007 97%
SF -1 -900 -483 -92 -302 -296 -4390 14527 83%
UF -1 -1709 -965 -201 -562 -533 -9470 16863 96%
PF -1 -4357 -2904 -377 -1702 -1749 -24792 14564 83%
SF -1 -1508 -1110 -279 -779 -842 -8465 10868 62%
UF -2 -3448 -2069 -562 -1306 -1280 -22147 16956 97%
PF -1 -2751 -1821 -352 -1110 -1121 -17454 15719 90%
SF -2 -3600 -3200 -1270 -2556 -2916 -43269 16929 96%
UF -3 -1284 -793 -45 -343 -252 -158 462 3%
PF -2 -1176 -877 -41 -347 -243 -14 40 0%
SF -3 -482 -411 -59 -222 -202 -7 32 0%
UF -1 -1721 -559 -37 -266 -209 -1228 4615 26%
PF -1 -806 -436 -23 -195 -151 -426 2187 12%
SF -1 -890 -582 -38 -275 -231 -410 1491 8%
UF -1 -941 -536 -67 -291 -276 -4244 14565 83%
PF -1 -2592 -1417 -91 -655 -541 -2946 4496 26%
SF -1 -1985 -1579 -84 -656 -481 -1966 2998 17%
UF -1 -2492 -1413 -123 -694 -605 -9010 12986 74%
PF -1 -1318 -804 -53 -364 -295 -257 707 4%
SF -1 -3651 -2923 -335 -1637 -1635 -16062 9810 56%
UF -38 -934 -839 -126 -400 -266 -4 9 0%
PF -5 -1273 -686 -39 -317 -256 -65 206 1%
SF -2 -969 -857 -75 -374 -306 -42 112 1%
UF -1 -1727 -940 -89 -477 -429 -6161 12913 74%
PF -1 -285 -216 -63 -146 -152 -2219 15157 86%
SF -1 -221 -221 -89 -183 -201 -3024 16565 94%
UF -1 -234 -105 -6 -45 -33 -176 3943 22%
PF -1 -1430 -754 -223 -500 -507 -8499 17003 97%
SF -2 -775 -600 -231 -443 -460 -7701 17387 99%
UF -1 -1198 -348 -25 -164 -133 -1719 10450 60%
PF -1 -2838 -1795 -196 -961 -915 -8991 9358 53%
SF -1 -1459 -1401 -130 -755 -742 -4712 6239 36%
UF -1 -2388 -1396 -119 -687 -598 -8932 13011 74%
PF -1 -2897 -1819 -143 -871 -739 -2618 3007 17%
SF -1 -2459 -2050 -149 -968 -844 -3065 3167 18%
UF -1 -1305 -598 -44 -290 -251 -1331 4591 26%
PF -1 -1354 -497 -31 -232 -185 -443 1913 11%
SF -1 -1240 -680 -80 -374 -361 -5315 14229 81%
UF -1 -681 -252 -19 -121 -94 -42 351 2%
PF -1 -2971 -1635 -232 -907 -861 -13946 15383 88%
SF -1 -2700 -1788 -350 -1095 -1114 -18194 16620 95%
UF -1 -1071 -545 -33 -249 -198 -1139 4583 26%
PF -1 -1546 -867 -49 -394 -321 -1044 2649 15%
SF -1 -2916 -1476 -89 -668 -540 -1336 2000 11%
UF -1 -4182 -2013 -223 -1063 -977 -15073 14174 81%
PF -9 -2435 -1660 -666 -1154 -1144 -20229 17529 100%
SF -1 -800 -700 -141 -419 -420 -6803 16219 92%
UF -1 -2546 -1351 -299 -815 -794 -13725 16844 96%
PF -1 -634 -290 -17 -134 -108 -562 4194 24%
SF -1 -800 -597 -44 -294 -260 -1278 4352 25%
UF -1 -922 -512 -62 -278 -263 -3357 12067 69%
PF -1 -266 -217 -16 -84 -61 -9 106 1%
SF -1 -405 -178 -7 -68 -45 -103 1506 9%
UF -1 -353 -172 -8 -75 -50 -16 219 1%
PF -1 -335 -116 -10 -56 -45 -26 461 3%
SF -1 -200 -80 -10 -41 -34 -28 681 4%
UF -1 -459 -232 -15 -102 -75 -178 1742 10%
PF -1 -552 -330 -18 -156 -133 -83 532 3%
SF -1 -870 -475 -31 -216 -179 -156 722 4%
UF -1 -659 -325 -23 -156 -131 -750 4812 27%
PF -2 -191 -117 -8 -55 -26 -1 21 0%
SF -2 -526 -280 -28 -133 -102 -15 110 1%
UF -1 -701 -379 -26 -181 -155 -1023 5648 32%
PF 0 -1938 -967 -70 -449 -362 -4442 9900 56%
SF -1 -695 -293 -20 -141 -116 -207 1473 8%
UF 0 -2393 -1119 -142 -596 -545 -9606 16128 92%
PF -1 -456 -294 -19 -136 -104 -33 242 1%
SF -1 -951 -295 -18 -140 -111 -152 1084 6%
UF 0 -1115 -442 -28 -204 -166 -796 3897 22%
PF -1 -3372 -1694 -158 -856 -759 -10201 11916 68%
SF -1 -3406 -2420 -486 -1494 -1518 -24889 16663 95%
UF -1 -4438 -2004 -129 -926 -734 -4045 4370 25%
PF -1 -5543 -4060 -569 -2380 -2461 -37367 15697 89%
SF -1 -1842 -1530 -368 -1074 -1226 -12361 11512 66%
UF -1 -4156 -2790 -871 -1805 -1772 -31377 17385 99%
DE+APG > CZ
CH > DE+APG
PL > CZ
PL > SK
CZ > SK
SK > HU
CEPS > 50HzT
CEPS > TTG
DE > NL
DE > PL
DE > CZ
DE+ > APG
APG > CZ
APG > HU
FR > BE
FR > DE
FR > IT
IT > APG
IT > SHB
BE > NL
-
CH > APG
CH > DE+
CH > FR
CH > IT
APG > SHB

Technical Report
ENTSO-E AISBL • Avenue de Cortenbergh 100 • 1000 Brussels • Belgium • Tel + 32 2 741 09 50 • Fax + 32 2 741 09 51 • [email protected] • www. entsoe.eu
103
Annex 5.2.: Statistical data related to the PTDF indicator Table 11: Statistical data related to the PTDF indicator
max min10%
percentile
90%
percentileaverage median sum time time
[MW] [MW] [MW] [MW] [MW] [MW] [GWh] [h] [%]
PF 1901 -2751 -1790 15 -953 -1039 -16716 17544 100.00%
CF 1192 -2931 -1950 -164 -1112 -1180 -19513 17544 100.00%
PTDF F 1185 -839 -203 565 159 140 2797 17544 100.00%
PF 5143 -1176 1474 4093 2842 2935 49857 17544 100.00%
CF 4718 -913 1245 3785 2532 2545 44427 17544 100.00%
PTDF F 1889 -1009 -178 754 310 334 5430 17544 100.00%
PF 617 -3031 -1344 -226 -747 -719 -13110 17544 100.00%
CF 724 -1944 -1023 -37 -572 -620 -10035 17544 100.00%
PTDF F 733 -1111 -493 108 -175 -155 -3075 17544 100.00%
PF 1245 -1105 -45 766 370 392 6485 17544 100.00%
CF 1204 -168 361 922 643 654 11287 17544 100.00%
PTDF F 623 -1736 -586 39 -274 -275 -4803 17544 100.00%
PF 3442 -2592 -704 1715 573 659 10060 17544 100.00%
CF 4569 -2700 40 2292 1192 1261 20908 17544 100.00%
PTDF F 752 -1923 -1024 -199 -618 -627 -10848 17544 100.00%
PF 4809 -1318 403 3342 1860 1860 32630 17544 100.00%
CF 3008 -2389 -559 2152 770 745 13507 17544 100.00%
PTDF F 2261 -111 660 1508 1090 1091 19123 17544 100.00%
PF 3235 -1273 643 2301 1489 1508 26131 17544 100.00%
CF 3255 -716 964 2558 1802 1858 31607 17544 100.00%
PTDF F 733 -1855 -718 75 -312 -303 -5476 17544 100.00%
PF 211 -320 -212 0 -125 -141 -2185 17544 100.00%
CF 70 -461 -250 -1 -106 -100 -1859 17544 100.00%
PTDF F 331 -279 -175 131 -19 -12 -326 17544 100.00%
PF 442 -1803 -751 -184 -481 -499 -8446 17544 100.00%
CF 686 -2071 -1012 -8 -506 -507 -8881 17544 100.00%
PTDF F 1329 -749 -356 392 25 27 435 17544 100.00%
PF 2478 -2838 -1544 1372 -104 -124 -1829 17544 100.00%
CF 2907 -2417 -811 1805 506 505 8874 17544 100.00%
PTDF F 655 -2403 -1008 -201 -610 -614 -10703 17544 100.00%
PF 6311 -2897 -606 3402 1606 1838 28172 17544 100.00%
CF 5528 -3232 -1104 2719 1001 1210 17563 17544 100.00%
PTDF F 2300 -734 189 1014 605 603 10609 17544 100.00%
PF 2030 -1354 -26 1245 603 603 10581 17544 100.00%
CF 719 -1346 -660 217 -204 -186 -3575 17544 100.00%
PTDF F 1824 -160 455 1168 807 803 14156 17544 100.00%
PF 1512 -2971 -1586 75 -756 -760 -13265 17544 100.00%
CF 1020 -2738 -1316 16 -663 -672 -11629 17544 100.00%
PTDF F 1060 -1253 -494 327 -93 -105 -1637 17544 100.00%
PF 959 -634 -131 478 173 174 3027 17544 100.00%
CF 747 -480 -36 510 263 292 4613 17544 100.00%
PTDF F 642 -558 -271 100 -90 -101 -1586 17544 100.00%
PF 2424 -266 339 1389 869 865 15250 17544 100.00%
CF 1027 -636 -178 527 166 164 2921 17544 100.00%
PTDF F 2203 -108 396 1033 703 684 12329 17544 100.00%
PF 1184 -335 0 680 372 380 6523 17544 100.00%
CF 725 -299 41 490 269 275 4726 17544 100.00%
PTDF F 738 -498 -109 302 102 117 1797 17544 100.00%
PF 2510 -552 278 1616 988 1027 17326 17544 100.00%
CF 1669 -499 202 1227 754 796 13228 17544 100.00%
PTDF F 1384 -585 -28 538 234 204 4097 17544 100.00%
PF 2041 -191 539 1507 1046 1073 18343 17544 100.00%
CF 1443 -266 390 1089 759 790 13322 17544 100.00%
PTDF F 976 -461 57 526 286 281 5021 17544 100.00%
SK > HU
AT/DE/LU > PL
AT/DE/LU > CZ
AT/DE/LU > HU
PL > CZ
PL > SK
CZ > SK
FR > AT/DE/LU
FR > IT
IT > AT/DE/LU
IT > SL
BE > NL
AT/DE/LU > NL
All
CH > FR
CH > IT
CH > AT/DE/LU
AT/DE/LU > SL
FR > BE
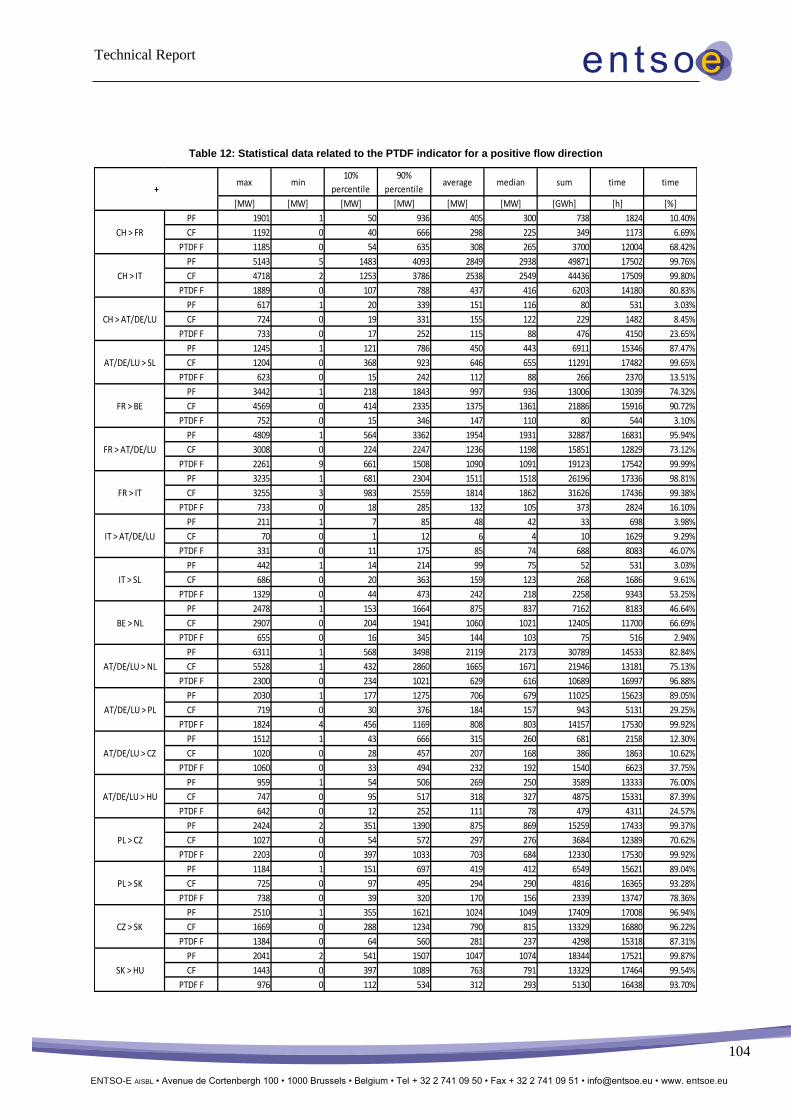
Technical Report
ENTSO-E AISBL • Avenue de Cortenbergh 100 • 1000 Brussels • Belgium • Tel + 32 2 741 09 50 • Fax + 32 2 741 09 51 • [email protected] • www. entsoe.eu
104
Table 12: Statistical data related to the PTDF indicator for a positive flow direction
max min10%
percentile
90%
percentileaverage median sum time time
[MW] [MW] [MW] [MW] [MW] [MW] [GWh] [h] [%]
PF 1901 1 50 936 405 300 738 1824 10.40%
CF 1192 0 40 666 298 225 349 1173 6.69%
PTDF F 1185 0 54 635 308 265 3700 12004 68.42%
PF 5143 5 1483 4093 2849 2938 49871 17502 99.76%
CF 4718 2 1253 3786 2538 2549 44436 17509 99.80%
PTDF F 1889 0 107 788 437 416 6203 14180 80.83%
PF 617 1 20 339 151 116 80 531 3.03%
CF 724 0 19 331 155 122 229 1482 8.45%
PTDF F 733 0 17 252 115 88 476 4150 23.65%
PF 1245 1 121 786 450 443 6911 15346 87.47%
CF 1204 0 368 923 646 655 11291 17482 99.65%
PTDF F 623 0 15 242 112 88 266 2370 13.51%
PF 3442 1 218 1843 997 936 13006 13039 74.32%
CF 4569 0 414 2335 1375 1361 21886 15916 90.72%
PTDF F 752 0 15 346 147 110 80 544 3.10%
PF 4809 1 564 3362 1954 1931 32887 16831 95.94%
CF 3008 0 224 2247 1236 1198 15851 12829 73.12%
PTDF F 2261 9 661 1508 1090 1091 19123 17542 99.99%
PF 3235 1 681 2304 1511 1518 26196 17336 98.81%
CF 3255 3 983 2559 1814 1862 31626 17436 99.38%
PTDF F 733 0 18 285 132 105 373 2824 16.10%
PF 211 1 7 85 48 42 33 698 3.98%
CF 70 0 1 12 6 4 10 1629 9.29%
PTDF F 331 0 11 175 85 74 688 8083 46.07%
PF 442 1 14 214 99 75 52 531 3.03%
CF 686 0 20 363 159 123 268 1686 9.61%
PTDF F 1329 0 44 473 242 218 2258 9343 53.25%
PF 2478 1 153 1664 875 837 7162 8183 46.64%
CF 2907 0 204 1941 1060 1021 12405 11700 66.69%
PTDF F 655 0 16 345 144 103 75 516 2.94%
PF 6311 1 568 3498 2119 2173 30789 14533 82.84%
CF 5528 1 432 2860 1665 1671 21946 13181 75.13%
PTDF F 2300 0 234 1021 629 616 10689 16997 96.88%
PF 2030 1 177 1275 706 679 11025 15623 89.05%
CF 719 0 30 376 184 157 943 5131 29.25%
PTDF F 1824 4 456 1169 808 803 14157 17530 99.92%
PF 1512 1 43 666 315 260 681 2158 12.30%
CF 1020 0 28 457 207 168 386 1863 10.62%
PTDF F 1060 0 33 494 232 192 1540 6623 37.75%
PF 959 1 54 506 269 250 3589 13333 76.00%
CF 747 0 95 517 318 327 4875 15331 87.39%
PTDF F 642 0 12 252 111 78 479 4311 24.57%
PF 2424 2 351 1390 875 869 15259 17433 99.37%
CF 1027 0 54 572 297 276 3684 12389 70.62%
PTDF F 2203 0 397 1033 703 684 12330 17530 99.92%
PF 1184 1 151 697 419 412 6549 15621 89.04%
CF 725 0 97 495 294 290 4816 16365 93.28%
PTDF F 738 0 39 320 170 156 2339 13747 78.36%
PF 2510 1 355 1621 1024 1049 17409 17008 96.94%
CF 1669 0 288 1234 790 815 13329 16880 96.22%
PTDF F 1384 0 64 560 281 237 4298 15318 87.31%
PF 2041 2 541 1507 1047 1074 18344 17521 99.87%
CF 1443 0 397 1089 763 791 13329 17464 99.54%
PTDF F 976 0 112 534 312 293 5130 16438 93.70%
CZ > SK
SK > HU
AT/DE/LU > NL
AT/DE/LU > PL
AT/DE/LU > CZ
AT/DE/LU > HU
PL > CZ
PL > SK
FR > BE
FR > AT/DE/LU
FR > IT
IT > AT/DE/LU
IT > SL
BE > NL
+
CH > FR
CH > IT
CH > AT/DE/LU
AT/DE/LU > SL

Technical Report
105
ENTSO-E AISBL • Avenue de Cortenbergh 100 • 1000 Brussels • Belgium • Tel + 32 2 741 09 50 • Fax + 32 2 741 09 51 • [email protected] • www. entsoe.eu
Table 13: Statistical data related to the PTDF indicator for a negative flow direction
max min10%
percentile
90%
percentileaverage median sum time time
[MW] [MW] [MW] [MW] [MW] [MW] [GWh] [h] [%]
PF -1 -2751 -1821 -352 -1111 -1122 -17454 15717 89.59%
CF 0 -2931 -1976 -398 -1213 -1228 -19862 16370 93.31%
PTDF F 0 -839 -329 -25 -163 -137 -903 5539 31.57%
PF -2 -1176 -877 -41 -347 -243 -14 40 0.23%
CF -15 -913 -584 -37 -269 -201 -9 34 0.19%
PTDF F 0 -1009 -495 -31 -230 -189 -773 3363 19.17%
PF -1 -3031 -1354 -276 -776 -737 -13190 17005 96.93%
CF 0 -1944 -1033 -176 -639 -669 -10264 16061 91.55%
PTDF F 0 -1111 -537 -47 -265 -229 -3551 13393 76.34%
PF -1 -1105 -437 -23 -195 -151 -426 2185 12.45%
CF -4 -168 -111 -8 -53 -34 -3 61 0.35%
PTDF F 0 -1736 -600 -80 -334 -322 -5068 15173 86.49%
PF -1 -2592 -1417 -91 -655 -541 -2946 4496 25.63%
CF -1 -2700 -1407 -69 -601 -420 -977 1627 9.27%
PTDF F 0 -1923 -1029 -247 -643 -640 -10928 16999 96.89%
PF -1 -1318 -804 -53 -364 -295 -257 707 4.03%
CF 0 -2389 -1000 -86 -497 -429 -2344 4714 26.87%
PTDF F -111 -111 -111 -111 -111 -111 0 1 0.01%
PF -5 -1273 -686 -39 -317 -256 -65 206 1.17%
CF -1 -716 -402 -13 -174 -139 -19 107 0.61%
PTDF F 0 -1855 -751 -87 -397 -369 -5850 14719 83.90%
PF -1 -320 -216 -63 -146 -152 -2219 15155 86.38%
CF 0 -461 -256 -6 -117 -116 -1869 15914 90.71%
PTDF F 0 -279 -206 -16 -107 -108 -1014 9460 53.92%
PF -1 -1803 -754 -223 -500 -507 -8499 17001 96.90%
CF 0 -2071 -1031 -129 -577 -560 -9149 15857 90.38%
PTDF F 0 -749 -448 -36 -222 -197 -1823 8200 46.74%
PF -1 -2838 -1795 -196 -961 -915 -8991 9357 53.33%
CF -1 -2417 -1190 -109 -604 -540 -3531 5843 33.30%
PTDF F -1 -2403 -1013 -242 -633 -626 -10777 17027 97.05%
PF -1 -2897 -1819 -143 -871 -739 -2618 3007 17.14%
CF 0 -3232 -2046 -151 -1005 -896 -4383 4362 24.86%
PTDF F 0 -734 -335 -23 -146 -99 -80 546 3.11%
PF -1 -1354 -497 -31 -232 -186 -443 1912 10.90%
CF 0 -1346 -737 -68 -364 -315 -4518 12412 70.75%
PTDF F -2 -160 -147 -6 -83 -92 -1 13 0.07%
PF -1 -2971 -1636 -232 -907 -861 -13946 15381 87.67%
CF 0 -2738 -1344 -201 -766 -747 -12015 15680 89.38%
PTDF F 0 -1253 -572 -54 -291 -253 -3176 10920 62.24%
PF -1 -634 -290 -17 -134 -108 -562 4192 23.89%
CF 0 -480 -251 -17 -118 -100 -262 2212 12.61%
PTDF F 0 -558 -293 -35 -156 -144 -2064 13232 75.42%
PF -1 -266 -218 -16 -85 -59 -9 105 0.60%
CF 0 -636 -304 -23 -148 -125 -763 5154 29.38%
PTDF F -1 -108 -99 -13 -44 -41 -1 13 0.07%
PF -1 -335 -116 -10 -56 -46 -26 460 2.62%
CF 0 -299 -157 -11 -76 -61 -90 1178 6.71%
PTDF F 0 -498 -355 -13 -143 -92 -542 3796 21.64%
PF -1 -552 -330 -19 -156 -133 -83 531 3.03%
CF -1 -499 -329 -18 -152 -134 -101 663 3.78%
PTDF F 0 -585 -189 -12 -90 -74 -201 2225 12.68%
PF -2 -191 -117 -8 -55 -26 -1 21 0.12%
CF -2 -266 -204 -9 -86 -64 -7 79 0.45%
PTDF F 0 -461 -204 -13 -99 -80 -110 1105 6.30%
PL > SK
CZ > SK
SK > HU
BE > NL
AT/DE/LU > NL
AT/DE/LU > PL
AT/DE/LU > CZ
AT/DE/LU > HU
PL > CZ
AT/DE/LU > SL
FR > BE
FR > AT/DE/LU
FR > IT
IT > AT/DE/LU
IT > SL
-
CH > FR
CH > IT
CH > AT/DE/LU

Technical Report
ENTSO-E AISBL • Avenue de Cortenbergh 100 • 1000 Brussels • Belgium • Tel + 32 2 741 09 50 • Fax + 32 2 741 09 51 • [email protected] • www. entsoe.eu
106
Annex 5.3.: Statistical data related to the DAUF indicator Table 14: Statistical data related to the DAUF indicator
max min10%
percentile
90%
percentileaverage median sum time time
[MW] [MW] [MW] [MW] [MW] [MW] [GW] [h] [%]
DACF 1 212 -3 252 -2 056 -182 -1 130 -1 135 -1 246 1 103 100,00%
DASF -144 -3 200 -3 123 -1 188 -2 233 -2 337 -2 463 1 103 100,00%
DAUF 2 771 -1 015 500 1 737 1 103 1 096 1 217 1 103 100,00%
DACF 4 833 -230 1 238 3 899 2 692 2 763 2 970 1 103 100,00%
DASF 4 240 241 1 220 3 859 2 463 2 470 2 717 1 103 100,00%
DAUF 1 392 -945 -256 682 229 238 253 1 103 100,00%
DACF 2 320 -4 025 -3 019 355 -1 449 -1 620 -1 598 1 103 100,00%
DASF 4 471 -1 625 -1 424 1 972 -103 -575 -113 1 103 100,00%
DAUF 887 -3 708 -2 149 -556 -1 346 -1 338 -1 484 1 103 100,00%
DACF 1 120 -326 186 733 466 468 514 1 103 100,00%
DASF 952 -583 391 951 722 795 797 1 103 100,00%
DAUF 790 -844 -578 110 -256 -281 -282 1 103 100,00%
DACF 3 082 -1 905 -274 2 021 845 840 932 1 103 100,00%
DASF 3 199 -792 577 2 601 1 693 1 803 1 867 1 103 100,00%
DAUF 532 -2 369 -1 533 -238 -848 -823 -935 1 103 100,00%
DACF 4 212 -500 452 2 614 1 480 1 417 1 632 1 103 100,00%
DASF 1 800 -3 001 -2 622 1 541 -720 -850 -794 1 103 100,00%
DAUF 4 266 129 1 053 3 279 2 200 2 231 2 427 1 103 100,00%
DACF 2 913 -288 516 2 201 1 298 1 231 1 431 1 103 100,00%
DASF 2 658 -617 863 2 652 1 513 1 104 1 669 1 103 100,00%
DAUF 863 -1 561 -759 311 -215 -208 -238 1 103 100,00%
DACF 102 -568 -366 -79 -228 -239 -251 1 103 100,00%
DASF 0 -221 -221 -72 -180 -196 -198 1 103 100,00%
DAUF 308 -347 -159 62 -48 -52 -53 1 103 100,00%
DACF 944 -1 652 -1 071 296 -382 -404 -421 1 103 100,00%
DASF 23 -630 -630 -203 -446 -455 -492 1 103 100,00%
DAUF 1 232 -1 022 -485 612 64 63 71 1 103 100,00%
DACF 1 644 -3 278 -1 931 735 -504 -346 -556 1 103 100,00%
DASF 1 451 -1 451 -927 1 401 357 469 394 1 103 100,00%
DAUF 516 -2 374 -1 539 -257 -861 -841 -949 1 103 100,00%
DACF 4 491 -1 205 1 488 3 684 2 659 2 786 2 933 1 103 100,00%
DASF 2 485 -2 453 744 2 459 1 799 1 978 1 984 1 103 100,00%
DAUF 2 360 -521 253 1 536 860 842 948 1 103 100,00%
DACF 2 285 -334 285 1 318 803 798 886 1 103 100,00%
DASF 25 -967 -630 0 -245 -195 -270 1 103 100,00%
DAUF 2 285 59 631 1 492 1 048 1 033 1 156 1 103 100,00%
DACF -148 -3 281 -2 213 -931 -1 553 -1 522 -1 713 1 103 100,00%
DASF 923 -3 017 -1 893 -64 -996 -988 -1 098 1 103 100,00%
DAUF 309 -1 437 -976 -133 -557 -541 -614 1 103 100,00%
DACF 811 -461 -21 446 211 219 233 1 103 100,00%
DASF 800 -602 48 800 480 560 530 1 103 100,00%
DAUF 530 -846 -558 33 -269 -277 -297 1 103 100,00%
DACF 1 976 45 459 1 367 917 907 1 011 1 103 100,00%
DASF 700 -55 0 419 148 75 163 1 103 100,00%
DAUF 1 838 7 408 1 143 768 744 848 1 103 100,00%
DACF 986 -48 0 637 391 411 431 1 103 100,00%
DASF 550 -20 0 285 100 50 110 1 103 100,00%
DAUF 761 -106 0 516 291 297 321 1 103 100,00%
DACF 1 882 -363 649 1 567 1 111 1 137 1 225 1 103 100,00%
DASF 1 732 -596 360 1 397 898 933 991 1 103 100,00%
DAUF 1 079 -517 -62 467 212 216 234 1 103 100,00%
DACF 1 950 145 799 1 567 1 217 1 249 1 343 1 103 100,00%
DASF 1 300 -118 444 1 200 905 1 000 998 1 103 100,00%
DAUF 1 021 -268 49 596 312 304 344 1 103 100,00%
DACF 738 -1 767 -1 282 -165 -755 -787 -833 1 103 100,00%
DASF 1 035 -547 -515 223 -211 -314 -232 1 103 100,00%
DAUF 502 -1 412 -960 -137 -545 -549 -601 1 103 100,00%
DACF 1 617 -2 458 -1 802 667 -693 -857 -765 1 103 100,00%
DASF 3 495 -1 078 -936 1 755 108 -311 119 1 103 100,00%
DAUF 393 -2 823 -1 441 -176 -801 -773 -884 1 103 100,00%
DACF 2 966 -819 107 2 025 1 055 1 036 1 164 1 103 100,00%
DASF 5 368 -1 380 491 3 343 1 900 1 889 2 096 1 103 100,00%
DAUF 1 650 -2 850 -1 880 195 -845 -873 -932 1 103 100,00%
DACF -137 -2 110 -1 575 -736 -1 142 -1 134 -1 259 1 103 100,00%
DASF 424 -800 -492 45 -235 -249 -260 1 103 100,00%
DAUF 119 -1 928 -1 344 -485 -906 -915 -1 000 1 103 100,00%
DACF 1 118 -1 935 -957 102 -411 -393 -453 1 103 100,00%
DASF 847 -2 252 -1 450 -50 -760 -771 -839 1 103 100,00%
DAUF 1 496 -859 -106 824 349 330 385 1 103 100,00%
DACF 407 -1 634 -1 237 -262 -791 -853 -872 1 103 100,00%
DASF 372 -1 300 -891 -17 -452 -457 -498 1 103 100,00%
DAUF 981 -1 383 -799 143 -339 -352 -374 1 103 100,00%
DACF 1 900 -635 -144 929 380 359 419 1 103 100,00%
DASF 414 -1 108 -623 31 -309 -303 -341 1 103 100,00%
DAUF 1 979 -556 95 1 258 689 692 759 1 103 100,00%
DE/LU North >
CZ (TTG > CEPS)
DE/LU South >
CZ (50Hertz >
CEPS)
SK > HU
CH > AT
CH > DE/LU
DE/LU > AT
AT > CZ
DE/LU > CZ
AT/DE/LU > PL
AT/DE/LU > CZ
AT/DE/LU > HU
PL > CZ
PL > SK
CZ > SK
FR > AT/DE/LU
FR > IT
IT > AT/DE/LU
IT > SI
BE > NL
AT/DE/LU > NL
All
CH > FR
CH > IT
CH > AT/DE/LU
AT/DE/LU > SI
FR > BE
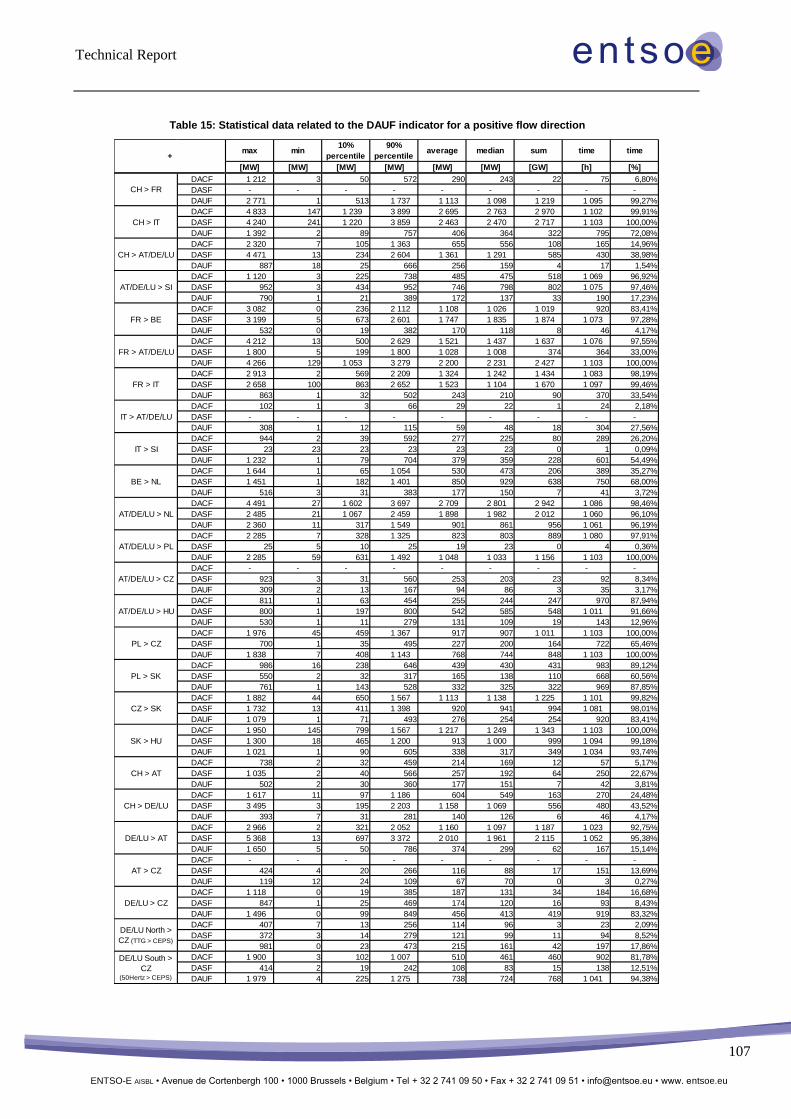
Technical Report
107
ENTSO-E AISBL • Avenue de Cortenbergh 100 • 1000 Brussels • Belgium • Tel + 32 2 741 09 50 • Fax + 32 2 741 09 51 • [email protected] • www. entsoe.eu
Table 15: Statistical data related to the DAUF indicator for a positive flow direction
max min10%
percentile
90%
percentileaverage median sum time time
[MW] [MW] [MW] [MW] [MW] [MW] [GW] [h] [%]
DACF 1 212 3 50 572 290 243 22 75 6,80%
DASF - - - - - - - - -
DAUF 2 771 1 513 1 737 1 113 1 098 1 219 1 095 99,27%
DACF 4 833 147 1 239 3 899 2 695 2 763 2 970 1 102 99,91%
DASF 4 240 241 1 220 3 859 2 463 2 470 2 717 1 103 100,00%
DAUF 1 392 2 89 757 406 364 322 795 72,08%
DACF 2 320 7 105 1 363 655 556 108 165 14,96%
DASF 4 471 13 234 2 604 1 361 1 291 585 430 38,98%
DAUF 887 18 25 666 256 159 4 17 1,54%
DACF 1 120 3 225 738 485 475 518 1 069 96,92%
DASF 952 3 434 952 746 798 802 1 075 97,46%
DAUF 790 1 21 389 172 137 33 190 17,23%
DACF 3 082 0 236 2 112 1 108 1 026 1 019 920 83,41%
DASF 3 199 5 673 2 601 1 747 1 835 1 874 1 073 97,28%
DAUF 532 0 19 382 170 118 8 46 4,17%
DACF 4 212 13 500 2 629 1 521 1 437 1 637 1 076 97,55%
DASF 1 800 5 199 1 800 1 028 1 008 374 364 33,00%
DAUF 4 266 129 1 053 3 279 2 200 2 231 2 427 1 103 100,00%
DACF 2 913 2 569 2 209 1 324 1 242 1 434 1 083 98,19%
DASF 2 658 100 863 2 652 1 523 1 104 1 670 1 097 99,46%
DAUF 863 1 32 502 243 210 90 370 33,54%
DACF 102 1 3 66 29 22 1 24 2,18%
DASF - - - - - - - - -
DAUF 308 1 12 115 59 48 18 304 27,56%
DACF 944 2 39 592 277 225 80 289 26,20%
DASF 23 23 23 23 23 23 0 1 0,09%
DAUF 1 232 1 79 704 379 359 228 601 54,49%
DACF 1 644 1 65 1 054 530 473 206 389 35,27%
DASF 1 451 1 182 1 401 850 929 638 750 68,00%
DAUF 516 3 31 383 177 150 7 41 3,72%
DACF 4 491 27 1 602 3 697 2 709 2 801 2 942 1 086 98,46%
DASF 2 485 21 1 067 2 459 1 898 1 982 2 012 1 060 96,10%
DAUF 2 360 11 317 1 549 901 861 956 1 061 96,19%
DACF 2 285 7 328 1 325 823 803 889 1 080 97,91%
DASF 25 5 10 25 19 23 0 4 0,36%
DAUF 2 285 59 631 1 492 1 048 1 033 1 156 1 103 100,00%
DACF - - - - - - - - -
DASF 923 3 31 560 253 203 23 92 8,34%
DAUF 309 2 13 167 94 86 3 35 3,17%
DACF 811 1 63 454 255 244 247 970 87,94%
DASF 800 1 197 800 542 585 548 1 011 91,66%
DAUF 530 1 11 279 131 109 19 143 12,96%
DACF 1 976 45 459 1 367 917 907 1 011 1 103 100,00%
DASF 700 1 35 495 227 200 164 722 65,46%
DAUF 1 838 7 408 1 143 768 744 848 1 103 100,00%
DACF 986 16 238 646 439 430 431 983 89,12%
DASF 550 2 32 317 165 138 110 668 60,56%
DAUF 761 1 143 528 332 325 322 969 87,85%
DACF 1 882 44 650 1 567 1 113 1 138 1 225 1 101 99,82%
DASF 1 732 13 411 1 398 920 941 994 1 081 98,01%
DAUF 1 079 1 71 493 276 254 254 920 83,41%
DACF 1 950 145 799 1 567 1 217 1 249 1 343 1 103 100,00%
DASF 1 300 18 465 1 200 913 1 000 999 1 094 99,18%
DAUF 1 021 1 90 605 338 317 349 1 034 93,74%
DACF 738 2 32 459 214 169 12 57 5,17%
DASF 1 035 2 40 566 257 192 64 250 22,67%
DAUF 502 2 30 360 177 151 7 42 3,81%
DACF 1 617 11 97 1 186 604 549 163 270 24,48%
DASF 3 495 3 195 2 203 1 158 1 069 556 480 43,52%
DAUF 393 7 31 281 140 126 6 46 4,17%
DACF 2 966 2 321 2 052 1 160 1 097 1 187 1 023 92,75%
DASF 5 368 13 697 3 372 2 010 1 961 2 115 1 052 95,38%
DAUF 1 650 5 50 786 374 299 62 167 15,14%
DACF - - - - - - - - -
DASF 424 4 20 266 116 88 17 151 13,69%
DAUF 119 12 24 109 67 70 0 3 0,27%
DACF 1 118 0 19 385 187 131 34 184 16,68%
DASF 847 1 25 469 174 120 16 93 8,43%
DAUF 1 496 0 99 849 456 413 419 919 83,32%
DACF 407 7 13 256 114 96 3 23 2,09%
DASF 372 3 14 279 121 99 11 94 8,52%
DAUF 981 0 23 473 215 161 42 197 17,86%
DACF 1 900 3 102 1 007 510 461 460 902 81,78%
DASF 414 2 19 242 108 83 15 138 12,51%
DAUF 1 979 4 225 1 275 738 724 768 1 041 94,38%
AT > CZ
DE/LU > CZ
DE/LU North >
CZ (TTG > CEPS)
DE/LU South >
CZ (50Hertz > CEPS)
PL > SK
CZ > SK
SK > HU
CH > AT
CH > DE/LU
DE/LU > AT
BE > NL
AT/DE/LU > NL
AT/DE/LU > PL
AT/DE/LU > CZ
AT/DE/LU > HU
PL > CZ
AT/DE/LU > SI
FR > BE
FR > AT/DE/LU
FR > IT
IT > AT/DE/LU
IT > SI
+
CH > FR
CH > IT
CH > AT/DE/LU

Technical Report
108
ENTSO-E AISBL • Avenue de Cortenbergh 100 • 1000 Brussels • Belgium • Tel + 32 2 741 09 50 • Fax + 32 2 741 09 51 • [email protected] • www. entsoe.eu
Table 16: Statistical data related to the DAUF indicator for a negative flow direction
max min10%
percentile
90%
percentileaverage median sum time time
[MW] [MW] [MW] [MW] [MW] [MW] [GW] [h] [%]
DACF -2 -3 252 -2 092 -361 -1 233 -1 216 -1 268 1 028 93,20%
DASF -144 -3 200 -3 123 -1 188 -2 233 -2 337 -2 463 1 103 100,00%
DAUF -25 -1 015 -614 -53 -261 -116 -2 8 0,73%
DACF -230 -230 -230 -230 -230 -230 0 1 0,09%
DASF - - - - - - - - -
DAUF -2 -945 -510 -24 -225 -169 -69 308 27,92%
DACF -5 -4 025 -3 082 -431 -1 819 -1 881 -1 706 938 85,04%
DASF -16 -1 625 -1 510 -333 -1 038 -1 160 -699 673 61,02%
DAUF -21 -3 708 -2 156 -593 -1 371 -1 356 -1 489 1 086 98,46%
DACF -7 -326 -239 -18 -117 -97 -4 34 3,08%
DASF -3 -583 -499 -24 -179 -111 -5 28 2,54%
DAUF -2 -844 -593 -90 -345 -346 -315 913 82,77%
DACF 0 -1 905 -959 -79 -478 -389 -88 183 16,59%
DASF -13 -792 -500 -27 -244 -177 -7 30 2,72%
DAUF -2 -2 369 -1 543 -322 -892 -847 -943 1 057 95,83%
DACF -26 -500 -309 -59 -172 -159 -5 27 2,45%
DASF -4 -3 001 -3 000 -279 -1 581 -1 500 -1 169 739 67,00%
DAUF - - - - - - - - -
DACF -4 -288 -284 -29 -132 -91 -3 20 1,81%
DASF -77 -617 -471 -112 -257 -188 -2 6 0,54%
DAUF -1 -1 561 -862 -76 -447 -394 -327 733 66,46%
DACF 0 -568 -368 -97 -237 -244 -252 1 065 96,55%
DASF -14 -221 -221 -72 -182 -196 -198 1 089 98,73%
DAUF 0 -347 -170 -20 -91 -79 -71 785 71,17%
DACF -2 -1 652 -1 114 -113 -616 -602 -502 814 73,80%
DASF -4 -630 -630 -203 -447 -455 -492 1 102 99,91%
DAUF 0 -1 022 -600 -60 -313 -285 -157 502 45,51%
DACF -2 -3 278 -2 119 -167 -1 067 -968 -762 714 64,73%
DASF -1 -1 451 -1 310 -129 -691 -653 -244 353 32,00%
DAUF -2 -2 374 -1 548 -323 -901 -859 -957 1 062 96,28%
DACF -136 -1 205 -998 -225 -532 -432 -9 17 1,54%
DASF -3 -2 453 -1 273 -43 -644 -560 -28 43 3,90%
DAUF -2 -521 -376 -15 -176 -129 -7 42 3,81%
DACF -1 -334 -323 -17 -142 -99 -3 23 2,09%
DASF -4 -967 -665 -66 -345 -306 -270 783 70,99%
DAUF - - - - - - - - -
DACF -148 -3 281 -2 213 -931 -1 553 -1 522 -1 713 1 103 100,00%
DASF -13 -3 017 -1 908 -311 -1 109 -1 071 -1 122 1 011 91,66%
DAUF -3 -1 437 -986 -175 -578 -556 -618 1 068 96,83%
DACF 0 -461 -224 -9 -107 -69 -14 133 12,06%
DASF -1 -602 -402 -16 -196 -184 -18 92 8,34%
DAUF -2 -846 -574 -91 -329 -322 -316 960 87,04%
DACF - - - - - - - - -
DASF -2 -55 -30 -5 -16 -14 0 20 1,81%
DAUF - - - - - - - - -
DACF -29 -48 -47 -32 -40 -43 0 3 0,27%
DASF -2 -20 -18 -4 -11 -10 0 3 0,27%
DAUF -2 -106 -75 -5 -31 -15 -1 17 1,54%
DACF -19 -363 -328 -53 -191 -191 0 2 0,18%
DASF -8 -596 -330 -24 -168 -124 -4 21 1,90%
DAUF -2 -517 -227 -18 -107 -77 -20 183 16,59%
DACF - - - - - - - - -
DASF -8 -118 -118 -11 -59 -50 -1 9 0,82%
DAUF -2 -268 -147 -12 -74 -66 -5 69 6,26%
DACF -1 -1 767 -1 292 -293 -808 -820 -845 1 046 94,83%
DASF -3 -547 -515 -111 -349 -391 -297 851 77,15%
DAUF -3 -1 412 -971 -190 -573 -563 -608 1 061 96,19%
DACF -10 -2 458 -1 884 -310 -1 114 -1 119 -928 833 75,52%
DASF -8 -1 078 -996 -272 -701 -766 -437 623 56,48%
DAUF -2 -2 823 -1 460 -250 -842 -807 -890 1 057 95,83%
DACF -4 -819 -666 -39 -291 -245 -23 80 7,25%
DASF -6 -1 380 -798 -33 -369 -275 -19 51 4,62%
DAUF -5 -2 850 -1 936 -268 -1 063 -1 015 -995 936 84,86%
DACF -137 -2 110 -1 575 -736 -1 142 -1 134 -1 259 1 103 100,00%
DASF -2 -800 -505 -81 -291 -280 -277 951 86,22%
DAUF -73 -1 928 -1 345 -488 -909 -915 -1 000 1 100 99,73%
DACF -3 -1 935 -1 037 -124 -531 -476 -488 919 83,32%
DASF -5 -2 252 -1 480 -229 -846 -826 -855 1 010 91,57%
DAUF -2 -859 -385 -32 -183 -135 -34 184 16,68%
DACF -7 -1 634 -1 245 -301 -810 -863 -875 1 080 97,91%
DASF -2 -1 300 -903 -133 -506 -501 -510 1 008 91,39%
DAUF -1 -1 383 -834 -114 -459 -422 -416 906 82,14%
DACF -5 -635 -423 -36 -204 -171 -41 201 18,22%
DASF -1 -1 108 -636 -106 -368 -343 -356 965 87,49%
DAUF -3 -556 -261 -33 -145 -133 -9 62 5,62%
CH > DE/LU
DE/LU > AT
AT > CZ
DE/LU > CZ
DE/LU North >
CZ (TTG > CEPS)
DE/LU South >
CZ (50Hertz >
CEPS)
AT/DE/LU > HU
PL > CZ
PL > SK
CZ > SK
SK > HU
CH > AT
IT > AT/DE/LU
IT > SI
BE > NL
AT/DE/LU > NL
AT/DE/LU > PL
AT/DE/LU > CZ
CH > IT
CH > AT/DE/LU
AT/DE/LU > SI
FR > BE
FR > AT/DE/LU
FR > IT
-
CH > FR