technical report - active...
TRANSCRIPT

Chicago Bike Monitoring Report 2014
CHICAGO BIKE MONITORING
Technical Report
TO: Ron Burke, Executive Director, Active Transportation Alliance
FROM: Matt Berkow, Senior Planner; Nick Falbo, Planner, Alta Planning + Design
DATE: April, 2014

Active Transportation Alliance
TABLE OF CONTENTS Introduction ................................................................................................................................................................................... 1
State of Bicycling in Chicago ..................................................................................................................................................... 3
Estimating Demand for all Bike Trips ................................................................................................................................... 10
City of Chicago Bicycle Counts .............................................................................................................................................. 14
The Future of Bicycling in Chicago ....................................................................................................................................... 19
LIST OF TABLES Table 1: Chicago Bike Commute Historic Mode Share ....................................................................................................... 3
Table 2: Model Estimate of Current Daily Bicycling Trips ............................................................................................... 11
Table 3: Bicycling Activity Annual Benefits......................................................................................................................... 12
Table 4: City-wide Bicycle Volumes: 2 hour highs from counts conducted from 2008-2013 ................................... 17
Table 5: Potential Future Bicycling Benefits ....................................................................................................................... 21
LIST OF FIGURES Figure 1: Chicago Bicycle Commute Mode Share Trends ................................................................................................... 3
Figure 2: Minority Status of Chicago Bicycle Commuters (ACS CTTP 2006-2010) ................................................... 4
Figure 3: Chicago Bicycle Commute Mode Share by Income Group (ACS CTTP 2006-2010) ................................. 4
Figure 4: Incomes of Chicago Bicycle Commuters (ACS CTTP 2006-2010) ................................................................. 4
Figure 5: Chicago Bicycle Commute Mode Share by Vehicle Availability (ACS CTTP 2006-2010) ....................... 5
Figure 6: Vehicle Availability of Chicago Bicycle Commuters (ACS CTTP 2006-2010) ............................................ 5
Figure 7: Chicago Bicycle Commute Mode Share by Age Group (ACS CTTP 2006-2010) ........................................ 5
Figure 8: Age of Chicago Bicycle Commuters (ACS CTTP 2006-2010).......................................................................... 5
Figure 9: Chicago Bicycle Mode Share by Census Tract 1990 ........................................................................................... 6
Figure 10: Chicago Bicycle Mode Share by Census Tract 2000 ........................................................................................ 7
Figure 11: Chicago Bicycle Mode Share by Census Tract (2005-2009) ........................................................................... 8
Figure 12: 2012 Chicago Bicycle Mode Share by Census Tract (ACS 2009-2012) ........................................................ 9
Figure 13: Ratio of Bicycle Commute Trips to Non-School Utilitarian Bicycle Trips (NHTS 2009). ................... 10
Figure 14: Chicago’s Greenhouse Gas Emissions 2000 ..................................................................................................... 12
Figure 15: City-wide Bicycle Volumes: 2 hour highs from counts conducted from 2008-2013 ............................... 15
Figure 16: 2012 Bicycle Volumes: Combined AM and PM Peak Periods (7-9am + 4-6pm) ...................................... 16
Figure 17: 2012 Average Bicycle Volumes by Season: Combined AM and PM Peak Periods (7-9am + 4-6pm) .... 17
Figure 18: Combined Bicycle Traffic over Four Main Portland Bicycle Bridges and Bikeway Miles ..................... 19
Figure 19: Capital Bikeshare Record of Monthly System Wide Trips ..........................................................................20

Chicago Bike Monitoring Report 2014
1
INTRODUCTION Growth in bicycle ridership in Chicago has been tremendous. Each year, more and more
Chicagoan’s take to the streets on two wheels. Bicycle commute to work rates have risen from 0.5
percent in 2000, to 1.3 percent in 2010 and 1.6 percent in 2012. This growth is poised to continue
as Chicago continues to invest in protected bike lanes, bike share and bicycle parking facilities.
People are bicycling for more than just commuting. Chicagoans are making an estimated 125,000
trips every day by bike, in the process keeping 47 million pounds of CO2 emissions out of our air
every year.
If Chicago succeeds in increasing the citywide bicycle commute rate to 5%, these benefits become
even greater.
This report tracks the state of bicycling in the city. It explores not only how valuable bicycling is to
meeting Chicago’s transportation needs today but makes the case for how vital it will likely be in
the future.
Bicycling takes place all across the city of Chicago.
Chicagoans make an estimated 125,000 trips by bike
every day, over 45,400,000 trips per year. This
bicycling activity prevents over 47 million pounds of
carbon dioxide emissions every year.
Active Transportation Alliance
2
THE DATA USED IN THIS REPORT Data analysis presented here comes from a variety of national and local sources, including:
City of Chicago bicycle counts from 2009 to 2013. These counts come from a variety of
sources and include both 24 hour automated counts and 2-hour manual counts.
Journey-to-work information collected by the U.S. Census Bureau's 2012 American
Communities Survey (ACS) is the main input used in this analysis. Work commute trips are
used as a base to estimate other types of bicycle transportation activity, including trips such
as shopping and medical visits. Trips to school were calculated separately based on local
school enrollment populations, a figure also provided by ACS. Social and recreational
bicycling trips were not included in this analysis.
The 2009 NHTS provides a substantial national dataset of travel characteristics, particularly
for bicycling and walking trips. Data used from this survey include:
o Bicycle mode share for school commute trips for college students
o Average trip length by trip purpose and mode
Local data regarding travel behavior for trips other than commute to work is collected in
the 2009 Chicago Regional Household Travel Inventory. Data used in this report was
retrieved from the 2010 Chicago Metropolitan Agency for Planning (CMAP) report Chicago
Regional Household Travel Inventory: Mode Choice and Trip Purpose for the 2008 and 1990
Surveys.
Studies from the Environmental Protection Agency (EPA) identify greenhouse gas and other
emission factors for vehicle travel based on vehicle miles traveled (VMT). EPA sources
were used to calculate the benefits of reduced or replaced auto trips.
The National Center for Safe Routes to School (SRTS), which has published studies on the
rates of walking and bicycling to school for children in grades K-8. Without another data
source, national bicycle-to-school mode share from this study was used for all K-12
students in Chicago.
DISCLAIMER As with any modeling projection, the accuracy of the result is dependent on the accuracy of the
input data and other assumptions. Effort was made to collect the best data possible for input to the
model, but in many cases the use of national data was required where local data was unavailable.

Chicago Bike Monitoring Report 2014
3
STATE OF BICYCLING IN CHICAGO
CENSUS TRENDS AND STATISTICS Over the last 20 years the rate of bicycling for commuting has grown in cities across the country,
and Chicago is no exception. From a stable rate of approximately 0.2% between 1980 and 19901
bicycle commuting experienced an eight-fold increase to 1.6% today2. The rate of growth has
accelerated in recent years and shows no sign of slowing down.
Figure 1: Chicago Bicycle Commute Mode Share Trends
Chart Source: USDOT; US Census Bureau.
Table 1: Chicago Bike Commute Historic Mode Share
Year Bicycle Commute Share Data Source
1980 0.22% Census 1980 – Chicago Metropolitan Statistical Area
1990 0.28% Census 1990
2000 0.50% Census 2000
2006 0.93% ACS 2006 1-Year, B08301
2007 1.12% ACS 2007 1-Year, B08301
2008 1.04% ACS 2008 1-Year, B08301
2009 1.15% ACS 2009 1-Year, B08301
2010 1.29% ACS 2010 1-Year, B08301
2011 1.40% ACS 2011 1-Year, B08301
2012 1.57% ACS 2012 1-Year, B08301 Table Source: USDOT; US Census Bureau.
1 1980 Census figures reflect the bicycle mode share of the Chicago Metropolitan Statistical Area. As reported by USDOT. Journey-To-Work Trends in the United States and its Major Metropolitan Areas 1960-1990. 2003.
-0.5%
0.0%
0.5%
1.0%
1.5%
2.0%
1975 1980 1985 1990 1995 2000 2005 2010 2015 2020
Bic
ycle
Co
mm
ute
Mo
de
Sh
are
Year
Bicycle Commute Mode Share Trendline

Active Transportation Alliance
4
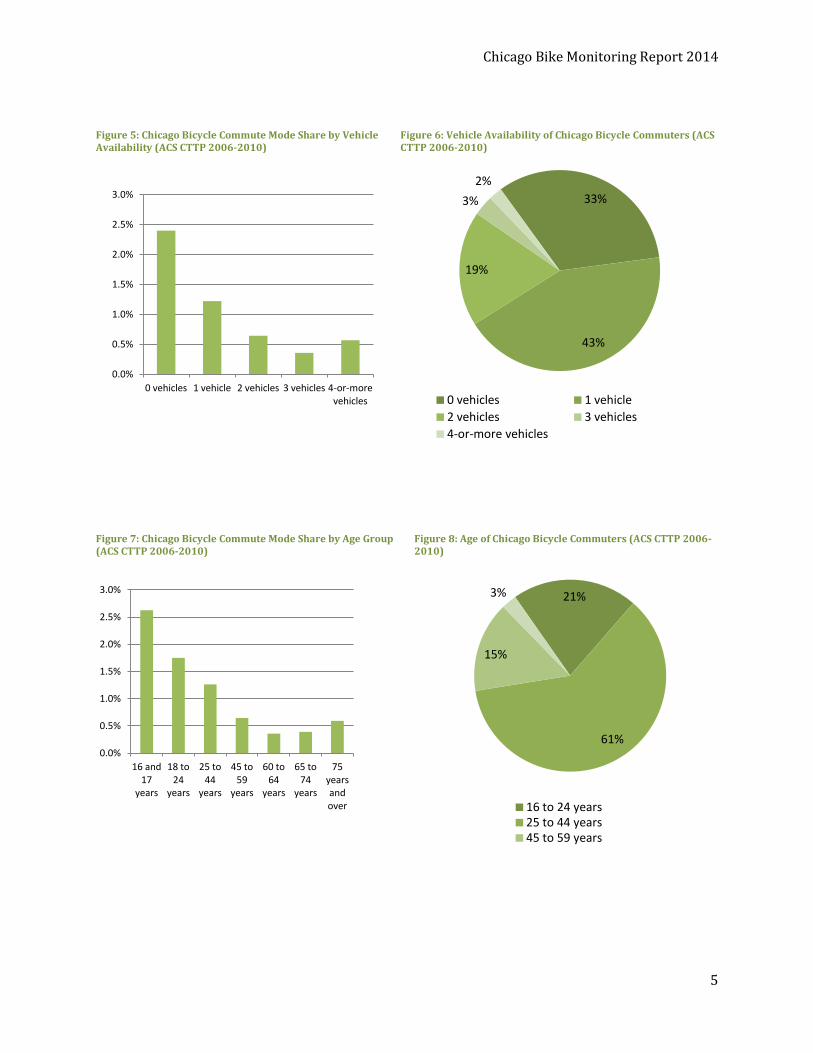
DEMOGRAPHICS OF BICYCLING The American Association of State Highway Officials (AASHTO) prepares a transportation specific
dataset based on the US Census American Community Survey (ACS) called the Census
Transportation Planning Package (CTPP). The CTPP offers custom tabulations of data unavailable
through traditional Census datasets. Released in October 2013, the most recent CTPP product is
based on 2006 – 2010 5-year ACS Data3. These data sets go beyond how many people commute by
bike, and provide some insight into the demographic characteristics of bicycle commuters.
A series of figures below present a summary of key variables available from the CTPP.4
Figure 2: Minority Status of Chicago Bicycle Commuters (ACS CTTP 2006-2010)
Figure 3: Chicago Bicycle Commute Mode Share by Income Group (ACS CTTP 2006-2010)
Figure 4: Incomes of Chicago Bicycle Commuters (ACS CTTP 2006-2010)
3 2006-2010 ACS data reflect lower levels of bicycling than occur today. The bicycle mode share for Chicago commuters in this period was 1.11%. 4 The source for all figures in this section is U.S. Census Bureau, American Community Survey 2006-2010 Five-year estimates. Special Tabulation: Census Transportation Planning
75%
25%
White
Nonwhite
0.00%
0.20%
0.40%
0.60%
0.80%
1.00%
1.20%
1.40% 16%
27%
41%
16%
Less than $24,999 $25,000-$49,999
$50,000-$99,999 $100,000-$149,999
Chicago Bike Monitoring Report 2014
5
Figure 5: Chicago Bicycle Commute Mode Share by Vehicle Availability (ACS CTTP 2006-2010)
Figure 6: Vehicle Availability of Chicago Bicycle Commuters (ACS CTTP 2006-2010)
Figure 7: Chicago Bicycle Commute Mode Share by Age Group (ACS CTTP 2006-2010)
Figure 8: Age of Chicago Bicycle Commuters (ACS CTTP 2006-2010)
0.0%
0.5%
1.0%
1.5%
2.0%
2.5%
3.0%
0 vehicles 1 vehicle 2 vehicles 3 vehicles 4-or-more vehicles
33%
43%
19%
3%
2%
0 vehicles 1 vehicle
2 vehicles 3 vehicles
4-or-more vehicles
0.0%
0.5%
1.0%
1.5%
2.0%
2.5%
3.0%
16 and 17
years
18 to 24
years
25 to 44
years
45 to 59
years
60 to 64
years
65 to 74
years
75 years and over
21%
61%
15%
3%
16 to 24 years 25 to 44 years 45 to 59 years

Active Transportation Alliance
6
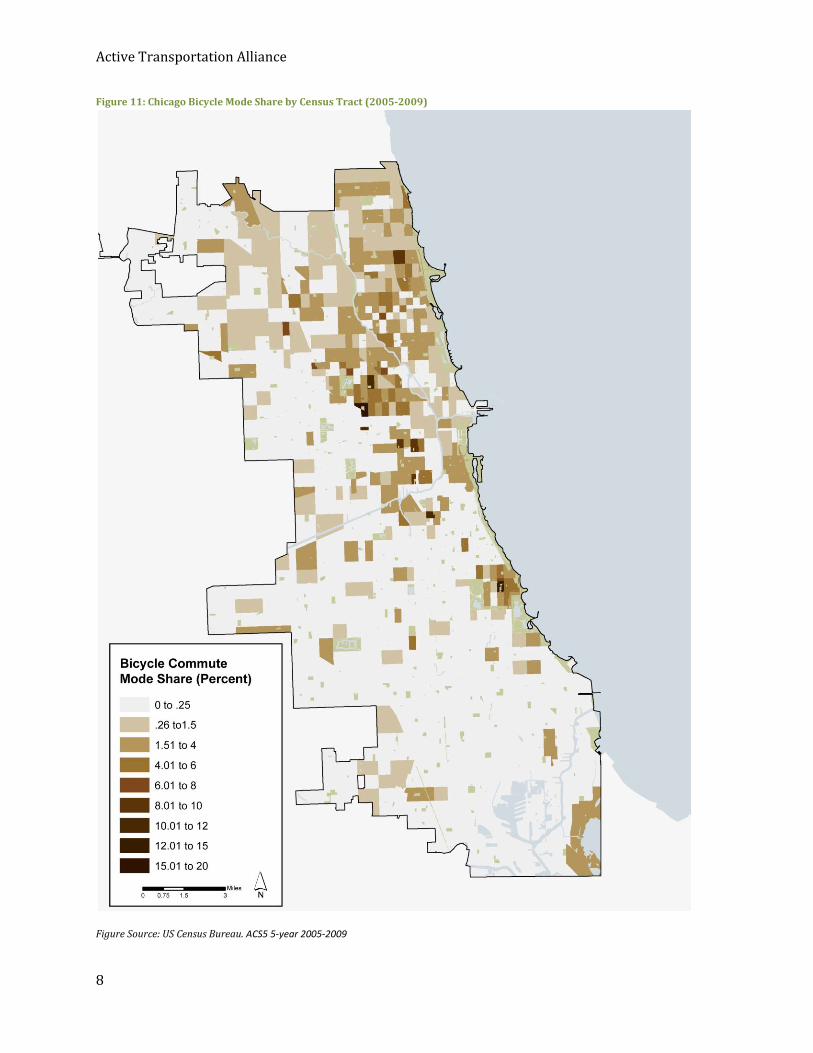
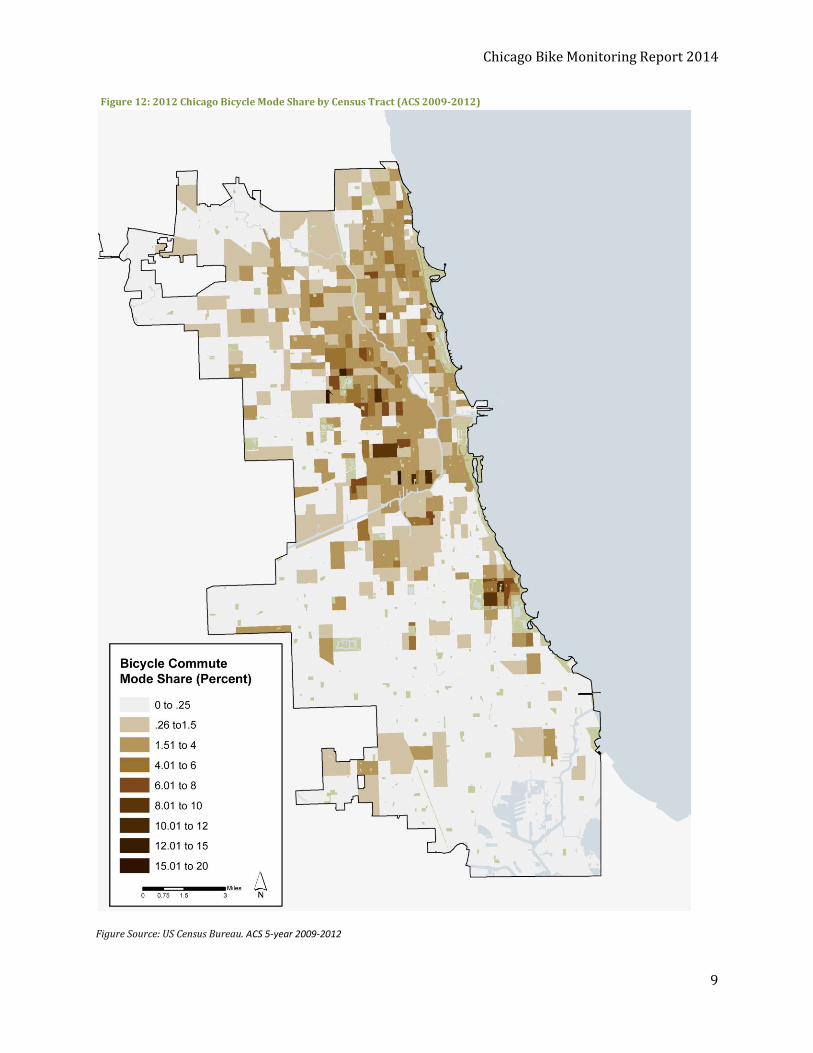
NEIGHBORHOOD BIKE COMMUTING Bicycle commuting has increased in many of Chicago’s neighborhoods. Figures 9–12 below and on
the following pages illustrates the rate of bicycle commuting over time in Census tracts throughout
the city. As illustrated in the figures, commute rates have increased in much of the city
Figure 9: Chicago Bicycle Mode Share by Census Tract 1990
Figure Source: US Census Bureau. Census 1990.

Chicago Bike Monitoring Report 2014
7
Figure 10: Chicago Bicycle Mode Share by Census Tract 2000
Figure Source: US Census Bureau. Census 2000.
Active Transportation Alliance
8
Figure 11: Chicago Bicycle Mode Share by Census Tract (2005-2009)
Figure Source: US Census Bureau. ACS5 5-year 2005-2009
Chicago Bike Monitoring Report 2014
9
Figure 12: 2012 Chicago Bicycle Mode Share by Census Tract (ACS 2009-2012)
Figure Source: US Census Bureau. ACS 5-year 2009-2012

Active Transportation Alliance
10
ESTIMATING DEMAND FOR ALL BIKE TRIPS
OVERVIEW Bicycling is gaining new interest from communities across the United States after decades of neglect
due to focused attention on motor vehicle transportation. Due to low existing levels of use and
funding, bicycling faces an uphill battle to prove its utility as a viable, efficient mode of
transportation. However, bicycling is becoming increasingly prevalent in Chicago, and the benefits
created by bicycling increase with use. For each additional vehicle mile replaced by bicycling, about
one pound of greenhouse gas emissions are prevented, a few cents are saved from being spent on
gas, and a person gets several minutes closer to reaching their recommended healthy levels of
physical activity. When bicycling becomes a part of people’s daily activity, these benefits add up to
create a healthier, more livable community. To communicate significance of these benefits, it is
necessary to develop a better more robust picture of the scale of bicycle use happening in Chicago
than currently exists.
EXISTING BICYCLING DEMAND The model applied in this study uses local and national studies to estimate the number and purpose
of bicycling trips taken today within Chicago. In isolation, data from ACS provides information only
on work commute trips. Because the trip to work represents only a fraction of all trips taken,
additional data is necessary to estimate and classify total bicycling activity in Chicago. The 2009
Chicago Regional Household Travel Inventory provides information on mode split for trips of all
purposes, as shown in Figure 13. The 2009 National Household Travel Survey (NHTS 2009)
provides information on where, why, and how far people are bicycling for transportation. These
data sources are combined to estimate the number of other types of bicycling trips being made in
addition to work trips.
Figure 13: City of Chicago Mode Share for All Trip Types (CMAP 2010).
Figure Source: CMAP 2010
18%
24%
41%
15%
1.41%
0%
5%
10%
15%
20%
25%
30%
35%
40%
45%
Walk Drive Alone Carpool Transit Bike
Mode Share

Chicago Bike Monitoring Report 2014
11
CURRENT DEMAND AND BENEFITS Table 2 shows the results of the overall bicycle trip activity model. Using the Chicago Regional
Household Travel Inventory, US Census and NHTS as a basis, the model estimates and classifies the
124,595 bicycle trips that occur in Chicago each day for transportation purposes. This number does
not include purely exercise/recreational bicycle trips in the area, which if added would further
increase the number of daily trips. The majority of Chicago area bicycling trips are utilitarian trips
not related to work or school, such as trips for medical/dental services, shopping/errands, family
or personal business, obligations, meals, and other trips.
Table 2: Model Estimate of Current Daily Bicycling Trips
Daily Trips (All Modes)
Bicycle Mode Share
Average Daily Bicycling Trips
All Trips in the City of Chicago 8,847,638 1.41% 124,595
Work Commute Trips 1,218,908 1.6% 26,334
K-12 School Trips 426,145 1.0% 4,203
College Commute Trips 242,742 1.7% 3,151
Utilitarian Trips Remainder of All Trips 90,907 Table Source: ACS 2007-2011, NHTS 2009, SRTS 2009, CMAP 2010
ESTIMATING BICYCLING BENEFITS Numerous studies have estimated benefits of bicycling. For each bicycle trip, the city and residents
benefit from improved health from increased physical activity, money saved on gas and vehicle
insurance, and reduced public costs of road maintenance from less wear and tear on local roads.
Table 3 shows the estimate annual impact of bicycling in Chicago, including air quality benefits
calculated using vehicle emissions data from the EPA. The benefits of bicycling in Chicago are based
on the number of regular bicycle transportation users and miles traveled estimated in the overall
demand model.
KEY FINDINGS OF EXISTING BICYCLING BENEFITS ANALYSIS Current levels of bicycling in Chicago have recently grown to over twice the national average, and
this increased local use of active transportation returns significant benefits to the community in the
form of improved air quality, reduced transportation costs, and improved health. Vehicle miles
traveled reductions are calculated using average bicycle trip distances for each trip purpose
category and the vehicular mode share of that trip type. Existing rates of bicycling transportation
result in over 27 million trips annually, preventing an estimated 30 million pounds of carbon
dioxide emissions.
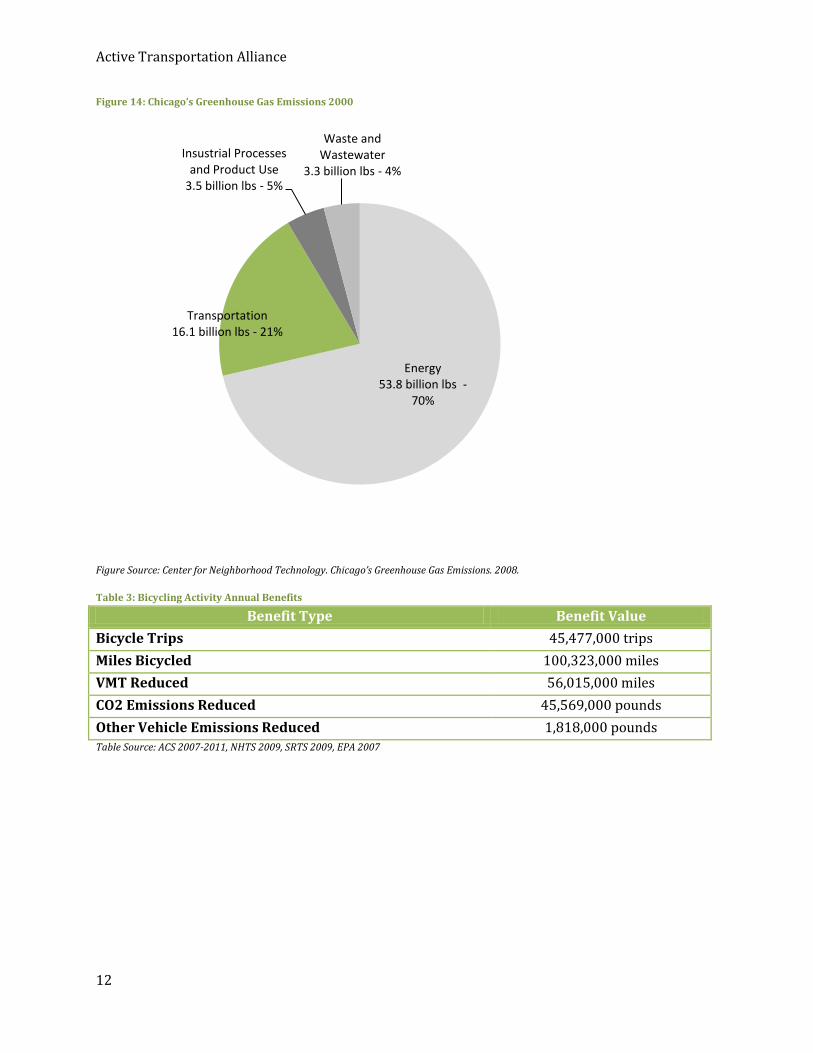
The transportation sector accounts for 21% of all greenhouse gas emissions in the city of Chicago,
as shown in Figure 14. Existing bicycling activity in the city is estimates to reduce transportation-
related greenhouse gas emissions by around 0.3%.
Active Transportation Alliance
12
Figure 14: Chicago’s Greenhouse Gas Emissions 2000
Figure Source: Center for Neighborhood Technology. Chicago’s Greenhouse Gas Emissions. 2008.
Table 3: Bicycling Activity Annual Benefits
Benefit Type Benefit Value
Bicycle Trips 45,477,000 trips
Miles Bicycled 100,323,000 miles
VMT Reduced 56,015,000 miles
CO2 Emissions Reduced 45,569,000 pounds
Other Vehicle Emissions Reduced 1,818,000 pounds Table Source: ACS 2007-2011, NHTS 2009, SRTS 2009, EPA 2007
Energy 53.8 billion lbs -
70%
Transportation 16.1 billion lbs - 21%
Insustrial Processes and Product Use
3.5 billion lbs - 5%
Waste and Wastewater
3.3 billion lbs - 4%
Chicago Bike Monitoring Report 2014
13
DIFFICULT-TO-QUANTIFY BENEFITS OF BICYCLING AND WALKING In addition to the air quality benefits estimated above, bicycling has many other benefits that are
challenging to quantify. Bike lanes can improve retail business directly by drawing customers and,
indirectly, by supporting the regional economy. Patrons who bike to local stores have been found to
spend more money than patrons who drive.5 By replacing short car trips, bicycling can help middle-
class families defray rising transportation costs. Families that drive less spend 10 percent of their
income on transportation, compared to 19 percent for households with heavy car use,6 freeing
additional income for local goods and services.
5 The Clean Air Partnership. (2009). Bike Lanes, On-Street Parking and Business: A Study of Bloor Street in Toronto’s Annex Neighborhood. 6 Center for Neighborhood Technology. (2005). Driven to Spend: Pumping Dollars out of Our Households and Communities.
Active Transportation Alliance
14
CITY OF CHICAGO BICYCLE COUNTS Six sites are part of the Chicago Bicycle Program’s monthly bike count program. On a specified
weekday each month, volunteer or staff use a standardized entry form to manually count and track
bicycle movements at these locations. These monthly counts provide a detailed understanding of
behavior over time and across seasons. For example, average winter ridership volumes equal
nearly 40% of average summer volumes.
The monthly counts support a long history of bicycle counts in Chicago. Since 2008, the Chicago
Bicycle Program and Department of Transportation have conducted bicycle counts at 41 different
locations. The majority of this data was collected manually by trained volunteers using a
standardized entry form similar to the monthly count program. Additional data was collected using
automated “tube” counters that were deployed for a 24-hour period.
These other count sites don’t allow for the same detailed analysis as the monthly bicycle counts, but
they do illustrate the presence and scale of bicycling activity across the city.
Figure 15 on the following page reveals that people are bicycling throughout the city of Chicago.
While the highest volumes have been observed in Central Chicago and in the neighborhoods north
of the Chicago River and east of I-90, the bicycle counts indicate that significant bicycling activity
occurs in all parts of the city.
Bicycling activity decays as a function of increasing distance from downtown Chicago. This is
consistent with historic bicycling trends shown in Figure 1 and Figure 2, and may be related to trip
length, or the conditions of available bicycle facilities and completeness of the bikeway network.

Chicago Bike Monitoring Report 2014
15
Figure 15: City-wide Bicycle Volumes: 2 hour highs from counts conducted from 2008-2013
Figure Source: CDOT Bicycle Counts.

Active Transportation Alliance
16
MONTHLY BIKE COUNTS AT SIX SITES In 2012, the Chicago Bicycle Program began collecting monthly bicycle counts at six key
intersections (Clark at Lincoln/Wells, Elston at Milwaukee, Lake at Damon, Jackson at Halsted, 18th
at Canal, and King at 31st) and has continued this practice in 2013. These locations represent a
diverse cross-section of geography, ethnicity and income. These sites were selected based upon
planned bicycle projects, existing bike facilities, ease of implementation and current ridership.7
With a limited count history at these locations, it is not yet possible to examine annual trends and
comparisons. Over time, these counts will allow for annual comparisons reflecting longer term
change. The current dataset does allow us to better understand monthly and seasonal changes in
ridership.
Figure 16 below shows combined bicycle volumes for all six count locations during the morning
and afternoon peak periods. The data shows that more people choose to ride bikes in the warm
months of June through September, yet thousands of people continue to ride through the harshest
months of winter. Both men and women ride year-round, although the data shows that in all
months, male bicyclists are over-represented compared to the general population of Chicago, which
is 48% male.
Figure 16: 2012 Bicycle Volumes: Combined AM and PM Peak Periods (7-9am + 4-6pm)
Figure Source: CDOT Bicycle Counts.
Figure 17 presents the bike counts averaged by season. As illustrated in the figure, average winter
ridership volumes equal nearly 40% of average summer volumes. Women made up an average 25%
7 http://chicagocompletestreets.org/your-streets/bikeways/bike-counts/
74% 77%
72%
74% 72%
70% 68% 69%
70%
71% 73% 74%
26%
23%
28%
26%
28%
30% 32%
31%
30%
29%
27% 26%
0
1000
2000
3000
4000
5000
6000
Male Female

Chicago Bike Monitoring Report 2014
17
of observed bicyclists during the winter months, compared to 31% during the summer months.
Studies have shown that women are more sensitive to safety concerns while bicycling8. If winter
conditions are less safe or feel less safe than summer months due to weather or bikeway
maintenance practices, it may result in fewer women choosing to ride.
Figure 17: 2012 Average Bicycle Volumes by Season: Combined AM and PM Peak Periods (7-9am + 4-6pm)
Figure Source: CDOT Bicycle Counts.
HISTORIC BICYCLE COUNT DATA Table 4 below provides additional details about each data point included on the map, such as the
time, month, and year of the count. Note that only manually counted locations include statistics on
observed gender.
Table 4: City-wide Bicycle Volumes: 2 hour highs from counts conducted from 2008-2013
Location Male
Riders
Female
Riders
2 Hour
Peak
Riders
Time
Counted*
Month
Counted
Year
Counted
Elston and Milwaukee 891 366 1257 Morning June 2012
Clark and Lincoln/Wells 469 266 735 Morning August 2012
Milwaukee and Halsted - - 730 Morning September 2009
Wells and Ontario - - 405 Morning August 2010
Division and Larrabee - - 372 Afternoon June 2010
Milwaukee and North - - 350 Morning September 2010
Wells and Schiller - - 339 Morning September 2009
8 Garrard, J., Rose, G., Lo, S.K., 2008. Promoting transportation cycling for women: the role of bicycle infrastructure. Preventive Medicine 46; Pucher, J., Dill, J., Handy, S., 2010a. Infrastructure, programs and policies to increase bicycling: an international review. Preventive Medicine 48
75%
73%
69%
71% 25%
27%
31%
29%
0
500
1000
1500
2000
2500
3000
3500
4000
4500
5000
Winter Spring Summer Fall
Female
Male

Active Transportation Alliance
18
Jackson and Halsted 242 87 329 Afternoon June 2013
Roosevelt and Throop - - 320 Morning June 2010
Lincoln and Dickens - - 264 Afternoon August 2010
Lakefront Trail and Jackson 176 70 246 Afternoon September 2011
Dearborn and Hubbard - - 241 Afternoon July 2010
Halsted and 27th - - 234 Afternoon September 2009
Michigan and Harrison 169 62 231 Afternoon September 2011
Halsted and Diversey - - 212 Morning June 2010
Lake and Damen - - 197 Afternoon July 2013
18th and Canal 133 63 196 Afternoon July 2013
August and Honore - - 163 Afternoon July 2010
Monroe and Clinton - - 160 Morning September 2011
Washington and Clinton 117 40 157 Morning September 2011
Division and Cherry - - 149 Afternoon June 2010
Lincoln and Dickens - - 144 Morning November 2009
Adams and Canal 106 31 137 Afternoon September 2011
King and 31st 87 42 129 Afternoon July 2013
Jackson and Canal 88 28 116 Morning September 2011
Van Buren and Wells 79 23 102 Afternoon September 2011
South Chicago and 71st - - 96 Afternoon August 2010
Archer and Cermak - - 71 Afternoon September 2010
Diversey and Kildare - - 70 Morning July 2010
Wabash and Harrison 47 21 68 Afternoon September 2011
Lawrence and Leavitt - - 66 Afternoon August 2010
Harrison and Canal 41 18 59 Morning September 2011
Blue Island Ave and 16th - - 59 Morning July 2010
South Shore Drive and 78th - - 52 Afternoon August 2010
Plymouth and Harrison 37 14 51 Morning September 2011
26th and Normal - - 44 Afternoon September 2010
26th Ave and Pulaski - - 43 Afternoon August 2009
Elston and La Crosse - - 43 Afternoon May 2010
Clark and Harrison 28 10 38 Afternoon September 2011
State and Harrison 24 11 35 Morning September 2011
Van Buren and Clinton 25 6 31 Morning September 2011
Figure Source: CDOT Bicycle Counts. * Morning counts were conducted on a Tuesday, Wednesday or Thursday from 7-9 am. Afternoon counts were conducted on a
Tuesday, Wednesday or Thursday from 4-6pm.
Chicago Bike Monitoring Report 2014
19
THE FUTURE OF BICYCLING IN CHICAGO
CONTINUED GROWTH OF BICYCLING IN CHICAGO The City of Chicago Bike 2015 Plan9 calls for bicycle use to increase to 5% of all trips under five
miles. Achieving and exceeding this goal is possible through a concerted effort to complete the
bikeway network, continued success of Divvy bike share, and marketing bicycling as a preferred
transportation option for Chicagoans.
A COMPLETED NETWORK The Chicago Streets for Cycling 2020 Plan presents a citywide network of Spoke, Crosstown and
Neighborhood Bike Routes designed to provide the option to bicycle to all Chicagoans. As evidenced
from other cities, completing the bikeway network across the city is likely to result in a
corresponding increase in bicycling. This growth in bicycling may be due to meeting the unmet
demand for bicycling present today as well as convincing non-bicycling Chicagoan’s who
previously would not consider bicycling to identify the activity as a safe, comfortable and viable
alternative for traveling. In either case, more bikeways are likely to translate into more bicycling.
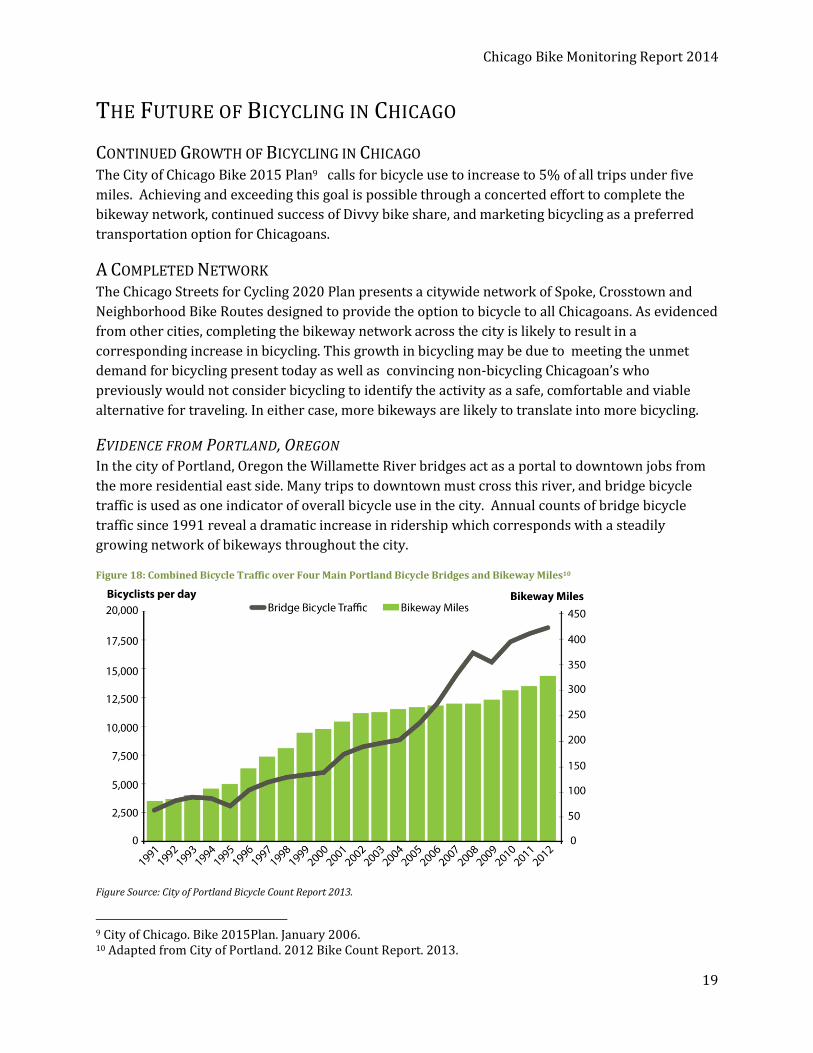
EVIDENCE FROM PORTLAND, OREGON In the city of Portland, Oregon the Willamette River bridges act as a portal to downtown jobs from
the more residential east side. Many trips to downtown must cross this river, and bridge bicycle
traffic is used as one indicator of overall bicycle use in the city. Annual counts of bridge bicycle
traffic since 1991 reveal a dramatic increase in ridership which corresponds with a steadily
growing network of bikeways throughout the city.
Figure 18: Combined Bicycle Traffic over Four Main Portland Bicycle Bridges and Bikeway Miles10
Figure Source: City of Portland Bicycle Count Report 2013.
9 City of Chicago. Bike 2015Plan. January 2006. 10 Adapted from City of Portland. 2012 Bike Count Report. 2013.

Active Transportation Alliance
20
THE BIKE SHARE BOOST
Regular bike commuters make up only one part of Chicago’s future growth in bicycling. Social,
spontaneous, and casual ridership is also likely to increase thanks to the Divvy bike sharing system.
While citywide bike sharing systems are new in the US, the Capital Bikeshare program from the
Washington D.C. area launched in 2010 is one of the country’s most mature systems. Experiences
and trends from Capitol Bikeshare offer a glimpse of the potential of Divvy to increase bicycling
trips over time. Ridership history for Capitol Bikeshare is graphed below in Figure 19.
Similar to the 2012/2013 Chicago bike counts, Capitol Bikeshare ridership fluctuates monthly to
correspond with seasonal variation. However, year-over-year growth had continued across all
seasons. Growth has increased so that winter ridership in 2013 is only slightly below peak summer
ridership two years earlier.
If Divvy ridership follows a similar pattern, it will continue to play an increasing role in trip making
by bicycle in Chicago.
Figure 19: Capital Bikeshare Record of Monthly System Wide Trips11
Figure Source: Capital Bikeshare Dashboard.
11 Retrieved and adapted from Capital Bikeshare Dashboard. http://cabidashboard.ddot.dc.gov/CaBiDashboard/ November 2013

Chicago Bike Monitoring Report 2014
21
MONITORING OUR PROGRESS
Moving forward the Chicago Bicycle Program should continue to count at the same six locations to
allow for annual comparison.
Increasing capacity of the count program may also allow counting at additional sites. For example,
new count sites could be added in advance of planned bikeway investments. Monitoring before and
after effects of new or enhanced bikeways may help quantify the benefits such investments bring.
GETTING TO 5% AND BEYOND
As described above, achieving Chicago’s mode share targets is possible by completing the bikeway
network, continued promotion of Divvy bike share, and continued marketing bicycling as a
preferred transportation option for Chicagoans.
Like Chicago, other cities have mode-share targets for biking and walking. The City of Portland
adopted mode share target is for 25% of trips by bicycle by 203012 and the City of Vancouver, BC
has adopted a target of at least half of all trips be by foot, bike or transit by 2020.13
Achieving a 5% or higher bicycle mode share will bring increased benefits to Chicago in the form of
reduced VMT and greenhouse gas emissions. Estimates for the total level of trip making and
resulting benefits are provided in Table 5.
Table 5: Potential Future Bicycling Benefits
Benefit Type
Current Estimate
(1.57% Mode Share)
Future Estimate
(5% Mode Share
Scenario)
Future Estimate
(10% Mode Share
Scenario)
Annual Commute to Work Bicycle Trips 9,611,794 30,595,000 61,189,000
Annual Bicycle Trips (Estimated for All Trips)
45,477,000 144,760,000 289,510,000
Annual Miles Bicycled 100,323,000 319,330,000 638,660,000
Annual VMT Reduced 56,015,000 178,300,000 356,590,000
CO2 Emissions Reduced (pounds) 45,569,000 145,050,000 290,090,000
Other Vehicle Emissions Reduced (pounds) 1,818,000 5,787,000 11,573,000
Table Source: CMAP 2010, ACS 2007-2011, NHTS 2009, SRTS 2009, EPA 2007
The important factor to consider with these future assumptions is not the accuracy of the mode
share percentages, but the benefits that would accrue to Chicago if those numbers are reached. As
more cities across the country track changes in bikeway mileage over time and participate in
annual bicycle counts, more data will be available to better understand and refine mode share
predictions. 12 City of Portland. Bike Plan for 2030. 2010. 13 City of Vancouver, Transportation 2040.