technical note - nasa · technical note d-1574 fatigue behavior of materials under strain cycling...
TRANSCRIPT

N 63 '4250
TECHNICAL NOTE 0-1574
·NASA TN D-1574
FATIGUE BEHAVIOR OF MATERIALS UNDER STRAIN CYCLING
IN LOW AND INTERMEDIATE LIFE RANGE
By Robert W. SInith, Marvin H. Hirschberg, and S. S. Manson
Lewis Research Center Cleveland, Ohio
NATIONAL AERONAUTICS AND SPACE ADMINISTRATION
WASHINGTON April 1963
https://ntrs.nasa.gov/search.jsp?R=19630004374 2018-09-16T23:41:24+00:00Z

NATIONAL AERONAUTICS AND SPACE ADMINISTRATION
TECHNICAL NOTE D-1574
FATIGUE BEHAVIOR OF MATERIALS UNDER STRAIN CYCLING
IN LOW AND INTERMEDIATE LIFE RANGE
By Robert W. Smith) Marvin H. Hirschberg) and S. S. Manson
SUMMARY
A series of constant strain range tests was made for a wide variety of materials producing fatigue lives varying from a few cycles to about one million cycles. The specimens were subjected to axial, compression-tension, low-frequency fatigue about a zero mean strain. Load range was measured periodically throughout each test, enabling an analysis of fatigue results in terms of elastic, plastic, and total strains. Materials tested were AlSI 4130 (soft and hard), AlSI 4340 (annealed and hard), AlSI 52100, AlSI 304 ELC (annealed and hard), AlSI 310 (annealed), AM 350 (annealed and hard), Inconel X, titanium (6Al-4V), 2014-T6, 5456-H311, and 1100 aluminum, and beryllium.
During strain cycling, load range generally changes during the very early part of the test and then settles down to a fairly constant value for most of the fatigue life. Cyclic strain hardening or softening causes the observed load change and produces cyclic stress-strain relations that often differ substantially from the virgin tensile flow curve. These comparisons are made for each of the test materials.
Fatigue-life relations between elastic, plastic, and total strain components were established. For metallurgically stable materials, straight-line fits of the logarithmic elastic strain-life and plastic strain-life data produce a relation that agrees well with the total strain-life data. The strain-life data are also used to explain changes in susceptibility to stress concentrations over a large life span and to rate correctly the relative notch sensitivities of the four test materials that experienced .nontest-section failures in comparison with the other materials.
Relative performance of the test materials is illustrated on the basis of both strain range and stress range over a life span ranging from a few cycles to about one million cycles.

INTRODUCTION
In recent years there has been an appreciable effort to incorporate lowcycle fatigue data obtained at various laboratories into fatigue design procedures. Manson (ref. 1) and Coffin (ref. 2) independently suggested that lowcycle fatigue life for a specific material is directly proportional to a power of the cyclic plastic strain (a straight line on a log-log plot of plastic strain against cycles to failure). Coffin (ref. 3) discussed the application of this criterion to design after extensive testing of type 347 stainless steel in both constrained thermal cycling and constant-temperature strain cycling. Correlated experimental data were developed at four laboratories to establish parameters governing pressure-vessel design with respect to the plastic fatigue characteristics of the material (ref. 4). In this analysis use was made of tota~ (elastic plus plastic) strain range test data. Manson (ref. 5) has related fatigue life to the elastic as well as the plastic strain range components of the total mechanical strain range) thereby producing one relation suitable for cyclic lives of approximately 10 to 106 cycles. It has also been pointed out (ref. 6) that in elastic-plastic stress analysis of fatigue problems there is a definite need for knowledge of the relation between stress range (or amplitude) and strain range (or amplitude) during strain cycling. Most recently, Langer (ref. 7) has described a pressure-vessel design procedure using a stress amplitude-life equation based on two factors: an empirical relation between plastic strain and tensile ductility, and the endurance limit.
In order to evaluate present design procedures, to develop new methods if necessary, and to increase the understanding of the stress-strain - life relations during fatigue, it was believed desirable to obtain detailed fatigue test data for a wide variety of ductile materials using axial, compression-tension, low-frequency fatigue machines in which both load and deformation were measured periodically throughout the test. The first phase of such a program) reported herein, provides the basic information obtained from room-temperature constant diametral strain range tests with zero mean strain. The following desired test information was obtained:
(1) Behavior of load range during cycling at constant strain amplitude
(2) Fatigue behavior for span of fatigue life ranging from a few cycles to about one million cycles
(3) Data for a selection of materials in which there is a wide variation of chemical and metallurgical composition
(4) Data for a selection of materials in which there is a wide variation in elastic and mechanical properties (elastic modulus, yield strength, ultimate strength, and ductility)
Such information is then used to
2
(1) Determine the cyclic stress-strain relations necessary to the stress analyst for fatigue analysis

(2) Determine the elastic strain (or stress), the plastic strain, and the total strain range as a function of fatigue life
(3) Compare relative performance of materials on a basis of strain range and stress range
(4) Illustrate the use of strain~life relations to indicate relative notch sensitivity of the materials
MATERIALS , APPARATUS, .AND PROCEDURE
Materials Tested
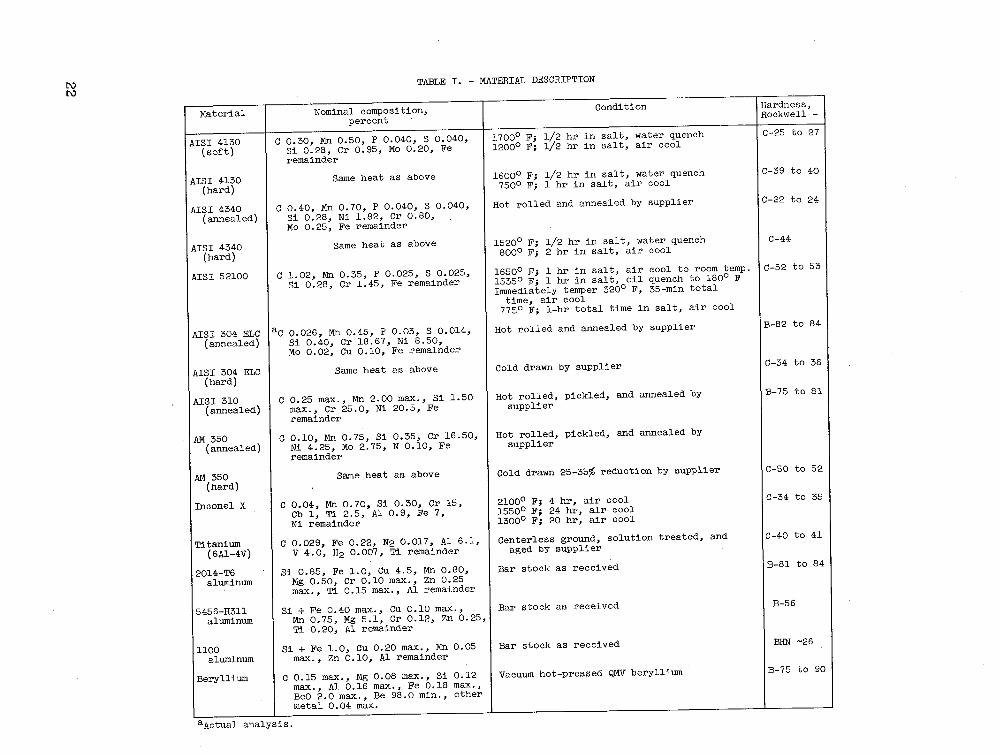
The nominal chemical composition, processing condition, and hardness of each test material are tabulated in table I. The test materials were three ferritic alloy steels: AISI 4130, AlSI 4340, and AISI 52100; three austenitic heatresisting steels: AlSI 304 (extra low carbon), AlSI 310, and AM 350; one heatresisting nickel-base alloy: Inconel X; three types of aluminum: 2014-T6, 5456-H3ll, and 1100; a 6Al-4V titanium alloy; and structural grade QMV beryllium. The steels AlSI 4130, 4340, and 304 ELC, and AM 350 were tested in both soft and hard conditions. Mechanical properties for these materials (table II) were measured at room temperature.
Specimen Configuration
The fatigue test specimens (£igs. lea) and (b» were bars, circular in cross section having an hourglass-shaped test section with a minimum diameter of 0.25 inch, unless otherwise noted in table III. AlSI 4130 and 52100 steels were fabricated from 1/2-inch-diameter blanks into fatigue specimens as shown in fig-ure l(b). All the rest of the materials were machined out of 3/4-inch-diameter blanks into buttonhead fatigue specimens as shown in figure lea) (or fig. l(c) for beryllium only). Separate buttonheads were screwed onto the threaded-head specimens so that the same style of grips could be used for all materials. It was necessary to use a modified specimen configuration for certain very short life tests to reduce the buckling problem that developed in the more ductile materials at large diametral strain ranges. The most common modification involved the reduction of the hourglass radius to 1. 0 inch and the overall specimen length to 2.25 inches. In a few tests of AlSI 4130 (annealed and hard) and Inconel X the hourglass radius was ~urther reduced to 0.5 inch. Another modification was necessary to prevent failures outside the test section for some materials under certain test conditions. In this case the minimum test-section diameter was reduced to 0.21 or 0.18 inch as circumstances dictated.
A cylindrical test section (fig. l(c» was used to make the longitudinal strain measurements necessary for elastic modulus determinations. Beryllium fatigue specimens were made of this configuration also to allow longitudinal strain control instead of diametral. This procedure was necessary because the extremely
3

low value of Poisson's ratio (~ = 0.024) for beryllium means that the elastic diametrical strains are very small and, therefore, more difficult to measure accurately.
Test Apparatus
Four low-frequency mechanical fatigue testing machines (fig. 2) designed and built at Lewis Research Center were used for this test program. Alternate push and pull forces on the specimen were supplied by a 6-inch-diameter hydraulic cylinder. The buttonhead specimens were attached rigidly to the loading rods with split-cone and wedge-type grips. A commercial die set was used to maintain alinement under the action of compressive loads. The lower loading rod was attached in series to the lower movable die-set platen, the commercial load cell, and the hydraulically operated piston rod.
Strain range control was obtained by a lO-to-l deflection lever attached to the moving platen. This lever actuated microswitches which energized relays that control a solenoid-operated four-way hydraulic valve. The valve transferred high-pressure oil to the opposite side of the double-acting piston and vented the unpressurized side to the supply tank. Cycling rate could be varied from as low as 2 or 3 cycles per minute to about 30 cycles per minute.
A strip-chart recorder was used to make either continuous or periodic records of load amplitude. A special circuit built into the recorder for this purpose powered the load cell which, in turn, supplied the load signals to the recorder for amplification.
Strain measurements were made with Tuckerman optical strain gages for all tests in which the diametral strain range fell below the maximum practical capability (Ed = 0.034 in./in. or less) of the l-inch-gage-length extensometer. (Symbols are defined in appendix A.) For larger strain ranges, a dial indicator type of diametral extensometer was used. Tuckerman optical strain gages were selected because of their reliability for a practically unlimited number of cycles at large as well as small strains, and because their excellent sensitivity is particularly desirable for diametral strain measurements. With these gages it is possible to discern a strain of 8 microinches per inch over a l/4-inch gage length. Diametral strain measurements were made using two l-inch extensometers fastened with piano-wire springs to a special diametral strain-gage fixture (figs. 3(a) and (b)). Two diametrically opposed aluminum bearing edges were rigidly fastened to a U-shaped leaf spring which pressed the bearing edges against the test section. Long flexible loops of piano wire attached to the loading rod stabilized the strain-gage fixture against tipping during the fatigue test. Longitudinal strain measurements, used for the beryllium fatigue tests and for all elastic modulus measurements, were made by fastening two l-inch-gage-length extensometers directly to specimens having cylindrical test sections. All optical strain readings were made with the use of the Tuckerman autocollimators.
4

Procedure
Determination of mechanical properties. - The usual procedure involved the measurement of tensile and elastic properties before fatigue testing each test material. For tensile testing, standard hourglass fatigue specimens were installed in a Rhiele universal testing machine and were fitted with a dial-gagetype diametral extensometer. .AB the tensile load was increased, simultaneous readings of the dial gage and load indicator were recorded. With these data the true stress - true strain relation beyond the yield point was established. Other quantities measured and used to calculate ultimate strength, fracture strength, and ductility were maximum load, fracture load, and the minimum test-section diameter after fracture. In all cases the reported tensile properties (table II) represent the average of at least three tests. Cylindrical test-section specimens (fig. l(c) were used to determine elastic modulus and Poisson's ratio. Two l-inch-gage-length optical extensometers were attached in the axial direction to opposite sides of the test section for strain measurement. Simultaneous strain and load readings taken at regular increments of both increasing and decreasing load provided the information nece~sary to plot the stress-strain curve from which the elastic modulus was determined by averaging the slope of the straightline portions of this curve. The optical strain gages were then removed from the test section and replaced with the specially designed diametral strain-gage fixture for use with optical gages (fig. 3). A similar series of simultane6us load and diametral-strain readings was used to plot this relation. The slope of the straight-line portions of this curve represents the ratio E/~, so that Poisson's ratio ~ can be established from this slope and the previously calculated elastic modulus E. The values of E and ~ (table II) were rounded off to two significant figures.
Fatigue testing. - The fatigue machine was operated manually during the first few cycles of each test to set the platen displacement limit switches (fig. 2) to produce the desired diametral strain range .6.Ed as measured at the test section. Initial loading was chosen to be compressive rather than tensile, because it was much easier to stop deformation of the test section at the desired strain level by manipulation of the pressure regulator. The natural increase of cross-sectional area during compressive flow reduces the required sensitivity of initial load control, whereas the reduction of area associated with tensile deformations increases the required sensitivity. Also, the initial plastic flow in compression tends to reduce the subsequent sharpness of the "knee" of the virgin stress-strain curve, which makes the control of tensile strains easier. The specimen was first compressed to produce an increase in strain of an amount
~.6.Ed by slowly increasing the oil pressure to the hydraulic cylinder. When
this strain was reached, the compression microsWitch was set to be tripped by the deflection lever. The compression load was removed, and tension was slowly ap-
plied to produce a diametral decrease of strain of ~.6.€d from the initial diam
eter. When this strain was reached, the tension microsWitch was adjusted. Thus, the specimen was strain cycled about a zero mean strain over a strain range of .6.Ed.
5

Automatic operation of the fatigue machine was begun once the limit switches had been positioned so that the deflection lever triggered the switches at the ,desired strain limits as observed with the optical strain gages. Repeated checks were made of strain range throughout the test. Strain softening or strain hardening of the test specimens necessitated minor adjustments in the deflectionlever limit-switch settings in order to maintain constant ~€d. These adjustments were necessary because the limit switches maintained constant displacement between upper and lower die-set platens. The loading rods, grips, and specimen heads were subjected to deflections entirely within the elastic range, but the test section of the specimen flowed plastically, undergoing a gradual change in material properties. Hence, as the test progressed, there was a change in strain distribution; and, in order to maintain a constant strain range at the test section, it was necessary to change the displacement limits between the platens. For a strain-hardening material these limits had to be increased, and for a strain-softening material they had to be decreased. Microswitch adjustments were made whenever the diametral strain range deviated 40 to 80 microinches from the desired value.
Continuous load recordings were taken during the early part of every test. Periodic load measurements were taken thereafter throughout the test in conjunction with the strain measurements. The basic test information periodically recorded throughout each test comprised total diametral strain range ~€d, load range 6P, and number of cycles N. Specimen life was defined as the number of cycles causing separation of the test section.
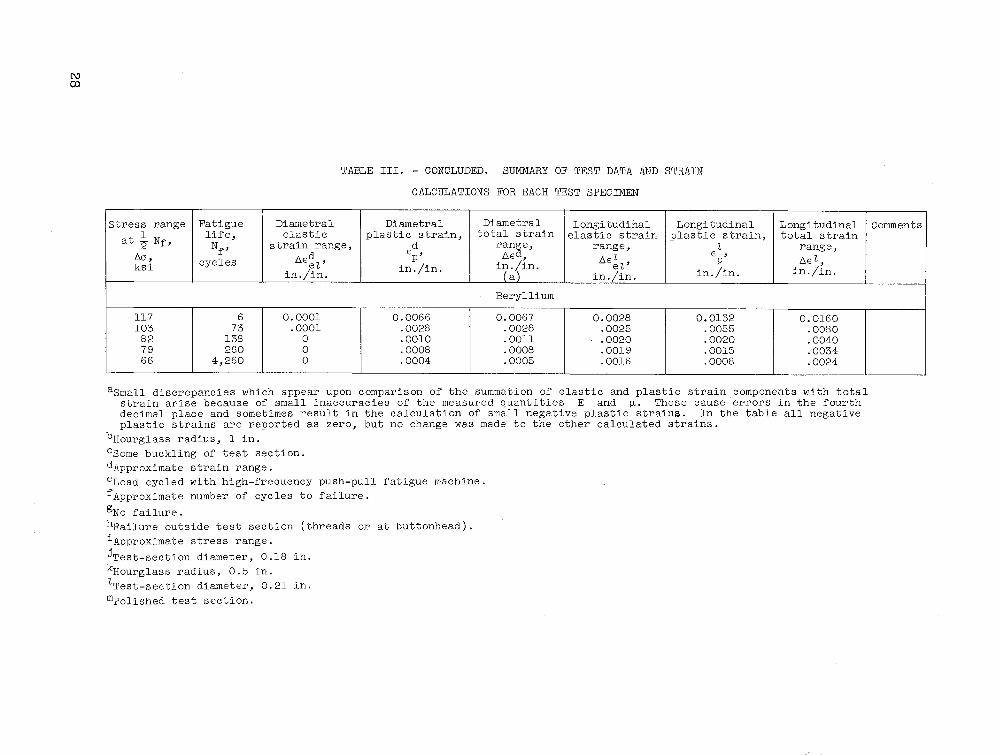
Special precautions, described in appendix B, were taken while testing beryllium to prevent distribution of toxic beryllium dust particles into the air.
RESULTS AND DISCUSSION
The basic test data, descriptive test information, and calculated stresses and strains are tabulated in table III for each fatigue test. Equations used to calculate these various quantities will be discussed later. Information from this table was used to plot most of the curves used in the subsequent analysis.
Cyclic Stress-Strain Relation
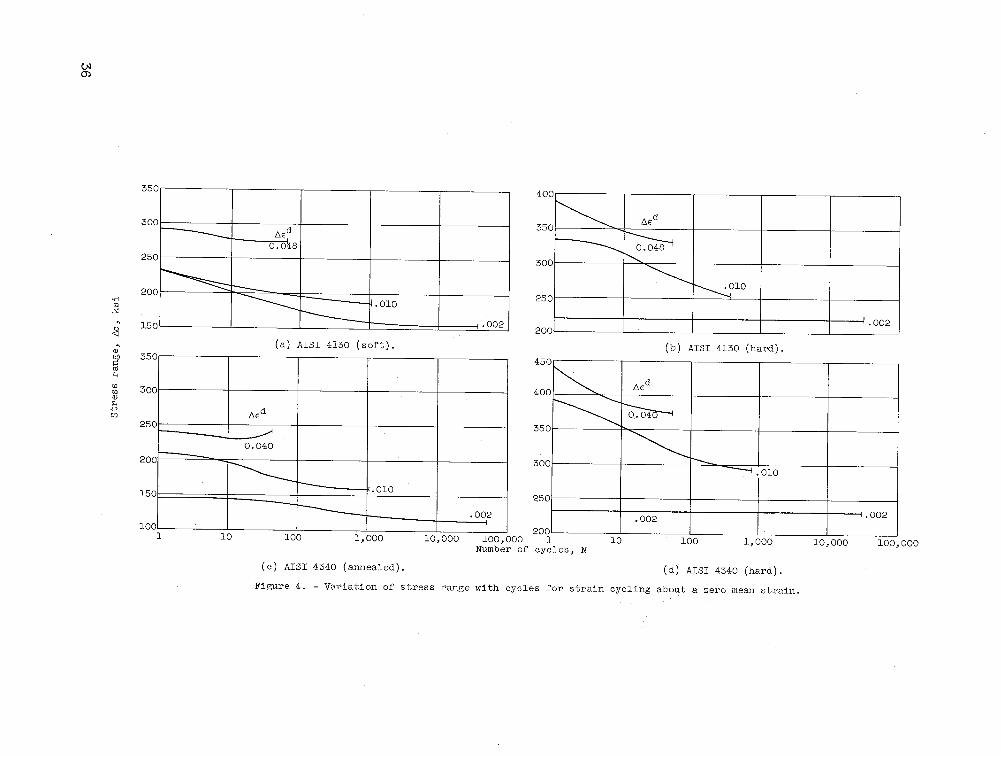
When fatigue specimens are cycled between fixed strain limits, the stress range generally changes during the test. Figure 4 shows the typical variations of stress range ~0 = ~/A with cycles for each of the test materials at three different values of applied strain range (zero mean strain in all cases). One group of materials including the heat-treatable ferritic alloy steels (figs. 4(a) to (e», hardened AM 350 stainless (fig. 4(j», and titanium (6Al-4V) (fig. 4(l) is characterized by a stress range that decreases from the initial value. Since the stress required to produce a fixed strain decreases in successive cycles, and since hardness tests indicate a coincident softening, these materials are described as cyclic strain softening. A second group of materials
6
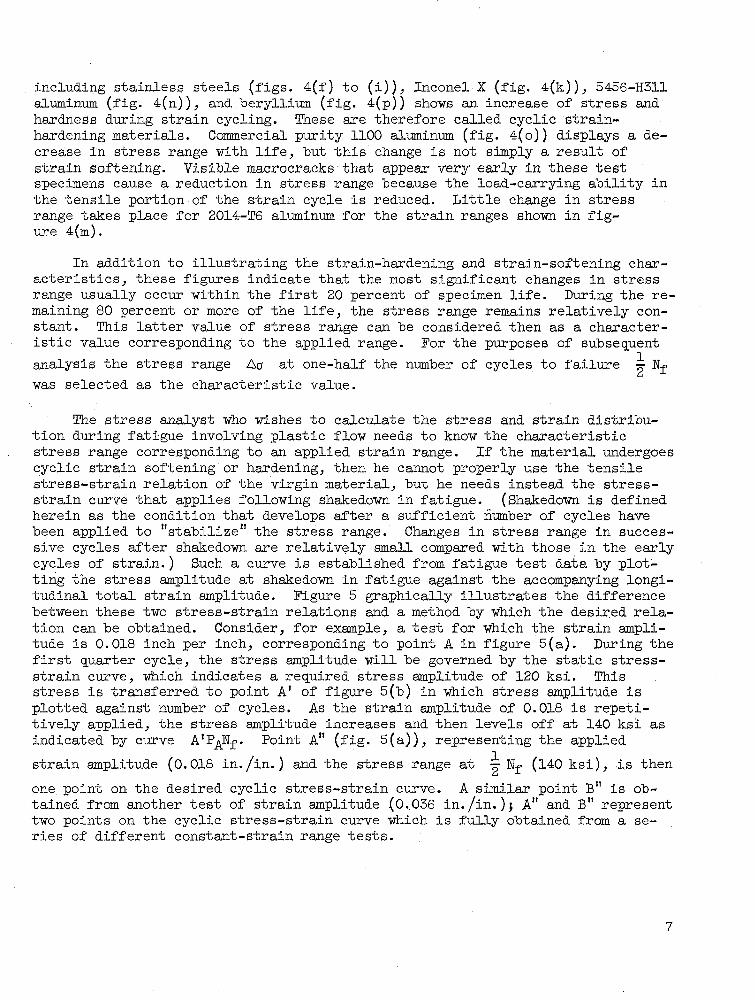
including stainless steels (figs. 4(f) to (i», Inconel X (fig. 4(k», 5456-H311 aluminum (fig. 4(n», and beryllium (fig. 4(p) shows an increase of stress and hardness during strain cycling. These are therefore called cyclic strain .. hardening materials. Commercial purity 1100 aluminum (fig. 4(0» displays a decrease in stress range with life, but this change is not simply a result of strain softening. Visible macrocracks that appear very early in these test specimens cause a reduction in stress range because the load-carrying ability in the tensile portion of the strain cycle is reduced. Little change in stress range takes place for 2014-T6 aluminum for the strain ranges shown in fig-ure 4(m).
In addition to illustrating the strain-hardening and strain-softening characteristics, these figures indicate that the most significant changes in stress range usually occur within the first 20 percent of specimen life. During the remaining 80 percent or more of the life, the stress range remains relatively constant. This latter value of stress range can be considered then as a characteristic value corresponding to the applied range. For the purposes of subsequent
analysis the stress range 6a at one-half the number of cycles to failure ~ Nf was selected as the characteristic value.
The stress analyst who wishes to calculate the stress and strain distribution during fatigue involving plastic flow needs to know the characteristic stress range corresponding to an applied strain range. If the material undergoes cyclic strain softening or hardening, then he cannot properly use the tensile stress-strain relation of the virgin material, but he needs instead the stressstrain curve that applies following shakedown in fatigue. (Shakedown is defined herein as the condition that develops after a sufficient number of cycles have been applied to IIstabilize ll the stress range. Changes in stress range in successive cycles after shakedown are relatively small compared with those in the early cycles of strain.) Such a curve is established from fatigue test data by plotting the stress amplitude at shakedown in fatigue against the accompanying longitudinal total strain amplitude. Figure 5 graphically illustrates the difference between these two stress-strain relations and a method by Which the desired relation can be obtained. Consider, for example, a test for which the strain amplitude is 0.018 inch per inch, corresponding to point A in figure 5(a). During the first quarter cycle, the stress amplitude will be governed by the static stressstrain curve, which indicates a required stress amplitude of 120 ksi. This stress is transferred to point AI of figure 5(b) in which stress amplitude is plotted against number of cycles. As the strain amplitude of 0.018 is repetitively applied, the stress amplitude increases and then levels off at 140 ksi as indicated by curve A'PANf • Point A" (fig. 5(a»), representing the applied
strain amplitude (0.018 in. lin.) and the stress range at ~ Nf (140 ksi) ,is then
one point on the desired cyclic stress-strain curve. A similar point B" is obtained from another test of strain amplitude (0.036 in. lin.); All and B" represent two points on the cyclic stress-strain curve which is fully obtained from a series of different constant-strain range tests.
7

Data necessary to plot the cyclic stress-strain curve (in terms of stress amplitude 0a against longitudinal strain amplitude €~) are readily calculated using the applied diametral strain range 6€d and the stress range 60 at 1 2 Nf · It was observed during zero mean strain fatigue testing that the maximum
compressive and tensile stresses during anyone cycle remained approximately equal to one another throughout the test. In other words, cyclic strain hardening or softening affected the peak tensile or compressive stresses equally, and the mean stress throughout a test was zero. By definition
(1)
where
applied load range at
A cross-sectional area
Total mechanical strain amplitudes €l and €~ are equal to the sum of the elastic and plastic strain components when creep and anelastic strains are negligi ble . Thus,
€Z a = €Z
eZ + €Z p (2a)
• €d €d + €d == a eZ p (2b)
where
€~Z longitudinal elastic strain amplitude
€l longitudinal plastic strain p
€~2 diametral elastic strain amplitude
€d diametral plastic strain p
Also,
(3a)
(3b)
8

where E is the elastic modulus and ~ is Poissonts ratio. The plastic term €~ must be related to ~€d through the total plastic diametral strain€~. Figure·6 illustrates stresses and diametral strain components for a typical stress-strain hysteresis loop during fatigue. The width of this hysteresis loop is the measure of €~. The longitudinal plastic strain €~ is equal in magni-tude to twice €~ (since volume is conserved during plastic flow) and is opposite in sign, alternating each cycle from tension to compression. Since comparison is desired with the tensile stress-strain curve, only positive strains need be considered. Hence,
(4a)
(4b)
(4c)
By substituting equations (3a) and (4c) into (28.), the desired relation is obtained:
(5 )
The cyclic stress-strain relation was established for each material by plotting 0a against €~ as shown in figure 7. This curve defines the shakedown stress amplitude that accompanies a given strain limit during strain cycling loading. It is readily apparent, on comparison with the virgin tensile data, that very appreciable changes to the stress-strain relation are caused by cyclic straining. These figures also reveal cyclic strain-softening and strainhardening behavior by the vertical displacement of the fatigue curve from the static tensile curve. Strain-softening materials exhibit a larger percentage reduction of stress at 1- or 2-percent strain (corresponding to intermediate life) than at 7- or 8-percent strain (corresponding to very short life). Apparently the softening characteristics are counteracted somewhat by large values of applied strain. On the other hand) strain-hardening materials tend to have a greater increase of stress at the larger strains.
Great differences exist between the stress-strain curves of initially annealed (or soft) and hardened conditions of an alloy. Figure 7 shows that strain-cycling fatigue causes the cyclic stress-strain relations for the two initial hardness conditions to become much more alike. This effect is most pronounced for materials that are customarily hardened by working such as AISI 304 and AM 350) though it does occur to a lesser degree with heat-treatable steels such as AISI 4130 and 4340.
9

Although the degree of softening or hardening varies somewhat with applied strain, an approximate comparison of materials with respect to these characteristics can be made by evaluating the ratio of the shakedown stress in fatigue at a gi ven strain range to the virgin tensile stress at a corresponding value of strain. This ratio is less than unity for cyclic strain softening and greater than unity for cyclic strain hardening. Table IV lists this ratio, calculated at I-percent strain, for each material (in order of increasing value). A fair correlation exists between the degree of softening or hardening and the parameter au/ays (ultimate tensile strength 0u divided by the conventional 0.2-percent offset yield strength ays ' fig. 8). All materials for which au/oys = 1.2 or less softened under cyclic straining and those for which 0u/OyS = l.4 or greater strain hardened. At intermediate values, 1.2 < 0u/Oys < 1.4, both hardening and softening were observed. This correlation may serve as a guide for estimating from tensile test data the degree of hardening or softening that may be expected in the absence of the requisite fatigue data.
The practical use of cyclic stress-strain relations in conjunction with the strain-life relations, which will be discussed next, for the application to the solution of practical problems is demonstrated in reference 8.
Relation of Life to Total Strain and to Elastic
and Plastic Components
For the most general of design applications, it is necessary to know the relation of fatigue life to both the total mechanical strain and the elastic and plastic components of this strain. Basic experimental strain-life test data are necessary also to evaluate and devise methods of predicting fatigue life and to obtain a better understanding of notch behavior in fatigue. ~hese purposes are served by the experimental strain-life data shown for each test material in figure 9. Plotted on log-log coordinates are the elastic strain range ~E~l' plastic strain E~' and total strain range ~El against Nf for each fatigue test. The elastic strain range and the plastic strain component are calculated from the basic data using equations (3a) and (4c), respectively. The total strain range ~l equals the sum of these elastic and plastic components.
Some general observations can be made about the behavior of the various strain data. The plastic strain, for example, has a magnitude many times that of ·the elastic strain range at short life, but it decreases rapidly with increasing life to become negligible in comparison with 6E~l at long life. This is true for all the test materials except in the long-life region for AlSI 304 ELC annealed and AM 350 annealed (figs. 9(f) and (i)), where the plastic strain remains a significant quantity though less than the elastic component. l The relative tolerance of different materials to plastic strain in the short-life region seems
IThe anomalous behavior of these strongly strain hardening stainless steels, as well as the delayed hardening of these steels at the low strain levels (figs.
10

to correlate ~uite directly with the tensile ductility. Those materials with larger ductilities such as 1100 aluminum and AlSI 304 annealed withstand a greater plastic strain for a given life than those with low ductilities such as beryllium and Inconel X.
Figure 9 also indicates that a log-log representation of plastic strain against fatigue life for most materials can be fitted well with a straight line (again except for the annealed states of AISI 304 ELC and AM 350). In determining the least-squares straight-line fit shown in figure 9, all data were used except those for fatigue lives less than 10 cycles and those for which the plastic strain is less than one-half the elastic strain range. The former exclusion is made because, under these large load and plastic flow conditions, bending in the test section often takes place or the diametral strain-gage fixture often indents the test section or both. The strain and load readings for these very short lives, therefore, may be open to some question. The latter exclusion is made because any error of fixed magnitude that enters into the calculated plastic strain becomes an increasingly larger percentage of the strain as it decreases to low' values. Therefore, for the purposes of subsequent detailed analysis (ref. 10) the line was fitted to the more representative data. It is obvious that empirical mathematical relations such as this straight-line correlation may work out very well in the short-life region where the plastic strain is large. However, for small values of plastic strain, on the order of 0.001 inch per inch or less, large errors in predicted life may result because of the uncertainty of the straight-line extrapolation into this region and because of uncertainties in E, ~, and other factors that enter into the €p calculation. Consequently, such a method, at best, would be limited to a maximum life of about 800 cycles for materials like AM 350 (hard) or 4000 cycles for those like AlSI 52100.
The elastic strain range, unlike the plastic strain, never decreases to dimini shingly small values that are impossible to measure or calculate accurately. Hence, it could be practical to relate fatigue life with the elastic strain (or stress) over the entire life span. This might be done in a way similar to that used for the plastic component, that is, by also fitting the elastic data with a single straight line. For many of the test materials such a correlation represents the data well over the range investigated, but for others there is a tendency for the data points to falloff such a line in either the long- or shortlife region. The straight lines fitted to the elastic strain data of figure 9 represent the least-squares fit of all failure data except those cases in the short-life region where the elastic strain is less than one-half of the plastic strain. This straight-line method of representation again was chosen for purposes used in reference 10 in which equations representing the elastic and plastic components are summed up to develop a relation between total strain range and
4(f) and (i)), appears to be associated with the transformation of austenite to the body-centered lattice that takes place during cyclic strain fatigue (ref. 9). The transformation, which is evidenced by an increase in magnetic properties during the test, proceeds at a much slower rate at the lower strain levels than the high. It appears to go to completion at high strain levels (as evidenced by magnetic properties and stress range behavior) well before specimen failure, but only partial transformation is accomplished at failure under low strain levels.
11

cyclic life. Such relations provide the designers with complete information concerning stress, strain, and fatigue life.
Figures 9(a) to (p) also demonstrate the behavior of total longitudinal strain range with cyclic life for the test materials. In most cases ~EZ decreases very rapidly with increasing Nf in the short-life region and then changes much less rapidly in the intermediate life region. This behavior of total strain reflects, of course, the overriding effect that the plastic strain component has upon total strain in the short-life region and the predominant effect the elastic strain component has in the longer life region. By adding together, at a given life, the strain values denoted by the straight-line correlation of the elastic and plastic strain components the corresponding correlating line for total strain can be determined. This line represents test data well for most of the materials, indicating that the total strain against life relations can be obtained by summing up the elastic and plastic components as approximated by straight-line relations. The biggest exceptions occur in the longer life region of the annealed states of AlSI 304 and AM 350, which is apparently due to the previously mentioned transformation that takes place in these materials.
Relative Performance of Materials
Comparison on basis of diametral strain range. - Figure 10 illustrates the effect of diametral strain range ~Ed on fatigue life for all the materials where this was the independent test variable. At a specific life the spread in 6Ed is greatest in the short-life region, becomes small at about 10,000 cycles, and then becomes fairly large again in the long-life region. A close examination of the data reveals that the relative standings of materials change with Nf . For example, 1100 aluminum and AlSI 4130 (soft) steel withstand the greatest 6 Ed for short lives, but they rate among the poorest at long life. Conversely, AM 350 (annealed) shows up poorly at short life, but it is one of the best for fatigue lives of 105 to 106 cycles. Table V, derived from this figure, makes a detailed comparison of the diametral strain range capability for the various materials at fatigue lives of 100, 3000, and 100,000 cycles. The strain range capability of the best material is about 6 times that of the poorest at 100 cycles,
only l~ times greater at 3000 cycles, and 3 times greater at 100,000 cycles. The change in relative ratings in going from short to long life is plainly evident. Titanium (6Al-4V) is an exception to the general trend since it ranks as one of the better strain-resisting materials over the complete life range.
The fact that the relative strain-cycling performance of materials changes with Nf is due to their different tolerances to plastic strain and elastic strain (or stress). In the short-life region the materials with the greatest plastic strain absorbing capacity (most ductile) will show up best, and in the long-life region generally those with the greatest elastic strain absorbing capacity (best endurance limit) will excel. For moderate life, 1000 to 10,000 cycles, the better materials are those with the best combination of plastic plus elastic strain capacity.
12
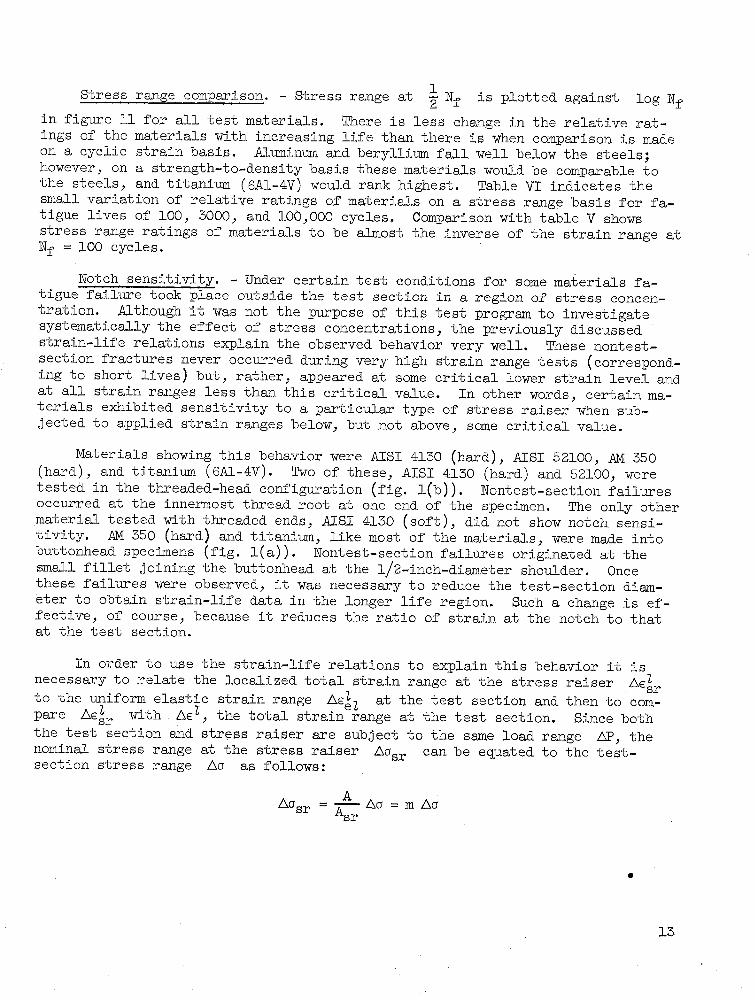
Stress range comparison. - Stress range at is plotted against log Nf in figure 11 for all test materials. There is less change in the relative ratings of the materials with increasing life than there is when comparison is made on a cyclic strain basis. Aluminum and beryllium fall well below the steels; however, on a strength-to-density basis these materials would be comparable to the steels, and titanium (6Al-4V) would rank highest. Table VI indicates the small variation of relative ratings of materials on a stress range basis for fatigue lives of 100, 3000) and 100,000 cycles, Comparison with table V shows stress range ratings of materials to be almost the inverse of the strain range at Nf = 100 cycles.
Notch sensitivity. - Under certain test conditions for some materials fatigue failure took place outside the test section in a region of stress concentration. Although it was not the purpose of this test program to investigate systematically the effect of stress concentrations) the previously discussed strain-life relations explain the observed behavior very well. These nontestsection fractures never occurred during very high strain range tests (corresponding to short lives) but) rather, appeared at some critical lower strain level and at all strain ranges less than this critical value. In oth~r words, certain materials exhibited sensitivity to a particular type of stress raiser when subjected to applied strain ranges below, but not above) some critical value.
Materials showing this behavior were AlSI 4130 (hard») AlSI 52100) AM 350 (hard), and titanium (6Al-4V). Two of these) AISI 4130 (hard) and 52100) were tested in the threaded-head configuration (fig. l(b). Nontest-section failures occurred at the innermost thread root at one end of the specimen. The only other material tested with threaded ends) AlSI 4130 (soft») did not show notch sensitivity. AM 350 (hard) and titanium) like most of the materials, were made into buttonhead specimens (fig. l(a»). Nontest-section failures originated at the small fillet joining the buttonhead at the 1/2-inch-diameter shoulder. Once these failures were observed) it was necessary to reduce the test-section diameter to obtain strain-life data in the longer life region. Such a change is effective) of course) because it reduces the ratio of strain at the notch to that at the test section.
In order to use the strain-life relations to explain this behavior it is necessary to relate the localized total strain range at the stress raiser ~€~r to the uniform elastic strain range l::,.€~ 1- at the test section and then to compare l::,.€~r with ~El) the total strain range at the test section. Since both the test section and stress raiser are subject to the same load range .6P) the nominal stress range at the stress raiser l::,.asr can be equated to the testsection stress range ~a as follows:
~a sr = AA ~a = m ~a sr
•
13

where
A cross-sectional area at test section
Asr cross-sectional area at stress raiser (thread root or shoulder)
m A/Asr ' a constant for a given specimen configuration
Localized total strain range at the stress raiser ~€2 is assumed to be approximately e~ual to the elastically computed strain ran~~ at this point multiplied by the elastic stress concentration factor k. This is a commonly used assumption that is sufficiently accurate for the present purpose. The total strain range at the stress raiser ~€~r can then be related to the elastic strain range at the test section ~€~2:
where C is a constant e~ual to kIn.
If C is less than unity, the total strain range at the stress raiser is less than the elastic strain range at the test section and therefore must be less than the total strain range at the test section. Conse~uently, for C < 1, failure must occur at the test section. When C is greater than unity, the total strain range at the stress raiser is greater than the elastic strain range at the test section, and therefore mayor may not be greater than the total strain range at the test section. Location of failure is dependent upon which of these total strain ranges is the larger. For this latter case consider figure 12, which presents elastic and total strain range as a function of life for AlSI 52100 steel. A dotted line is drawn parallel to the elastic strain range line but is vertically displaced by the factor C = 1.5 to represent a hypothetical localized total strain at the thread root ~€1r = 1.5 ~€~2' This line intersects the testsection total strain range line at 700 cycles. For lives less than 700 cycles, ~€2 is greater than ~€2 ; conse~uently, failure is expected at the test sec-sr tion. For lives greater than 700 cycles, f:,.€~r is greater than ~€2, and frac-ture should take place at the notch. Qualitatively, this is the type of behavior that was observed in the abovementioned materials.
These strain-life relations can be used further to make comparisons of the relative notch sensitivities of all test materials. An effective way of doing this is to compare characteristic strain ratio curves in which the ratio of total strain range divided by elastic strain range at the test section ~€2/~€~2 (obtained from the strain-life test data) is plotted against log Nf , as has been done in figure 13 for the three materials tested in the threaded-head configuration. Now, whenever the total strain at the stress raiser is less than that at the test section, failure should occur at the test section. In other words, if ~€~r/~€~2 = C is less than the characteristic strain ratio ~€2/~€~2' failure
14

takes Flace at the test section; if C is greater than the characteristic strain ratio, failure takes Flace at the stress raiser. As an examFle, consider again the hypothetical case where C = 1.5; that is, the total strain range at the
stress raiser is ~ times the elastic strain range at the test section. The or-2
dinate on the right side of the graph is used to represent ~€~r/~€!z = C, which, for a sFecific sFecimen geometry, is a fixed value independent of Nf' The dashed line at C = 1.5 intersects the strain ratio - life curve of AlSI 52100 steel at about 700 cycles. If failure is to occur anywhere in the specimen at less than 700 cycles, it should take place in the test section because ~€Z is greater than ~€~r in this life region. If failure occurs at more than 700 cycles, it should take place at the stress raiser since ~€k exceeds !::J.€Z in this region. This intercept occurs at about 7000 cycles for AlSI 4130 (hard) and 17,000 cycles for AlSI 4130 (soft). The value of life at which this transition from test-section to stress-raiser-type failure occurs is then a measure of fatigue notch sensitivity. Notch sensitivity decreases with increasing values of IItransition ll life.
These characteristic strain ratio curves indicate that AlSI 52100 would be more notch sensitive than AlBI 4130 (hard), which in turn is more notch sensitive than AlBI 4130 (soft) regardless of C, since the curves do not cross on~ another. Tests results for the standard 0.25-inch-diameter test section substantiate this observation. The least number of cycles causing a thread failure was 225 for AlSI 52100 steel and 15,500 for AlSI 4130 (hard). No thread failures took place in AlSI 4130 (soft) even for fatigue lives exceeding one million cycles. Similar characteristic strain ratio comparisons (fig. 14) for the materials tested in the buttonhead configuration indicate for 1 < C < 1.2 that nontest-section failures should occur at the lowest life for AM 350 (hard) and next lowest life for titanium. Experiment indicated buttonhead failures in as few as 23,200 cycles for AM 350 (hard) and 192,000 cycles for titanium. No such failures developed in the other materials.
A more quantitative aPFlication of this analysis could not be accurately applied to these data for several reasons. First, the value of stress concentration factor k is not accurately known. Roark (ref. 11) quotes k for similar configurations; however, he does not give the values for geometries as severe as those used. Second, this method of analysis should be useful for the prediction of the initiation of a fatigue crack at the stress raiser, but not necessarily for the prediction of complete separation of the entire specimen cross section. Crack propagation may have an appreciable effect upon life, depending uFon the duration of the macrostage of crack growth (ref. 12, PF. 22-25). The appearance of test-section fracture surfaces indicated that the size of the fatigued area was less for high-yield-strength materials than for low; also the fatigued area for a given material tended to be less at high strain levels than at low levels. The quantitative analysis can be particularly difficult when C is close to unity for these reasons and other reasons such as the uncertainty in the ~€Z/~€lz ratio and the material effect upon the k value.
15

CONCLUSIONS
The following conclusions are based upon extensive strain-cycling tests about a zero mean strain and apply to AlSI 4130 (soft and hard conditions), AlSI 4340 (annealed and hard), AlSI 52100 (hard), AlSI 304 ELC (annealed and hard), AlSI 310 (annealed), AM 350 (annealed and hard), Inconel X, titanium (6Al-4V), 20l4-T6, 5456-H3ll, and 1100 aluminum, and beryllium materials:
1. The cyclic stress-strain relations have been established and are shown to be substantially different from the virgin tensile data in many instances.
2. These relations are based upon the general observation that the stress range, following the initial period in which cyclic strain hardening or softening occurred, remains relatively unchanged throughout the majority of the specimen life.
3. A fair correiation was obtained between the degree of cyclic strain hardening and softening and the ratio of ultimate strength over yield strength. Hardening always took place when this ratio exceeded 1.4, and the softening occurred when the ratio was less than 1.2.
4. The life relation between elastic, plastic, and total strain components has been established. Straight-line fits of the logarithmic elastic strain-life and plastic strain-life data, when summed together, provide good agreement with the total strain range - life data for metallurgically stable materials.
5. The test data can be used to evaluate relative performance of all test materials both on a strain range and stress range basis over a life span of a few cycles up to one million cycles.
6. In general, the materials with the better total strain-absorbing capacity at low life (100 cycles or less) were among the poorest at high life (100,000 cycles or more). Titanium (6Al-4V), which had good performance throughout the entire life span, was an exception to this behavior.
7. The strain-life relations can be used to explain the changes in susceptibility to stress concentrations over a large life span and to rate correctly the relative notch sensitivities of the four test materials that experienced nontestsection failures in comparison with the other test materials.
Lewis Research Center
16
National Aeronautics and Space Administration Cleveland, Ohio, October 10, 1962

APPENDIX A
SYMBOLS
A cross-sectional area of test section, s~ in.
C dimensionless constant
E modulus of elasticity, Ibjs~ in.
k stress concentration factor
m area ratio
N number of cycles
Nf
number of cycles to failure
bP load range, Ib
€ strain, in.jin.
~€ strain range, in.jin.
~ Poissonts ratio
o stress, Ibjs~ in.
~0 stress range, Ibjs~ in.
Subscripts:
a amplitude
e"L elastic component of total strain
f fracture
max maximum value during a fatigue cycle \
min minimum value during a fatigue cycle
p plastic component of total strain
srat stress raiser
u ultimate
ys O.2-percent offset yield strength
17

Superscripts:
d diametral
I longitudinal
18
APPENDIX B
PRECAUTIONS TAKEN DURING BERYLLIUM TESTING
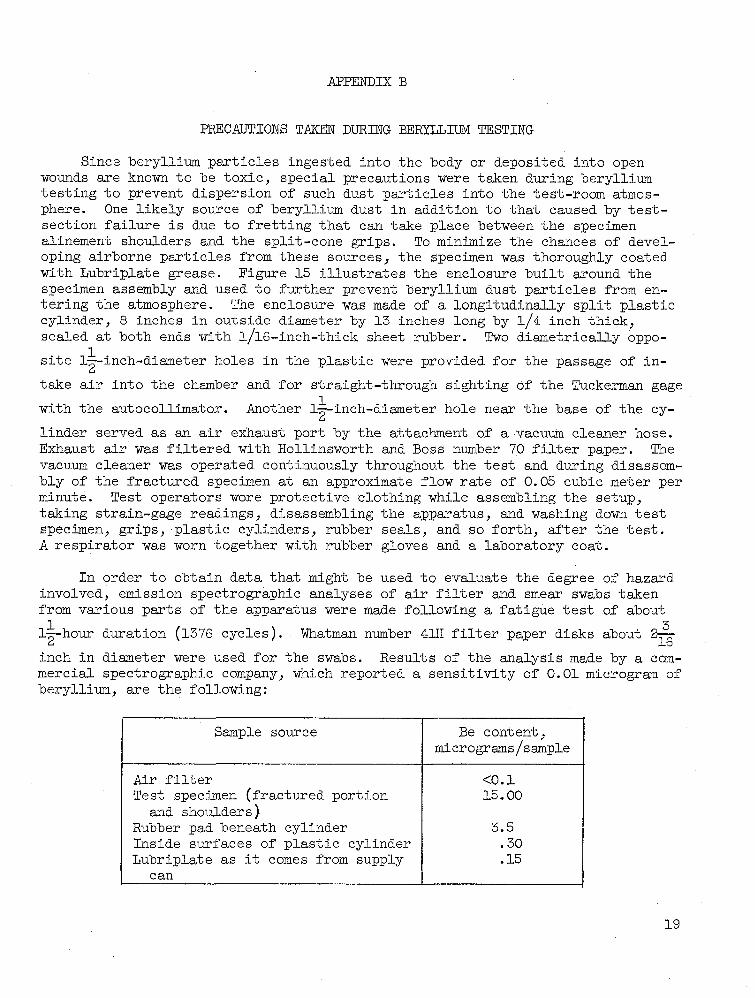
Since beryllium particles ingested into the body or deposited into open wounds are known to be toxic) special precautions were taken during beryllium testing to prevent dispersion of such dust particles into the test-room atmosphere. One likely source of beryllium dust in addition to that caused by testsection failure is due to fretting that can take place between the specimen alinement shoulders and the s~lit-cone grips. To minimize the chances of developing airborne particles from these sources) the s~ecimen was thoroughly coated with Lubriplate grease. Figure 15 illustrates the enclosure built around the specimen assembly and used to further prevent beryllium dust particles from entering the atmosphere. The enclosure was made of a longitudinally split plastic cylinder) 8 inches in outside diameter by 13 inches long by 1/4 inch thick) sealed at both ends with 1/16-inch-thick sheet rubber. Two diametrically oppo-
site l~-inch-diameter holes in the plastic were provided for the passage of in
take air into the chamber and for straight-through sighting of the Tuckerman gage
with the autocollimator. Another l~-inch-diameter hole near the base of the cy
linder served as an air exhaust port by the attachment of a vacuum cleaner hose. Exhaust air was filtered with Hollinsworth and Boss number 70 filter pa~er. The vacuum cleaner was operated continuously throughout the test and during disassembly of the fractured specimen at an approximate flow rate of 0.05 cubic meter per minute. Test operators wore protective clothing while assembling the setup) taking strain-gage readings) disassembling the apparatus) and washing down test specimen) grips) plastic cylinders) rubber seals) and so forth) after the test. A respirator was worn together with rubber gloves and a laboratory coat.
In order to obtain data that might be used to evaluate the degree of hazard involved) emission spectrographic analyses of air filter and smear swabs taken from various parts of the apparatus were made following a fatigue test o£ about
l~ hour duration (1376 cycles). Whatman number 4lH filter paper disks about 2~6 inch in diameter were used for the swabs. Results of the analysis made by a commercial spectrographic company) which reported a sensitivity of 0.01 microgram of beryllium) are the following:
Sample source Be content) micrograms/sample
Air filter <0.1 Test specimen (fractured portion 15.00
and shoulders) Rubber pad beneath cylinder 3.5 Inside surfaces of plastic cylinder .30 Lubriplate as it comes from supply .15
can
19

The amount of beryllium trapped out from the exhausted air is low, and, with further substantiating data, might indicate that the respirator and specimen enclosure is not necessary. The greater amounts of apparently larger beryllium particles found on the greased specimen and the rubber pad suggest that a careful cleanup after each test is desirable,
20

REFERENCES
1. Manson, S. S.: Behavior of Materials Under Conditions of Thermal Stress. NACA Rep. 1170,1954. (Supersedes NACA TN 2933, 1953.)
2. Coffin, L. F., Jr. z A Study of the Effects of Cyclic Thermal Stresses on a Ductile Metal. Trans. ASME, vol. 76, no. 6, Aug. 1954, pp. 931-949; discussion, pp. 949-950.
3. Coffin, L. F., Jr.: Design Aspects of High Temperature Fatigue with Particular Reference to Thermal Stresses. Trans. ASME, vol. 78, no. 3, Apr. 19S6, pp. 527-532.
4. KOOistra, L. F.: Effect of Plastic Fatigue on Pressure Vessel Materials and Design. Welding Jour. {Welding Res. Supplement), vol. 36, Mar. 1957, pp. 120S-130S.
5. Manson, S. S.: Thermal Stresses in Design. Ft. 19 - Cyclic Life of Ductile Materials. Machine Design, vol. 32) no. 14, July 7, 1960, pp. 139-144.
6. Manson, S. S.: Thermal Stresses in Design. Ft. 20 - Thermal Cycling with Steady Stress. Machine Design, vol. 32, no. 15, July 21, 1960, pp. 161-167.
7. Langer, B. F.: Design of Pressure Vessels for Low-Cycle Fatigue. Paper 6l-WA-18, ASME, 1961.
8. Manson, S. S.: Thermal Stresses in Design. Ft. 18. Working Stresses for Ductile Materials. Machine Design, vol. 32, no. 13, June 23, 1960, pp. 153-159. (See also pt. 19, vol. 32, no. 14, July 7,1960, pp. 139-144.)
9. Brick, R. M., and Phillips, Arthur! structure and Properties of Alloys. McGraw-Hill Book Co., Inc., 1942, p. 160.
10. Tavernelli, J. F., and Coffin, L. F., Jr.: Experimental Support for Generalized Equation Predicting Low-Cycle Fatigue (Discussion by S. S. Manson). Jour. Basic Eng. (Trans. ASME), sere D, vol. 84, no. 4, Dec. 1962, pp. 537-541.
11. Roark, Raymond Jefferson: Formulas for Stress and Strain. Third ed., McGraw-Hill Book Co., Inc., 1954, pp. 348; 353.
12. Smith, Robert W., and Smith, Gordon T.: Thermal-Fatigue Crack-Growth Characteristics and Mechanical Strain Cycling Behavior of A-286, Discaloy, and 16-25-6 Austenitic Steels. NASA TN D-479, 1960.
21
ro ro
TABLE I. - MATERIAL DESCRIPTION
Material
AISI 4130 (soft)
AISI 4130 (hard)
AISI 4340 (annealed)
AISI 4340 (hard)
AISI 52100
AISI 304 ELC (annealed)
AISI 304 ELC (hard)
AISI 310 (annealed)
AM 350 (annealed)
AM 350 (hard)
Inconel X
Titanium (6Al-4V)
2014-T6 aluminum
5456-H311 aluminum
1100 aluminum
Beryllium
Nominal composition, percent
C 0.30, Mn 0.50, P 0.040, S 0.040, Si 0.28, Cr 0.95, Mo 0.20, Fe remainder
Same heat as above
C 0.40, Mn 0.70, P 0.040, S 0.040, Si 0.28, Ni 1.82, Cr 0.80, Mo 0.25, Fe remainder
Same heat as above
C 1.02, Mn 0.35, P 0.025, S 0.025, 8i 0.28, Cr 1.45, Fe remainder
a C 0.026, Mn 0.45, P 0.03, S 0.014, Si 0.40, Cr 18.67, Ni 8.50, Mo 0.02, Cu 0.10, Fe remainder
Same heat as above
C 0.25 max., Mn 2.00 max., Si 1.50 max., Cr 25.0, Ni 20.5, Fe remainder
C 0.10, Mn 0.75, Si 0.35, Cr 16.50, Ni 4.25, Mo 2.75, N 0.10, Fe remainder
Same heat as above
C 0.04, Mn 0.70, Si 0.30, Cr 15, Cb 1, Ti 2.5, Al 0.9, Fe 7, Ni remainder
C 0.029, Fe 0.22, N2 0.017, Al 6.1, V 4.0, H2 0.007, Ti remainder
Si 0.85, Fe 1.0, Cu 4.5, Mn 0.80, Mg 0.50, Cr 0.10 max., Zn 0.25 max., Ti 0.15 max., Al remainder
Si + Fe 0.40 max., Cu 0.10 max., Mn 0.75, Mg 5.1, Cr 0.12, zn 0.25, Ti 0.20, Al remainder
Si + Fe 1.0, Cu 0.20 max., Mn 0.05 max., Zn 0.10, Al remainder
C 0.15 max., Mg 0.08 max., Si 0.12 max., Al 0.16 max., Fe 0.18 max., BeO 2.0 max., Be 98.0 min., other metal 0.04 max.
aActual analysis.
Condition
17000 F; 1/2 hr in salt, water quench 12000 F; 1/2 hr in salt, air cool
16000 F; 1/2 hr in salt, water quench 7500 F; 1 hr in salt, air cool
Hot rolled and annealed by supplier
15200 F; 1/2 hr in salt, water quench 8000 F; 2 hr in salt, air cool
16500 F; 1 hr in salt, air cool to room temp. 15350 F; 1 hr in salt, oil quench to 1800 F Immediately temper 3200 F, 35-min total
time, air cool 7750 F; I-hr total time in salt, air cool
Hot rolled and annealed by supplier
Cold drawn by supplier
Hot rolled, pickled, and annealed by supplier
Hot rolled, pickled, and annealed by supplier
Cold drawn 25-35% reduction by supplier
21000 F 4 hr, air cool 15500 F 24 hr, air cool 13000 F 20 hr, air cool
Centerless ground, solution treated, and aged by supplier
Bar stock as received
Bar stock as received
Bar stock as received
Vacuum hot-pressed QMV beryllium
Hardness, Rockwell -
C-25 to 27
C-39 to 40
C-22 to 24
C-44
C-52 to 53
B-82 to 84
C-34 to 36
B-75 to 81
C-50 to 52
C-34 to 35
C-40 to 41
B-81 to 84
B-56
BRN -26
B-75 to 90

[\) CfI
TABLE II. - MECHANICAL AND ELASTIC
PROPERTIES OF TEST MATERIALS
[Data represent the average of three test specimens unless otherwise specified. 1
Material Yield strength Ultimate Fracture 0.2-percent strength, strength,
offset strength, au' af
, a ys , ksi ksi ksi
4130 r0ftl 113 130 245 4130 hard 197 207 302 4340 ann. 92 120 174 4340 hard 199 213 278 52100 279 292 323
304 ELC ~ann. ~ 3.7 108 278 304 ELC hard 108 138 295
310 tnn.j 32 93 197 350 ann. 64 191 339 350 hard 270 276 328
Inconel X 102 176 219 Titanium 172 179 249 2014-T6 Al 67 74 91 5456-H311 Al 34 58 82 1100 Al 14 16 (b) Beryllium 38 46.9 47.7
a Data for five specimens ranged from 0.08 to 0.38. b
Could not be accurately measured.
Reduction in area, percent
67.3 54.7 43.4 38.1 11.2
74.3 68.8 63.5 52.1 20.3
19.7 41.0 25.0 34.6 87.6 1.7
cAssumed equal to value obtained for other aluminum alloys.
dBeryllium datum from commercial supplier.
True Modulus of ductili ty elas ti ci ty,
E
1.12 32XIO-6
.79 29
.57 28
.48 29
.12 30
1.37 27 1.16 25 1.01 28
.74 28 a. 23 26
.22 31
.53 17
.29 10
.42 10 2.09 cIO
.017 42
Poisson's ratio,
jl.
0.29 .28 .32 .30 .29
.27
.34
.30
.32
.30
.31
.33
.33
.33 ~.33
.024
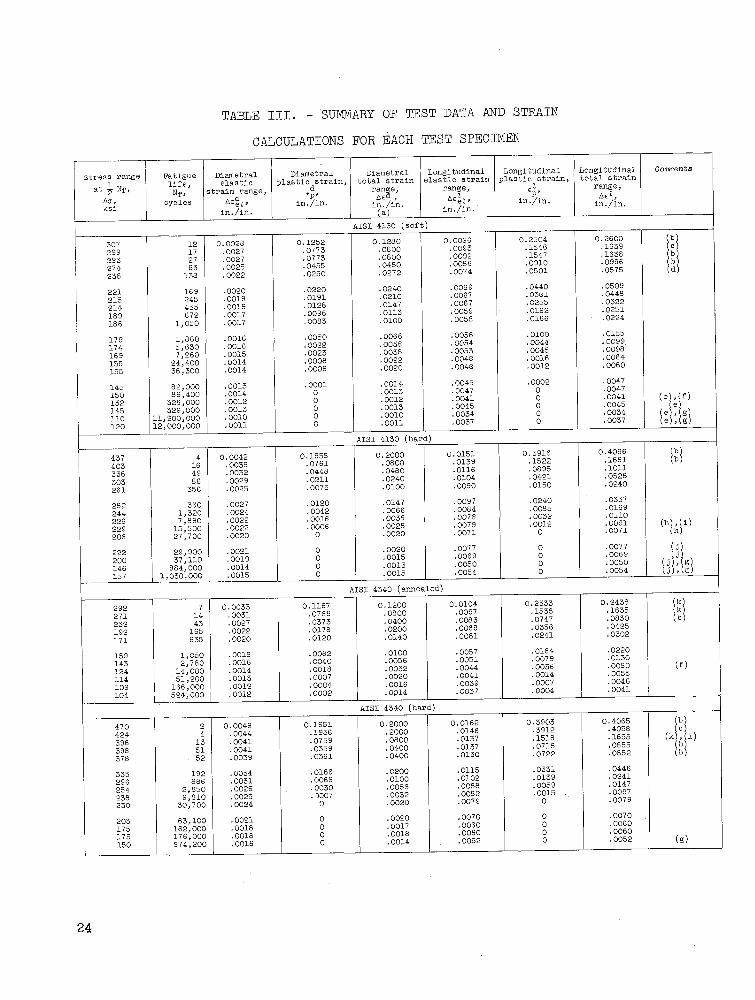
TABLE III. - SUMMARY OF TEST DATA AND STRAIN
CALCULATIONS FOR EACH TEST SPECIMEN
Stress range I Fatigue Diametral Diametral Diametral Longi tudina1 Longitudinal Longi tudina1 Comments
. 1 I life, elastic plastic dstrain, total strain elastic strain plas tl c strain, total strain at '2 Nf, Nf, strain range, range, range, E~, range,
t,a, cycles &E~'L' €p,
6.ed , b.€~'L ' b.e 1., ksi in./in. in·/in. in·/in. in·/in. in·/in. (a) in·/in.
AlSl 4130 (soft)
307 12 0.0028 0.1252 0.1280 0.0096 0.2504 0.2600
Ii! 299 17 .0027 .0773 .0800 .0093 .1546 .1639 293 27 .0027 .0773 .0800 .0092 .1547 .1638 274 63 .0025 .0455 .0480 .0086 .0910 .0996 238 138 .0022 .0250 .0272 .0074 .0501 .0575
221 169 .0020 .0220 .0240 .0069 .0440 .0509 215 245 .0019 .0191 .0210 .0067 .0381 .0448 214 455 .0019 .0128 .0147 .0067 .0255 .0322 189 672 .0017 .0096 .0113 .0059 .0192 .0251 186 1,050 .0017 .0083 .0100 .0058 .0166 .0224
179 1,860 .0016 .0050 .0066 .0056 .0100 .0155 174 5,630 .0016 .0022 .0038 .0054 .0044 .0099 169 7,260 .0015 .0023 .0038 .0053 .0045 .0098 155 24,400 .0014 .0008 .0022 .0048 .0016 .0064 155 36,300 .0014 .0006 .0020 .0048 .0012 .0060
145 82,000 .0013 .0001 .0014 .0045 .0002 .0047 150 86,400 .0014 0 .0013 .0047 0 .0047 132 326,000 .0012 0 .0012 .0041 0 .0041 (el' (f) 145 329,000 .0013 0 .0013 .0045 0 .0045 e) 110 11,200,000 .0010 0 .0010 .0034 0 .0034 f:U~l 120 12,000,000 .0011 0 .0011 .0037 0 .0037
AISl 4130 (hard)
437 4 0.0042 0.1958 0.2000 0.0151 0.3916 0.4066 f~l 403 16 .0039 .0761 .0800 .0139 .1522 .1661 336 49 .0032 .0448 .0480 .0116 .0895 .1011 303 86 .0029 .0211 .0240 .0104 .0421 .0526 261 3.'56 .0025 .0075 .0100 .0090 .0150 .0240
282 360 .0027 .0120 .0147 .0097 .0240 .0337 244 1,320 .0024 .0042 .0066 .0084 .0085 .0169 226 7,890 .0022 .0016 .0038 .0078 .0032 .0110 229 15,500 .0022 .0006 .0028 .0079 .0012 .0091 (h), (i) 206 27,700 .0020 0 .0020 .0071 0 .0071 (h)
222 29,900 .0021 0 .0020 .0077 0 .0077
f j l 200 37,110 .0019 0 .0015 .0069 0 .0069 146 884,000 .0014 0 .0013 .0050 0 .0050 Hl~ ~l 157 1,030,000 .0015 0 .0015 .0054 0 .0054
AlSI 4340 (annealed)
292 7 0.0033 0.1167 0.1200 0.0104 0.2333 0.2438
!~l 271 14 .0031 .0769 .0800 .0097 .1538 .1635 232 43 .0027 .0373 .0400 .0083 .0747 .0830 192 165 .0022 .0178 .0200 .0069 .0356 .0425 171 635 .0020 .0120 .0140 .0061 .0241 .0302
159 1,050 .0018 .0082 .0100 .0057 .0164 .0220 143 2,780 .0016 .0040 .0056 .0051 .0079 .0130 124 14,000 .0014 .0018 .0032 .0044 .0036 .0080 (f) 114 51,200 .0013 .0007 .0020 .0041 .0014 .0055 109 166,000 .0012 .0004 .0016 .0039 .0007 .0046 104 524,000 .0012 .0002 .0014 .0037 .0004 .0041
AISl 4340 (hard)
470 2 0.0049 0.1951 0.2000 0.0162 0.3903 0.4065 I~l 424 4 .0044 .1956 .2000 .0146 .3912 .4058 396 13 .0041 .0759 .0800 .0137 .1518 .1655 (k/, (1) 398 51 .0041 .0359 .0400 .0137 .0718 .0855 ~l 378 52 .0039 .0361 .0400 .0130 .0722 .0852
333 192 .0034 .0166 .0200 .0115 .0331 .0446 296 886 .0031 .0069 .0100 .0102 .0139 .0241 254 2,850 .0026 .0030 .0056 .0088 .0059 .0147 238 9,810 .0025 . )007 .0032 .0082 .0015 .0097 230 30,700 .0024 0 .0020 .0079 0 .0079
203 63,100 .0021 0 .0020 .0070 0 .0070 175 162,000 .0018 0 .0017 .0060 0 .0060 175 176,000 .0018 0 .0018 .0060 0 .0060 150 974,200 .0016 0 .0014 .0052 0 .0052 (g)
24
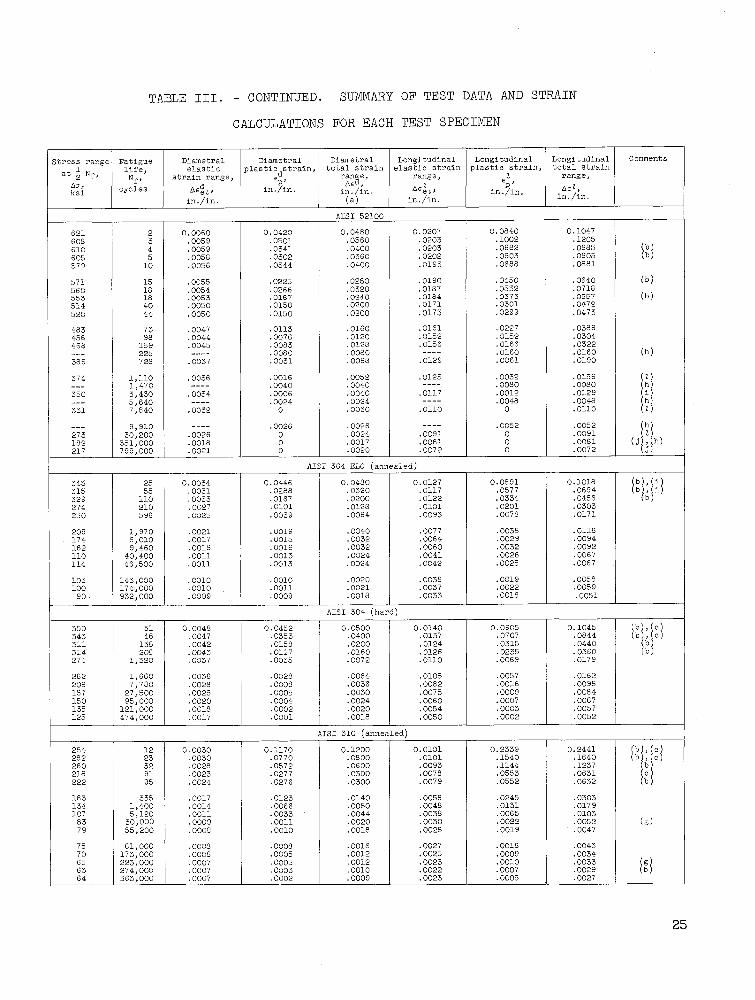
TABLE III. - CONTINUED. SUMMARY OF TEST DATA AND STRAIN
CALCULATIONS FOR EACH TEST SPECIMEN
stress range Fatigue Diametral Diametral Diametral Longitudinal Longitudinal Longitudinal Comments
at ~ Nf' life, elastic plas tic dB train, total strain elastic strain plastic strain, total strain
Nf , strain range, €p' r~~~:, range, ! range, lOa,
b.€~p ~€~lJ €p'
D.€ l, leSl cycles in./in. in./in. in·/in. in./in. (a) in./in. in·/in.
AISI 52100
621 2 0.0060 0.0420 0.0480 0.0207 0.0840 0.1047 608 3 .0059 .0501 .0560 .0203 .1002 .1205 610 4 .0059 .0341 .0400 .0203 .0682 .0885 ~~ l 605 5 .0058 .0302 .0360 .0202 .0603 .0805 579 10 .0056 .0344 .0400 .0193 .0688 .0881
571 15 .0055 .0225 .0280 .0190 .0450 .0640 (b) 560 18 .0054 .0266 .0320 .0187 .0532 .0718 553 18 .0053 .0187 .0240 .0184 .0373 .0557 (b) 514 40 .0050 .0150 .0200 .0171 .0301 .0472 520 44 .0050 .0150 .0200 .0173 .0299 .0473
483 73 .0047 .0113 .0160 .0161 .0227 .0388 456 98 .0044 .0076 .0120 .0152 .0152 .0304 468 159 .0045 .0083 .0128 .0156 .0166 .0322 --- 225 ---- .0080 .0080 ---- .0160 .0160 (h) 386 728 .0037 .0031 .0068 .0129 .0061 .0190
374 1,110 .0036 .0016 .0052 .0125 .0032 .0156
It I --- 1,470 ---- .0040 .0040 ---- .0080 .0080 350 3,430 .0034 .0006 .0040 .0117 .0012 .0129 --- 5,640 ---- .0024 .0024 ---- .0048 .0048 331 7,840 .0032 0 .0030 .0110 0 .0110
--- 9,910 ---- .0026 .0026 ---- .0052 .0052 f~l 273 30,200 .0026 0 .0024 .0091 0 .0091 182 351,000 .0018 0 .0017 .0061 0 .0061 (j), (h) 217 799,000 .0021 0 .0020 .0072 0 .0072 ( j)
AISI 304 ELC (annealed)
343 25 0.0034 0.0446 0.0480 0.0127 0.0891 0.1018 ~b), f i l 315 55 .0031 .0288 .0320 .0117 .0577 .0694 b I' 1 329 110 .0033 .0167 .0200 .0122 .0334 .0456 b)
274 210 .0027 .0101 .0128 .0101 .0201 .0303 250 596 .0025 .0039 .0064 .0093 .0078 .0171
209 1,970 .0021 .0019 .0040 .0077 .0038 .0116 174 6,010 .0017 .0015 .0032 .0064 .0029 .0094 162 9,460 .0016 .0016 .0032 .0060 .0032 .0092 110 40,400 .0011 .0013 .0024 .0041 .0026 .0067 114 46,500 .0011 .0013 .0024 .0042 .0025 .0067
103 143,000 .0010 .0010 .0020 .0038 .0019 .0058 100 174,000 .0010 .0011 .0021 .0037 .0022 .0059
90 932,000 .0009 I .0009 .0018 .0033 .0018 .0051 ~-
AISI 304 (hard)
350 31 0.0048 0.0452 0.0500 0.0140 0.0905 0.1045 i~U~l 343 46 .0047 .0353 .0400 .0137 .0707 .0844 311 138 .0042 .0158 .0200 .0124 .0315 .0440 1~l 314 208 .0043 .0117 .0160 .0126 .0235 .0360 274 1,320 .0037 .0035 .0072 .0110 .0069 .0179
262 1,660 .0036 .0028 .0064 .0105 .0057 .0162 206 7,780 .0028 .0008 .0036 .0082 .0016 .0098 187 27,500 .0025 .0005 .0030 .0075 .0009 .0084 150 95,000 .0020 .0004 .0024 .0060 .0007 .0067 135 121,000 .0018 .0002 .0020 .0054 .0003 .0057 125 474,000 .0017 .0001 .0018 .0050 .0002 .0052
AISI 310 (annealed)
284 12 0.0030 0.1170 0.1200 0.0101 0.2339 0.2441 i~U~l 282 23 .0030 .0770 .0800 .0101 .1540 .1640 260 32 .0028 .0572 .0600 .0093 .1144 .1237
~~ l 218 91 .0023 .0277 .0300 .0078 .0553 .0631 222 95 .0024 .0276 .0300 .0079 .0552 .0632
163 335 .0017 .0123 .0140 .0058 .0245 .0303 134 1,400 .0014 .0066 .0080 .0048 .0131 .0179 107 5,120 .0011 .0033 .0044 .0038 .0065 .0103 83 30,000 .0009 .0011 .0020 .0030 .0022 .0052 (g) 79 55,200 .0008 .0010 .0018 .0028 .0019 .0047
75 61,000 .0008 .0008 .0016 .0027 .0016 .0043 70 173,000 .0008 .0005 .0012 .0025 .0009 .0034 65 223,000 .0007 .0005 .0012 .0023 .0010 .0033 f~l 63 274,000 .0007 .0003 .0010 .0022 .0007 .0029 64 363,000 .0007 .0002 .0009 .0023 .0005 .0027
25

TABLE III. - CONTINUED. SUMMARY OF TEST DATA AND STRAIN
CALCULAT~ONS FOR EACH TEST SPECIMEN
Stress range Fatigue Diametral Diametral Diametral Longi tudinal Longi tudinal Longi tudinal Comments
at ~ Nr, life, elastic plastic strain, total strain elastic strain plastic strain, total strain Nr, s train rang e, d range, range,
€~, range,
I!.a, cycles nE~z' .p' 6.e:d , ll€~1.' l::.e 1.,
ksi in·/in. in./in. in·/in. in·/in. in./in. (a) in./in.
AM 350 (annealed)
499 7 0.0057 0.0343 0.0400 0.0178 0.0686 0.0864 f~U~l 501 18 .0057 .0183 .0240 .0179 .0365 .0544
462 34 .0053 .0087 .0140 .0165 .0174 .0339 422 125 .0048 .0032 .0080 .0151 .0064 .0214 367 228 .0042 .0018 .0060 .0131 .0036 .0167
288 1,134 .0033 .0015 .0048 .0103 .0030 .0133 234 3,220 .0027 .0013 .0040 .0084 .0027 .0110 193 15,410 .0022 .0012 .0034 .0069 .0024 .0093 141 42,700 .0016 .0010 .0026 .0050 .0020 .0070 152 98,300 .0017 .0011 .0028 .0054 .0021 .0076
159 137,000 .0018 .0012 .0030 .0057 .0024 .0080 134 170,000 .0015 .0011 .0026 .0048 .0021 .0069 117 1,020,000 .0013 .0007 .0020 .0042 .0013 .0055 (g)
AM 350 (hard)
579 3 0.0067 0.0453 0.0520 0.0223 0.0906 0.1129 567 14 .0065 .0235 .0300 .0218 .0469 .0667 536 46 .0062 .0176 .0240 .0206 .0356 .0562 525 71 .0061 .0139 .0200 .0202 .0279 .0481 523 85 .0060 .0060 .0140 .0201 .0159 .0360
524 90 .0060 .0140 .0200 .0202 .0279 .0481 488 169 .0056 .0024 .0060 .0188 .0047 .0235 522 176 .0060 .0080 .0140 .0201 .0160 .0360 466 190 .0054 .0014 .0068 .0179 .0028 .0208 436 450 .0050 .0010 .0060 .0168 .0019 .0187
316 5,971 .0036 .0004 .0040 .0122 .0007 .0129 272 11,500 .0031 .0001 .0032 .0105 .0001 .0106 237 13,920 .0027 0 .0028 .0091 .0001 .0092
W 225 16,300 .0026 0 .0025 .0087 0 .0087 241 23,200 .0028 0 .0028 .0093 0 .0093
213 35,940 .0025 0 .0024 .0082 0 .0082 (h) 234 40,050 .0027 .0001 .0028 .0090 .0002 .0092
PU~l 220 56,600 .0025 0 .0025 .0085 0 .0085 223 133,000 .0026 0 .0026 .0086 .0001 .0087 219 759,000 .0025 0 .0025 .0084 0 .0084 Hl;i~U~l 227 ,010,000 .0026 0 .0026 .0087 0 .0087
Inconel X
382 2 0.0038 0.0682 0.0720 0.0123 0.1364 0.1487
I~I 422 4 .0042 .0518 .0560 .0136 .1036 .1172 396 6 .0040 .0400 .0440 .0128 .0801 .0929 406 9 .0041 .0379 .0420 .0132 .0758 .0890 378 37 .0038 .0322 .0360 .0122 .0644 .0766
368 41 .0037 .0303 .0340 .0119 .0606 .0725 f~l 356 50 .0036 .0304 .0340 .0115 .0609 .0724 336 79 .0034 .0266 .0300 .0108 .0533 .0641 359 89 .0036 .0244 .0280 .0116 .0488 .0604 f~l 342 137 .0034 .0206 .0240 .0110 .0412 .0522
322 193 .0032 .0148 .0180 .0104 .0296 .0399 (i) 312 220 .0031 .0129 .0160 .0101 .0258 .0358 314 261 .0031 .0169 .0200 .0101 .0337 .0438 317 282 .0032 .0128 .0160 .0102 .0257 .0359 298 296 .0030 .0070 .0100 .0096 .0140 .0237
288 779 .0029 .0071 .0100 .0093 .0142 .0235 281 813 .0028 .0072 .0100 .009l .0144 .0234 281 1,080 .0028 .0040 .0068 .0091 .0080 .0170 264 1,580 .0026 .0024 .0050 .0085 .0047 .0132 233 5,160 .0023 .0011 .0034 .0075 .0021 .0097
232 5,210 .0023 .0017 .0040 .0075 .0034 .0108 230 6,440 .0023 .0005 .0028 .0074 .0010 .0084 231 7,800 .0023 .0005 .0028 .0075 .0010 .0084 211 9,400 .0021 .0001 .0022 .0068 .0002 .0070 215 9,940 .0021 .0008 .0029 .0069 .0015 .0065
204 18,400 .0020 0 .0019 .0066 0 .0066 188 36,400 .0019 0 .0016 .0061 0 .0061 169 47,500 .0017 0 .0016 .0055 0 .0055 155 99,800 .0015 0 .0014 .0050 0 .0050 137 125,000 .0014 0 .0012 .0044 0 .0044
124 267,000 .0012 0 .0012 .0040 0 .0040 124 395,000 .0012 0 .0011 .0040 0 .0040 114 688,000 .0011 0 .0010 .0037 0 .0037
26

TABLE III. - CONTINUED. SUMMARY OF TEST DATA AND STRAIN
CALCULATIONS FOR EACH TEST SPECIMEN
stress range Fatigue Dlametral Diametral D1ametral Longi tudinal Longi tudinal Longi tudinal Comments
~t ~ Nf, life, elastic plastic dstrain, total strain elas tl c strain plastic strain, total strain Nr, s train range,
'p' r~~~~, range, €~, rC;nge, 60, cycles A€~Z' in./'in. in./in. Aekz.J in·/in. b,.e ~, ksi in./in. in·/in. (a) in·/in.
Titanium (6Al-4V)
430 6 0.0083 0.1117 0.1200 0.0253 0.2233 0.2486 i~l 382 27 .0074 .0646 .0720 .0225 .1292 .1516 338 86 .0066 .0294 .0360 .0199 .0589 .0788 326 188 .0063 .0177 .0240 .0192 .0353 .0545 313 453 .0061 .0079 .0140 .0184 .0158 .0343
281 1,470 .0055 .0025 .0080 .0165 .0051 .0216 216 11,800 .0042 0 .0040 .0127 0 .0127 175 '37,000 .0034 0 .0032 .0103 0 .0103 156 70,200 .0030 0 .0028 .0092 0 .0092 149 192,000 .0029 0 .0026 .0088 0 .0088 (h)
134 881,000 .0026 0 .0024 .0079 0 .0079 (hi 150 4,270,000 .0029 0 .0029 .0088 0 .0088 Ul;i~l; ;U~l 172 5J590~OOO .0033 0 .0033 .0101 0 .0101
2014-T6 aluminum
166 4 0.0055 0.0825 0.0880 0.0166 0.1650 0.1816 147 10 .0048 .0552 .0600 .0146 .1103 .1250 155 42 .0051 .0249 .0300 .0155 .0498 .0653 142 203 .0047 .0093 .0140 .0142 .0186 .0328 127 608 .0042 .0038 .0080 .0127 .0076 .0203
117 1,610 .0039 .0009 .0048 .0117 .0019 .0136 117 1,980 .0039 .0009 .0048 .0117 .0019 .0136 107 4,180 .0035 .0001 .0036 .0106 .0002 .0108
72 61,700 .0024 0 .0022 .0071 0 .0071 92 95,550 .0030 0 .0029 .0091 0 .0091
62 229,000 .0020 0 .0062 0 .0062 67 285,000 .0022 0 .0020 .0066 0 .0066 58 394,000 .0019 0 .0018 .0058 0 .0058 (g) 58 418,000 .0019 0 .0058 0 .0058
5456-H311 aluminum
138 7 0.0046 0.0554 0.0600 0.0138 0.1109 0.1247 (c) 133 12 .0044 .0476 .0520 .0133 .0952 .1085 127 54 .0042 .0258 .0300 .0127 .0516 .0643 118 175 .0039 .0101 .0140 .0118 .0202 .0320 111 494 .0036 .0044 .0080 .0110 .0087 .0198
100 1,920 .0033 .0015 .0048 .0100 .0030 .0130 88 5,950 .0029 0 .0028 .0087 0 .0087 72 22,800 .0024 0 .0022 .0072 0 .0072 65 65,100 .0021 0 .0020 .0065 0 .0065 59 90,300 .0019 0 .0018 .0059 0 .0059
52 130,000 .0017 0 .0016 .0052 0 .0052 47 366,000 .0015 0 .0014 .0047 0 .0047 44 917,000 .0015 0 .0014 .0044 0 .0044
1100 aluminum
37 2 0.0012 0.2388 0.2400 0.0037 0.4776 0.4813 37 2 .0012 .2388 .2400 .0037 .4776 .4812 42 5 .0014 .2186 .2200 .0042 .4372 .4414 42 11 .0014 .1986 .2000 .0042 .3972 .4014 36 27 .0012 .1188 .1200 .0036 .2376 .2412
30 73 .0010 .0590 .0600 .0030 .1180 .1210 24 282 .0008 .0292 .0300 .0024 .0584 .0608 22 784 .0007 .0133 .0140 .0021 .0266 .0287 18 2,120 .0006 .0054 .0060 .0018 .0108 .0126 18 6,320 .0006 .0024 .0030 .0018 .0048 .0066
17 12,800 .0006 .0014 .0020 .0017 .0029 .0046 15 104,000 .0005 .0005 .0010 .0015 .0010 .0025 15 205,000 .0005 .0003 .0008 .0015 .0006 .0021 15 417,000 .0005 .0002 .0006 .0015 .0003 .0018 14 1,000,000 .0005 0 .0005 .0014 .0001 .0014 (g)
27
I:\:)
en
Stress range Fatigue 1 lif'e,
at "2 Nf', Nf"
/',cr, cycles ksi
117 6 103 73
82 138 79 260 66 4,260
--
Diametral elastic
TABLE III. - CONCLUDED. SUMMARY OF TEST DATA AND STRAIN
CALCULATIONS FOR EACH TEST SPECIMEN
Diametral Diametral Longitudinal Longitudinal plastic strain, total strain elastic strain plastic strain,
strain range, d range, range, 1 €p' /',Ed,
/',E~L ' /',E ~ L' E ,
p in·/in. in./in.
in./in. in·/in. ( a') in./in.
Beryllium
0.0001 0.0066 0.0067 0.0028 0.0132 .0001 .0028 .0028 .0025 .0055
0 .0010 .0011 .0020 .0020 0 .0008 .0008 .0019 .0015 0 .0004 .0005 .0016 .0008
--- ---------
Longitudinal total strain
range, /',EL
in./in.
0.0160 .0080 .0040 .0034 .0024
aSmall discrepancies which appear upon comparison of the summation of elastic and plastiC strain components with total strain arise because of small inaccuracies of the measured quantities E and ~. These cause errors in the fourth decimal place and sometimes result in the calculation of small negative plastic strains. In the table all negative plastiC strains are reported as zero, but no change was made to the other calculated strains.
bHourglass radius, 1 in. cS ome buckling of test section. dApproximate strain range. eLoad cycled with high-frequency push-pull fatigue machine. f'Approximate number of cycles to failure.
gNo f'ailure. hFailure outside test section (threads or at buttonhead). iApproximate stress range.
jTest-section diameter, 0.18 in. kHourglass radius, 0.5 in. LTest-section diameter, 0.21 in. ffiPolished test section.
Comments
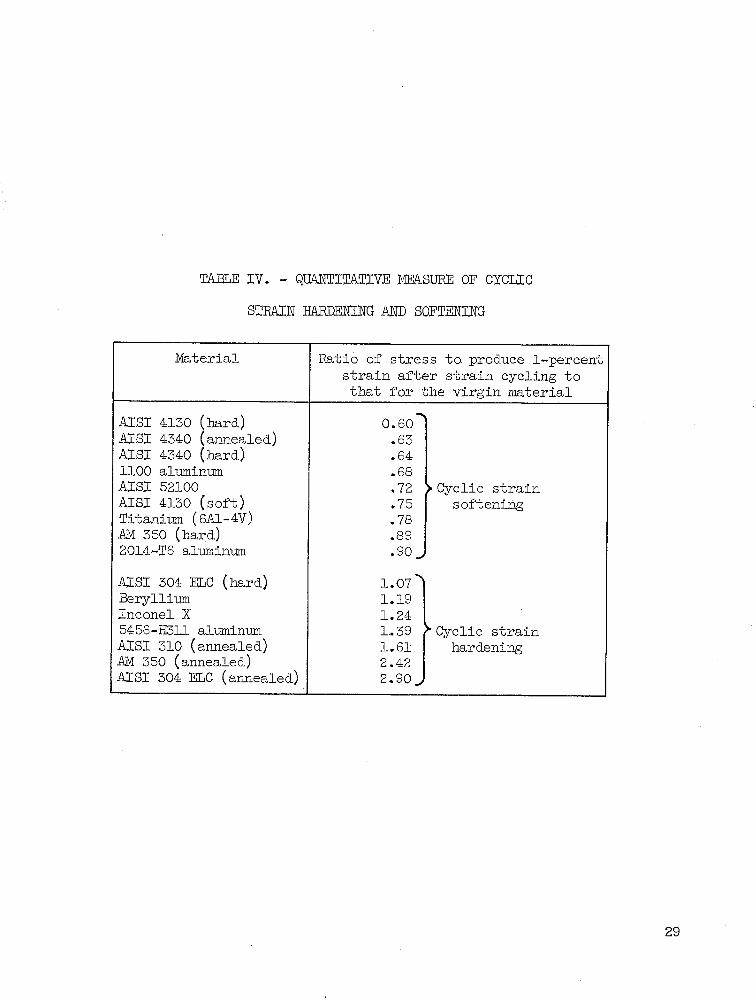
TABLE IV. - QUANTITATIVE }1EA.SURE OF CYCLIC
STRAIN HARDENING AND SOFTENING
:Material Ratio of stress to produce l-percent strain after strain cycling to that for the virgin material
AlSI 4130 (hard) .....
0.60 AlSI 4340 (annealed) .63 AlSI 4340 (hard) .64 1100 aluminum .68 AlSI 52100 .72 > Cyclic strain AlSI 4130 (soft) .75 softening Titanium (6Al-4V) .78 AM 350 (hard) .89 20l4-T6 aluminum .90 ....
AlSI 304 ELC (hard) 1.07"'" Beryllium 1.19 Inconel X 1.24 5456-H3ll aluminum 1.39 >- Cyclic strain AlSI 310 (annealed) 1.61 hardening AM 350 (annealed) 2.42 AlSI 304 ELC (annealed) 2.90
29

TABLE V. - DIAMETRAL STRAIN RANGE RATINGS OF MATERIALS FOR
FATIGUE UVES OF 100, 3000, .AND 100,000 CYCLES
Material Nf = 100 Nf = 3000 Nf = 100,000
.6.€d Rank .6.€d Rank .6.€d Rank
1100 aluminum 0.050 1 0.0048 9 0.0010 15 AlSI 4130 (soft) .036 2 .0052 5 .0014 12 Titanium (6Al-4V) .033 3 .0062 1 .0026 2 AlSI 4340 (annealed) .030 4 .0054 4 .0017 9 AlSI 4130 (hard) .030 4 .0050 8 .0016 11
AISI 310 (annealed) .029 6 .0056 2 .00138 14 AISI 4340 (hard) .028 7 .0056 2 .0018 8 Inconel X .027 8 .0051 7 .0014 12 AlSI 304 ELC (hard) .025 9 .0052 5 .0023 4 AISI 304 ELC (annealed) .021 10 .0037 15 .0022 5
2014-T6 aluminum .020 11 .0040 13 .0021 6 5456-H311 aluminum .019 12 .0039 14 .0017 9 AlSI 52100 .014 13 .00"16 10 .0020 7 AM 350 (hard) .012 14 .0042 11 .0026 2 AM 350 (annealed) .009 15 .0041 12 .0028 1
30

TABLE VI. - STRESS RANGE RATINGS OF MATERIALS FOR FATIGUE
LIVES OF 100, 3000, AND 100,000 CYCLES
Material Nf ::: 100 Nf ::: 3000 Nf ==. 100,000 Density, Ib/cu in.
6.0 ) Rank. 6.0, Rank 6.0) Rank ksi ksi ksi
AM 350 (hard) 510 1 330 1 202 2 0.30 AlSI 52100 469 2 321 2 253 1 .30 AM 350 (annealed) 426 3 246 5 148 8 .30 AlSI 4340 (hard) 354 4 261 3 189 3 .30 Inconel X 353 5 248 4 155 5 .30
Titanium (6Al-4V) 327 6 241 6 155 6 .16 AlSI 304 ELC (hard) 325 7 236 7 145 9 .30 AlSI 304 ELC (annealed) 311 8 189 9 105 11 .30 AlSI 4130 (hard) 293 9 223 8 178 4 .30 AlSI 4130 (soft) 252 10 173 10 150 7 .30
AlSI 4340 (annealed) 213 11 143 11 112 10 .30 AlSI 310 (annealed) 213 12 120 13 72 12 .30 2014-T6 aluminum 144 13 123 12 72 13 .10 5456-H311 aluminum 122 14 95 14 58 15 .10 Beryllium 102 15 81 15 64 14 .07 1100 aluminum 29 16 18 16 15 16 .10
31

32
r"" -3'25~"'1 0.02-0.03 Rad.
----r-f-0.75 Di81ll.
t
* \
''-0.25 Diam.
1.5 Rad.
"-"-~0.50 Diam.
(a) Buttonhead fatigue specimen.
II-.--~ --4'OO-~l
t .§. ~ --. - - -
-- 1 t -I t I '-0.25 Diam. I '-0.47 Diam. L " - -1/2 20 NF 3
2.0 Rad.
(b) Threaded-head fatigue specimen.
~-------------3.25--------------~
~----1.50 • !
0.75 Diam.-
~ 0.31
\ \ '-- 0.25 Diam. " , '--'-0.50 Diam.
(c) Specimen used for moduli determinations and beryllium fatigue tests.
Figure 1. - Test specimen configurations. (All dimensions in inches.)

. "-00
Limit
~ . .
L Four-way hydraulic valve
Figure 2 . - Low- frequency fatigue machine.
Platen displacement
33

(a) Horizontal view of assembly during test .
Figure 3. - Diametral strain-gage fixture.
34

I
L ----
" Piano- wire I \ s prings
I \ I \ Aluminum
U spr ing , \ \
L Piano wire loops - _
\ ........ \
........ ...L Tuckerman
extensometers
(b) Vertical view of assembly after specimen failure .
Figure 3 . - Concluded . Diametral strain- gage fixture.
C-5890l
35
();I 0)
.,;
" ... ~ ru' M ~ ctl H
" " ru H -P Ul
350
300 -- !'.Ed
0.0l!,8 250
200 ~ ------= .010
------150
(a) AISI 4130 (soft).
350
300
flEd 250
.........-0.040 - r-----r--
200
150
100 1 10
.010
i---
100 1,000
(c) AISI 4340 (annealed).
I
400
~ flEd
~ ---350
"--~
~010
300
250
.002 200
(b) AISI 4130 (hard).
! ,
450
~ flEd
~ ~ ~ - --1.010
400
350
300
250
.002 .002
200 - '--- - L---
10,000 100,000 1 10 100 1,000 Number of cycles, N
(d) AISI 4340 (hard).
Figure 4. - Variation of stress range with cycles for strain cycling about a zero mean strain.
.002 - -
.002
10,000 100,000

():I -...l
... '" ~
.g OJ till
~ H
'" rD OJ H -P Cfl
60 )
)~ ~ .Md
)~ ~
)~ ) ~
~-
55
50
45
40
35
30
25 n
(e) AISI 52100.
350 l;Ed
0.020
~ - --.0072
300
250
200
150
100 1
--10 100 1,000
(g) AISI 304 ELC (hard).
350 l;Ed
/" .---
/0.020
/ ---t
300
250
/ V- 0064
/
/ / / V /0024 --- ______ f-'""
200
150
100
50
.0024
o (r) AISI 304 ELC (annealed).
300
1;~ ~ 0.080
/ 250
200 II
150
.0024 ----I- .008
V 100
.0018 50
10,000 100,000 1 10 100 1,000 10,000 100,000 Number or cycles, N
(h) AISI 310 (annealed).
Figure 4. - Continued. Variation or stress range with cycles ror strain cycling about a zero mean strain.

c.N CD
·rl OJ -'<
b <l
OJ b!I >:: Ctl H
Ul OJ OJ H .p CIl
50 r
lIEd
) ~74 /1 ,r----r---+-+------t--
) I /L--:066
4501
400
) 1 / ) I /
350
300
) / / )~ ~)/ ~
250'
200
150
100
450
400 I
350 I ~ ~
(i) AM 350 (annealed).
l>€d
0.034
.0028
550
500
450
400
350
300
250
200
150
~
----II
I 300 -=----=--250 'V 200
150 1
V /
10
~
.0016 ,
100 1,000 10,000 100,000 1 10 Number of cycles, N
(k) Inconel X.
LO,Ed
~
.006
.0025
(j) AM 350 (hard) .
LO,,,d
0.072
-- .008 -i
.0028
100 1,000 10,000
(1) Titanium (6Al-4V).
Figure 4. - Continued. Variation of stress range with cycles for strain cycling about a zero mean strain.
100,000

~ to
-rl Ul
-'" ,; <I
,; bll <=: cO H
Ul Ul ill H
"" (I)
250
200
150
100
50
75
50
25
o 1
150, "'Ed
0.030
"'Ed
0.03
.0048
125
V --I
-----~048 ----t-
100
75
~--------- -, .0022
501 .0018
(m) 2014-T6 aluminum. (n) 5456-H311 aluminum. 12 )
"'E L
0.0080 )(
V .0034
10
7 5_
.0024
5 rJ 10 100 1,000 10,000 100,000 1 10 100 1,000 10,000 100,000
Number of cycles, N
(o) 1100 aluminum. (p) Beryllium.
Figure 4. - Concluded. Variation of stress range with cycles for strain cycling about a zero mean strain.

'r! til
..!.:l
"' <IJ rd
E 'r! r-I
~ til til <IJ 1-1 +> m
40
180 Elastic modulus
160
140
120
100
80r---ff-+----.~-----r--~~
60~~--~--~~----~--~~
o .01 .02 .03 .04 Strain amplitude
(a) Static and cyclic stressstrain characteristics.
-,
,
l' '2 Nf
1--~-~~Nf
~ ~ B 1
'2 Nf --~- ... I- - -~ .iN"f
~~PA ----
Cycles
(b) Stress range as a function of applied cycles, logarithmic scale for cycles.
Figure 5. - Static and cyclic stress characteristics of a hypotheticalcyclic strain hardening material.

~~ ____________ ~€d ____________ ~
o diametral
Figure 6. - Hypothetical axial stress - diametra1 strain relation during strain cycling in which mean strain is zero.
•
41

~ N
160
I 320
140 I - 280
120
100
80
---J---L---
r I-;::--~ ...9--- o 0
~( fQ
sP
240
200
160
60 120
40 Virgin tensile tests -- 80 orl
---Cyclic tests ro
..>: 20 I I 40 ~
'0
ro~ 0 o ro (jJ
H (a) AISI 4130 (soft). (b) AISI 4130 (hard).
-1-0 140 C!l 280
120 240
100
80
60
40
20
200 - - __ ----c r f------...--c L ---o-~ ----g r
II
160
120
80
40
0 .02 .04 .06 .08 .10 0 .02 .04 .06 .08 .10 Longitudinal strain
(c) AISI 4340 (annealed). (d) AISI 4340 (hard).
Figure 7. - Comparison of cyclic and virgin tensile stress-strain curves.

11>CJ.l
oM
'" ~ b "'~ '" ill H ...., CI)
360
320
280
240
200
160
120
80
40
0
180
160
140
120
100
80
60
40
20
0
u ° ° _-----0 f----
/ ~ ----I ,,/
V
yo 1 t
II Virgin tensile tests _ --- Cyclic tests
180
~I -__ I
IJ>-
- 1-----r::J'
0'",,--~
I I
$ -- I--
lL
160
140
120
100
80
60
40
20
I I o (e) AISI 52100. (f) AISI 304 ELC (annealed).
_ --0--I-----/"
V·..o--
. ?" .....-f ~
~
f ~ ----
t / V ---f-
~ ~ ----1'---
.02 .04 .06 .08 .10 0 .02 .04 .06 .08 .10 Longitudinal strain
(g) AISI 304 ELC (hard). (h) AISI 310 (annealed).
Figure 7. - Continued. Comparison of cyclic and virgin tensile stress-strain curves.

l!>I!>-
-rl
'" .=<
b
'" '" Q)
H -P Ul
32
\r 28
r
p ~..-o-
0
24
20
8
0 ,
0 f ~ o j
ot-
16
12
4
~
240
200
160
120
80
40
o .02
L--o- (~ -0---- 0 _ 0
#' l
I --v I ~
I
(i) AM 350 (annealed). (j) AM 350 (hard).
r- - .f\.
V-i r Virgin tensile tests __
II . --- Cyclic tests
~ I .04 .06 .08 .10 0 .02 .04 .06 .08 .10
Longitudinal strain
(k) Inconel X. (1) Titanium (6Al-4V).
Figure 7. - Continued. Comparison of cyclic and virgin tensile stress-strain curves.

If'>. CJl
orl rll ~
~
b
;; rll ill H .p [/)
90
80
70
60
50
40
30
20
10
0
24
20
16
12
8
4
0
-~
~ -U-
!:/' r I
o .02 .04 .06 .08 .10
(m) 2014-T6 aluminum. (n) 5456-H311 aluminum.
~ 60
~
lL If~,o- _--0---1---- --
It§
i --l J -l
--0--
..(y'-
--,---/ ~
/ I
Virgin tensile tests
II ----- Cyclic tests I I
50
40
30
20
10
.02 .04 .06 .08 .10 0 .002 .004 .006 .008 .010 Longitudinal strain
(0) 1100 aluminum. (p) Beryllium.
Figure 7. - Concluded. Comparison of cyclic and virgin tensile stress-strain curves.

I!>m
Ul
J'> ---t?
"' :S ~ (])
H +> Ul
cd .-I (]) 'r! ?> 0
+> .s:: +> bO i=1 (]) H +> Ul
(]) .-I 'r! Ul i=1 (])
+> G-i 0
6 or! +> &!
3.0
2.6
2.2
1.8
1.4
1.0 o
-
r I I I I I I \ -\ I
0 AISI 4130 (sof't) ~ AM 350 (annealed)
• AISI 4130 (hard) ~ AM 350 (hard) 0 AISI 4340 (annealed) '\l Inconel X
• AISI 4340 (hard) 0 Ti tanium (6Al-4V) ~ AISI 52100 Cl 20l4-T6 aluminum
0 AISI 304 ELC (annealed) D 5456-H3ll aluminum
• AISI 304 EIC (hard) 0 llOO aluminum LI AISI 310 (annealed) 0 Beryllium
Nontailed symbols denote N ~ v
strain-softening materials ~ Tailed symbols denote
strain-hardening materials
Strain Strain hardening ~ .-. softening
if C
0 .. C
00 Cl o· ~ q ~
.4 .8 1.2 1.6 2.0 2.4 2.8 3.2 Stress ratio at l-percent strain
Figure 8. - Comparison of stress ratio at l-percent strain with virgin tensile proper-ties.

101,----.-----,-----,-----.-----,----~ ,-----,-----,-----,-----,-----,-----,10°
100·~--~--~~----_+----_+----~----~ r-----r-~&-r-----r-----r-----T---~10-1
10-2 10-3
~ .r<
~ "--rl ~ "- .r<
~ ;--rl <I
;-10-3 0- 10-4 oJ <I ao - (a) (soft) . (b) (hard) .
~ OJ AISI 4130 AISI 4130 cO bO H ~ 101
10° ~ cO H .r<
cO ~ /',E L H -rl 0 +> cO eL Ul H
L rl +> CI) 0 Ep cO
+>
/',E L 0
L'. 8
100 10-1
r-----+-~--+-----~----~~---r----~10-2
o 0
10-3 10-4
10° 101 102 103 104 105 106 100 101 102 103 104 105 106 Cycles to failure, Nf
(c) AISI 4340 (annealed). (d) AISI 4340 (hard) •
Figure 9. - Elastic, plastic, and total strain range variations with cycliC life.
47

C 0,-{
'-. C
0,-{
.;; <l
a! bO ~ ro H
~ 0,-{
ro H ., U1
48
101.-----r-----r-----r-----.-----.-----,
100~~~~----+-----+-----+_----+_--~
10-3 0
( e) (r) AISI 304 ELC (annealed) . AISI 52100.
101
0 i;€~L
0 €L p
t:,. i;€ L
10°
10-1r-----+-~--+_----+_--~~----1_----~
(g) AISI 304 ELC (hard). (h) AISI 310 (annealed).
Figure 9. - Continued. Elastic, plastic, and total strain range variations with cyclic life.
10-3
C 0,-{
:-~
0,-{
.;; <l
10-4 a! bO ~ ro
100 H
~ 0,-{
ro H ., 00
rl ro ., 0 E-I
10-1

101 ,-----.-----.-----,-----,-----,------
100~---t;~----_+----~----~----~----~
0 0
10-2 10-3
.: .r<
.: :-.r< ~
:- 0 or{
~ 0 <JJ~
or{ <I ~
<JJ 10-3 10-4 OJ <l b()
" (i) AM 350 (annealed). (j) AM 350 (hard). ~ aJ
b()
101 100 H
~ ~ aJ H
or{
LEt aJ ~ 0 H
.r< eZ ..., aJ L til
H 0 Ep rl ..., CI) aJ ...,
t; t; LEL 0 E-<
100 t; 10-1
10-3 10-4
100 10
1 102
103
104
105 10
6 100
101
102
103 10
4 10
5 106
Cycles to failure, Nf
(k) Inconel X. (1) T1 tan1um (6Al-4V) .
Figure 9. - Continued. Elastic, plastic, and total strain range variations with cyclic life.
49

.:: .,;
':->: .,;
tv'
<I
oJ ~ oj I'-<
>: .,; oj I'-< ..,
CI)
50
101 ,----.-----.-----.-----.----.-----,
10°r---_+~--~----+-----r---_+----~
o
0
10-2
0
10-3
(m) 2014-T6 aluminum.
101
6. 6.
100
0 0
10-1r---~r_--~----_+--~~----~----~
o 0
(0) 1100 aluminum.
,----,-----.----.-----.-----,----.100
(n) 5456-H311 aluminum.
'A.., ""-~
tI",
~ -0-: =- ..n
100 101
failure, Nf
0
0
6.
~ ~ ~
~ ~ 0..... --0-
(p) Beryllium.
10-4
I 100
{:,El, el,
1, E
P {:,E 1,
10 -1
Figure 9. - Concluded. Elastic, plastic, and total strain range variations with cyclic life.
.:: .,;
-...... .:: .,;
.;; <I
oJ bD >: oj I'-<
>: .r< oj I'-< .., " rl oj -I-' 0 8

U1 I-'
:5
'" <l
,; Q() c m H
C -rl m H .p rn
rl m H .p
'" "' m -rl q
100
10-1
10-2
10-3
10-4
100
0 <
~ ()
0
-= " 'r-.
to. v I .... [:, <;;~
"'t>.lJ I."
/),.
101
0 AV~
2 10
~D
"'-
~<;; ~I€ Ie
I II I I I I II
0 AISI 4130 !SOft~ • AISI 4130 hard 0 AISI 4340 annealed)
• AISI 4340 hard) ~ AISI 52100 0 AISI 304 ELC ~annealed)
• AISI 304 ELC hardl LI AISI 310 (annealed
~.
11 In I!!l
~ ~ ,;. r-A .., [ -r I A'"',
b~ ~ ... .... a; -'ro. A
" <;;2:1' ~" 'i
" LI LI1!J
3 4 10 10 10
5
Cycles to failure, Nf
Figure 10. - Effect of diametral strain range on fatigue life.
~
/),. ... " Q Cl D 0
~~ ~
S\ 14]
I I II I I
AM 350 ~annealed) AM 350 hard) Inconel X Titanium (6Al-4V) 2014-T6 aluminum 5456-H3l1 aluminum 1100 aluminum
~
106
,
7 10

CJl N
-rl Ul .>:
.; <l
~ :<':
rllOJ
+' cO
Q)
bO >:: cO N
Ul Ul Q)
N +' (1)
103
102
101
100
~
II111 II II II II J I JI I I I IIIII I I I I IIIII I I I I IIIII I I I III I I I II
o AISI 4130 1SOft) • AISI 304 ELC (hard) Q Titanium (6Al-4V) • AISI 4130 hard LI AISI 310 (annealed Cl 2014-T6 aluminum o AISI 4340 annealed) ~ AM 350 (annealed) D 5456-H311 aluminum • AISI 4340 hard) A AM 350 hard) o 1100 aluminum t>. AISI 52100 OAISI 304 ELC (annealed)
'V Inconel X o Beryllium
~~ ... 1:>' ~I!I!II A
-L>. (> .. vP41 IA:iL ~ .1:>
I~ 1"- -~
~O I~ .::I P 'J
-In rt*, .~ I~~ l&:l t:.. 00 n ~ '..AI
A
P u
Ll ~Ll C I ~ 0" ~~~ ~~ ~~ ~ p-O .~ ~ • -4 I ~ D D J Cl~ 0 ~ ,rl " r>-
'"' l.o. '" 0
<;
P 1" 0 P p ~ ~
101 102 103 104 105 106 107 Cycles to failure, Nf
Figure 11. - Variation of stress range at ~ Nf with fatigue life for constant strain range cycling.

(Jl ~
. >=1 ·rl
----. >=1 ·rl
" ~ " (])
b.O >=1 al H
>=1 ·rl al H .p (J)
10-
10-
10-
Failure in threads i'..
"'-..... " .6E7, Test-section
i'. failure .. 'r-.
.6EZ = 1 5 &7, sr • e7, ~ ---~ r- \ " Transition Nf ;: 700 cycles -I- :-1_ "-t--_ -~~
r--r-, r- ----.6E7- -/ r- I" I--1-- I"-
e7- ---~ "'- --I----- ........ - -l-I--r---r--. ..... -- -r- I"- '~-I~ ::; ~
:--~ r-- -r- -I-
:5 --- ---
100
101 102 103
104 105
106
Cycles to failure~ Nf
Figure 12. - Graphical illustration of failure transition in test speclirren based upon strain-life relations for AISI 52100 steel and an assumed stress concentration factor.

~
/\
N NQ)
IJJ
~ N
IJJ <I
o ..-l .p ro H
~
102 102
~ r AISI 4130 ~hard)
~ ""I'---. / AISI 4130
"@ 101 H
1'--. r' ( soft) ~ 10
1 .p Ul
<:)
..-l
.p Ul ..-l H Q) .p <:)
ro H ro 5
.....
100
101
~
....... I".:
.......
"I--
~ISI 52100
t--1-t-
.......... .........
........ 1-... ..........
........
~ ........
r-............. "
~ ~ I---
f--
102
Nf == 700
........ t-... t--
Nf = 7,000
I'--- ........ -....... r--..... r-.. I--- l"-
t: r--I--- l--b, r=====-==--- -:: r- ::...
r---I---t--'- '---- i--
103
Cycles to failure, Nf
Nf = 17,000
llE~r r-~-= 1.5
I llEe~
~~~- .-t---~ r--
104
r-N- 100
105
Figure 13. - Relative notch sensitivity behavior of threaded specimens as indicated by strain ratio against life curves.
0
N NQ)
IJJ <I ~
NUl IJJ <I
H Q)
Ul ..-l (lj H
Ul Ul Q)
H .p Ul
.p (lj
0 ..-l .p (lj H
~ ..-l ro H .p lZl

(J1 (J1
~
~Q)
'" > '" <I
o ..-{ -I-'> ttl H
<=: ..-{
~ -I-'>
" " ..-{
-I-'>
"' ..-{
H Q)
-I-'>
" ~ ttl
.<:! co
10
2
PS S421 I III/II Ii] I 111111 I I I 111111 I I I 111111 I I I 111111102
~ ~
1100 aluminum ~ ~~B -.l i I I I I I I I I I I I I I I I I r AISI 310 ~ I I I I I I ~ (annealed) 1'--.. I ............. ~ f"-.... 11111 I I I 111111 I I 1111111
...... ~~ r AISI 4340 r---)--..
r~1 ~/ (hard) N I ..... , I ~"" ~ AISI 304 , '''\-
101 ..... / ~ (hardl"--J::: 5456-H311 I l' 101 .... / aluminum .......
~:--.. ...... / _1111 :::--, ........... ~ .... ...: ......... .......... ~AISI 4340
, ........ ~~ I::::::" 7-r...... ...... / (annealed) r-.... !!.:ryllium, .~ -...... I'>-.... 7"--.- 1'-,'1-...1' , , ,
-_. I \ ..........:::: ~ .... b,.. 't--:J: ....
Titanium , AISI 304 ~:::f~~~~~~~~~~~~i:~~~~r+~~~~-±~~~~~~:tjjHl------II--;/r-(annealed)
100
101 102 103 lb4 10~ Cycles to failure, Nf
Figure 14. - Relative notch sensitivity behavior of buttonhead specimen as indicated by strain ratio against life curves.
co
~
~Q)
{ ~"'
'" <I
fu "' ..-{
ttl H
"' "' Q)
H -I-'>
" -I-'> ttl
o ..-{ -I-'>
~ <=:
..-{
~ -I-'> C/l

------~ -. - _. --- _ .. _,- - ----- -- .--- - .
Figure 15 . - Protective assembly for testing beryllium.
56 NASA-Langley . 1963 E-1590