technical note - nasa › archive › nasa › casi.ntrs.nasa... · allowed a margin of excess...
TRANSCRIPT
h
P
!
.
r
I'l
o
Z
Z
/ ,J_ .... j
NASA TN D-I057i I |
TECHNICAL
D-1057
NOTE
ANALYSIS OF X-19 LANDING APPROACH AND FLARE
CHARACTERISTICS DETERMINED FROM
THE FIRST 30 FLIGHTS
By Gene J. Matranga
Flight Research CenterEdwards, Calif.
NATIONAL AERONAUTICS AND SPACE ADMINISTRATION
WASHINGTON July 1961
https://ntrs.nasa.gov/search.jsp?R=19980227282 2020-06-15T03:37:59+00:00Z

IJ
NATIONAL AERONAUTICS AND SPACE ADMINISTRATION
TECHNICAL NOTE D-I057
H
2
2
i
ANALYSIS OF X-15 LANDING APPROACH AND FLARE
CHARACTERISTICS DETERMINED FROM
THE FIRST 30 FLIGHTS
By Gene J. Matranga
SUMMARY
The approach and flare maneuvers for the first 30 flights of the
X-15 airplane and the various control problems encountered are discussed.
The results afford a relatively good cross section of landing conditions
that might be experienced with future glide vehicles having low lift-
drag ratios.
Flight-derived drag data show that preflight predictions based on
wind-tunnel tests were_ in general_ somewhat higher than the values
measured in flight. Depending on configuration_ the peak lift-drag
ratios from flight varied from 3-5 to 4.5 as compared with a predicted
range of from 3.0 to 4.2.
By employing overhead_ spiral-type patterns beginning at altitudes
as high as 40_000 feet_ the pilots were consistently able to touch down
within about ±i_000 feet of a designated point.
A typical flare was initiated at a "comfortable" altitude of about
$00 feet and an indicated airspeed of approximately 300 knots_ which
allowed a margin of excess speed. The flap and gear were extended
when the flare was essentially comp!eted_ and an average touchdown was
accomplished at a speed of about 159 knots indicated airspeed_ an angle
of attack of about 7°_ and a rate of descent of about 4 feet per second.
In general_ the approach and landing characteristics were predicted
with good accuracy in extensive preflight simulations. F-104 airplanes
which simulated the X-I_ landing characteristics were particularly
valuable for pilot training.

INTRODUCTION
Prior to the first flight of the X-15, _t was apparent from wind-tunnel tests that the landing approach and flare maneuverswould beperformed in a range of lift-drag ratios low_r than previously flownwith rocket-propelled aircraft (ref. i). Sirce piloting problems wereanticipated, analytical and flight-test studies were undertaken by theNASAFlight Research Center, the manufacturer (North American Aviation,Inc.), and the Air Force Flight Test Center Io determine howwell thepilot could execute approach and flare maneuversat reduced lift-dragratios. References i to 3 are illustrative (f these investigations.
This paper expandsupon the limited analyses of early X-15 landingspresented in references I, 4, and 5. The la_ding approach and flaredata acquired during the first 30 X-15 flights are considered in detailand are comparedwith the preflight predictions. Included are data forthe initial landings of each of the seven X-15 pilots. These results_it is believed_ are generally indicative of flight characteristics andpiloting problems which might be encountered in executing a normalflared landing with future low-lift-drag-rat_o gliders.
A detailed analysis of the X-!5 landing-gear behavior duringtouchdown and runout is presented in reference 6.
H22i
SYMBOLS
a n
CD
CL
g
h
L/D
M
P
q
normal acceleration_ g units
airplane drag coefficient
airplane lift coefficient
acceleration due to gravity, ft/sec 2
geometric altitude (referenced to touchdown point), ft
lift-drag ratio_ CL/C D
Mach number
rolling velocity, deg/sec
pitching velocity_ deg/sec
t time before touchdown, sec

At
Vi
Vv
W
X
Zxx
Y
ga
8f
gh
incremental time before touchdown_ sec
indicated airspeed_ knots
vertical velocity_ ft/sec
landing weight 3 ib
longitudinal distance from touchdown_ ft
touchdown dispersion from intended touchdown point_ ft
lateral distance from touchdown_ ft
angle of attack_ deg
angle of sideslip_ deg
aileron deflection (left horizontal-tail deflection minus right
horizontal-tail deflection)_ deg
flap deflection_ deg
horizontal-tail deflection_
Left horizontal-tail deflection + Right horizontal-tail deflection2
deg
Subscripts:
The following subscripts apply to conditions during the particular
portion of the landing approach and flare maneuver indicated.
f
ge
TD
9o
18o
fe
max
flare initiation
gear extension
touchdown
pattern base leg
pattern downwind leg
flap extension
maximum condition during flare
AIRPLANE
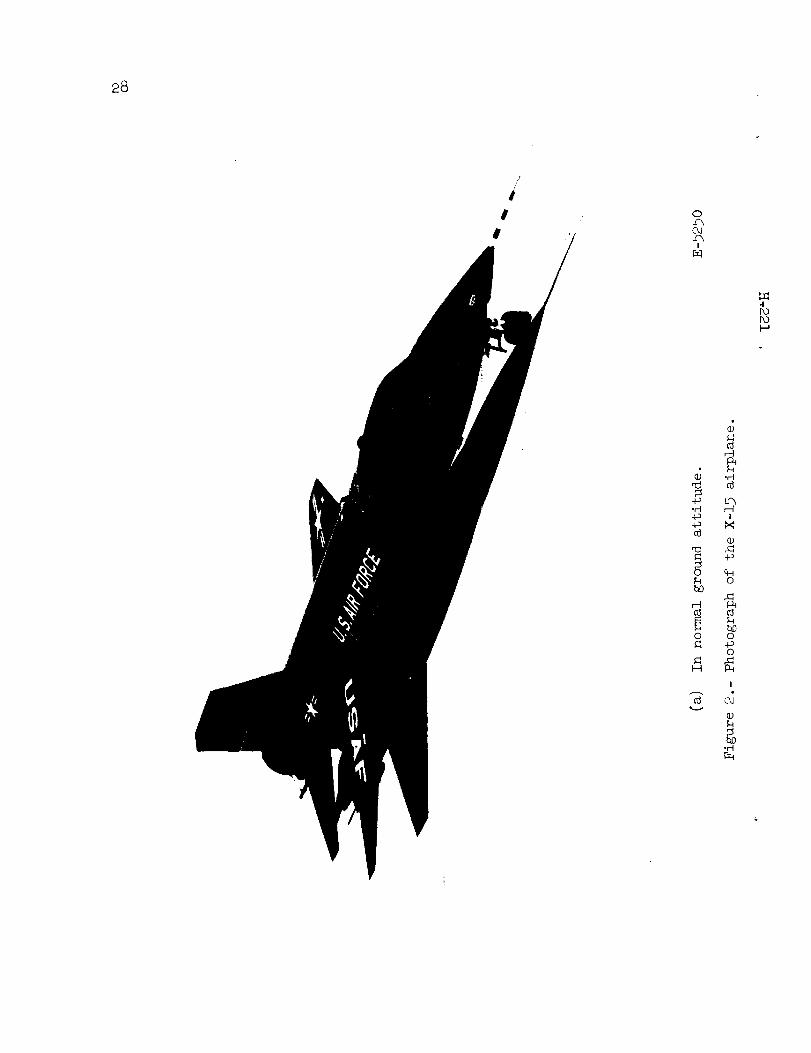
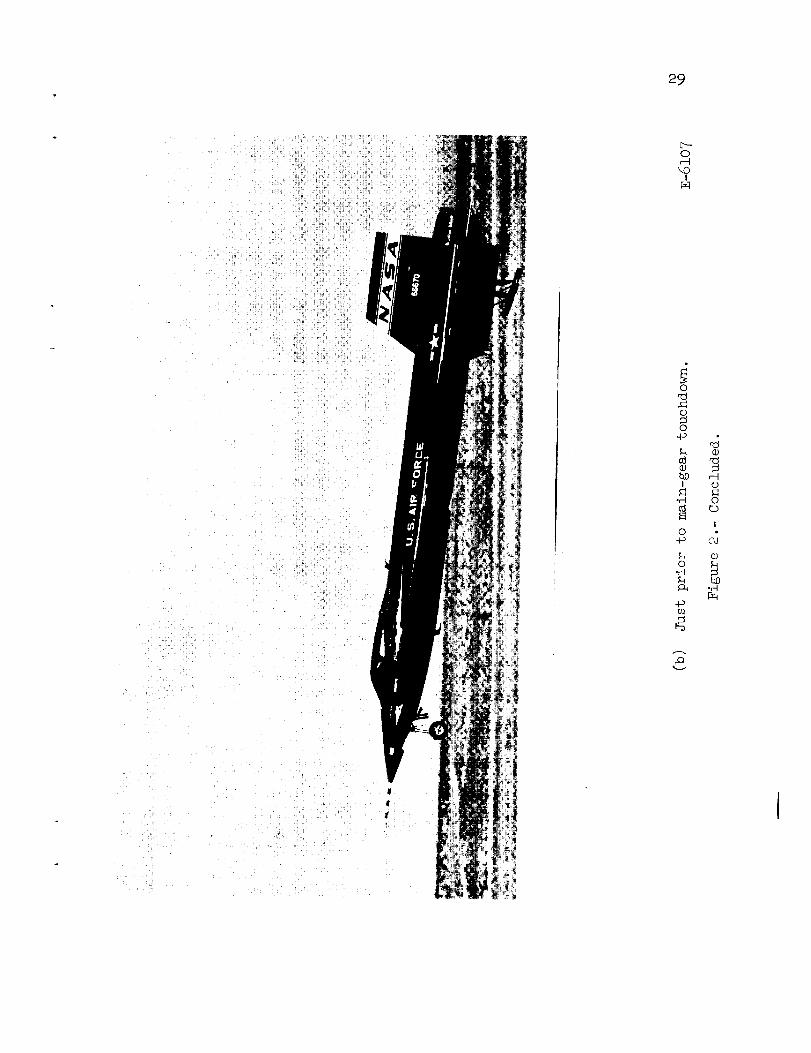
The X-15 is a single-place research airplane designed to performat speeds up to 6_600 ft/sec and altitudes _p to 250_000feet. Thepeak performance is attained during short-d_ration_ rocket-poweredflight following which the airplane perform_ an unpoweredglide to thelanding. A three-view drawing of the airplane is shownin figure i.Figure 2(a) is a photograph of the airplane in the normal groundattitude_ and figure 2(b) showsthe airplan_ in flight just prior tomain-gear touchdown. Table I contains pertinent X-15 physicalcharacteristics.
The airplane has a 5-percent-thick win_ with an aspect ratio of 2.5.Plain flaps are located at the trailing edg_ of the wing.
All aerodynamic control surfaces are actuated by irreversiblehydraulic systems. Movable horizontal-tail surfaces are deflectedessentially symmetrically for longitudinal control and differentiallyfor lateral control by meansof either a cor_ventional center stick ora side-located controller. The controllers are linked mechanically andhydraulically to provide simultaneous movementof both control sticks;however_ to obtain a given stabilizer motio_ only about one-third asmuchmovementof the side stick is required as of the center stick.The movable portions of the upper and lower wedge-sectioned verticaltails_ actuated by conventional rudder pedals_ provide directionalcontrol. Just prior to flare initiation, t_e lower movable portion ofthe vertical tail (also referred to as the _Lovablerudder) is jettisonedto allow sufficient ground clearance for lalding. Speedbrakes arelocated on the rear fixed portion of the up],er and lower vertical tails.
Augmentedaerodynamic damping of the a_rplane is provided aboutall three axes in a conventional manner. An additional interconnectdamper_termed "yar"_ furnishes a crossfeed of the yaw-rate signal intothe roll damper. The characteristics of th_ stability augmentationsystem are given in table II.
A nominal flap deflection of 40° was u_ed for the first five flightsof the number i X-15 airplane and the first three flights of the number2airplane. However_in order that a reduced drag could be obtained withoutappreciably affecting the lift_ the nominal deflection was reduced to 30°for all subsequent flights. The actual fla], deflection recorded duringeach flight and the flap-actuation time are included in the tabulationof flight-measured characteristics in table III.
The landing gear consists of a comparalively conventional dual-wheel nose gear located far forward of the airplane center of gravityand steel skids located to the rear under tle horizontal tail (fig. i).
Extensive detail of this gear system and its operation is presented inreference 6. Table III lists the gear-actuation time for each flight.
INSTRUMENTATION
The following quantities pertinent to this investigation wererecorded on NASAinternal-recording instruments_ synchronized by acommontimer:
Airspeed and altitudeNormal and longitudinal accelerationAngle of attack and angle of sideslipRolling_ yawing_ and pitching velocityAileron_ vertical-tail_ horizontal-tail; and flap deflection
The airspeed and pressure altitude were measuredwith a conven-tional NASApitot-static tube mounted on a nose boom. A descriptionof the nose boomand its accuracies is given in reference 7. Also onthe nose boomwere free-floating vanes used to measure angles of attackand sideslip. The angles presented in this paper were not corrected fortransient position errors_ since these errors were considered negligible.The angular velocities were measuredabout the airplane body axes.
Geometric altitude and ground coordinates fcr the approach-patternanalysis were obtained from multistation solutions of position datafurnished by Air Force Flight Test Center Askania cinetheodolite cameras.These cameras; operating at 4 frames per second; tracked the airplanethroughout the pattern; flare; touchdown; and ground runout. Akeleyphototheodolite cameras_ running at 19 frames per second; tracked theairplane through the final phases of the flare_ the touchdown; andground runout. A combination of the Askania and Akeley camera dataprovided altitude and rate-of-descent information during the flare andtouchdown.
During someof the more recent landings reported in this paper,an analysis of the skid imprint on the lakebed (see ref. 6) and measure-ments using the skid itself as a trailing arm (somewhat similar inprincipal to the method of ref. 8) afforded additional cross checks fordetermining the value of rate of sink at touchdown. The values obtainedfrom these independent sources generally agreed to within i ft/sec.

TESTCONDITIONS
Table III presents a listing of the pilo_ landing weight_ dampersetting_ and control stick used during the fll_re_ together withconditions existing on the downwindand base i_egsof the pattern_ atflare initiation, during flap and gear extens2on_ and at touchdown foreach flight. This tabulation forms the nucleonsof this paper and willbe referred to frequently in the subsequent sections. In the flightdesignation used in the first column of the t_le_ the first digitindicates the airplane by number (i or 2), th._ second indicates thefree-flight numberof the particular airplane, and the third indicatesthe total airborne X-15/B-52 flights for that airplane.
At least one landing has been performed _y each of the seven X-15pilots (A to G in the tabulation). Three were NASApilots_ two wereAir Force pilots_ one was a U.S. Navy pilot_ and one was a NorthAmerican Aviation pilot.
Weights at touchdownhave ranged from a _.owof 13_234 pounds whichwas experienced on the initial glide flight (_.-i-5), as discussed inreference 4_ to a high of 15_153pounds recorced on flight 2-3-9. Theaverage touchdownweight was about 14,600 pou_Lds_which correspondsto a wing loading of 73 ib/sq ft.
The numbers in the column labeled damper setting indicate thesettings for the pitch_ roll (plus yar)_ and _w dampers_respectively,for each flight. The relationship between da_er setting and gain ispresented in table II. Dampergains have varied from all dampers offfor flight 2-8-16 to all damperson at the se_ging of 4-4-8 used formost of the flights. The landing of flight 2-$-16 was madeintentionallywith all dampersoff. In flights i-i-5_ 2-2-_, 2-3-9, i-2-7_ 1-3-8,and 1-6-11, the zero gain for one damping mod__was caused by amalfunction in that particular mode.
The side stick was utilized to perform t_e flare on only theinitial flight (i-i-_) and two subsequent flights (2-9-18 and 2-10-21).On all other flights the conventional center _tick was used.
Pattern geometry varied from S-shaped pa_terns to full 360° overhead
patterns_ depending on space-positioning requirements at the high key
or initial point.
All landings reported herein were made or designated runways on
the hard surface of Rogers Dry Lake at Edwards Air Force Base_ Calif._
except for flight 2-3- 9. This flight terminated in an emergency
landing on nearby Rosamond Dry Lake following an in-flight explosion
in the engine compartment. Figure 3 is an aezial photo map of
HD "
4
Rogers Dry Lake, showing the marked lakebed runways. The initial
landing and i0 subsequent landings were performed on the longest Rogers
Dry Lake runway, designated as i in figure 3. Seventeen landings were
performed on the runway designated as 2. Also, because of appreciable
cross winds on runway i, the pilot for flight 1-5-10 elected to land on
the runway labeled 3.
For the first five flights of the number i airplane and the first
three flights of the number 2 airplane, the nominal flap deflection for
touchdown was 40 ° . Subsequent flights were performed with a nominal
30°-flap deflection at touchdown.
RESULTS AND DISCUSSION
To provide general information on the ranges of lift, drag, and
angle of attack covered in this study, the following section presents,
first, performance data for the X-15 in various landing configurations.
This is followed by a discussion of the approach patterns flown and the
flare maneuvers performed prior to landing. These maneuvers are
graphically illustrated by typical time histories and summary plots.
Finally, an assessment is made of the extensive in-flight simulations
employed in the flight program, with particular attention to the value
of such simulations and their applicability to future low-lift-drag-
ratio gliders.
Performance
Figure _ presents angle of attack, lift-drag ratio, and drag
coefficient as a function of lift coefficient for the X-15 in various
approach configurations. All data were measured during approach and
flare maneuvers and are thus representative of the lift and angle-of-
attack range covered during this portion of the landing. Because of
the transient nature of the flare and the relatively short intervals
during which the airplane remained in some fixed configurations
(notably, those with the flaps extended only) data in several
configurations are limited. Also shown in this figure are the
manufacturer's estimates of these variables based on wind-tunnel data.
Clean airplane.- Figure 4(a) presents the performance data for the
clean airplane at approach speeds (M _ 0.5 to 0.7). The flight-measured
peak lift-drag ratio is about 4.25, occurring at a lift coefficient of
about 0.45 and an angle of attack of approximately 8° . With few
exceptions, the pilots have flown on the "front side" (low CL) of the
L/D curve throughout the approach pattern. The low-lift condition is
maintained by increasing bank angle as normal acceleration is increased

8
at constant speed or by increasing bank angle or decreasing normal
acceleration, or both 3 as speed is reduced. This trend is normal, since
pilots usually like to allow some margin for reducing glide angle by
increasing lift. The estimates of the lift curve agree well with the
flight data 3 although a slight discrepancy bet_reen the flight and
predicted drag due to lift is evident. Fortun_tely, the predicted
lift-drag ratios were somewhat lower than thos._ measured in flight;
therefore, the actual landing problem was some_rhat less than anticipated.
Similar trends were evident in the data of ref,_rence 9 at higher subsonicMach numbers.
Ventral off.- Prior to flare initiation, at an altitude of several
thousand feet, the lower X-15 rudder is jettisc_ned. Data for this
configuration are presented in figure 4(b). J,_ttisoning the ventral
increases the peak lift-drag ratio to about 4.5 and slightly decreases
the lift coefficient for the peak lift-drag ra_io. Again there are few
data points on the 'back side" of the L/D cu:'ve and, as before, minor
differences exist between the flight and predicated data.
Flaps extended.- As noted previously, only eight landings were
performed with a nominal flap deflection of 40 ° (lower rudder off)_
and, since this configuration existed only bri_fly in these flights_
data in this configuration are limited_ as sho_ in figure 4(c).
Although the data seem to agree reasonably wel; with predictions_ they
are insufficient to define any trends.
Data obtained with the ventral off and a i_O°-flap deflection are
presented in figure 4(d). All data are on the front side of the L/D
curve_ with no definite peak discernible. In -_his instance_ both the
predicted drag due to lift and the lift-curve _lopes differ from
values obtained in flight.
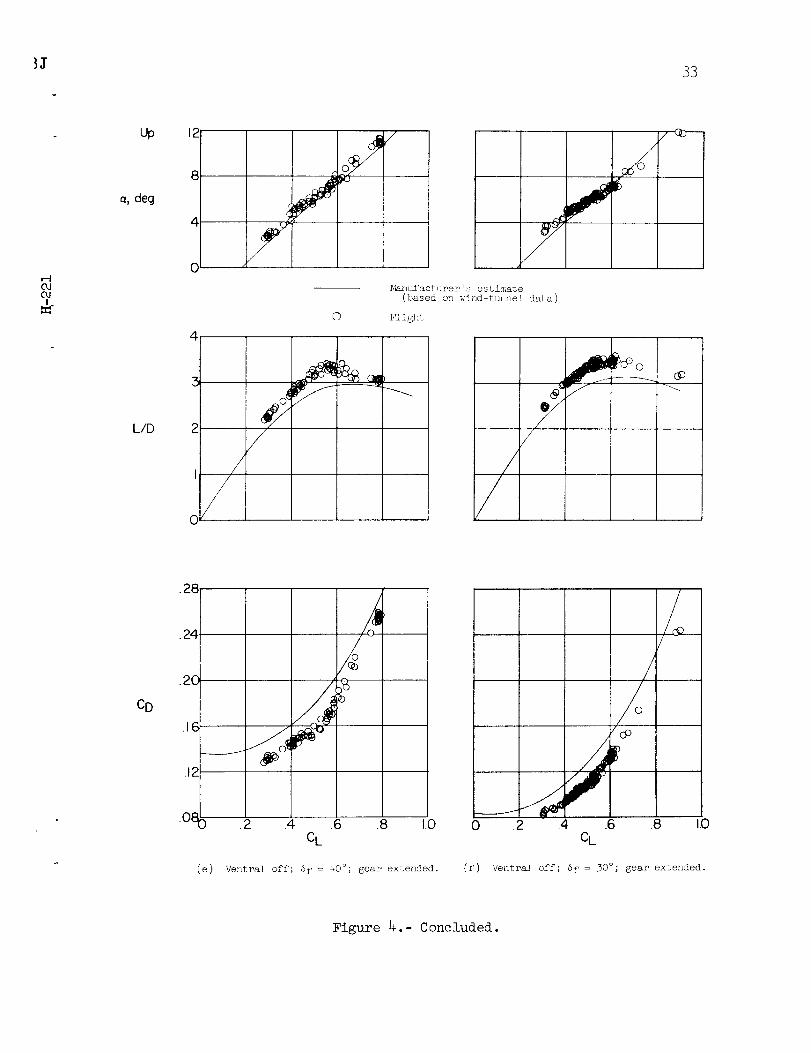
Landing configuration.- Representative da_a in the landing
configuration (ventral off_ flap and gear exte_Lded) with a flap
deflection of 40 ° are presented in figure 4(e) The peak lift-drag
ratio of 3.3 occurs at a lift coefficient of _out 0.55 and an angle of
attack of about 7° . In this instance_ the fill-drag-ratio data are
distributed on both sides of the peak and are zLoticeably higher than
predicted_ especially at low lift. It should _e noted that the flight
data in this figure do not concur with those p2"eviously reported inreference 4. The latter data were obtained u_er transient conditions
with comparatively insensitive accelerometers and_ therefore, are
considered to be less accurate than the data oJ' figure 4(e).
Figure 4(f) presents data for the landing configuration with lower
rudder off_ flaps deflected 30°_ and gear extezded. The peak lift-drag
ratio is about 3.5 and occurs at a lift coefficient of about 0.6 and an
angle of attack of about 7° . Most of the data are on the front side of

9
the L/D curve; however, some data do exist on the back side. The
flight-measured values for lift-curve slope and lift-drag ratio are
again higher than predicted.
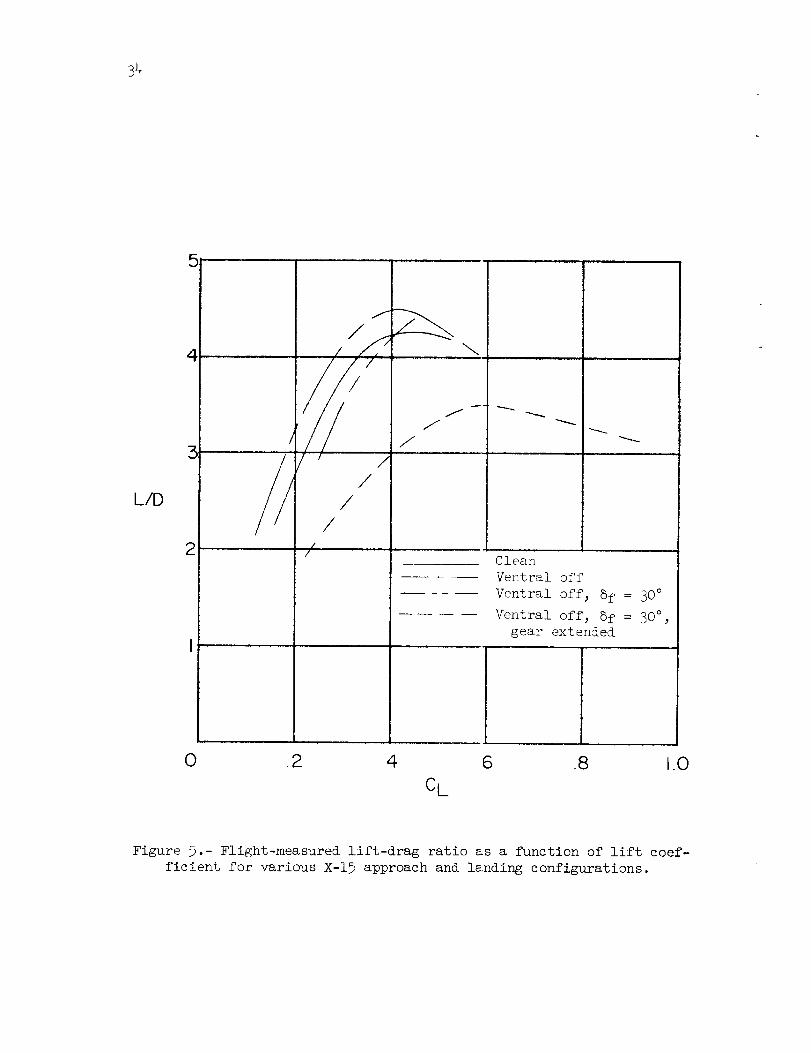
Summary.- Faired values of the flight-measured lift-drag ratios
are plotted against lift coefficient in figure 5 for the various X-15
configurations. For the configurations where the flaps are extended,only curves for 30°-flap deflection are shown inasmuch as this condition
is most indicative of that which is currently being utilized on the
airplane. The peak lift-drag ratio of 4.25 in the clean configuration
can be raised to 4. 5 by jettisoning the ventral, thereby offering a
potential means of increasing range capability. Deflecting the flaps
30 ° causes no appreciable change in the peak lift-drag ratio. As
expected, however, there is a reduction in the trim angle of attack
through the period of flap extension. In the landing configuration
(ventral off, _f = 30 °, gear extended), the peak lift-drag ratio is 3.5.
The data on the back side of the L/D curves result primarily from
landings performed at a speed lower than that for peak lift-drag ratio,
rather than from large normal accelerations during the flare. Before
touchdown is accomplished, speed can be inadvertently reduced below
that for peak lift-drag ratio (CL _ 0.6), since the speed decay with
the flaps and gear extended is of the order of 6 KIAS per second.
Pattern
Several representative X-15 approach patterns are shown in figure 6
for approach speeds averaging about 300 knots indicated airspeed. Am
S-pattern and 270 ° and 360 ° overhead patterns are illustrated. For the
360 ° overhead pattern, the high key point is greater than 20,000 feet
above the touchdown point. (In this paper, high key is defined to be
the point where the pilot terminates his glide to the landing site and
initiates his spiral turn to the touchdown point.) For the patterns
shown, the average altitude is about 12,000 feet on the downwind leg
and about 6,000 feet on the base leg. The average radius of turn in these
patterns is of the order of I0,000 feet.
As mentioned in reference 4, digitally computed preflight predictions
of pattern geometry were good. Figure 7 shows a comparison of flight and
predicted patterns. The flight pattern is somewhat tighter than the
predicted path, even though the flight-determined lift-drag ratio was
higher than predicted (as seen in fig. 4). This reflects the slightly
higher speed and bank angle preferred by the pilot in flight as comparedwith predictions.
Pattern selection.- By referring to table III, the type of pattern
flown and the speed, altitude, and space-position coordinates on the
downwind leg and base leg of the patterns can be compared from flight to

i0
flight. From this tabulation it can be seen _hat there is no predomi-nance of any particular type of pattern, except that all patternsutilized at least 180° of turning flight. The pattern selected dependedprimarily on space-positioning considerations at the high key point.The S-pattern and the 180° pattern were utili_ed most frequently oninitial flights because they were the most co_ivenient for the type ofground tracks traversed on these flights (see refs. 4 and 5).
Downwind leg.- Conditions at the maximum lateral distance from the
touchdown point were chosen as representative for the downwind leg of
each flight in table III. On 180 ° patterns where there was no point of
inflection, the point directly opposite the touchdown point (x180 = O)was selected as the downwind coordinate.
Speeds on the downwind leg varied from a_ low as 247 KIAS to as
high as 332 KIAS. The lowest altitude was 7,_82 feet, whereas the
highest was 2_293 feet. Lateral separations from the touchdown on the
downwind leg ranged from 13,557 feet to 34,24_ feet.
Base leg.- For the base leg of the pattern_ conditions at the
maximum longitudinal distance from the touchdi_wn point were chosen as
representative.
Speeds on the base leg of the pattern_ a_ shown in table III,
ranged between 246 KIAS and 338 KIAS. Altitu_[es varied between
3,479 feet and 12j394 feet 3 and longitudinal _[istance from the touchdown
varied between 13,878 feet and 34,386 feet.
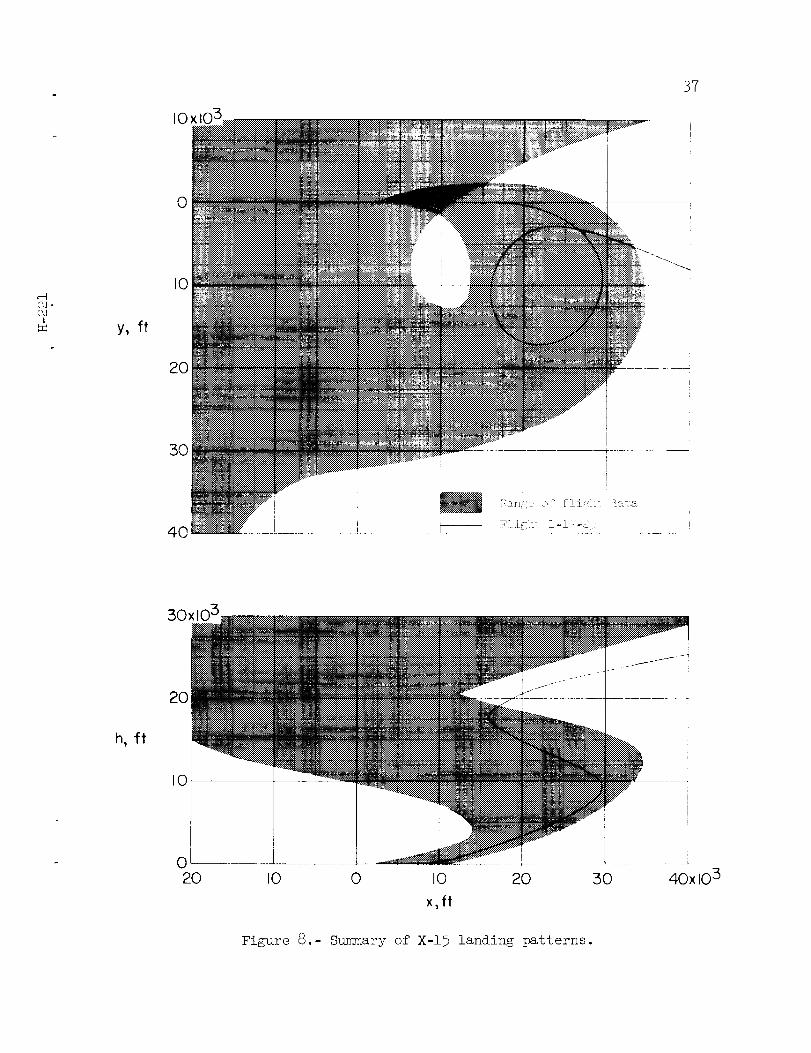
Summary.- Figure 8 shows the spread of tile patterns flown during
the first 30 landings of the X-15. The range_ of the pattern space-
position data are indicated as shaded areas. The pattern of
flight 1-13-25 is considered an exception to ;he data presented herein
and, thus, is shown individually. On this flLght an engine failure at
the most distant point in the flight trajectory was encountered and the
pilot, concerned about returning to the base _uccessfullyj performed
the pattern shown. This landing emphasizes tile wide range of landing
flexibility of even this low-lift-drag-ratio rehicle and the adapta-
bility of the pilot.
In general, the pilots encountered no serious problems in
performing the approach maneuver. The airpla_le had satisfactory control
effectiveness at approach speeds, and the vis_ility in the landing
maneuver was adequate for a research-type airplane. All pilots
performed circling patterns which were genera_ly flown with some excess
in speed (V i _ 300 KIAS) to compensate for un._ertain wind conditions
and possible misjudgment of distances. The excess energy was then
expended through use of speed brakes and maneuvering flight prior to
entry into the final approach. The resulting convergence of the
H
2
"2
i

ii
D
D
1
patterns is readily evident in figure 8 which, in turn, emphasizes the
great amount of flexibility that is available in a circling pattern
(ref. i).
Rates of descent in the pattern have been as high as 400 ft/sec at
high speeds with the speed brakes extended. However, the average rate
of sink is nearer 275 ft/sec. This value is considerably greater than
the limiting rate of sink recommended in reference i0. Because of the
consistent use of high sink rates in the X-15 landing patterns as well
as in other tests (refs. i to 3, ii, and 12), the specification of a
limiting rate of descent applicable to all vehicles is not believed to
be realistic. The choice of a limiting rate, instead; should be based
on a number of factors, such as normal approach and flare speeds, glide
angles, vehicle lift capability, available time before touchdown, and
the repeatability of the landing from a piloting standpoint.
Flare
Since most problems involved in landing the X-15 occurred during
the first few landing flares, each of the first four flights is
discussed in detail. Subsequent sections cover the effects of
technique, dampers, side-stick controller; and flap extension on the
flare and the relationship of these variables to problems encountered
in the initial flights. Finally, a summary of flare parameters is
presented and discussed. First, however, the results of a preflight
study of configuration effects are considered.
Preflight configuration study.- Well in advance of the first X-15
flight, both flight and analog simulation studies were conducted to
define the optimum flare technique to use. From this study it was
determined that flap and gear extension should be delayed until the
flare was essentially completed. The comparison of two analog time
histories in figure 9 shows the advantage of this procedure. In one
maneuver, the flaps and gear are extended at the beginning; in the other;
the flaps and gear are extended near the end of the flare. The flare-
initiation speed was 300 KIAS for both maneuvers. In the first maneuver 3
however, the flare was initiated at an altitude of about 23000 feet and
a rate of sink of slightly less than 290 ft/sec; for the second maneuver,
the altitude was only 800 feet and the rate of sink about one-half that
of the preceding maneuver. The flaps and gear were then extended at
350 feet. It is obvious, as discussed in reference 2, that the latter
technique would afford the pilot the time and margin for error in
determining the flare-initiation point that is consistent with normal
pilot capability and judgment.
First flight (1-1-5).- Details of this glide flight were reported
in reference 4. Since it was an intentional unpowered flight and no

12
propellants were carried, the landing weight o:_133234 pounds is thelowest recorded to date. Prior to pattern ent_'y3 the pilot performeda stall approach in the clean configuration ancLextended the flaps foran evaluation. The flaps were then retracted 3 and the landing patternwas entered. During these maneuvers, the lack of a pitch damper(which had failed before launch) posed no probilems. Because of timelimitations 3 the pilot was able to perform onllr these limited maneuversin evaluating the handling qualities that might be expected in theapproach and flare. Throughout the entire flii_ht 3 the pilot controlledthe airplane with the side-located controller.
Figure i0 is a time history of the events which occurred on thisflight during the flare. At an altitude of 13591 feet and an airspeedof 270 KIAS the pilot initiated the flare. About 8 seconds later theflaps started down. Near the end of the flap cycle 3 severe longitudinaloscillations developed, with peak-to-peak oscillations in angle ofattack reaching values as high as ±5° . In attempting to subdue this
motion 3 the pilot repeatedly attained the limi_ angular rate of the
horizontal stabilizer (15 deg/sec), as indicated by the saw-tooth motion
in figure i0. Touchdown was finally accomplished at an airspeed of
153 KIAS with a rate of descent of 2 ft/sec anl 3 fortunately 3 because
of restrictions on angle of attack, at the bottom of an oscillation
where the angle of attack was only 8.5 ° .
Immediate analysis of the flight records _ref. 4) considered a
number of possible contributing factors. These included the lack of
automatic pitch damping, the existence of a noalinear airplane
pitching moment with near-neutral stability at low angle of attack 3
and an oversensitivity of the side-located control stick. Pilot
impressions of this landing (see ref. 133 for _xample) indicate that 3
at the time 3 he believed the airplane to be st_tically unstable in the
longitudinal mode. Subsequent six-degree-of-freedom analog simulations
showed that the oscillations could only have been pilot-induced.
As a result of all these factors 3 it was lecided by the
manufacturer that (i) the less-sensitive center stick would be used in
subsequent landings, (2) the control-surface r_te would be increased
from 15 deg/sec to 25 deg/sec, (3) the longit_inal-force gradient
would be increased approximately 30 percent3 (4) the longitudinal
breakout force would be increased slightly 3 a_d 3 as an additional
precaution, (5) launches would be performed orly if the pitch damper
were operating. These modifications were incorporated into the
number 2 airplane. It was considered essential that these restrictions
remain in effect until additional tests could be performed to justify
relaxing the restrictions or further altering the control system.
However 3 from additional tests 3 the NASA and the USAF determined that
the higher force gradient and higher breakout force were not partic-
ularly desirable from a piloting standpoint. These changes were 3
H
2
2
i

13
H
2
2
7"
thereforej not incorporated into the number i airplane which was to be
flown in the initial joint NASA_ USAF 3 and Navy program. The surface
rate was increased_ though_ and the restriction was observed of
launching only if the pitch damper was operating.
Second flight (2-1-3).- An account of this first powered X-15
flight is given in reference 5. The flare time history for this
flight (fig. ii) shows that the flare was initiated at an altitude
slightly greater than _00 feet and at an airspeed of 242 KiAS. Shortly
thereafter 3 the flap cycle was started. Although at first_ as can be
seen in the figure_ the flap motion proceeded at a normal rate_ the
rate of extension after only 2 seconds of operation decreased abruptly.
Consequently_ at touchdown only about 60 percent of the total flap
travel had been reached. With the pitch damper operating normally and
the center stick being used for control_ the only transient noticeable
to the pilot occurred with gear extension. Thisj however_ was quickly
damped. Touchdown was accomplished at an airspeed of 184 KIAS_ a rateof sink of 4 ft/sec_ and an angle of attack of 8.1 ° .
Although the flap failed to operate properly and the pilot
prolonged the flare to the point of touchdown (indicated on the
vertical-velocity trace of fig. ii)_ this landing was comparatively
successful. Some of the concern generated by the first landing was_therefore_ dispelled.
Third flight (2-2-6).- On this flight the roll damper failed at
launch. However_ as anticipated from preflight simulator tests_ this
created no serious control problem. Figure 12 presents a time history
of the flare. With the pitch damper operating and the pilot using the
center stick_ the flare was executed from an altitude of 700 feet at an
airspeed of 244 KIAS. The flap extended properly and did not introduce
any serious transients. Because of the lack of an energy margin_ the
pilot was again forced to extend the flare to the point of touchdown_
which resulted in a relatively large rate of descent (8 ft/sec) at
contact. The airspeed at touchdown was 180 KIAS_ and the angle ofattack was 7.6 ° .
Fourth flight (2-3-9).- Shortly after launch on this flight_ an
in-flight explosion occurred in the engine compartment_ which
necessitated an emergency landing on an alternate landing site
(Rosamond Dry Lake). Again, the roll damper failed at launch.
Figure 13 shows that the flare was initiated at an altitude of
about 9_0 feet with a speed of 253 KIAS. The flare continued to brake
the vertical velocity to a point approximately 4 seconds prior to
touchdown. At this point_ the altitude was slightly greater than
30 feet_ the airspeed was 184 KIAS, and the rate of descent was 4 ft/sec.
After continuing to decelerate during the last 4 seconds_ the airplane

14
made contact at an airspeed of 161 KIAS_ a vertical velocity of
9.5 ft/sec_ and an angle of attack of i0.8 ° . The landing was hard and
resulted in major structural damage to the air,plane.
In this instance the lack of speed margi:_ at touchdown_ which had
been experienced in the previous two landings, allowed the pilot no
cushion "to feel" for the ground on an unfamiliar and unmarked landing
site. Another contributing factor to the severeness of the landing and
the damage sustained was the touchdown weight of I_183 pounds. A
limiting rate of sink of 9 ft/sec had been established, based upon a
design weight of ii_500 pounds. Howeverj as _he airplane fabrication
progressed and necessary modifications were i:_corporated into the design_
the basic airplane weight had increased to ne_rly 14_000 pounds. In
addition_ the usual quantity of propellant a_i oxidizer fluids could
not be jettisoned because of the steep descending attitude necessary to
reach the landing site. All of these factors contributed to the abnor-
mally high landing weight which even further _ompromised the allowable
rate of descent at touchdown (see ref. 6).
Effect of technique.- As was shown in th_ discussion of the first
four flights_ most of the early X-15 landing _lares were performed with
initial airspeeds of about 250 KIAS. At this speed 3 the pilot found it
necessary to prolong the flare until touchdown in order to land with a
proper rate of descent and yet not exceed the angle-of-attack limits.
Previous experience in simulating X-15 landi_!_s (refs. i and 2)
demonstrated that starting the flare with excess speed gave the pilot
a margin for adjustment at the end of the flange. This condition is
illustrated in the flare time history of figu_e 14 for another X-I_
pilot making his first flight.
The flare illustrated (fig. 14) was initiated at an altitude of
580 feet and an airspeed of 309 KIAS. It was essentially completed
20 seconds before touchdown at an altitude of 40 feet and an airspeed
of 280 KIAS. At this point_ it was possible for the pilot to extend
the flap and gear without giving undue attention to correcting the
induced transient motions. Even after flap a:id gear extension_ the
pilot was able to devote almost i0 seconds to the task of further
reducing rate of sink and touching down. In ;his instance_ touchdown
was accomplished with an airspeed of 174 KIAS an angle of attack
of 7.5 °, and a rate of sink of 5 ft/sec.
A comparison of the time history of figu;_e 14 with time histories
of the first four flights (figs. i0 to 13) sh>ws that the pilot_ by
increasing his speed margin_ had more than d_led the time available
for making a gentle landing. Increasing the _peed margin does not_ in
itself_ guarantee that the pilot will make a i_ood landing. But_ by
increasing the time interval in the presence .)f the ground_ the pilot
materially improves his chances of minimizing the rate of sink at
H
2
2
i

15
H
2
2
i-
touchdown. He affords himself a finite time interval for estimating
his rate of descent, adjusting it as required, and touching down before
speed has decayed to a dangerously low value.
Inspection of figure 14 reveals that large stabilizer control
inputs were applied during the landing_ which suggests a tendency for
the pilot to overcontrol. Similar tendencies were observed in the data
of reference 14 from which it was determined that some pilots,
particularly fighter pilots, derive a more satisfactory "feel" and
response from the controls by applying abrupt, rapid stick motions.
Other landings by pilot C_ a former fighter pilot, exhibited this
tendency_ which indicates that the cause was one of technique ratherthan overcontrol.
Effect of dampers.- As mentioned previously, lack of pitch
damping was considered to be a contributing factor in the oscillations
encountered in the first flight. That the lack of roll damping had
little effect was also noted in the initial landings. It is of
interest_ therefore, to consider the results obtained under similar
conditions in later flights_ particularly those flights made without
pitch damping.
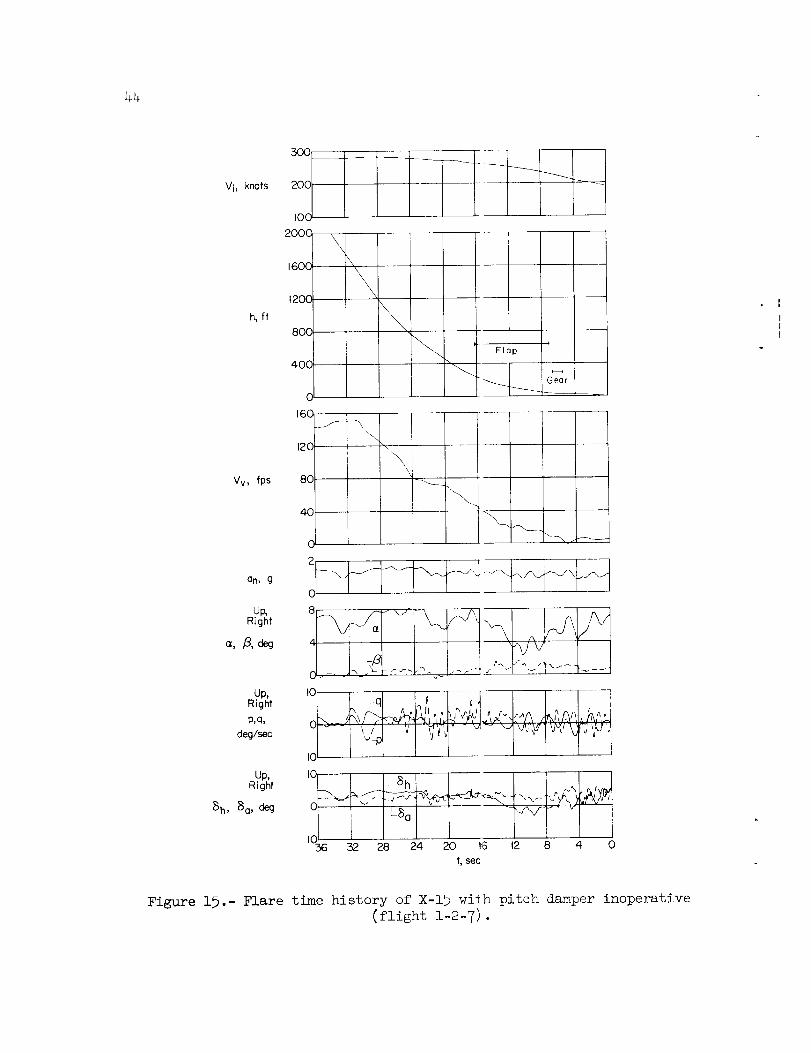
A recurrence of inoperative pitch damping took place on
flight 1-2-7 in which the damper apparently failed prior to launch.
Because of the nature of the failure_ however_ the pilot was not aware
of the trouble. Figure 15 presents a time history of the landing which
shows that a preliminary flare was performed by using the center stick
at an altitude of i;860 feet and an airspeed of 279 KIAS while the
airplane was turning onto the final approach several thousand feet to
the side of the runway centerline. A final flare was then initiated at
an altitude slightly less than 500 feet and an airspeed of 270 KIAS.
No large oscillations were encountered during this flare; and touchdown
was accomplished at an airspeed of 189 KINKS, a rate of sink of 5 ft/sec;
and an angle of attack of 7.1 °. Although the pilot realized that the
airplane did not handle as it had in the previous three flights
(because of the damper failure), he had no difficulty in making the
landing.
After a number of maneuvers were performed at safe altitudes with
all dampers intentionally inoperative, in addition to the earlier
landings with pitch- or roll-damper malfunctions; a landing with all
dampers off was demonstrated in flight 2-8-16. In this flight the
entire flare was made with the pilot using the center stick only. As
shown in figure 16_ the flare was initiated at an altitude of 630 feet
and an airspeed of 270 KIAS. Shortly after the initiation of the flap
cycle (t _ 16 sec); a transient motion in roll with a peak roll rate
of 13.5 deg/sec occurred. This was the largest roll transient observed
during any flare, including that of the glide flight. The transient

16
was quickly damped, however, and the remain0er of the landing wasroutine. Touchdown conditions were an airsleed of 185 KIAS_ a rate of
sink of 3.5 _t/sec, and an angle of attack cf 6.6 ° . This landing proved
that the X-15 could be landed with all dampers off without encountering
the objectionable oscillations experienced cn the first flight.
Evaluation of side-stick controller.- _nother factor believed to
have contributed to the oscillations experienced on the first flight
was the sensitivity of the side-stick controller used to perform the
flare. With a backlog of experience that imcluded i0 landings in the
X-15_ pilot A again tested the suitability of the side stick for landing
in flight 2-9-18. In this instance, however, the pitch damper was
operating. The time history for this flare is shown in figure 17.
Although no pronounced aircraft oscillations are evident in figure 17,
the horizontal-stabilizer and normal-acceleration curves show some
overcontrol tendencies throughout the flare. The flare was initiated
at an altitude of 464 feet and an airspeed of 282 KIAS. Touchdown was
delayed, however_ until the comparatively s]ow speed of 160 _ was
reached. The angle of attack was 11.2 ° and the rate of sink was
4 ft/sec at touchdown.
One additional landing (flight 2-i0-21) was performed using the
side stick. The pilot again had some difficulty in controlling the
airplane, particularly near the ground; and conceded at this time that
he felt he could perform more satisfactory landings with the less-
sensitive center stick. This concession do_s not necessarily imply
that the side-stick controller is unsatisfactory; however. Previous
tests at the Flight Research Center using a_ F-107A airplane equipped
with a side controller similar to that used in the X-15 showed that
low controller sensitivity for landing may Itot be an essential
requirement. Several of the X-15 pilots flc_w the F-107Aairplane and
performed; among other maneuvers_ complete landings using only the side
stick. After a number of landings were perJ'ormed; each pilot could
land equally well with the side stick and tile center stick. Thus; with
some experience_ good landings can be performed with either means of
control.
Effect of flap angle.- The improper fl_.p actuation in the second
flight_ discussed previously, actually resulted in a comfortable flare
from a piloting standpoint. Thus, a reappr_.isal of available wind-
tunnel data was made which showed that, by c ecreasing the flap travel
from 40 ° to 30°_ a reduction in drag and a c:orresponding increase in
lift-drag ratio could be obtained (see figs 4(c) and 4(d)) without
noticeably affecting the angle of attack fo:" landing. Figure 18 is a
time history of a flare with the 30°-flap extension (flight 2-7-15).
The initial flare was begun about 28 second:; before touchdown from an
altitude of about i, i00 feet and an airspeed of 297 KIAS_ followed by
H
2
2
i

_J
17
a second flare performed shortly after flap actuation. Touchdown
conditions were an airspeed of 193 KIAS, angle of attack of 7.1°_ and
rate of sink of 2.5 ft/sec.
Summary.- Figure 19 presents_ in terms of landing speed_ a summary
of various flare and touchdown parameters_ including touchdown angle of
attack and vertical velocity_ time to perform the flare_ and flare-
initiation altitude and airspeed. Touchdown statistics and limitations
are further summarized in figure 20 and table III. Each factor is
briefly discussed in the following sections_ and the variations among
the different pilots are indicated.
Examination of the data of figure 19 shows that an average X-15
flare would begin at an altitude of about 800 feet and an airspeed of
about 300 KIAS. The time required to perform the flare and touchdown
is usually less than 30 seconds. Average touchdown conditions are of
the order of an airspeed of 185 KIAS_ a rate of sink of 4 ft/sec 3 and
an angle of attack of 7°. All the pilots believed that_ when the
center stick was used_ the X-15 could be controlled adequately even
with all dampers off.
Angle of attack at touchdown: Figure 19 shows that the angle of
attack at touchdown, as expected_ generally increases with decreasing
touchdown speed. As shown_ pilot A_ in particular 3 has landed at
slower speeds than the other pilots; hence_ the touchdown angles of
attack for his flights were higher than average. In general_ the angles
of attack at touchdown have varied from about 4° at high speeds to near
Ii ° at low speeds. Also shown for reference in this figure is the angle
of attack for i g trim flight with a wing loading of 73 ib/sq ft. Since
most of the touchdowns have been made near i g_ the lower trend in angle
of attack shown for the flight data is attributed to ground effects.
Vertical velocity at touchdown: This parameterj with rates
extending to 9.5 ft/sec (fig. 19), seems to be relatively independent
of touchdown speed. The average rate of sink at touchdown of about
4 ft/sec is somewhat higher than that reported in reference 12.
Time to complete flare: The time interval from flare initiation
to touchdown also appears to be independent of touchdown speed; for
this investigation the average time is about 27 seconds.
Airspeed at flare initiation: This parameter generally increases
with increasing touchdown speed_ as might be expected. It is
interesting to note 3 however_ that the flares starting from the highest
speed (V± = 339 KIAS on flight 1-15-28) and the lowest speed
(Vi = 242 KIAS on flight 2-1-3) both terminate at touchdown airspeeds
slightly below the average of approximately 185 KIAS.

18
Altitude at flare initiation: A generally diminishing trend with
decreasing airspeed is noted for this altitude in figure 19. There is_
however_ a wide spread in the results arising from differences in flare
abruptness and the point of gear and flap extension.
Touchdown dispersion: In a number of flights; pilots B to G have
attempted to touch down at preselected points on the landing runway.
Table III summarizes the dispersions from the_e preselected points.
Three touchdowns occurred over 2_000 feet fron the intended pointj and
three others extended just beyond i;000 feet; whereas_ in five of the
more recent landings; contact was made in les_ than i;000 feet.
Excluding some of the early attempts; these d_ta verify the conclusion
of reference i that landings of the X-15 should be possible within
±i;000 feet of a designated point.
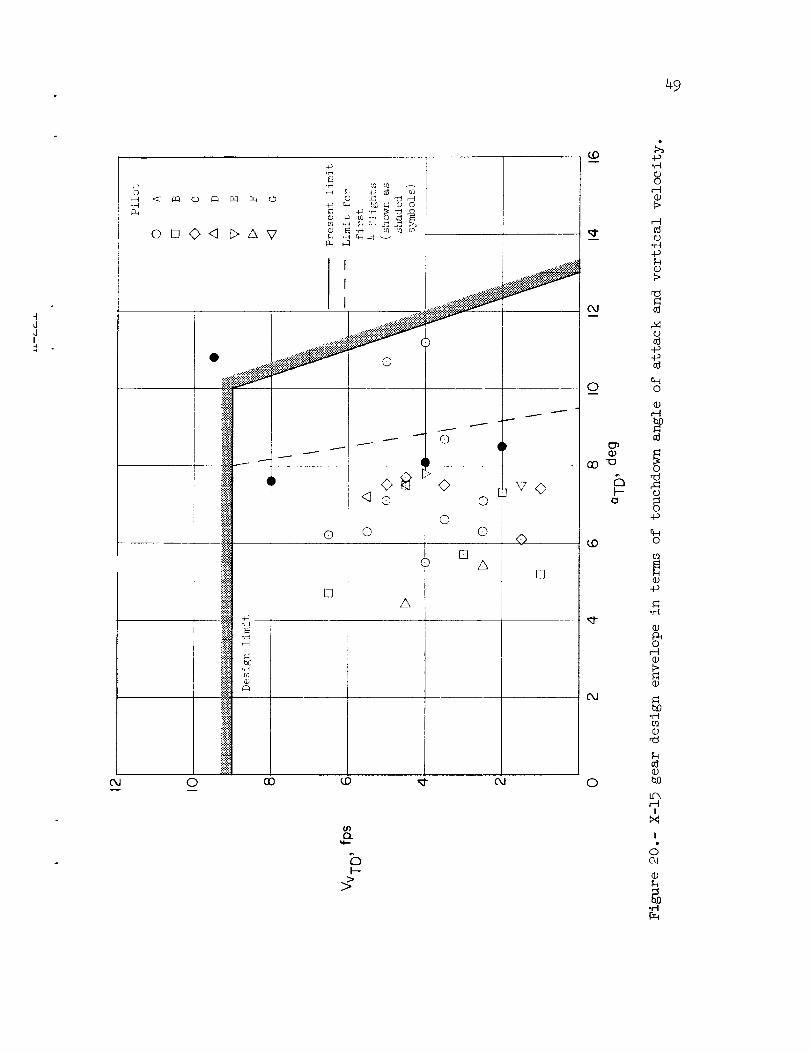
Gear design envelope: Figure 20 presents the gear design envelope
defined by touchdown angle of attack and vertical velocity. This
envelope actually imposed a rather severe tas]: on the pilot in
executing the flare so that the touchdown limitations would not beexceeded. The dashed line shows the original design limit (based upon
a design weight of ii_500 ib) applicable to tle first four landings
designated by the solid symbols. It can be s(_en that the first three
landings closely approached the limit; and th_.t the fourth considerably
exceeded the limit. As noted before; major s_ructural damage was
incurred on this landing (flight 2-3-4). Ref(_rence 6 describes in
detail the manner in which the gear was strengthened; thereby raising
the limits to the present levels (based upon a design weight of
14;500 ib) indicated by the solid lines. All subsequent landings
were within the new limits; although two landings made by pilot A were
very close to these limits.
l
Value of In-Flight Simul_tion
Prior to and during the X-15 flight prog_am_ numerous in-flight
landing simulations have been performed using, primarily; F-f04
airplanes. Fixed-base simulations served con_:urrently as a guide for
determining the range of control parameters _ich should be investi-
gated. Because the visual cues and motion st:.muli of flight were
lacking_ however_ the fixed-base simulations _Lid not provide an
adequate sense of realism. For the in-flight simulation the Flight
Research Center and the Air Force Flight Test Center used F-I04
airplanes and North American Aviation used an F-10OA. Both airplanes
approximated the X-15 wing loading.
Performance data from the F-IO4A tests; reported in reference 2;
are shown with X-15 data in figure 21. As can be seen; when
appropriate combinations of extended gearj flaps; and speed brakes are
usedj the F-104A at zero thrust should be abl_ to simulate the X-15 well.

19
The ability of the F-I04 to simulate the X-15 is more
convincingly demonstrated in figure 22_ which shows the good correla-
tion between an F-I04 flight pattern and the X-15 predicted landing
pattern previously presented in figure 7. Also included is a similar
pattern for the F-IOOA airplane used by the manufacturer with idle
engine power 3 extended gear_ speed brakej and a drag parachute. Both
of these vehicles enabled the pilots in simulated X-15 landings to
establish geographic check points and key altitudes around the pattern;
thus_ they became familiar with the precise timing required in the
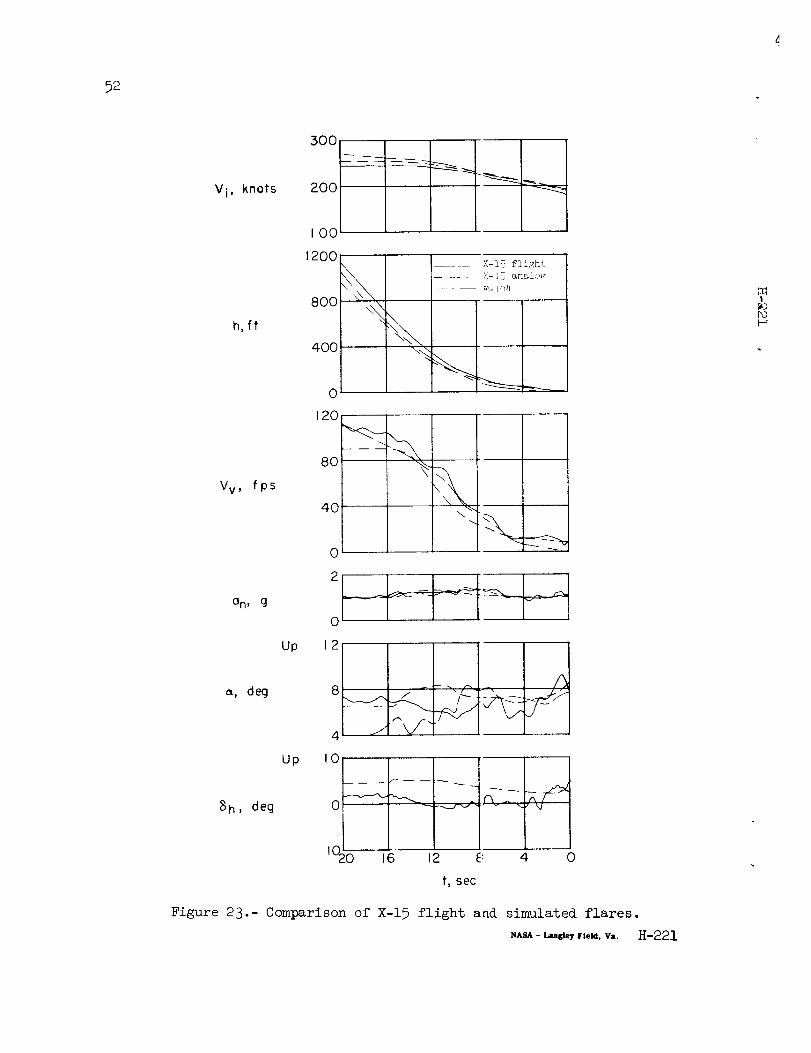
pattern by the low lift-drag ratio. Even the X-15 flare characteristics
were well represented by the F-IO4A, as can be seen in figure 23.
Speeds_ vertical velocities 3 altitudes_ and normal acceleration
correlated well_ which provided the pilot with the proper motion stimuli
and visual cues. The results from the fixed-base analog simulation are
included for comparison.
At present_ prior to each X-15 flight 3 the pilot devotes an entire
F-104 flight to simulated approaches and flares. The pilots all
readily agree on the value of these flight simulations (ref. 15) and
feel that such procedures should be seriously considered for all future
reentry gliders having low lift-drag ratios.
CONCLUDING REMARKS
This analysis of the first 30 landing approach and flare maneuvers
made with the X-15 airplane provides a useful background of flight
experience and a relatively good cross section of landing characteristics
applicable to future low-lift-drag-ratio gliders. Seven X-15 pilots_
after a suitable period of indoctrination_ have now flown the aircraft.
Among the significant results from these early X-I_ flights are the
following items:
Analysis of the flight data indicates that the peak lift-drag
ratio for the X-15 at landing speeds varied between 3.5 and 4.5_
depending on configuration_ and was somewhat higher than predicted.
In this range of lift-drag ratios the pilots were able to establish
a fairly wide range of easily controlled approach patterns and flares
without devoting undue attention to space position, pattern speeds,
or sinking rates.
In spiral-type overhead patterns starting from altitudes as high
as 40_000 feet_ the pilots_ through the use of speed-brake modulation
and maneuvering flight, were able to define a "gate" on the downwind leg
of the pattern having ±8_O00-foot altitude deviations and ±lO_O00-foot
lateral deviations and yet touch down consistently within about
±i_000 feet of a preselected point.

2O
The flare was found to be the most proble;natical phase of the X-15landings_ largely because of the relatively severe touchdown angle-of-attack limitations imposedby the landing-gear design. In the landingevaluation_ most of the airplane deficiencies and piloting problemsemergedduring the flare maneuversof the first four landings. There-after_ the task becameeasier.
A typical flare was initiated at a "comfortable" altitude of about800 feet and an indicated airspeed of approximately 300 knots3 whichallowed a margin of excess speed. Whenthe fl_re was essentiallycompletedj the flap and gear were extendedj th_s delaying to the lastpossible momentthe rapid speed decay associated with the low lift-dragratios and allowing the pilot additional time for final adjustments.Average touchdowns have been accomplished at speeds of about 185 KIASwith angles of attack of about 7° and rates of sink of about 4 ft/sec.
All the pilots believed that_ when the center stick was used_ theX-15 could be controlled adequately even with all dampers off.
The extensive fixed-base and flight simu_ations_ particularlythose madewith the F-104 airplanes_ were accurate and valuable aidsin this landing program.
I
r
Flight Research Center_
National Aeronautics and Space Administrstion_
Edwards, Calif._ April 12_ 1961

21
REFERENCES
H2
i
l.
•
.
.
.
•
.
•
.
i0.
ii.
Weil_ Joseph_ and Matranga_ Gene J.: Review of Techniques
Applicable to the Recovery of Lifting Hypervelocity Vehicles.
NASA TM X-334, 1960.
Matranga_ Gene J._ and Armstrong 3 Neil A.: Approach and Landing
Investigation at Lift-Drag Ratios of 2 to 4 Utilizing a Straight-
Wing Fighter Airplane. NASA TM X-31_ 1959.
Matranga_ Gene J._ and Menard_ Joseph A.: Approach and Landing
Investigation at Lift-Drag Ratios of 3 to 4 Utilizing a Delta-
Wing Interceptor Airplane• NASA TM X-125j 1959.
Finch_ Thomas W._ and Matranga_ Gene J.: Launch_ Low-Speed_ and
Landing Characteristics Determined From the First Flight of the
North American X-15 Research Airplane. NASA TM X-195_ 1959•
Flight Research Center: Aerodynamic and Landing Measurements
Obtained During the First Powered Flight of the North American
X-15 Research Airplane. NASA TM X-269_ 1960.
McKay_ James M._ and Scott_ Betty J.: Landing-Gear Behavior
During Touchdown and Runout for 17 Landings of the X-15 Research
Airplane• NASA TM X-518_ 1961.
Stillwell_ Wendell H._ and Larson_ Terry J.: Measurement of the
Maximum Speed Attained by the X-15 Airplane Powered With Interim
Rocket Engines. NASA TN D-6153 1960.
Dreher_ Robert C.: An Airborne Indicator for Measuring Vertical
Velocity of Airplanes at Wheel Contact. NACA TN 2906_ 1953.
Saltzman_ Edwin J.: Preliminary Full-Scale Power-0ff Drag of the
X-15 Airplane for Mach Numbers From 0.7 to 3.1. NASA TM X-430 _
1960.
Breuhaus, W. 0._ Reynolds_ P. A., and Kidd, E.A.: Handling
Qualities Requirements for Hyper-Velocity Aircraft• Rep.
No. TC-1332-F-I, Cornell Aero. Lab._ Inc._ Sept. 30, 1959
(rev. Jan. 28, 1960).
Bray, Richard S., Drinkwater_ Fred J._ III_ and White, Maurice D.:
A Flight Study of a Power-0ff Landing Technique Applicable to
Re-Entry Vehicles• NASA TN D-323_ 1960.

22
12.
13.
14.
15.
Stillwell, Wendell H.: Results of Measurements _de During the
Approach and Landing of Seven High-S_eed Research Airplanes.
NACA RM H54K24, 1955.
Crossfield_ A. Scott, and Blair_ Clayj Jr.: Always Another Dawn.
The World Publishing Co._ 196% pp. _43-344.
Pembo, Chris, and M_tranga_ Gene J.: Control Deflectionsj Airplane
Response_ and Tail Loads Measured on an F-IOOA Airplane in
Service Operational Flying. NACA RM H58C263 1958.
White 3 Robert M. 3 and Walker_ Joseph A.: Pilots Report on X-15
Flight Tests. Space/Aeronautics, vol. 35, no. 2, Feb. 1961,
pp. 55-58.

23
H
2
2
i
TABLE I.- PHYSICAL CHARACTERISTICS OF THE X-15 AIRPLANE
Wing :
Airfoil section ............... NACA 66005 (Modified)
Total area (includes 94.98 sq ft
covered by fuselage), sq ft ............... 200
Span, ft ......................... 22.36
Mean aerodynamic chord, ft ................ 10.27
Root chord, ft ...................... 14.91
Tip chord, ft ...................... 2.98
Taper ratio ....................... 0.20
Aspect ratio ...................... 2.50
Sweep at 25-percent-chord line, deg ............ 25.64
Incidence, deg ...................... 0
Dihedral, deg ....................... 0
Aerodynamic twist, deg .................. 0
Flap -
Type ....................... Plain
Area (each), sq ft ................... 8.30
Span (each), ft ..................... 4.50
Inboard chord, ft .................... 2.61
Outboard chord, ft .................. 1.O8
Deflection, down, deg .............. See table III
Ratio flap chord to wing chord ............. 0.22
Ratio total flap area to wing area ........... 0.08
Ratio flap span to wing semispan ............ 0.40
Trailing-edge angle, deg ............... 5.67
Sweepback angle of hinge line, deg ........... 0
Horizontal tail:
Airfoil section ............... NACA 66005 (Modified)
Total area (includes 63.29 sq ft
covered by fuselage), sq ft ............... 115.3 4
Span, ft ......................... 18.08
Mean aerodynamic chord, ft ................ 7.05
Root chord, ft ...................... 10.22
Tip chord, ft ....................... 2.11
Taper ratio ........................ 0.21
Aspect ratio ....................... 2.83
Sweep at 25-percent-chord line, deg ............ 45
Dihedral, deg ....................... -15
Ratio horizontal-tail area to wing area .......... 0.58
Movable surface area, sq ft ................ 51.77
Deflection -
Longitudinal, up, deg .................. 15
Longitudinal, down, deg ................. 35
Lateral differential (pilot authority), deg ....... ±15
Lateral differential (autopilot authority), deg ..... ±30
Control system. . Irreversible hydraulic boost with artificial feel

24
TABLE I.- PHYSICAL CHARACTERISTICS OF THE X-15 AIRPLANE - Concluded
Upper vertical tail:
Airfoil section .................. i0 ° single wedge
Total area, sq ft ..................... 40.91
Span, ft ......................... 4.58
Mean aerodynamic chord, ft ................ 8.95
Root chord, ft ...................... lO.21
Tip chord, ft ....................... 7.56
Taper ratio ........................ 0.74
Aspect ratio ....................... 0.51
Sweep at 25-percent-chord line, deg ............ 23.41
Ratio vertical-tail area to wing area ........... 0.20
Movable surface area, sq ft ................ 26.45
Deflection, deg ...................... ±7.50
Sweepback of hinge line, deg ............... 0
Control system. . Irreversible hydraulic boost with artificial feel
Lower vertical tail:
Airfoil section .
Total area, sq ft .....................
Span, ft .........................
Mean aerodynamic chord, ft ................
Root chord, ft ......................
Tip chord, ft .......................
Taper ratio ........................
Aspect ratio .......................
Sweep at 25-percent-chord line, deg ............
Ratio vertical-tail area to wing area ...........
Movable surface area, sq ft ................
Deflection, deg ......................
Sweepback of hinge line, deg ...............
Control system.
................ i0 ° _ingle wedge
34.41
3.839.17
i0.21
8o.780.43
23.410.17
19.95
+7.5o0
Irreversible hydraulic i_oost with artificial feel
Fuselage:
Length, ft ........................ 50.75
Maximum width, ft ..................... 7.33
Maximum depth, ft .................... 4.67
Maximum depth over canopy, ft ............... 4.97
Side area (total), sq ft ................. 215.66
Fineness ratio ...................... lO.91
Speed brake (typical for each of four):
Area, sq ft ....................... 5.57
Span, ft ......................... 1.67
Chord, ft ....................... 3.33
Deflection, deg ...................... 35
H
2
2
-i

25
H
2
2
i
H
H
H
I
O
_JQ0HE_
rj
I
I---I
-H
O
r--tr-tO
O-O.H
b0
.H
O
b0
b0
A
OmoO _-LO Lr_--_ C_ CU,-I O
O
OO O r-I r--1r-I OJ CLI C_ 0r_OOOOOOOOOO
O
OO O r-I r-I r-I CU C_ OJ CF_
O
-_I"CO CL!'qD O-_I- OD CLI_O OO O _--I_--IC_I CLI O.l Cc_D'h-_-OOOOOOOOOO
O
_OOOOOOOOOLr_O U'_O LrxO Lr_O IP'_O
0
O O OO O rq H _-4 _-_ r-_OOOOOOOOOO
• . . , • • • •
O
o@
b_@
I-I
O
_Q
b0
b0
o
bD
_d
o
b0
b0
o
b0
o
b0
bO
LFhO Lr_O L_.O Lr_O ICXOD-- LCh C_I 01_-- U'h CLI 0 D-- Lr_0 ,--t OJ C_ CF___ LghkO kO D--
• ° • • • e • • • •
0
o
bO
H
_0 _0 _0 _0 _00 _ _ _ __ _0000000000
,..,.e0e_
0
_-I od c_-__._-LC_LD D--CO C_ O,-I
O
o
IO
_Q
!
o
oc_Io
.r-I
©
_H
O+_
Oo_. ,,_t o
cQ ,__D
.r-t
O4-_
O
!O
%
O
4-_-H
o
I
o .H
Azl ,--IO _l _-_.__-I-_ Or-I•_I IZl .H
oO N• .H 4_
_-1% % m+I O % O
#zl _ rqII t_ _cl
•H O .H,-t o r-t Z_ -I-_
% r l+_ •-I_ +I O_H
O _HO
0 r--I o L_
°,-'t O•H • .r--I
+1 _" _ o _
II q-_ _ ._I ,-IO.H o _0
_-I _-I izl o@ o .H -H -HI> LrX
% [-----4_ . _-I-_+I m ON
I_H
o ,_
Azl r_
_ O_•H _ .,-4
oO N
,-q % ,% m+I O % O
II _ Azl _l
_ O_ Iz1-_© .H .H
• (1)-_ +1
% %
g-_ N_zl r-I o .HO _l ,--I
O "H
•H _I Lr_O •ON ,--t -1o
+1 0 _ 0,--t
II _q AzlrH.H O _i
H O_ _ o
I> .H
%r-14 o • 04o+I m O_z_
_ 0 _10
o o o

26
.... i IIJ i i i
g
8.
, , , , , , , , , , ,_ , _..8_. I 18 I I_ I, , , , , , , , , , ,., .... _ . _ I 111 1tI I , , , , , , ,.... ' ' ' I '_I_ I, , _ I I : I 11 I
> _ , ,_,q_q, , , , , , ,_, , ,_ ,_, , , , ,
3 ....
_-- o_ _ _, _ _ _ _ c_, o ,_ o _o_
_o
,_o_- o,o _ _x_o _ _ _
.._e , ' _ ...................
u,ooooououooouo oooououo ouuo
_ _, ,_. ,_,W, , . ,.__

c_Od!
oi i=_3
27
o
¢J
h
tc_
!
g-_o
_-_._
-r--I
!©
!
%
b.O.r'-I
28
0
oJLf_
!
4
IX)
_H
"M
•,-I r---I
_D
obD
hi?0 ©
©
H
!
I1)
t_O.r--I
29
0
I
o
©t_OI
._l
©
,%o
,el
0r_)
I
c_
q)
b.O.r-t

3o O
Scale, ft
5 I0 15 ZO x 103
!toro
Figure 3.- Photograph of Rogers Dry Lake. Runways denoted
by numbers. E-6419

Up
ct,deg
LID
12
5
4
3
2
I
0
/
0
Manufacturer's estimate
(based on wind-tum_el data)
Flight
31
.16
CD
.12
.08
J
O40
/
.i.2 4 .6 0 .2 .4 .6
CL CL
(a) Ventral on; _f : '3°; (b) Ventral off; 6f = 0°;
sear up. gear up.
Figure 4.- X-15 performance data measured during the approach and
landing.

32
Up
a, deg
L/D
8
4
0
5
4-
©
3
/c/
m
_ufacturer rs estimat_
(based on wimd-turLme data)
Flight
o//
//
i
I
O
I
!
CD
.IE
.12
.O8
.o%
(c)
J O
.2 .4 .6CL
Vei-Ltral off; 6f = _0°;
gear up.
_J
/
.2 .4 .6CL
(d) _tral off; _f = 30°;
gear up.
Figure 4.- Continu(d.
3_ 33
OJCU
Up
e, deg
L/D
12
4
0
4
0
o
/
i
/_lufacturerTs estimate
('cased on wind-t_e! data)
FIight
/4
//
/
/
CD
.28
•24
.2O
16
.12
O_
/
.2 .4 .6 .8 1.0
CL
(e) Ventral off; $f = 40°; gear extended.
//
J
0 .2 .4 .6 .8 1.0CL
(f) Ventral off; 6f = 30°; gear extended.
Figure 4.- Concluded.
34
LID
5
4
/
2
I-
/ ,,l//-
,, ,
/,
/'
/
//
Clean
Ventral off
Ventral off_ 5f = 30 °
Ventral off_ 5f = 30o ,gear extended
0 2 4 6 .8 1.0
CL
Figure 5.- Flight-measured lift-drag ratio as a function of lift coef-
ficient for various X-15 approach and landing configurations.

39
IO
OJI .
y, ft
0
,o (
20
30, in5 ,,_
30xlO 3
/J-it
\\
\
f
//
//
it./"
i" /
./ j
k
/
Pattern Flight
:3 : -16-29
27'0 ° I-LC-19
300° _-5-L->
h, ft
2O
I0
0I0 0
Touchdown
I0 20
x, fi
\
50 x I05
Figure 6.- Representative X-15 landing patterns.

36
y, ft
0
t0
20 _\
30x,n_
/J
J
/!
DO
F_
320x ,,J
h, ft IO
J
Flight
Predicted
>CIO O I0 20
Touchdown x, ft
:50 x IO5
Figure 7.- Comparison of X-15 flight and predicted patterns.
IOxlO 5
37
0
CLI-
Iy, ft
I0
2O
5O
4O
I
2O
h, ft
I0
ol2O I0 0 I0
x,ft
Figure 8.- Summary of X-19 landing patterns.
40x I05

38
Vi, knots
300
2OO
I00
320
Vv, fps
28(
24(
2OO
160
12C
8C
4O
\
\\
\
\
\
\
IFO
h, ft
2400
2000
1600
1200
800
4OO
\\
\\
\
\
\\
\\
Dc-ayed gear and
flap ext ens_on
G¢ _r ar_d flap
_xtended inltially
"l_H!Nt!t i F2_p extension
i Ge _r exl,ei±s1oi'i
\
\
\\
\\
\O'28 24 20 16 12 0
f, sec
\\
\
h\
\
\
8 4
Figure 9.- X-15 analog simulation time history showing the effect of
configuration on flare characteristics.

39
r+oJoJ
I
Vi, knots
h, ff
Vv, fps
On, g
Up,Right
a,/9, deg
Up,Right
P_ q,
deg/sec
Up,Right
8h, 8o, deg
'l/1600
1200
8OO
400--
o i
_o-I--40 I _ _o/-t
] Gear
--T
+ r
!
J
8 ....
/
4---
20
Figure i0.- Time history of the flare on X-15 flight 1-1-5.

4O
Vi, knots
h, ft
Vv, fps
On, g
Up
a, deg
Up
3OO
80(
40(
Gear,
-....,
4
I0
8h, 8f, deg I0
0
2O
\
3020 16 12 8 4 0t, sec
. IDODO
Figure ii.- Time history of the flare of X-15 flight 2-1-3.

41
Vi, knots 20C
r-{"C'_lCd
I
h, ft
Vv, fps
an, g
I00
1200
8OO
400
,
o!12C
8O
4O
0
\
Flap
IC_
Up 12
a, deg 8 //_
4
Up I0
,.,,.J8h, deg 0 < "-'-''- C_ ^ n/"
16 12 8 4 0t,sec
Figure 12.- Time history of the flare of X-15 flight 2-2-6.

42
3OO
Vi, knots 200
IOC
1200
800
h, ft
400
0
120
8O
Vv, fps
an, g
4C
\F Lap
C-e& _'
Up 12
a,deg
Up
8h, deg
4
I0
032 28 24 20 16 "12 8 4 0t, sec
troroFJ
Figure 13.- Time history of the flare of X-15 flight 2-3-9.

43
400
Vb knots
500
20C
h, ft
Vv, fps
an, g
Up
I00
800
40O
0
120
8C
4O
\\
\
0 _ /_ r'F/-_ __
12
a, deg
8 A,',,
0
Up I0
8h, deg
105t2 28 24 20 16 12 8 4
t, sec
Figure 14.- Flare time history of X-15 landing with excess speed at
flare initiation (flight 1-4-9).
44
Vi, knots
h, ft
Vv, fps
an, g
Up,Right
_, /_, deg
300
200
I00
200C
1600
120C
80C
40C
C
160
120
\
8O
4O
\\\
Flap
" Gear
0 r.
Up, I0Right
P,q, 0 _.-__'
deg/sec
I0
Up, I0Right
Sh, Sa, deg C
K_,6
\
J_l P_"' :"A _._l_,Ai_,,.A,_._
32 28 24 20 115 12 8 4 0
t, sec
I
Itt
Figure 15.- Flare time history of X-15 with pitch damper inoperative(flight 1-2-7).

Vi, knots
3OO
2OO
45
h, ft
Vv, fps
an, g
Up,Right
e, _, deg
Up,Right
P, q,
deg/sec
Up,Right
Bh, Be, deg
I00
80£
40C
\ I--
\Ge_P
12C
8C
4o
0
4
_Nvj_
,_.. j"
2O
I0
I0
iO
f,//-P
v - / 'J'_l "J_"'J "-/ ,.I %, V_q
0 _ .__--c--_....... _ __., _ .,,.,_ _' ...-,-.__---'-.__,-.d_/"-" "" "-
\--_b_
1024 20 16 t 2 8 4 0
t, sec
Figure 16.- Flare time history of X-15 landing with all dampers inoper-
ative (flight 2-8-16).

V[, knots
h, ft
Vv, fps
an, g
Up,Rig ht
a, B, deg
Up,Righf
P, q,
deg/sec
300
200
I00
BOO
400
0
120
ao'X_
4O
I
12
I0 q
,J IUp, I0
Right
8h, 8o, deg C__
t"
\._v /
t032 28 24
/---_h
'-%A
t, sec
I
DCDO
Figure 17.= Flare time history of X=I5 larding using side=stick
controller (flight 2-9-18).

47
Vi, knots
h, ft
Vv, fps
On, g
Up
_, deg
300, " ' -- _....... _1_--
200 .........I I
I
I00'
16001
i1200 x
1
800
[400!
0"
"\"x
!
! . .7b M.... t
I i
C
Up IC
i
Sh, deg 0 -- __-_! _ _'
0 ...................
12f-_ , f!
II
I _,, /%.,
__ i I
32 28
i
I
L_
F -- --
1
---j
,,,,/ "/--" Jl
I
I f_
i
24 20 16 12 8 4 0t, sec
Figure 18.- Flare time history of X-15 landing with a flap deflection
of 30 ° (flight 2-7-15).

48
Up
aTD, deg
VVT D, fps
At, sec
4
12
4
PiJ-, ,[0 A
B
0 cA D
<z E
F
besi£n Limit
\\\\\\\X,C<_\\\\\X,_.NNx.N\'__\\\\\_N\\\\_
0
) 0
,: oo _7%..c. _'
o <s 0 [] <0
4O0
i
20 _
0
0
0
340
300
Vif, knots
260
Z<V [] ZA<
0 (> o []o<b--
oq[} C
O©
(> 0
hf, ft
22O
2000
1600
1200
8OO
4OO
--C,
Oo
o
vu q<q
o0 o
0
0 A
rn2
0 ....150 160 170 180 190 ;'.00 210 220
ViTD, knots
!PO
Figure 19.- Summary of X-15 flare and touchdown parameters.
49
Od
4_O
o_Oq PAT
4a
0 _2 qJ _-I
m % _.q _ X2o _._ tnm m
I
......._,_:.'._
.... i_@iiS..• .-.-:.::: ::: : ,'::: -:::.'-', ..
.._:.,..__::i:i!_!_iiii::i_i'.".."."_'_':_i........
......,.:.:::.':ii_
i i
..:...._._
!..$.'S _
{ "
-_.:.,:
::_
O
...._.,:..,.,:.'.'_{
tI
O_ I>
j<o
o i o
I
, OIi
I[] I
i A
t
I
O
O©
QO
E1X_
00 ¢D _ O,I
I
c_vO
o
[]
t---
£_ 4_
or-I
8@>
,-t
-- O.rq4a
@
"d
0,.I _1
0
m
..p6
e_0 o
©
_0
a _I-- o
4-_
cO o
-o
.M
(9
or--Io
o
b.O
0
%
0 N
u_r---t
!M
!
0o,1
%
g.el

5o
Up
a, deg
12
8
4
0
///
X-15 clean
X-15 landing
F-IO4A (ref. 2)
5
L/D
2
I I"" ' ' '
/
/
///
f
J/
ff "
0 .2 .4 .6 .8 1.0
CL
Figure 21.- Comparison of X-15 and F-IO4A performance data for
approach and landing conditions.

51
OdCdI
y, ft
0
I0
2O
50YIn3
\
/
X-15 predicted
F-100A simulation
F-104A simulation (ref. 2 )
h, ft
20xlO 5
I0
---.....
-.........
/i/
I0 0 I0 20 50Touchdown
x, ft
Figure 22.- Comparison of predicted X-15 pattern with
flight-simulated patterns.
52
3OO
Vi, knots 200
h, ft
Vv, fps
On, g
I00
1200
8O0
400
0
120
8O
4O
0
2
0
Up 12
a, dec] 8
4
Up I0
8h, deg 0
I0.
-- _-15 flight
y_lE analo_
16 12 8 4 0
t, sec
Figure 23.- Comparison of X-15 flight and simulated flares.
,X_A - _,y Fi_w,v,. H-221
!
POp_