technical note experimental study on the performance of ...users.ugent.be/~mvbelleg/literatuur schx...
TRANSCRIPT

ARTICLE IN PRESS
Renewable Energy 32 (2007) 2617–2628
0960-1481/$ -
doi:10.1016/j
�CorrespoJapan. Tel.:
E-mail ad
www.elsevier.com/locate/renene
Technical Note
Experimental study on the performance of solarRankine system using supercritical CO2
Xin-Rong Zhanga,b,�, Hiroshi Yamaguchia, Daisuke Unenoa
aDepartment of Mechanical Engineering, Doshisha University, Kyoto 630-0321, JapanbCollege of Engineering, Peking University, Beijing 100871, China
Received 8 June 2006; accepted 1 January 2007
Available online 23 March 2007
Abstract
An experimental study is carried out to investigate the performance of a solar Rankine system
using supercritical CO2 as a working fluid. The testing machine of the solar Rankine system consists
of an evacuated solar collector, a pressure relief valve, heat exchangers and CO2 feed pump, etc. The
solar energy powered system can provide electricity output as well as heat supply/refrigeration, etc.
The system performance is evaluated based on daily, monthly and yearly experiment data. The
results obtained show that heat collection efficiency for the CO2-based solar collector is measured at
65.0–70.0%. The power generation efficiency is found at 8.78–9.45%, which is higher than the value
8.20% of a solar cell. The result presents a potential future for the solar powered CO2 Rankine
system to be used as distributed energy supply system for buildings or others.
r 2007 Elsevier Ltd. All rights reserved.
Keywords: Solar energy; Supercritical CO2; Rankine cycle; Distributed energy supply system
1. Introduction
Taking environmental pollution and energy problem as a background, the necessity ofexploiting renewable energy and research on its practical application is high. In recentyears, solar energy technologies have also been developed and the processes are moreefficient than they used to be [1–4]. For example, sunlight can be directly and efficiently
see front matter r 2007 Elsevier Ltd. All rights reserved.
.renene.2007.01.003
nding author. at Department of Mechanical Engineering, Doshisha University, Kyoto 630-0321,
+81774 65 7755; fax: +81 774 65 6831.
dress: [email protected] (X.-R. Zhang).

ARTICLE IN PRESSX.-R. Zhang et al. / Renewable Energy 32 (2007) 2617–26282618
converted into electricity and thermal heat, which comes from processes called solarphotovoltaic, solar heating, solar home heating, solar dry, solar cooker, solar waterheating and solar thermal power, etc. In 2004, a small distributed power supply system wasproposed in order to contribute to effective utilization of the solar energy and solution ofenvironmental pollution problems [5]. The system is named solar CO2 Rankine system(SCRS), which utilizes solar energy as energy source and CO2 as working fluid. A basicstudy on feasibility of constructing a solar Rankine cycle of using evacuated collector andsupercritical CO2 as working fluid was carried out [6,7], which also includes analyses ofeconomic aspects and environmental profits. The obtained results show that CO2 can beefficiently converted into high-temperature supercritical state in the solar collector andsupercritical CO2 seems a good working fluid to collect heat efficiently. But the detaileddata of the proposed solar Rankine cycle is not far enough. Therefore, in the present study,an experimental study was carried out in order to increase knowledge of the solar Rankinesystem performance using supercritical CO2 as working fluid.
2. Outline of the SCRS
The SCRS is composed of solar collectors, turbine, heat exchanger and CO2 feed pump.Fig. 1 shows the outline of SCRS.In the process 4 to 1, CO2 is heated by solar heat energy collected in the solar collector
tubes and becomes a high-temperature supercritical fluid. In processes 1 to 2, CO2 isexpanded to drive a turbine and makes electric power available. In processes 2 to 3, CO2 iscooled by water or other fluids in the heat exchanger and changes into a liquid state andthe heat energy obtained from the process can be utilized effectively for heating water,refrigeration or others. In the process 3 to 4, liquefied CO2 is pumped back into highpressure, into the solar collector. The importance of this system is to produce electricenergy and heat energy simultaneously from solar thermal energy.
Solar energy
Evacuated solar collector
Feed pump
Heat exchanger
Heat output
turbine
Power output
2
3
4
1
Fig. 1. Schematic diagram of a solar energy powered Rankine cycle using supercritical CO2 for combined power
output and heat collection.

ARTICLE IN PRESS
Table 1
Comparison of various working fluids
Mediums Ozone depletion
potential (ODP)
Global warming
potential (GWP)
Safeness
HCFC R22 0.055 1700 A1
HFC R134a 0 1300 A1
R404A 0 3850 A1
R407C 0 1370 A1
R410A 0 1370 A1
R507A 0 3900 A1
Natural R717 0 o1 B2
NH3
R290 0 3 A3
C3H8
R600a 0 3 A3
C4H10
R744 0 1 A1
CO2
ODP: the value of CFC-11 is defined as 1. GWP: the value of CO2 is defined as 1. (A) Low-toxicity, (B) high-
toxicity, (1) non-combustible, (2) low combustible, (3) high combustible.
X.-R. Zhang et al. / Renewable Energy 32 (2007) 2617–2628 2619
CO2 is a natural fluid, which is non-toxic, non-ignitable, and exists everywhere in natureand has advantages over other fluids used (such as Freon). Table 1 shows the properties ofsome fluids.
3. Experimental work
Fig. 2 shows the testing machine of SCRS and other experimental equipmentconstructed. A pressure relief valve is installed instead of a turbine. The opening of thevalve can be adjusted in the range of 0.0–30.0mm. An evacuated collector is adopted andthe effective area of the evacuated solar collector is 9.6m2. The absorption ratio of selectivesurface is 92.7% and the emissivity is 1.93% and it can stand temperature up to 250 1C.Fig. 3 shows the appearance of the evacuated solar collector. The details of the collectorused and other components in the SCRS testing machine can be seen in Refs. [5,8]. CO2 iscooled at the cooler (heat exchanger 1) and liquefied at the condenser (heat exchanger 2).Water temperature at the condenser can be adjusted.
In this study, the measurement parameters are temperatures T1–5 and pressures P1–5 ofCO2 at 5 points (as shown in Fig. 2), CO2 flow mass G and global solar radiation I. Theelectricity output of the solar cell wS is also measured for a purpose of comparison withthat of SCRS. The solar cell has 0.96m2 effective area.
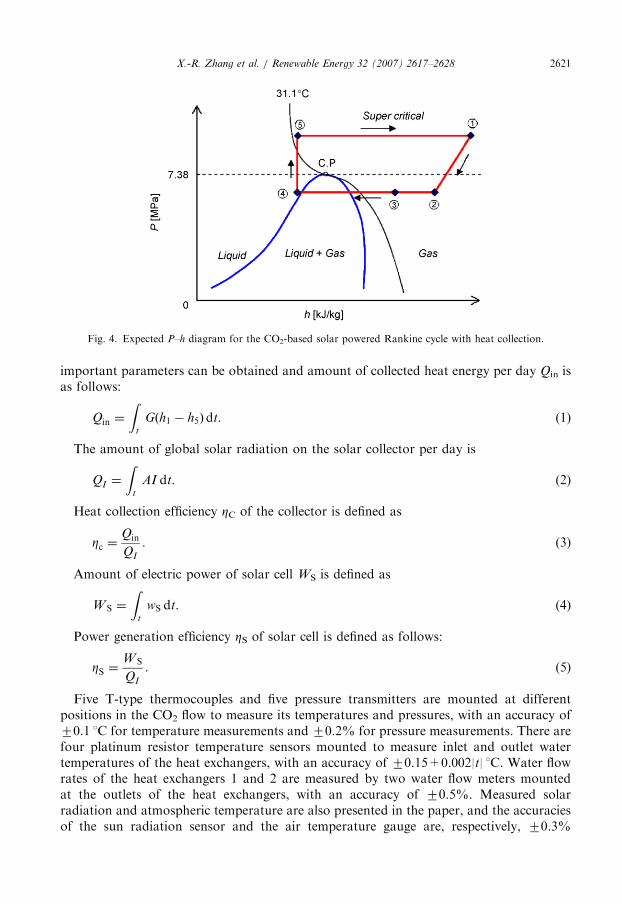
Physical properties of CO2 are calculated by database PROPATH V12.1 [9]. The valuesof enthalpy h1–5 are obtained based on measured temperatures and pressures for eachmeasuring point. Fig. 4 shows expected CO2-based trans-critical Rankine cycle by P–h
diagram. Processes 5 to 1 show heating by the solar collector, processes 1 to 2 showexpansion by the expansion valve, processes 2 to 3 and 3 to 4 show cooling by thecondenser, processes 4 to 5 show pump up by pumping CO2 by feed pump.

ARTICLE IN PRESS
Evacuated solar collector
Pressure relief valve
Heat exchanger 1
Heat exchanger 2
CO2 pump
Mass flow meter
Flow meter (Hot water)
Flow meter (Cold water)
Pump (Cold water)
Solar radiation sensor
Solar cell
Air temperature sensor
Computer
Pump (Hot water)
Pump (Cooling water)
Cooling tower
Heat exchanger 3
Temperature and Pressure monitoring point )Temperature monitoring point )
1
2
3
4
5
6
7
8
9
10
11
12
13
14
15
16
17
16 15 14 6
5
17 4
13 12 8 11 9 10
1
2
3
7
5
4
3
2
1
CO2
(
(
Fig. 2. Schematic diagram of testing machine of the CO2-based solar powered Rankine system.
Fig. 3. A photography of the evacuated solar collector used in the testing machine.
X.-R. Zhang et al. / Renewable Energy 32 (2007) 2617–26282620
The heat energy qin that CO2 fluid absorbs in the collector means the product ofenthalpy difference between inlet and outlet of the solar collector and CO2 flow massqin ¼ Gðh1 � h5Þ. Total amount of solar radiation on the solar collector qI is calculated bythe product (qI ¼ AI) of the effective area (A ¼ 9.6m2) and solar radiation (I). Some
ARTICLE IN PRESS
Fig. 4. Expected P–h diagram for the CO2-based solar powered Rankine cycle with heat collection.
X.-R. Zhang et al. / Renewable Energy 32 (2007) 2617–2628 2621
important parameters can be obtained and amount of collected heat energy per day Qin isas follows:
Qin ¼
Zt
Gðh1 � h5Þdt: (1)
The amount of global solar radiation on the solar collector per day is
QI ¼
Zt
AI dt. (2)
Heat collection efficiency ZC of the collector is defined as
Zc ¼Qin
QI
. (3)
Amount of electric power of solar cell WS is defined as
WS ¼
Zt
wS dt. (4)
Power generation efficiency ZS of solar cell is defined as follows:
ZS ¼WS
QI
. (5)
Five T-type thermocouples and five pressure transmitters are mounted at differentpositions in the CO2 flow to measure its temperatures and pressures, with an accuracy of70.1 1C for temperature measurements and 70.2% for pressure measurements. There arefour platinum resistor temperature sensors mounted to measure inlet and outlet watertemperatures of the heat exchangers, with an accuracy of 70.15+0.002|t| 1C. Water flowrates of the heat exchangers 1 and 2 are measured by two water flow meters mountedat the outlets of the heat exchangers, with an accuracy of 70.5%. Measured solarradiation and atmospheric temperature are also presented in the paper, and the accuraciesof the sun radiation sensor and the air temperature gauge are, respectively, 70.3%

ARTICLE IN PRESSX.-R. Zhang et al. / Renewable Energy 32 (2007) 2617–26282622
and 70.15+0.002|t| 1C. During the experiment, the two major error sources are:(1) temperature, pressure and flow rate measurement accuracy; (2) error resulting fromdata logging and reading by the computer. The error of data logging and reading are:70.1% for CO2 temperature; 70.3% for CO2 pressure; 70.3% for CO2 mass flow rate;70.2% for water temperature; 70.3% for water flow rate; 70.3% for solar radiation and70.2% for atmospheric temperature. A detailed error analysis was carried out, indicatingthat the maximum uncertainty in the performance parameters is less than 73.0% [6].Therefore, these errors are acceptable for the present study.
4. Results and discussion
In the present paper, the SCRS performance is investigated based on daily, monthly andannual experimental data. The measured data of solar radiation and air temperature, CO2
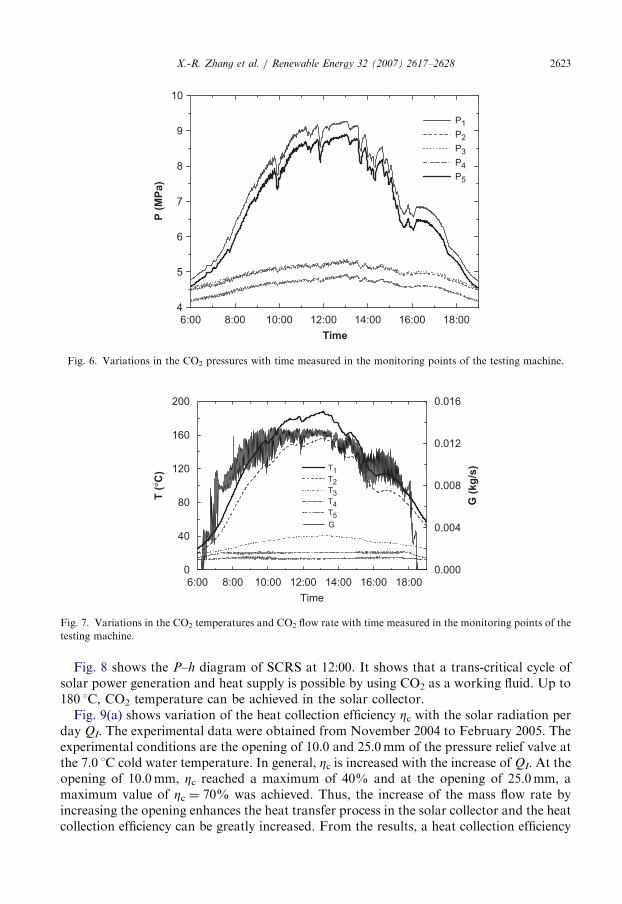
pressures, CO2 temperatures and CO2 mass flow rate are shown in Figs. 5–7, respectively.The experiment was carried out on June 13, 2005, and the cold water temperature of thecondenser is fixed at about 10.0 1C. The opening of the pressure relief valve is adjusted at22.5mm.From Fig. 5, the solar radiation data show the maximum value of 0.80 kW/m2. The
weather condition shown in the figure represents average one, i.e., not very sunny and notvery cloudy. From Fig. 6, the pressure increases with solar radiation, and a maximumpressure 9.26MPa is achieved. With the decrease in the solar radiation, the CO2 pressuredecreases. From Fig. 7, CO2 temperature reaches a maximum value of 187 1C. The dataobtained of CO2 temperature show similar variations with CO2 pressure. It means thatboth T and P increase with I and decrease with decrease of I. The measured CO2 mass flowrate shown in Fig. 7 also varies with solar radiation I. A relatively stable CO2 flow rateachieved in the SCRS system can be seen in Fig. 7. Although the CO2 flow rate is closelyrelated to solar radiation I, the flow rate G would not drop suddenly with sudden solarradiation drop. During 15:00–17:00, an obvious drop of CO2 flow rate is observed, whichmay be contributed to the cloudy period of 15:00–17:00 and the drop in solar radiationduring that time period.
0.0
0.2
0.4
0.6
0.8
1.0
6:00 8:00 10:00 12:00 14:00 16:00 18:00
T (
°C)
I (k
W/m
2)
Time
Solar radiation
0
10
20
30
40
50
Air temperature
Fig. 5. Variations in the solar radiation and atmosphere temperature measured with time.
ARTICLE IN PRESS
4
5
6
7
8
9
10
6:00 8:00 10:00 12:00 14:00 16:00 18:00
P (
MP
a)
Time
P1
P2
P3
P4
P5
Fig. 6. Variations in the CO2 pressures with time measured in the monitoring points of the testing machine.
0
40
80
120
160
200
6:00 8:00 10:00 12:00 14:00 16:00 18:00
Time
G (
kg
/s)
T (
°C) T1
T2
T3
T4
T5
0.000
0.004
0.008
0.012
0.016
G
Fig. 7. Variations in the CO2 temperatures and CO2 flow rate with time measured in the monitoring points of the
testing machine.
X.-R. Zhang et al. / Renewable Energy 32 (2007) 2617–2628 2623
Fig. 8 shows the P–h diagram of SCRS at 12:00. It shows that a trans-critical cycle ofsolar power generation and heat supply is possible by using CO2 as a working fluid. Up to180 1C, CO2 temperature can be achieved in the solar collector.
Fig. 9(a) shows variation of the heat collection efficiency Zc with the solar radiation perday QI. The experimental data were obtained from November 2004 to February 2005. Theexperimental conditions are the opening of 10.0 and 25.0mm of the pressure relief valve atthe 7.0 1C cold water temperature. In general, Zc is increased with the increase of QI. At theopening of 10.0mm, Zc reached a maximum of 40% and at the opening of 25.0mm, amaximum value of Zc ¼ 70% was achieved. Thus, the increase of the mass flow rate byincreasing the opening enhances the heat transfer process in the solar collector and the heatcollection efficiency can be greatly increased. From the results, a heat collection efficiency

ARTICLE IN PRESS
Fig. 8. Measured P–h diagram for the CO2-based solar powered Rankine cycle.
X.-R. Zhang et al. / Renewable Energy 32 (2007) 2617–26282624
up to 70% is achieved from the experimental data for the SCRS system. Fig. 9(b) showsthe results obtained at the opening of 22.5mm from the end of May to the middle of June2005. QI changes over about 80MJ/day and Zc ranges from 64% to 73%. QI ¼ 80MJrepresents cloudy day weather. Thus, a high collection efficiency of average 70% can beobtained even in cloudy day conditions. One point of Zc ¼ 15% is seen in the figure, whichrepresents a day of heavy rain and a cloudy day condition. Based on the above results, theheat collection efficiency of 70% is obtained as a representative value.The experimental results in which both thermal energy collection and solar radiation are
given from almost 1 year (starting from November of 2004) are shown in Fig. 10, but notall data during the year are used, because of system maintenance and other experimentsbeing carried out. Fig. 11 shows the relationship between solar radiation and averagepower generation efficiency of a solar cell. Based on these data in Fig. 10, Q̄I decreasesfrom 79.2MJ/day in November 2004 to 66.9MJ/day in December 2004. Further, itincreases from January 2005, reaching highest value 161.5MJ/day in May, 2005. The solarradiation in June is less than that of May, because raining time period in June increases.The experimental conditions from November 2004 to February 2005 are the opening10.0mm of the valve and 7.0 1C at the cold water temperature of the condenser, and theopening 22.5mm and the cold water temperature 10.0 1C from April to July 2005. All thedata show the collection efficiency can be obtained above 0.50. From April to June of2005, an average value of 0.65 is found for the heat collection efficiency. On the otherhand, the annual data obtained in the experiments (shown in Fig. 11) present the powergeneration efficiency of solar cell at a value of 8.20%.Based on Figs. 9 and 10, if the opening of the expansion valve is kept more than 22.5mm
and a value of the heat collection efficiency above 0.65–0.70 can be expected. Furthermore,a thermodynamic analysis was carried out to investigate thermal efficiency of the CO2

ARTICLE IN PRESS
QI [MJ/Day]
η C [
-]
0 50 100 150 200 250
0.2
0.4
0.6
0.8
1.0
10.0 mm
25.0 mm
1.0
0.8
0.6
0.4
0.2
0 20 40 60 80 100 120 140
QI [MJ/Day]
η C[-
]
Fig. 9. (a) Variations of the collecting efficiency with the amount of solar radiation per day measured from
November of 2004 to 2005 February beginning (the opening of the expansion valve is at 10.0 and 25.0mm,
respectively). (b) Variations of the collecting efficiency with the amount of solar radiation per day from the end of
May to the June middle of 2005 (the opening of the expansion valve is at 22.5mm).
X.-R. Zhang et al. / Renewable Energy 32 (2007) 2617–2628 2625

ARTICLE IN PRESS
Fig. 10. Monthly averaged collected energy in the collector and solar radiation during one year.
0.10
0.08
0.06
0.04
0.02
1 2 3 4 5 6
month
7 8 9 10 11 12
η S[-
]
Fig. 11. Power generation efficiency of solar cell measured during 1 year.
X.-R. Zhang et al. / Renewable Energy 32 (2007) 2617–26282626
Rankine system (a ratio of power generation and the energy input into the Rankinesystem) [10,11]. The result obtained shows the thermal efficiency is 13.5% for thetemperature and pressure levels in the present paper and the maximal value is found at16.5%. Therefore, the power generation efficiency (defined as a ratio of power generationand solar radiation) of the SCRS system is above 8.78–9.45% (the theoretical maximum isabove 10.7–11.6%), which is a little higher than that of solar cell (8.20%). The powergeneration efficiency of the proposed system is closely related to the collection efficiency ofthe solar collector (using supercritical CO2 as working fluid) and the thermal efficiency of

ARTICLE IN PRESSX.-R. Zhang et al. / Renewable Energy 32 (2007) 2617–2628 2627
the thermodynamic cycle (CO2-based). Enhancements in heat transfer and improvementsin flow distribution uniformity in the collector have a potential to improve the collectionefficiency and further the power generation of the system. In addition, optimization of CO2
temperatures and pressures also improves the power generation efficiency in the future.However, in addition to the power generation, SCRS can also supply heat energy/refrigeration. In the economic comparison, a cost calculation was carried out for theproposed system, which gave a cost of US$0.047 per kWh for the total energy output andUS$0.176 per kWh for electric energy [6]. For PV cell system, the present cost is aboutUS$0.410 per kWh for electric energy generation [12]. The above comparison indicates apotential future for distributed energy supply system.
5. Conclusions
The performance of solar Rankine system using supercritical CO2 as working fluid isexperimentally studied in the paper. The solar Rankine system consists of evacuated solarcollectors, power generating turbine, heat collection system and CO2 feed pump. In thepresent study, an expansion valve is installed in place of a turbine. The experimental datashow that a CO2-based trans-critical cycle can be achieved by using solar energy as anenergy source in the Rankine system. The heat collection efficiency of the collector usingsupercritical CO2 as working fluid is found about 70.0%, even on cloudy days. The resultobtained also shows that the power generation efficiency of the SCRS is found at8.78–9.45% (the theoretical maximum is above 10.7–11.6%), which is higher than thevalue 8.20% of the solar cell. Furthermore, the performance of the solar energy poweredsystem can be enhanced by optimizing the system and using a true turbine. The resultspresent a good potential of the CO2-based solar Rankine system used as a distributedenergy supply system.
Acknowledgment
This study was supported by the Academic Frontier Research Project on ‘‘NextGeneration Zero-Emission Energy Conversion System’’ of Ministry of Education, Culture,Sports, Science and Technology, Japan.
References
[1] Mills DR. Advances in solar thermal electricity technology. Sol Energy 2004;76:19–31.
[2] Goswami DY, Vijayaraghavan S, Lu S, Tamm G. New and emerging developments in solar energy. Sol
Energy 2004;76:33–43.
[3] Goswami DY. Solar thermal power technology: present status and ideas for the future. Energy Sources
1998;20:137–45.
[4] Xu F, Goswami DY, Bhagwat SS. A combined power/cooling cycle. Energy 2000;25:233–46.
[5] Zhang XR, Yamaguchi H, Fujima K, Enomoto M, Sawada N. A feasibility study of CO2-based Rankine
cycle powered by solar energy. JSME Int J, Ser B 2005;48(3):540–7.
[6] Yamaguchi H, Zhang XR, Fujima K, Enomoto M, Sawada N. A solar energy powered Rankine cycle using
supercritical carbon dioxide. Appl Therm Eng 2006;26:2345–54.
[7] Zhang XR, Yamaguchi H, Uneno D, Fujima K, Enomoto M, Sawada N. Analysis of a novel solar energy
powered Rankine cycle for combined power and heat generation using supercritical carbon dioxide. Renew
Energy 2006;31:1839–54.

ARTICLE IN PRESSX.-R. Zhang et al. / Renewable Energy 32 (2007) 2617–26282628
[8] Zhang XR, Yamaguchi H, Fujima K, Enomoto M, Sawada N. Study of solar energy powered transcritical
cycle using supercritical carbon dioxide. Int J Energy Res 2006;30:1117–29.
[9] PROPATH GROUP, PROPATH V12.1, 2001; /http://gibbs.mech.kyushu-u.ac.jpS.
[10] Zhang XR, Yamaguchi H, Uneno D. Thermodynamic analysis of the CO2-based Rankine cycle powered by
solar energy. Int J Energy Res, in press.
[11] Uneno D. Research on characteristics of solar CO2 Rankine system using supercritical state, Master’s thesis,
Department of Mechanical Engineering, Doshisha University, Japan, 2006. p. 11–8.
[12] The 8th new energy and energy conservation symposium in Kansei, 2005. p. 10–1 [In Japanese].