technical memorandum salmon creek treatment plant …...the salmon creek treatment plant (sctp) is a...
TRANSCRIPT

T E C H N I C A L M E M O R A N D U M
1
Salmon Creek Treatment Plant Phase 4 Odor Control Update
PREPARED FOR: John Peterson/Clark Regional Wastewater District
COPY TO: File
PREPARED BY: Alex Demith/CH2M
DATE: July 28, 2017
PROJECT NUMBER: 688766.03.30.04
Introduction The Salmon Creek Treatment Plant (SCTP) is a typical secondary treatment plant comprised of common unit processes that, in addition to the important work of treating wastewater, also generate odors as a byproduct of the various physical and biological treatment processes. These odors are primarily hydrogen sulfide (H2S) and smaller amounts of other organic reduced sulfur compounds (methyl mercaptans, dimethyl disulfide, etc.), all traditionally associated with secondary treatment plants. These odors can drift across plant property lines and affect nearby residents. This technical memorandum (TM) provides a comprehensive evaluation of odor control offsite impacts related to the SCTP and makes recommendations for meeting regulatory requirements pertaining to odor emissions.
Background In 2005, CH2M completed a preliminary design for the Phase 4 Expansion Program for the SCTP where a variety of odor control upgrades were explored. As a result of this effort, an odor control system was constructed for treating foul air from the Sludge Blend Tank, and a separate odor control system was constructed for serving the 117th Street Pump Station (also known as the Klineline Pump Station) force main discharge at SCTP. A preliminary design was also completed which included a bioscrubber/bio-trickling filter to treat foul air from the headworks and primary clarifiers. However, the implementation of this odor control system was deferred due to lack of an explicit regulatory permit driver at the time and lack of financial resources available for the program.
In March 2007, odor sampling and odor dispersion modeling activities were performed pertaining to the SCTP for the purpose of characterizing the odor footprint at the SCTP.
Since the work was completed in 2005 and 2007, multiple changes have occurred that justify updating the previous analysis for understanding future needs for the facility. These changes include the following:
• Residences (odor receptors) have been and are continuing to be constructed in close proximity to the plant. This means that current and future odor receptors are located closer to the SCTP than previously identified.
• Emissions (specifically toxic air pollutants) regulatory requirements have changed since completion of the previous work.
• Technologies including bio-trickling filters and biofilter medias have evolved and improved since completion of the previous work. Specifically, acceptable loading rates (both bed velocity and inlet
PHASE 4 ODOR CONTROL UPDATE
2
odor loadings) have gradually increased, making required footprints smaller. In addition, media types have improved, with longer life media now available.
Purpose This TM provides an update to previous work completed, including the following:
• Dispersion model update to account for additional odor receptors encroaching closer to the SCTP boundary.
• Dispersion model update to determine how toxic air pollutant (TAP) emissions regulatory requirements can be met.
• Updated technology evaluation of specific biological technologies to capture recent advances in the field and make recommendations for most preferred vapor phase odor control approach for SCTP.
• Updated costs for selected vapor phase odor control systems.
This TM provides a comprehensive odor evaluation that builds on previous work completed and provides a current update for facilitating funding decisions and capital improvements implementation plans moving forward.
Phase 4 Odor Control System Preliminary Design In 2005, CH2M completed a preliminary design for the Phase 4 Expansion Program for the SCTP. This effort included an evaluation of various odor control technologies capable of serving preliminary treatment (headworks) and primary treatment (primary clarifiers).
Odor Control System Sizing Criteria As part of the Phase 4 effort, detailed ventilation calculations were completed. These ventilation rates were identified as meeting the following objectives:
• Provide adequate ventilation to protect maintenance personnel within occupied spaces per National Fire Protection Association (NFPA) 820, Fire Protection in Wastewater Treatment and Collection Facilities, 1999 Edition.
• Maintain a minimum negative pressure of 0.1-inch water column (wc) within wastewater holding tanks and raw wastewater sewers to contain odors under the following conditions:
− Dynamic liquid level changes − Estimated crack openings in storage tank covers treated as sharp-edged orifices
• When a single access cover is removed, maintain sufficient velocities across the opening to prevent fugitive odors.
• Provide adequate turnover rate and air scavenging within storage tanks to reduce corrosion resulting from H2S pockets.
These criteria remain applicable with the exception of the 1999 edition of NFPA 820, which has been superseded by the 2016 version, adopted in June 2015. It should be noted that the 2016 version has no substantive changes pertaining to preliminary or primary facilities and therefore the ventilation values identified during the previous work remain applicable.
The previous predicted foul air flows from each preliminary/primary source at SCTP are summarized in Table 1.

PHASE 4 ODOR CONTROL UPDATE
3
Table 1. Foul Air Flow Rates and Sizing Criteria Summary
Location Air Flow
(ft3/minute) Air
(ACH) Sizing Criteria Summary
Headworks
Dumpster Room 1,000 7.2 Flow rate necessary to prevent buildup of interior odors by introducing sufficient dilution air. Based on past experience at similar process facilities.
Screen Channel 500 NA Flow rate necessary to maintain a negative 0.1-inch wc within channel under normal operating conditions assuming normal checkered plate, closed covers, and open cracks around checker plate openings. Flow rate necessary to maintain high capture velocity of > 50 fpm across open hatches.
Screen Room 11,100 15.5 Flow rate necessary to provide (1) adequate cooling in summer months due to heat generation, (2) exceedance of NFPA 820 ventilation criteria of 12 ACH, and (3) prevention of buildup of interior odors by introducing sufficient dilution air.
Primary Clarifiers
Underside of Covers 8,000 8.3 Flow rate necessary to (1) maintain a negative 0.1-inch wc under clarifier covers under normal operating conditions assuming typical cover tightness (crack opening of 0.02%), (2) maintain high capture velocity of > 50 fpm across open hatches, and (3) prevent pockets of corrosive H2S from accumulating by creating adequate scavenging velocities (~ 25 fpm).
Total at All Locations
Total 21,100 N/A N/A
ACH = air changes per hour; fpm = feet per minute; ft3/minute = cubic feet per minute; N/A = not applicable.
Vapor-phase Odor Control Technology Evaluation Four technologies were evaluated in the previous TM. These included packed chemical towers, mineral biofilters, organic biofilters, and bio-trickling filters.
Packed Chemical Towers
Packed chemical towers are a common form of wet scrubbers used for odor control in municipal wastewater treatment plants. They are a proven technology and have been the technology of choice for many wastewater treatment facilities. Odor constituents including H2S, ammonia, and various organic reduced sulfur (ORS) compounds may be reduced to very low levels using multistage packed towers. These systems are extremely effective in situations with high odor concentrations and large airflows. However, when compared to other technologies such as bio-trickling filters (or bio-trickling filters [BTFs] as described herein), these systems can be costlier and pose more safety concerns due to storage and handling of chemicals. These systems also exhibit greater complexity regarding operation due to

PHASE 4 ODOR CONTROL UPDATE
4
additional equipment and instrumentation when compared to other technologies. For these reasons, this technology was not selected after the evaluation in the previous TM.
Mineral Biofilters and Organic Biofilters
In an organic biofilter, organic material such as wood chips and compost are used as a medium to grow sulfur-consuming bacteria. Foul air is forced into the bottom of the biofilter bed and treated air is released from the surface. The bacteria also use other odor compounds as a food source, including ammonia, amines, and various ORS compounds.
The concept and components of a mineral (or sand) biofilter are the same as for an organic biofilter, but a different medium (proprietary sandy loam) is used to host the microbial population.
Both of these types of biofilters require large footprints and the organic media requires more frequent media replacement than a bio-trickling filter or chemical packed tower. The land needed based on the estimated required airflow made these systems less favorable than the bio-trickling filter system in the evaluation.
Selected Vapor-phase Odor Control System (Bio-trickling filter)
In the previously selected bio-trickling filter technology, odorous air is blown into the bottom of the tower and flows up through the media material, exiting through an exhaust stack. The media may be a synthetic material or a natural material such as lava rock. The bacteria also use other odor compounds as a food source, including ammonia and various ORS compounds. A typical bio-trickling filter schematic is shown in Figure 1. It should be noted that two types of systems are available; a bio-trickling filter (also known as a bioscrubber) in which scrubbant is recirculated over the media, and a BTF in which once-through irrigation water is applied over the top of the media. Bioscrubbers are generally more suitable for targeting H2S odors while BTF’s are more capable of treating a broad spectrum of odorants. This is because a gradient of bacteria (both low pH and neutral pH) generally exists within the BTF media bed, allowing for a greater removal of complex odorants. Low pH bacteria (autotrophic thiobacillus) specifically targets H2S) while neutral pH bacteria (heterotrophic bacteria) targets ORS compounds.
Earlier design bed velocities for bio-trickling filters were limited to 50 fpm maximum. However, advances in this technology as well as BTFs have gradually shifted acceptable bed velocities to as high as 100 to 200 fpm; although 100 fpm is considered an appropriate high end value that can be achieved by multiple suppliers.
The required empty bed gas residence time (EBGRT) ranges between 10 and 14 seconds, depending on odor loading rate. The design head loss through the media bed can range between 0.2 and 0.5 inch water column (WC) per foot of bed depth, depending on bed velocity selected and type of media. The required footprint for this technology is generally smaller than for biofilters. For all bioscrubber systems, a scrubbant recirculation pump is required to keep the media moist and maintain some biomass in solution. This is not the case with BTFs, in which makeup water is sprayed over the top of the media and
Figure 1. Simplified Schematic Diagram of a Bio-trickling filter System
PHASE 4 ODOR CONTROL UPDATE
5
drained out the bottom without recirculation. BTF suppliers include BioAir, Azzuro, and EcoVerde. Because of the synthetic nature of the media, supplemental nutrients are generally added for maintaining biomass health. However, if secondary effluent is available and meets specific water quality requirements, then supplemental nutrients are not required.
Preliminary Design Findings for Vapor-phase Odor Control Technology
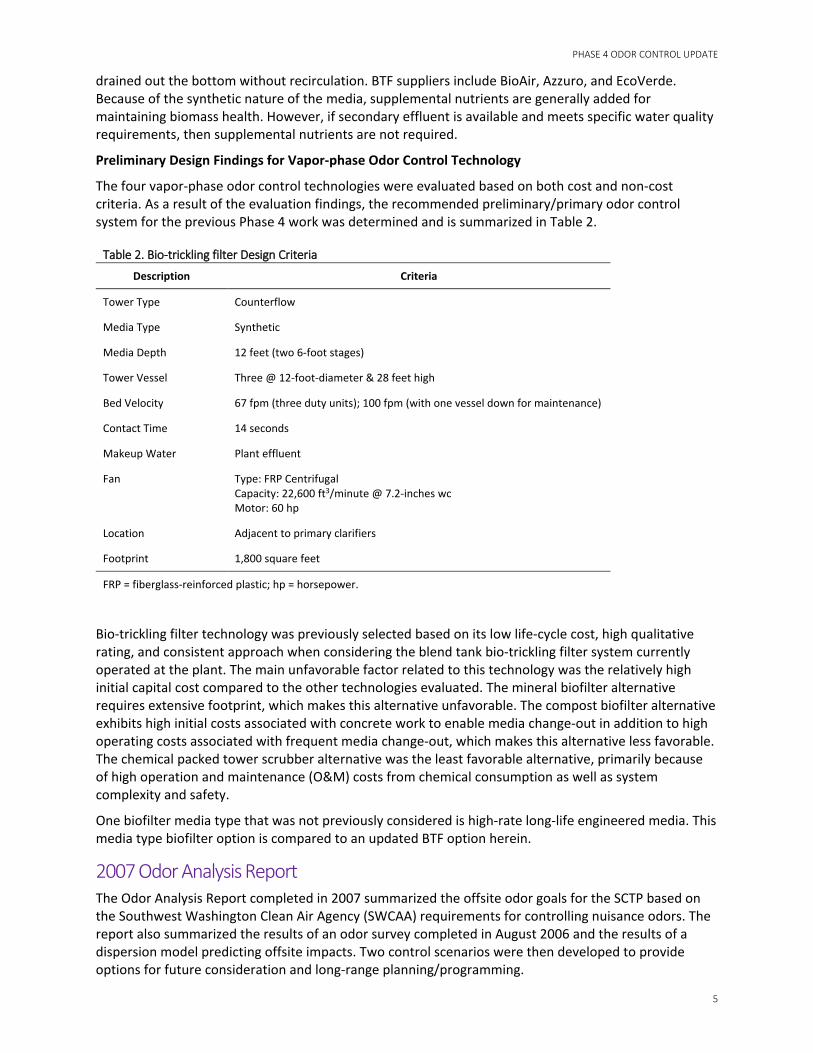
The four vapor-phase odor control technologies were evaluated based on both cost and non-cost criteria. As a result of the evaluation findings, the recommended preliminary/primary odor control system for the previous Phase 4 work was determined and is summarized in Table 2.
Table 2. Bio-trickling filter Design Criteria
Description Criteria
Tower Type Counterflow
Media Type Synthetic
Media Depth 12 feet (two 6-foot stages)
Tower Vessel Three @ 12-foot-diameter & 28 feet high
Bed Velocity 67 fpm (three duty units); 100 fpm (with one vessel down for maintenance)
Contact Time 14 seconds
Makeup Water Plant effluent
Fan Type: FRP Centrifugal Capacity: 22,600 ft3/minute @ 7.2-inches wc Motor: 60 hp
Location Adjacent to primary clarifiers
Footprint 1,800 square feet
FRP = fiberglass-reinforced plastic; hp = horsepower.
Bio-trickling filter technology was previously selected based on its low life-cycle cost, high qualitative rating, and consistent approach when considering the blend tank bio-trickling filter system currently operated at the plant. The main unfavorable factor related to this technology was the relatively high initial capital cost compared to the other technologies evaluated. The mineral biofilter alternative requires extensive footprint, which makes this alternative unfavorable. The compost biofilter alternative exhibits high initial costs associated with concrete work to enable media change-out in addition to high operating costs associated with frequent media change-out, which makes this alternative less favorable. The chemical packed tower scrubber alternative was the least favorable alternative, primarily because of high operation and maintenance (O&M) costs from chemical consumption as well as system complexity and safety.
One biofilter media type that was not previously considered is high-rate long-life engineered media. This media type biofilter option is compared to an updated BTF option herein.
2007 Odor Analysis Report The Odor Analysis Report completed in 2007 summarized the offsite odor goals for the SCTP based on the Southwest Washington Clean Air Agency (SWCAA) requirements for controlling nuisance odors. The report also summarized the results of an odor survey completed in August 2006 and the results of a dispersion model predicting offsite impacts. Two control scenarios were then developed to provide options for future consideration and long-range planning/programming.
PHASE 4 ODOR CONTROL UPDATE
6
Offsite Odor Goals The offsite odor goals described in the Odor Analysis Report were based on controlling nuisance odors, described by the SWCAA, at nearby sensitive receptor locations (neighboring houses). Target threshold values were selected for both H2S and total odor. The target chosen for H2S concentration at sensitive receptor locations adjacent to SCTP was 10 micrograms per cubic meter (µg/m3) (6.54 parts per billion by volume [ppbV]). The target chosen for total odor concentration at sensitive receptor locations adjacent to SCTP was 10 dilutions-to-threshold (D/T) with 100 percent compliance.
D/T is defined via odor tests conducted in an odor laboratory where air samples containing a combination of odorous compounds are diluted with clean air to below detectable concentrations and then introduced to a gas delivery system. A panel of eight members trained in odor response serves as the odor “detectors” for the sample. Panel members are asked to smell air samples delivered to a nose cone piece. By depressing buttons, the panelist introduces three distinct samples, one with the diluted sample and two with clean dilution air. Panel members are then asked whether they can detect a difference in the odor of the samples. If they cannot, the sample concentration is then increased by a given dilution amount, and the test is repeated. This process continues until half the panel members can detect the sample odor. This final level of sample concentration is called detection threshold (DT). Field olfactometry utilizes a field olfactometer, which dynamically dilutes the ambient air with carbon-filtered air in distinct dilution ratios known as D/T, indicating the number of dilutions of pure air required to get to the threshold of detection. The calculation method for field olfactometry (D/T) is slightly different from the calculation of the dilution factor in laboratory olfactometry (DT).
These target threshold values were chosen based on the concentrations of D/T and H2S that typically cause odor complaints. The target threshold for H2S is higher than its actual odorant detection thresholds. The detection threshold for H2S is approximately 0.5 - 1 ppbV. However, based on prior experience, odor complaints do not typically occur until H2S concentrations reach 7–10 ppbV (10.7–15.3 µg/m3). Similarly, the concentration in air at which odors from wastewater plants typically cause nuisance odor complaints is approximately 10 D/T.
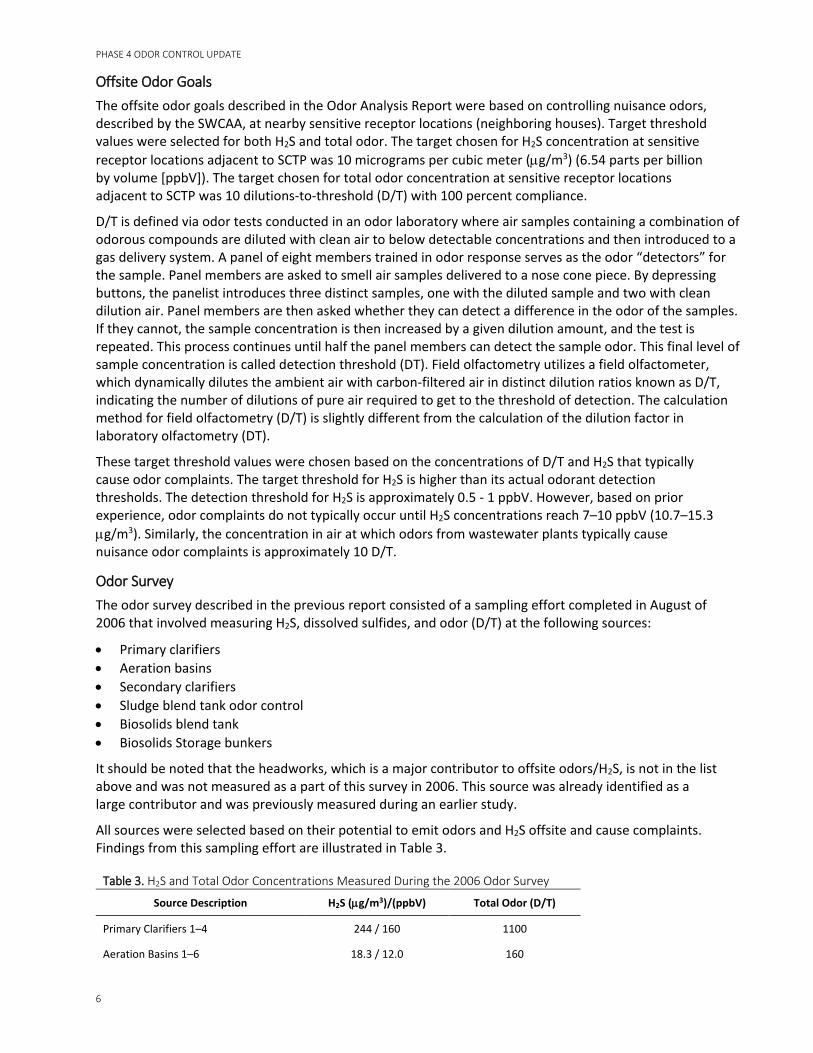
Odor Survey The odor survey described in the previous report consisted of a sampling effort completed in August of 2006 that involved measuring H2S, dissolved sulfides, and odor (D/T) at the following sources:
• Primary clarifiers • Aeration basins • Secondary clarifiers • Sludge blend tank odor control • Biosolids blend tank • Biosolids Storage bunkers
It should be noted that the headworks, which is a major contributor to offsite odors/H2S, is not in the list above and was not measured as a part of this survey in 2006. This source was already identified as a large contributor and was previously measured during an earlier study.
All sources were selected based on their potential to emit odors and H2S offsite and cause complaints. Findings from this sampling effort are illustrated in Table 3.
Table 3. H2S and Total Odor Concentrations Measured During the 2006 Odor Survey
Source Description H2S (µg/m3)/(ppbV) Total Odor (D/T)
Primary Clarifiers 1–4 244 / 160 1100
Aeration Basins 1–6 18.3 / 12.0 160

PHASE 4 ODOR CONTROL UPDATE
7
Table 3. H2S and Total Odor Concentrations Measured During the 2006 Odor Survey
Source Description H2S (µg/m3)/(ppbV) Total Odor (D/T)
Secondary Clarifiers 1–4 13.7 / 9.0 55
Biosolids Blend Tank 825 / 540 2100
Sludge Blend Tank Odor Control Stack 10.7 / 7.0 980
Biosolids Storage Bunkers 12.2 / 8.0 70
Headworks* 3057*/ 2000* 8000*
*Headworks was not sampled as a part of the survey in 2006. These values are from a prior survey and are included in table for comparison.
The conclusions of the study showed that the headworks, primary clarifiers, and biosolids blend tank had the highest concentrations and therefore the highest potential to create offsite odors. Detailed results, conclusions, and sampling methodology are further described in the Odor Analysis Report.
Air Dispersion Model
ISCST3 The previous air dispersion model was built using the Source Complex Short Term Version 3 (ISCST3) algorithm. ISCST3 is a steady-state Gaussian plume model that is used to assess pollutant concentrations from a wide variety of sources associated with an industrial complex such as a wastewater treatment plant. The ISCST3 model can account for the following:
• Settling and dry deposition of particles • Building downwash • Point, area, line, and volume sources • Plume rise as a function of downwind distance • Separation of point sources • Limited terrain adjustment
It should be noted that prior to the end of 2005, ISCST3 was the model that was recommended by the U.S. Environmental Protection Agency (EPA) for dispersion modeling. Since 2005, AERMOD became the EPA preferred model. ISCST3 is similar to AERMOD because they both use the steady-state Gaussian plume algorithm. However, ISCST3 is now considered an outdated model that is no longer supported or being used for EPA permitting.
Terrain Data Terrain data were used in the ISCST3 Model. These were taken from WebGIS.com in the form of DEM (Digital Elevation Model) files. These data were processed using AERMAP and were used to define base elevations for receptors, buildings, and sources based on the terrain surrounding the SCTP.
Meteorological Data The meteorological data used were from the year 1987. These data are now 30 years old, but they were used in the 2006 model because they are local data and considered the most representative data.
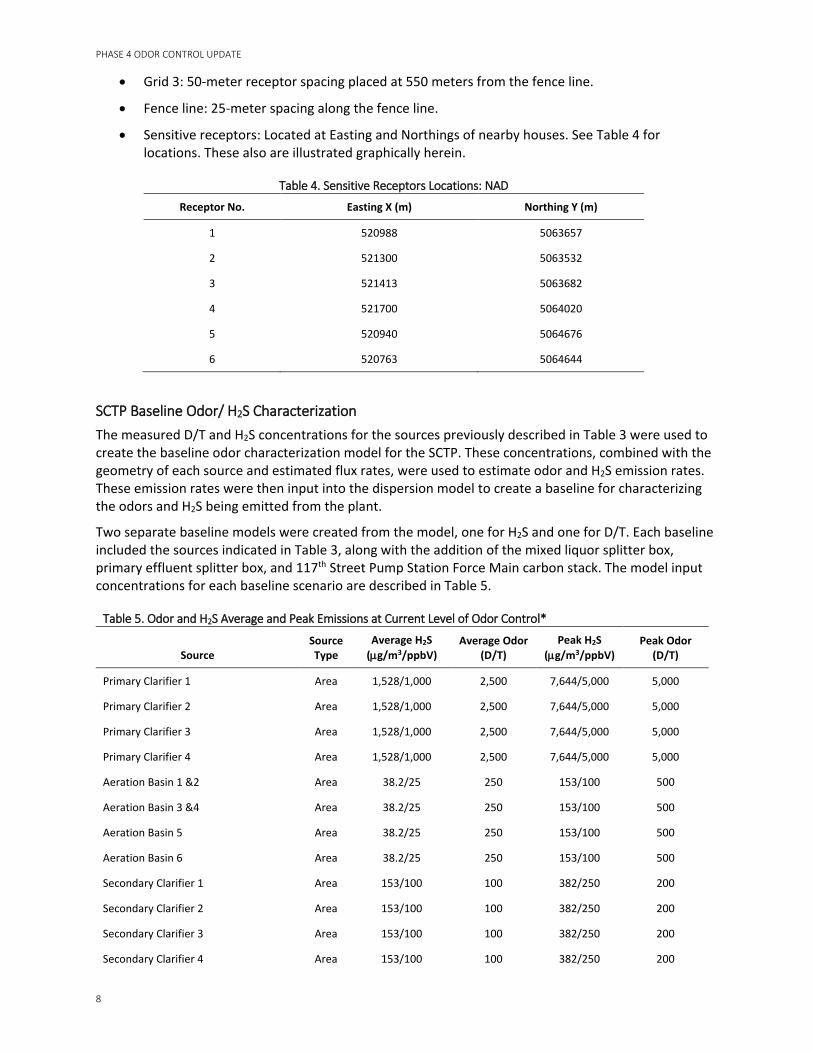
Receptors Gridded receptors, fence line receptors, along with sensitive receptors (nearby houses) were included in the modeling. The gridded receptors were defined as follows:
• Grid 1: 500-meter receptor spacing placed at 5,000 meters from the fence line.
• Grid 2: 100-meter receptor spacing placed at 1,000 meters from the fence line.
PHASE 4 ODOR CONTROL UPDATE
8
• Grid 3: 50-meter receptor spacing placed at 550 meters from the fence line.
• Fence line: 25-meter spacing along the fence line.
• Sensitive receptors: Located at Easting and Northings of nearby houses. See Table 4 for locations. These also are illustrated graphically herein.
Table 4. Sensitive Receptors Locations: NAD
Receptor No. Easting X (m) Northing Y (m)
1 520988 5063657
2 521300 5063532
3 521413 5063682
4 521700 5064020
5 520940 5064676
6 520763 5064644
SCTP Baseline Odor/ H2S Characterization The measured D/T and H2S concentrations for the sources previously described in Table 3 were used to create the baseline odor characterization model for the SCTP. These concentrations, combined with the geometry of each source and estimated flux rates, were used to estimate odor and H2S emission rates. These emission rates were then input into the dispersion model to create a baseline for characterizing the odors and H2S being emitted from the plant.
Two separate baseline models were created from the model, one for H2S and one for D/T. Each baseline included the sources indicated in Table 3, along with the addition of the mixed liquor splitter box, primary effluent splitter box, and 117th Street Pump Station Force Main carbon stack. The model input concentrations for each baseline scenario are described in Table 5.
Table 5. Odor and H2S Average and Peak Emissions at Current Level of Odor Control*
Source Source Type
Average H2S (µg/m3/ppbV)
Average Odor (D/T)
Peak H2S (µg/m3/ppbV)
Peak Odor (D/T)
Primary Clarifier 1 Area 1,528/1,000 2,500 7,644/5,000 5,000
Primary Clarifier 2 Area 1,528/1,000 2,500 7,644/5,000 5,000
Primary Clarifier 3 Area 1,528/1,000 2,500 7,644/5,000 5,000
Primary Clarifier 4 Area 1,528/1,000 2,500 7,644/5,000 5,000
Aeration Basin 1 &2 Area 38.2/25 250 153/100 500
Aeration Basin 3 &4 Area 38.2/25 250 153/100 500
Aeration Basin 5 Area 38.2/25 250 153/100 500
Aeration Basin 6 Area 38.2/25 250 153/100 500
Secondary Clarifier 1 Area 153/100 100 382/250 200
Secondary Clarifier 2 Area 153/100 100 382/250 200
Secondary Clarifier 3 Area 153/100 100 382/250 200
Secondary Clarifier 4 Area 153/100 100 382/250 200
PHASE 4 ODOR CONTROL UPDATE
9
Table 5. Odor and H2S Average and Peak Emissions at Current Level of Odor Control*
Source Source Type
Average H2S (µg/m3/ppbV)
Average Odor (D/T)
Peak H2S (µg/m3/ppbV)
Peak Odor (D/T)
Primary Effluent Splitter Box Area 764/500 0.25 1,528/1,000 0.5
Mixed Liquor Splitter Box Area 764/500 0.25 1,528/1,000 0.5
Headworks Point 3,057/2,000 8,000 15,288/10,000 16,000
Biosolids Blend Tank Point 825/540 2,100 1,528/1,000 4,200
Sludge Blend Tank Odor Control Stack Point 10.7/7 980 10.7/7 1,960
Pump Station Carbon Stack Point 15.3/10 375 76.4/50 750
Biosolids Storage Bunkers Point 1,528/1,000 1.0 764/500 2.0
*Input concentrations for both peak and average are based on the measured values multiplied by correction factor.
As indicated in Table 5, two scenarios were completed for both the H2S baseline and D/T baseline models. One was based on average concentrations and the other was based on peak concentrations. The results for the peak emissions scenario are briefly described below. However, both average and peak scenarios are defined in detail in the Odor Analysis Report completed in 2007.
Hourly Peak H2S Baseline For the hourly peak H2S baseline, the dispersion model indicated that the headworks facility is the largest contributor to the offsite H2S concentrations followed by the primary clarifiers and aeration basins. The maximum offsite impact was 287 μg/m3 (188 ppbV) at the fence line.
The 1-hour annual peak H2S concentrations at the six sensitive receptors identified in Table 4 are summarized in Table 6. Figure 2, which was obtained from the Odor Analysis Report, represents H2S concentrations in μg/m3.
Table 6. Peak H2S Concentrations at Sensitive Receptors with Current Level of Odor Control
Receptor No. H2S Concentration (µg/m3) H2S Concentration (ppbV)
1 29.6 19.36
2 32.9 21.52
3 87.3 57.10
4 39.6 25.90
5 45.5 29.76
6 43.7 28.58

PHASE 4 ODOR CONTROL UPDATE
10
Figure 2. Isopleths Showing Lines of Constant H2S Concentration in µg/m3—1-Hour Annual Peak
Hourly Peak Odor (D/T) Baseline For the hourly peak odor baseline, the model, similarly to the H2S baseline, indicated that the headworks facility is also the largest contributor to the offsite odor concentrations. The maximum offsite impact was 328 D/T at a point just outside of the fence line.
The 1-hour annual peak odor concentrations at the six sensitive receptors identified in Table 4 are summarized in Table 7. The isopleths shown in Figure 3 represent lines of constant odor concentrations in D/T.
Table 7. Peak Odor Concentrations at Sensitive Receptors with Current Level of Odor Control
Receptor No. Odor Concentration (D/T)
1 35
2 40
3 147
4 47
5 54
6 52

PHASE 4 ODOR CONTROL UPDATE
11
Figure 3. Isopleths Showing Lines of Constant Odor Concentration in D/T—1-Hour Annual Peak
The peak H2S and peak D/T exceedances at each of the sensitive receptors for each baseline case are indicated in Table 8. This is based on the number of hours, over a 1 year period (8,760 hours), that the H2S and D/T concentrations were greater than 10 μg/m3 and 10 D/T, respectively.
Table 8. Number of 1-hour Exceedances per Year for Peak H2S and Peak Odor
Receptor No. H2S exceeding 10 µg/m3 Odor exceeding 10 D/T
1 41 133
2 361 857
3 637 1103
4 41 93
5 30 79
6 20 111

PHASE 4 ODOR CONTROL UPDATE
12
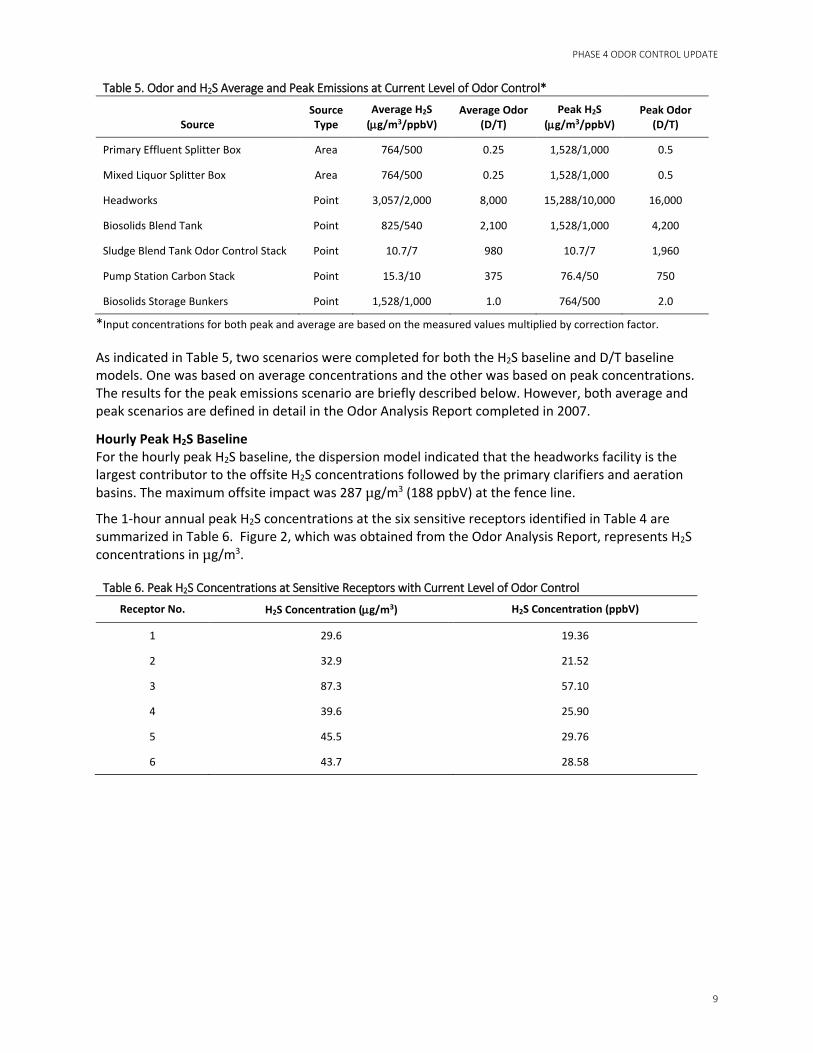
Odor Control Alternatives Two odor control strategies were evaluated in the Odor Analysis Report, Odor Control Strategy 1 and Odor Control Strategy 2.
Odor Control Strategy 1 included covering the primary clarifiers and preliminary treatment channels and providing an odor control system for both the clarifiers and the preliminary treatment facility. This option would reduce maximum offsite H2S and odor concentrations from 287 µg/m3 (188 ppbV) and 328 D/T, respectively, to 11.3 µg/m3 (7.39 ppbV) and 53 D/T, respectively. See Figures 4 and 5.
Figure 4. 1-Hour Peak Hydrogen Sulfide Concentrations in µg/m3—Odor Control Option 1
PHASE 4 ODOR CONTROL UPDATE
13
Figure 5. Isopleths Showing Lines of Constant Odor Concentration in D/T for Control Strategy 1—1-Hour Annual Peak
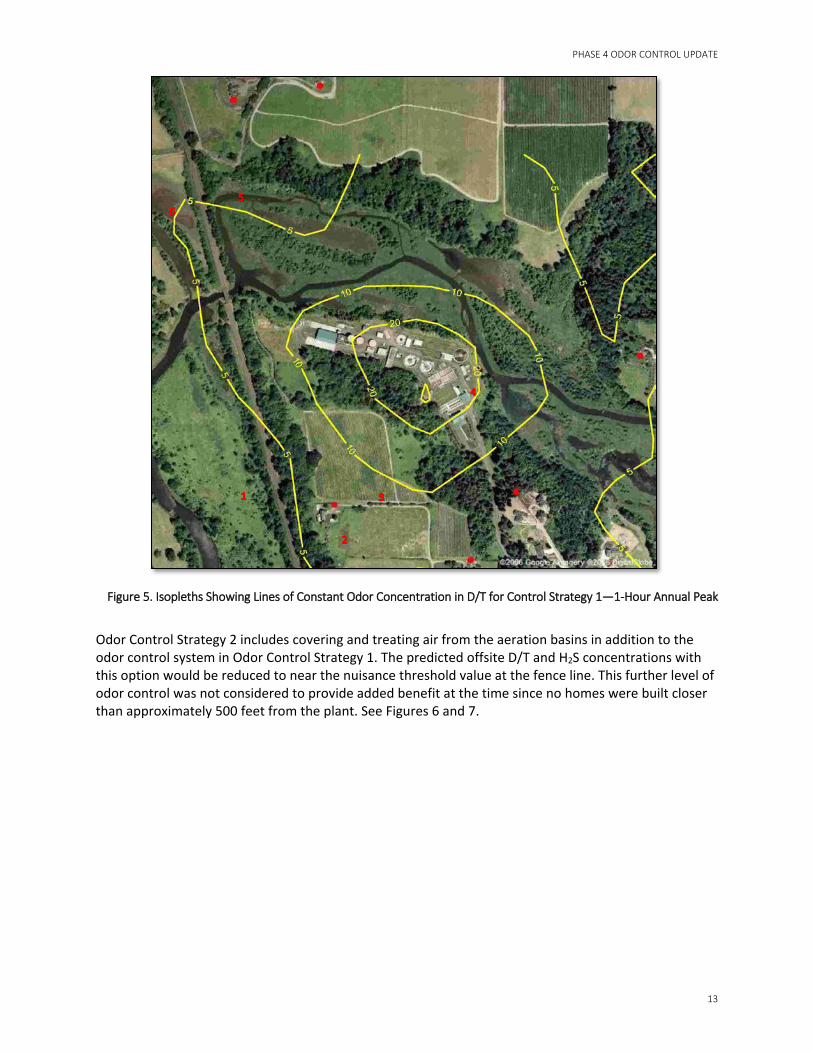
Odor Control Strategy 2 includes covering and treating air from the aeration basins in addition to the odor control system in Odor Control Strategy 1. The predicted offsite D/T and H2S concentrations with this option would be reduced to near the nuisance threshold value at the fence line. This further level of odor control was not considered to provide added benefit at the time since no homes were built closer than approximately 500 feet from the plant. See Figures 6 and 7.

PHASE 4 ODOR CONTROL UPDATE
14
Figure 6. Isopleths Showing Lines of Constant H2S Concentration in µg/m3 for Control Strategy 2—1-Hour Annual Peak

PHASE 4 ODOR CONTROL UPDATE
15
Figure 7. Isopleths Showing Lines of Constant Odor Concentration in D/T for Control Strategy 2—1-Hour Annual Peak
CH2M recommended Option 1, which involved covering the primary clarifiers and preliminary treatment channels and then ventilating these areas to a new odor control system. This was the best option since it provided enough odor control to maintain odors below the nuisance value at all nearby receptors. This recommendation has been carried forward programmatically as part of the definition of the Phase 6 Expansion project for the facility.
Air Emission Regulatory Requirement Update The air discharges from SCTP are regulated by the SWCAA to limit toxic air pollution and nuisance odors. Individual odor-causing compounds are quantified as a concentration (mass per volume). Of these compounds, H2S is a regulated toxic pollutant and the SWCAA has established a limiting concentration for H2S toxicity. This section describes the key regulatory requirements pertaining to required limits of SCTP air emissions.
Nuisance Odors Because H2S is easily detected by the human nose, it is also commonly regulated as a nuisance odor. The SWCAA Regulations (SWCAA 400) contain what is best termed as a “nuisance odor” clause. Section 400-

PHASE 4 ODOR CONTROL UPDATE
16
040(4)(a) states: “Any person who shall cause or allow the generation of any odor from any ‘source,’ which may unreasonably interfere with any other property owner’s use and enjoyment of his property must use recognized good practice and procedures to reduce these odors to a reasonable minimum.” This clause indicates that procedures be put in place to mitigate odors so that they are not “unreasonable” or a nuisance. Odors in general are typically quantified using a D/T method. However, limiting values are not specifically defined by the SWCAA, so target thresholds were selected based on experience to meet these qualitative nuisance odor requirements.
Toxic Air Pollutants Since the 2006 model was completed, new regulations have been implemented for H2S at the state level but have not yet been adopted at the local level. At the state level, the Washington Administrative Code- Title 173-Chapter 460- Section 150 (WAC 173-460-150) describes an updated Acceptable Source Impact Level (ASIL) for H2S as 2.0 µg/m3 over a 24-hour period. The previous value was 0.9 µg/m3 over a 24-hour period. At the local level, which is regulated by the SWCAA, the new regulated value has not been adopted and the ASIL for H2S is 0.9 µg/m3 over a 24-hour period. To be in compliance with both the local agencies, the value 0.9 µg/m3 over a 24-hour period should be used as the required criteria. This discussion is further outlined in the Control Technology Considerations for Permitting the Expansion of the Salmon Creek Wastewater Treatment Plant report completed by CH2M in June 2016.
For the state level, these regulatory requirements can be found at http://apps.leg.wa.gov/WAC/default.aspx?cite=173-460-150. For the Local level (SWCAA), http://www.swcleanair.org/docs/regs/wac173460-1998.pdf.
Odor Criteria Requirements Based on the conclusions above, toxic air pollution requirements and odor criteria requirements include the following:
• H2S—For toxic air pollution control, H2S cannot exceed a 24-hour average of 0.9 µg/m3 at the property boundary per year.
• H2S—For nuisance odor control, H2S cannot exceed a 1-hour average of 10 µg/m3 at any receptor (residence) per year
• D/T—For nuisance odor control, D/T cannot exceed a 1-hour average of 10 D/T at any receptor per year.
Updated Odor Control Evaluation This section provides an updated odor control evaluation that builds on the previous Phase 4 work completed in 2005 as well as the previous odor survey work completed in 2007 and in the context of the current regulatory environment. This evaluation is based on influent flow and load consistent with the Phase 4 capacity of the facility.
Updated Baseline Air Dispersion Model The same model developed from the 2006 evaluation was used in this evaluation. This includes meteorological data, the modeling algorithm (ISCST3), gridded receptors, terrain data, and sources input data.
It should be noted that the meteorological data are 29 years old and the ISCST3 model algorithm used is no longer the recommended model by the EPA. This does not make the results invalid, but does affect the accuracy of the results because newer models such as AERMOD have shown to be more accurate. The year of meteorological data used is also a factor that affects the results of the model. The older the weather data and the farther the specific receptor is from the plant, the less accurate the model results will be. Ideally, the most recent onsite data are recommended. However, this requires the data to be
PHASE 4 ODOR CONTROL UPDATE
17
specially processed for use with the dispersion model. This processing is considered beyond the scope of this work, so the original meteorological data were used.
Further, it should be noted that while the permitting methodology is focused on incremental H2S emissions (above current permit), this analysis considers total H2S emissions compared to WAC, rather than current SWCAA, requirements. This is intended to focus the discussion specific to the potential for odor complaints and to anticipate the future possibility that SWCAA may adopt the updated WAC standards.
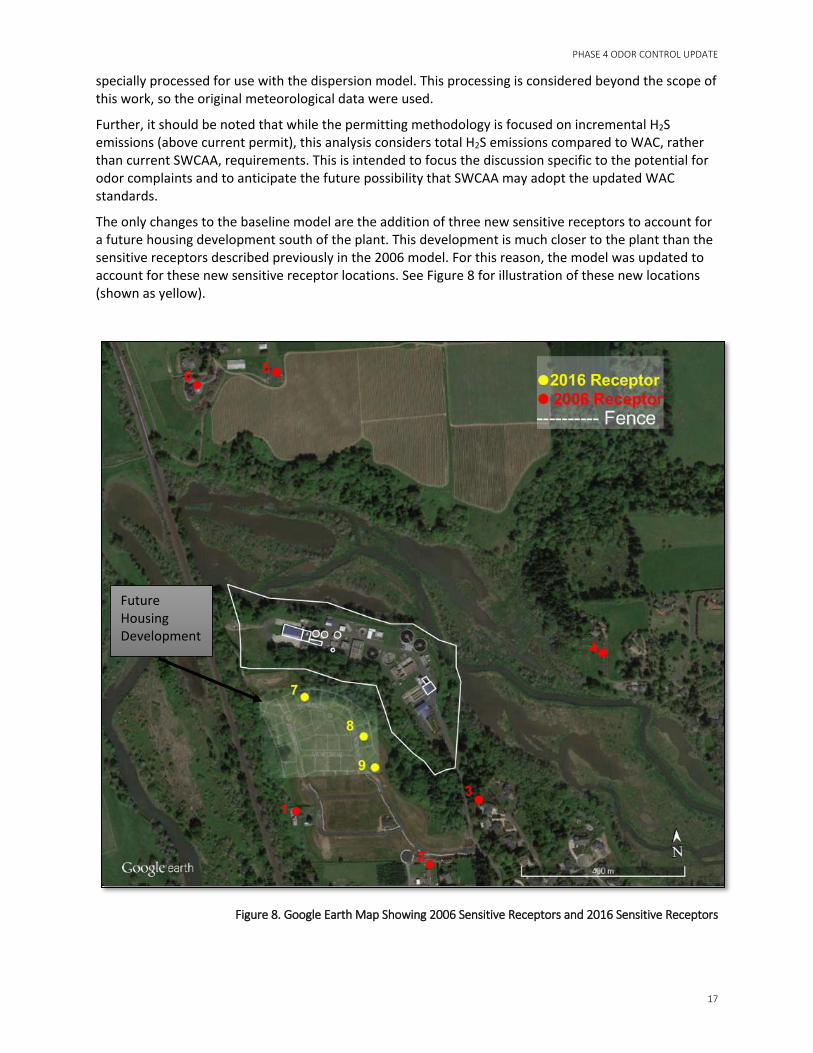
The only changes to the baseline model are the addition of three new sensitive receptors to account for a future housing development south of the plant. This development is much closer to the plant than the sensitive receptors described previously in the 2006 model. For this reason, the model was updated to account for these new sensitive receptor locations. See Figure 8 for illustration of these new locations (shown as yellow).
Figure 8. Google Earth Map Showing 2006 Sensitive Receptors and 2016 Sensitive Receptors
Future Housing Development
PHASE 4 ODOR CONTROL UPDATE
18
As shown in Figure 8, the new receptors account for the future housing development and are much closer to the southwest side of the plant than any of the other receptors from the 2006 study.
The updated baseline model used the same source input concentrations as described in Table 5.
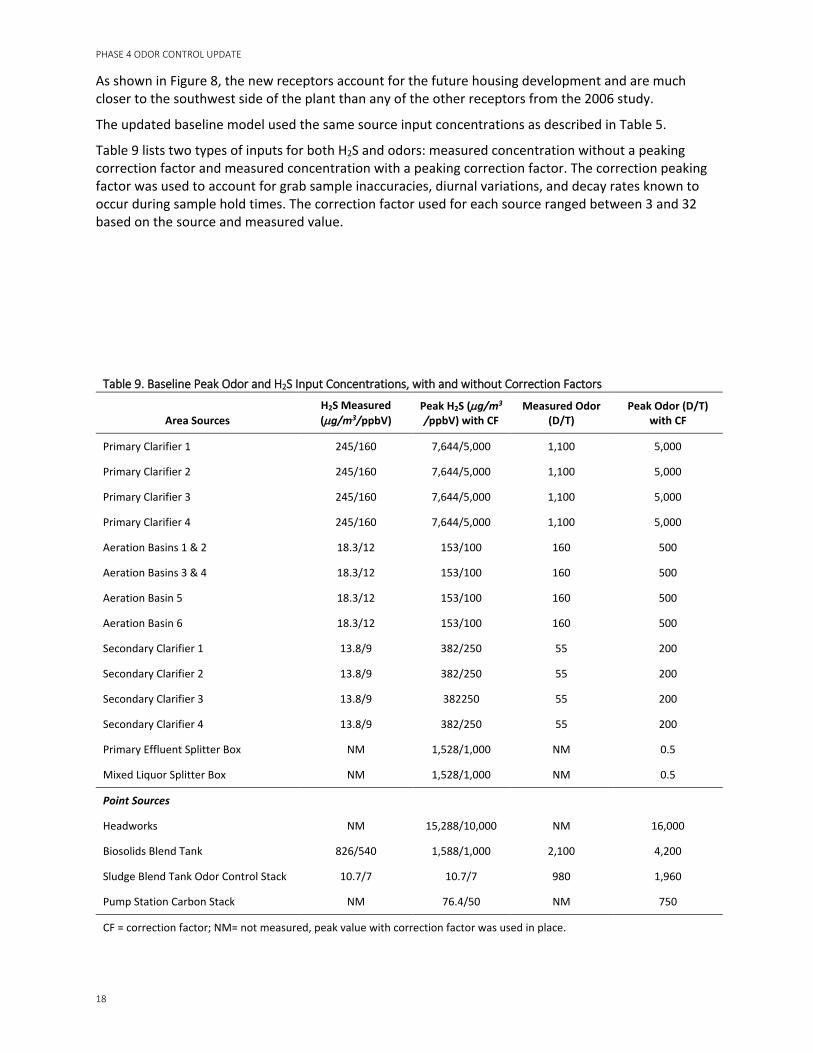
Table 9 lists two types of inputs for both H2S and odors: measured concentration without a peaking correction factor and measured concentration with a peaking correction factor. The correction peaking factor was used to account for grab sample inaccuracies, diurnal variations, and decay rates known to occur during sample hold times. The correction factor used for each source ranged between 3 and 32 based on the source and measured value.
Table 9. Baseline Peak Odor and H2S Input Concentrations, with and without Correction Factors
Area Sources H2S Measured (µg/m3/ppbV)
Peak H2S (µg/m3 /ppbV) with CF
Measured Odor (D/T)
Peak Odor (D/T) with CF
Primary Clarifier 1 245/160 7,644/5,000 1,100 5,000
Primary Clarifier 2 245/160 7,644/5,000 1,100 5,000
Primary Clarifier 3 245/160 7,644/5,000 1,100 5,000
Primary Clarifier 4 245/160 7,644/5,000 1,100 5,000
Aeration Basins 1 & 2 18.3/12 153/100 160 500
Aeration Basins 3 & 4 18.3/12 153/100 160 500
Aeration Basin 5 18.3/12 153/100 160 500
Aeration Basin 6 18.3/12 153/100 160 500
Secondary Clarifier 1 13.8/9 382/250 55 200
Secondary Clarifier 2 13.8/9 382/250 55 200
Secondary Clarifier 3 13.8/9 382250 55 200
Secondary Clarifier 4 13.8/9 382/250 55 200
Primary Effluent Splitter Box NM 1,528/1,000 NM 0.5
Mixed Liquor Splitter Box NM 1,528/1,000 NM 0.5
Point Sources
Headworks NM 15,288/10,000 NM 16,000
Biosolids Blend Tank 826/540 1,588/1,000 2,100 4,200
Sludge Blend Tank Odor Control Stack 10.7/7 10.7/7 980 1,960
Pump Station Carbon Stack NM 76.4/50 NM 750
CF = correction factor; NM= not measured, peak value with correction factor was used in place.
PHASE 4 ODOR CONTROL UPDATE
19
These correction factors, which were used for the baseline D/T and H2S nuisance model in 2006, were also used for this updated D/T and H2S nuisance baseline model (for meeting maximum thresholds of 10 µg/m3 (6.5 ppbV) H2S and 10 D/T over a 1-hour average interval). The correction factors were not used for the TAP ASIL Air Dispersion Model Analysis (H2S threshold of 0.9 µg/m3 (1.3 ppbV) over a 24-hour period) described herein.
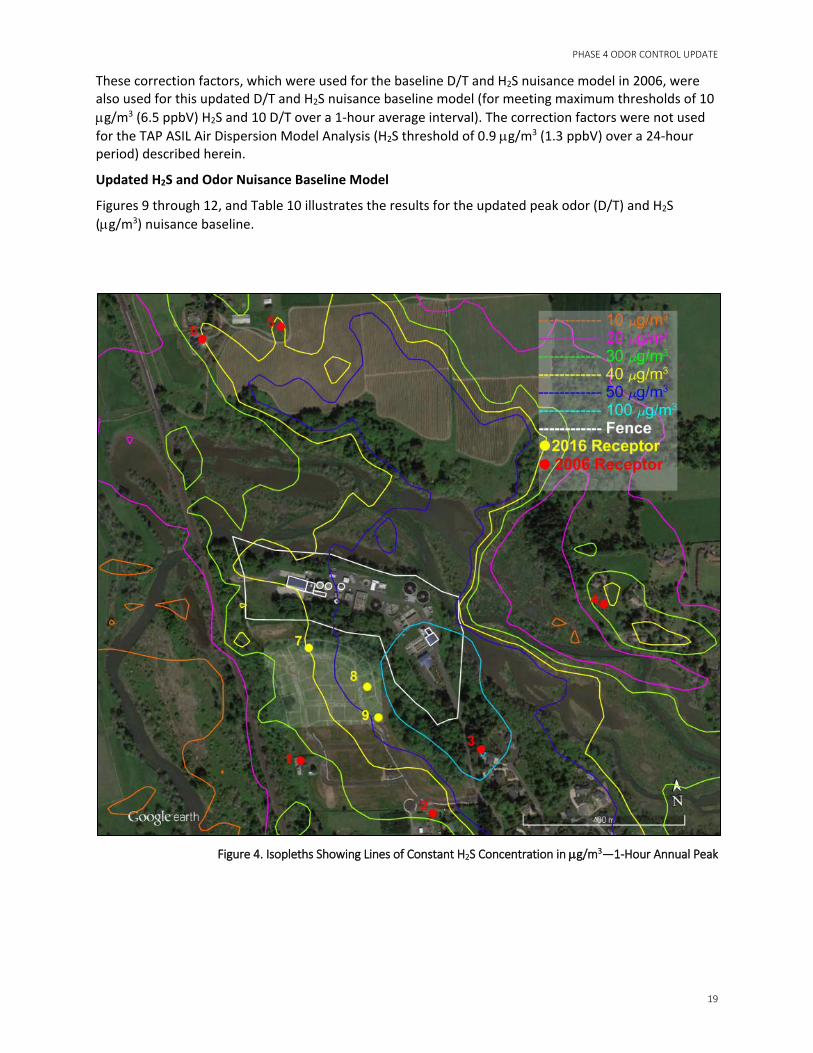
Updated H2S and Odor Nuisance Baseline Model
Figures 9 through 12, and Table 10 illustrates the results for the updated peak odor (D/T) and H2S (µg/m3) nuisance baseline.
Figure 4. Isopleths Showing Lines of Constant H2S Concentration in µg/m3—1-Hour Annual Peak

PHASE 4 ODOR CONTROL UPDATE
20
Figure 5. Isopleths Showing Lines of Constant H2S Exceedance of 10 µg/m3 in Hours—1-Hour Annual Peak

PHASE 4 ODOR CONTROL UPDATE
21
Figure 6. Isopleths Showing Lines of Constant Odor Concentration in D/T—1-Hour Annual Peak
PHASE 4 ODOR CONTROL UPDATE
22
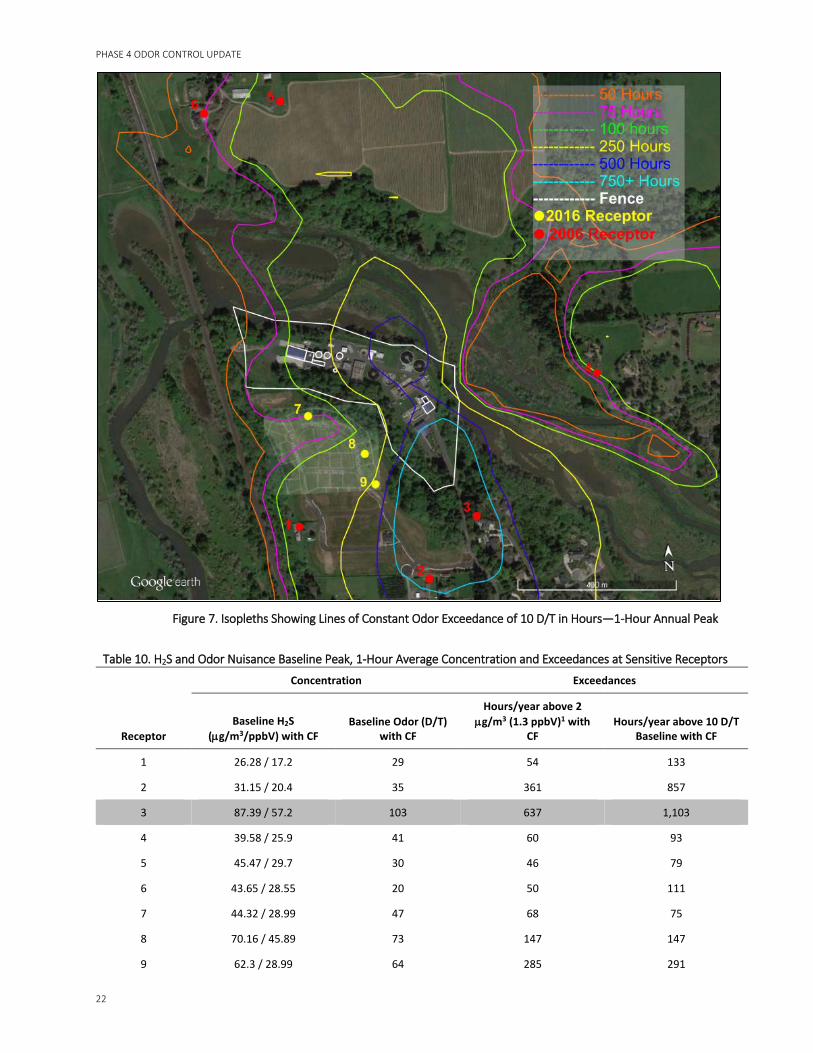
Figure 7. Isopleths Showing Lines of Constant Odor Exceedance of 10 D/T in Hours—1-Hour Annual Peak
Table 10. H2S and Odor Nuisance Baseline Peak, 1-Hour Average Concentration and Exceedances at Sensitive Receptors
Receptor
Concentration Exceedances
Baseline H2S (µg/m3/ppbV) with CF
Baseline Odor (D/T) with CF
Hours/year above 2 µg/m3 (1.3 ppbV)1 with
CF Hours/year above 10 D/T
Baseline with CF
1 26.28 / 17.2 29 54 133
2 31.15 / 20.4 35 361 857
3 87.39 / 57.2 103 637 1,103
4 39.58 / 25.9 41 60 93
5 45.47 / 29.7 30 46 79
6 43.65 / 28.55 20 50 111
7 44.32 / 28.99 47 68 75
8 70.16 / 45.89 73 147 147
9 62.3 / 28.99 64 285 291
PHASE 4 ODOR CONTROL UPDATE
23
Table 10. H2S and Odor Nuisance Baseline Peak, 1-Hour Average Concentration and Exceedances at Sensitive Receptors
Receptor
Concentration Exceedances
Baseline H2S (µg/m3/ppbV) with CF
Baseline Odor (D/T) with CF
Hours/year above 2 µg/m3 (1.3 ppbV)1 with
CF Hours/year above 10 D/T
Baseline with CF
1 Pertains to future WAC ASIL limit for H2S
The results shown in Table 10 indicate that Receptor 3, which is a receptor from the previous 2006 model, still represents the highest offsite impact. Figures 10 and 12 show that the highest concentrated plume touches down directly on the Receptor 3 location outside the south tip of the plant fence line. Based on these facts, unless new developments are being constructed on the south tip of the plant, Receptor 3 is likely to remain the worst-case receptor. The conclusions from the odor analysis in 2006 therefore remain largely unchanged.
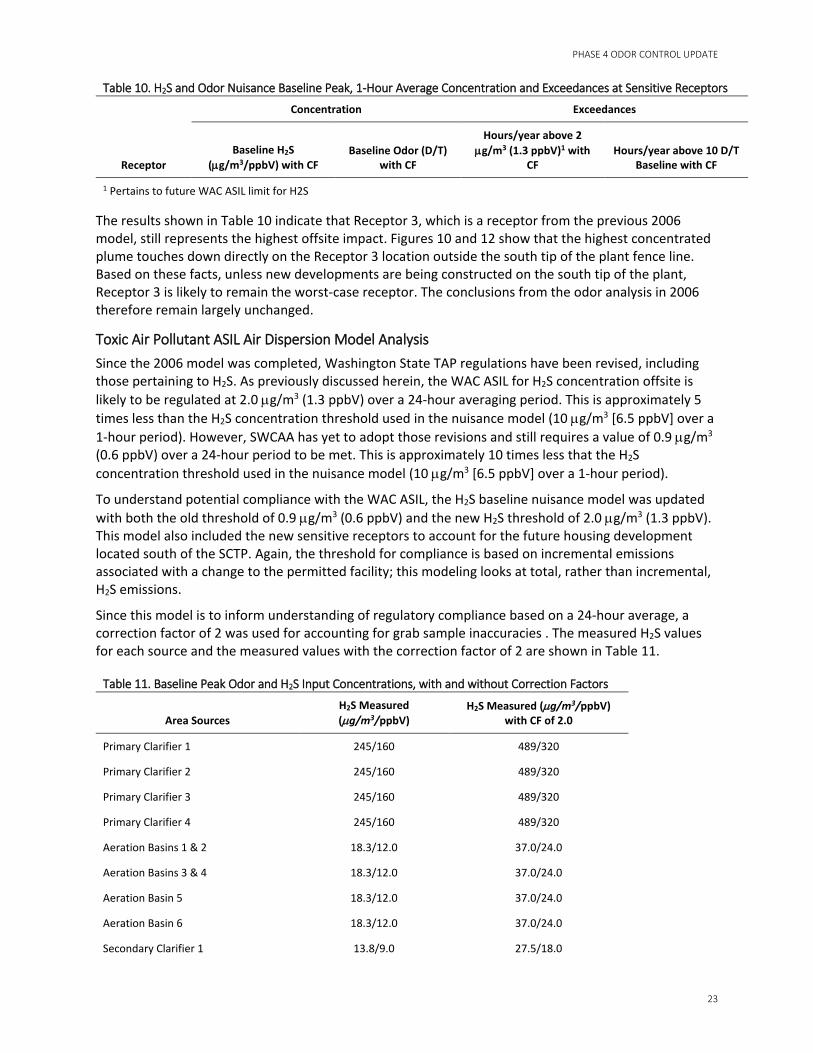
Toxic Air Pollutant ASIL Air Dispersion Model Analysis Since the 2006 model was completed, Washington State TAP regulations have been revised, including those pertaining to H2S. As previously discussed herein, the WAC ASIL for H2S concentration offsite is likely to be regulated at 2.0 µg/m3 (1.3 ppbV) over a 24-hour averaging period. This is approximately 5 times less than the H2S concentration threshold used in the nuisance model (10 µg/m3 [6.5 ppbV] over a 1-hour period). However, SWCAA has yet to adopt those revisions and still requires a value of 0.9 µg/m3 (0.6 ppbV) over a 24-hour period to be met. This is approximately 10 times less that the H2S concentration threshold used in the nuisance model (10 µg/m3 [6.5 ppbV] over a 1-hour period).
To understand potential compliance with the WAC ASIL, the H2S baseline nuisance model was updated with both the old threshold of 0.9 µg/m3 (0.6 ppbV) and the new H2S threshold of 2.0 µg/m3 (1.3 ppbV). This model also included the new sensitive receptors to account for the future housing development located south of the SCTP. Again, the threshold for compliance is based on incremental emissions associated with a change to the permitted facility; this modeling looks at total, rather than incremental, H2S emissions.
Since this model is to inform understanding of regulatory compliance based on a 24-hour average, a correction factor of 2 was used for accounting for grab sample inaccuracies . The measured H2S values for each source and the measured values with the correction factor of 2 are shown in Table 11.
Table 11. Baseline Peak Odor and H2S Input Concentrations, with and without Correction Factors
Area Sources H2S Measured (µg/m3/ppbV)
H2S Measured (µg/m3/ppbV) with CF of 2.0
Primary Clarifier 1 245/160 489/320
Primary Clarifier 2 245/160 489/320
Primary Clarifier 3 245/160 489/320
Primary Clarifier 4 245/160 489/320
Aeration Basins 1 & 2 18.3/12.0 37.0/24.0
Aeration Basins 3 & 4 18.3/12.0 37.0/24.0
Aeration Basin 5 18.3/12.0 37.0/24.0
Aeration Basin 6 18.3/12.0 37.0/24.0
Secondary Clarifier 1 13.8/9.0 27.5/18.0

PHASE 4 ODOR CONTROL UPDATE
24
Table 11. Baseline Peak Odor and H2S Input Concentrations, with and without Correction Factors
Area Sources H2S Measured (µg/m3/ppbV)
H2S Measured (µg/m3/ppbV) with CF of 2.0
Secondary Clarifier 2 13.8/9.0 27.5/18.0
Secondary Clarifier 3 13.8/9.0 27.5/18.0
Secondary Clarifier 4 13.8/9.0 27.5/18.0
Primary Effluent Splitter Box NM 764/500
Mixed Liquor Splitter Box NM 764/500
Point Sources
Headworks 114/75.0 305/200
Biosolids Blend Tank 825/540 1682/1100
Sludge Blend Tank Odor Control Stack 10.7/7.0 21.4/14.0
Pump Station Carbon Stack NM 15.3/10.0
Biosolids Storage 12.2/8.0 24.5/16.0
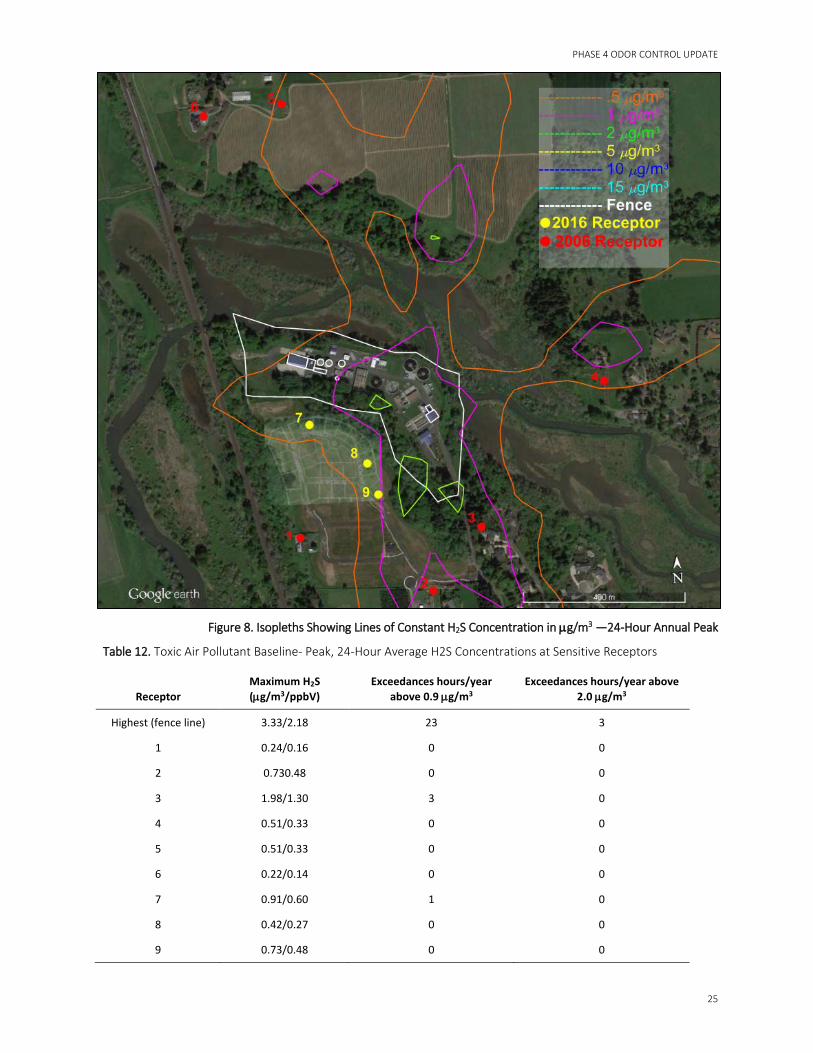
The results of the TAP dispersion model are shown in Figure 13 and Table 12 below.
PHASE 4 ODOR CONTROL UPDATE
25
Figure 8. Isopleths Showing Lines of Constant H2S Concentration in µg/m3 —24-Hour Annual Peak
Table 12. Toxic Air Pollutant Baseline- Peak, 24-Hour Average H2S Concentrations at Sensitive Receptors
Receptor Maximum H2S (µg/m3/ppbV)
Exceedances hours/year above 0.9 µg/m3
Exceedances hours/year above 2.0 µg/m3
Highest (fence line) 3.33/2.18 23 3
1 0.24/0.16 0 0
2 0.730.48 0 0
3 1.98/1.30 3 0
4 0.51/0.33 0 0
5 0.51/0.33 0 0
6 0.22/0.14 0 0
7 0.91/0.60 1 0
8 0.42/0.27 0 0
9 0.73/0.48 0 0
PHASE 4 ODOR CONTROL UPDATE
26
For H2S, the results from Table 12 show that, without any odor control (baseline), the fence line, and Receptors 3 and 7 all exceed the old threshold of 0.9 µg/m3 (0.6 ppbV). However, Receptor 3 is the only receptor that comes close to the ASIL for H2S of 2.0 µg/m3 (1.3 ppbV). The highest value recorded was at the fence line and was 3.33 µg/m3 (2.18 ppbV) and exceeded the new threshold 3 hours out of the 8,760 hours in the year. These results show that the plant in its current state is not in compliance at the property boundary for both thresholds. Due to the lack of compliance, odor control will be needed during the Phase 4 expansion.
Updated Odor Control Alternatives
Two strategies were described in the previous analysis, Odor Control Strategy 1 and Odor Control Strategy 2. Since Odor Control Strategy 1 was the recommended option, it was the only alternative that was updated. Strategy 2 would only be updated if the conclusions or recommendations changed.
Odor Control Strategy 1 involves covering the primary clarifiers and the headworks and ventilating these sources to three bio-trickling filters.
The results of the updated baseline model and the TAP analysis showed that Receptor 3 is still the worst-case receptor and that both the new and the old ASIL for H2S at the property boundary are not in compliance. A revised strategy was developed based on an engineered media biofilter approach and reduced number of bio-trickling filter/BTF vessels. The engineered media approach was modeled because of its simplicity, it’s ease of maintenance, and because it has now become a proven cost-effective technology. Only two bio-trickling filters/BTFs are needed to treat current loads as opposed to three because of improvements in the media and its ability to handle a higher rate of loading. Because bio-trickling filters/BTFs and engineered media biofilters have similar removal efficiencies, this revised strategy changed only the number and location of odor control stacks. Only one odor control stack is modeled for the biofilter strategy instead of the previous three (one per bio-trickling filter vessel). Only two odor control stacks are modeled for the revised bio-trickling filter/BTF strategy instead of the previous three (one per vessel). The revised control strategy was also updated to include the latest receptors. A summary of updated Odor Control Strategy 1 is indicated below:
• Updated with new receptors based on future housing development.
• Updated based on an engineered media biofilter instead of three bio-trickling filters.
• Updated based on new location of the odor control system.
• Biofilter operating efficiency assumed to have 99 percent H2S removal and 90% Odor (D/T) removal, which is the same as the bio-trickling filters modeled previously.
• All other source Inputs based on updated baseline model described above.
• Primary clarifiers and headworks sources are deleted from baseline model since they are contained.
The results for the bio-trickling filter/BTF approach are shown in Figures 14 and 15 and Table 13.

PHASE 4 ODOR CONTROL UPDATE
27
Figure 9. Isopleths Showing Lines of Constant H2S Concentration in µg/m3 —1-Hour Annual Peak, Revised Control
Strategy 1—Bio-trickling filter/BTF Approach

PHASE 4 ODOR CONTROL UPDATE
28
Figure 10. Isopleths Showing Lines of Constant Odor Concentration in D/T—1-Hour Annual Peak, Revised Control
Strategy 1—Bio-trickling filter/BTF Approach
Table 13. Revised Control Strategy 1—Bio-trickling filter/BTF Approach, 1-Hour Peak Average H2S Concentrations at Sensitive Receptors
Receptor
H2S (µg/m3/ppbV) H2S (µg/m3/ppbV) Odor (D/T) Odor (D/T) Odor Exceedances
2006 Control Strategy 1 Results
Updated Control Strategy 1
2006 Control Strategy 1 Results
Updated Control Strategy 1
Hours/year above 10 D/T
1 1.14/0.75 1.16/0.76 6.1 4.77 -
2 1.55/1.01 1.49/0.97 5.2 6.01 -
3 2.05/1.34 1.49/0.97 7.6 6.59 -
4 1.51/0.99 1.51/0.99 4.7 6.83 -
5 0.72/0.47 0.72/0.47 3.4 3.31 -
6 1.00/0.65 0.85/0.56 5.4 3.62 -
7 N/A 4.66/3.05 N/A 17.05 1
8 N/A 2.60/1.70 N/A 9.57 -
9 N/A 2.94/1.92 N/A 7.86 -
PHASE 4 ODOR CONTROL UPDATE
29
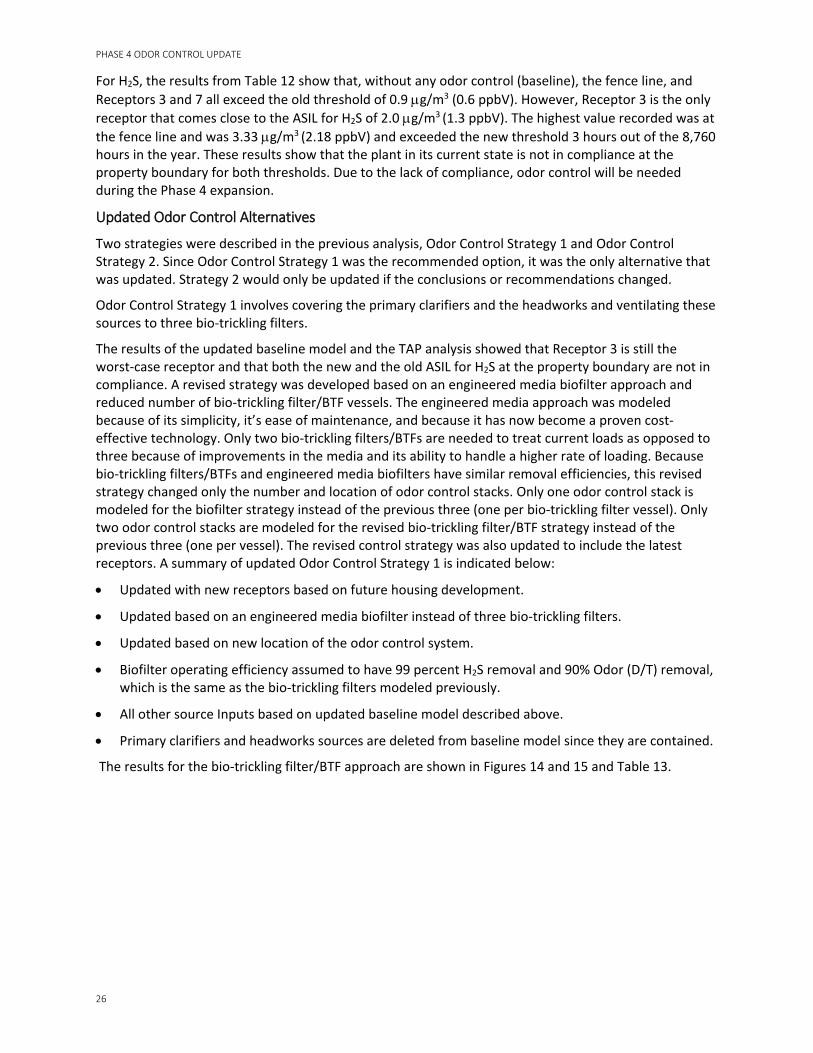
The results of Revised Odor Control Strategy 1 show that Receptor 7 is the only receptor to exceed the nuisance odor threshold of 10 D/T. However, this only happens 1 hour per year. This is less than 0.01 percent of the time. Since this is such a small percentage of time, it is not considered a high enough risk to consider more conservative alternatives.
Table 13 also shows the values from the previous study as comparison. The slight differences are due to the change in the number of stacks for the bio-trickling filter/BTF approach.
The results for the biofilter approach are shown in Figures 16 and 17 and Table 14.
Figure 16. Isopleths Showing Lines of Constant H2S Concentration in µg/m3 —1-Hour Annual Peak, Revised Control
Strategy 1—Biofilter Approach

PHASE 4 ODOR CONTROL UPDATE
30
Figure 17. Isopleths Showing Lines of Constant Odor Concentration in D/T – 1-Hour Annual Peak, Revised Control
Strategy 1—Biofilter Approach
Table 14. Revised Control Strategy 1—Biofilter Approach, 1-Hour Peak Average H2S Concentrations at Sensitive Receptors
Receptor
H2S (µg/m3/ppbV) H2S (µg/m3/ppbV) Odor (D/T) Odor (D/T) Odor Exceedances
2006 Control Strategy 1 Results
Updated Control Strategy 1
2006 Control Strategy 1 Results
Updated Control Strategy 1
Hours/year above 10 D/T
1 1.14/0.75 1.16/0.76 6.1 4.73 -
2 1.55/1.01 1.49/0.97 5.2 5.83 -
3 2.05/1.34 1.47/0.97 7.6 7.02 -
4 1.51/0.99 1.51/0.99 4.7 4.68 -
5 0.72/0.47 0.72/0.47 3.4 3.31 -
6 1.00/0.65 0.85/0.56 5.4 3.62 -
7 N/A 4.66/3.05 N/A 17.05 1
8 N/A 2.60/1.70 N/A 9.57 -
9 N/A 2.94/1.92 N/A 7.86 -

PHASE 4 ODOR CONTROL UPDATE
31
The results of Revised Odor Control Strategy 1 with the biofilter approach, indicated in Table 14, are similar to the results for the Bio-trickling filter/BTF approach shown in Table 13. Receptor 7 is the only receptor to exceed the nuisance odor threshold of 10 D/T. Similar to the bio-trickling filter/BTF approach, Table 14 shows that this exceedance only happens 1 hour per year, which is less than 0.01 percent of the time. Since this is such a small percentage of time, it is not considered a high enough risk to consider more conservative alternatives.
Table 14 also shows the values from the previous study for comparison. The slight differences are due to the change in the number of stacks from three to one.
The results for both approaches are similar and indicate that either the biofilter or bio-trickling filter/BTF approach will meet the nuisance criteria with only 1 hour of exceedance in the year.
Control Strategy 1 was also modeled to ensure compliance with the ASIL threshold of 0.9 µg/m3 over a 24-hour averaging period at the fence line. The results of this model run showed that the maximum H2S concentration at the fence line was 0.855 µg/m3. This is less than the 0.9 µg/m3 as required by the SWCAA, and, therefore, Control Strategy 1 also meets the regulatory permitting requirements. Figure 18 below illustrates the results.
Figure 18. Isopleths Showing Lines of Constant H2S Concentration in µg/m3—24-Hour Average, Revised Control
Strategy 1—Bio-trickling filter Approach

PHASE 4 ODOR CONTROL UPDATE
32
Technology Evaluation
Originally, the proposed Control Strategy 1 system consisted of three 12-foot-diameter, once through, packed media bio-trickling filters/BTFs. This was considered the best available system that provided the most benefit to cost in the 2005 evaluation. Since 2005, BTFs and biofilters have improved in performance and efficiency. To ensure the best technology is selected, the evaluation from 2005 was revisited to account for these technology advancements. For this evaluation, two alternatives were evaluated for the SCTP odor control system: structured media BTF, as previously described herein, and a high rate engineered media biofilter.
High rate engineered media biofilters are biofilter systems that utilize a proprietary media that performs under much higher loading rates than organic, soil, or mineral biofilters. High rate engineered media biofilters also exhibit similar or better performance characteristics than organic mediums. These types of systems also have longer lasting media and require less footprint due to the higher loading. The media is generally more expensive because it is a unique proprietary composition.
Design flow rates for high rate biofilters range from 5.0 to 11.0 cubic feet per minute per square foot. Media life is normally guaranteed for 10 to 20 years. The appropriate EBGRT for high rate media is dependent upon the target odor and respective loading rate but will typically range between 30 to 60 seconds.
Generally, high rate biofilter media do not require a nutrient source because they have a nutrient constituent built into the media recipe. The advantages of high rate packaged biofilters include the following:
• A wide range of odorous constituents may be removed.
• The system O&M is relatively simple.
• Chemical storage and delivery is not required.
• High rate proprietary media requires less frequent change-out (generally guaranteed for 10 to 20 years).
• The control systems are either manually operated or are relatively simple.
• The collected leachate is typically not odorous, as with compost biofilters.
• The required footprint is approximately half that of organic media biofilters.
• High-velocity stack that allows for better dispersion/dilution than open area biofilters without cover and stack.
However, high rate biofilters have the following disadvantages:
• Media costs can be high.
• Because bacterial populations provide the removal mechanism, the system can handle gradual cyclic loadings but cannot accommodate rapid load spikes effectively.
• Can require larger footprint than BTFs
Alternative 1—Structured Media BTF This alternative is similar to the recommended alternative from the 2005 evaluation but consists of revised BTF technology that includes structured synthetic media as opposed to random packed media. Structured synthetic media improves uniformity in the BTF media and has much more resistance to breakdown and compaction. This design improvement has allowed BTFs to handle up to 200 fpm loading capacity with little to no loss in removal efficiency. Previously, the 2005 evaluation was based on bio-trickling filters with a maximum loading rate of 50 to 75 fpm. The designed loading rate for this

PHASE 4 ODOR CONTROL UPDATE
33
alternate is now based on 100 to 150 fpm, which reduces the number of vessels required for the design H2S loading rate. The revised alternative now consists of only two (instead of three) FRP towers with structured synthetic media and an exhaust fan with acoustical enclosure. The BTF configuration evaluated is also a once-through type BTF to minimize maintenance and create a pH gradient to increase ORS removal. System drainage water would exhibit low pH and would be drained back to a process flow stream or storage tank. Further design criteria associated with this alternative are described in Table 15.
Table 15. Alternative 1—BTF Design Criteria
Description Criteria
Tower Type Once through—counterflow
Media Type Structured synthetic
Media Depth 12 feet
Tower Vessel Two @ 12-foot-diameter & 28 feet high
Contact Time 14 seconds
Makeup Water Plant effluent
Fans Type: FRP centrifugal (1 duty, 1 standby) Capacity: 21, 000 ft3/minute @ 7.3-inches wc Motor: 60 hp
Location Adjacent to primary clarifiers
Footprint 1,660 square feet
For layout drawings, see previous report completed in 2005. Note that the layout in 2005 has three vessels and only one fan. The updated evaluation herein now considers space and costs for an extra standby fan and is based on two vessels.
Alternative 2—Engineered Media Biofilter This alternative involves an in ground engineered media biofilter located next to the primary clarifiers. The biofilter consists of high rate proprietary media placed in two cells approximately 35 feet by 40 feet in size designed for 45 seconds of EBGRT. Each cell is approximately 12 feet deep in the ground, which accounts for 6 feet of media, 3 feet for the underground air distribution system, and 3 feet for concrete and space above the biofilter. Three feet of the biofilter is assumed to be above grade. Each cell will be covered with aluminum covers and ventilated through a common 15-foot stainless steel stack or coated carbon steel stack. Two odor control exhaust fans will be used to ventilate the primary clarifiers and headworks. There will be one duty fan and one standby. Table 16 summarizes this alternative.
Table 16. Alternative 2—Engineered Media Biofilter
Description Criteria
Biofilter Type At-grade w/concrete retaining walls
Media Type Engineered media
Media Depth 6 feet
Gas Residence Time (GRT) 45 seconds
Loading Rate 8 ft3/minute/square feet
Humidification Primary: humidification chamber Secondary: irrigation type sprinklers
PHASE 4 ODOR CONTROL UPDATE
34
Table 16. Alternative 2—Engineered Media Biofilter
Description Criteria
Fans Type: FRP centrifugal (1 duty, 1 standby) Capacity: 21,000 ft3/minute @ 7.3 inches wc Motor: 60 hp
Location Adjacent to primary clarifiers
Footprint 5,600 square feet (80 feet x 70 feet)
Both economic (cost) and non-economic (benefit) criteria were used to evaluate the two technologies described above. A technology with the lowest cost to benefit ratio is the most appropriate technology for the SCTP.
Economic Evaluation Economic criteria include capital cost and life-cycle cost.
A conceptual level cost estimate has been developed for each evaluated technology. The cost estimates are considered a study or feasibility, Class 4 estimate as defined by the Association for the Advancement of Cost Engineering International. These estimates are considered accurate from +20 to +50 percent on the high side to -15 to -30 percent on the low side, based on a preliminary design, level of information available, and estimating techniques used.
Capital costs for all odor control technology alternatives include site work, odor control equipment, mechanical, electrical, instrumentation and control, piping, and ductwork. Site work includes excavation for equipment pads and biofilter vessels. Odor control equipment costs include the odor control fans, media, and vessels. The ductwork costs include an estimated 550 feet of collection duct from the headworks and primary clarifiers. Also included are aluminum covers for the primary clarifiers as well as a $100,000 place holder for modifying the headworks heating, ventilation, and air conditioning (HVAC) system. Capital costs are estimated using the following approach:
• Equipment costs are based on recent equipment supplier cost quotes received.
• Percentage markups applied for unknown costs such as site work, instrumentation, electrical, and yard piping.
Additional project costs were developed by escalating the equipment sub-cost by the markups illustrated below.
Markups applied to equipment cost were as follows:
• Equipment Installation: 10% • Field Painting/Finishes: 1% • Mechanical: 8% • Electrical: 8% • Instrumentation: 5%
Contractor markups applied to equipment subtotal + project costs were as follows:
• General Conditions: 7% • Overhead: 5% • Profit: 5% • Bonds/Insurance: 2.5%

PHASE 4 ODOR CONTROL UPDATE
35
• Contingency: 20% • Escalation (3% per year): 6% (construction completed end of 2018)
Non-construction cost markups applied to construction cost after contractor markups and escalation were as follows:
• Permitting 3% • Engineering 10% • Services during Construction: 5% • Commissioning/Startup: 5% • Sales Tax: 8.4% (Sales tax in Washington)
O&M and life-cycle costs were developed using the following inputs:
• Electricity Costs: $0.06/ kilowatt-hour • Operator Labor Costs: $40/hour • Financing Costs: 20-year life, 6 percent discount rate • Nutrient Costs: $10/gallon
Table 17 summarizes the cost estimate for evaluated odor control technologies.
Table 17. Cost Estimate Summary of Technologies
Item BTF
(x$1,000) Engineered Media Biofilter
(x$1,000)
Capital Equipment Costs:
Odor Control Equipment $794 $372
Biofilter Aluminum Cover $0 $91
Primaries Aluminum Cover $239 $239
HVAC For Headworks $100 $100
Ducting and Stack $234 $243
Site work $18 $279
Subtotal- Equipment Costs $1,386 $1,324
Capital Mark-up Costs:
Allowance Costs $460 $440
Contractor Markups $360 $344
Contingency (20%) $441 $422
Escalation (3% per year) $238 $228
Non-construction Capital Costs:
Engineering $289 $276
Permitting $87 $83
Services During Construction $144 $138
Commissioning and Start-Up $144 $138
Sales Tax $242 $232

PHASE 4 ODOR CONTROL UPDATE
36
Table 17. Cost Estimate Summary of Technologies
Item BTF
(x$1,000) Engineered Media Biofilter
(x$1,000)
Annual Costs:
Electrical Power $10.94 $11.06
Maintenance $25.87 $36.79
Nutrients $19.16 $0.00
R&R Costs $7.70 $12.59
Water $5.37 $5.37
Subtotal – Annual Costs $70.00 $66.00
Present Worth Annual Costs $873 $823
Total Capital Cost $3,794 $3,623
Total Project Present Worth $4,667 $4,446
The updated cost evaluation shows that the total project present worth cost for the BTF is approximately $221,000 more than the engineered media biofilter. Furthermore, costs associated with the biofilter are shown to be less in every category including capital cost and annual cost.
Non-economic Evaluation The non-economic evaluation criteria have been updated to be slightly different but more applicable than those of the evaluation in 2005, as follows:
• Safety and Health: This criterion refers to day-to-day operator safety related to the type of odor control system. Both BTFs and biofilters are considered equally safe to operate and pose no major safety or health concerns.
• Risk of Odor Breakthrough: Because odor receptors are located close to the plant, this criterion is weighted high for the odor control systems evaluated. Both biofilters and BTFs are susceptible to odor breakthrough under certain peak conditions because both require a certain bacterial population to reduce different concentrations of H2S. However, engineered media biofilters tend to be a little more effective at handing these spikes due to the adsorption capabilities of the media.
• Technology Maturity and Reliability: Some alternatives evaluated have a more proven track record of success when designed and operated correctly. Others are newer technologies that have recently been introduced to the market. Both of the control technologies evaluated, BTFs and engineered media biofilters, have many proven installations in the marketplace. Both are considered equal in maturity and reliability.
• Level of Maintenance Required: This criterion refers to the day-to-day maintenance that would be performed by County staff. Biofilters and once-through BTFs both require a minimal amount of maintenance because the fans are usually the only pieces of mechanical equipment in each system. However, because BTFs require nutrient addition, they require slightly more maintenance than engineered media biofilters.
• Level of Operating Complexity: Similar to maintenance requirements, this criterion refers to the day-to-day need for operator attention. Generally, engineered media biofilters and once-through BTFs require minimum operator attention, involving periodic monitoring for odors or checking of the

PHASE 4 ODOR CONTROL UPDATE
37
biofilter media for moisture content. Because the BTFs require nutrient addition, the complexity is considered slightly greater than that of an engineered media biofilter.
• Energy Usage: This is based on the energy required by the entire system. For both systems the fans will be the main source of energy usage. The biofilter is slightly higher because it requires two stack fans to add static pressure that is lost due to covering the biofilter. In addition, the expected pressure drop across the biofilter media is expected to exceed that for the BTF.
• Space Requirements: Space requirements include footprint areas for odor control equipment as well as space for access for equipment. Engineered media biofilters require larger footprints than BTFs.
• Odor Removal Efficiency: Odor removal efficiency relates to the ability of a particular odor treatment technology to remove odor constituents such as H2S, reduced sulfur compounds, and other constituents. Once-through BTFs and engineered media biofilters can effectively remove both H2S and ORS compounds effectively. However, due to longer EBGRT biofilters will have slightly better efficiency.
Each criterion was given a weighting factor, depending on the importance of the criterion for this specific application. Then a score was given for each criterion to each technology. The final score is a weighted overall score of all criteria. Table 18 summarizes the weighing of the criteria and score of each evaluated technology. Figure 19 illustrates the results.
Table 18. Non-economic Evaluation of Technologies
Evaluation Criteria Criteria Weight
Weighed Score
Engineered Media Packaged Biofilter BTF
Safety/Health 10 73.68 73.68 Risk of Odor Break-through 15 47.37 31.58 Technology Maturity and Reliability 15 31.58 31.58 Level of Maintenance Required 10 84.21 63.16 Level of Operating Complexity 10 84.21 63.16 Energy Usage 10 63.16 73.68 Space Requirements 10 42.11 84.21 Odor Removal Efficiency 15 78.95 78.95
Total Weighed Score (out of 100)
63.16 62.50
Ranking
1 2
PHASE 4 ODOR CONTROL UPDATE
38
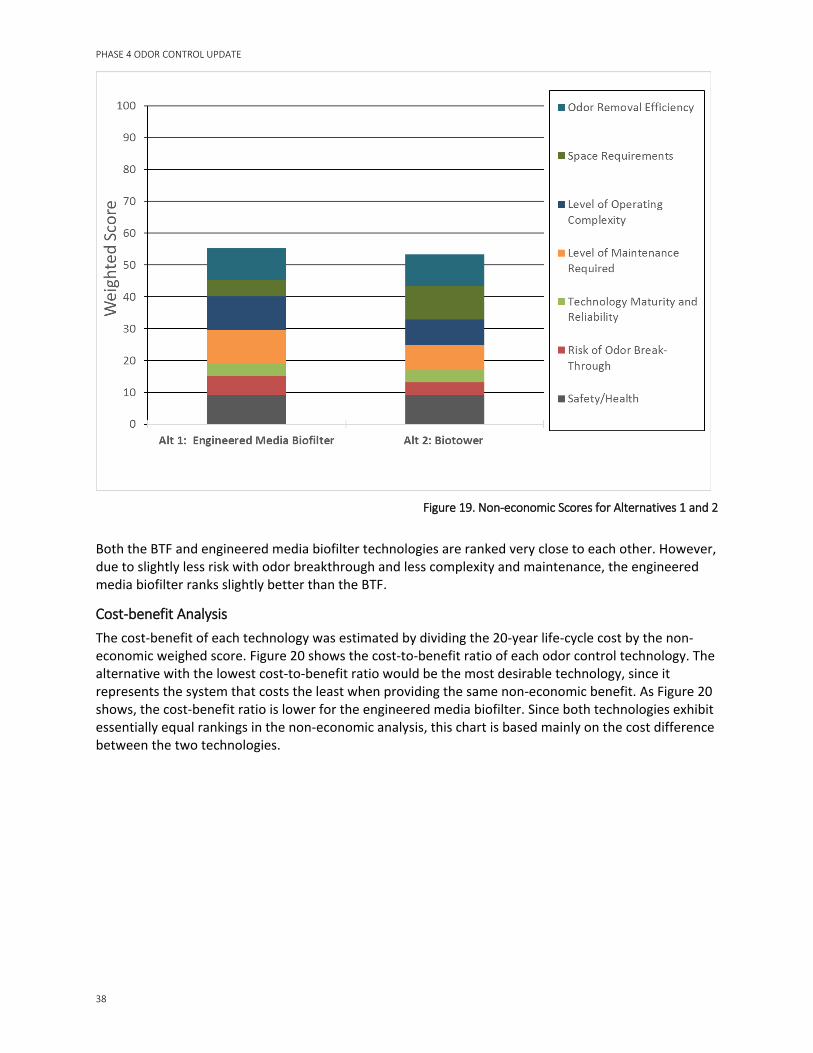
Figure 19. Non-economic Scores for Alternatives 1 and 2
Both the BTF and engineered media biofilter technologies are ranked very close to each other. However, due to slightly less risk with odor breakthrough and less complexity and maintenance, the engineered media biofilter ranks slightly better than the BTF.
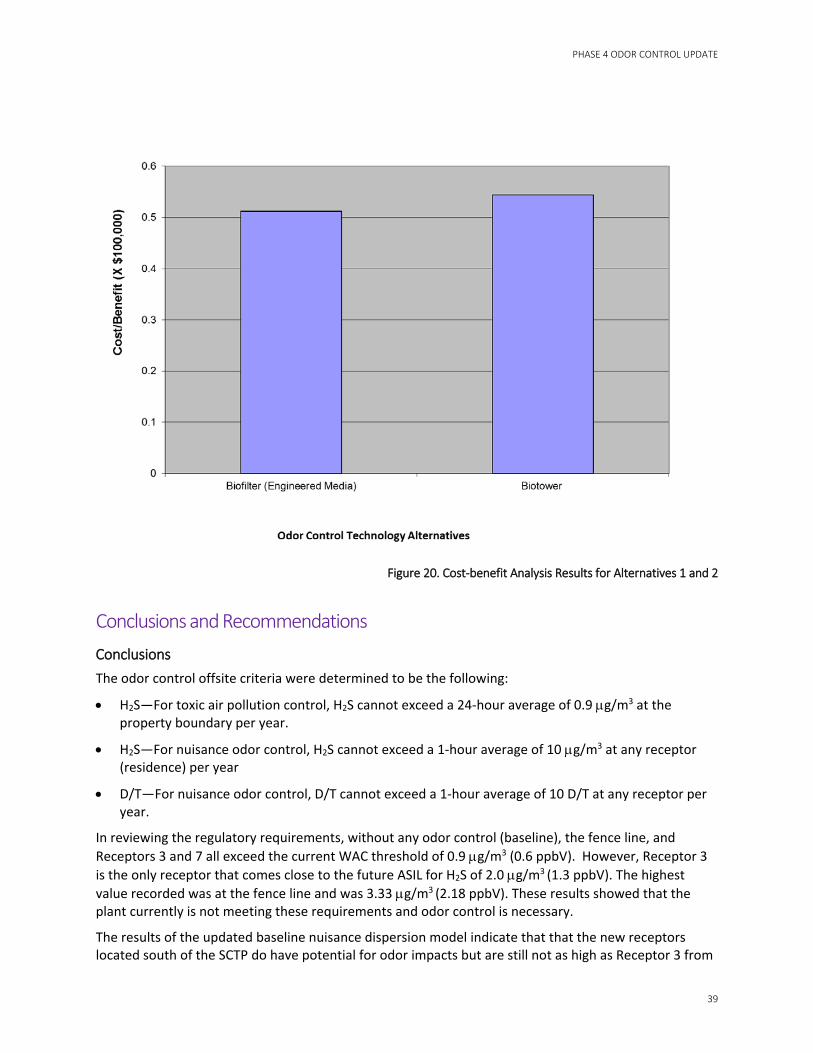
Cost-benefit Analysis The cost-benefit of each technology was estimated by dividing the 20-year life-cycle cost by the non-economic weighed score. Figure 20 shows the cost-to-benefit ratio of each odor control technology. The alternative with the lowest cost-to-benefit ratio would be the most desirable technology, since it represents the system that costs the least when providing the same non-economic benefit. As Figure 20 shows, the cost-benefit ratio is lower for the engineered media biofilter. Since both technologies exhibit essentially equal rankings in the non-economic analysis, this chart is based mainly on the cost difference between the two technologies.
PHASE 4 ODOR CONTROL UPDATE
39
Figure 20. Cost-benefit Analysis Results for Alternatives 1 and 2
Conclusions and Recommendations Conclusions The odor control offsite criteria were determined to be the following:
• H2S—For toxic air pollution control, H2S cannot exceed a 24-hour average of 0.9 µg/m3 at the property boundary per year.
• H2S—For nuisance odor control, H2S cannot exceed a 1-hour average of 10 µg/m3 at any receptor (residence) per year
• D/T—For nuisance odor control, D/T cannot exceed a 1-hour average of 10 D/T at any receptor per year.
In reviewing the regulatory requirements, without any odor control (baseline), the fence line, and Receptors 3 and 7 all exceed the current WAC threshold of 0.9 µg/m3 (0.6 ppbV). However, Receptor 3 is the only receptor that comes close to the future ASIL for H2S of 2.0 µg/m3 (1.3 ppbV). The highest value recorded was at the fence line and was 3.33 µg/m3 (2.18 ppbV). These results showed that the plant currently is not meeting these requirements and odor control is necessary.
The results of the updated baseline nuisance dispersion model indicate that that the new receptors located south of the SCTP do have potential for odor impacts but are still not as high as Receptor 3 from

PHASE 4 ODOR CONTROL UPDATE
40
the 2006 analysis, which is located southeast of the SCTP fence line. This confirms that the conclusions from the 2006 report remain valid. The potential for nuisance odors are still present based on the current plant operation.
Odor Control Strategy 1, which was recommended in 2006, was updated with the new receptors and with the latest odor control systems. The results indicate that only Receptor 7 exceeds the target odor threshold of 10 D/T with implementation of this strategy, but at less than 0.01 percent of the year. The results also showed that Odor Control Strategy 1 meets the 0.9 µg/m3 requirement for toxic air pollution control at the plant boundary.
The updated evaluation comparing the latest odor control technology alternatives indicate that both the engineered media biofilter and BTF are viable options.
Recommendations Based on the updated dispersion model results, the new sensitive receptors are not shown to be a new risk but are still exceeding odor and H2S target thresholds along with other (existing) sensitive receptors without additional odor control measures. The results also indicated that the 0.9 µg/m3 requirement for toxic air pollution control at the plant boundary is currently being exceeded. For these reasons, along with the fact that the potential for nuisance odor complaints remains significant, it is recommended that the revised Odor Control Strategy 1 continue to be carried forward for implementation. This alternative includes covering and ventilating the primary clarifiers and ventilating the headworks facility to an odor control system.
Based on the alternative evaluation results, it is recommended that both the BTF and engineered media biofilter be considered as part of a predesign effort. Considerations beyond the scope of this work that should be considered in more detail include aesthetics of the installation as well as expandability to address future process expansions and overall site constraints.