technical evolution of liquid crystal displays
TRANSCRIPT

Vol. 1 October 2009 | NPG ASIA MATERIALS | www.natureasia.com/asia-materials 29
REVIEW ARTICLE
NPG Asia Mat. 1(1) 29–36 (2009)
doi: 10.1038/asiamat.2009.3
In 1888, more than a century ago, the Austrian botanist Friedrich Reinitzer discovered an intermediate state of matter between iso-tropic liquid and lattice-structured crystal [1–3]. Th is state, later
termed liquid crystal (LC), remained merely a novelty for many years until suitable applications for the technology began to become ap-parent. From the late 1960s, following the realization that various display applications were possible, the popularity of liquid crystal as a research fi eld expanded rapidly, attracting the interest of many sci-entists who made fundamental contributions to the technologies that have led to the spectacular success of liquid crystal displays (LCDs) [3–13]. Th e development of the twisted nematic (TN) [4] and super-twisted nematic (STN) [5] cell confi gurations, along with the neces-sary manufacturing technologies [6–9], resulted in the birth of the LCD industry in the late 1970s and early 1980s. The subsequent development of thin-film transistor (TFT) technology provided a further boost to the industry in the late 1980s [14,15]. Th e boom was signifi cantly supported by the advancement of material technologies such as the highly reliable manufacturing of liquid crystal base mate-rials, and the development of polymers for the alignment layer, color fi lter materials, and sheet-type polarizers formed from the poly(vinyl alcohol)-iodine complex.
In the 1990s, LCDs occupied an important position in the display market primarily through notebook applications, although the cathode ray tube (CRT) continued to dominate the desktop monitor and televi-sion markets. Th e plasma display panel (PDP), which appeared in the commercial market in 1997, pioneered the large-area fl at panel display market. It was widely predicted at the time that PDPs would maintain the lead in the large-area display market and that LCDs in small-display information technology (IT) applications would soon be replaced by new technologies such as displays based on organic light-emitting di-odes (OLEDs) [16,17]. Such predictions were based on the belief that the LCD technology suff ered from serious limitations in terms of both off -axis image quality and moving picture quality, and also that it had proved diffi cult to obtain reasonable manufacturing yields of large-area TFT panels. However, these predictions, as we now know, turned out to be incorrect. Th e application of LCDs has expanded rapidly in re-cent years from purely information technology (IT) applications to the
television and mobile display markets, and now even to very-large-area digital information displays (DIDs).
Interestingly, while LCDs penetrated the traditional territories of other display technologies including CRTs and PDPs, attracting inevitable and heavy competition from these technologies, the most critical competitors were in fact alternative LCD technologies. A range of LCD modes and technologies are now applied in the same areas of application and are compared directly with one another in the market. In applications for which LCD technology always held the monopoly, such as small display devices, LCDs avoided direct competition with
Technical evolution of liquid crystal displays
Kyeong-Hyeon Kim* and Jang-Kun Song†
Samsung Electronics, Korea
Liquid crystal displays (LCDs) have evolved rapidly as a result of fi erce competition among the various LCD technologies, and now
occupy the largest proportion of the entire display market. The evolution of LCDs continues, with new technologies and new materials
in development to replace current devices. This review summarizes the key technologies used in commercially successful LCD
products, focusing on the requirements for high-end displays and the benefi ts of the in-plane switching and multi-domain vertical
alignment modes. As in past advances, the development of new materials will play an important role in the continued technical
evolution of LCDs.
*Corresponding author. Email: [email protected] †Permanent address: UNIST, Ulsan 689-805, Korea
LCD Division, Samsung Electronics Co. Ltd, 200 Myeongami-Ri, Tangjeong-Myeon, Asan City, Chungcheongnam-Do 336-841, Korea
Rearpolarizer
TFT substrate
TFT circuitAlignment layer
LC
Common electrode
Black matrix + color filter
Frontpolarizer
Color filter substrate
Polarizationaxis
Figure 1. Schematic diagram showing the construction of a TN-mode TFT LCD
panel. The twisted LC structure rotates the polarization of incident light (upper pixel)
without an applied electric fi eld, aligning the polarization with the front polarizer
(bright state). When an electric fi eld is applied (lower pixel), the LC layer becomes
homeotropically aligned and the polarization of light is no longer aligned with the
front polarizer (dark state).

K.-H. Kim and J.-K. Song
30 Vol. 1 October 2009 | NPG ASIA MATERIALS | www.natureasia.com/asia-materials
other displays technologies. However, the competition among the vari-ous LCD technologies has been unavoidable and persistent, and it is through this fi erce competition that LCD technologies have evolved so rapidly. This strongly market-driven evolution is one of the main reasons that the early predictions regarding the future of LCDs were proved incorrect. Here, we briefl y review the history of technical evo-lution in LCD technology from the point of view of the performance required for high-end displays.
Wide viewing angle performance
Twisted nematic modeThe TN mode is currently one of the most widely used modes for LCD panels [4]. Figure 1 shows a schematic of a TN-mode TFT LCD. Many of the components comprising the panel are common to all LCDs. Th e LC layer is injected between a TFT substrate and a color filter (CF) substrate. The TFT circuits (data and gate bus lines), pixel electrodes and TFT channels are embedded in the TFT substrate, and the CF substrate consists of sequentially stacked black matrix (BM), color filter (CF) and transparent common-electrode layers. Two orthogonally aligned polarizers are attached to the outer faces of the panel. Th e LC molecules are aligned by surface anchoring to alignment layers formed on the inner surfaces of the two substrates by rubbing in one direction, which results in a preferred alignment of the LC molecules. Th e rubbing directions for the two substrates are at right angles in the TN mode, resulting in an LC layer with a 90° twisted structure in the absence of an electric fi eld. Th e twisted LC structure rotates the polarization of light passing through the cell, aligning the polarization with that of the front polarizer and allow-ing light to pass (bright state). On increasing the electric fi eld applied between the pixel and common electrodes, the LCs align with the electric fi eld, reducing the birefringence (polarization rotation) of the LC layer and resulting in a gray or dark pixel state. Th us, LCDs based on the TN structure exploit the birefringence eff ect of the LC layer directly to control the polarization of light and the transmittance of the panel. However, as the apparent birefringence of the LC layer varies with the viewing direction, image distortion occurs in off -axis observation. This degradation of off-axis image quality is generally considered to be the weakest point of LCD technology, and has been addressed by the development of new LC technologies. Nevertheless, the TN mode is simple and off ers good brightness and response time performance [4]. Hence, the TN mode has been the most widely commercialized LCD mode.
For high-performance applications, a number of new LCD modes providing an improved range of optimum viewing angle have been introduced, including the multi-domain TN mode, surface-stabilized ferroelectric liquid crystal (SSFLC), antiferroelectric liquid crystal (AFLC) and the optically compensated birefringence (OCB) mode [10–13,18–21]. Most of these technologies, however, have not been successfully commercialized due either to difficulties in mass production or to drawbacks other than poor viewing angle. Th e two technologies that have achieved commercial success are the in-plane switching (IPS) mode and the multi-domain vertical alignment (VA) mode.
In-plane switching modeIn the IPS mode (Figure 2), which was fi rst suggested in 1992, uni-formly aligned LC molecules with positive dielectric anisotropy are rotated azimuthally on a glass plate by an electric fi eld aligned paral-lel to the plate [13,21–23]. Th e electric fi eld for azimuthal switching is applied via interlaced electrodes formed on one of substrates. Th e fringe fi eld switching (FFS) mode (also shown in Figure 2) is an ad-vanced form of the IPS technology [24]. Th e transmittance of light in the normal direction of the LC cell, which contains a uniformly aligned LC layer, can be expressed simply by
T = T0sin2[2θ(V)]sin2[πdΔn(V )/λ] (1)
Here, θ is the angle between the optical axis of the LC layer and the direction of the polarizer, V is voltage, d is the cell thickness or the length of the light path, Δn is the optical anisotropy and λ is the wavelength of light. In the IPS mode, the angle θ, and hence the light-transmittance of the cell, is controlled by the applied electric fi eld. Th e alignment layer is rubbed parallel to the axis of the polariz-er to align the LC molecules in the dark state. Th e angle θ varies with the strength of the applied electric fi eld, and non-zero transmittance (i.e. gray levels) is obtained according to equation (1). Hence, gray levels are determined by the fi rst sine term in equation (1), dependent only on θ. When viewed from an off -axis horizontal angle, θ should be replaced by the eff ective angle θ' projected on a plane perpendicu-lar to the ray direction in the LC layer. Th e second sine term contain-ing Δn and λ remains largely constant with respect to the electric fi eld. Th e fi rst sine term is not sensitive to the viewing direction, since the molecules are oriented parallel to the substrate. Overall, the IPS mode is therefore less sensitive to viewing angle than the TN mode, making the IPS mode a wide-viewing-angle mode [25].
However, the second sine term in equation (1) is somewhat de-pendent on the viewing angle, and results in a yellowish image in one diagonal direction and a bluish image in the other diagonal direction. To compensate for this color shift, a chevron-shaped pixel structure with an obtuse angle is used (Figure 2). Th is two-domain structure is called the super IPS (S-IPS) mode [26].
FFS panels have two transparent electrode layers, one of which contains a fi ne grid that induces electric fringe fi elds (see Figure 2). Th ese fringe fi elds drive all the LC molecules in the pixel area, includ-ing LC on the transparent electrode. Compared to the IPS mode, which uses opaque metal electrodes, the FFS off ers higher transmit-tance due to the high aperture ratio and the fringe field effect, al-though the preparation of the panels requires at least one additional photo-lithographic process [24].
Vertical alignment mode In the VA mode [10,12], LC molecules with negative dielectric ani-sotropy are aligned vertically on the substrate in the absence of an electric fi eld, corresponding to the dark state. Under an electric fi eld, the molecules tilt over, resulting in the bright state. Th e transmittance of the VA cell is also expressed by equation (1). However, the term dependent on the applied fi eld is not θ but the eff ective birefringence, Δn(V ), in the second sine term. Δn(V ) is sensitive to the viewing
E
~
a S-IPS
OFF ON
b FFS
ITO
ON
~
Figure 2. Microscope images (upper) and schematic diagrams (lower) of pixels with
the (a) S-IPS and (b) FFS structure.

Technical evolution of liquid crystal displays
Vol. 1 October 2009 | NPG ASIA MATERIALS | www.natureasia.com/asia-materials 31
REVIEW ARTICLE
direction in the VA mode, since the molecules are inclined on the glass substrate under intermediate electric fi elds. Hence, the VA mode was not a wide-viewing-angle mode when it was fi rst introduced in 1971 [10]. Due to a lack of availability of reliable LC and alignment materials, as well as the poor quality of the viewing angle, the VA mode was not used in commercial products for a long time. These limitations were fi nally overcome in the late 1990s, and the VA mode became one of the major commercial wide-viewing-angle modes. Th e key technologies leading to these improvements are a multi-domain structure and a suitable compensation fi lm [27,28].
It is a rather simple engineering task to control the tilt direction of molecules and to form multiple domains in the VA mode. Since molecules in the VA mode are aligned vertically in the dark state, the molecules can be tilted over in any direction by even a weak asym-metric force. Th e tilt direction of LC molecules can thus be control-led using simple structures. In the multi-domain VA (MVA) mode, protrusions are added to the electrodes to force the molecules to tilt from the surface, as shown in Figure 3 [27]. Th e patterned VA (PVA) mode uses open slits on the pixel electrodes to induce fringe fields on the edge of the slits, which causes the molecules to tilt over in the direction perpendicular to the slit (Figure 3) [28]. Th us, four-domain structures can be achieved relatively easily by optimizing the design of either the protrusion (in the MVA mode) or the indium tin oxide (ITO) slit (in the PVA mode). The four sub-domains compensate for one another, enhancing image quality under horizontal off-axis viewing. However, although the four-domain structure improves the image quality significantly, the performance is still insufficient for high-performance LCDs. In particular, color wash-out in off-axis observation needed to be addressed. Th e super PVA (S-PVA) mode, a mode with eight sub-domains, was suggested in response to this need (Figure 3) [29]. Each pixel in an S-PVA panel is composed of two subpixels, each with four domains. Diff erent levels of electric fi elds are applied to each subpixel, resulting in a diff erent tilt angle of the LC molecules. Th us, each pixel has eight eff ective domains. Th e S-PVA mode has much improved image quality in off -axis observation. An advanced MVA technology with eight domains per pixel has also been developed and is now used in MVA applications.
Th e eight-domain, two-subpixel structure for S-PVA and advanced MVA panels is implemented in a number of ways. Two-TFT technol-ogy [30] is one example in which each subpixel has a dedicated TFT that is linked to the gate or data bus lines. Optimized image quality is thus obtained by controlling each subpixel independently. Th is is the simplest method for constructing the eight-domain format, but requires the number of data or gate bus lines to be doubled. To avoid this problem, other technologies such as charge sharing, capacitive-coupling, advanced capacitive-coupling and common voltage swing methods have been developed [30–32]. Although none of these methods requires the number of gate or data bus lines to be increased, the methods off er less control over the electric voltage applied to each subpixel. Thus, two-TFT technology has the greatest advantage in terms of off -axis image quality, even though it has the apparent disad-vantage of doubling the number of gate or data bus lines.
Th e other complementary technology that has been developed to overcome the poor off -axis image quality for VA panels is the com-pensation fi lm.
Compensation fi lms for VA and IPS modesTh e IPS mode has excellent intrinsic image quality, but diagonal off -axis black quality is an area requiring improvement. Th e maximum polar angle at which the contrast ratio between white and black states is greater than 10:1 is about 60° off -axis in the diagonal direc-tion. Th e poor diagonal off -axis black quality of the IPS mode can be improved through the use of a biaxial compensation fi lm known as a ‘z-plate’, which has a refractive index ellipsoid characterized by nx > nz > ny and (nx – nz)/(nx – ny) ≈ 0.5 (z axis is normal to the fi lm, x and y axes are on the fi lm plane) [33]. However, the z-plate fi lm is
diffi cult to manufacture and hence expensive, and so most IPS panels are currently produced without the fi lm. Instead, a low-retardation triacetyl cellulose (TAC) polarizer is used. Th e TAC fi lm has almost no birefringence, and improves the color shift that occurs under di-agonal off -axis viewing in the IPS mode [34].
Although the off -axis diagonal black quality of VA panels is even worse than that for the IPS mode, the diagonal off -axis angle meet-ing the 10:1 contrast requirement can be expanded to more than 89° with the use of an appropriate compensation fi lm. Th ese fi lms are in-dispensable for VA-mode LCDs, and have been studied and adopted from the beginning of development of the MVA and PVA modes [35,36]. Various materials and simple structures have been developed for the compensation film, and the films have become much more aff ordable than the z-plate for the IPS mode. As the structure of the compensation fi lm for the VA mode is simple compared to that used for TN panels, the compensations fi lms for VA panels are even less expensive than the wide-viewing-angle compensation fi lms now used for TN displays [37].
Compensation fi lms should compensate for optical retardation in the oblique direction associated with the geometry of the LC layers, and also for the geometric deformation of the relative angle between the two polarizers (the angle between the two polarizers is 90° on-axis, but less or more than 90° off -axis) [36,38]. For VA-mode LCD panels, a negative C-plate film with a refractive index ellipsoid of nx = ny > nz is used to compensate for the retardation of the LC layer, which has an ellipsoid of nx = ny < nz. However, to compensate for the change in relative angle between the polarizers, the refractive index nx of the compensation fi lm should be diff erent from ny. Th is has been achieved by combining films, such as a combination of an A-plate (nx > ny ≈ nz) and a C-plate, two biaxial plates (nx > ny > nz), one biaxial plate, or a biaxial plate and a C-plate.
Moving image quality
Factors aff ecting moving image qualityTh e quality of moving images is another weak point of LCDs, which generally have slower response times than other display devices [16,17]. Th is relatively poor moving image performance is due to the slow mo-lecular motion of liquid crystal, which causes blurring of the moving picture, and the ‘holding type’ method of display, by which each frame is held on the screen until refreshed with the subsequent frame. To im-prove the moving image quality, these two diff erent factors should be taken into account independently.
~
ITOProtrusion
a MVA
b PVA
c 8-Domain structure
High subpixel
Low subpixel
ITO open (slit)
~
E
Figure 3. Schematic diagrams of the (a) MVA and (b) PVA structures. (c) Microscope
image of eight-domain structure.

K.-H. Kim and J.-K. Song
32 Vol. 1 October 2009 | NPG ASIA MATERIALS | www.natureasia.com/asia-materials
Response time Th e molecular motion of liquid crystal is slow (tens of milliseconds) compared to the frame refresh rate, which results in blurring in the moving image. To achieve faster molecular motion, various factors should be optimized, including the LC material, cell thickness, pixel design, electrode shape and driving scheme.
Over the last 15 years, new LC materials having low viscosity, which is a key factor in determining the response time, have been developed [39]. Th e lowest viscosity of current IPS liquid crystal (with positive dielectric anisotropy) is about 50–60 mPa s, whereas that for VA liquid crystal (with negative dielectric anisotropy) is about 100–110 mPa s. However, as the distance between opposing electrodes in VA cells is the same as the cell thickness (< 4 μm) and shorter than that between the interlaced electrodes in an IPS cell (ca. 10 μm), the eff ective response times of these two types of cells are very similar. Th e IPS mode has a less variable gray-to-gray response time than the VA mode, which is an advantage for the IPS mode [40]. Th e elastic constant is also an impor-tant factor contributing to the response time [41]. Th inner cells impart stronger restoring force due to higher stress, resulting in faster off -re-sponse times [42,43]. Technologies for a thinner cell gap have therefore been developed to improve response times; some LCDs now have cells of as thin as 3 μm.
To further improve the response time of LCDs, overdriving is now commonly used in many high-end displays [44–46]. The response time (τ) of liquid crystal is inversely proportional to the square of the applied electric fi eld, as given by τ ∝ 1/(Vapp – Vth)2, where Vapp is the applied cell voltage and Vth is the threshold voltage of the LC. The response time is therefore sensitive to the strength of the effec-tive electric fi eld applied across the LC layer. However, the TFT-LCD has a weak point in this regard. Th e electric charge (Q) in the pixel is preserved as both storage capacitance (Cst) and LC capacitance (Clc) until the charge is refreshed by the next gate signal. The apparent
dielectric constant (ε) of the LC layer along the electric fi eld changes during molecular movement, and the actual voltage (V ) on the pixel drops gradually, since V = Q/(Cst + Clc) and Clc ∝ ε. Due to this volt-age drop, the LC molecules cannot rotate from the initial to the fi nal states within a single frame, and successive recharges of voltage are required in order to realize the fi nal state over the next several frames. Hence, the transmittance of an LC cell undergoes a step-wise increase over time, termed a ‘cusp’, resulting in a delay in the response time, as shown in Figure 4 [44,45]. To remove the cusp by compensating for the dynamic capacitance change, a higher voltage with respect to the target voltage is applied for turn-on, and a lower voltage is applied for turn-off (Figure 4). Th is is the concept behind overdriving. In reality, the overdrive voltage is determined so as to achieve the fastest response time without introducing side-eff ects such as ghosting or tailing of the image [46].
In VA cells, control of the tilt direction of molecules to prevent the development of an unstable Schlieren texture is also important for im-proving the response time. One method for suppressing the formation of texture is the application of a pre-tilt voltage prior to application of the conventional overshoot voltage [47]. The pre-tilt signal helps the LC molecules tilt over to the desired direction without forming a Schlieren texture, and improves the response time signifi cantly. Another method for suppressing the formation of an unstable texture is the use of an electrode with a fine micro-slit pattern. The molecules tend to align parallel with the micro-slits, suppressing azimuthal movement of the LC molecules [48,49]. Photo-alignment and reactive mesogens are also being developed to induce a pre-tilt angle [50,51].
Holding-type display problemCRT displays are composed of phosphor-based pixels that ‘fl ash’ for a sub-millisecond duration once each frame under excitation by a scanning electron beam. In contrast, a pixel in an LCD maintains a constant luminance for the entire duration of the frame, known as ‘holding’. Th e LCD image therefore remains unchanged for the entire frame until replaced by a new image signal, resulting in a discretely changing image, that is, a static image that is held for one frame and then changes abruptly in the next frame. However, the human eye moves continuously and linearly. Th e diff erence between the trajec-tory of the eye and the movement path of the image on the display causes the viewer to perceive the moving image as being blurred (Figure 5(a)), no matter how fast the response time of the liquid crystal [52–56].
To solve the problem of motion blurring, two independent methods have been developed and adopted successfully in high-end LCDs. One method, impulsive driving [57–59], imitates the display mechanism of the CRT by inserting a black image between successive display frames, either directly or by blinking the backlight lamp in part of the panel (Figure 6(a,b)). The longer the duration of the dark state, the better the quality of the moving image. However, both techniques reduce the luminance of the LCD and introduce fl icker.
Th e other method, known as the high refresh rate method [60,61], reduces blurring without introducing flicker or reducing luminance or contrast by multiplying the frame frequency and inserting one or more interpolated images between successive frames (Figure 6(c)). Th is method is widely used in commercial displays. Th e eff ects of the impul-sive driving and high refresh rate methods are illustrated in Figures 5(b) and (c). The difference between the trajectory of the eye and that of the image is reduced signifi cantly. Recently, a 240 Hz driving method,
n–2 n–1 n n+1 n+2
n–2 n–1 n n+1 n+2
Volt
age
Frame (time)
Frame (time)
Volt
age
a
b
Lum
inan
ceLu
min
ance
Dynamic capacitance effect
Overdriving
Voltage
Voltage
Luminance
Luminance
Figure 4. Schematic diagram illustrating the concept of ‘overdriving’. (a) The ‘cusp’
effect is a step-wise increase in LC cell transmittance that results in a delay in
response time. (b) To compensate for the dynamic capacitance change, a higher
voltage is applied for turn-on, and a lower voltage is applied for turn-off .
Table 1. Measured MPRTs for an S-PVA LCD television panel
Frame frequency No impulsive driving With impulsive driving60 Hz 18.5 ms 9.6 ms
120 Hz 8.7 ms 6.5 ms240 Hz 5.0 ms 3.9 ms

Technical evolution of liquid crystal displays
Vol. 1 October 2009 | NPG ASIA MATERIALS | www.natureasia.com/asia-materials 33
REVIEW ARTICLE
in which three interpolated images are inserted between successive frames, has achieved similar moving image performance to that of CRT displays. Table 1 lists the measured motion picture response times (MPRTs) for various display rates with and without impulsive driving of the backlight [55,56]. Th is measurement is the quantitative response time for moving images considering both the LC molecular motion and the holding image eff ect. For comparison, a CRT display has an MPRT of about 5 ms.
Contrast ratio
Th e contrast ratio for LCDs, defi ned as the ratio of white luminance to black luminance, is one of the most important factors contributing to clear and vivid image quality [29]. For example, when watching a movie on a home display, black luminance greater than 0.1–0.2 Cd/m2 can deteriorate the perceived quality of dark images. An LCD television typically has a brightest luminance of about 500 Cd/m2 and a contrast ratio of 1,000:1, meaning that the black luminance is 0.5 Cd/m2, which is not suffi ciently dark to represent a vivid black image.
For IPS panels in particular, the planar orientation of LC molecules makes it rather diffi cult to prevent light leakage. In the dark state, LC molecules are uniformly aligned parallel to the direction of the polariz-ers, which is achieved by rubbing of the alignment layer. However, such a mechanical rubbing process cannot ensure the perfectly uniform align-ment of molecules, and random defects deteriorate the black quality. It has recently been reported that a contrast ratio of 1,500:1 has been
achieved for IPS-mode panels through the use of an improved rubbing process and materials with low light scattering properties [62,63].
In VA-mode panels, a very dark state can be achieved because there is no residual retardation in the fi eld-off state [61]. Th e micrometer-high protrusions in MVA-mode cells could cause light leakage due to the slight tilting of the LC molecules. Hence, the protrusions should have a gentle inclination to minimize light leakage. The PVA mode, which has an ITO slit, has very little light leakage owing to its flat surface geometry, and recently contrast ratios of around 10,000:1 have been reported at several international conferences.
To obtain very high contrast ratios, both the LC mode and the scat-tering property of the materials are very important. Light leakage by scattering in the various layers of an LCD panel can be as large as that caused by residual retardation in the LC layer [64–66]. Light scatter-ing from the color fi lter layer in particular has the largest contribution to light scattering in an LCD [66–68]. To minimize scattering from the color filter, technologies for reducing the size of color pigments and increasing the degree of pigment dispersion have been developed. Recently, small color pigments of around 60 nm in diameter have been developed. However, as the size of the pigment molecules decreases, the aggregation of molecules becomes stronger, which limits the mini-mum pigment size. To overcome this aggregation, color fi lter materials containing dye colorants are being re-investigated. Another important factor for obtaining high contrast ratios is the material of the polarizer. Th e ability of the polarizer to polarize light is known to be important with regard to the contrast ratio [69], and a number of technologies have been studied and developed to improve the polarizer, including use of the poly(vinyl alcohol)-iodine complex, and the introduction of low-haze surface treatment and low-light-scatter compensation fi lms.
Conventionally, the contrast ratio is measured under dark condi-tions. Recently, however, the ‘ambient’ contrast ratio (measured under ambient lighting conditions) has become more important, particularly for outdoor applications such as mobile displays and advertisement boards [70–72]. Compared to PDPs or CRT displays, LCDs have better contrast ratios under ambient conditions because, unlike PDPs and CRTs, the LCD does not use phosphor, which emits light when excited by ambient incident light [73]. To further improve the ambi-ent contrast ratio for LCDs, suitable surface treatments for reducing refl ections on the surface of the polarizer are currently under vigorous study [72].
Posi
tion
Posi
tion
Frame (time)
Posi
tion
a
b
c
Image
(original)
Eye’s trajectory Image trajectory
n n+1 n+2 n+3
n n+1 n+2 n+3
n n+1 n+2 n+3 n+4 n+5 n+6 n+7
Figure 5. Mechanisms of image blurring in holding-type displays. (a) Conventional
motion. (b) Impulsive driving. (c) High refresh rate driving.
c
Original images
Interpolatedimages
Black image
Set
BLU blinking
Reset
a b
Figure 6. Technologies for enhancing motion picture response time in holding-
type displays. (a) Black image insertion. (b) Blinking (scanning) backlight unit. (c)
High refresh rate method.

K.-H. Kim and J.-K. Song
34 Vol. 1 October 2009 | NPG ASIA MATERIALS | www.natureasia.com/asia-materials
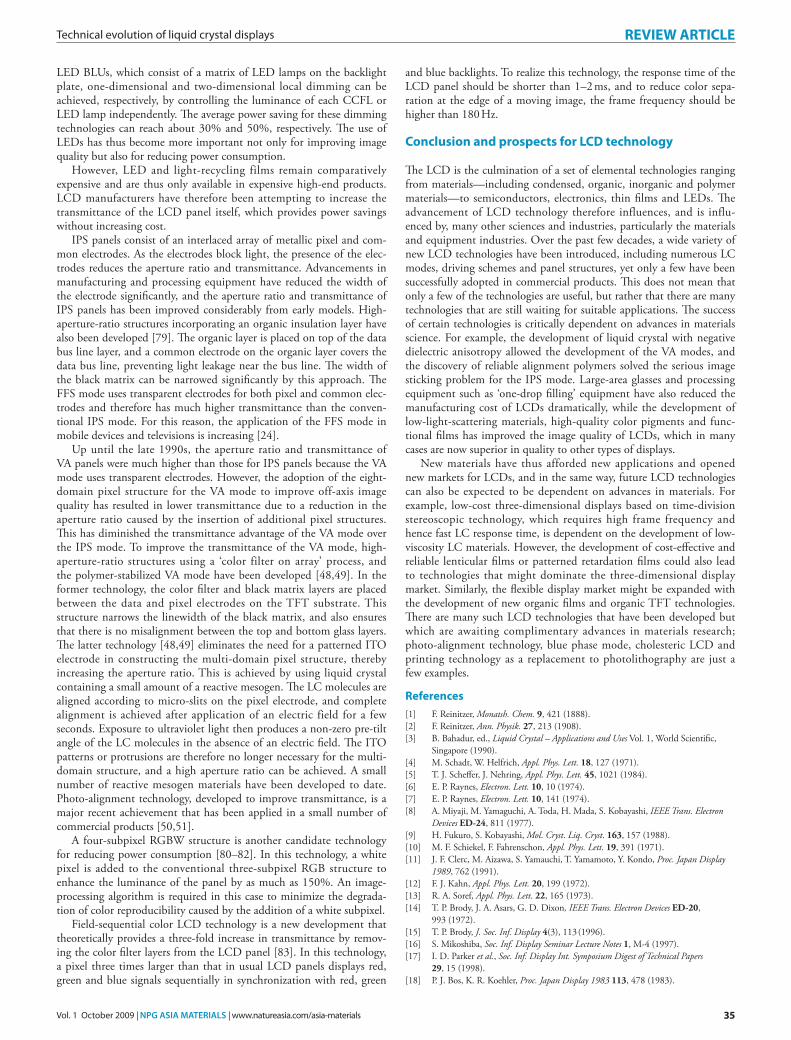
Another important technology for improving the contrast ratio is the dynamic contrast ratio method, which involves localized dimming of the display using an image-synchronized backlight system. Th e basic concept of local dimming is shown in Figure 7. By reducing and in-creasing the brightness of the backlight unit in dark and bright areas of the image, respectively, the quality of the image and the apparent con-trast ratio can be much improved. By dimming the backlight in dark areas, dynamic contrast ratios of 150,000:1 and 1,000,000:1 can be achieved for cold cathode fl uorescent lamp (CCFL) and light-emitting diode (LED) backlight technologies, respectively. However, local dim-ming can introduce artifacts such as the degeneracy of gray levels in the dark or bright state. In particular, the diff erence in black level between dimmed and non-dimmed areas can be perceptible. Such artifacts can be minimized when the panel has a high contrast ratio in the conven-tional sense. An appropriate algorithm for optimizing image data and backlight luminance should be adopted. Table 2 shows the improve-ment in the contrast ratio with the refi nement of these technologies. Th e increase in the ambient contrast ratio over the last few years is pri-marily due to improvements in polarizer surface treatment.
Color performance
Accurate color reproduction is another performance factor for high-end LCDs. Th e ability of an LCD panel to display a continuous and vivid color spectrum is determined by the absorption spectra of the color fi lters forming the panel and the spectral character of the backlight. Th e color fi lter material is composed of a basic resin and colorants, and the quality of colorants is the most important factor in achieving superior color performance [67,68]. Dye colorants were used originally in LCDs, but were later replaced with pigment colorants, which off er greater heat resistance and durability. However, pigments form molecular aggregates of several tens to a few hundred nanometers in size, which causes in-creased light scatter and a consequent reduction in the contrast ratio. Hence, dye colorants have again attracted the interest of researchers due to their superior qualities in terms of contrast ratio and transmittance. Recent technical developments have demonstrated good progress toward overcoming the lower heat resistance and durability of dye materials.
Th e maximum color reproducibility currently achievable for an LCD panel based on control solely using a color fi lter layer is about 90–95% of the National Television System Committee (NTSC) color scheme. Th is is higher than that for both PDPs and CRT displays, but less than the 120% of NTSC achievable by OLED-based displays. By combining a thick color fi lter with a LED backlight system, the color reproducibil-ity can be extended to 150% of the NTSC standard, which is at present the best color reproducibility available for fl at panel displays.
Th e standard red-green-blue (sRGB) color space is known as ‘true color’ in display systems [74], and most recent LCD monitors and LCD televisions cover the sRGB color space, which corresponds to 71% of the NTSC standard. As the technologies for digital cameras and printers improve, sRGB has become insuffi cient for reproducing the vivid images taken by high-end digital cameras. New standards such as the Adobe and xvYCC color spaces, which cover approximately 100% of the NTSC color space, have been proposed, and high-end LCD monitors and televisions covering these color spaces are currently in development [74,75].
Environmental technologies and high-aperture-ratio pixel structure
Environmental issues have recently become more important in the LCD industry, and ‘green’ technologies are now of particular interest. Such technologies typically involve reducing the reliance on hazardous materials and lowering power consumption.
Th e Electronic Products Environmental Assessment Tool (EPEAT) off ered by the Green Electronics Council in the US designates a list of hazardous materials that should be omitted from electronic products (see http://www.epeat.net/), such as cadmium, mercury, arsenic, lead, hexavalent chromium and certain brominated fl ame retardants. Hence, the development of new substitutes for these hazardous materials with-out degrading image quality is an important aspect of LCD research and aff ects most LCD technologies, including the liquid crystal, color fi lter and fl orescent lamp.
Low energy consumption is also an important goal for LCDs, for both consumers and industry, in order to reduce the environmental burden of these devices and to extend the operating time of mobile products. Th e Energy Star 5.0 standard, developed by the Environmen-tal Protection Agency and the Department of Energy in the US, will come into effect in October 2009. This new standard enacts tighter regulation of maximum power consumption for LCDs, defined ac-cording to size and resolution (see http://www.energystar.gov/index.cfm?c=about.ab_index). More than 60% of the total power consump-tion for a notebook LCD panel and more than 80% of that for an LCD monitor or television is attributable to the backlight unit (BLU). High-effi ciency backlight systems and high-transmittance LCD panels are therefore essential technologies for achieving low power consump-tion. LED BLUs consume about 30% less energy than CCFL BLUs, and are thus a good light source for low power consumption applica-tions. Light-recycling film, which re-uses light by transmitting light polarized parallel to the film and reflecting light with perpendicular polarization [76], is another power-saving technology that can enhance the luminance of the LCD panel by about 30%.
Backlight-dimming technology, originally developed to enhance the dynamic contrast ratio, also reduces power consumption [61,77,78]. Th e backlight luminance in this case is varied according to the maxi-mum gray level of the displayed image. For example, if the maximum gray level of the image is half the full white level, the backlight lumi-nance is dimmed to 50% of full luminance by reducing the electric current supplied to the lamps, and the image data are modified to effectively double the panel transmittance so as to achieve the same luminance as the original image. In the case of edge-type fl uorescent BLUs, which are installed on one or two edges of the panel, dimming is performed globally, changing the luminance uniformly over the entire display area. This method can reduce power consumption by about 8%. To further increase energy efficiency, the panel can be divided into segments, and the luminance of each segment can be controlled independently [78]. In the case of direct CCFL BLUs, which consist of many long fl orescence lamps located across the entire panel, and direct
Backlight unit
Display
Figure 7. Local dimming method for backlights consisting of a matrix of LEDs.
Table 2. Improvement in measured contrast ratios for S-PVA LCD television panels
Year
Contrast ratio 2003 2006 2008 2009Conventional 1,000:1 2,000:1 5,000:1 8,000:1Ambient* 600 1,250 1,600 1,800Dynamic 5,000:1 10,000:1 50,000:1 150,000:1Polarizability 99.988 99.993 99.996 99.998
*Under 200 lx external luminance
Technical evolution of liquid crystal displays
Vol. 1 October 2009 | NPG ASIA MATERIALS | www.natureasia.com/asia-materials 35
REVIEW ARTICLE
LED BLUs, which consist of a matrix of LED lamps on the backlight plate, one-dimensional and two-dimensional local dimming can be achieved, respectively, by controlling the luminance of each CCFL or LED lamp independently. Th e average power saving for these dimming technologies can reach about 30% and 50%, respectively. Th e use of LEDs has thus become more important not only for improving image quality but also for reducing power consumption.
However, LED and light-recycling films remain comparatively expensive and are thus only available in expensive high-end products. LCD manufacturers have therefore been attempting to increase the transmittance of the LCD panel itself, which provides power savings without increasing cost.
IPS panels consist of an interlaced array of metallic pixel and com-mon electrodes. As the electrodes block light, the presence of the elec-trodes reduces the aperture ratio and transmittance. Advancements in manufacturing and processing equipment have reduced the width of the electrode signifi cantly, and the aperture ratio and transmittance of IPS panels has been improved considerably from early models. High-aperture-ratio structures incorporating an organic insulation layer have also been developed [79]. Th e organic layer is placed on top of the data bus line layer, and a common electrode on the organic layer covers the data bus line, preventing light leakage near the bus line. Th e width of the black matrix can be narrowed signifi cantly by this approach. Th e FFS mode uses transparent electrodes for both pixel and common elec-trodes and therefore has much higher transmittance than the conven-tional IPS mode. For this reason, the application of the FFS mode in mobile devices and televisions is increasing [24].
Up until the late 1990s, the aperture ratio and transmittance of VA panels were much higher than those for IPS panels because the VA mode uses transparent electrodes. However, the adoption of the eight-domain pixel structure for the VA mode to improve off-axis image quality has resulted in lower transmittance due to a reduction in the aperture ratio caused by the insertion of additional pixel structures. Th is has diminished the transmittance advantage of the VA mode over the IPS mode. To improve the transmittance of the VA mode, high-aperture-ratio structures using a ‘color filter on array’ process, and the polymer-stabilized VA mode have been developed [48,49]. In the former technology, the color fi lter and black matrix layers are placed between the data and pixel electrodes on the TFT substrate. This structure narrows the linewidth of the black matrix, and also ensures that there is no misalignment between the top and bottom glass layers. Th e latter technology [48,49] eliminates the need for a patterned ITO electrode in constructing the multi-domain pixel structure, thereby increasing the aperture ratio. This is achieved by using liquid crystal containing a small amount of a reactive mesogen. Th e LC molecules are aligned according to micro-slits on the pixel electrode, and complete alignment is achieved after application of an electric field for a few seconds. Exposure to ultraviolet light then produces a non-zero pre-tilt angle of the LC molecules in the absence of an electric fi eld. Th e ITO patterns or protrusions are therefore no longer necessary for the multi-domain structure, and a high aperture ratio can be achieved. A small number of reactive mesogen materials have been developed to date. Photo-alignment technology, developed to improve transmittance, is a major recent achievement that has been applied in a small number of commercial products [50,51].
A four-subpixel RGBW structure is another candidate technology for reducing power consumption [80–82]. In this technology, a white pixel is added to the conventional three-subpixel RGB structure to enhance the luminance of the panel by as much as 150%. An image-processing algorithm is required in this case to minimize the degrada-tion of color reproducibility caused by the addition of a white subpixel.
Field-sequential color LCD technology is a new development that theoretically provides a three-fold increase in transmittance by remov-ing the color fi lter layers from the LCD panel [83]. In this technology, a pixel three times larger than that in usual LCD panels displays red, green and blue signals sequentially in synchronization with red, green
and blue backlights. To realize this technology, the response time of the LCD panel should be shorter than 1–2 ms, and to reduce color sepa-ration at the edge of a moving image, the frame frequency should be higher than 180 Hz.
Conclusion and prospects for LCD technology
Th e LCD is the culmination of a set of elemental technologies ranging from materials—including condensed, organic, inorganic and polymer materials—to semiconductors, electronics, thin fi lms and LEDs. Th e advancement of LCD technology therefore influences, and is influ-enced by, many other sciences and industries, particularly the materials and equipment industries. Over the past few decades, a wide variety of new LCD technologies have been introduced, including numerous LC modes, driving schemes and panel structures, yet only a few have been successfully adopted in commercial products. Th is does not mean that only a few of the technologies are useful, but rather that there are many technologies that are still waiting for suitable applications. Th e success of certain technologies is critically dependent on advances in materials science. For example, the development of liquid crystal with negative dielectric anisotropy allowed the development of the VA modes, and the discovery of reliable alignment polymers solved the serious image sticking problem for the IPS mode. Large-area glasses and processing equipment such as ‘one-drop fi lling’ equipment have also reduced the manufacturing cost of LCDs dramatically, while the development of low-light-scattering materials, high-quality color pigments and func-tional fi lms has improved the image quality of LCDs, which in many cases are now superior in quality to other types of displays.
New materials have thus afforded new applications and opened new markets for LCDs, and in the same way, future LCD technologies can also be expected to be dependent on advances in materials. For example, low-cost three-dimensional displays based on time-division stereoscopic technology, which requires high frame frequency and hence fast LC response time, is dependent on the development of low-viscosity LC materials. However, the development of cost-eff ective and reliable lenticular fi lms or patterned retardation fi lms could also lead to technologies that might dominate the three-dimensional display market. Similarly, the fl exible display market might be expanded with the development of new organic fi lms and organic TFT technologies. Th ere are many such LCD technologies that have been developed but which are awaiting complimentary advances in materials research; photo-alignment technology, blue phase mode, cholesteric LCD and printing technology as a replacement to photolithography are just a few examples.
References
[1] F. Reinitzer, Monatsh. Chem. 9, 421 (1888).[2] F. Reinitzer, Ann. Physik. 27, 213 (1908).[3] B. Bahadur, ed., Liquid Crystal – Applications and Uses Vol. 1, World Scientifi c,
Singapore (1990).[4] M. Schadt, W. Helfrich, Appl. Phys. Lett. 18, 127 (1971).[5] T. J. Scheff er, J. Nehring, Appl. Phys. Lett. 45, 1021 (1984). [6] E. P. Raynes, Electron. Lett. 10, 10 (1974).[7] E. P. Raynes, Electron. Lett. 10, 141 (1974).[8] A. Miyaji, M. Yamaguchi, A. Toda, H. Mada, S. Kobayashi, IEEE Trans. Electron
Devices ED-24, 811 (1977).[9] H. Fukuro, S. Kobayashi, Mol. Cryst. Liq. Cryst. 163, 157 (1988).[10] M. F. Schiekel, F. Fahrenschon, Appl. Phys. Lett. 19, 391 (1971).[11] J. F. Clerc, M. Aizawa, S. Yamauchi, T. Yamamoto, Y. Kondo, Proc. Japan Display
1989, 762 (1991).[12] F. J. Kahn, Appl. Phys. Lett. 20, 199 (1972).[13] R. A. Soref, Appl. Phys. Lett. 22, 165 (1973).[14] T. P. Brody, J. A. Asars, G. D. Dixon, IEEE Trans. Electron Devices ED-20,
993 (1972).[15] T. P. Brody, J. Soc. Inf. Display 4(3), 113 (1996).[16] S. Mikoshiba, Soc. Inf. Display Seminar Lecture Notes 1, M-4 (1997).[17] I. D. Parker et al., Soc. Inf. Display Int. Symposium Digest of Technical Papers
29, 15 (1998).[18] P. J. Bos, K. R. Koehler, Proc. Japan Display 1983 113, 478 (1983).

K.-H. Kim and J.-K. Song
36 Vol. 1 October 2009 | NPG ASIA MATERIALS | www.natureasia.com/asia-materials
[19] Y. Yamaguchi, T. Miyashita, T. Uchida, Soc. Inf. Display Int. Symposium Digest of Technical Papers 24, 277 (1993).
[20] N. A. Clark, S. T. Lagerwall, Appl. Phys. Lett. 36, 899 (1980).[21] R. Kiefer, B. Webber, F. Windscheid, G. Baur, Proc. Japan Display 1992, 547 (1992).[22] M. Oh-e, K. Kondo, Appl. Phys. Lett. 67, 3895 (1995).[23] K. Kondo, K. Kinugase, N. Konishi, H. Kawagami, Soc. Inf. Display Int. Symposium
Digest of Technical Papers 27, 81 (1996).[24] S. H. Lee, S. L. Lee, H. Y. Kim, Appl. Phys. Lett. 73, 2881 (1998).[25] M. Oh-e, Liquid Crystals Today 10 (2001).[26] H. Wakemoto et al., Soc. Inf. Display Int. Symposium Digest of Technical Papers
28, 929 (1997).[27] A. Takeda et al., Soc. Inf. Display Int. Symposium Digest of Technical Papers
29, 1077 (1998).[28] K. H. Kim et al., Proc. Asia Display 1998, 383 (1998).[29] S. S. Kim, B. H. Berkeley, K. H. Kim, J. K. Song, J. Soc. Inf. Display
12(4), 353 (2004).[30] S. S. Kim, B. H. Berkeley, J. H. Park, T. Kim, J. Soc. Inf. Display 14(2),
127 (2006).[31] S. B. Park et al., Soc. Inf. Display Int. Symposium Digest of Technical Papers
38, 1252 (2007).[32] Y.-P. Huang et al., Soc. Inf. Display Int. Symposium Digest of Technical Papers
38, 1010 (2007).[33] Y. Saitoh, S. Kimura, K. Kusafuka, H. Shimizu, Soc. Inf. Display Int. Symposium
Digest of Technical Papers 29, 706 (1998).[34] T. Yasuda et al., SSoc. Inf. Display Int. Symposium Digest of Technical Papers
37, 1169 (2006).[35] K. Ohmuro, S. Kataoka, T. Sasaki, Y. Koike, Soc. Inf. Display Int. Symposium Digest
of Technical Papers 28, 845 (1997).[36] J. Chen et al., Soc. Inf. Display Int. Symposium Digest of Technical Papers
29, 315 (1998).[37] H. Mori, Y. Itoh, Y. Nishiura, T. Nakamura, Y. Shinagawa, Proc. AM-LCD 1996,
189 (1996).[38] J. E. Bigelow, R.A. Kashnow, Appl. Opt. 19, 2090 (1977).[39] C. S. Lim, J. H. Lee, C. H. Oh, H. C. Choi, Proc. Int. Meeting on Information
Display 2003, 68 (2003).[40] M. Ohta et al., Soc. Inf. Display Int. Symposium Digest of Technical Papers
28, 86 (1997).[41] C. S. Lim et al., Proc. Int. Meeting on Information Display 2004, 26-4 (2004).[42] H. Hasebe, S. Kobayashi, Soc. Inf. Display Int. Symposium Digest of Technical Papers
16, 81 (1985).[43] T. Tanaka, H. Hasebe, S. Kobayashi, Proc. Japan Display 1986, 396 (1986). [44] B. W. Lee et al., Proc. Int. Display Workshops 2000, 1153 (2000).[45] B. G. Rho, B. K. Yang, S. S. Lee, J. S. Kim, Proc. Int. Display Workshops 2000,
1155 (2000).[46] B. W. Lee, D. Sagong, G. Jeong, Soc. Inf. Display Int. Symposium Digest of Technical
Papers 32, 1106 (2001).[47] J. K. Song et al., Soc. Inf. Display Int. Symposium Digest of Technical Papers
35, 1344 (2004).[48] S. G. Kim et al., Appl. Phys. Lett. 90, 261910 (2007).[49] M.-H. Wu, R.-C. Yang, Proc. Int. Display Workshops 2007, 1669 (2007).[50] M. Schadt, K. Schmitt, V. Kozinkov, V. Chigrinov, Jpn J. Appl. Phys.
31, 2155 (1992).[51] W.-C. Lee, C.-S. Hsu, S.-T. Wu, Jpn J. Appl. Phys. 40, 5942 (2001).
[52] D. Parker, in Display Systems pp. 353–364, John Wiley & Sons, UK (1997).[53] T. Kurita, A. Saito, I. Yuyama, Proc. Int. Display Workshops 1998, 823 (1998).[54] T. Kurita, Soc. Inf. Display Int. Symposium Digest of Technical Papers
32, 986 (2001).[55] K. Oka, Y. Enami, Soc. Inf. Display Int. Symposium Digest of Technical Papers
35, 1266 (2004).[56] Y. Igarashi et al., Soc. Inf. Display Int. Symposium Digest of Technical Papers
35, 1262 (2004).[57] N. Fisekovic, T. Nauta, H. J. Cornelissen, J. Bruinink, Proc. Int. Display Workshops
2001, 1637 (2001).[58] M. A. Klompenhouwer, Soc. Inf. Display Int. Symposium Digest of Technical Papers
36, 1578 (2005).[59] A. A. S. Sluyterman, E. P. Boonekamp, Soc. Inf. Display Int. Symposium Digest of
Technical Papers 36, 996 (2005).[60] Y. Kuroki, T. Nishi, S. Kobayashi, H. Oyaizu, S. Yoshimura, Soc. Inf. Display Int.
Symposium Digest of Technical Papers 37, 14 (2006).[61] S. S. Kim et al., Soc. Inf. Display Int. Symposium Digest of Technical Papers
38, 1003 (2007).[62] I. Mori, R. Oke, K. Kamoshida, T. Asakura, K. Ono, Proc. EuroDisplay 2005,
102 (2005).[63] Y. Utsumi et al., Soc. Inf. Display Int. Symposium Digest of Technical Papers
39, 129 (2008).[64] W. Heller, M. Nakagaki, J. Chem. Phys. 61(9), 3619 (1974).[65] M. Yoneya, Y. Utsumi, Y. Umeda, J. Appl. Phys. 98, 016106 (2005).[66] X. Li, A. Tafl ove, V. Backman, Optics Lett. 30(8), 902 (2005).[67] Y. Utsumi, I. Hiyama, Y. Tomioka, K. Kondo, S. Matsuyma, Jpn J. Appl. Phys.
46, 1047 (2007).[68] L. E. McNeil, R. H. French, J. Appl. Phys. 89(1), 283 (2001).[69] Y. Yoshimi, Proc. Flat Panel Display Int. 2004, 146 (2004).[70] C. F. Chao, W. Cheng, Inf. Display 37, 322 (2006).[71] S.-C. Jeng et al., Soc. Inf. Display Int. Symposium Digest of Technical Papers
38, 315 (2007).[72] E. F. Kelley, M. Lindfors, J. Penczek, J. Soc. Inf. Display 14(12), 1019 (2006).[73] S. H. Yoo, T. J. Kweon, H. Kwon, E. G. Heo, Soc. Inf. Display Int. Symposium
Digest of Technical Papers 37, 1217 (2006).[74] P. Green, L. W. MacDonald, Colour Engineering: Achieving Device Independent
Colour, John Wiley & Sons, UK (2002).[75] T. Matsumoto et al., Soc. Inf. Display Int. Symposium Digest of Technical Papers
37, 1130 (2006).[76] N. Guselnikov, P. Lazarev, M. Paukshto, P. Yeh, J. Soc. Inf. Display
13(12), 339 (2005).[77] J. H. Stessen, J. G. R. van Mourik, Soc. Inf. Display Int. Symposium Digest of Techni-
cal Papers 37, 1249 (2006).[78] T. Shirai, S. Shimizukawa, T. Shiga, S. Mikoshiba, T. Käläntär, Soc. Inf. Display Int.
Symposium Digest of Technical Papers 37, 1520 (2006).[79] J.-S. Lin, K.-H. Yang, S.-H. Chen, Jpn J. Appl. Phys. 44, 6178 (2005).[80] B. W. Lee et al., Soc. Inf. Display Int. Symposium Digest of Technical Papers
34, 1212 (2003).[81] L. Wang, Y. Tu, L. Chen, K. Teunissen, I. Heynderickx, Soc. Inf. Display Int. Sympo-
sium Digest of Technical Papers 38, 1142 (2007).[82] C. H. Brown Elliott et al., J. Soc. Inf. Display 11(1), 89 (2003).[83] L. Arend, J. Lubin, J. Gille, J. Larimer, Soc. Inf. Display Int. Symposium Digest of
Technical Papers 25, 201 (1994).
Kyeong Hyeon Kim
Kyeong Hyeon Kim received his BS and MS degrees at Korea
University and the Korea Advanced Institute of Science and Tech-
nology in 1984 and 1986, and earned his PhD degree in organic
material engineering at the Tokyo Institute of Technology, Japan, in
1994. He conducted postdoctoral research on ferroelectric liquid
crystals at the University of Colorado, USA, before joining Samsung Electronics
in Korea. His work on liquid crystal technology has included innovations such
as PVA/S-PVA technology, fast-response LC, optical compensation films and
new LC modes for wide viewing angle and fast response. He is currently vice
president of LC technology in Samsung’s LCD research and development team.
Jang-Kun Song
Jang-Kun Song received his BS and MS degrees in physics
from Korea University in 1994 and 1996. He joined Samsung
Electronics in 1996, where he has been working as project
leader on the development of new LCD modes and frontier
technologies. He obtained his PhD in electronics engineering
from Trinity College Dublin, Ireland, in 2008, where he carried out
fundamental research on liquid crystalline materials, publishing 18 papers.
He is the main inventor of the PVA and S-PVA modes, and holds about
150 patents including 50 US patents. He is currently principal engineer at
Samsung in Korea.
Author profi les