technical & economic considerations …arnoldkeller.com/presentation.pdfslide 6 shows the net...
TRANSCRIPT

COMPARING SELECTED POST- AND PRE-COMBUSTION ROUTES TO CO2 CAPTURE:
TECHNICAL & ECONOMIC CONSIDERATIONS
Presented at:
The Catalyst Group Resources™
Contact Details: John J. Murphy
Phone +1 (215) 628-4447
Email: [email protected]
Carbon Dioxide Capture Conversion (CO2CC) Program 2011 Annual Meeting
Held in San Francisco, California, October 11, 2011
By: Arnold Keller, Process Engineering Consultant
London Management, Inc., Las Vegas, Nevada
www.ArnoldKeller.com
Introduction
For this brief presentation, the goal is to select a couple of the processes that were documented at
length in the TCGR post combustion topics of the CC program, as well as a couple of the processes from
the pre-combustion CC topics. The detailed reports are a matter of record and can be reviewed again at
your convenience.
The objective of the presentation is to compare the most “imminent” contenders for CC for both the
post-combustion and the pre-combustion alternatives on a side-by-side basis.
T he analysis provided in the detailed report, as well as this presentation is exclusively developed from
information available in the public domain.

The starting point for the presentation is a DOE/NETL study published in 2007. In this report, there were
12 cases analyzed. The study compared IGCC with and without pre-combustion CC for three gasification
technologies -- GE, E-Gas and Shell.
Other cases looked at pulverized coal combustion using sub-critical and super-critical steam boiler
technology with and without post combustion CC.
Yet other cases compared using NG in a combined cycle, with and without post combustion CC.
For the post combustion PC technology CC, the technology selected in the DOE report was a MEA based
amine (first generation process) commercialized by Fluor in their Econamine FG post combustion CC
process.
The detailed report issued for the first TCGR consortium study last year included 2 second generation
processes. The first was developed by Kansai and Mitsubishi Heavy Industries (MHI), the KM CDR
process – The “Kansai Mitsubishi Carbon Dioxide Recovery” (KM CDR) process. The second of these
detailed processes was Alstom’s Chilled Ammonia Process (CAP).
The second report issued for TCGR Consortium this year focused on pre-combustion CC processes. The
two state-of-the art processes are Selexol™ and Rectisol®. The Selexol process is licensed by Honeywell’s
UOP division (and alternatively provided by The DOW Chemical Company). The generic version of the
same solvent is available from Costal Chemicals. The solvent from Costal Chemicals is provided without
any process guarantees and is used at the owners’ risk.
The Rectisol process is licensed by both Linde (a German company), and by Lurgi, (recently purchased by
Air Liquide, a French company). The solvent used in the Rectisol process is Methanol -- a relatively
inexpensive commodity chemical.
The final example of pre-combustion CC is a brand new process which was developed to reduce energy
costs and to capitalize on combining proven, commercialized, current processes in a new integrated
method, which enables substantial electric power savings over the current state-of-the-art process.
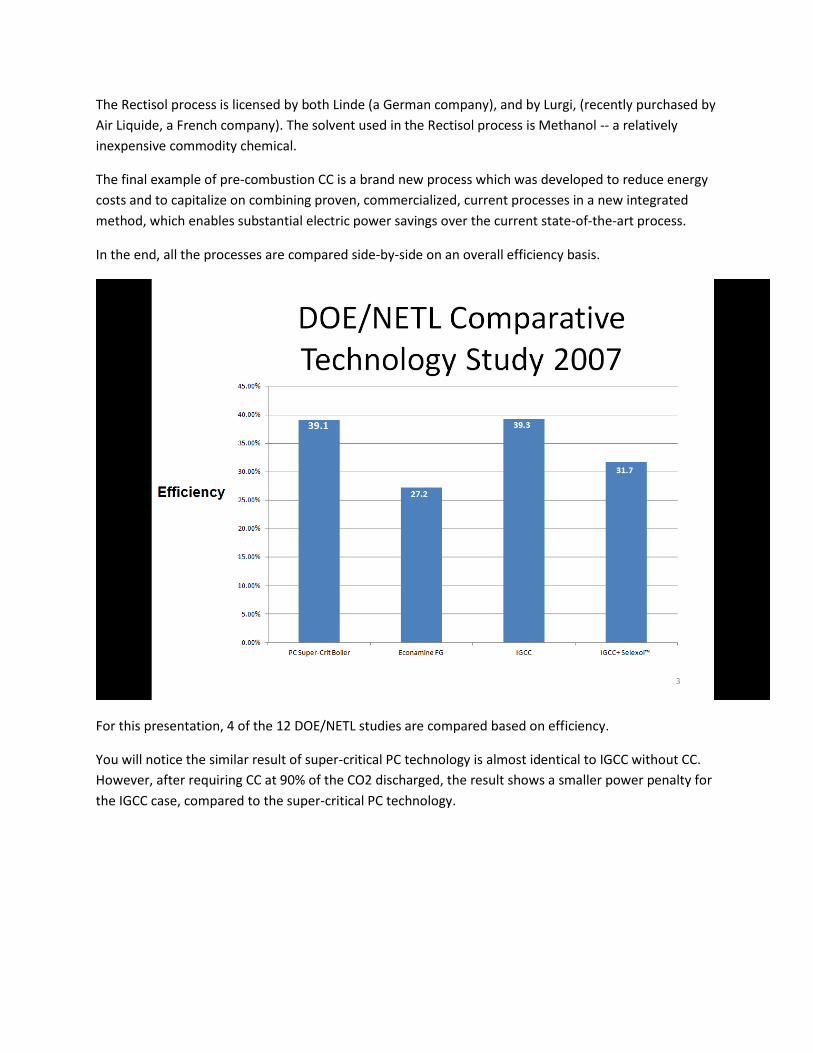
In the end, all the processes are compared side-by-side on an overall efficiency basis.
For this presentation, 4 of the 12 DOE/NETL studies are compared based on efficiency.
You will notice the similar result of super-critical PC technology is almost identical to IGCC without CC.
However, after requiring CC at 90% of the CO2 discharged, the result shows a smaller power penalty for
the IGCC case, compared to the super-critical PC technology.

GEN
FGD
BOILER
FLUE GAS
DEAERATOR
CONDENSER
CONDENSATE
STEAM
STEAM
STEAMHEATCOMBUSTION OFFUEL + AIR
VENT
POWER SALES
PC BOILER WITHOUT
CARBON CAPTURE4
Slide 4 shows a simplified block diagram for the a PC technology without CC
GEN
FGD
BOILER
DEAERATOR
CONDENSER
CONDENSATE
STEAM
STEAM
STEAMHEATCOMBUSTION OFFUEL + AIR
VENT
ATM DISCHARGE
CONDENSATE
CONDENSATE
DEHYDRATION
STEAM
STRIPPER
ABSORBER
COMPRESSOR COMPRESSOR
CO2 SALES
POWER SALES
PC BOILER WITH POST COMBUSTIONCARBON CAPTURE
1st & 2nd
STAGES3, 4,& 5th
STAGES
5
Slide 5 shows the added equipment required when you want (or are obliged) to “go green.” The
additional equipment is needed to capture CO2 post combustion.
The exhaust flue gas is desulfurized to a low level, and is then contacted by a lean solvent to absorb the
CO2. The rich solvent is regenerated in a steam heated stripper arrangement, releasing a water
saturated CO2 stream at atmospheric pressure. This wet CO2 stream is then compressed, dried and
additional compression is needed to reach the CO2 discharge super-critical pressure for pipeline
transmission.
The different technologies use different solvents. The lower the energy needed for regeneration of the
solvent, leaves more steam to make more power. If the solvent releases the CO2 at atmospheric
pressure, then all the CO2 will be compressed to super-critical pressure in 5 stages, with drying
occurring typically after the 2nd stage of compression.
The red lines show where the parasitic power is consumed by the post combustion CC process. Most of
the parasitic power is lost in the steam regeneration. A substantial loss occurs in the compression of CO2
to supercritical pressure.
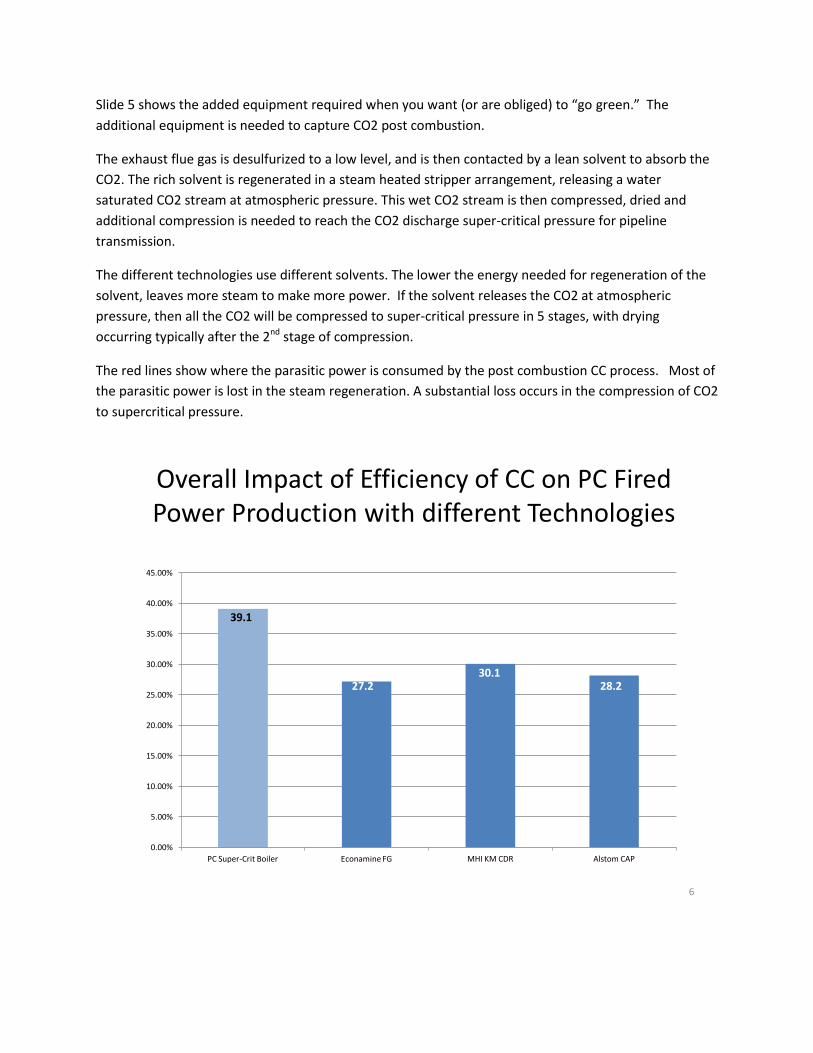
Overall Impact of Efficiency of CC on PC Fired Power Production with different Technologies
0.00%
5.00%
10.00%
15.00%
20.00%
25.00%
30.00%
35.00%
40.00%
45.00%
PC Super-Crit Boiler Econamine FG MHI KM CDR Alstom CAP
39.1
27.230.1
28.2
6

Slide 6 shows the net effect of post combustion CC on a PC supercritical technology, using the different
solvents. Solvents with the least requirement of regeneration heat are most advantageous.
The least amount of heat needed to regenerate the CO2 is from the Alstom CAP process. It is lower than
both Economine FG, and the KM CDR process, so the first inclination is to assume the Alstom’s CAP
process would prove to be the best.
Furthermore, Alstom’s CAP process is designed to discharge its CO2 at a pressure of roughly 300 psig
(saving about2 stages of compression).
Something else must be going on in the CAP process for it to be less effective than the KM CDR process.
What could it be?
Post-Combustion CCParasitic loss breakdown
0.00%
5.00%
10.00%
15.00%
20.00%
25.00%
30.00%
PC Super-Crit Boiler Econamine FG MHI KM CDR Alstom CAP
Steam Diverted
Compression Energy
Auxiliaries
7
Slide 7 shows the breakdown on the parasitic power used in each of the post combustion CC processes
compared to each other. The green range (top) of power loss is attributed to the steam used in
regenerating the CAP solvent. Clearly the green range is less than both Econoamine FG and KM CDR.

The red section (middle) of the power loss of the Alstom’s parasitic bar is attributed to the CO2
compression power, also is clearly less than the other two processes.
The big difference is shown in the amount of auxiliary power required by Alstom’s CAP process (the blue
region – bottom - of the parasitic power loss bar).
8
Alstom Chilled Ammonia Process (CAP)
Slide 8 is a flow sheet of Alstom’s process, as used in the test “Proof of Concept” demonstration facility
at the Pleasant Prairie Power Plant (“P4 Plant”), in Wisconsin. This demonstration has now been
discontinued and it did not compress the released CO2 from the CO2 stripper to super-critical pressure.
Instead the CO2 was discharged at stripper pressure (about 300 psig) into the atmosphere. The flow
sketch does not show the remaining 3 stages of CO2 compression needed to compress the CO2 to
super-critical pressure that would be needed in a commercial Alstom CAP plant.
What is apparent from the flow sheet is the amount of auxiliary equipment needed to pre-treat the flue
gas, to cool the flue gas to absorption temperature, and the amount of equipment needed to recover
the ammonia that would otherwise be lost to the environment. Also, a booster blower is needed to
force the flue gas through all the extra towers needed in the CAP process, compared to the other two
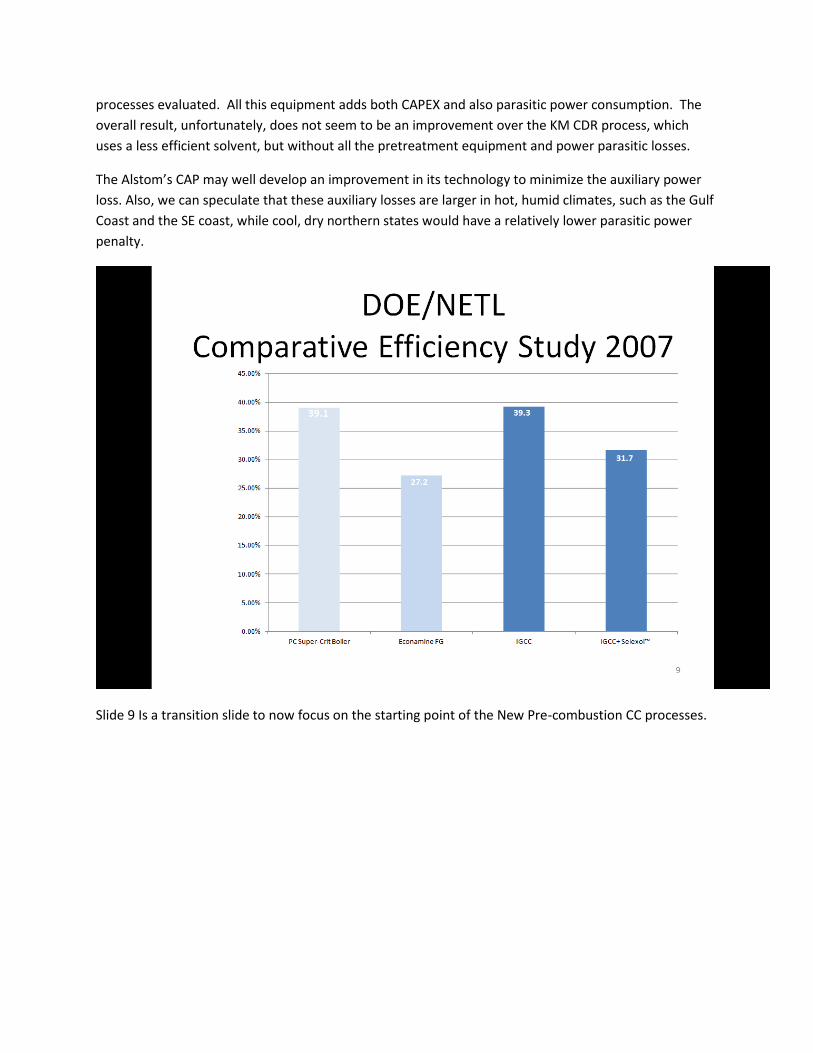
processes evaluated. All this equipment adds both CAPEX and also parasitic power consumption. The
overall result, unfortunately, does not seem to be an improvement over the KM CDR process, which
uses a less efficient solvent, but without all the pretreatment equipment and power parasitic losses.
The Alstom’s CAP may well develop an improvement in its technology to minimize the auxiliary power
loss. Also, we can speculate that these auxiliary losses are larger in hot, humid climates, such as the Gulf
Coast and the SE coast, while cool, dry northern states would have a relatively lower parasitic power
penalty.
Slide 9 Is a transition slide to now focus on the starting point of the New Pre-combustion CC processes.

FUELGASIFICATION
HT HEATRECOVERY
SOLIDS FILTER +WASH
LT HEATRECOVERY
H2S REMOVAL
POWERISLAND
CLAUS SULFUR
HYDROLYSIS+
COMPRESSION
ASU
AIR
O2
N2
IGCC NO CARBON CAPTURE
POWERSALES
10
Slide 10 is a typical simplified IGCC process without CC. It features a Hydrolysis and compression process
for the Claus tail gas recycle to co-feed the Acid Gas Removal (AGR) plant. This arrangement is less
expensive than building a Claus Tail Gas Unit (TGU) and also it results in a 100% of the sulfur removed in
the Claus plant.
FUELGASIFICATION
HT HEATRECOVERY
SOLIDS FILTER +WASH
LT HEATRECOVERY
H2S REMOVAL
POWERISLAND
CLAUS SULFUR
HYDROLYSIS+
COMPRESSION
ASU
AIR
O2
N2
CO SHIFT
R
STEAM
FLASH
FLASH
CO2
ABSORBER
1st
Stage2nd Stage
3rd Stage
4th Stage
5th StageCO2
CO2
CO2
STEAM POWER
H2
IGCC WITHSTATE OF THE ARTCARBON CAPTURE
POWERSALES
11
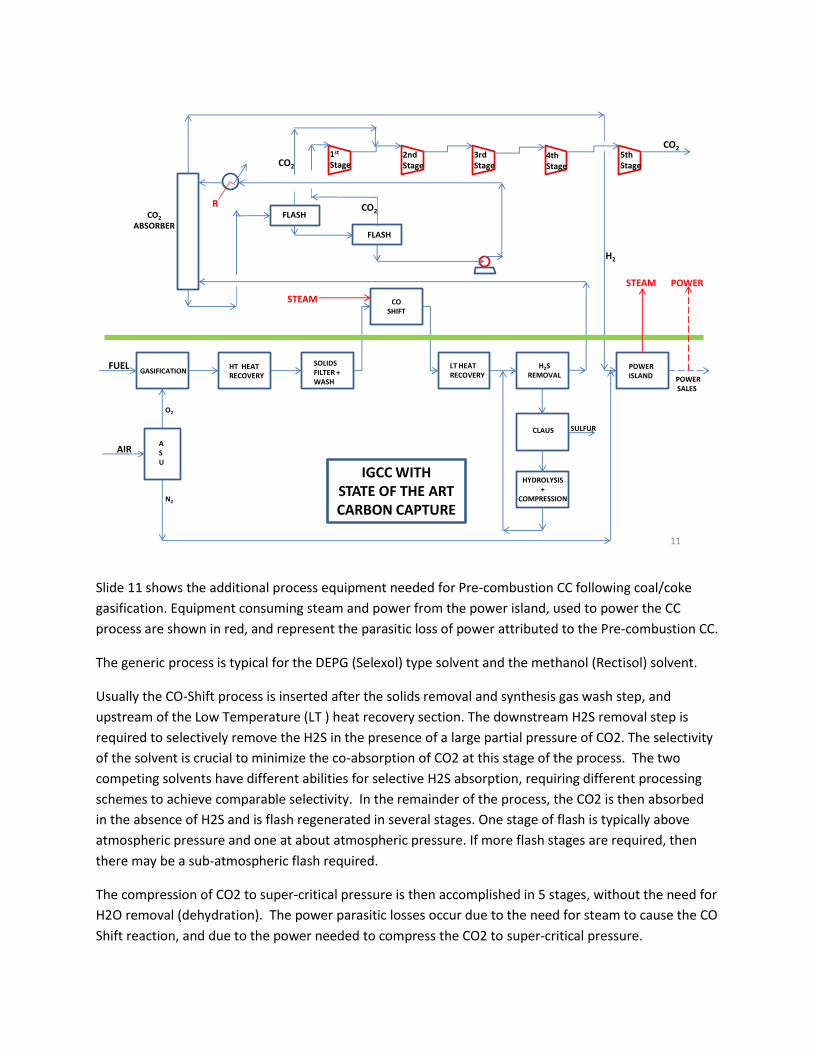
Slide 11 shows the additional process equipment needed for Pre-combustion CC following coal/coke
gasification. Equipment consuming steam and power from the power island, used to power the CC
process are shown in red, and represent the parasitic loss of power attributed to the Pre-combustion CC.
The generic process is typical for the DEPG (Selexol) type solvent and the methanol (Rectisol) solvent.
Usually the CO-Shift process is inserted after the solids removal and synthesis gas wash step, and
upstream of the Low Temperature (LT ) heat recovery section. The downstream H2S removal step is
required to selectively remove the H2S in the presence of a large partial pressure of CO2. The selectivity
of the solvent is crucial to minimize the co-absorption of CO2 at this stage of the process. The two
competing solvents have different abilities for selective H2S absorption, requiring different processing
schemes to achieve comparable selectivity. In the remainder of the process, the CO2 is then absorbed
in the absence of H2S and is flash regenerated in several stages. One stage of flash is typically above
atmospheric pressure and one at about atmospheric pressure. If more flash stages are required, then
there may be a sub-atmospheric flash required.
The compression of CO2 to super-critical pressure is then accomplished in 5 stages, without the need for
H2O removal (dehydration). The power parasitic losses occur due to the need for steam to cause the CO
Shift reaction, and due to the power needed to compress the CO2 to super-critical pressure.

Pre-Combustion Carbon Capture
Basis: 90% CO2 Capture
• State of the art: Selexol ™ Vs. Rectisol®
• Conventional wisdom states that:
– Selexol ™ Smaller piece count = smaller CAPEX
– Selexol™ Warmer solvent temp (0o F) Vs. Rectisol®(-70o F) = smaller OPEX for Selexol™
12
Slide 12 compares the DEPG process versus the Rectisol process following Coal gasification, in which the
H2S is completely removed following the CO- Shift reaction and the CO2 is required to be captured and
compressed from the synthesis gas by at least 90%.
• Conventional wisdom states that:
– Selexol ™ Smaller piece count = smaller CAPEX
– Selexol™ Warmer solvent temp (0o F) Vs. Rectisol®(-70o F) = smaller OPEX for Selexol™
There are exceptions to conventional wisdom which will be discussed.

13
Physical Solvent Solubility Data
4.29
London Management, Inc.
4.90
4.282.983.31COS:CO2
4.119.0510.03H2S:CO2
Selectivity
0.29
NMP
Propylene
Carbonate
PC
N-Methyl-2-Pyrrolidone
Dimethyl Ethers of
Polyethylene GlycolDEPG
Solubility Data (Nm3 Gas/m3 Liquid )
64.9014.5130.9437.00H2S
56.7615.1010.1912.20COS
0.730.250.23CH4
0.140.080.070.06CO
0.070.030.020.02H2
13.243.533.423.69CO2
-25o C25o C25o C25o CTemp
(Generic)(Fluor Solv)(Purisol)(Selexol)Component
MethanolPCNMPDEPG
Slide 13 shows various commercial solvents capacity to absorb the H2S and the CO2 through physical
absorption. Physical absorption requires that the partial pressure of the individual gas component to be
high enough to cause the acid gas component to be absorbed by the solvent. This table was generated
by running the ProMax simulation package (from Brian Research and Engineering) at the various
conditions of a gas/liquid mixture in a flash operation. The acid gas component absorption rate is
dependent on the partial pressure of the component in the gas phase and also the temperature of the
mixture. The higher the partial pressure of the acid gas component, the higher is the capacity of the
solvent to absorb more of the acid gas component. The lower the mixture temperature, the larger is the
capacity of the solvent to absorb more of the acid gas component. In summary, high pressure and low
temperature are helpful in minimizing solvent flow rate and equipment size.
In reviewing the selectivity below the table, we can see that DEPG and Purisol are the best solvents for
the selective removal of H2S in the presence of CO2. The Purisol solvent has a disadvantage in that it is
more volatile than DEPG, requiring additional processing steps to limit solvent loss to the synthesis gas

stream being processed. The DEPG solvent is about twice as effective as methanol for the selective
removal of H2S in the presence of CO2. The solvent of choice for the selective removal of H2S is DEPG
Next, look at the capacity of each of the solvents to absorb the CO2. Here methanol is the most
effective solvent for CO2 absorption, with over 3 times the effectiveness compared to DEPG.
Auto refrigeration is experienced by all physical solvents when the acid gas is released at lower pressure.
The lower solvent rate will result in a higher temperature drop during flash regeneration, which will
increase the capacity of the solvent to absorb the CO2 in a smaller liquid solvent volume. This is great
news, as the smaller circulation rate reduces equipment size and cost.
In the case of using the DEPG solvent, the auto refrigeration effect must be limited due to DEPG’s
increase in viscosity as the temperature drops. At about 30⁰ F, DEPG is at the lowest practical
temperature. Lower temperature will increase viscosity, reduce the heat transfer coefficient in heat
exchangers and also result in decreased absorption performance on the tower packing.
Methanol has no such auto refrigeration limitation, allowing the temperature to drop to the range of -
60⁰ F to -75⁰ F after flash regeneration. This minimizes the solvent flow rate and the volume of the
synthesis gas stream, due to lower operating temperature, which in turn also results in smaller
equipment sizes.
Since the auto refrigeration effect is limited for the DEPG solvent, make-up refrigeration is needed by
external refrigeration, using power taken from the power sales.
These observations result in the following conclusions:

Observations
• DEPG is the favored solvent for H2S selective removal
• The DEPG and Claus plant are less expensive when H2S is removed upstream from CO-Shift
• CO2 is more effectively removed downstream from the CO-Shift using MeOH in absence of H2S
• Both DEPG and MeOH will co-absorb CO and other components to contaminate CO2 stream
14
DEPG is the favored solvent for H2S selective removal
• The DEPG and Claus plant are less expensive when H2S is removed upstream from CO-Shift
• CO2 is more effectively removed downstream from the CO-Shift using MeOH, in the absence of
H2S
A separate observation not mentioned before, is the undesirable co-absorption of CO in all solvents --
including both DEPG and methanol. All components absorbed in the solvent along with the CO2 are
released during the flash regeneration step.

15
A BETTER WAY

FUELGASIFICATION
HT HEATRECOVERY
SOLIDS FILTER +WASH
LT HEATRECOVERY
H2S REMOVAL
POWERISLAND
CLAUS SULFUR
HYDROLYSIS+
COMPRESSION
ASU
AIR
O2
N2
RFLASH
FLASH
1st
Stage2nd Stage
CO2
CO2
R
STEAM
COSHIFT
CO2
CONDEN-SATION
IGCC WITHNEW PROCESS
CARBON CAPTURE
POWERSALES
CO2
CO
2
AB
SO
RB
ER
CO
2
PU
RIF
IER
16
Slide 16: IGCC followed by selective removal of H2S, via conventional DEPG (or other conventional
process), followed by CO –Shift reaction and then the new CO2 pre-combustion CC Process.
This scheme is designed to be added to an IGCC process in which the project is CC ready.
Once it is required that the IGCC project be converted to CC compliant, the new process is implemented.
Then the first step of the new process condenses as much of the CO2 as can be achieved by the partial
pressure of the CO2 in the pre-dried synthesis gas stream. Lowest temperature for condensation is
limited to a few degrees above solidification of CO2 about -69⁰ F. Uncondensed CO2 is then removed by
a methanol absorption process. The solvent is warmed and flashed to allow for the CO2 to be released
at around 300 psig, and then the two stages of compression allow the CO2 to condense against cooling
water. The two liquid CO2 streams are then combined together and purified in the purification
distillation column.
Pure CO2 is removed from the column bottoms and pumped to the super-critical pressure needed for
transmission in the CO2 pipeline.

Pre-Combustion CCParasitic loss breakdown
0.00%
5.00%
10.00%
15.00%
20.00%
25.00%
30.00%
IGCC IGCC + 2Stg DEPG New Process
Refrig + CO2 Compression
Auxiliaries +Steam
17
Slide 17 shows the comparison of the new pre-combustion process against the conventional state-of-
the-art process.
Power consumption in the new process is about 50% less than the conventional state-of-the-art process.
Other methods can be used to minimize the additional steam needed for the CO-Shift reaction. That is a
whole separate topic for another presentation.
Comparative Summary
0.00%
5.00%
10.00%
15.00%
20.00%
25.00%
30.00%
35.00%
40.00%
45.00%
PC Super-Crit Boiler Econamine FG MHI KM CDR Alstom CAP IGCC IGCC + 2Stg DEPG New Process
39.1 39.3
27.230.1 28.2
31.733.6
Post-Combustion Carbon Capture Pre-Combustion Carbon Capture
Eff
icie
nc
y %
18
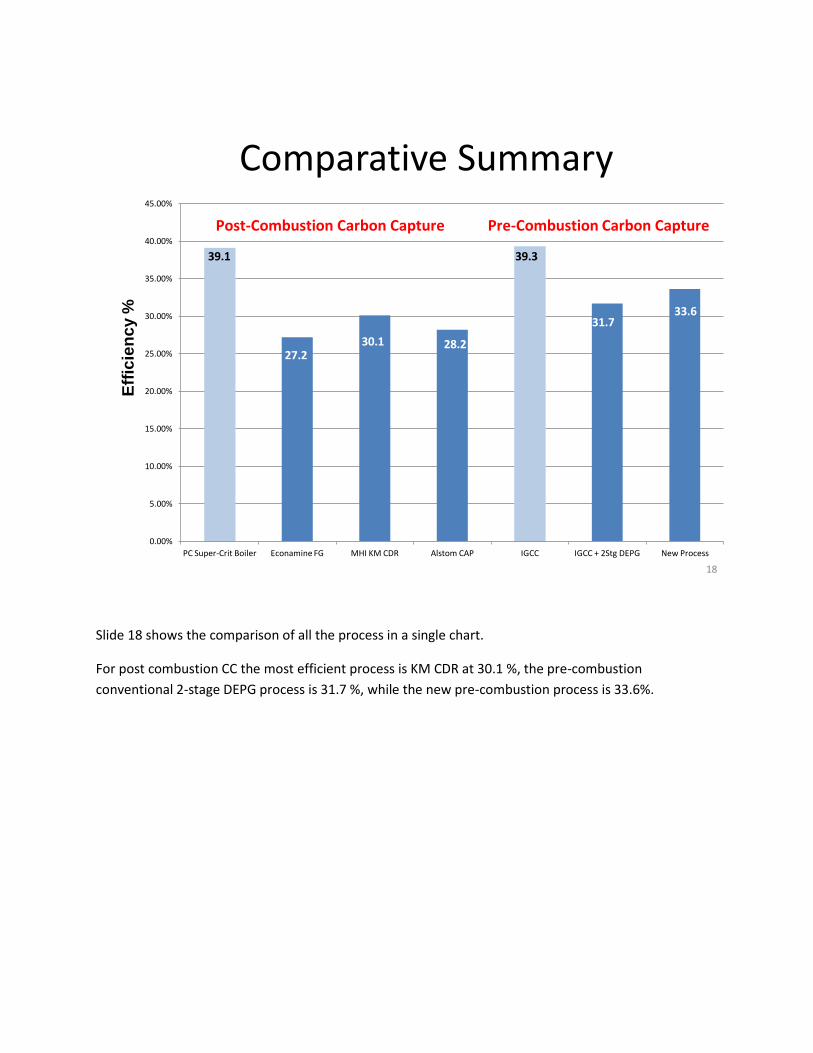
Slide 18 shows the comparison of all the process in a single chart.
For post combustion CC the most efficient process is KM CDR at 30.1 %, the pre-combustion
conventional 2-stage DEPG process is 31.7 %, while the new pre-combustion process is 33.6%.