technical and economic assessment of producing hydrogen … · technical and economic assessment of...
TRANSCRIPT

August 1995 NREL/TP-431-8143
Technical and Economic Assessment of Producing Hydrogen by Reforming Syngas from the Battelle Indirectly Heated Biomass Gasifier
Margaret K. Mann
National Renewable Energy Laboratory 1617 Cole Boulevard Golden, Colorado 80401-3393 A national laboratory of the U.S. Department of Energy Managed by Midwest Research Institute for the U.S. Department of Energy under contract No. DE-AC36-83CH10093

NREL/TP-431-8143 UC Category: 1630 DE95009275
Technical and Economic Assessment of Producing Hydrogen by Reforming Syngas from the Battelle Indirectly Heated Biomass Gasifier
Margaret K. Mann Industrial Technologies Division National Renewable Energy Laboratory Hydrogen Program Milestone Completion Report Program Manager: Catherine Gregoire Padró
National Renewable Energy Laboratory 1617 Cole Boulevard Golden, Colorado 80401-3393 A national laboratory of the U.S. Department of Energy Managed by Midwest Research Institute for the U.S. Department of Energy under contract No. DE-AC36-83CH10093
August 1995
NOTICE
This report was prepared as an account of work sponsored by an agency of the United States government. Neither the United States government nor any agency thereof, nor any of their employees, makes any warranty, express or implied, or assumes any legal liability or responsibility for the accuracy, completeness, or usefulness of any information, apparatus, product, or process disclosed, or represents that its use would not infringe privately owned rights. Reference herein to any specific commercial product, process, or service by trade name, trademark, manufacturer, or otherwise does not necessarily constitute or imply its endorsement, recommendation, or favoring by the United States government or any agency thereof. The views and opinions of authors expressed herein do not necessarily state or reflect those of the United States government or any agency thereof.
Available to DOE and DOE contractors from:
Office of Scientific and Technical Information (OSTI) P.O. Box 62 Oak Ridge, TN 37831 Prices available by calling 423-576-8401
Available to the public from:
National Technical Information Service (NTIS) U.S. Department of Commerce 5285 Port Royal Road Springfield, VA 22161 703-605-6000 or 800-553-6847 or DOE Information Bridge http://www.doe.gov/bridge/home.html
Printed on paper containing at least 50% wastepaper, including 10% postconsumer waste

Executive Summary
The technical and economic feasibility of producing hydrogen from biomass by means of indirectly heated gasification and steam reforming was studied. A detailed process model was developed in ASPEN Plusm to perform material and energy balances. The results of this simulation were used to size and cost major pieces of equipment from which the determination of the necessary selling price of hydrogen was made. A sensitivity analysis was conducted on the process to study hydrogen price as a function of biomass feedstock cost and hydrogen production efficiency.
The gasification system used for this study was the Battelle Columbus Laboratory (8CL) indirectly heated gasifier. The heat necessary for the endothermic gasification reactions is supplied by circulating sand from a char combustor to the gasification vessel. Hydrogen production was accomplished by steam reforming the product synthesis gas (syngas) in a process based on that used for natural gas reforming. Thee process configurations were studied. Scheme 1 is the full reforming process, with a primary reformer similar to a process furnace, followed by a high temperature shift reactor and a low temperature shift reactor. Scheme 2 uses only the primary reformer, and Scheme 3 uses the primary reformer and the high temperature shift reactor. A pressure swing adsorption (PSA) system is used in all three schemes to produce a hydrogen product pure enough to be used in fuel cells. Steam is produced through detailed heat integration and is intended to be sold as a by-product.
Three plant sizes, 27 T/day (30 t/day), 272 T/day (300 t/day), and 907 T/day (1000 t/day) were studied. In Scheme I , the small plant produces approximately 21,594 standard m3/day (762,580 scfd) hydrogen, which approximates the fuel requirement of 500 vehicles per day with a fuel economy corresponding to 60 miles per gallon of gasoline (Ogden, 1995). The medium-size plant was chosen for study because it is ten times larger. The large plant corresponds to a plant using half the maximum amount of biomass that has historically been considered to be economically and logistically feasible from a dedicated feedstock supply system (DFSS). The two smaller plants would most likely be able to use waste biomass at a cheaper price than that from a DFSS. When examples of costs ~ IZ given in this report, biomass is assumed to cost $46.30/T and $15/T from DFSS and waste sources, respectively. The cost of biomass from either waste sources or a DFSS will vary depending on the location and crop type, as well as market influences once biomass energy systems are developed. The Department of Energy goal for biomass from a DFSS is $37.50/T ($34/t = $2/MMBtu) to $46.30/T. ($42/t = $2SO/MMBtu).
The steam reforming process studied is very similar to that used to reform natural gas. All necessary unit operations are commercially available, and should require no special engineering design. The estimated capital costs of the entire gasification and reforming plant for the most profitable scenario studied (Scheme 1) are $6.1 W o n for the 27 T per day (30 t h y ) plant, $34.5 million for the 272 T/day (300 t/day) plant, and $90.4 million for the 907 Tiday (1000 tlday) plant.
The economics of producing hydrogen from this process are moderately favorable for many of the scenarios tested. The most economically feasible design is that tested in Scheme 1. The necessary selling prke for hydrogen produd by steam reforming BCL biomass syngas falls within the current market d u e s ($5 - $1 YGJ) for many of the cost scenarios studied. However, the results are mostly on the high end of this range for reasonable biomass feedstock costs. Of the three plant sizes studied, the most economic configuration depends upon the availability of waste biomass at a lower price than biomass from a DFSS. If waste biomass can be obtained for the medium size plant, this scale with a Scheme 1 design yields the lowest hydrogen price. If the medium size plant must use biomass from a DFSS, the large plant with a Scheme 1 design is the most economic.

Results show that the small scale plant using any of the process schemes studied does not produce hydrogen cheaper than the medium size plant. However, if the smaIl plant is the only size for which cheaper waste biomass can be obtained, local refueling stations, similar to existing gasoline stations, might be feasible.
The hydrogen production cost from the large plant obtaining biomass from a DFSS at $46.30/T ($42/t), is $6.50/GJ ($6.90/MMBtu) without taxes. With a 37% tax rate and a 15% after-tax internal rate of return @iR), the necessary hydrogen selling price is $13.70/GJ ($14.30/MMBtu). The hydrogen production cost for the 272 T/&y plant is $4.10/GJ using biomass waste at $16.50/T ($15/t). The corresponding hydrogen selling price is $13.10/GJ ($13.80/MMBtu). If the feedstock for the medium size plant must be obtained from a DFSS, the production cost and necessary selling price increases to $7.20/GJ ($7.60/MMBtu) and $16.20/GJ ($17.1/MM€3tu), respectively. Hydrogen produced in the small plant using waste biomass will cost $7.20/GJ ($7.6O/MMBtu), and sell for $23.20/GJ ($24SO/MMBtu). A lower specified IRR would decrease the required selling price in each case and the estimates of what biomass from waste and DFSS sources will cost are likely to vary from the examples given here. Hydrogen produced in process Schemes 2 and 3 is more expensive than that produced in Scheme 1 because of the decrease in production.
The discount rate for which the net present value of the project equals zero was calculated for each scenario studied. This rate is set such that the cumulative net earnings from the project exactly balance the initial investment in the process. Using Scheme 1, the discount rate for the large plant using biomass from a DFSS is 9.2%. The rate for the medium plant using biomass from a DFSS is 6.7%; using biomass waste, this rate increases to 10.4%. The rate for the small plant, even with the cheaper biomass waste feedstock, is 4.0%.
The break-even points for the large, medium, and small plants are 13.3 years, 6.3 years, and 7.2 years, respectively. These caIculations were made using DFSS biomass for the large plant and waste biomass for the medium and small plants. If the medium plant must use biomass from a DFSS, the break-even point is extended to 9.5 years.
.. ll

Table of Contents
Abbreviations and Acronyms .............................................................. 1
Metric Units of Measurement .............................................................. 1
1.0 Introduction ......................................................................... 2
2.0 Process Description ............................................................. . . . . . 2 2.1 Gasification Using the BCL Indirectly Heated Gasifier ................................ 3 2.2 Steam Reforming to Produce Hydrogen . . . . . . . . . . . . . . . . . . . . . . . . . . . . . . . . . . . . . . . . . . . . 5 2.3 Steam Generation .............................................................. 8
3 . 0 Conversion Efficiency .................................................................. 8 3.1 Stoichiornetric Maximum Efficiency Calculation ..................................... 8
4.0 Economic Analysis .................................................................. 10 4.1 Economic Assumptions ........................................................ 11 4.2 By-Product Credit: Steam ...................................................... 11 4.3 Equipment Sizing and Costing . . . . . . . . . . . . . . . . . . . . . . . . . . . . . . . . . . . . . . . . . . . . . . . . . . 12
4.3.1 Gasification Costs .................................................... 12 4.3.2 Reactor Costs ....................................................... 12 4.3.3 Compressor Costs . . . . . . . . . . . . . . . . . . . . . . . . . . . . . . . . . . . . . . . . . . . . . . . . . . . . 13 4.3.4 Heat Exchanger Costs ................................................. 13 4.3.5 Pump Costs ......................................................... 13 4.3.6 PSA Cost ........................................................... 13
4.4 Economic Analysis Results ..................................................... 13 . 4.3.7 Operating Costs ...................................................... 13
5.0 Conclusions ........................................................................ 26
6.0 Future Work ......................................................................... 24
References and Pertinent Literature ......................................................... 28

List of Tables
Table 1: Elemental Analysis of Biomass and Char .............................................. 3 Table 2: Syngas Composition After Cleanup .................................................. 5 Table 3: Summary of Unit Operations Used in Different Process Configurations ..................... 7 Table 4: Hydrogen Produced in Each Scenario Analyzed (standard m3/day) .......................... 8 Table 5: Process Conversion Efficiencies .................................................... 10 Table 6: Economic Assumptions ........................................................... 1.1 Table 7: By-product Steam Generated ...................................................... 12 Table 8: Capital (MM$) and Operating Costs (MM$/year) ...................................... 14 Table 9: Necessary Hydrogen Selling Price for a 15% after-tax IRR After Taxes .................... 21 Table 10: Discount Rate Obtained from Return on Investment Analysis ........................... 22
List of Figures
Figure 1: The BattelIe Indirectly Heated Gasification System ..................................... 4 Figure 2: Reforming Process ................................................................ 6 Figure 3: ASPEN PlusTM Process Flow Diagram ................................................ 9 Figure 4: Production Cost of Hydrogen. Scheme 1. Pre-tax ...................................... 15
Figure 6: Production Cost of Hydrogen. Scheme 2. he-tax ...................................... 17
Figure 8: Production Cost of Hydrogen. Scheme 3. Pre-tax ...................................... 19
Figure 10: Cumulative Cash Flow for a 27 T/day Facility ....................................... 23 Figure 1 1 : Cumulative Cash Flow for a 272 Tiday Facility ...................................... 24
Figure 5: SeUing Price of Hydrogen. Scheme 1. After.tax. 15% IRR .............................. 16
Figure 7: Selling Price of Hydrogen. Scheme 2. Afier.tax. 15% IRR .............................. 18
Figure 9: Selling Price of Hydrogen. Scheme 3. After.=. 15% IRR .............................. 20
Figure 12: Cumulative Cash Flow for a 907 T/day Facility ...................................... 25
i V

Abbreviations and Acronyms
BCL - Battelle Columbus Laboratories CO - Carbon monoxide CO, - Carbon dioxide DCFROR - Discounted Cash Flow Rate of Return DFSS - Dedicated Feedstock Supply System GJ - Gigajoule H, - Hydrogen IRR - Internal Rate of Return
MMBtu - Million British Thermal Units PSA - Pressure Swing Adsorption ROI - Return on Investment SCFD - Standard Cubic Feet per Day t - ton T- Metric tonne
kPa - Kilopascal
Metric Units of Measurement
In accord with recommendations from the Department of Energy, all results from t h i s study are reported in metric units. Occasionally, the English system equivalent is stated in parenthesis. Below are the metric units used in this report with the corresponding conversions to English units.
Mass:
Volume: Pressure: Energy: Temperature:
kilogram (kg) = 2.20462 pounds metric tonne (T) = 1.1023 1 ton cubic meter (m3) = 264.17 gallons kilopascals @Pa) = 0.145 pounds per square inch gigajoule (GJ) = 0.9488 MhilBtu "C = (OF - 32)/1.8 .
1

1 .O Introduction
The technical and economic feasibility of producing hydrogen by refonning syngas from the Battelle Columbus Laboratory (BCL) indirectly heated gasifier was studied. From experimental work conducted at BCL on the gasifier and commercial information on the reforming operation, a process plant was designed using the ASPEN Plusm sirnulation software. The material and energy balances obtained were used to size and cost major pieces of equipment, from which a capital cost estimation was made. Using discounted cash flow rate of return (DCFROR) and return on investment (ROI) analyses, the economic position of this biomass-derived process relative to conventional hydrogen production processes was assessed.
Hydrogen has the potential to deliver si,bnificant economic and environmental benefits. Hydrogen is a very clean burning fuel; in internal Combustion engines, water and a very small amount of NO, are the only products. When used in a he1 cell to produce electricity, water is the sole product. Hydrogen can be used to produce energy in every application that fossil fuels are currently used. By 2025, the percentage of energy from oil imports could be reduced from the current 50-60% to less than 25%, if hydrogen energy were only to contribute 10% to the overall energy use.
On a life-cycle basis, the emissions associated with hydrogen depend primarily upon the production route used. Renewable resources, such as solar, wind, and biomass are excellent feedstocks for hydrogen because of their inherently clean nature and sustainability.
This study assesses the technical design arid economic feasibility of producing hydrogen from gasification, one of the possible biomass-based routes to hydrogen. Biomass is considered to be anything that has participated in the growing cycle recently. Agriculture waste, forest residue, urban wood waste, and trees and gasses grown as energy crops, are commonly the process feedstocks referred to as biomass. Because biomass consumes as much CO, in its growing cycle as is produced when it is transfonned to energy, the net CO, contribution from biomass-derived fuels to the atmosphere is much less than from fossil-derived fuels. Furthermore, producing biomass on a sustainable basis by growing energy crops supports the U.S. agriculture sector and potentially reduces our oil and gas imports.
The gasification system used for this study was the BCL indirectly heated gasifier. The heat necessary for the endothermic gasification reactions is supplied by circulating sand from a char combustor to tbe gasification vessel. The syngas, containing pfimarily CO, H,, CH,, Cq , and some higher hydrocarbons, is then steam reformed to produce H, and CQ in a process based on that used for natural gas refonning. ThqH can be purified and sold as an energy carrier to be used in vehicles, power plants, or refinery applications.
2.0 Process Description
Biomass, obtained either from a DFSS, or as agricultural, urban, or industrial waste, is fed to a rotary dryer to reduce the moisture content from approximately 50% to 1 1%. The biomass is then gasified in the BCL gasifier which is heated indirectly by sand circulating between a char combustor and the gasification vessel. The product syngas is cooled and compressed to the appropriate conditions for reforming. A reactor known as the primary reformer converts the methane and higher hydrocarbons to CO and performs a significant portion of the water-gas shift reaction to convert CO and water to H2 and CO,. The remaining CO is consumed via this reaction in the subsequent high temperature and low temperature shift reactors. A pressure swing adsorption (PSA) system is used to separate hydrogen pure enough for use in fuel cell applications from the shift reactors product gas.
2

2.1 Gasification Using the BCL Indirectly Heated Gasifier
Carbon .
Oxygen
Hydrogen
Nitrogen
Sulfur
Chlorine
A schematic of the BCL gasifier is shown in Figure 1. This system was simulated using run data from Battelle Columbus Laboratory. A Fortran subroutine controls the simulation of the gasifier and is shown along with the entire run input file in Appendix A. Biomass and char were simulated as non-conventional components; their ultimate analyses are shown in Table 1. The biomass composition used for this study is typical of woody biomass such as hybrid poplar.
Ultimate Analysis (Weight percent, dry basis)
Biomass Char
50.88 65.2
4 1.90 3.03
6.04 3.70
0.17 2.47
0.09 28.65
0 0
Ash 0.92
Biomass of approximately 50 wt% moisture is dried in a rotary drier using a combination of char combustor flue gas and air. The dried biomass, containing 11 wt% moisture, is fed to the fluidized bed gasifier, with hot sand from the char combustor as the bed material. It operates at nearly atmospheric pressure and 825°C (15 17°F). Steam rather than air or oxygen is added to the gasifier to produce a syngas of medium quality: 18.35 MJ/m3 (493 Btdscf). After a cyclone separator removes the char, the syngas is expected to be cleaned using the hot-gas clean-up processes currently being developed by the Department of Energy (DOE) and Westinghouse; the current technology uses a water scrubber. Hot-gas clean-up would consist of ceramic candle filters to remove particulates from the syngas prior to downstream operations such as reforming. The resultant syngas composition is shown in Table 2.
3.04
3


Component
I co I 43.17% I Volume%
I H2 - L . 2 2 %
I 15.83%
I co2 I 13.46%
I 4.62%
I 0.47%
I tar I 0.40% I I 0.37%
1 0.37% I 1 0.08% I
After clean-up, the syngas is cooled to 91°C (195°F) so that it can be compressed to the pressure required for the PSA system plus the expected pressure losses in the reactors. During this cooling, the water and higher hydrocarbons (tars) remaining in the syngas will most likely condense and must be removed and pumped before being added again to the compressed syngas. The syngas compressor outlet pressure is 3,654 kPa (530 psi).
2.2 Steam Reforming to Produce Hydrogen
The reforming process, shown in Figure 2, is similar to that used in hydrogen production from natural gas. The major unit operations are a primary reformer to convert methane and the higher hydrocarbons present in the syngas to hydrogen, plus shift reactors to convert CO to hydrogen. The reactions governing the reforming process are shown in the following equations:
(1) C,H, + nH,O + heat => nCO + ( d 2 + n)H,
(2) CO + H 2 0 => CO, + H, + heat
The primary reformer, a reactor similar to a process furnace with catalyst-filled tubes, converts the methane and higher hydrocarbons to CO and H2 (Reaction l), and performs a significant portion of the water-gas shift reaction to convert CO and water to H, and CO, (Reaction 2). The remaining CO is consumed via this reaction in the subsequent high temperature and low temperature shift reactors. A pressure swing adsorption (PSA) system is used to purify the hydrogen.
Reaction (1) typically takes place at temperatures between 800°C and 850°C (1472°F and 1561 O F ) in the primary reformer. The heat necessary for this endothermic reaction is supplied by combusting the PSA offgas outside of the reactor tubes through which the reactants and products are flowing. These tubes are filled with a commercial nickel-based catalyst. According to results from operating plants, the primary reformer was
5

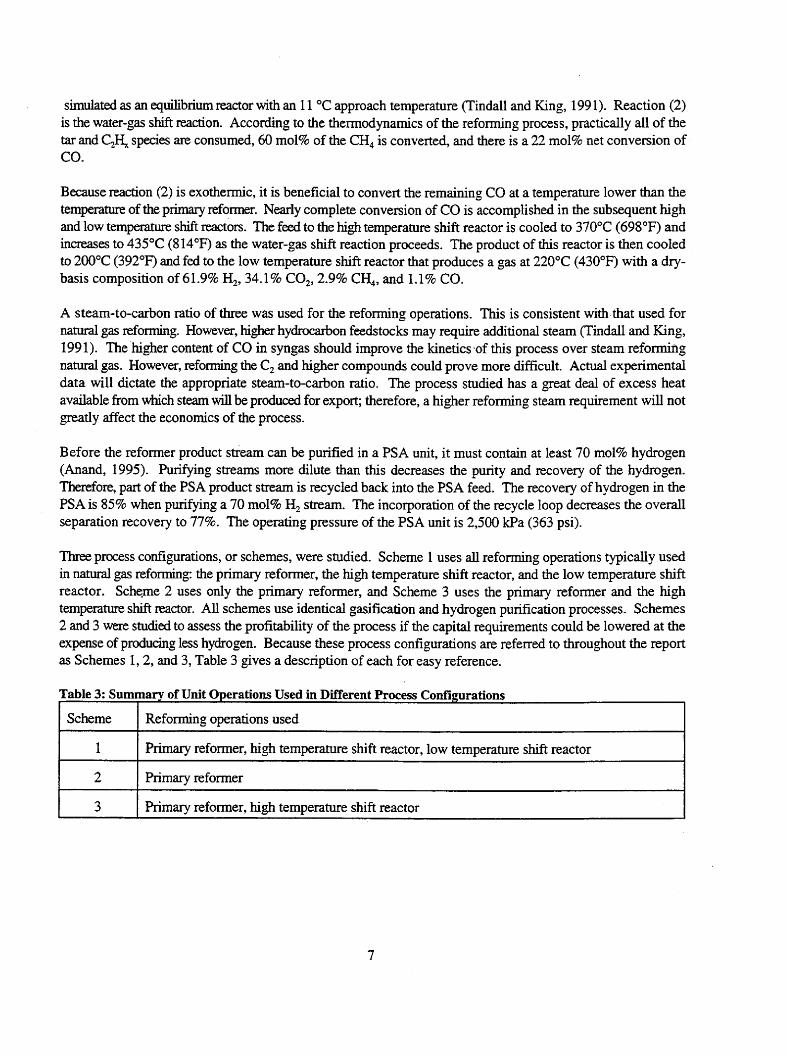
simulated as an equilibrium reactor with an 1 1 "C approach temperature (Tindall and King, 199 1). Reaction (2) is the water-gas shift reaction. According to the thermodynamics of the refonning process, practically all of the tar and C.& species are consumed, 60 mol% of the CH, is converted, and there is a 22 mol% net conversion of co.
Scheme Refonning operations used
Because reaction (2) is exothermic, it is beneficial to convert, the remaining CO at a temperature lower than the temperature of the primary reformer. Nearly complete conversion of CO is accomplished in the subsequent high and low temperature shife reactors. The feed to the high temperature shift reactor is cooled to 370°C (698°F) and inCreaSes to 435°C (814°F) as the water-gas shift reaction proceeds. The product of this reactor is then cooled to 200°C (392°F) and fed to the low temperature shift reactor that produces a gas at 220°C (430°F) with a dry- basis composition of 61 -9% H,, 34.1 % CO,, 2.9% CH,, and 1.1 % CO.
3
A steam-to-carbon ratio of three was used for the reforming operations. This is consistent with,that used for natural gas reforming. However, higher hydrocarbon feedstocks may require additional steam (Tindall and King, 1991). The higher content of CO in syngas should improve the kinetics.of this process over steam reforming natural gas. However, refomhg the C, and higher compounds could prove more difficult. Actual experimental data will dictate the appropriate steam-to-carbon ratio. The process studied has a great deal of excess heat available from which steam will be praduced for export; therefore, a higher reforming steam requirement will not greatly affect the economics of the process.
Primary reformer, high temperature shift reactor
Before the reformer product stream can be purified in a PSA unit, it must contain at least 70 mol% hydrogen (hand, 1995). Purifying streams more dilute than t h i s decreases the purity and recovery of the hydrogen. Therefore, part of the PSA product stream is recycled back into the PSA feed. The recovery of hydrogen in the PSA is 85% when purifying a 70 moI% H, stream. The incorporation of the recycle loop decreases the overall separation recovery to 77%. The operating pressure of the PSA unit is 2,500 Wa (363 psi).
Three process configurations, or schemes, were studied. Scheme 1 uses all reforming operations typically used in natural gas reforming: the primary reformer, the high temperature shift reactor, and the low temperature shift reactor. Scheme 2 uses only the primary reformer, and Scheme 3 uses the primary reformer and the high temperature shift reactor. All schemes use identical gasification and hydrogen purification processes. Schemes 2 and 3 were studied to assess the profitability of the process if the capital requirements could be lowered at the expense of producing less hydrogen. Because these process configurations are referred to throughout the report as Schemes 1,2, and 3, Table 3 gives a description of each for easy reference.
I 1 I Primary reformer, high temperature shift reactor, low temperature shift reactor I
7

2.3 Steam Generation
Scheme 1 Scheme 2 Scheme 3
In the simulation, gasification and reforming were inteegated such that heat available from the reforming operation could generate the steam necessary for gasification as well as a substantial amount of export steam. The process gas was cooled as it moved between the primary reformer, the shift reactors, and the PSA unit, generating steam in each step. Steam was also generated by cooling the primary reformer flue- gas. The majority of the steam produced was superheated at 690 P a (100 psig); the steam produced by cooling the process gas between the high and low temperature shift reactors was at 3,450 kPa (500 psig).
27 T/day biomass 21,600
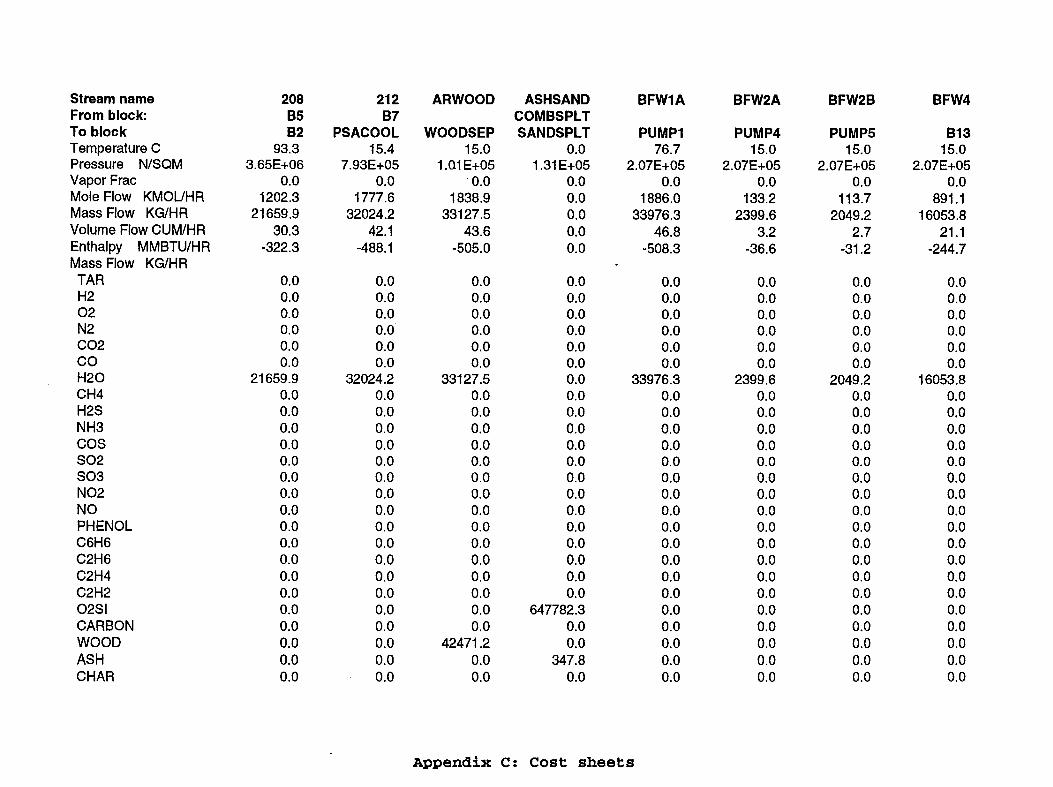
A complete process flow dia,oram corresponding to the simulation is shown in Fiewe 3. Appendix C contains stream data for the 907 T/day plant.
16,850 20,440
3.0 Conversion Efficiency
907 T/day biomass
Two methods were used to estimate the efficiency of producing hydrogen from biomass by this process. The first method looks at the ratio of the amount of hydrogen that was produced to the stoichiometric maximum amount of hydrogen possible according to reactions (1) and (2). The second method calculates the ratio of the energy value of the product hydrogen and export steam to the energy value of the biomass feed plus purchased electricity. The amount of hydrogen produced for each plant size and scheme is shown in Table 4.
719,800 561,650 68 1,280
I 272 T/day biomass 1 215,940 1 168,500 I 204,390 I
3.1 Stoichiometric Maximum Efficiency Calculation
The "molecular formula" of biomass can be approximated as CH,-,,0,-6, on a dry basis. Completely steam reforming this biomass yields 2.07 moles of hydrogen per "mole" of biomass as shown by the following stoichiometry :
CH,&,, + 1.33H20 => CO, + 2.07H2
This hydrogen yield is equivalent to 2.02 standard m3 hydrogenkg biomass (32.38 scfAb). In Scheme 1, with all refonning operations used, 0.79 standard m3kg (12.71 scfAb) hydrogen is produced. This corresponds to a 39.3% conversion and recovery efficiency.
8


3.2 Energy Conversion Efficiency Calculation
I Stoichiometric Efficiency
The efficiency of this process on an energy in, energy out basis can be calculated by the following formula:
Energy Conversion Efficiency
where: H, = hydrogen recovered (kg) HHV,, = higher heating value of hydrogen (GYkg) AHs,, = difference in enthalpy between incoming water and s tem produced (GJ) stm,, = steam produced to be sold (kg) B, = biomass fed to process (kg) HHV, = higher heating value of biomass (19.75 M J k g = 8,500 Btu/lb) e = electricity imported for process requirements (GJ equivalent)
Scheme 1
Scheme 2
Scheme 3
The efficiencies calculated for the three schemes are shown in Table 5.
39.3% 79.0%
30.6% 69.7%
37.2% 76.5%
Table 5: Process Conversion EEHciencies I I I i
4.0 Economic Analysis
The current market value of hydrogen is between $5 and $15/GJ. By calculating the economics of the process being studied and comparing the results to this current hydrogen market, the potential profitability can be assessed. Possible sources of error in this analysis are in equipment cost estimation, feedstock and product market predictions, and invalid economic assumptions. The total error can be reduced by looking at ranges of profitability, such as the range of hydrogen se€ling price versus a range of biomass feedstock costs. As more information on the development of biomass-based technologies becomes available, this analysis can be modified to give a more representative process cost.
The economic feasibility of producing hydrogen by steam reforming syngas from the BCL gasifier was studied using the DCFROR method. This method calculates the LRR that will be earned on the initial capital investment over the life of the project. Given this rate and a feedstock cost, the necessary selling price of the product can be Calculated. Often, the IRR is specified as the minimum acceptable rate for an investor to finance a project. Therefore, the perceived risk of the project can be incorporated into the IRR. Because the process of producing hydrogen from biomass currently carries higher risks than conventional hydrogen-generating processes, the TRR specified in this study was 15% after tax, while the rate for conventional processes is between 9% and 12%. For a 37% tax rate, a 15% after-tax IRR corresponds to a pre-tax R.R of 20.3%.
. 10

As an alternative means of measuring the economic feasibility of this process, an ROI analysis was also performed. The ROI is the sum of the net present value of each project year's revenue, divided by the initial capital investment. The discount rate used to bring all revenues and costs to the value of what money is worth today (or at any defined time) is set so that the ROI equals zero. This practice is also known as setting the net present value equal to zero.
4.1 Economic Assumptions
The economic analysis for this study was based on current dollars and performed using equity financing, assuming that the capital will not be borrowed. The latter assumption is probably valid for the smaller-scale plants, less so for the large plant. The majority of the assumptions used in performing the economic analysis are shown in Table 6, Other assumptions, such as the percentage of the purchased equipment cost spent on piping,
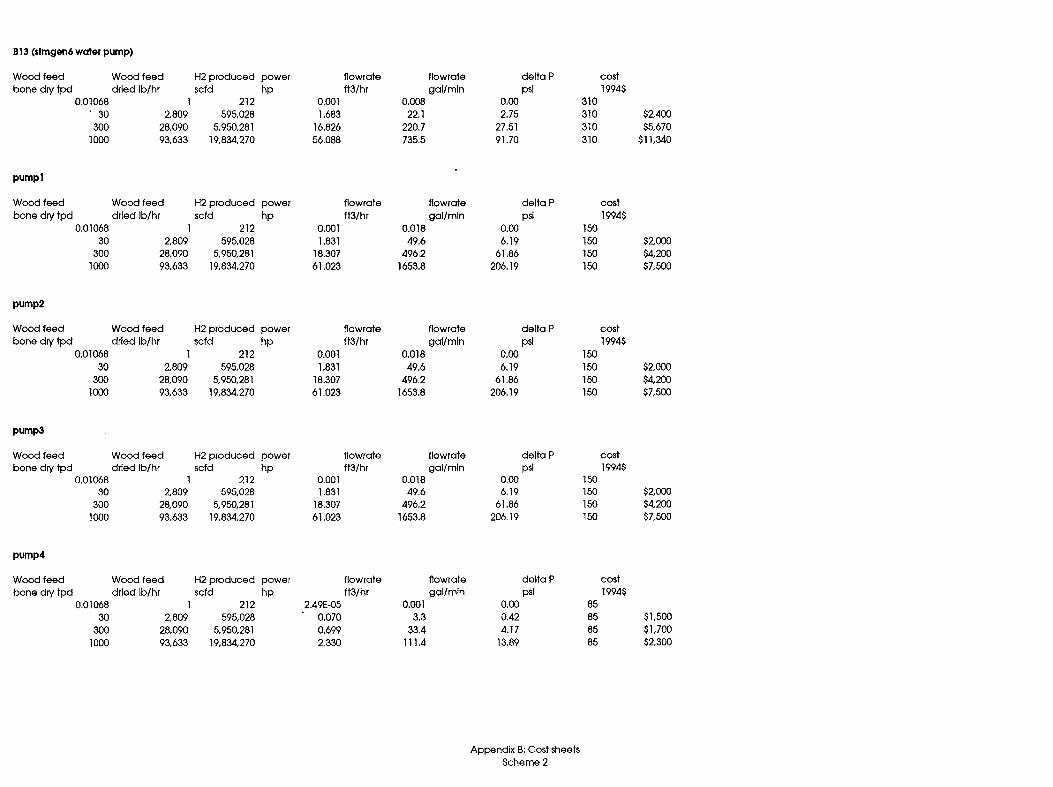
. can be found in the cost sheets in Appendix B.
Table 6: Economic Assumptions
January, 1995 dollars
Equity financing
20 year plant life I
Two year construction period
90% on-line factor
Royalties = 0.5% of sales
Inflation rate = 5%
Tax rate = 37%
Straight-line depreciation for ten years; first and last year at 50% of other years
50% plant capacity first year of production
I 30% of capital investment spent first year, 70% second year I
4.2 By-Product Credit: Steam
A by-product credit was taken for the steam generated in the process. A selling price of $7.88/1000 kg ($3.57/1000 Ib) was assumed for 3,450 kPa (500 psig) steam. A price of $5.18/1000 kg ($2.35/1000 lb) was assumed for 690 kPa (100 psig) steam (Peters and Timmerhaus, 1980). All steam produced contains 17 "C superheat. The amount of steam produced is shown in Table 7. The amount of steam generated for Schemes 2 and 3 is not expected to be significantly different from that generated in Scheme 1 because the same or higher amount of heat will be available. The assumption that the steam will be able to be sold is probably vdid for the medium and large plants as they will most likely be located in more industrialized centers to take advantage of other infrastructure. However, it may be difficult to sell the steam produced by the small plant, as this size represents small refueling stations located near the demand for hydrogen.
11

Source of Heat (stream name in Figure 3)
Cooling gas between high and low temperature shift (FROMHT)
Amount Produced, Pressure, kPa kg steam / kg dry biomass (Psi$)
0.32 3,450 (500)
4.3 Equipment Sizing and Costing
Compression of syngas (TOCOMPR)
Compression of air fed to offgas combustor (OFFAIR1)
Cooling offgas combustor flue gas (OFFFLUE)
Cooling gas going to PSA (TOPSA)
The material and energy balance results from the ASPEN Plusw simulation were used to determine the size and corresponding costs of major pieces of equipment for the process. Costs were taken from the ChemCost software package and published literature and brought to January 1995 doJlars using equipment cost escalation ratios from Chemical Enginering Magazine (March, 1995). Some costs, especially those related to gasification, were taken from other studies. Detailed cost results can be found in the cost sheets in Appendix B.
1.26 690 (100)
0.12 690 (100)
0.43 690 (100)
0.85 690 (100)
4.3.1 Gasification Costs
The cost of the gasification train was estimated in a previous study for DOE'S Biomass Power Program, as well as by several consulting firms working for BCL (Breault and Morgan, 1992; Double, 1988; Dravo Engineering Companies, 1987; Weyerhaeuser, 1992). These costs were scaled to the appropriate plant size for this study using a 0.7 scale factor. Unit operations included in these costs were the feed system, dryer, gasifier, char combustor, cydlone separators, hot-gas cleanup system, and necessary pumps and compressors. The gasification steam generator (heat exchanger and flash drum) cost was calculated separately and included with the reformer costs.
4.3.2 Reactor Costs
The reactors sized and priced for this study were the primary reformer, the high temperature shift reactor, and the low temperature shift reactor.
A themodynamically-controlled reactor block was used to model the primary reformer in ASPEN Plusm. This block predicts the final reaction products based on minimization of Gibbs free energy. An 11 "C temperature approach to equilibrium was used in accordance with results from natural gas reforming operations (Tindall and King 1991). The heat for the endothermic reactions (Reaction 1) taking place in this reactor was supplied by burning the PSA offgas that consists of unrecovered hydrogen, CH,, CO and inerts. An equilibrium bIock was also used to model this combustor, and taken together, the two reactor blocks represent the primary refomer. The cost of the primary reformer was based on a furnace reactor, taken from three sources and averaged (see Appendix B cost sheets).
12

The costs of the high and low temperature shift reactors were based on a space velocity of 4000h (Kirk-Othrner, V.13, p 856) and a height-to-diameter ratio of 2. The cost of the reactor as a function of height, diameter, and material of construction was determined using ChemCost. Costs from other sources were similar.
4.3.3 Compressor Costs
The two compressors necessq for this process are the syngas compressor and the air compressor for the offgas combustor. Both are four stage compressors with interstage cooling. As noted in Table 7, steam is generated by cooling the gas being compressed between stages. The costs of these compressors were calculated by ChemCost as eight individual compressors of the required horsepower. See cost sheets in Appendix B for the power requirements and resultant costs. The interstage coolers were calcuIated separately as heat exchangers and flash drums.
4.3.4 Heat Exchanger Costs
Heat exchangers were modeled as counter-cumnt in the simulation. The minimum approach temperature used was 1 1 "C. The required area for a heat exchanger was calculated fiom the appropriate heat duty, temperature difference, and heat transfer coefficient. ChemCost was used to derive the corresponding cost.
4.3.5 Pump Costs
The cost of each pump required for the process was calculated by ChemCost using the flowrate and outlet pressure.
4.3.6 PSA Cost
The appropriate PSA design is very specific to the application, therefore, the manufacturers would most Likely design and cost it for the potential buyer. Because this study is only to assess feasibility and not to design a planned operation, the capital and operating costs of the PSA unit were taken from the literature (Schendel, et al, 1983) and scaled according to the amount of hydrogen produced. The installed capital of a PSA system was $7.164/thousand standard m3/d ($253/thousand scfd). The operating costs were $0.184/thousand standard m3/d ($6 .SO/thousand scfd).
4.3.7 Operating Costs
Operating costs for this process include the feedstock, electricity to run the compressors ($O.OYkWh), water for steam generation and cooling ($330/m3), and labor. The revenue from steam produced for export is taken as an operating cost credit. Detailed operating costs for each plant can be found in the cost sheets in Appendix B.
4.4 Economic Analysis Results
The capital and operating costs for each of the scenarios studied are shown in Table 8. These costs were calculated using a feedstock cost of $16.50/T for the smalI and medium size plants and $46.30/T for the large plant. Operating costs would increase significantly if the medium size plant obtained its biomass from a DFSS.
13

Scheme 1 Scheme 2 Plant size Sm med lg sm med lg Operating Costs 0.30 1.73 14.1 0.28 1.43 13.1
Fixed 0.15 0.27 0.33 0.16 0.27 0.33
The results of the DCFROR analysis are shown in Figures 4 through 9. Because the eventual price of biomass needed to supply plants such as those studied here is unknown, these figures give the biomass feedstock cost that can be paid to produce hydrogen within the current market values. Conversely, if the biomass cost can be accurately assessed, the necessary hydrogen selling price from this process can be obtained. Figures 4,6, and 8 show the pre-tax production cost of hydrogen in each of the three schemes at the different plant sizes. Fi,gures 5,7, and 9 show the necessary hydrogen selling price given a 37% tax rate and a 15% after-tax IRR. With the market value of hydrogen between $5/GJ and $lS/GJ, these figures show that hydrogen can be produced from biomass to compete with current hydrogen production methods on the large and medium scale for all configurations studied. However, the necessary hydrogen selling price is highly dependent upon the biomass feedstock cost, and low-cost biomass will need to be obtained to justify hydrogen from this process, particularly on the small scale. For easy reference, a summary of these results is shown in Table 9. Hydrogen selling prices were calculated using biomass feedstock prices of $16.50/T for the small plant and $46.30/7' for the Iarge plant. Because it is uncertain if nearly 300 T/day waste biomass at the lower price can be secured, both $ld.SO/T and $46.30/T were used to calculate the minimum selling price for the medium size plant. The results shown in this table are representative only of the situations for which biomass can be obtained at the listed prices. The actual biomass price for a given region and situation should be used when assessing the necessary hydrogen selling price from this process. Figures 4 through 9 can be used when assessing specific situations.
Scheme 3 sm med 1g 0.31 4.39 , 14.1 0.16 0.27 0.33
14
~ Variable Byproduct credit Feed
Capital Costs
0.16 1.60 5.33 0.13 1.30 4.32 0.16 2.60 5.32 -0.16 -1.62 -5.38 -0.16 -1.62 -5.38 -0.16 -1.62 -5.38 0.15 1.48 13.8 0.15 1.48 13.8 0.15 4.14 13.8 6.08 34.5 90.4 5.05 29.3 80.0 6.02 34.0 89.1


Table 9: Necessary Hydrogen Selling Price for a 15% after-tk IRR After 1 I
Plant size Biomass cost Hydrogen ($m selling price
(WJ)
Scheme1 I small I 16.50 I 23 20
16.50 I 13.20 I medium I medium 46.30 16.20
large 46.30 13.70 ~ ~~
Scheme 2 small 16.50 25.10
medium 16.50 14.20
I medium' I 46.30 I 18.20
I large I 46.30 I 15.70
I 16.50 I 24.30
I medium I . 46.30 I 17.00
I 46.30 I 14.20
Taxes
From Figures 4 through 9, it can be seen that the cost of producing less hydrogen in Schemes 2 and 3 is higher than the savings obtained by eliminating some unit operations in the reforming section of the process. Of the three process configurations studied, the most profitable is Scheme 1. Of the two configurations with reduced reforming operations, Scheme 3, with the primary reformer and high temperature shift reactor, is more economic than Scheme 2 with only the primary reformer. This is because the majority of the water gas shift reaction takes place in the high temperature shift reactor. Scheme 3 is not as economic as Scheme 1 even though capital costs are lower because of the absence of the low temperature shift reactor, the decreased amount of hydrogen that is produced reduces the net income over the life of the plant.
The most economic size for the process studied depends upon the feedstock cost. If the medium size plant can be supplied with waste biomass at a cheaper price (i-e., $16.50/T) than the biomass supplied by a DFSS, the necessary hydrogen selling price from the medium size plant is lower than that from the large plant. However, if the medium and Iarge plants must both use biomass from a DFSS, the larger plant is .more economically feasible. The medium size plant is more economic than the small plant if biomass at the same feedstock cost is used in each. Figures 4 through 9 also show that there is a larger economy of scale realized in going from the smal l to the medium size plant than in going from the medium to the large plant. Figure 5 shows that for positive biomass feedstack costs, the necessary hydrogen selling price would have to be at least $8.70/GJ and $1 1.20/GJ for the large and medium size plants, respectively. Unless biomass at extremely low costs can be obtained, hydrogen produced in the small indirectly heated gasification and reforming operation is not economically feasible. Figures 7 and 9 give similar results.
21

fie^ 10 through 12 show the cumulative cash flow for the three plant sizes for Scheme 1 over a twenty-year plant life. The conresponding curves for Schemes 2 and 3 are similar. Figures 10 and 11 show the cash flow for the 27 and 272 T/&y plant using a biomass feedstock cost of $16.50/T. Figure 12 is the cash flow diagram for the 907 T/day plant using a feedstock cost of $46.30/T. Each diagram is based on a hydrogen selling price of $1 1/GJ ($12/MMBtu). The breakeven point for the medium plant (6.3 years) is sooner than that for the large plant (7.2 years) because of the lower feedstock cost. If the medium plant were also using biomass at $46.30/T, the break-even point would be 9.5 years.
Plant size Biomass cost Discount rate ($fn for NPV=O
(W Scheme1 small 16.50 4.0
Table 10 gives the discount rate used to set the net present value to zero for each scheme at the three plant sizes. This rate was calculated using a hydrogen selling price of $1 1/GJ ($12/MMBtu). The biomass costs used were $16.50/T for the small plant and $46.30/T for the large plant; the discount rate for the medium plant was calculated using both biomass costs. The rates obtained in this analysis are low in comparison to other processes which reach commercialization. A better estimate for how much the biomass feed will cost will reduce some of the uncertainty in these calculations, and it may be that the discount rates are higher than reported here.
medium
medium
16.50 10.4
46.30 6.7
Scheme2
large 46.30 9.2
small 16.50 3 .O
medium
I I medium I 46.30 I 4.7 I 16.50 9.4
Scheme 3
large
small
medium
medium
- .
46.30 6.6
16.50 3.5
16.50 9.9
46.30 6.0 I
46.30 1 8.4 I
22


5.0 Conclusions
Compared to conventional hydrogen producing processes, many of the criteria for successful commercialization of this process are not met. This is because the gasification technology is not fully optimized and tested, and that the reforming process was developed specifically for natural gas and not biomass syngas. Additionally, a higher and mofle conservative IRR was used for the DCFROR analysis. The necessary selling price of hydrogen from this process falls at the higher end of the current market value range. Also, the discount rates obtained in the ROI analysis are low and the break-even times are fairly long. Therefore, improvements in process design and conversion yields will be necessary for this process to be readily commercialized.
The necessary selling price of hydrogen produced by steam reforming syngas from the BCL gasifier falls within current market values for many of the scenarios studied. The factors that determine which scenario is the most economically feasible are design configuration, plant size, and biomass feedstock costs. The configuration that produces the least expensive hydrogen is that which uses all reforming operations, Scheme 1. Therefore, for the reforming process studied, as much hydrogen as possible should be made at the expense of higher capital equipment charges. Of the three plant sizes studied, the most economic configuration depends upon the availability of waste biomass at a lower price than biomass from a DFSS. If waste biomass can be obtained for the medium size plant, this scale is the most economic. However, if DFSS biomass must be used for both the medium and large plants, the 907 T/day plant produces hydrogen at a cheaper price than the 272 Tiday plant. Results show that unless biomass can be obtained at very low prices, producing hydrogen from a very small plant acting as a local refueling station will not be economically competitive.
As the development of biomass-based technologies continues and better predictions for the costs of biomass from energy crop improvements can be made, the examples of costs given in this study can be revisited using the curves of hydrogen price versus feedstock cost. For this process to be economically viabIe in the marketplace, low biomass costs will probably be necessary. As research continues on processes that use biomass and as uncertainties are addressed, the risk of investing in such projects will decrease. This will reduce the necessary hydrogen selling price and provide a shorter break-even point.
.
6.0 Future Work
Additional benefits of producing hydrogen on the small scale via reforming syngas from the BCL gasifier should be studied and incorporated into the estimated cost. For example, if hydrogen is produced at the point of its intended use, compression, storage, and transportation costs will be lower than on the larger production scale, or eliminated completely. On the medium and large scales, this cost mitigation is less likely, thus making on-site hydrogen production more attractive than shown in this report.
The ASPEN Plusm model of the reforming operation will be optimized to increase hydrogen production efficiency and reduce costs. Areas targeted for improvement will be determined from sensitivity analyses within ASPEN Plusm and the economic spreadsheet model. One option that might help costs is the addition of a steam turbine to produce electricity from the excess heat in the reforming operation. Also, a quench operation will be tested to cool the feed to the PSA unit. Furthermore, new information obtained in the testing and scale-up of the BCL gasifier will be incorporated into t h i s analysis to measure cost improvement.
26

As biomass-based processes become better developed and the uncertainties associated with the cost of the biomass feedstock decrease, the assumptions made in this analysis will be revisited. Currently, the biomass feedstock cost is a result of the analysis, determined from the cost curves set between the current high and low market values of hydrogen.
A life cycle assessment will be conducted on these processes to determine their environmental impacts in terms of energy consumption and emissions to water and the air. This will include a comparative analysis of conventional hydrogen producing processes.
The economic and environmental effects of reforming a mixture of biomass syngas and natural gas should be studied. Because the stoichiometric maximum amount of hydrogen that can be produced from methane is higher than from syngas, the overall amount produced would be higher. This scenario would allow for higher hydrogen fecovery by avoiding the need for the recycle stream used to increase the percentage of hydrogen in the PSA feed, while e t a i n i n g or sacrificing only a small portion of the benefits obtained in using a biomass-based process. This may also be a means of transition firom the current hydrogen production technologies to a renewable technology.
27

References and Pertinent Literature
h a n d , M. (April, 1995). Personal Correspondence.
Bain, R. (January 14, 1992). Material and Energy Balances for Methanol from Biomass Using Biomass Gaszjiers. Golden, Colorado: National Renewable Energy Laboratory.
Bland, W.; Davidson, R.L., eds. (1967). Petroleum Processing Handbook. New York: McGraw-Hill; pp. 140-148.
Branan, C., ed. (1994). Rules of Thumb for Chemical Engineers. Houston, Texas: Gulf Publishing Company.
Breault, R.; Morgan, D.; (1992). Design and Economics of Electriciiy Production from and Indirectly Heated Biomass Gasifier. Report TR4533-049-92. Columbus, Ohio: Battelle Columbus Laboratory.
Chomet, E.; Czernik, S.; Wang, D.; Mann, M. (1994). Biomass to Hydrogen via Fast Pyrolysis and Reforming. Department of Energy Hydrogen Program Review.
Chum, H.L.; Black, S.K. Process for Fractionating Fast Pyrolysis Oils and Products Derived Therefrom. US. Patent No. 4,942,269 (17 July 1990).
Double, J.M.; (1988) Design, Evaluation and Costing of Biomass Gasifiers. Doctoral Thesis.
Dravo Engineering Companies. (1987). Gasification Capital Cost Estimation. Obtained from Mark Paisley in personal comespondance, August, 1994. Battelle Columbus Laboratory.
Feldmann, H.; Paisley, M.A. (May 1988). Conversion of Forest Residues to a Methane-Rich Gas in a High- Throughput Gasifier. Columbus, Ohio: Battelle Columbus Laboratory.
Garrett, D. (1989). Chemical Engineering Economics. New York Reinhold.
Gerhartz, W., ed. (1989). Ullman's Encyclopedia of Industrial Chemistry. Germany: VCH; Vols. A13, A17, A22.
Gregoire, C.E. (1 992). Technoeconomic Analysis of the Production of Biocrude porn Wood. Golden, CO. NRJZL Report TP-430-5435.
Kirk, R.; Othmer, D., eds. (1983). Encyclopedia of Chemical Technology. New York: Wiley & Sons; Vols. 12, 15, 19.
Larson, E.; Katofsky, R. (July 1992). Production of Methanol and Hydrogen from Biomass. PULCEES Report No. 271. Princeton University: Center for Energy and Environmental Studies.
Moe, J. (March 1962). "Design of Water-Gas Shift Reactors." Chemical Engineering Progress; Vol. 58, 131, pp. 33-36.
Ogden, J.; Dennis, E.; Steinbugler, M.; Strohbehn, J.W. (January 18, 1995). Hydrogen Energy Systems Studies. Princeton University: Center for Energy and Environmental Studies, Figure 5b.

Ogden, J.; Larson, E.; Delucchi, M. (May 27,1994). A Technical and Economic Assessment of Renewable Transportation Fuels and Technologies. Princeton University: Center for Energy and Environmental Studies.
Peters, M.; Timmerhaus, K (1980). Plant Design and Economics for Chemical Engineers. 3rd edition. New York: McGraw-Hill.
Peters, M.; Timme~haus, K. (1991). Plant Design and Economics for Chemical Engineers. 4th edition. New York McGraw-Hill.
Pikulik, A.; Dim, H. (October 10, 1977). "Cost Estimating for Major Process Equipment." Chemical Engineering; Vol. 84, (211, pp. 106122.
Schendel, R.L.; Mariz, C.L.; Mak, J.Y. (August 1983). Hydrocarbon Processing; Vol. 62, p. 58.
SRI International. (1 994). Chemical Economics Handbook. Menlo Park, California
Stultz, S.C.; Kitto, 3.B. (1992). Steam. Barberton, Ohio: Babcock and Wilcox.
Sunggyu, L. (1990). Methanol Synthesis Technology. Boca Raton, Florida: CRC Press; pp. 4-22.
Supp, E. (1990). How to Produce MeOHtfiom Coal. Germany: Springer-Verlag; pp. 4493,183-185.
Tindall, B.M.; King, D.L. (July 199 2). "Designing Steam Reformers for Hydrogen Production. '' Hydrocarbon Processing; Vol. 73, [7], pp. 69-75.
Twigg, M., ed. (1989). Catalyst Handbook. Cleveland, Ohio: WoIfe Publishing; p. 87-89,262.
Weenen, W.; Tielrooy, J. (February 1983). "Optimizing Hydrogen Plant Design." Chemical Engineering Progress; Vol. 79,[21, pp. 3744.
Weyerhaeuser. (1 992). Gasification Capital Cost Estimation. Obtained from Mark Paisley in personal correspondance, August, 1994. Battelle Columbus Laboratory.
Woods, D.R. (1975). Financial Decision Making in the Process Industry. New Jersey: Prentice Hall.

Appendix A: ASPEN Plus Input File Gasifier Fortran Subroutine
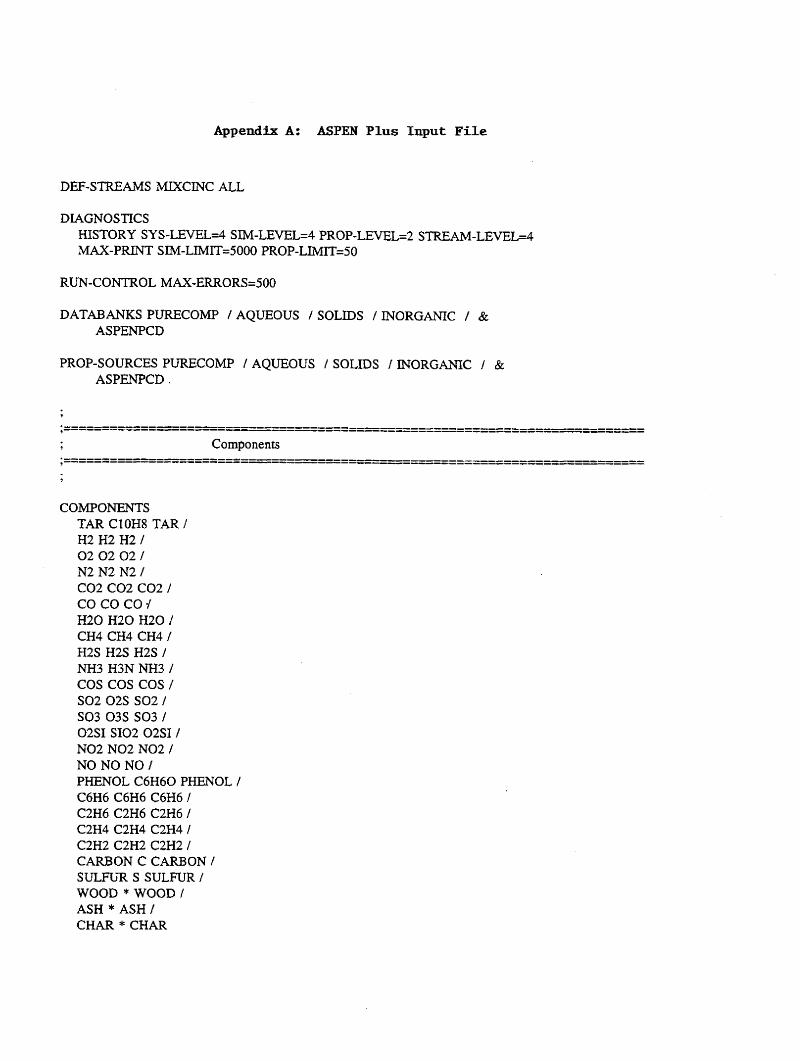
Appendix A: ASPEN P l u s Input F i l e
DEF-STREAMS MJXCINC ALL
DIAGNOSTICS HISTORY SY S-LEVELA S.M-LEVEL=4 PROP-LEVEL==! STREAM-LEVELz4 MAX-PRINT SIM-LIMIT=5000 PROP-LIMIT=50
RUN-CONTROL MAX-ERRORS=500
DATABANKS PURECOMP I AQUEOUS I SOLIDS / INORGANIC / & ASPENPCD
PROP-SOURCES PURECOMP / AQUEOUS / SOLIDS / INORGANIC / & ASPENfCD .
COMPONENTS TAR CIOH8 TAR / H2 H2 H2 I 0 2 0 2 0 2 I N2 N2 N2 I c02 c02 c02 I co co co -/ H20 €320 H20 / CH4 CH4 CH4 I H2S H2S H2S I NH3 H3N NH3 / cos cos cos / so2 02s SO2 f SO3 035 SO3 f 02% SI02 02SI I NO2 NO2 NO2 / NO NO NO / PHENOL C6H60 PHENOL / C6H4 C6H6 C6H6 / C2H6 C2H6 C2H6 / C2H4 C2H4 C2H4 1 C2H2 C2H2 C2H2 / CARBON C CARBON I SULFUR S SULFUR / WOOD * WOOD 1 ASH * ASH I CHAR * CHAR

FLOWSHEET MAIN BLOCK FEEDMIX IN=GASPSTM WOOD SAND OUT=GFEED BLOCK GASIFIER IN=GFEED OUT=WOODGAS QGAS BLOCK CHARSEP IN=WOODGAS OUT=CHAR SYNGAS BLOCK CHARDEC I N = C W OUT=CHARCOMP QCHAR BLOCK AIRHEAT IN=COMBAIR2 OUT=HCOMBAIR QAIR BLOCK CHARF'URN IN=CHARCOMP HCOMBAIR SANDSUPP QCHAR OUT= &
BLOCK COMBSPLT IN=COMBPROD OUT=CHARF'LUE ASHSAND BLOCK SANDSPLT IN=ASHSAND OWT=SAND SANDPURG BLOCK SYNCOMPR IN=TOCOMPR OUT=SYNCOMPD 205 BLOCK PRIMARY IN=TOREFHOT REFSTM OUT=SYFREFRM 105 BLOCK HTSHIFT IN=TOHT OUTT=FROMHT QHT BLOCK LTSHIFT IN=TOLT OUT=FROMLT QLT BLOCK R E m IN=207 OUT=TOREFHOT 198 BLOCK WATPUMP IN=REFSTMA OUT=REFSTMB BLOCK WOODSEP IN=ARWOOD OUT=WOODWAT MIDWOOD BLOCK DRY2 IN=MIDWOOD WETDAIR OUT=DRYWUOD BLOCK DRY 1 IN=WOUDWAT F'LUENAIR OUT=WETDAIR BLOCK DRYRMIX IN=CHARFLUE DRYRAIR2 OUT=FLUENm BLOCK PSA IN=TOPSAB OUT=H2PURIFY OFFGAS BLOCK OFFCOMB IN=OFFGAS OFFAIR2 105 OUT=OFFFLUEl BLOCK GSTMGEN IN=SYNREFRM GSTMIN OUT=FROMPm GASIFSTM BLOCK AIRCOMPl IN=COMBAIR OUT=COMBAIR2 BLOCK AIRCOMP2 IN=DRYRAIR OUT=DRYRAIR2 BLOCK DRYRSEP IN=DRYWOOD OUT=DRIED GASWAT BLOCK MODEL1 IN=HOTIN COLDIN OUT=HOTOUT COLDOUT BLOCK SYNCOOL1 IN=SYNGAS OUT=SYNCOLD 197 BLOCK MODEL2 IN=HI CI OUT=HO CO BLOCK LTCOOL IN=FROMHT 196 OUT=TOLT STEAM4 BLOCK OFFCOMPR IN=OFFAIRl OUT=OFFAIR2 BLOCK REFSTM IN=REFSTMB OUT=REiFSTM 135 BLOCK COMBCOOL IN=OFFl?LUEl 135 OUT=OFFFLWE2 BLOCK HTCOOL IN=FROMPRIM OUT=TOHT BLOCK PUMP1 IN=BFWlA OUT=145 BLOCK INTER2A IN=GAS2A 160 OUT=COOLED2A STEAM2A BLOCK INTER2B IN=GAS2B 165 OUT=COOLED2B STEAM2B BLOCK PUMP4 IN=BFW2A OUT=160 BLOCK PUMP5 IN=BFW2B OUT=165 BLOCK RECMIX IN=TOPSAA H2RECYCL OUT=TOPSAB BLOCK RECSPLT IN=H2PURIEY OUT=H2PROD H2RECYCL BLOCK STMGEN6 IN=OFFF;LUE2 188 OUT=OF'F'F'LUE3 STEAM4 BLOCK B13 IN=BFW4 OUT=188 BLOCK B3 IN=BFW6 OUT=196 BLOCK B 1 IN=SYNCOLD OUT=KOWATER TOCOMPR BLOCK B2 IN=SYNCOMPD 208 205 OUT=207 BLOCK B5 IN=KOWATEiR OUT=208 BLOCK PSACOOL IN=FROMLT 212 OUT=TOPSAA S T E A M 5 189
COMBPROD QCOMB

BLOCK €37 IN=BFWS OUT=212 BLOCK €34 IN=GASlA OUT=COOLEDlA 213 BLOCK 8 6 IN=145 213 OUT=STMWAT BLOCK STMFLASH IN=STMWAT OUT=STEAMlA WATlA
PROPERTIES SYSOP3
PROP-REPLACE SYSOP3 RKS-BM PROP MUVMX MWMXO2 PROP MULMX MULMX02 PROP KVMX KVMX02 PROP KLMX KlLMXO1 PROP DV DVOl PROP MU., MULOl PROP M W MWOl PROP KV KVOl PROP KL KLO1
7
NC-COMPS WOOD ULTANAL SULFANAL PROXANAL
NC-PROPS WOOD ENTHALPY HCJlBOIE / DENSITY DCOALIGT
NC-COMPS ASH GENANAL ULTANAL SULFANAL PROXANAL,
NC-PROPS ASH ENTHALPY HCJlBOIE / DENSITY DNSTYGEN
NC-COMPS CHAR ULTANAL SULFANAL PROXANAL
NC-PROPS CHAR ENTHALPY HCJlBOIE / DENSITY DCHARIGT
PROP-DATA DATA1 IN-UNITS ENG PROP-LIST DGSFRM / DHSFRM / M W PVAL 02SI .O / -0 / 60.0840 PVAL CARBON .O / .O / 12.0110 PVAL SULFUR .O / .O / 32.0640
PROP-DATA DATA5 IN-UNITS SI TEMPERATURE=F PROP-LIST VSPOLY

PVAL CARBON -005340 .O .O .O .O .O 2500.0 PVAL, SULFUR ,01550 .O .O -0 -0 .O 2500.0
PROP-DATA U-1 IN-UNITS ENG MOLE-HEAT-CA='CAL/MOL-K TEMPERATITREK PROP-LIST CPSPOl PVAL CARBON 2.6730 .0026170 .O -0 -116900.0 .O 273.0 &
1373.0 PVAL 02SI 12.80 .004470 .O .O -302000.0 .O 273.0 1973.0 PVAL SULFUR 3.630 .00640 0.0 0.0 0.0 0.0 0.0 1000.000
PROP-DATA U-2 IN-UNITS SI PROP-LIST DENGEN PVAL ASH 2000.0 -0 .O .O
1
PROP-SET PS-1 CP RHO UNITS='BTU/LB-R' 'GWCC' !LB/C?JFT & SUBSTREAM=MKED COMPS=02SI CARBON StJLFUR PHASES
PROP-SET PS-2 DENSITY HEAT-CAP UNITS=LB/CUFT" 'GWCC' & BTU/LB-R' 'CAL/GM-K' SUBSTREAM-NC COMPS=WOOD ASH CHAR & PHASE=S
STREAM 207
STFtEAM ARWOOD SUBSTREAM MIXED TEMP=59 PRES=14.696
SUBSTREAM NC TEMP49 PRES=14.696 MASS-FLOW H20.78
MASS-FLOW WOOD 1 COMP-ATI'R WOOD ULTANAL ( -920 50.880 6.04 .17 0 0.09 &
41.9 ) COMP-A'ITR WOOD SULFANAL ( .450 .02250.02250 ) COMP-ATTR WOOD PROXANAL ( 1 1 15.29 83.52 .87 )
STREAM BFWlA S U B S T R E A M MIXED TEMP=170 PRES=30 MASS-FLOW H20.8
STREAM BFW2A SUBSTREAM MIXED TEMP=59 PRES=30 MASS-FLOW H 2 0 ,0565
STREAM BFW2B SUBSTREAM MIXED TEMP=59 PRES=30 MASS-FLOW H20 .04825
STREAM BFW4

SUBSTREAM MIXED TEMP=59 PRES=30 MASS-FLOW H20 -378
STREAM BFWS SUBSTREAM MIXED TEMP=59 PRES=30 MASS-FLOW H20 .75
STREAM BFW6 SUBSTREAM MIXED TEMP=59 PRF,S=14.696 MASS-FLOW H20.2
STREAM CI SUBSTREAM MIXED TEMP=59 PRES=30 MASS-FLOW H20 .570
STREAM COLDIN SUBSTREAM MIXED TEMP=228 PRES=530 MASS-FLOW TAR .014 / H2 .012 / C02 .16 / CO .327 / &
H20 .51 / CH4 -069 / H2S ,001 / NH3 ,002 / C2H6 & .004 / C2H4 .035 / C2H2 .003
smAM COMBAIR SUBSTREAM MIXED TEMP=59.0 PRES=14.696 MASS-FLOW=1.80 MOLE-FRAC 0 2 ,207340 / N2 .782180 / C02 .000330 / H20 &
.O 1 0 1 50
STIU3AM DRYRAIR SUBSTREAM MIXED 'IEMP=59 PRESz14.696 MASS-FLOW=6 MOLE-FRAC 0 2 .207340 / N2 .782180 / C02 .000330 / H20 &
.010150.
STREAM GASlA SUBSTREAM MIXED TEMP=397.8549 PRES45.37759 MASS-FLOW TAR .013804 / H2 .011585 / C02 .160307 / CO &
0.327241 / H20 SO999 / CH4 .Of58728 / H2S .OW781 / & NH3 .001718 / C2H6 .003747 / C2H4 .035058 / C2H2 & -00254
STREAM GAS2A SUBSTREAM MIXED TEMPd14.9241 PRES=72.99842 MASS-FLOW 0 2 -250564 / N2 .827514 / C02 -000548 / €320 &
.006906
STREAM GAS2B SUBSTREAM MIXED TEMP=373.9805 PRES=l62.6937 MASS-F'LOW 0 2 .250564 / N2 .827514 / C02 .000548 / H20 &
.006906
STREAM GASIFSTM SUBSTREAM MIXED TEMP=lOOO PRES=25

MASS-FLOW H 2 0 . 4
STREAM GSTMIN SUBSTREAM MIXED TEMP=59 PRES=30 MASS-FLOW H 2 0 . 4
STREAM HI SUBSTREGM MIXED TEMP=1736 PRES=362.6 MASS-FLOW 0 2 .038 / N2 .99 / C02 1.041 / H 2 0 .227
STREAM HOTIN SUBSTIEAM MIXED TEMP=1517.5 PRES=20 MASS-FLOW TAR .014 / H2 .012 I C02 .16 f CO .327 / &
H20 .51 / CH4 .069 / H2S .001 / NH3 .002 / C2H6 & -004 / C2H4 .035 / C2H2 .003
STREAM OFFAIR1 S U B S T R E A M MIXED TEMPz59 PRE$=14.696 MASS-FLUW=5 MOLE-FRAC 0 2 207340 / N2 -782180 / C 0 2 .000330 / H 2 0 &
.010150
STREAM OFFFLUE1 SUBSTREAM MIXED TEMP=1915 PRES=362 MASS-FLOW 0 2 .058983 / N2 1.197313 / C02 1.040337 / CO &
.266843
STREAM REFSTMA S U B S T R E A M MIXED TEMP=59 P W = 3 0 MASS-FLOW H20.544
STREAM SAND S U B S T R E A M MfXlED TEMP=1822.0 PRES=25.0
S U B S T R E A M CISOLID TEMP=1740.0 PRES=25.0
SUI3STR.EN.M NC TEMP=1740.0 Pl2ES=25.0
MASS-FLOW HI20 1 .OOOE-05
MASS-FLOW 02SI 21.0
MASS-FLOW ASH .00780 COMP-ATI'R ASH GEWANAL ( 100.0 0.0 0.0 0.0 0.0 0.0 0.0 & 0.0 0.0 0.0 0.0 0.0 0.0 0.0 0.0 0.0 0.0 0.0 0.0 & 0.0 )
C O M P - A m ASH ULTANAL ( 100.0 0.0 0. 0.0 0.0 0.0 0.0 ) COMP-AlTR ASH SULFANAL ( 0.0 0.0 0.0 COMP-ATTR ASH PROXANAL ( 0.0 0.0 0.0 100.0 )
smm SANDSUPP SUBSTREAM MIXED EMP=59.0 PRES=20 MASS-FLOW H20 1 .OOOE-O5 SUBSTREAM CISOLID TEMP=59.0 PRES=20 MASS-FLOW 02SI .080

STREAM WOOD SUBSTREAh4 M m D TEMP=155 PRES=25 SUBSTREAM CISOLID TEMP=220 P W = 2 5
SUBSTREAM NC TEMP=220 PFLES=25 MASS-FLOW CARBON 1 .OOOE-OS
MASS-FLOW WOOD 1.0 / ASH 1.OOOE-05 / CHAR 1.OOOE-05 COMP-ATIR WOOD ULTANAL ( -920 50.880 6.040 -170 .O -090 &
41.90 ) COMP-ATTR WOOD SULFANAL ( .450 -02250 ,02250 ) COMP-ATTR WOOD PROXANAL ( 11.0 15.290 83.520 .870 ) COMP-ATTR ASH GENANAL ( 100.0 .O .O .O .O .O .O .O &
.o .o .o .o .o .o .o .o .o .o .o .o ) COMP-A'lTR ASH ULTANAL ( 100.0 .O .O .O -0 .O .O ) C O M P - A m ASH SULFANAL ( .O .O .O COMP-AlTR ASH PROXANAL ( .O -0 -0 100.0 ) C O M P - A m CHAR ULTANAL ( .O 86.0 4.0 -0 .O .030 9.970 &
1 COMP-ATTR CHAR SULFANAL ( .010 ,010 ,010 ) COMP-ATI'R CHAR PROXANAL ( .O 87.180 12.810 .010 )
DEF-STREAMS HEAT 105
DEF-STREAMS HEAT 135
DEF-STREAMS E A T 197
DEF-STREAMS HEAT 198
DEF-STREAMS HEAT 213
DEF-STREAMS HEAT QAIR
DEF-STREAMS HEAT QCHAR
DEF-STREAMS HEAT QCOMB
DEF-STREAMS HEAT QGAS
DEF-STREAMS HEAT QHT
DEF-STREAMS HEAT QLT
BLOCK B2 MIXER PARAM PRES=530
BLOCK DRY1 MIXER

BLOCK DRY2 MIXER
BLOCK DRYRMIX MIXER
BLOCK FEEDMIX MIXER PARAM PRES=25
BLOCK RECMIX MIXER
BLOCK RECSPLT FSPLIT m c H2FECYCL .1
BLOCK SANDSPLT FSPLIT FRAC SANlDPURG .0050
BLOCK B1 SEP FRAC STREAM=KOWATER SUBSTREAM=MIXED COMPS=TAR H2 0 2 N2 &
C 0 2 CO H 2 0 CH4 H2S NH3 COS SO2 SO3 02SI NO2 NO & PHENOL C6H6 C2H6 C2H4 C2H2 CARBON SULFUR FRACS=O 0 & 0 0 0 0 1 0 0 0 0 0 0 0 0 0 0 0 0 0 0 0 0
FRAcs=o 0
mcs=o 0 0
FRAC STREAM=KOWAIER SUBSTREAM=CISOLID COMPS=02SI CARBON &
FRAC STREAM=KOWATER SUBSTREAM=NC COMPS=WOOD ASH CHAR &
BLOCK CHARSEP SEP F'R4C STREAM=CHAR SUBSTREAM=CISOLID COMPS=02SI CARBON &
FRAC STREAM=CHAR SUBSTREAhkNC COMPS=WOOD ASH CHAR FRACS= &
FRAC STREAM=SYNGAS SUBSTREAM=MIXED COMPS=TAR H2 02 N2 &
FRACSE1.0 1.0
1.0 1.0 1.0
C02 CO H 2 0 CH4 H2S NH3 COS SO2 SO3 02SI NO2 NO & PHENOL C6H6 C2H6 C2H4 C2H2 CARBON SULFCTR FRACS=l.O & 1.0 1.0 1.0 1.0 1.0 1.0 1.0 1.0 1.0 1.0 1.0 1.0 & 1.0 1.0 1.0 1.0 1.0 1.0 1.0 1.0 0.0 0.0
BLOCK COMBSPLT SEP FRAC STREAM=ASHSAND SUBSTFEAM=MIXED COMPS=TAR H2 0 2 N2 &
C02 CO H 2 0 CH4 H2S N H 3 COS SO2 SO3 02SI NO2 NO & PHENOL C6H6 C2H6 C2H4 C2H2 CARBON SULFUR FRACS=.O .O & .o .o .o .o .o .o -0 .o .o .o .o 1.0 .o .o .o & .o .o .o .o -0 .o
1 .o
FRAcs=.o 1.0 .o
FRAC STREAM=ASHSAND SuBS"REiAM=CISOLID COMPS=02SI FRACS= &
FRAC STREAM=ASHSAND SUBSTREAM=NC COMPS=WOOD ASH CHAR &
BLOCK DRYRSEP SEF'

FRAC STREAM=DRIED SUBS"M=MIXED COMPS=TAR H2 0 2 N2 & C02 CO H 2 0 CH4 H2S NH3 COS SO2 SO3 02SI NO2 NO & PHENOL C6H6 C2H6 C2H4 C2H2 CARBON SULFUR FRACS=O 0 & 000000000000000000000
mcs=o 0
FRACS=l 0 0
FRAC S'REAM=DRIED S U B S ~ A M = C I S O L D COMPS=02SI CARBON &
FRAC STREAM=DRIED SUBSTREAM=NC COMPS=WOOD ASH CHAR &
BLOCK PSA SEP FRAC STFE,AM=H2PURJFY SUBSTREAM=MIXED COMPS=TAR H2 0 2 N2 &
CO2 CO H20 CH4 H2S NH3 COS SO2 SO3 02SI NO2 NO & PHENOL C6H6 C2H6 C2H4 C2H2 CARBON SULFUR FRACS=O .85 & 000000000000000000000
WACS=O 0
FRAcs=o 0 0
FRAC STREAM=€€2PURIEy SUBSTREAM=CISOLID COMPS=OZSI CARBON &
FRAC STREAM=H2PURFY SUBSTREAM=NC COMPS=WOOD ASH CHAR &
BLOCK WOODSEP SEP FRAC STREAM=WOODWAT SUBSTREAM=MIXED COMPS=TAR H2 0 2 N2 &
C02 CO H 2 0 CH4 H2S NH3 COS SO2 SO3 02SI NO2 NO & PHENOL C6H6 C2H6 C2H4 C2H2 CARBON SULFUR FRACS=l 1 & 1 1 1 1 1 1 1 1 1 1 1 1 1 1 1 1 1 1 1 1 1
FRACS=l 1
FRAcs=o 1 1
FRAC ST1REAM=WOODWAT SUBSTREAM=CISOLID COMPS=02SI CARBON &
FRAC STREAM=WOODWAT SUBSTREAM=NC COMPS=WOOD ASH CHAR &
BLOCK AIRHEAT HEATER PARAM TEMP=60.0 PRES=O
BLOCK €34 HEATER PARAM TEMP=190 PRES=O
BLOCK B6 HEATER PARAM PREs=O
BLOCK COMBCOOL HEATER PARAM PRES=O
BLOCK HTCOOL HEATER PARAM TEMP=370 <C> PRES=O
BLOCK REFWTR HEATER PARAM TEMP=800 <C> PRES=O
BLOCK REFSTM HEATER P A W TEMP=lOOO PRES=O
BLOCK SYNCOOLl HEATER PARAM TEMP=195 PRES=O

BLOCK STMFLASH FLASH2 PARAM PRES=130 DUTY=O
BLOCK GSTMGEN €€EATX PARAM T-COLD=lOOO PRES-COLD=O FEEDS HOT=SYNREFRM COLD=GSTMIN PRODUCTS HOT=FROMPFUM COLD=GASIFSTM
BLOCK INlER2A HEATX PARAM T*HOT=150 FEEDS HOT=GAS2A COLD=l60 PRODUCTS HOT=COOLED2A COLD=STEAM2A
BLOCK INTER2B HEATX PARAM T-HOT=150 FEEDS HOT=GAS2B COLD=l65 PRODUCTS HOT=COOLED2B COLD=STEAM2B
BLOCK LTCOOL HEATX PARAM T-HOTz392 FEEDS HOT=FROMHT COLD=196 PRODUCTS HOT=TOLT COLD=STEAM6 FLASH-SPECS TOLT FREE*WATER=YES MAXIT=100 FLASH-SPECS STEAM6 MAXIT=100
;This block is used to model the syngas cooler prior to compression. Note ;that this block is really only representative of SYNC0011 and FCEFHTR; ;SYNCOOL2 is a separate cooler, modelled by MODEL2.
BLOCK MODELl HEATX PARAM T-HOT=1472 FEEDS HOT=HOTIN COLD=COLDIN PRODUCTS HOT=HOTOUT COLD=COLDOUT
;This block models the heat exchanger which connects blocks SYNCOOL2 ;DECANTHT. SYNCOOLl is modeled by MODELl.
BLOCK MODEL2 HEATX PARAM T-COLD-1000 FEEDS HOT=HI COLD=CI PRODUCTS HOT=HO COLD=CO
BLOCK PSACOOL m A T X P A W T-HOTz75 FEEDS HOT=FROMLT COLD=212 PRODUCTS HOT=TOPSAA COLD-STEAMS DECANT-STREA HOT=l89 FLASH-SPECS TOPSAA FREE-WATERzYES
BLOCK STMGENG HEATX PARAM T-HOT42 FEEDS HOT=OFFFLUE2 COLD=188 PRODUCTS HOT=OFF'FLUE3 COLD=STEAM4

BLOCK CHARmTRN RSTOIC PARAM TEMP= 1 800 .O PRES=- 1 .O STOIC 1 MIXED H2 -1.0 / 02 -.50 / H20 1.0 STOIC 2 MIXED 0 2 -1.0 / CISOLID CARBON -1.0 / MIXED &
c02 1.0
so2 1.0 STOIC 3 MIXED 0 2 -1.0 / CISOLID SULFUR -1.0 / MIXED &
CONV 1 MIXED H2 1.0 C O W 2 CISOLID CARBON 1.0 C O W 3 CISOLID SULFUR 1.0
BLOCK HTSKIFT RSTOIC P A R A M PRES=O DUTY=O STOIC 1 MIXED TAR -1 / H20 -20 / CO2 10 / H2 24 STOIC 2 MIXED CO -1 / H 2 0 -1 / H2 1 / C02 1 CONV 1 MIXED TAR 1 C O W 2 MIXED CO .7
BLOCK LTSHIFT RSTOIC P A W PRES=O DUTY=O
CONV 1 MIXED CO .75 STOIC 1 MIXED CO -1 / H20 -1 / H2 1 / C02 1
BLOCK GASIFIER RYIELD SUBROUTINE YIELD=BA'IYD USER-VECS NREAL=6 REAL VAL+uE-LIST=1500.0 360.0 6.60 8.30 .04650 4.0 PARAM TEMP=1500.0 PRES=20 BLOCK-OPTION SIM-LEWLz4
BLOCK OFFCOMB RGJBBS PARAM PRES=O
BLOCK PRIMARY RGIBBS PARAM TEMP=850 <C> PRES=O TAPP=-20
BLOCK B3 PUMP PARAM PRES=500
BLOCK B5 PUMP PARAM PRES=530
BLOCK B7 PUMP PARAM PRES=l15
BLOCK I313 PUMP PARAM PRES=llS
BLOCK PUMP1 PUMP PARAM PRES=180

BLOCK PUMP4 PUMP PARAM PRES=115
BLOCK PUMP5 PUMP PARAM PRES=115
BLOCK WATPUMP PUMP PARAM PRES=363
BLOCK AIRCOMPl COMPR PAICAM TYPE=POLYTROPIC PRES=20
BLOCK AIRCOMP2 COMPR PARAM TYF'E=POLYTROPIC PRES19 TEMP=59
BLOCK OFFCOMPR MCOMPR PARAM NSTAGE4 TYPE=POLYTROPIC PRES=362.6 FEEDS OFFAIR11 PRODUCTS OFFAIR2 4 COOLER-SPECS 1 TEMP=180 / 2 TEMP=150 / 3 TEMk150 / 4 &
TEMP=372.8
BLOCK SYNCOMPR MCOMPR PARAM NSTAGE4 TYPE=POLYTROPIC PmS=530 FEEDS TOCOMPR 1 PRODTJCTS SYNCOMPD 4 / 205 GLOBAL L COOLER-SPECS 1 TEMP=190 / 2 TEMP=190 / 3 TEMP=190 / 4 &
TEMP=393.1852 BLOCK-OPTION FREE-WATER=YES
BLOCK CHARDEC USER DESCRIPTION "CHAR IS DECOMPOSED INTO ITS ELEMENTS" SUBROUTINE USRDEC BLOCK-OPTION SIM-LEVEL4
7
Design Specifications
DESIGN-SPEC ADIABAT DEFINE GAST INFO-VAR I"FO=HEAT VARIABLEDUTY STREAM=QGAS SPEC "GAST" TO "O.DO" TOL-SPEC "5 ." VARY BLOCK-VAR BLOCK=GASIFIER VARIABLE=TEMP SE"IENCE=PARAM LIMITS 1200." "2000."
DESIGN-SPEC AIRTOFLU DEFINE WOODT STREAM-VAR S"R,EAM=DRYWOOD SUBSTREAM=MIXED &
VARIABLE=TEMP SPEC "WOODT1 TO "155"

TOL-SPEC "1 .O" VARY STREAM-VAR STREAM=DRYRAIR SUBSTREAM=MIXED &
VARIABLE-MASS-FLOW LIMITS "12" "40"
DESIGN-SPEC RECYCLE DEFINE H2F'RAC MOLE-FRAC STREAM=TOPSAB SUBSTREAM=MIXED &
COMPONENT=H2 SPEC "H2FRAC" TO ".7" TOL-SPEC ".01" VARY BLOCK-VAR BLOCK=RECSPLT SENTENCE=FRAC VARID-IBLE=FRAC &
LIMITS ".1" ".5" IDl=H2RECYCL
DESIGN-SPEC SANDREC DEFINE QNONE INFO-VAR INFOzHEAT VARIABLEDUTY STREAM=QCOMB SPEC "QNONE" TO "O.DO" TOL-SPEC 'I 10." VARY STREAM-VAR STREAM=SANDSUPP SUBSTFEAM=CISOLID &
VARIABLE=MASS-FlOW LIMITS "0.01 "40."
DESIGN-SPEC STMGEN6 DEFINE STMT STREAM-VAR STREAM=STEAMS SUBSTREAM=MIXED
VARIABLE=TEMP SPEC "STMT TO "360" TOL-SPEC 1 'I VARY STREAM-VAR STFEAM=BFWS SUBSTREAM=MIXED &
VARIABLEMASS-FLOW LIMITS ".70" ".85"
DESIGN-SPEC STMGENS DEFINE STMT STREAM-VAR SlREiAM=STEAM6 SUBSTREAM=MMED
VARIABLE=TEMP SPEC "STMT TO "490" TOL-SPEC "1 'I VARY STREAM-VAR STREAM=BFW6 SUBSTREAM=MIXED &
VANABLEMASS-FLOW LIMITS ".2" 'l.3"
&
&
FORTRAN COMBAIRT DEF"E BLTEMP BLOCK-VAR BLOCK=AIRHEAT VARIABLETEMP &
SENTENCEPARAM
VARIABLE=TEMP DEFINE STRTEM STREAM-VAR STREAM=COMBAIR2 SUBS"RE%M=MIXED 8~
F BLTEMP=STRTEM * EXECUTE AFTER BLOCK AIRCOMPl
FORTRAN GASTEMP DEFINE TGAS BLOCK-VAR BLOCK=GASIFTER VARIABLETEMP &

SENTENCEkPARAM
SENTE"E=REAL ELEMENT=l DEFINE 'LIST BLOCK-VAR BLOCK=GASIFIER VARIABLbVALUE-LIST &
F TLIST=TGAS F F
WRITE(NHSTRY,*) WRITE: TLIST = ',TLIST WRTTE(NHSTRY,*) WRITE: TGAS = ',TGAS
READ-VARS TGAS WRITE-VARS TLIST
F O K I " OF'FAIR DEFINE €32 MOLE-FLOW STREAM=OFFGAS SUBSTREAM=MIXED &
COMPONENT=H2
COMPONEW=CO
COMPONENT=CH4
COMPONENT=C2H6
COMPONWI"TC2H4
COMPONENT=C2H2
DEFINE CO MOLE-FLOW STREAM=OFFGAS SUBSTREAM=MIXED &
DEFINE CH4 MOLE-FLOW STREAM=OF'FGAS SUBSTREAM=MKED & I
DEFINE C2H6 MOLE-FLOW STREAM=OFFGAS SUBSTREAM=MIXED &
DEFINE C2H4 MOLE-FLOW STREAM=OFFGAS SUBSTREAM=MIXED &
DEFINE C2H2 MOLE-=OW STREAM=OFFGAS SUBSTREAM=MULED &
DEF"E ARFZO STREAM-VAR STREAM=OFFAIRl SUBSTREAM=MIXED & VARIABLbMOLE-FLOW
DEFINE 02FRAC MOLE-FRAC S'IREAM=OFFAIRl SUBSTREAM=MIXED & COMPONENT=02 02MOL=( .5 *H2+.5 *C0+2*CH4+3.5 *C2H6+3 *C2H4+2.5 *C2H2) F
F AIRFL,O=l.l5*02MOU02FRAC EXl3CUTE BEFORE BLOCK OFFCOMB
FORTRAN PRESDROP DEFINE P1 STREAM-VAR STREAM=SYNCOMPD SUBSTREAM=MIXED &
VARIABLEPRES
SENTENCE=PARAM
SENTENCEPARAM
SENTENCE=PARAM
DEFINE HTPRES BLOCK-VAR BLOCKGHTSHIFT VARIABLE=PRES &
DEFINE LTPRES BLOCK-VAR BLOCK=LTSH:IFT VARIABLE=PRES &
DEFINE PRIMP BLOCK-VAR BLOCK=PRIMARY VARIABLEPRES &
F PRIMP= 0.95 * P1 F F
HTPRES = 0.85 * PRIMP LTPRES = 0.85 * HTPRES
FSECUTE AFTER BLOCK PRIMARY
FORTRAN REFSTM DEFINE STM MOLE-FLOW STREAM=REFSTMA SUBSTR.EA.M=MIXED &
COMPONJWI"TH20
COMPO"T=TAR
COMPONENT=CO
COMPONENT=CH4
DEFINE TAR MOLE-FLOW STREAM=TOREFHOT SUBSTREAM=MIXED &
DEFINE CO MOLE--OW STREAM=TORET;HOT SUBSTREAM=MIXED &
DEFINE CH4 MOLE-FLOW STREAM=TOREFHOT SUBSTREAM=MIXED &
DEFINE C2H6 MOLE-FLOW STREAM=TOREFHOT SUBSTREAM=MIXED &

COMPO"T=C2H6
COMPONENT=C2H4
COMPONENT=C2H2
COMPONENT=H20
DEF'INE C2H4 MOLE-FLOW STREAM=TOREFHOT SUBSTREAM=MIXED &
DEFINE C2H2 MOLE-FLOW S"REAM=TOREFHOT SUBSTREAM=MIXED &
DEFINE EXIST MOLE-FLOW STREAM=TOREF'HOT SUBSTREAM=MIXED &
F STM=3*( lO*TAR+CO+l *CH4+2*C2H6+2*C2H4+2*C2H2)-EXIST EXECUTE BEFORE BLOCK PRIMARY
FORTRAN SETCSEP DEFINE TEMPLN STREAM-VAR STREAM=WOODGAS SUBSTFtEAM=MIXED &
VARIABLIbTEMP DEFTNE TSEP BLOCK-VAR BLOCK=CHARSEP VARIABLETEMP &
SENTENCEkFLASH-SPECS IDlZCHAR DEFINE TSEPG BLOCK-VAR BLOCK=CHARSEP VARLABLETEMP &
SEI"CIE=KASH-SPECS IDl=SYNGAS TSEP =TEMPIN TSEPG = TEMPIN
READ-VARS TEMPIN WRITE-VARS TSEP TSEPG
I
FORTRAN STEAMAMT DEFINE STEAM MASS-FXOW STREAM=GASIFSTM SUBSTREAM=MIXED
COMPONENT=HZO
COMPONENT=WOOD STEiAM = 0.4 * WOOD
DEFINE WOOD MASS-FLOW STREAM=WOOD SUBSTREAM=NC &
F READ-VARS WOOD WRITE-VARS STEAM
&
FORTRAN WOODDRY DEFINE REALNC STREAM-VAR STREAM=WOOD SUBSTREAM=NC &
VARIABLEMASS-FLOW D E m REALMI STREAM-VAR STREAhbWOOD SUBSTREAM=MUCED &
VARIABLbMASS-FLOW DEFINE REALCI STREAM-VAR STREAM=WOOD SUBSTREAM=CISOLID &
VARIABLE=MASS-FkOW DEFINE NEWNC STREAM-VAR STREAM=ARWOOD SUBSTREKM=NC &
VARLABLE-MASS-FLOW DEFTNE l " M I X STREAM-VAR STREAM=ARWOOD SUBSTREAM=MIXED &
VARIABLEMASS-FLOW DEFINE NEWCI STREAM-VAR STREAM=ARWOOD SUBSTREAM=CISOLID &
VARLABLkMASS-FLOW DEFINE NEWH20 MASS-FLOW STREAM=ARWOOD SUBSTREAM=MIXED &
COMPONENT=H20 F NEWNC=REALNC F F F NEWCI=FtEALCI
N E W 2 0 = 0.78 * MALNC NEWMIX = REAL,MI + NEWH20
EXECUTE BEFORE BLOCK WOODSEP

FORTRAN XSAIR DEFINE PCARB MOLE-FLOW STRIEAhkCHARCOMP SUBSTREAM=CISOLFD
COMPONENT=CARBON
COMPONENT=H2 DEFINE PHYDRO MOLE-FLOW STREAM=CHARCOMP SUBSTREAM=MIXED
F F
DEFTNE PSULF MOLE-FLOW S'"RJZAM=CHARCOMP SUBSTREAM=CISOLID & COMPONENT=SULFUR
DEFINE A I W O STMXM-VAR STREAM=COMBAIR SUBSTREAM=MMED & VARIABLEMOLE-FLOW
DEFI"E 02FRAC MOLE-FXAC STREAM=COMBAIR SOBSTREAM=MIXED & COMPO"T=O2 02MOL = PCARB + 0.5*PHYDRO + PSULF AIRFLO = 1.2 * 02MOL 1 02FRAC
READ-VARS PCARB PHYDRO PSmF 02FRAC WRITE-VARS AIRFLO
COW-OPTIONS PARAM CHECKSEQ=NO
CONVERGENCE C-GASSTM WEGSTEIN TEAR GASIFSTM
CONWXGENCE C-H2REE WEGSTEIN TEAR H 2 m c Y c L
CONVERGENCE C-SAND WEGSTEIN TEAR SAND .0010 PARAM MAXITz50 QMIN=-5.0
CONVERGENCE MIXTEAR WEGSTEIN TEAR 207
CONVERGENCE C-AIRF;LU SECANT SPEC AIRTOFLU
CONVERGENCE C-QGAS SECANT SPEC ADIABAT
CONVERGENCE C-SANDR SECANT SPEC SANDREC
CONVERGENCE HZSPLT SECANT SPEC RECYCLE
CONVERGENCE STMGEN6 SECANT SPEC STMGEN6
&
&
CONVERGENCE STMGEN8 SECANT SPEC STMGENS
Appendix B: Economic Analysis Cost Sheets


Appendix C : Process Stream Summary


REPORT DOCUMENTATION PAGE
1 I AGENCY USE ONLY (Leave blank)
Form Approved I OMB NO. 0704-0 188
2. REPORT DATE 3. REPORT TYPE AND DATES COVERED
9. SPONSORING/MONITORING AGENCY NAME61 AND ADDRESS(ES)
National Renewable Energy Laboratory
Golden, CO 80401-3393 16 17 Cole Boulevard
1 August 1995 I Technical Report
4. TITLE AND SUBTITLE Technical and Economic Assessment of Producing Hydrogen by Reforming Syngas from the Battelle Indirectly Heated Biomass Gasifier.
DE95009275
10. SPONSORING/MONITORING AGENCY REPORT NUMBER
NRELTTP-43 1 -8 143
6 . AUTHORW Margaret K. Mann
14. SUBJECT TERMS
5. FUNDING NUMBERS
15. NUMBER OF PAGES
(C) (TA) HY 5 1.4041
17. SECURITY CLASSIFICATION
Unclassified OF REPORT
7. PERFORMING ORGANIZATION NAME61 AND ADDRESS(ES1
1 8. SECURITY CLASSIFICATION 19. SECURITY CLASSIFICATION 20. LIMITATION OF ABSTRACT OF THIS PAGE OF ABSTRACT
8. PERFORMING ORGANIZATION REPORT NUMBER
I
11. SUPPLEMENTARY NOTES
1 2a. DlSTRlBUTtON/AVAILABILITY STATEMENT
National Technical Information Service U.S. Department of Commerce 5285 Port Royal Road Springfield, VA 221 61
12b. DISTRIBUTION CODE
UC-1311
I biomass, gasifiers, hydrogen production 126
16. PRICE CODE
NSN 7540-01 -280-5500 Standard Form 298 (Rev. 2-89) Prescribed by ANSI Std. 239-1 8
298-1 02