techical report -...
TRANSCRIPT

1
Techical Report

2
3
Environmental Sustainability Indicators 2012First published 2009
© Department of Environmental Affairs
ISBN 978-0-621-41639-8
This document may be reproduced in whole or in part for educational or non-profit purposes without special permission from the copyright holder, provided that acknowledgement of the source is made. No use of this publication may be made for resale or for any other commercial purpose whatsoever without prior written permission from the Department of Environmental Affairs.
Suggested citation
Department of Environmental Affairs. 2012. Environmental Sustainability Indicators, Technical Report 2012. Department of Environmental Affairs, Pretoria. 192pp.
Publication
This publication is available on the website of the Department of Environmental Affairs at www.environment.gov.za. A charge may be made according to the pricing policy, which is available on the website.
For further information, please contact
Department of Environmental AffairsPrivate Bag X447Pretoria 0001Republic of South Africa
Web site: http://www.environment.gov.zaWeb site: http://soer.environment.gov.za

4
Disclaimer
This report is based on information gathered by the project team. The views it contains are not necessarily those of Government. The Department of Environmental Affairs and other agencies do not accept responsibility in respect of any information or advice given in relation to, or as a consequence of anything contained herein.
Every effort has been made to contact and acknowledge copyright holders. However, should any infringement have inadvertently occurred, the Department of Environmental Affairs wishes to be notified. We take this opportunity to offer our apologies. In the event of a reprint, any errors will be corrected.
For a listing of errors or omissions in this report found subsequent to printing, please visit our website at http://www.environment.gov.za.
Team for preparation of the Environmental Sustainability Indicators 2012
Senior Policy Advisor: Ms Anna MampyeContributors: Leanne Richards, Anna Mampye, Ngodiseni Madadzhe, Fulufhelo Mavhungu and Fhumulani MalumeCover and layout design: Leanne Richards, Ngodiseni Madadzhe and Communications (Department of Environmental Affairs)

5
Acknowledgements
This report was compiled in collaboration with many organizations and institutions that are acknowledged and sincerely thanked for their contributions. The project team acknowledges the invaluable contributions made by many organizations and individuals who provided data and information that was used as the basis for this report. All sources of data are acknowledged and referenced where they appear in the report.
Quality Review:Anna Mampye (Directorate Sustainability Reporting and Environmental Statistics)Leanne Richards (Directorate Sustainability Reporting and Environmental Statistics)Ngodiseni Madadzhe (Directorate Sustainability Reporting and Environmental Statistics)
Graphic design and layout: Leanne Richards, Ngodiseni Madadzhe and Communications (Department of Environmental Affairs)
Graph editing and formatting:Ngodiseni Madadzhe (Department of Environmental Affairs)
Map editting and formatting:Deon Marais (Department of Environmental Affairs)Cecily van der Berg (Department of Environmental Affairs)
Cover and theme pages images: Theme page imagesState of Environmental Systems: Pin Cusion 01302230Environmental Stresses: Hermanus Early Morning 01302686Human Vulnerability to Environmental Change: Namaqua Flower 01302103Social and Institutional Capacity to cope: Union Building 01301196Capability to Respond to Global Stewardship Collectively: Sea Point Dusk 01302024
6
Table of ContentsList of Tables 10
List of Figures 13
INTRODUCTION 16
Environmental sustainability indicators 16
The environmental sustainability framework 17
Indicator framework 19
Goals and targets 20
References and other information 21
STATE OF ENVIRONMENTAL SYSTEMS 22
Air Quality 25
Domestic fuel burning 25
Biodiversity 30
Threatened bird, mammal, amphibian and reptile species (known) 30
Threat and protection status of vegetation types per biome 34
Land 38
Degraded and transformed land 38
Marine 41
Status of west coast rock lobster 41
Catches of selected marine species (harvesting) 45

7
Marine protected areas (MPAs) 48
Freshwater 51
Available water per capita 51
Capacity and levels of dams in South Africa 54
Freshwater quality 57
Groundwater 61
Groundwater quantity 61
Groundwater quality 63
REDUCING ENVIRONMENTAL STRESSES 66
Air pollution 67
Coal consumption 69
Vehicles in use per populated area 73
Ecosystem stress 77
Invasion of alien species 77
Population pressure 81
Percentage change in projected population, 1950–2050 81
Total fertility rate (TFR) 86
Migration 88

8
Waste and consumption pressures 92
Ecological footprint 92
Energy use 96
Grazing capacity 98
Water stress 100Fertilizer sales 100Water stress 102
HUMAN VULNERABILITY TO ENVIRONMENTAL CHANGE 106Basic human sustenance 108Households with access to sanitation 109Access to water 113Access to refuse removal 117
Environmental health 120Death rate from respiratory diseases and tuberculosis 120HIV prevalence 123Malaria 127Under 5 mortality 130 SOCIAL AND INSTITUTIONAL CAPACITY 134Energy efficiency 135Eco efficiency 137Hydropower and renewable energy production as a percentage of total energy consumption 141

9
Environmental governance 146Percentage of total land area under protected status 146Percentage of variables missing from the “Rio to Joburg dashboard” 149
Private sector responsiveness 152Environmental management systems 152
Science and technology 155
Budget for the environment 155
Digital access index (DAI) 157
Number of researchers per 1 000 total employment 161
Budget for research and development (R&D) 165
Gross tertiary enrolment rate 167
Education (primary, secondary and adult basic education and training (ABET)) 170
GLOBAL STEWARDSHIP 174
Greenhouse gas emissions 176
Carbon emissions per capita 176
Participation in international collaborative efforts 179
Multilateral environmental agreements 179
Reducing transboundary environmental pressures 183
Production and consumption of CFCs 183
Transfrontier Conservation Areas (TFCAs) 190

10
List of Tables
STATE OF ENVIRONMENTAL SYSTEMS 22
Table 1: Households by energy source for cooking (2002–2012) 27
Table 2: Households by energy source for heating (2002–2012) 28
Table 3: Households by energy source for lighting (2002–2012) 29
Table 4: Number of species status in each category 33
Table 5: Area (hectares and percentage) covered by different land cover categories 39
Table 6: The total kilogram (nominal mass) of South African pelagic catches and seaweed collection 47
Table 7: Estimated population and water availability (m3/capita) in Southern African countries in 2001 and 2030 53
Table 8: Average levels of dams in South Africa (2000–2012) 55
ENVIRONMENTAL STRESSES 66
Table 9: Consumption of coal (Kt) 72
Table 10: Vehicle population (2000–2012) 76
Table 11: Estimated annual population growth (2001–2021) 83
Table 12: Population growth (1950–2050) 84
Table 13: Estimated total fertility rates (2001–2013) 87
Table 14: Estimated provincial migration streams (2001–2006) 91
Table 15: Estimated provincial migration streams (2006–2011) 91
Table 16: Ecological Footprint (global hectares per person) 95
Table 17: Reconciliation of the requirements for and availability of water for year 2025 (million m3/a) 104
11
HUMAN VULNERABILITY TO ENVIRONMENTAL CHANGE 106
Table 18: Percentage of households (HH) with access to basic sanitation services 110
Table 19: Number of households using the bucket system 112
Table 20: Percentage of households (HH) with access to water infrastructure (no access, below RDP and above or equal to RDP levels) 115
Table 21: Number of households in each province with different access levels to refuse removal (2002–2012) 118
Table 22: Percentage of households who have their refuse removed by the municipality (2002–2012) 119
Table 23: Number of deaths resulting from respiratory diseases and tuberculosis (1997–2010) 122
Table 24: HIV prevalence (percentage) in antenatal attendees per province (2001–2011) 125
Table 25: Number of malaria cases, deaths and fatality rate (1996–2012) 129
Table 26: Number of deaths by age and year of death (1997–2010) 132
SOCIAL AND INSTITUTIONAL CAPACITY TO COPE 134
Table 27: Energy intensity 139
Table 28: Hydroelectric capacity in South Africa 143
Table 29: Total primary energy supply TJb 144
Table 30: Percentage of variables missing from the Rio to Joburg dashboard for selected countries 151
Table 31: Number of researchers and research and development personnel (R&D) expressed as a percentage of gross domestic product (GDP) 163
Table 32: The total number of learners enrolled into public schools (primary and secondary combined) and into the adult basic education and
training centres 172

12
CAPABILITY TO RESPOND TO GLOBAL STEWARDSHIP COLLECTIVELY 174
Table 33: Carbon emissions (1991–2010) 178
Table 34: Examples of multilateral environmental agreements signed 180
Table 35: Numbers of agreements signed and in force 182
Table 36: Consumption of ozone depleting substances in ODP tons for South Africa 188
Table 37: Production in ODP tons for South Africa 189
Table 38: Transfrontier Conservation Area names and information regarding establishment date, area currently occupied and bordering countries 192
13
List of Figures
STATE OF ENVIRONMENTAL SYSTEMS 22
Figure 1: Households by energy source used for cooking (2002–2012) 27
Figure 2: Households by energy source used for heating (2002–2012) 28
Figure 3: Households by energy source used for lighting (2002–2012) 29
Figure 4: The threat status of vegetation types in the nine biomes of South Africa 36
Figure 5: The protection status of the nine biomes of South Africa 37
Figure 6: Aggregated land cover classes as a percentage of all land cover classes 40
Figure 7: Annual commercial landings of west coast rock lobster (1890–2000) 43
Figure 8: Annual commercial landings of west coast rock lobster (2004–2012) 44
Figure 9: The total amount of nominal mass landed for both inshore and deep-sea trawl catches (2001–2012) 46
Figure 10: The current threat status of biozones in South African waters 49
Figure 11: The current protection status of biozones in South African waters 50
Figure 12: Total capacity and level (106 m3) of dams in South Africa 56
Figure 13: Mean annual phosphorus concentration (mg/l) for each drainage region (2000–2012) 59
Figure 14: Average Chlorophyll A concentration for each drainage region measured (2000–2012) 60
Figure 15: Ground water quality of the nine provinces in South Africa measured (2000–2012) 65

14
REDUCING ENVIRONMENTAL STRESSES 66
Figure 16: Coal consumption (Kt) in various sectors in South Africa (1995–2009) 71
Figure 17: Total percentage of vehicles per populated area (2000–2012) 75
Figure 18: Number of hectares cleared in initial and follow-up attempts by the Working for Water programme 80
Figure 19: Population growth rate (1950–2050) 85
Figure 20: Estimated total fertility rates in South Africa (2001–2013) 87
Figure 21: Provincial emigration and immigration rated (2001–2006) 89
Figure 22: Estimated provincial migration streams (2006–2011) 90
Figure 23: South Africa’s ecological footprint, bio-capacity and ecological reserve or deficit compared to that of the world and Africa 94
Figure 24: Primary energy supply from fossil fuels and non-fossil fuels (1992–2009) 97
Figure 25: Long term grazing capacity (hectares/large stock unit) 99
Figure 26: Metric tons of fertilizer sales in South Africa from (1955–2010) 101
Figure 27: Projected water surpluses and deficits in the 19 water management areas by 2025 103
HUMAN VULNERABILITY TO ENVIRONMENTAL CHANGE 106
Figure 28: Percentage of households with access to basic sanitation services 111
Figure 29: Percentage of households with no access, access below and access equal to or above RDP levels to water infrastructure 116
Figure 30: Death rate from respiratory diseases and tuberculosis (1997–2010) 122
Figure 31: HIV prevalence in antenatal attendees per province from (2001–2011) 124
Figure 32: HIV prevalence (percentage) among antenatal attendees aged 15–49 (1990–2011) 125
Figure 33: HIV prevalence in the South African population (2001–2011) 126
Figure 34: Total number of reported malaria cases in South Africa (1996–2012) 129
Figure 35: Average number of deaths in each age class (1997–2010) 133

15
SOCIAL AND INSTITUTIONAL CAPACITY TO COPE 134
Figure 36: Energy intensity depicted as TJ/R measured (2000–2009) 140
Figure 37: Hydropower and renewable energy production in South Africa measured as a percentage of total energy contribution 145
Figure 38: Protected areas in South Africa 148
Figure 39: Number of businesses in each province with ISO 14001 accreditation 154
Figure 40: Budget allocated to different sectors in the environmental field in R1 000’s (2001–2013) 156
Figure 41: Access to internet by Province (2009–2012) 159
Figure 42: Private access to ICTs per municipality 160
Figure 43: Number of reseachers and research and development personnel in South Africa (2001–2011) 164
Figure 44: Gross expenditure on research and development as a percentage of gross domestic product 166
Figure 45: Percentage of students enrolled in each main study area 168
Figure 46: Percentage people enrolled into tertiary education out of the total South African population 169
Figure 47: Gross Enrolment Rate (GER) in primary and secondary schools (2003-2011) 171
CABILITY TO RESPOND TO GLOBAL STEWARDSHIP COLLECTIVELY 162
Figure 48: Total carbon emissions per capita in metric tons 178
Figure 49: Production and consumption of ozone depleting substances (CFC’s) in South Africa (1986–2012) 185
Figure 50: Production and consumption of Methyl Bromide in ODP tons (1991–2012) 186
Figure 51: Production and consumption of HCFC’s in ODP tons (1986–2012) 187
Figure 52: Distribution of Transfrontier Concervation Areas in South Africa and neighbouring countries 191

16
INTRODUCTION
Since the publication of the Brundtland Report in 1987, attempts have been made to capture the concept of sustainable development in statistics. Policy makers on all continents are trying to identify indicators that would reflect prosperity, well-being and sustainability. The Department of Environmental Affairs has contributed to this movement by participating in testing indicators of sustainable development proposed by the United Nations Commission on Sustainable Development, and by develop-ing both national and local environmental indicators for environmental reporting in South Africa.
During 2013 the Department comissioned a study to compile a Monitoring and Evaluation report for the National Strategy for Sustainable Development and Action Plan (NSSD). This Monitoring and Evaluation report will focus on all those indicators listed in the NSSD report and will further-more provide an indication on the suitability of these indicators to accurately reflect on the state of sustainability within the country. The outcome of this initiative will support the development of the Second National Strategy for Sustainable Development (NSSD II).
Environmental sustainability indicators
The first Environmental Sustainability Indicator Technical Report was published in 2009 and subsequently updated on an annual basis. The current report is an update of indicators contained in the 2011 report and is available for download on http://soer.environment.gov.za. This report will be the final publication as a consolidated envi-ronmental sustaiability indicator report. Indicators reflected in this report will still be updated on an annual basis and can be downloaded as individual indicator reports from the Enviroindicator portal accessible via http://enviroindicator.environment.gov.za.
This report integrates 9 datasets into a set of 20 indicators of environmental sustainability. The purpose of these indicators is to provide information on our ability to protect our environment over the next decades. In addition, the indicators reflect key factors determining the state of the environment, and show whether we are moving towards environmental sustainability or not.
The indicators and variables build on the “Pressure-State-Response” (PSR) environmental policy model and the DPSIR variant that includes Driving Forces and Impacts, both of which are also used for reporting on the state of the environment. The indicators and variables used were selected through an extensive review of international and national environmental literature, assessment of available data, consultations through MINTEC Working Group 3 and by hosting a National Workshop on 15 April 2008 to discuss and reflect on potential indicators and variables. In selecting these indicators, existing indicators from the following national and international sources were considered:
• Sustainable development indicators from the United Nations Commission on Sustainable Development (1998) • Environmental Vulnerability indicators developed by the United Nations Environmental Programme (2004) • Indicators used in the Environmental Performance Index developed by Yale University (2005) • Indicators related to the Millennium Development Goals (2003) • Indicators from the Johannesburg Plan of Implementation (2002)

17
• Indicators developed under International Environmental Agreements for example the Convention on Biological Diversity (1999), the Montreal Protocol (1987) • Indicators from the Government Wide Monitoring and Evaluation System (2004) • Environmental Indicators for National State of the Environment Reporting (2002) • The set of Local Environmental Indicators developed by the Department of Environmental Affairs and Tourism (2004) • The Key Performance Indicators developed by the Department of Provincial and Local Government (2005)
• Coastal and Marine indicators developed as part of the State of the Coast Initiative (2006) • Indicators used in the National State of the Environment Report (2006) • Indicators used in the National Spatial Biodiversity Assessment (2005) and the Millennium Ecosystem Assessment (2004) • Biodiversity indicators developed by the South African Biodiversity Institute (2011)
The environmental sustainability framework
The indicators and variables included in this document focus on the state of environmental systems. They also measure stresses on environmental systems such as natural resource depletion and pollution. There are also indicators that measure impacts and responses and human vulnerability to environmental change. In addition, there are indicators that track society’s capacity to cope with environmental stresses and our contribution to global stewardship.
In order to present the indicators and variables in a meaningful way, they have been grouped into five components of environmental sustainability.
The concept of environmental sustainability, in its broadest context, can be separated into the following five components which are considered necessary conditions for environmental sustainability. These components include:
• The state of environmental systems. Environmental sustainability can only be realized if vital environmental systems are maintained at healthy levels. • The stresses on environmental systems. Environmental sustainability can only be realised if levels of human impacts are low enough not to cause harm to environmental systems. • Human vulnerability to environmental change. Environmental sustainability can only be realised if people and social systems are not vulnerable to environmental change. • The social and institutional capacity to cope with environmental change. Environmental sustainability can only be realised if the necessary institutional capacity and underlying social patterns of skills, attitudes and networks that foster effective responses to environmental challenges exist.

18
• The ability to respond to the demands of global stewardship. Environmental sustainability can only be realised if there is cooperation with other countries to manage common environmental problems.
Each of the components, in turn, encompasses between two and six indicators of environmental sustainability. These 20 indicators are the fundamental building blocks of environmental sustainability – and it is these 20 indicators and their associated variables that provide us with some measure of environmental sustainability.
The set of environmental sustainability indicators and variables presented in this report is provisional as it needs national testing, evaluation and further discussion, including discussion on what additional indicators may be necessary to describe environmental sustainability more comprehensively. Due to data gaps and conceptual limitation, the indicator set falls short of the ideal. The indicators presented here should therefore be seen as a first step. Over the following years, the set needs to be improved to enable us to measure environmental sustainability more fully.
More information with regards to environmental sustainability indicators can be viewed on the environmental indicators website hosted by the Department of Environmental Affairs on http://enviroindicator.environment.gov.za.

19
Indicator number Indicator Variable number Variable description Page
Envi
ronm
enta
l sy
stem
s
1 Air quality 1 Domestic fuel burning 252 Biodiversity 2 Threatened bird, mammal, amphibian and reptile species (known) 30
3 Threat and protection status of vegetation types per biome 343 Land 4 Degraded and transformed land 384
Marine5 Status of west coast rock lobster 416 Catches of selected marine species (harvesting) 457 Marine protected areas 48
5Freshwater
8 Available water per capita 519 Capacity and levels of dams in South Africa 54
10 Freshwater quality 576 Groundwater 11 Groundwater quantity 61
12 Groundwater quality 63
Redu
cing
en
viro
nmen
tal s
tres
ses
7 Air pollution 13 Coal consumption 6914 Vehicles in use per populated area 73
8 Ecosystem stress 15 Invasion of alien species 779
Population pressure16 Percentage change in projected population, 1950–2050 8117 Total fertility rate (TFR) 8618 Migration 88
10Waste and consumption pressures
19 Ecological footprint 9220 Energy use 9621 Grazing capacity 98
11 Water stress 22 Fertelizer sales 10023 Water stress 102
Redu
cing
hu
man
vu
lner
abili
ty
12Basic human sustenance
24 Households with access to sanitation 10925 Access to water 11326 Access to refuse removal 117
13
Environmental health
27 Death rate from respiratory diseases and tuberculosis 12028 HIV prevalence 12329 Malaria 12730 Under 5 mortality 130
Soci
al a
nd in
stitu
tiona
l ca
paci
ty
14 Energy efficiency 31 Eco efficiency 13732 Hydropower and renewable energy production as percentage of total energy consumption 141
15 Environmental governance 33 Percentage of total land area under protected status 14634 Percentage of variables missing from the “Rio to Joburg Dashboard” 149
16 Private sector responsiveness 35 Environmental management systems 15217
Science and technology
36 Budget for the environment 15537 Digital access index 15738 Number of researchers per 1 000 total employment 16139 Budget for research and development (R&D) 16540 Gross tertiary enrolment rate 16741 Education (primary, secondary and adult basic education and training) 170
Glo
bal
stew
-ar
dshi
p 18 Greenhouse gas emissions 42 Carbon emissions per capita 17619 Participation in international collaborative efforts 43 Multilateral environmental agreements 17920
Reducing transboundary environmental pressures44 Production and consumption of CFCs 18345 Transfrontier concervation areas (TFCAs) 190

20
Goals and Targets
Various initiatives designed to promote sustainable development have been adopted by South Africa. Some of these initiatives include the Millennium Declaration, Johannesburg Plan of Implementation and the South African Outcomes Based Approach adopted by cabinet in January 2010.
The Johannesburg Plan of Implementation identifies sustainability effects and outcomes in the form of implementation plans which promote the integration of the three components of sustainable development – economic development, social development and environmental protection. Plans relevant to the South Africa context include:
• Poverty eradication • Changing unsustainable patterns of consumption and production • Protecting and managing the natural resources base of economic and social development • Sustainable development in a globalizing world • Health and sustainable development • Sustainable development in Africa • Means of implementation • Institutional framework for sustainable development
Embedded in the Millennium Declaration of 2000, which was adopted by 147 heads of state and 189 countries, are eight Millennium Development Goals, including 18 time-bound targets. These goals are:
Goal 1: Eradicate extreme poverty and hunger Goal 2: Achieve universal primary education Goal 3: Promote gender equality and empower women Goal 4: Reduce child mortality Goal 5: Improve maternal health Goal 6: Combat HIV and AIDS, malaria and other diseases Goal 7: Ensure environmental sustainability Goal 8: Develop a global partnership for development
The goals and targets are interrelated with the overarching goal of creating an environment that is conducive to development and the elimination of poverty. Although environmental sustainability is captured in Goal 7, environmental dimensions are contained in all the goals.
21
Goal 7 is underpinned by three targets and eight indicators, of which 5 have been included in this set of indicators. This set of environmental indicators also relates, directly or indirectly, to 5 of the targets identified in the Plan of Implementation for the World Summit on Sustainable Development.
During 2010 the South African Government agreed on 12 outcomes which outline the main strategic priorities of government between 2010 and 2014 and are refered to as the Outcomes Based Approach. These 12 outcomes each encompass a number of measurable outputs with associated targets. Outcome 10 specifically focuses on Environmental Assets and the protection and continual enhancement of the country’s natural resources. This outcome consists of four outputs with a total of 18 sub-outputs and 41 indicators. The four main outputs outlined under Outcome 10 are:
Output 1: Enhanced quality and quantity of water resourcesOutput 2: Reduced Greenhouse gas emissions, climate change and improved air/atmospheric qualityOutput 3: Sustainable environmental managementOutput 4: Biodiversity protected
References and other information
Esty, DC, Levy, M, Srebotnjak, T and de Sherbinin, A, 2005. 2005 Environmental Sustainability Index. New Haven: Yale Center for Environmental Law & Policy.
South Africa, 2002. Environmental Indicators for National State of the Environment Reporting: South Africa 2002. Department of Environmental Affairs and Tourism, Pretoria.
Department of Environmental Affairs and Toursim 2006. South Africa Environment Outlook. A report on the state of the environment. Department of Environmental Affairs and Toursim, Pretoria.
United Nations, 2000. United Nations Millennium Declaration. http://www.developmentgoals.org
United Nations, 2002. World Summit on Sustainable Development: Johannesburg Plan of Implementation. http://www.un.org/esa/sustdev/
Department of Environmental Affairs (DEA) 2012. Delivery Agreement for Outcome 10: Environmental Assets and Natural Resource protected and continually enhanced.

22
23
IntroductionEnvironmental sustainability can only be realized if vital environmental systems are maintained at healthy levels. The state or condition of environmental systems and natural resources are affected by both natural conditions and human activities.
Some systems or resources may appear degraded as a result of natural conditions in the environment, whilst others may appear degraded due to human activities such as the release of pollutants, or over-extraction of a particular resource.
State of Environmental SystemsThe state of environmental systems should be monitored through time in order to track movement towards or away from environmental sustainability. The state or cur-rent condition is affected either by natural or human-induced change. It is only our knowledge of change in the environment that will enable us to manage that change effectively.
Environmental systems and resources include air, water and land, as well as biodiversity. Human activities influence these systems and resources through many dif-ferent ways, including through industry, human settlements, economic activities and agricultural activities. Natural resource depletion through over-exploitation also contributes to the state of these systems.
Environmental systems do not have an infinite capacity for accommodating wastes and pollution. Certain systems will be able to accommodate higher levels of waste than others, and over-exploitation of a system may reduce its ability to absorb wastes and pollution.
The indicators and variables representing the state of environmental systems are:
• Air quality - Domestic fuel burning
• Biodiversity - Threatened bird, mammal, amphibian and reptile species (known) - Threat and protection status of vegetation types per biome
• Land - Degraded and transformed land
• Marine - Status of west coast rock lobster - Catches of selected marine species (harvesting) - Marine protected areas (MPAs)
24
• Freshwater - Available water per capita - Capacity and levels of dams in South Africa - Freshwater quality
• Groundwater - Groundwater quantity - Groundwater quality
For further information on the state of environmental systems please refer to the following:
South Africa 2002. Environmental Indicators for National State of the Environment Reporting: South Africa 2002. Department of Environmental Affairs and Tourism, Pretoria. http://soer.environment.gov.za/documents.html
Department of Environmental Affairs and Tourism 2006. South Africa Environment Outlook. A report on the state of the environment. Department of Environmental Affairs and Tourism, Pretoria. http://soer.environment.gov.za/documents.html
United Nations Environment Programme. Global Environment Outlook. http://www.unep.org/geo/
United Nations Environment Programme. Africa Environment Outlook. http://www.unep.org/dewa/Africa/

25
Indicator: Air Quality
Variable: 1
Description: Domestic fuel burning
Units: Number of households by energy source.
Source: Statistics South Africa (Stats SA) 2013. General Household Survey (Statistical release P0318). www.statssa.gov.za. Department of Energy (DoE) 2012. A survey of energy-related behavior and perceptions in South Africa. The Residential Sector 2012 (report).
Logic: Domestic fuel burning is a measure of household fuel combustion, including electricity, gas, paraffin, coal, wood, candles and other sources such as animal dung and solar power. This variable is used as a proxy for indoor air pollution (see limitations). Indoor air pollution has deleterious effects, especially on women who cook inside using solid fuels. High exposure to the fumes from solid fuel combustion is dangerous to human health. Solid fuel use has further consequences for over harvesting of woodlands and soil depletion because of dung collection.
Discussion: The significance of domestic fuel burning emissions is enhanced due to three factors:
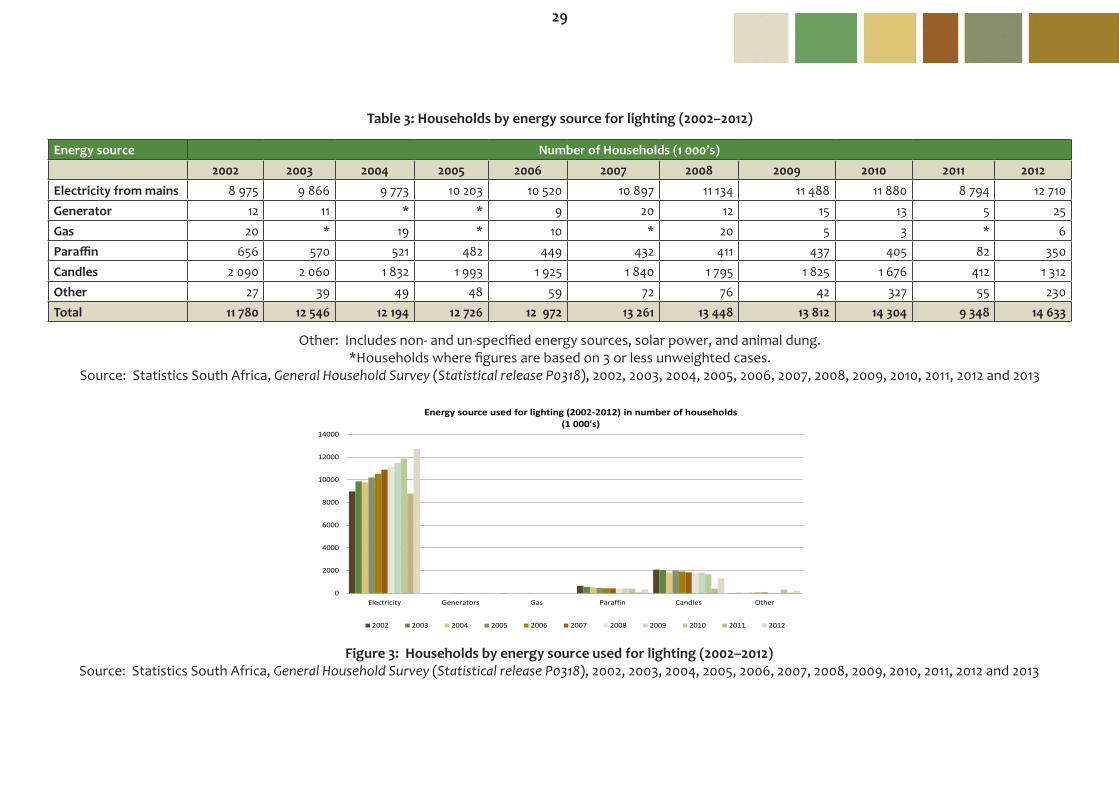
1. The low level of emissions, 2. The coincidence of peak emissions, typically a factor of 10 greater than if total annual emissions were averaged, with periods of poor atmospheric dispersion (i.e. night-time, winter-time), 3. The release of such emissions within high human exposure areas with high contributions to both indoor and outdoor pollution concentrations. The use of solid fuels for cooking and heating on open fires or traditional stoves results in high levels of indoor air pollution. Indoor smoke contains a range of health damaging pollutants such as small particles and carbon monoxide. Domestic fuel burning is a significant source of low level fine particulate and sulphur dioxide (SO2) emissions. This sector also contributes significantly to carbon monoxide (CO), total organic carbon (TOC), benzene emissions, and to greenhouse gas emissions, particularly carbon dioxide and methane (CO2 and CH4). A wide array of factors affect the extent of household fuel combustion, such as population growth, availability of electricity, household income, degree of urbanization, and percentage of informal (non-serviced) households. The main use of energy in households in South Africa is for cooking followed by heating and lighting. The percentage of households connected to the main electricity supply has increased relatively consistently from 77. 1% in 2002 to 85% in 2012. The number of households that use electricity for cooking increased from 6 664 000 in 2002 to 10 954 000 in 2012 (Table 1). Although the use of wood as a source of energy declined from 2 430 000 in 2002 to 1 696 000 in 2012, a noticeably high number of household still use wood for cooking.
26
Almost half (45.1%) of households in Limpopo still used wood for cooking, followed by almost a fifth of all households in Mpumalanga (17.6%) , Eastern Cape (17.3%), and KwaZulu-Natal (16%). Only approximately 0.6% and 0.9% respectively of households in Western Cape and Gauteng used wood for cooking during 2012 (StatsSA 2013). The use of electricity as the main source of energy for cooking was found to be highest in the Western Cape (88.1%) and the Free State (85.9%), and the lowest in the Eastern Cape (64.9%) and Limpopo (49.8%). The Eastern Cape had the highest proportion of households using paraffin (13.1%), followed by North West (11.3%) and Gauteng (10.9%). By contrast, only 2.4% of households in the Western Cape used paraffin for cooking (StatsSA 2013). It is notable that electricity accounted for 75% for cooking, 57% for heating and 87% for lighting of the total energy consumed by the residential sector during 2012, a marked increase since 2002. The remainder of the energy consumed was provided largely by the combustion of wood (11% for cooking, and 21% for heating), and paraffin (7% for cooking, 12% for heating, and 3% for lighting). The use of coal has decreased to 0.8% and 2% for cooking and heating respectively. According to the Department of Energy, 84% of households indicated that they are electrified.
Limitations: This is a proxy indicator for indoor air pollution from solid fuel use for which data is currently unavailable.

27
Energy source Number of Households (1 000’s)2002 2003 2004 2005 2006 2007 2008 2009 2010 2011 2012
Electricity from mains 6 664 7 403 7 234 7 800 8 222 8 729 9 166 9 822 10 170 7 730 10 954Generator 4 * * * 12 * * 8 5 * 9Gas 273 200 202 235 291 292 402 311 306 203 485Paraffin 1 928 1 956 1 845 2 145 2 086 1 864 1 280 1 298 1 267 245 1 131Wood 2 430 2 506 2 420 2 117 2 011 1 977 2 238 2 129 2 041 1 006 1 696Coal 372 343 307 308 271 296 247 182 162 86 111Other 109 138 186 121 79 103 115 62 353 78 245Total 11 780 12 546 12 194 12 726 12 972 13 261 13 448 13 812 14 304 9 348 14 631
Table 1: Households by energy source for cooking (2002–2012)
Other: Includes non- and un-specified energy sources, solar power, candles and animal dung. *Households where figures are based on 3 or less unweighted cases.
Source: Statistics South Africa, General Household Survey (Statistical release P0318), 2002, 2003, 2004, 2005, 2006, 2007, 2008, 2009, 2010, 2011, 2012 and 2013
Figure 1: Households by energy source used for cooking (2002–2012)Source: Statistics South Africa, General Household Survey (Statistical release P0318), 2002, 2003, 2004, 2005, 2006, 2007, 2008, 2009, 2010, 2011, 2012 and 2013
0
2000
4000
6000
8000
10000
12000
Electricity Generator Gas Paraffin Wood Coal Other
Energy source used for cooking (2002-2012) in number of households (1 000's)
2002 2003 2004 2005 2006 2007 2008 2009 2010 2011 2012

28
Energy source Number of Households (1 000’s)2002 2003 2004 2005 2006 2007 2008 2009 2010 2011 2012
Electricity from mains 5 878 6 508 6 054 6 387 6 470 6 773 7 012 7 002 6 524 4 775 6 085Generator 4 * * * 7 * * * 6 4 6Gas 73 77 107 91 119 138 224 174 212 235 396Paraffin 1 342 1 285 1 291 1 579 1 772 1 696 1 290 1 302 1 288 852 1 332Wood 2 916 3 003 3 000 2 613 2 631 2 605 2 923 2 698 2 864 1 418 2 293Coal 624 585 590 557 599 573 504 423 376 233 255Other 943 1 088 1 152 1 499 1 374 1 476 1 495 2 213 3 034 1 831 4 265Total 11 780 12 546 12 194 12 726 12 972 13 261 13 448 13 812 14 304 9 348 14 632
Table 2: Households by energy source for heating (2002–2012)
Other: Includes non- and un-specified energy sources, solar power, candles and animal dung.*Households where figures are based on 3 or less unweighted cases.
Source: Statistics South Africa, General Household Survey (Statistical release P0318), 2002, 2003, 2004, 2005, 2006, 2007, 2008, 2009, 2010, 2011, 2012 and 2013
Figure 2: Households by energy source used for heating (2002–2012)Source: Statistics South Africa, General Household Survey (Statistical release P0318), 2002, 2003, 2004, 2005, 2006, 2007, 2008, 2009, 2010, 2011, 2012 and 2013
0
1000
2000
3000
4000
5000
6000
7000
8000
Electricity Generator Gas Paraffin Wood Coal Other
Energy source used for heating (2002-2012) in number of households (1 000's)
2002 2003 2004 2005 2006 2007 2008 2009 2010 2011 2012
29
Energy source Number of Households (1 000’s)2002 2003 2004 2005 2006 2007 2008 2009 2010 2011 2012
Electricity from mains 8 975 9 866 9 773 10 203 10 520 10 897 11 134 11 488 11 880 8 794 12 710Generator 12 11 * * 9 20 12 15 13 5 25Gas 20 * 19 * 10 * 20 5 3 * 6Paraffin 656 570 521 482 449 432 411 437 405 82 350Candles 2 090 2 060 1 832 1 993 1 925 1 840 1 795 1 825 1 676 412 1 312Other 27 39 49 48 59 72 76 42 327 55 230Total 11 780 12 546 12 194 12 726 12 972 13 261 13 448 13 812 14 304 9 348 14 633
Table 3: Households by energy source for lighting (2002–2012)
Other: Includes non- and un-specified energy sources, solar power, and animal dung.*Households where figures are based on 3 or less unweighted cases.
Source: Statistics South Africa, General Household Survey (Statistical release P0318), 2002, 2003, 2004, 2005, 2006, 2007, 2008, 2009, 2010, 2011, 2012 and 2013
Figure 3: Households by energy source used for lighting (2002–2012)Source: Statistics South Africa, General Household Survey (Statistical release P0318), 2002, 2003, 2004, 2005, 2006, 2007, 2008, 2009, 2010, 2011, 2012 and 2013
0
2000
4000
6000
8000
10000
12000
14000
Electricity Generators Gas Paraffin Candles Other
Energy source used for lighting (2002-2012) in number of households (1 000's)
2002 2003 2004 2005 2006 2007 2008 2009 2010 2011 2012

30
Indicator: Biodiversity
Variable: 2
Description: Threateneda bird, mammal, amphibian and reptile species (known)
Units: Number of threatened bird, mammal, amphibian and reptile species as percentage of known species of each group in South Africa.
Source: International Union for Conservation of Nature (IUCN) 2008. http://www.redlist.org
South African National Biodiversity Institute. G.J. Measey (ed.). Ensuring a future for South Africa’s frogs: A strategy for conservation research. Pretoria. SANBI Biodiversity Series 19 (2011) Birdlife International. South Africa Birds. www.birdlife.org: Accessed 29 October 2012 11:40 am Logic: This variable is dependent on various ecological and geographical factors not included as indicators in this document. Looking at the percentage of threatened species gives a good indication of the country’s success in preserving its biodiversity.
Discussion: The primary threat to species comes from loss of natural habitat, particularly as a result of cultivation in the terrestrial environment. Invasive alien species are another severe threat in the terrestrial and freshwater environments.
Birds Birds are potent and significant indicators of the health of our ecological milieu. They are also very visible and accessible to everyone and are a colourful and inspiring part of nature. South Africa has a spectacular diversity of birds representing about 8% of the world bird species. Bird species are threatened with extinction due to the rapid spread of agriculture, urbanization, mining, industrial fishing, pollution and a host of other human- induced factors. Birds are extremely good indicator species as they are widespread over a variety of ecosystems, are very sensitive to many kinds of environmental changes and have widespread popular appeal. Due to this popular appeal it is easy to mobilize volunteer groups to collect data and thus it is not surprising that this is the best known and documented taxonomic group. A variety of factors can lead to the detriment of bird species. Some of these include: • Habitat fragmentation, • Changes in weather conditions, • Incidences of accidental poisoning.

31
Looking at the total number of threatened bird species (those belonging to groups CR (Critically Endangered), EN (Endangered) and VU (Vulnerable)), a total of 41 species are deemed threatened, amounting to 5.44% of the total number of bird species. The percentage of threatened bird species in relation to all bird species in the country gives a good measure of the overall capacity of the country to preserve its biodiversity. This variable is under the control of various measures that are not directly incorporated into the environmental sustainability indicator framework and paints a good picture of the status of the environment as a whole.
Mammals Mammals are one of the most important groups of species on earth in terms of evolution, ecology and economic impact. They occupy nearly all of the planet’s ecosystems and play critical roles in ecosystem dynamics, including as predators and keystone species. According to IUCN, South Africa had a total of 23 threatened mammal species. This amounts to a total percentage of 7.74%.
A multitude of factors can threaten the existence of mammals in South Africa. One of the most important are changes in weather patterns. Unlike birds, the distribution of mammals is restricted and various natural and man-made barriers may prohibit a species from moving to a more suitable habitat once a change has occurred. Similarly human developments have fragmented distribution patterns of species and may be one of the most important causes for the destruction of mammal species.
Amphibians In terms of amphibian species richness, South Africa is the 27th country with the greatest known amphibian species richness at the global level, and the fifth country at the biogeographical realm (Afrotropical) level. South African amphibians appear to be faring relatively better, with proportionately less species in the threatened category or in the data deficient category. Within South Africa, most threatened species are concentrated in Western Cape Province and to a lesser extent in KwaZulu-Natal Province.
Looking at the total number of threatened amphibian species, comprising of groups CR, EN and VU, a total of 17 species can be deemed threatened, amounting to 14.4% of the total number of amphibian species. Amphibian species are more reliant on environmental factors than birds due to the restriction this group has with regards to dispersal. Amphibian species need water to reproduce and when water resources are no longer available extinction is an increasing possibility. Similarly to mammals new developments play a vast role in the threatened status of this species. The most important factors threatening amphibian speciesb are as follows: • Habitat destruction and fragmentation, • Over exploitation, • Introduced species, • UV–B radiation,

32
• Chemical contaminants, • Disease. Seeing as amphibians are sensitive to all the above mentioned factors they are considered to be good indicator species. Globally there is an estimated total of 6 000+ species of amphibians of which nearly a 1/3 (32%) can be deemed threatened. For more information please visit: http://www.iucnredlist.org/amphibians.
Reptiles Reptiles are threatened by habitat loss, over-exploitation and climate change. The introduction of alien species is also a concern for the survival of native reptiles. According to the IUCN database a total of 19 reptile species are currently labelled as threatened (out of a total of 44). The threats posed to reptile species are very similar to those imposed on both mammals and amphibians.
Limitations: One of the major limitations to this variable is the frequency with which this variable is measured and the reliability of the data obtained through observational studies. Currently the most reliable data for this variable was obtained from the IUCN and SANBI website encompassing the trends for a couple of years so a comparison between different time periods is not possible. Notes: The key to the different assessments are as follows: EX - A species is extinct when the last individual of that species has died. EW - A species is Extinct in the Wild when it only survives in captivity, cultivation or as a naturalized population (or populations) well outside its previous distributional range. CR - A species is Critically Endangered when it is considered to be facing an extremely high risk of extinction in the wild, EN - A species is Endangered when it is considered to be facing a very high risk of extinction in the wild, VU - A species is considered to be facing a high risk of extinction in the wild, NT - A species is Near Threatened when it has been evaluated against the criteria but does not qualify for Critically Endangered, Endangered or Vulnerable now, but is close to qualifying for or is likely to qualify for a threatened category in the near future, LC - A species is of Least Concern when it has been evaluated against the criteria and does not qualify for Critically Endangered, Endangered, Vulnerable or Near Threatened. Widespread and abundant species are included in this category, DD - A species is Data Deficient when there is inadequate information to make a direct, or indirect, assessment of its risk of extinction based on its distribution and/or population status. STBA - Still to be assessed, LR/cd - Lower risk: Conservation Dependent, LR/lc - Lower risk: Least Concern and LR/nt - Lower risk: Near Threatened.

33
CategoryBirds
(Birdlife International- 29 October 2012)
Mammals (IUCN-02 June 2012)
Amphibians (SANBI Series 19, 2011)
Reptiles (IUCN-2008)
Extinct 0 1 0 1Extinct in the wild 0 0 0 0Critically endangered 1 3 5 2Endangered 16 9 7 4Vulnerable 24 11 5 13Near threatened 31 11 5 0Least concern 681 232 96 0Data deficient 1 30 0 2Still to be assessed 0 0 0 0Lower risk/conservation dependent 0 31 0 0Lower risk/least concern 0 50 0 4Lower risk/near threatened 0 3 0 18Total 754 297 118 44
Table 4: Number of species status in each category
Source: International Union for Conservation of Nature (IUCN) 2008 and 2012. http://www.redlist.org Birdlife International. South Africa Birds. 2012.www.birdlife.org
Biodiversity Series 19. 2011
a) The term threatened species include all those species that can be classified as Critically Endangered, Endangered or Vulnerable according to the Red data book listing. b) According to www.nationmaster.com
It is important to note that the section focussing on birds in this variable was assessed in terms of the number of breeding birds in South Africa and does not include the migratory birds.

34
ndicator: Biodiversity
Variable: 3
Description: Threat and protection status of vegetation types per biome
Units: Percentage of vegetation types in each biome falling into threat categories and the protection status of these vegetation types.
Source: Driver, A., Sink, K.J., Nel, J.L., Holness, S., Van Niekerk, L., Daniels, F., Jonas, Z., Majiedt, P.A., Harris, L. & Maze, K. 2012. National Biodiversity Assess ment 2011: An assessment of South Africa’s biodiversity and ecosystems. Synthesis Report. South African National Biodiversity Institute and Department of Environmental Affairs, Pretoria. Driver, A., Maze, K., Rouget, M., Lombard, A. T., Nel, J., Turpie, J.K., Cowling, R.M., Desmet, P., Goodman, P., Harris, J., Jonas, Z., Reyers, B., Sink, K. and Strauss, T. 2005. National spatial biodiversity conservation in South Africa, Strelitzia 17 (NSBA). South African National Biodiversity Institute (SANBI), Pretoria.
Logic: Vegetation types can be grouped into biomes according to shared ecological and climatic characteristics. The protection status of vegetation types in each biome will provide a good indication of the overall protection status of a country’s biodiversity.
Discussion: Terrestrial ecosystems play a vital role in food security, protection from natural hazards, and the development of economic sectors. Ecosystem threat status tells us about the degree to which ecosystems are losing vital aspects of their structure, function and composition, on which their ability to provide ecosystem services ultimately depends. Currently the conversion of natural vegetation to other land uses (examples include: cultivation, mining and plantations) is the biggest pressure on biodiversity. This loss of natural habitat is irreversible. It is estimated that about 20% of natural habitat in the country has been lost (National Biodiversity Assessment 2011). About 40% of terrestrial ecosystem types are threatened (9% critically endangered, 11% endangered, 19% vulnerable and 60% least threatened). The highest threatened ecosystem types are the Indian Ocean Coastal Belt, Grassland, Fynbos and Forest biomes. Threatened terrestrial ecosystems tend to be concentrated in areas that are hubs of economic production, with the remaining fragments of these ecosystems embedded in production land scapes. The remaining natural habitat in critically endangered and endangered ecosystems makes up less than 3% of the country’s area.

35
The types of terrestrial ecosystem that are well protected make up 22%. However, 35% remain completely unprotected, highlighting that the protected area network does not yet include a representative sample of all ecosystems. The total extent of the land-based protected area network increased from just fewer than 6% in 2004 to 6.5% in 2011, representing an increase of approximately 10% in the extent of the protected area network.
Most of the ecosystems falling in the endangered category are situated in the Forest and grass-land biome. Currently the Desert ecosystem is afforded the greatest protection (about 40% of the total surface area) but at the same time the Desert ecosystem is also fall on the least threatened category(100%). The Grassland and Nama - karoo biomes are afforded the least protection with 53% and 64% of vegetation types in these biomes (respectively) afforded no protection at all.
Limitations: Assessment of threat status of an ecosystem or vegetation type is dependent on various different measurements and studies such as the national land cover database. These studies are often not performed on a regular basis.
Notes: The threat status was calculated based on the percentage area remaining and the percentage target set for each natural habitat (LT - Least Threatened, if the remaining natural habitat is >80%, VU - Vulnerable, if remaining natural habitat is <80%, EN - Endangered, if remaining natural habitat is <60%, CE - Critically Endangered, if remaining natural habitat is < target).
The protection status was calculated according to the percentage of its biodiversity target met in type 1 protected area. A well protected area has 100% or more of target, a moderately protected area has between 50% to 99% of its biodiversity target protected, and poorly protected areas have between 5% and 49% of their biodiversity target protected, while Not protected areas have zero or less than 5% biodiversity target of their biodiversity areas protected. Ecosystem protection level tells us whether ecosystems are adequately protected or under-protected. Ecosystem types are categorized as not protected, poorly protected, moderately protected or well protected, based on the proportion of each ecosystem type that occurs within a protected area recognized in the Protected Areas Act.

36
Figure 4: The threat status of vegetation types in the nine biomes of South Africa
Source: Driver, A., Sink, K.J., Nel, J.L., Holness, S., Van Niekerk, L., Daniels, F., Jonas, Z., Majiedt, P.A., Harris, L. & Maze, K. 2012. National Biodiversity Assessment 2011: An assessment of South Africa’s biodiversity and ecosystems. Synthesis Report. South African National Biodiversity Institute and
Department of Environmental Affairs, Pretoria.
0
10
20
30
40
50
60
70
80
Albany Thicket Desert Forest Fynbos Grassland Indian OceanCoastal Belt
Nama-Karoo Savanna SucculentKaroo
Percentage of vegetation type in each threat categoty per biome
CR EN VU LT

37
Figure 5: The protection status of the nine biomes of South Africa
Source: Driver, A., Sink, K.J., Nel, J.L., Holness, S., Van Niekerk, L., Daniels, F., Jonas, Z., Majiedt, P.A., Harris, L. & Maze, K. 2012. National Biodiversity Assessment 2011: An assessment of South Africa’s biodiversity and ecosystems. Synthesis Report. South African National Biodiversity Institute and
Department of Environmental Affairs, Pretoria.
0
5
10
15
20
25
30
35
40
45
Albany Thicket Desert Forest Fynbos Grassland Indian OceanCoastal Belt
Nama-Karoo Savanna SucculentKaroo
Protection status of vegetation types in each biome (percentage)
Not Protected Poorly protected Moderately protected Well protected
0
5
10
15
20
25
30
35
40
45
Albany Thicket Desert Forest Fynbos Grassland Indian OceanCoastal Belt
Nama-Karoo Savanna SucculentKaroo
Protection status of vegetation types in each biome (percentage)
Not Protected Poorly protected Moderately protected Well protected

38
Indicator: Land
Variable: 4
Description: Degraded and transformed land
Units: Percentage land degraded and transformed.
Source: Fairbanks, D.H.K. Thompson, W.M. Vink, D.E. Newby T.S. van den Berg H.M. and D.A. Everard. 2000. The South African Land-cover Characteristics database: a synopsis of the landscape. South African Journal of Science 96, February 2000.
Gibson, D., Paterson, G. and Newby, T. 2005. Land: Background Research. Paper produced for the South Africa Environment Outlook Report on behalf of the Department of Environmental Affairs and Tourism .
Logic: Information regarding the characteristics and spatial distribution of South Africa’s land cover is critical for sustainable land-use planning, strategic environmental assessments and global change research. Degraded land may lead to a decline in the productivity of land, as well as the loss of vegetation and resources to support human livelihoods and commercial activities. Land degradation can additionally lead to reduced biodiversity and loss of ecosystem services. Ecosystem functions affected by erosion include plant nutrient supply, nutrient cycling and waste material decomposition.
Discussion: Soil loss together with, compaction, low organic matter, loss of structure, poor drainage, salinisation and acidity problems are all classified as soil degradation and lead to increased soil erosion.
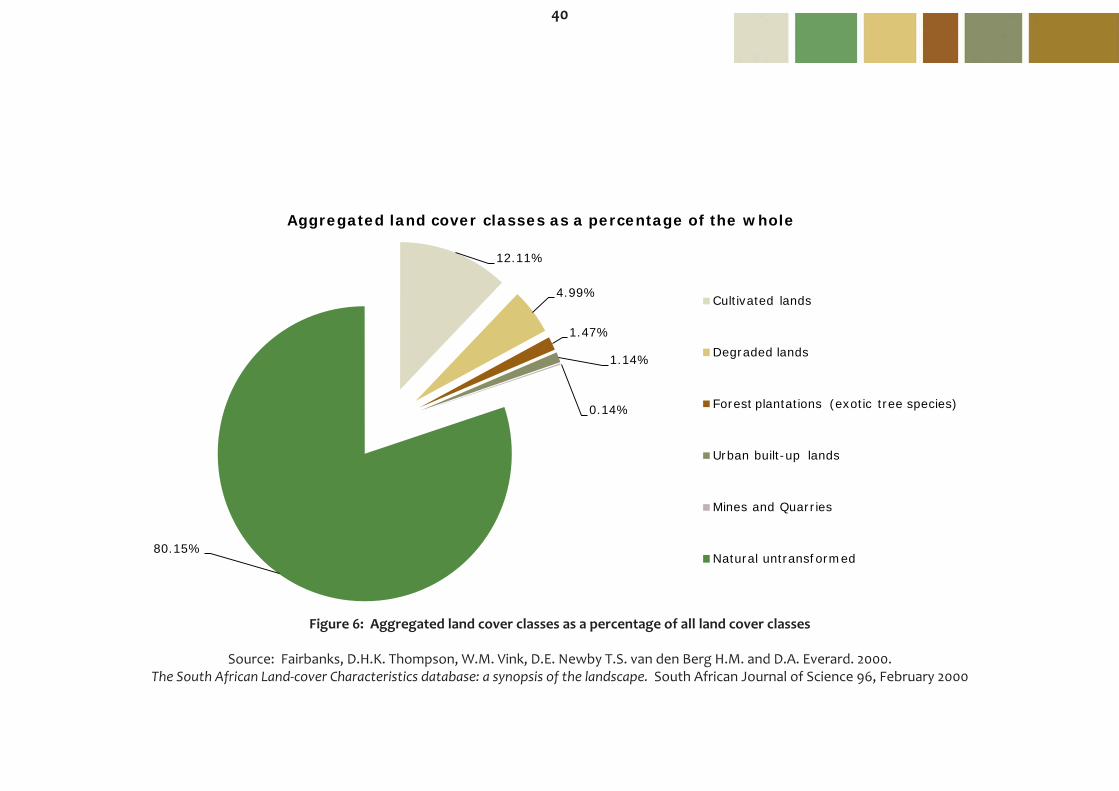
Soil erosion is a naturally occurring process on land and the agents of soil erosion are water and wind, each contributing a significant amount of soil loss. Soil erosion may be a slow process that continues relatively unnoticed, or it may occur at an alarming rate causing serious loss of topsoil. The loss of soil from farmland may be reflected in reduced crop production potential, lower surface water quality and damaged drainage networks. The National Land Cover Database (NLCD) clearly shows that almost 20% of the land in South Africa can be classified as transformed whereas the greatest percentage area is covered by shrub lands and low fynbos (34.5%) followed by grasslands (21.28%).
Limitations: The accuracy of the land cover database range from 51% to 93% depending on the geographic area.

39
Aggregated land cover class Land cover category Area (ha) PercentageCultivated lands Cultivated permanent - commercial dryland 83 086.8 0.07
Cultivated permanent - commercially irrigated 416 753.4 0.34Cultivated temporary - commercial sugarcane 459 370.0 0.38Cultivated temporary - commercial dryland 9 748 150.8 8.00Cultivated temporary - commercial irrigated 1 081 256.7 0.89Cultivated temporary - semi-commercial/subsistence dryland 2 964 630.6 2.43
Degraded lands Degraded herbland 138.6 0.00Degraded forest and woodland 965 723.1 0.79Degraded schrubland and low fynbos 563 182.4 0.46Degraded thicket & bushland (etc) 2 256 031.7 1.85Degraded unimproved grassland 1 862 583.9 1.53Dongas and sheet erosion scars 186 513.8 0.15Barren rock 260 361.2 0.21
Forest plantations (exotic tree species) Forest plantations 1 790 269.6 1.47Urban built-up lands Commercial 34 476.3 0.03
Industrial/Transport 64 652.0 0.05Residential 1 084 164.1 0.89Residential (small holdings: bushland) 27 927.5 0.02Residential (small holdings: grassland) 134 927.3 0.11Residential (small holdings: shrubland) 12 301.6 0.01Residential (small holdings: woodland) 40 462.6 0.03
Mines and Quarries Mines and quarries 175 420.7 0.14TOTAL degraded and transformed 24 212 384.7 19.86TOTAL untransformed/natural 97 695 404.3 80.14TOTAL 121 907 789.0 100.00
Table 5: Area (hectares and percentage) covered by different land cover categories
Source: Fairbanks, D.H.K. Thompson, W.M. Vink, D.E. Newby T.S. van den Berg H.M. and D.A. Everard. 2000. The South African Land-cover Characteristics database: a synopsis of the landscape. South African Journal of Science 96, February 2000
40
12.11%
4.99%
1.47%
1.14%
0.14%
80.15%
Aggregated land cover classes as a percentage of the whole
Cultivated lands
Degraded lands
Forest plantations (exotic tree species)
Urban built-up lands
Mines and Quarries
Natural untransformed
Figure 6: Aggregated land cover classes as a percentage of all land cover classes
Source: Fairbanks, D.H.K. Thompson, W.M. Vink, D.E. Newby T.S. van den Berg H.M. and D.A. Everard. 2000. The South African Land-cover Characteristics database: a synopsis of the landscape. South African Journal of Science 96, February 2000

41
Indicator: Marine
Variable: 5
Description: Status of west coast rock lobster
Units: West coast rock lobster landings (Tons).
Source: Department of Agriculture, Forestry and Fisheries (DAFF) 2013. Fisheries Statistics request
Department of Agriculture, Fisheries and Forestry (DAFF) 2012. Status of the South African Marine Fishery Resources Report. www.daff.gov.za
Fishing Industry Handbook South Africa, Namibia and Mozambique. 2005 33rd, 2006 34th,2007 35th, 2008 36th, 2009 37th, 2010 38th, 2011 39th and 2012 40th
edition Griffiths, C.L., van Sittert, L., Best, P.B., Brown, A.C., Clark, B.M., Cook, P.A., Crawford, R.J.M., David, J.H.M, Davies, B.R., Griffiths, M.H., Hutchings, K., Jerardino, A., Kruger, N., Lamberth, S., Leslie, R., Melville-Smith, R., Tarr, R., and van der Lingen, C.D. 2004. Impacts of Human Activities on Marine Animal Life in the Benguela: a historical overview. Oceanography and Marine Biology: An Annual Review 42, 303–392.
Tarr, R.J.P., Williams, P.V.G., and MacKenzie, A.J. 1996. Abalone, sea urchins and rock lobsters: a possible ecological shift may affect traditional fisheries. South African Journal of Marine Science 17, 319–323.
Department of Environmental Affairs and Tourism (DEAT) 2006. South Africa Environment Outlook. A report on the state of the environment. Pretoria. Two Oceans Aquarium. Cape Town South Africa. www.aquarium.co.za. (Accessed: 28th October 2012)
Logic: The west coast rock lobster fishery is one of the oldest fisheries in South Africa. Commercial, subsistence and recreational fisheries all target the rock lobster.
Discussion: The West Coast rock lobster fishery is the most important rock lobster fishery in South Africa on account of its high market value (more than R260 million per annum) and its importance in providing employment for over 4 200 people from communities along the West Coast of South Africa. West Coast rock lobster fishery, which historically landed the bulk (60%) of the lobster catch, now lands only 40% of the total catch annually. Historically, the South African rock lobster fishery would catch about 4 000 tonnes of lobster per year. Figure 8 shows a decrease of catches from 2 937 to 1 879 (36%) tons between 2005 and 2012 respectively . This decline in catch has had a devastating effect on coastal communities with economic hardship experienced by most fishers on the West Coast.

42
The slow growth rate of lobsters and illegal fishing activities have led to a dramatic decline in the fishery since 1960. During the 1990’s a decrease in growth rate and insufficient numbers of juveniles in the population to sustain a healthy fishery further reduced the rock lobster landings to about 50% that of the 1980’s. The harvestable biomass is currently estimated at 5% of pre-exploitation levels and the spawning biomass approximately 20% of pristine levels.
Limitations: Information for 1890 to 2000 were obtained from a study conducted by Griffiths et al. 2004, whereas information on landings for 2004–2011 were obtained from the Fishing Industry Handbook. A direct comparison between the data for these two groupings of years is thus not possible. No information could be obtained for landings during 2001–2004.

43
Figure 7: Annual commercial landings of west coast rock lobster (1890–2000)
Source: Griffiths, C.L., van Sittert, L., Best, P.B., Brown, A.C., Clark, B.M., Cook, P.A., Crawford, R.J.M., David, J.H.M, Davies, B.R., Griffiths, M.H., Hutchings, K., Jerardino, A., Kruger, N., Lamberth, S., Leslie, R., Melville-Smith, R., Tarr, R., and van der Lingen, C.D. 2004.
Impacts of Human Activities on Marine Animal Life in the Benguela: a historical overview. Oceanography and Marine Biology: An Annual Review 42, 303–392
0
2000
4000
6000
8000
10000
12000
14000
16000
18000
1890 1900 1910 1920 1930 1940 1950 1960 1970 1980 1990 2000
West coast rock lobster in tons (1890 - 2000)

44
Figure 8: Annual commercial landings of west coast rock lobster (2004–2012)
Source: Department of Agriculture, Forestry and Fisheries (DAFF) 2013. Fisheries Statistics request.Department of Agriculture, Fisheries and Forestry (DAFF) 2012. Status of the South African Marine Fishery Resources Report. www.daff.gov.za
Fishing Industry Handbook South Africa, Namibia and Mozambique. 2005 33rd, 2006 34th,2007 35th, 2008 36th, 2009 37th, 2010 38th, 2011 39th and 2012 40th edition
0
500
1000
1500
2000
2500
3000
3500
4000
2004 2005 2006 2007 2008 2009 2010 2011 2012
West Coast rock lobster landings in tons (2000 - 2012)

45
Indicator: Marine
Variable: 6
Description: Catches of selected marine species (harvesting)
Units: Kilograms per nominal mass harvested.
Source: Department of Agriculture, Forestry and Fisheries (DAFF) 2013. Fisheries Statistics request.
Department of Agriculture, Fisheries and Forestry (DAFF) 2012. Status of the South African Marine Fishery Resources Report. www.daff.gov.za Fishing Industry Handbook South Africa, Namibia and Mozambique. 2005 33rd, 2006 34th,2007 35th, 2008 36th, 2009 37th, 2010 38th, 2011 39th and 2012 40th
edition National Biodiversity Assessment 2011: Technical Report. Volume 4: Marine and Coastal Component. South African National Biodiversity Institute, Pretoria.
Logic: South Africa is a country rich with marine biodiversity. Although South Africa only covers 2% of the global area it is estimated that a total of 15% of the global marine species occur in its waters.
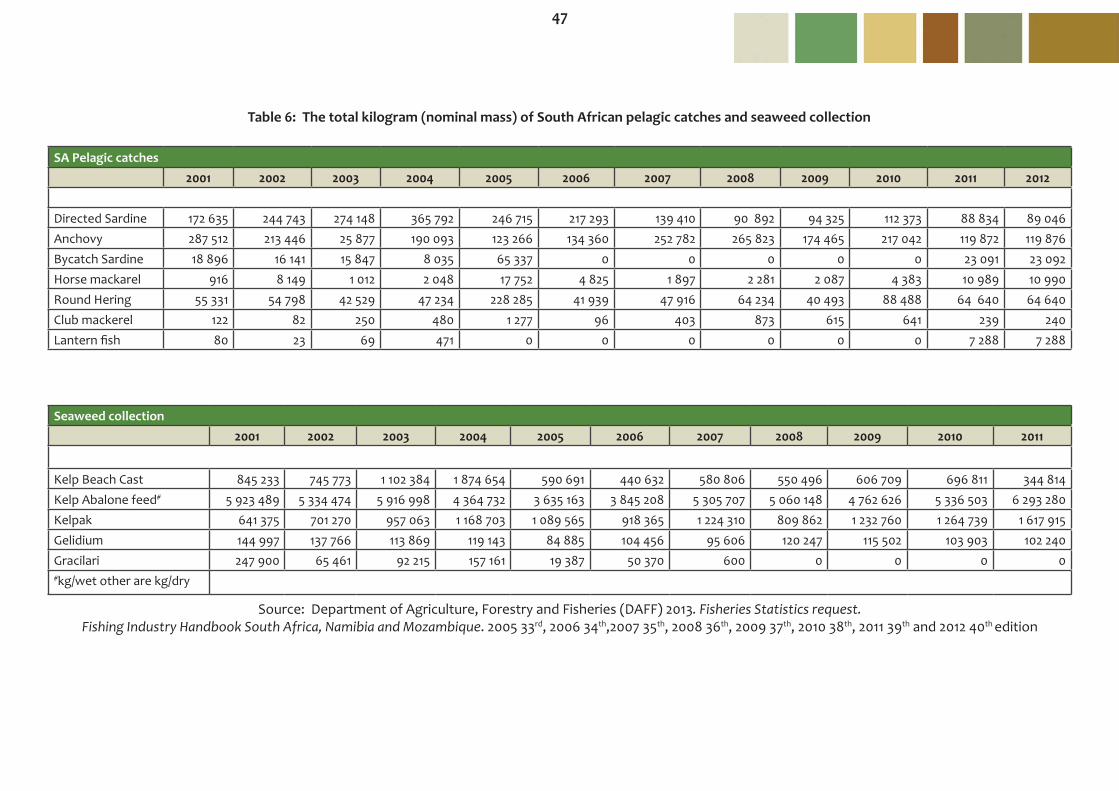
Discussion: The South African seaweed industry is based on the commercial collection of kelps and the red seaweeds Gelidium and Gracilaria, as well as small quantities of several other species. The sector is small compared to many other fisheries, but is estimated to be worth at least R35 million annually and to provide 300 - 400 jobs. Much of the harvest is exported for the extraction of gums. Combined landings of anchovy, sardine and round herring in 2011 were just under 300 000 t, down from the 400 000 t reported in 2010 and due primarily to a reduced anchovy catch. The combined catch for 2011 was slightly below the long-term average annual catch of 335 000 t. In 2011, anchovy accounted for only 120 000 t, the lowest landing of this species for the past 13 years (Table 6).
There are strong interactions between fisheries and the surrounding environment. Such interactions can lead to negative impacts on fisheries, such as pollution, predation, climate change, harmful algal blooms and extraction of resources, etc. More than 630 marine species are caught by commercial, subsistence and recreational fisheries in South Africa with approximately 6% (41) being reported for stock status. An estimated 61% (25 of 41) of marine species reported on are overexploited. While 47% of South Africa’s marine and coastal habitats are threatened, there are still opportunities to restore impacted habitats, secure remaining healthy habitats, prevent further damage and improve marine biodiversity management. This variable attempts to investigate the total mass landed during harvesting since 2001 with the main focus on trawl catches (inshore and offshore) as well as pelagic catches and seaweed collection.

46
The data for the years between 2009 and 2012 shows a decrease of inshore trawl catches from 10 449 616 to 6 997 912.23 (i.e. a drop of more than 33%) and increase in the deep-sea trawl from 150 135 826 to 166 922 866.43 (i.e. an escalation of more than 11 %) within the same period (Figure 9).
Notes: The data represented in this indicator only takes into account legal harvesting of marine species. Illegal harvesting impact heavily on the state of biodiversity as a whole however is not reported on in this current report.
Figure 9: The total amount of nominal mass landed for both inshore and deep-sea trawl catches (2001–2012)
Source: Department of Agriculture, Forestry and Fisheries (DAFF) 2013. Fisheries Statistics request.Fishing Industry Handbook South Africa, Namibia and Mozambique, 2005 33rd, 2006 34th,2007 35th, 2008 36th, 2009 37th, 2010 38th, 2011 39th and 2012 40th edition
0
5
10
15
20
25
2000 2001 2002 2003 2004 2005 2006 2007 2008 2009 2010 2011 2012
Kg (10 000 000's) nominal mass landed for both inshore and deepsea trawl catches
SA inshore trawl catch (kilograms nominal mass) SA deepsea trawl catch (kilograms nominal mass)
47
SA Pelagic catches2001 2002 2003 2004 2005 2006 2007 2008 2009 2010 2011 2012
Directed Sardine 172 635 244 743 274 148 365 792 246 715 217 293 139 410 90 892 94 325 112 373 88 834 89 046Anchovy 287 512 213 446 25 877 190 093 123 266 134 360 252 782 265 823 174 465 217 042 119 872 119 876Bycatch Sardine 18 896 16 141 15 847 8 035 65 337 0 0 0 0 0 23 091 23 092Horse mackarel 916 8 149 1 012 2 048 17 752 4 825 1 897 2 281 2 087 4 383 10 989 10 990Round Hering 55 331 54 798 42 529 47 234 228 285 41 939 47 916 64 234 40 493 88 488 64 640 64 640Club mackerel 122 82 250 480 1 277 96 403 873 615 641 239 240Lantern fish 80 23 69 471 0 0 0 0 0 0 7 288 7 288
Table 6: The total kilogram (nominal mass) of South African pelagic catches and seaweed collection
Seaweed collection2001 2002 2003 2004 2005 2006 2007 2008 2009 2010 2011
Kelp Beach Cast 845 233 745 773 1 102 384 1 874 654 590 691 440 632 580 806 550 496 606 709 696 811 344 814Kelp Abalone feed# 5 923 489 5 334 474 5 916 998 4 364 732 3 635 163 3 845 208 5 305 707 5 060 148 4 762 626 5 336 503 6 293 280Kelpak 641 375 701 270 957 063 1 168 703 1 089 565 918 365 1 224 310 809 862 1 232 760 1 264 739 1 617 915Gelidium 144 997 137 766 113 869 119 143 84 885 104 456 95 606 120 247 115 502 103 903 102 240Gracilari 247 900 65 461 92 215 157 161 19 387 50 370 600 0 0 0 0#kg/wet other are kg/dry
Source: Department of Agriculture, Forestry and Fisheries (DAFF) 2013. Fisheries Statistics request.Fishing Industry Handbook South Africa, Namibia and Mozambique. 2005 33rd, 2006 34th,2007 35th, 2008 36th, 2009 37th, 2010 38th, 2011 39th and 2012 40th edition
48
Indicator: Marine
Variable: 7
Description: Marine protected areas (MPAs)
Units: Levels of vulnerability and protection of marine areas.
Source: Driver, A., Sink, K.J., Nel, J.L., Holness, S., Van Niekerk, L., Daniels, F., Jonas, Z., Majiedt, P.A., Harris, L. & Maze, K. 2012. National Biodiversity Assessment 2011: An assessment of South Africa’s biodiversity and ecosystems. Synthesis Report. South African National Biodiversity
Logic: The number and extent of marine protected areas represents an investment by the country in marine and biodiversity conservation.
Discussion: Marine protected areas (MPAs) are divided into zones which include no-take zones where no extractive use such as fishing is allowed and extractive use zones where various forms of harvesting are permitted. Because fishing is the biggest pressure on marine ecosystems, the degree of protection provided by no-take zones is higher. Coastal Marine Protected Areas that allow extractive use can actually become nodes of increased exploitation by fishers, rather than providing protection.
During 2011, 23.2% of South Africa’s coastline falls within marine protected areas or land-based protected areas with only 9% of the coastline in no-take marine protected areas or zones. Offshore, less than 1% of the mainland EEZ is protected. In 2011, the national biodiversity assessment assessed ecosystem threat status for 136 marine and coastal habitat types whereas the National Spatial Biodiversity Assessment 2004 assessed threat status for 34 broad marine biozones. The 136 marine and coastal habitat types consist of 58 coastal and inshore habitat types (including three island associated habitat types), 62 offshore benthic habitat types and 16 offshore pelagic habitats.
Out of South Africa’s 136 marine and coastal habitat types, 47% are threatened, 17% are critically endangered, 7% endangered, and 23% vulnerable (Figure 10). Many of these threatened habitat types are relatively small, leaving more than 70% of the overall area of South Africa’s mainland marine territory least threatened.
Nearly 70% of offshore habitat types are not protected at all (Figure 11). Offshore ecosystems are the least protected of all South Africa’s ecosystems. Although 23% of South Africa’s coastline falls within land-based or marine protected areas, a small proportion of coastal and inshore ecosystems are well protected.

49
Figure 10: The current threat status of biozones in South African waters
Source: Driver, A., Sink, K.J., Nel, J.L., Holness, S., Van Niekerk, L., Daniels, F., Jonas, Z., Majiedt, P.A., Harris, L. & Maze, K. 2012. National Biodiversity Assessment 2011: An assessment of South Africa’s biodiversity and ecosystems. Synthesis Report. South African National Biodiversity

50
Figure 11: The current protection status of biozones in South African waters
Source: Driver, A., Sink, K.J., Nel, J.L., Holness, S., Van Niekerk, L., Daniels, F., Jonas, Z., Majiedt, P.A., Harris, L. & Maze, K. 2012. National Biodiversity Assessment 2011: An assessment of South Africa’s biodiversity and ecosystems. Synthesis Report. South African National Biodiversity

51
Indicator: Freshwater
Variable: 8
Description: Available water per capita
Units: Availability of water in m3 per capita.
Source: Department of Water Affairs (2013). National Water Resource Strategy 2nd Edition. www.dwa.gov.za Department of Water Affairs (2010). Integrated Water Resource Planning for South Africa: A Situation Analysis 2010. www.dwa.gov.za
United Nations (UN) 2002: World Population Prospects: The 2002 Revision and World Urbanization Prospects: The 2001 Revision. United Nations Population Division, New York. http://esa.un.org/unpp
Scholes, R.J. and Biggs, R. 2004. Ecosystem services in South Africa: A regional assessment. Millennium Ecosystem Assessment. Council for Scientific and Industrial Research, Pretoria.
Biggs, R. Bohensky, E. Desanker, P.V. Fabricius, C. Lynam, T. Misselhorn, A.A. Musvoto, C. Mutale, M. Reyers, B. Scholes, R.J. Shikongo, S. and van Jaarsveld, A.S. 2004. Nature supporting people: The South African Millennium Ecosystem Assessment – Integrated report. Council for Scientific and Industrial Research, Pretoria.
Logic: The per capita volume of available water resources for a country is an important indicator of environmental services and the ability to support the needs of the population. Discussion: The total surface water available in South Africa averages about 49 200 million m3 per year, of which about 4 800 million m3 per year originates from Lesotho. Surface water from dams and direct abstraction from rivers has accounted for 9 500 million m3 of all the water available, with groundwater, return flows and water used by afforestation. The significant volume of the surface water yield (3 000 million m3 per annum) moved via inter-basin transfers to areas in the country where requirements exceed supply (NWRS, 2013).
The supply of freshwater of acceptable quality is vital to life and is a basic human right. The United Nations has set a target of 1 000 m3 per person per year to satisfy a country’s water needs. South Africa is a water scarce country with an annual rainfall which is about 500 mm. This value is low compared to the world average of 860 mm per yeara; in fact South Africa is ranked as one of the 20 most water scarce countries in the world. The total water availability is calculated as the sum of all the internal renewable water resources. This includes resources such as freshwater and groundwater. The availability of water in 2001 was estimated at 1 156 m3/capita/year. This value is marginally higher than the minimum value of 1 000 m3/capita/year as suggested by the United Nations.

52
The country has made significant progress towards implementing sustainable water resource protection programmes, such as the development of the water resource classification system. Reconciliation Strategies have been developed to assess the water balance against future needs.
Limitations: Information contained in this variable was calculated as the total renewable water resources divided by the population number. Estimated water availability for 2030 was calculated using projected population numbers obtained from the United Nations. During the calculation of the estimated water availability for 2030 the only change in calculation was based on the population number. The total water resources amount remained constant from the calculated value in 2001.
Notes: a) Department of Water Affairs and Forestry (DWAF) 2004. National Water Resources Strategy. Pretoria.

53
Country Estimated population in 2001 (million)
Water availability in 2001 (m3/capita)
Estimated population in 2030 (million)
Water availability in 2030 (m3/capita)
Angola 13.5 13 620 28.6 6 436Botswana 1.7 8 471 1.6 9 219Burundi 6.9 519 13.7 264Congo 3.1 268 387 7.6 110 082Dem. Rep. Congo 52.4 24 508 107.0 11 992Equatorial Guinea 0.5 55 319 0.9 29 279Gabon 1.3 130 159 2.0 80 235Kenya 30.7 982 41.1 734Lesotho 2.1 1 467 1.6 1 943Malawi 10.5 1 641 19.8 871Mozambique 18.1 11 960 26.6 8 118Namibia 1.8 10 022 2.4 7 419Rwanda 7.9 656 13.5 387South Africa 43.2 1 156 42.2 1 186Swaziland 1.1 4 215 1.0 4 422Tanzania 34.5 2 642 56.9 1 599Uganda 22.8 2 896 64.0 1 032Zambia 10.3 10 233 15.2 6 910Zimbabwe 12.8 1 560 12.8 1 566
Source: Scholes, R.J. and Biggs, R. 2004. Ecosystem services in South Africa: A regional assessment. Millennium Ecosystem Assessment. Council for Scientific and Industrial Research, Pretoria.
Biggs, R. Bohensky, E. Desanker, P.V. Fabricius, C. Lynam, T. Misselhorn, A.A. Musvoto, C. Mutale, M. Reyers, B. Scholes, R.J. Shikongo, S. and van Jaarsveld, A.S. 2004. Nature supporting people: The South African Millennium Ecosystem Assessment – Integrated report. Council for Scientific and Industrial Research, Pretoria
Table 7: Estimated population and water availability (m3/capita) in Southern African Countries in 2001 and 2030

54
Indicator: Freshwater
Variable: 9
Description: Capacity and levels of dams in South Africa
Units: The capacity and levels (m3) of dams in South Africa (2000–2012).
Source: Department of Water Affairs (DWA) 2009–2013. Georequests Department of Water Affairs (2013). National Water Resource Strategy 2nd Edition. www.dwa.gov.za Department of Water Affairs and Forestry (DWAF) 2000–2008 Georequests Department of Water Affairs and Forestry (DWAF) 2004. National Water Resources Strategy, 1st Edition
Logic: The per capita volume of available water resources for a country is an important indicator of environmental services and the ability to support the needs of the population.
Discussion: Surface water resources in South Africa are well developed and supply the majority of the urban, industrial and irrigation needs. South Africa has more than 4 395 dams, of which 2 528 are water supply related (DWA, 2013). Currently there are 19 WMAs in South Africa with a total capacity of about 31 690.6 106 m3. In 2012, major dams in South Africa contained 82% of their overall full supply capacity compared to 87% of 2011. South Africa has low levels of rainfall relative to the world average with high variability as well as high levels of evaporation due to the hot climate, and increasing challenges from water pollution. All of these pose constraints on the amount of water available for use (DWA, 2013).
In spite of the good infrastructure, the challenges of floods and droughts form part of water cycle; however, water restrictions and flood management are a critical part of the water business. The other challenge is that the poor and marginalised experience water scarcity most intensely, particularly in under-developed rural areas and areas such as the former homelands. Water quality in the larger reservoirs and also in the smaller dams and impoundments reflects the interacting effects of physical processes, chemical processes and biological processes.
The average rainfall in South Africa is about 500 mm per year. This value is less than half of the world’s average rainfall, adding up to a potential supply of 1 100 million m3 paa. Surface water from dams and direct abstraction from rivers accounts for 9 500 Mm3/a, with a significant volume of the surface water yield moved via inter-basin transfers to areas in the country where water requirements exceed supply. An example is the Lesotho Highlands Water Scheme which supplies water to Gauteng through transfer from Katse and Mohale Dams in Lesotho to the Vaal WMA (DWA, 2013).
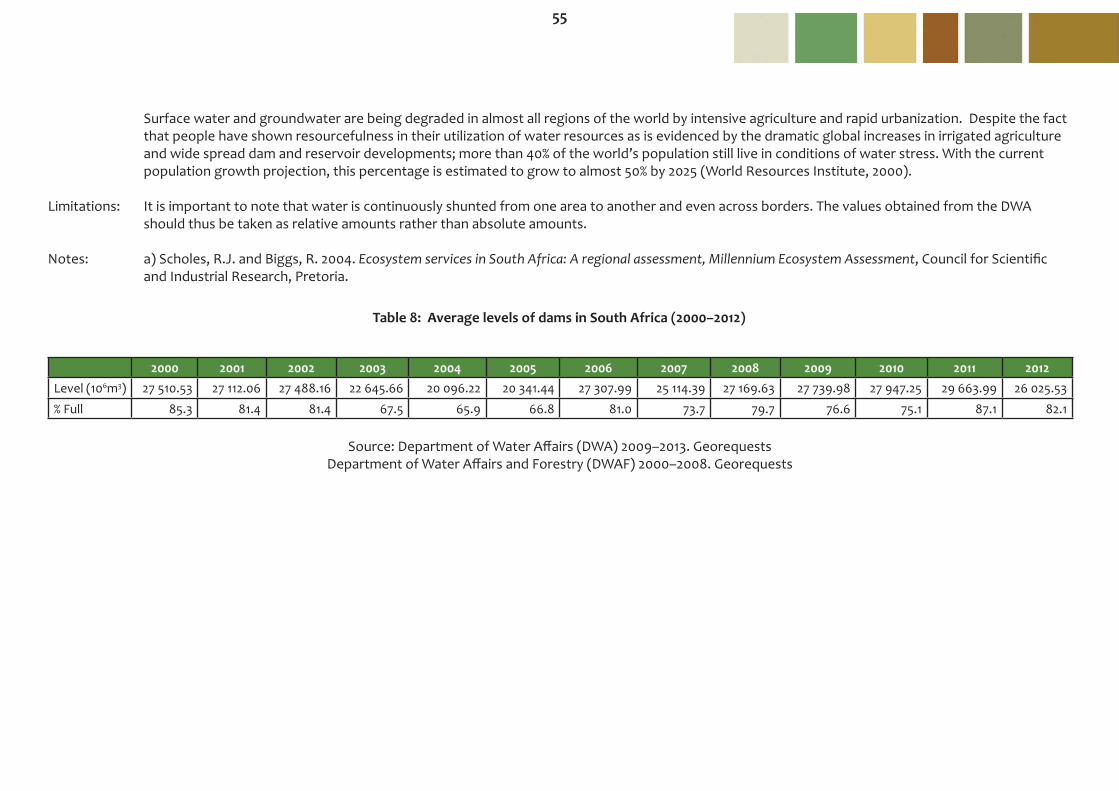
55
Surface water and groundwater are being degraded in almost all regions of the world by intensive agriculture and rapid urbanization. Despite the fact that people have shown resourcefulness in their utilization of water resources as is evidenced by the dramatic global increases in irrigated agriculture and wide spread dam and reservoir developments; more than 40% of the world’s population still live in conditions of water stress. With the current population growth projection, this percentage is estimated to grow to almost 50% by 2025 (World Resources Institute, 2000).
Limitations: It is important to note that water is continuously shunted from one area to another and even across borders. The values obtained from the DWA should thus be taken as relative amounts rather than absolute amounts.
Notes: a) Scholes, R.J. and Biggs, R. 2004. Ecosystem services in South Africa: A regional assessment, Millennium Ecosystem Assessment, Council for Scientific and Industrial Research, Pretoria.
2000 2001 2002 2003 2004 2005 2006 2007 2008 2009 2010 2011 2012Level (106m3) 27 510.53 27 112.06 27 488.16 22 645.66 20 096.22 20 341.44 27 307.99 25 114.39 27 169.63 27 739.98 27 947.25 29 663.99 26 025.53
% Full 85.3 81.4 81.4 67.5 65.9 66.8 81.0 73.7 79.7 76.6 75.1 87.1 82.1
Table 8: Average levels of dams in South Africa (2000–2012)
Source: Department of Water Affairs (DWA) 2009–2013. Georequests Department of Water Affairs and Forestry (DWAF) 2000–2008. Georequests

56
Figure 12: Total capacity and level (106 m3) of dams in South Africa (2000–2012)
Source: Department of Water Affairs (DWA) 2009–2013. GeorequestsDepartment of Water Affairs and Forestry (DWAF) 2000–2008
0
5000
10000
15000
20000
25000
30000
35000
2000 2001 2002 2003 2004 2005 2006 2007 2008 2009 2010 2011 2012
Capacity Level
Capacity and level of dams in South Africa (106m3)

57
Indicator: Freshwater
Variable: 10
Description: Freshwater quality
Units: Water quality is measured in terms of eutrophication with the measured variables being Ortho-phosphate (PO4 – mg/l), Chlorophill A (µg/l) and total Phosphate (P – mg/l).
Source: Department of Water Affairs (DWA) 2013. Georequests. www.dwa.gov.za Department of Water Affairs (DWA) 2013. National Water Resource Strategy 2nd Edition. www.dwa.gov.za Department of Water Affairs (DWA) 2011. Planning level review of water quality in South Africa-March 2011 Department of Water Affairs and Forestry (DWAF) 2004. National Water Resources Strategy, 1st Edition. Department of Water Affairs and Forestry (1999–2005). National Water Quality Monitoring Data.
Logic: The enrichment of surface water with dissolved nutrients has the potential to stimulate primary production and thereby increase the potential for eutrophication which severely affects the functioning of aquatic ecosystems.
Discussion: The 2013 National Water Resource Strategy indicated that the levels of nutrients in the country’s water resources are the most concerning water quality problem. Only 10% of the monitoring sites showed compliance with the prescribed tolerable range of resource quality objective (>0.015 mg/l to <0.025mg/l) for phosphate for phosphate and showed that there is currently 88% non-compliance at a national scale. The current status and the resulting eutrophication is a threat to the aquatic ecosystem health of our water resources and to domestic water supply. The results of the review imply that the levels of nutrients in the country’s water resource are of major concern. The results calculated in this report showed that the mean annual phosphorus concentration of some drainage regions remained below the level where there is a serious potential for algal growth (below 0.13mg/l) between the years 2000 to 2012. Dams in drainage regions A, R and H however showed phosphorus concentrations in the range of serious potential for algal growth. Algal toxins pose a direct threat to human and animal health. Exposure may occur through direct contact with the water or using the water for laundry, personal hygiene or cultural practices. Consumption of contaminated water includes water for cooking and drinking, as well as through consumption of fish that have been exposed to the algae. The average Chlorophyll A concentration of all drainage regions remained fairly stable for the period 2000 to 2012 (ranging between 0 and 50 μg/l) with the exception of dams in drainage regions A and R which have shown elevated levels throughout the sample period and could thus be classified as being hypertrophic. A manual compiled by the national eutrophic monitoring group defined eutrophication as the following:

58
“Eutrophication is the process of excessive nutrient enrichment of waters that typically results in problems associated with marcophyte, algal of cy anobacterial growth.” The trophic status of a water body can be placed in one of the following categories:
• Oligotrophic – low in nutrients and not productive in terms of aquatic animal and plant life, • Mesotrophic – intermediate levels of nutrients, fairly productive in terms of aquatic animal and plant life, showing emerging signs of water quality problems, • Eutrophic – Rich in nutrients, very productive in terms of aquatic animal and plant life, showing increase signs of water quality problems, • Hypertrophic – Very high nutrient concentration. Plant growth is determined by physical factors. Water quality problems are serious.
The trophic status of a water body is associated with the phosphorus and chlorophyll A concentration of that water body
Current trophic statusMean annual Chlorophyll A (ug/l)
0 < x ≤ 10 Oligotrophic (low)10 < x ≤ 20 Mesotrophic (moderate)
> 30 HypertrophicPotential for algal and plant production
Mean annual Phosphorus (mg/l)x ≤ 0.015 Negligible
0.015 < x ≤ 0.047 Moderate0.048 < x ≤ 0.130 Significant
> 0.130 Serious

59
Figure 13: Mean annual phosphorus concentration (mg/l) for each drainage region (2000–2012)
Source: Department of Water Affairs (DWA) 2013: Georequests Department of Water Affairs and Forestry (1999–2005). National Water Quality Monitoring Data.
-0.1
0.1
0.3
0.5
0.7
0.9
2000 2001 2002 2003 2004 2005 2006 2007 2008 2009 2010 2011 2012
Mean annual P concentration (mg/l) for each dams in drainage region
A B C D E G H K P R S T U V W X
Serious potential for algal growth
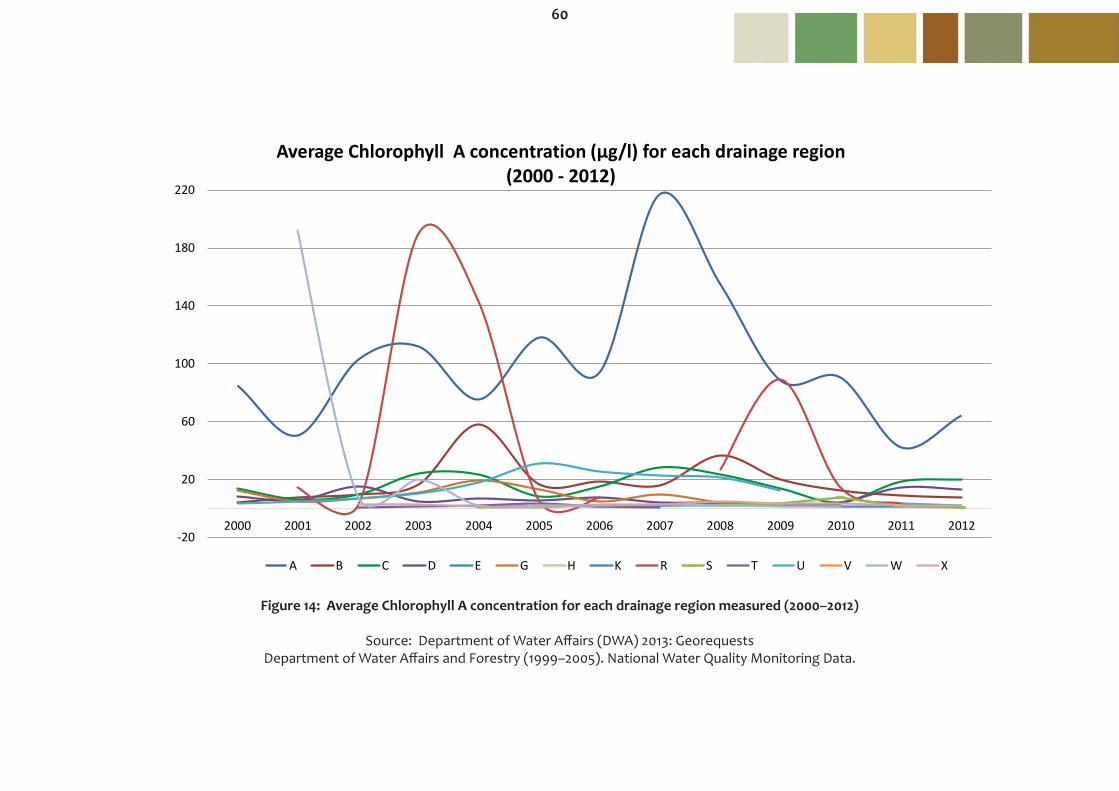
60
Figure 14: Average Chlorophyll A concentration for each drainage region measured (2000–2012)
Source: Department of Water Affairs (DWA) 2013: Georequests Department of Water Affairs and Forestry (1999–2005). National Water Quality Monitoring Data.
-20
20
60
100
140
180
220
2000 2001 2002 2003 2004 2005 2006 2007 2008 2009 2010 2011 2012
Average Chlorophyll A concentration (µg/l) for each drainage region (2000 - 2012)
A B C D E G H K R S T U V W X

61
Indicator: Groundwater
Variable: 11
Description: Groundwater quantity
Units: Groundwater distance below ground level.
Source: Department of Water Affairs (DWA) 2013. Georequests
Department of Water Affairs and Forestry (DWAF) 2000 - 2008: Georequests Department of Water Affairs (DWA): 2013. National Water Resource Strategy 2nd Edition
Logic: Groundwater is an important part of the picture of a country’s water resources. The more groundwater of good quality available per capita, the higher the probability that a country can sustainably manage its groundwater resources, e.g. for agricultural production.
Discussion: South Africa is a drought prone country with an annual precipitation of about 500 mm. This is very low when compared to the world average of 860 mm. About 21% of the country’s surface area receives less than 200 mm precipitation per year. Globally South Africa is ranked among the 20 most water scarce countries in the world. Groundwater is a substantial resource in many parts of the country, but the quantity that is produced within the country is quite low. The most recent estimate of the capacity of groundwater resource at the highest guarantee is 7 500 million m3 per year, and the current groundwater used is about 2 000 million m3 per year (DWA, 2013).
In terms of South Africa’s overall water consumption; groundwater contributes 15% of the total volume consumed. This percentage belies the fact that over 300 towns and 65% of the population are entirely dependent upon this resource for their water supply. Data on the output of monitoring boreholes in South Africa is available from the DWA. These monitoring boreholes are situated all over South Africa. Looking at the changes in borehole levels over a long period may give a good indication of the usage of ground water as well as the replenishing rates of this water resource. In South Africa ground water is used extensively in rural and arid areas. Generally these resources are quite limited due to the fact that a lot of the underlying geology in the country is composed of hard rock. In South Africa the following 6 aquifers are present: 1. Dolomites, 2. Table Mountain Group Sandstone,

62
3. Coastal sand deposits, 4. Basement granites, 5. Karoo dolerites, 6. Alluvium along perennial rivers.
The average ground water level (measured in meters below ground) from 01/03/2011 to 29/02/2012 equaled -20.040m as measured at 1 367 monitoring points across the country. For the period 1/03/2010 to 28/02/2011 the average distance below ground level equaled -18.66m. National groundwater studies have shown that this resource is presently under-utilized and would thus provide great development opportunities in the country. The Department of Water Affairs is ensuring that the potential for using groundwater resources is thoroughly explored.
Limitations: The initial intention of this variable was to calculate the amount of groundwater available in terms of thousand cubic meters per capita. Unfortunately data was not available in this format and thus the current format was reported on.
Notes: a) Department of Environmental Affairs and Tourism (2006). South Africa Environment Outlook. A report on the state of the environment. Department of Environmental Affairs and Tourism, Pretoria. b) DWAF 2004. Groundwater Resource Assessment II – Task 1D, Groundwater Identification, DWAF Pretoria.
63
Indicator: Groundwater
Variable: 12
Description: Groundwater quality
Units: Total Dissolved Solids (TDS) (mg/l).
Source: Department of Water Affairs (DWA) 2013. GeoRequests. www.dwa.gov.za Department of Water Affairs (DWA) 2013. National Water Resource Strategy 2nd Edition. www.dwa.gov.za Department of Water Affairs (DWA) 2010. Groundwater Strategy 2010. www.dwa.go.za Department of Water Affairs and Forestry (DWAF) 2000-2007. Water Management System (WMS). Department of Water Affairs and Forestry (DWAF). South African water quality guidelines, volume 1: Domestic use, 2nd Edition, 1996.
Logic: The more groundwater of good quality available per capita, the higher the probability that a country can sustainably manage its groundwater resources, e.g. for agricultural production. The TDS is a measure of the amount of various inorganic salts dissolved in the water.
Discussion: Groundwater quality is one of the main factors restricting the development of available groundwater resources. High concentration of total dissolved solids, nitrates and fluoride are considered to be the most common and serious problems associated with water quality. The electrical conductivity is directly proportional to the TDS, and the TDS can be calculated by using a conversion factor. The conversion factor generally lies between 5.5 and 7.5 and in this particular case 6.5 was used. High TDS levels generally indicate hard water, which can cause scale buildup in pipes, valves, and filters, reducing performance and adding to system maintenance costs.
The interpretations of TDS values are varied. Low concentrations of TDS may have a flat insipid taste. The health effects associated with higher TDS value are minimal at a concentration value between (2 000 and 3 000 mg/TDS). In contrast to this higher concentration of TDS (> 3 000 mg/TDS) may have an unpleasant taste and may also negatively affect the kidneys. Numerical information is a useful guide to the nature of risks in exposing aquatic organisms or terrestrial animals to high TDS levels. Results from the nine different provinces show that the general ground water quality of South Africa is in a good state (less than 2 000 mg/TDS). It only exceeded the 2 000 mg/TDS once during the period of 2000 and 2001 in the Eastern Cape.

64
Groundwater pollution and over-abstraction are serious problems in the country. Poor and deteriorating groundwater quality is widespread and can be attributed to diverse sources in various sectors such as mining, industrial activities, effluent from municipal wastewater treatment works, storm water runoff from urban and especially informal settlements where adequate sanitation facilities are often lacking, return flows from irrigated areas, effluent discharge from industries (DWA-Groundwater Strategy, 2010). Rural communities in parts of the country that are dependent on ground water are negatively affected when the natural mineral content exceeds recommended levels. Untreated or poorly treated waste water is severely affecting the quality of water in many areas. Water of bad quality also impacts negatively on farming, recreation, ecosystems and the economy.
According to United Nation Environmental Programme (UNEP) more than one-third of the world’s population and roughly 2.4 billion people live in water-stressed regions and by 2025 the number is expected to rise to two-thirds. Groundwater tables and river levels are receding in many parts of the world due to human water use. 3.6 billion people die each year from water-related diseases and 98% of water-related deaths occur in the developing world. 884 million people lack access to safe water supplies equating to approximately one in eight people.

65
Figure 15: Ground water quality of the nine provinces in South Africa measured (2000–2012)
All values measured in Electrical Conductivity and then calculated in terms of Total Dissolved SolidsSource: Department of Water Affairs (DWA) 2013. GeoRequests. www.dwa.gov.za
0
500
1000
1500
2000
2500
3000
3500
2000 2001 2002 2003 2004 2005 2006 2007 2008 2009 2010 2011 2012
Groundwater quality per province as Total Disolved Solids(mg/l)
Western Cape Northern Cape Gauteng Eastern Cape KwaZulu-Natal
Mpumalanga North West Free State Limpopo
Unpleasant taste and may affect the kidneys
Minimum health associated effects

66

67
IntroductionEnvironmental sustainability can only be realised if levels of human impacts are low enough not to cause harm to environmental systems. As the level of pollution in-creases in environmental systems, so the capacity of those systems to absorb pollution is reduced.
At some point, the stresses placed on environmental systems are too large, and the system presents symptoms and signs of degradation. This happens when the ‘car-rying capacity’ of the environmental system has been reached.
Stresses on Environmental Systems
Stresses to environmental systems can be human-induced or natural. Extreme weather events such as droughts and floods can place stress on environmental systems, resulting in the system being more susceptible to damage. Human-induced stresses generally result from pollution and wastes. Environmental systems show a thres-hold for assimilating a certain amount of waste products. Once that threshold has been reached, it is highly likely that the system will present with damage, which may or may not recover with time. Examples of human-induced stresses include pesticides and fertilizers contaminating water sources, air emissions such as lead and sulphur dioxide, and household waste disposal in landfills.
Stresses to environmental systems can be trans-boundary in nature, and are generally dynamic in space and time. Trans-boundary stresses would occur when the pol-lution of one country is transmitted into the territory of another country where impacts are experienced. Transmission can occur for example via water flow or air circulation.
The indicators and variables representing stresses on environmental systems are:
• Air pollution - Coal consumption - Vehicles in use per populated area
• Ecosystem stress - Invasion of alien species
• Population pressure - Percentage change in projected population, 1950–2050 - Total fertility rate (TFR) - Migration
68
• Waste and consumption pressures - Ecological footprint - Energy use - Grazing capacity • Water stress - Fertilizer sales - Water stress
For further information on environmental stresses please refer to the following:
United Nations Environment Programme 2004. Global Environment Outlook 3. http://www.unep.org/geo/
United Nations Environment Programme. Global Environment Outlook. http://www.unep.org/geo/
United Nations Environment Programme. Africa Environment Outlook. http://www.unep.org/dewa/Africa/
69
Indicator: Air pollution
Variable: 13
Description: Coal consumption
Units: Terrajoule coal consumed.
Source: Department of Energy (Energy) 2010. South African Energy Synopsis.
Department of Energy (Energy) 2009. National Energy Balances. Department of Minerals and Energy Affairs (DME) 2006. Digest of South African Energy Statistics.
Logic: Coal fired power stations emit higher CO2 levels and other air pollutants than natural gas or oil fired plants, and the energy produced is more carbon intensive.
Discussion: Coal contributes more than 70% of South Africa’s primary energy. South African coal is nearly all bituminous, with very little anthracite. It is generally of low quality with high ash content. However, sulphur levels are low at about 1%. South Africa has proven coal reserves of 48 Gt, representing 5.7% of total global reserves. The bulk of South Africa’s coal reserves are situated in the central basin, which consists of the Witbank, Highveld, Ermelo, South Rand and KwaZulu-Natal coalfields.
The local coal market for electricity is more likely to expand. Eskom generates over 92% of its electricity from coal and it is probable that new coal stations will be built to meet growing demand for electricity. All other remaining local coal market, about 15%, is in industry and includes mining and quarrying, and household fuel. Household coal is supplied mainly by traders through informal but established networks in townships.
There is a large potential for recovering the energy in discard coal. This would also remove an environmental problem. A likely technology for doing so would be Fluidized Bed Combustion (FBC). Supply of limestone, needed in this process, is an issue that would need to be resolved. About 60% of South Africa’s coal exports go to Europe, the rest to countries along the Pacific Rim. The coal-mining industry has become a major exporter of steam coal, the second biggest in the world after Australia. A small amount of anthracite and blend coking coal is exported. Environmental concerns pose the main challenge to coal as energy source. Not only does the burning of coal cause air pollution, but the mining activities to extract coal also impact negatively on the environment.

70
Acid drainage occurs from coal mine dumps. Extensive use of coal in households countrywide causes indoor air-pollution problems, which have a serious health impact. It has been found that in some cases, especially regarding particulate matter, exposure can exceed World Health Organization (WHO) standards (180 mg.m3) by factors of six to seven during winter, and two to three in summer. A national programme has been established to introduce low smoke alternatives into the townships. Since 1994, the overall consumption of coal increased by just over 35% and the consumption for electricity generation increased by over 48% in the same period (2009). Notes: a) Figures for coal reserves vary. According to the GCIS pocket guide, reserves are about 28.6 billion tons, enough for 50 years of supply. According to Energy Policies for sustainable development in South Africa, 2006, South Africa’s coal reserves were estimated at 53 billion tons in 2002, and that with the present production rate there should be almost 200 years of coal supply left. According to the latest natural resource accounts report for minerals, published by Statistics South Africa in 2004 (Report no. 04-05-02; 1980 to 2001), in 2001 there was 246 years left to depletion, given current rate of extraction and proven resources. (Quoted from: Energy accounts for South Africa, 1995–2001).

71
Figure 16: Coal consumption (Kt) in various sectors in South Africa (1995–2009)
Source: Department of Energy (2010). National Energy Balances. www.energy.gov.za Department of Energy (2010). South African Energy Synopsis. www.energy.gov.za
0
20 000
40 000
60 000
80 000
100 000
120 000
140 000
1995 1996 1997 1998 1999 2000 2001 2002 2003 2004 2005 2006 2007 2008 2009
Coal consumption (Kt)
Electricity generation Synthetic Iron & steel Merchants & domestics Other

72
Year Electricity generation Town gas Iron and
steelMerchants and
domestic Industry Mining Metallurgical Synthetic Trans-port Total (Kt)
Total consump-tion (Terra-
joulea)
Total primary energyb sup-
ply (TJ)1990 71 251 116 6 953 6 963 6 174 452 2 533 40 287 69 134 797 2 709 420 -1991 71 287 49 6 826 7 095 6 075 422 1 696 39 120 36 132 604 2 665 340 -1992 69 271 45 5 791 6 451 6 177 506 1 370 39 960 9 129 580 2 604 558 2 990 6911993 73 595 45 4 937 4 823 5 457 470 2 142 40 249 94 131 812 2 649 421 3 028 7451994 79 247 62 5 767 4 415 517 388 2 003 41 734 42 134 174 2 696 897 3 117 2301995 82 821 60 5 822 6 674 5 172 603 1 509 43 356 54 146 071 2 936 027 3 243 7371996 83 374 10 4 877 5 269 5 557 506 1 313 45 640 17 146 564 2 945 936 3 299 7871997 93 535 - 4 725 6 787 7 325 1 257 1 719 44 392 2 159 679 3 209 548 3 370 2541998 93 262 37 4 350 4 749 6 272 1 517 1 620 45 544 23 157 374 3 163 217 3 268 1981999 93 487 0.4 3 678 4 268 5 076 764 1 406 46 559 - 155 238 3 120 284 3 413 4992000 93 367 - 4 465 3 920 5 175 145 1 272 46 335 - 154 680 3 109 068 3 425 7252001 89 274 - 4 373 3 802 3 387 1 528 1 073 41 682 2 145 122 2 916 952 3 065 6192002 92 726 - 4 728 5 026 4 287 1 508 1 079 41 515 - 150 870 3 032 487 2 961 0262003 103 074 - 4 325 5 780 5 050 1 416 1 685 39 582 - 160 912 3 234 331 3 277 600
2004 109 974 - 4 816 6 774 6 644 1 499 1 953 41 051 - 172 712 3 471 511 3 573 3432005 106 209 - 4 903 7 513 6 808 2 113 2 129 41 445 - 171 120 3 439 512 3 651 7262006 108 705 - 4 710 6 375 6 375 1 973 987 43 758 - 174 967 3 516 837 3 721 1562007 112 168 - 4 604 11 088 3 750 1 965 1 630 45 437 132 180 774 3 633 557 3 842 1312008 126 072 - 4 322 12 157 5 065 1 903 1 369 44 081 203 195 172 3 922 957 4 220 6492009 117 595 - 3 558 11 659 10 126 1 894 3 874 32 956 75 181 737 3 652 910 4 447 884
Table 9: Consumption of coal (Kt)
a) Calorific values calculated based on conversion factors on p59 of the above publication. Standard conversion factor of 20.1 Mj/kg was used. See also Inter-national Energy Agency for statistics for 2004.
http://www.iea.org/Textbase/stats/renewdata.asp?COUNTRY CODE=ZA b) From p3 of Digest of South African Energy Statistics 2006. The values for Tj differ somewhat from above calculation but this may be due to the fact that the
table deals with total supply, whereas the above table deals with total consumption. Difference is less than 3%.(Other includes sectors such as the Metallurgical, Town gas, Mining, Transport and Industry)
Source: Adapted from the Digest of South African Energy Statistics 2009. The National Energy Balances

73
Indicator Air pollution
Variable: 14
Description: Vehicles in use per populated area
Units: Number of registered vehicles (excluding caravans and trailers) per populated land area (at 5 or more persons per square km).
Sources: National Traffic Information System (eNaTIS) 1998–2012. Live vehicle populationa.
Fleet Watch 2002–2010. www.fleetwatch.co.za Department of Environmental Affairs (2013). www.environment.gov.za. Accessed 22 May 2013 Center for International Earth Science Information Network (CIESIN), Columbia University; and Centro Internacional de Agricultura Tropical (CIAT). 2005. Gridded Population of the World Version 3 (GPWv3): Population Density Grids. Palisades, NY: Socioeconomic Data and Applications Center (SEDAC), Columbia University. Available at http://sedac.ciesin.columbia.edu/gpw. Data downloaded 19 November 2008.
Logic: This is a proxy measure of air pollution from the transportation sector, which is a large sector in terms of energy use. This sector has experienced a growth rate of 20% since 1998.
Discussion: Transport activities support increasing mobility demands for passengers and freight in South Africa. Transport activities have resulted in growing levels of motorization and congestion, as a result, the transport sector is increasingly contributing to environmental problems. Environmental impacts linked to the transportation are vast and include: air pollution, greenhouse gas emissions, the use of raw materials and energy to manufacture cars, and the loss of wildlife habitat and fragmentation to develop road networks. With increases in South Africa’s population, there has been an increase in the number of vehicles on the road. This in turn, has increased pressure on the environment and on the human health.
Figure 17 shows the total number of vehicles increased from 7 653 045 in 2006 to 9 522 799 in 2012 (24.43% increased between 2006 and 2012). On a provincial percentage basis the biggest increase was in Limpopo province where the vehicle population increased by 25.56%. The biggest increase per vehicle type was on buses, bus train and midibuses at 40.56%. Motor cars and station wagons contribute a staggering 66.9% of all vehicles on the road followed by LDV’s, panel vans and other light vehicles at 23.57%.
Particulate matter is one of the main pollutants from vehicle emissions. The effects of exposure to particular matter on health have been associated with hospitalization for respiratory or cardiovascular diseases and exacerbation of respiratory diseases, such as asthma. The health effects depend on particle size and chemical composition. The impact of wet and dry deposition of particular matter on eco-systems may cause damage to plants, metal surfaces, fabrics and buildings. Depending on the chemical composition, particulate matter can contaminate soil and water.

74
Carbon monoxide (CO) is a colourless, odourless and poisonous gas, produced by incomplete combustion of carbon fuels. When carbon monoxide enters the bloodstream it reduces the delivery of oxygen to the body’s tissues and cells, because the haemoglobin in the red blood cells has a higher affinity for CO than for oxygen. Exposure to nitrogen dioxide increases the risk to respiratory infections. Nitrogen oxides (NOx) play an important role in the atmospheric reactions that create ozone (O3) and acid rain. Acid rain causes acidification of dams and rivers, damages trees and crops as well as buildings and statues.
Vehicles are major source of both air pollution and congested road particularly in urban areas where vehicles concentration is high. Vehicle emissions contribute to global warming and accounting for large and growing share of greenhouse gas emissions. Much of the effort to reduce pollution from vehicles to date has been in the form of increasingly strict emissions standards on new cars sold in South Africa. These controls have reduced emissions of CO, HC, and to lesser extent NOx despite large increases in the number of vehicles and miles driven.
According to a media statement, the introduction of the Department of Environmental Affairs Zero Emission Electric vehicles is a ground breaking pioneering initiative for the South African automobile market, also referred to as the DEA Green cars. The green cars seek to ensure that South Africa practically contributes to the reduction of environmentally harmful gases by promoting the use of cleaner sources of fuel by the automotive industry (Minister E. Molewa, Department of Environmental Affairs 2013).
Limitations: The Gridded Population of the World dataset was used to calculate the total land area inhabited with a population density greater than 5 persons per square kilometer. This dataset only contains population densities up to the year 2000, and uses a grid of 2.5 arc-minutes resolution. A comparison per province is only possible from 2002 onwards.
Notes: a) Prior to 2002 the data is not available on the internet. The datasets in the National State of Environment Report (2006) obtained from eNaTIS does not give a breakdown per province.
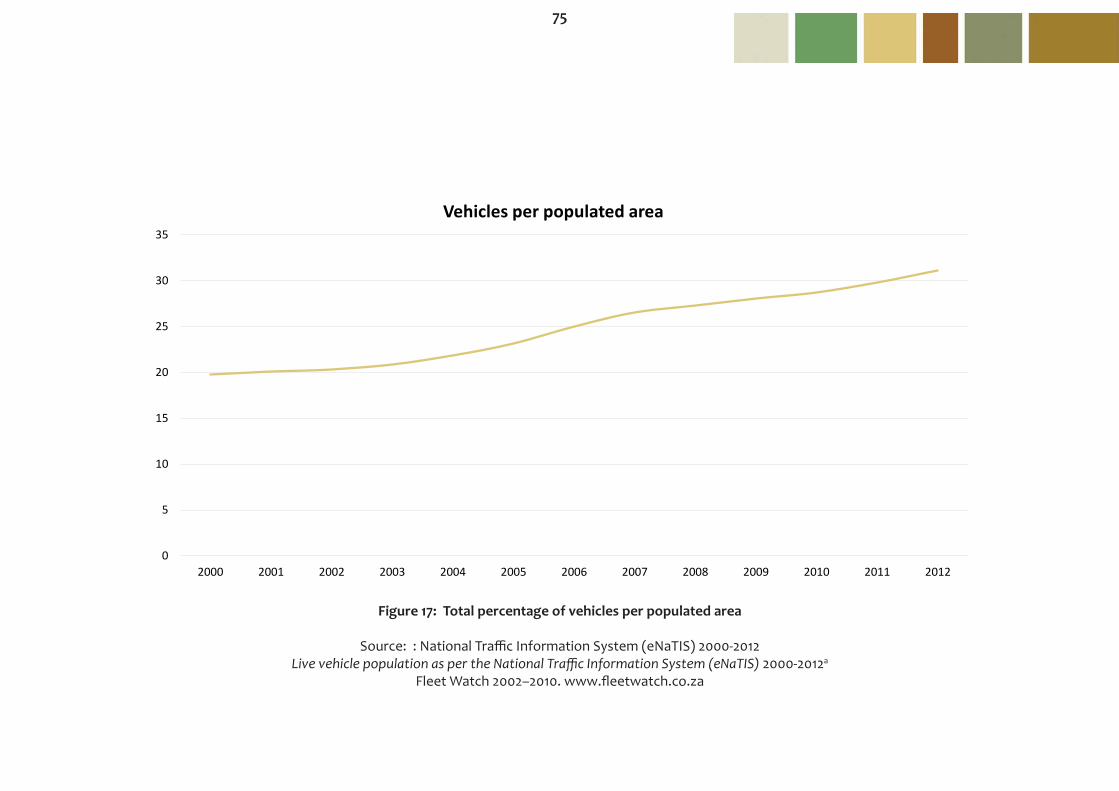
75
Figure 17: Total percentage of vehicles per populated area
Source: : National Traffic Information System (eNaTIS) 2000-2012Live vehicle population as per the National Traffic Information System (eNaTIS) 2000-2012a
Fleet Watch 2002–2010. www.fleetwatch.co.za
0
5
10
15
20
25
30
35
2000 2001 2002 2003 2004 2005 2006 2007 2008 2009 2010 2011 2012
Vehicles per populated area

76
2000 2001 2002 2003 2004 2005 2006 2007 2008 2009 2010 2011 2012Motorcars and station wagons
3 913 470 3 977 255 4 035 774 4 154 593 4 307 943 4 307 943 4 890 206 5 160 844 5 275 541 5 411 093 5 596 521 5 832 197 6 110 660
Minibus 248 837 244 598 240 296 241 938 245 753 255 647 266 175 276 599 279 976 282 941 285 992 284 189 285 859
Buses, bus trains, midi-buses
25 943 25 820 26 390 21 221 28 834 31 963 36 772 39 941 42 893 45 217 47 342 49 254 51 687
Motorcycles, quadracy-cles, tricycles
158 958 158 958 158 356 162 871 188 320 233 083 280 693 312 046 324 172 362 400 327 297 339 932 355 633
LVD’s panel vans. other light load vehicles (smaller than or equal to 3.5 ton)
1 297 383 1 332 591 1 354 669 1 406 217 1 464 171 1 561 507 1 688 418 1 822 829 1 897 078 1 946 292 2 000 915 2 074 437 2 152 779
Trucks (bigger than 3.5 ton)
226 937 225 134 225 329 231 302 242 436 258 867 279 780 302 955 318 118 321 604 325 019 333 255 342 131
Other self propelled vehicles
178 788 173 367 172 207 173 182 199 782 203 349 211 000 199 883 203 420 213 632 216 465 220 724 224 050
Total 5 750 316 6 137 723 6 213 021 6 391 324 6 677 239 6 852 359 7 653 044 8 8115 097 8 341 198 8 5831 80 8 799 551 9 133 988 9 522 799
Table 10: Vehicle population (2000–2012)
Source: : National Traffic Information System (eNaTIS) 2000-2012

77
Indicator: Ecosystem stress
Variable: 15
Description: Invasion of alien species
Units: Number of hectares cleared by the Working for Water programme.
Source: Department of Environmental Affairs (DEA) 2013. Environmental Programmes. Department of Water Affairs (DWA) 2011. Working for Water Programme. www.dwa.gov.za
Agricultural Research Council (ARC) 2010. National Invasive Alien Plant Survey. www.arc.agric.za
Logic: This variable measures the extent to which a country seeks sustainable management practices. Invasive plant species have a detrimental effect on a country’s environment and improved management practices will aim to combat/lessen this effect.
Discussion: Invasive Alien Species are widely considered as a major threat to biodiversity, human livehoods and economic development. Invasive alien species are causing billions of rands of damage to South Africa’s economy every year. The introduction of alien species in the country has the potential to alter ecosystems and landscapes to the detriment of endemic fauna and flora. Invasive species have major social, economic, and environmental impacts including: • Declines in the abundance and diversity of native flora, • Increased soil erosion and sedimentation of natural waterways and water bodies, • Competition with endemic species for sustenance and habitat, • Consumption of seedlings and plant materials, reducing the capacity for the ecosystem to regenerate itself, • Increased spread and establishment of weeds, • Decreased abundance and diversities of aquatic and terrestrial invertebrates, • Decreased and agricultural productivity by reducing the availability of feed for stock, • Damage to fences and other infrastructure. Invasive species threaten indigenous biodiversity and they also have serious socio-economic impacts including threats to water security, reduced productivity of rangelands, increased fire risk, and impacts on crop agriculture. Invasive alien plants impact on river habitat and water yield, consuming an estimated 7% of South Africa’s total annual runoff.
78
In South Africa, a conservatively estimated R6.5 billion worth of ecosystem services are lost each year as a result of invasive alien plants, a value that would be more than six times higher had no management of these plants been carried out. Invasive species are not evenly distributed across the South African landscape and seascape. More is known about the distribution of invasive woody plant species than other groups of invasive species.
Since the inception of Working for Water programme an estimated ten million hectares of South Africa’s land area had been invaded by invasive woody plants. The total area of land infested increased from an estimated 10 million hectares in 1995 to approximately 20 million hectares (16% of South Africa’s land area) in 2007 (National Invasive Alien Plant Survey, 2010).
The Working for Water (WfW) program was launched in 1995 and its purpose was to eliminate alien plant species from invaded areas in partnership with communities (to whom job opportunities are provided) and various government departments. There are 9 regions where the Environmental programmes are currently underway in South Africa and these are the following:
• Western Cape, • Eastern Cape, • Mpumalanga, • KwaZulu-Natal, • Limpopo, • Gauteng, • North-West, • Northern Cape and • Free State.
The programme essentially has two areas of focus when eliminating alien plant species and these are initial clearance and follow-up programmes as shown in (Figure 18). Since its inception in 1995, the programme has cleared more than one million hectares of invasive alien plants. In 2012/13 the programme has cleared 155 186 hectares in the Initial clearance and 630 838 hectares on the follow-up clearance. There has been a marked increase in the areas cleared under the follow-up programmes to ensure that those areas cleared under the initial programme remain free of alien plant infestation. Apart from focusing their efforts on the clearing of invasive plant species the programme also focuses on various community upliftment programs such as the education of the community in matters as HIV and AIDS. The clearing of invasive alien species is done by a number of different avenues:
• Mechanical methods, • Chemical methods, • Biological control, • Integrated methods (encompassing all three above mentioned methods).

79
There are generally three major steps when controlling invasive species and these are:
• The initial control (a drastic reduction of the population), • Follow-up control (control of seedlings etc.), • Maintenance control.
Addressing the challenge of invasive alien species create opportunities linked to restoring ecosystem functioning, securing the provision of ecosystem services and creating employment. Working for Water programme uses labour-intensive methods to clear invasive woody plants, supporting job creation and relieving poverty as well as protecting scarce water resources and restoring productive land and biodiversity. From its inception in 1995/96 to 2012/13, the programme created more than 160 000 full time equivalent employment.

80
Figure 18: Number of hectares cleared in initial and follow-up attempts by the Working for Water programme (1995-2013)
Source: Department of Environmental Affairs (DEA) 2013. Environmental Programmes. www.environment.gov.zaDepartment of Water Affairs and Forestry (DWAF) 1995-2008. Working for Water Programme
-
200 000
400 000
600 000
800 000Number of hectares cleared in initial and follow-up programmes
Initial FUP

81
Indicator: Population pressure
Variable: 16
Description: Percentage change in projected population, 1950–2050
Units: Percentage change in projected population, 1950–2050.
Sources: Statistics South Africa (Stats SA) 2013. Mid-year population estimates, 2013. Statistical release P0302. www.stassa.gov.za
Bureau of Market Research, University of South Africa. Population and Household Projections, 2001-2021. Media release 2007-05-23.
Population Division of the Department of Economic and Social Affairs of the United Nations Secretariat, World Population Prospects: The 2012 Revision and World Urbanization Prospects. http://esa.un.org (Accessed: 3rd June 2013)
Logic: The projected change in population provides an indication of the trajectory of population change, which has an impact on a country’s per capita natural resource availability and environmental conditions.
Discussion: South Africa, like many developing countries, is moving through a demographic transition, where dropping death rates are followed by declining birth rates, and the combined outcome is a declining rate of natural population increase. Although there is a decline in the natural population increase the implied population growth rate for the country has shown a slight increase. This increase can be attributed to the high rate of immigration taken into account in this projection.
The common wisdom two decades ago was that the population would grow steadily into the new millennium, albeit at a declining rate. HIV and AIDS have prompted a serious revision of earlier projections, however, with the prospect of a declining population becoming ever more likely. At best, population projections are based on assumptions and scenarios, and HIV and AIDS has added a layer of complexity to the calculations. For projections to assess the impact of HIV and AIDS, forecasts of prevalence are needed (that is, forecasts of the proportion of the country’s total population that is infected at any particular time), as well as forecasts of when prevalence is likely to peak and trends in AIDS-related deaths.
For 2013, Statistics South Africa (Stats SA) estimates the mid-year population at 52.98 million. Approximately fifty-one per cent (approximately 27.16 million) of the population is female. This release uses the cohort-component methodology to estimate the 2013 mid-year population of South Africa. The estimates cover all the residents of South Africa at the 2013 mid-year, and are based on the latest available information. Estimates may change as new data become available. Gauteng covers the largest share of the South African population. Approximately 12.7 million people (24.0%) live in this province. KwaZulu-Natal is the province with the second largest population, with 10.5 million people (19.7%). Northern Cape has approximately 1.16 million people (2.2%) and it remains the province with the smallest share of the South African population.

82
According to the 2012 Revision of the official United Nations population estimates and projections, the world population of 7.2 billion in mid-2013 is projected to increase by almost one billion people within the next twelve years, reaching 8.1 billion in 2025, and to further increase to 9.6 billion in 2050 and 10.9 billion by 2100 .These results are based on the medium-variant projection, which assumes a decline of fertility for countries where large families are still prevalent as well as a slight increase of fertility in several countries with fewer than two children per woman on average.
Limitations: To project the population until 2050, assumptions regarding future trends in fertility, mortality, levels of HIV/AIDS and international migration are made. There seems to be some agreement between the projections made by the Bureau of Market Research at the University of South Africa, and those made by the Population Division of the Department of Social Affairs of the UN. The projections by the US Census Bureau shows a lower population in the outer years.
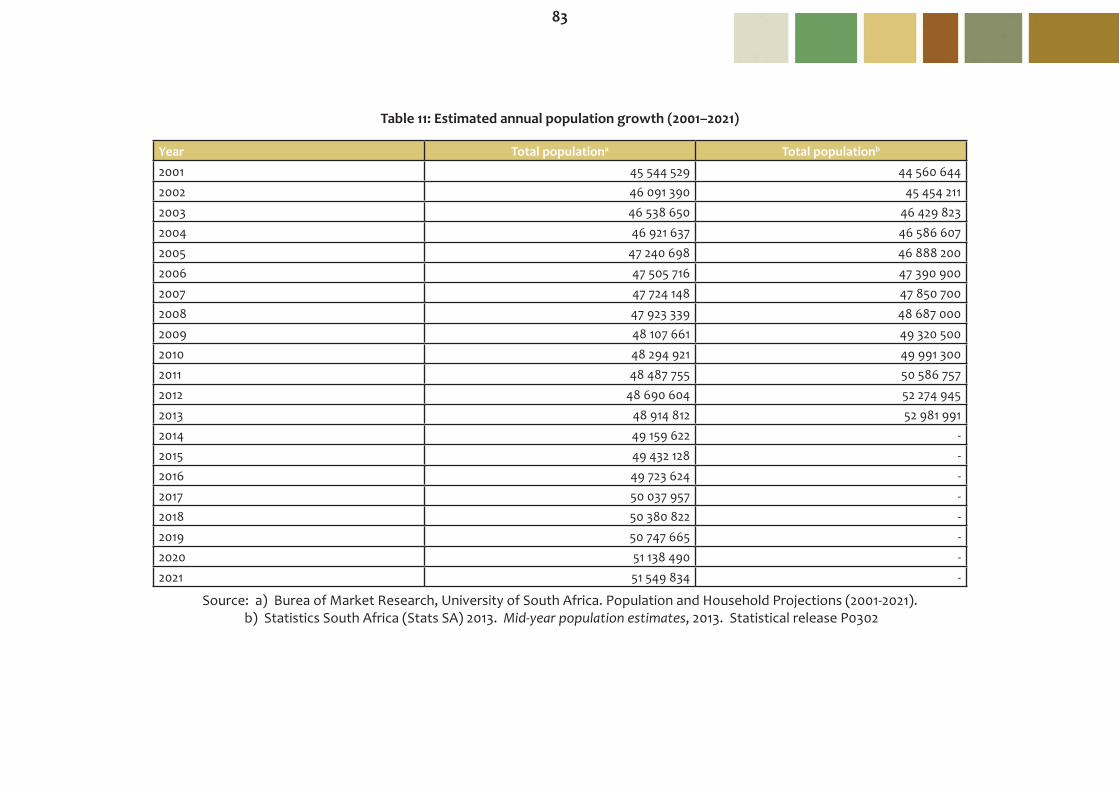
83
Year Total populationa Total populationb
2001 45 544 529 44 560 6442002 46 091 390 45 454 2112003 46 538 650 46 429 8232004 46 921 637 46 586 6072005 47 240 698 46 888 2002006 47 505 716 47 390 9002007 47 724 148 47 850 7002008 47 923 339 48 687 0002009 48 107 661 49 320 5002010 48 294 921 49 991 3002011 48 487 755 50 586 7572012 48 690 604 52 274 9452013 48 914 812 52 981 9912014 49 159 622 -2015 49 432 128 -2016 49 723 624 -2017 50 037 957 -2018 50 380 822 -2019 50 747 665 -2020 51 138 490 -2021 51 549 834 -
Source: a) Burea of Market Research, University of South Africa. Population and Household Projections (2001-2021). b) Statistics South Africa (Stats SA) 2013. Mid-year population estimates, 2013. Statistical release P0302
Table 11: Estimated annual population growth (2001–2021)

84
Year Total population Growth rate % Growth rate period1950 13 683 0001955 15 385 000 2.344 1950-19551960 17 396 000 2.458 1955-19601965 19 814 000 2.602 1960-19651970 22 503 000 2.545 1965-19701975 25 699 000 2.656 1970-19751980 29 077 000 2.47 1975-19801985 32 983 000 2.521 1980-19851990 36 793 000 2.187 1985-19901995 41 427 000 2.36 1990-19952000 44 846 000 1.56 1995-20002005 48 235 000 1.311 2000-20052010 51 452 000 0.956 2005-20102015 53 782 000 0.511 2010-20152020 55 982 000 0.439 2015-20202025 58 335 000 0.443 2020-20252030 60 819 000 0.354 2025-20302035 63 547 000 0.276 2030-20352040 66 550 000 0.204 2035-20402045 69 808 000 0.146 2040-20452050 73 274 000 0.108 2045-2050
Source: Population Division of the Department of Economic and Social Affairs of the United Nations Secretariat, World Population Prospects: The 2012 Revision and World Urbanization Prospects. http://esa.un.org (Accessed: 3rd June 2013)
Table 12: Population growth (1950–2050)

85
Figure 19: Population growth rate (1950–2050)
Source: Population Division of the Department of Economic and Social Affairs of the United Nations Secretariat, World Population Prospects: The 2012 Revision and World Urbanization Prospects. http://esa.un.org (Accessed: 3rd June 2013)
0
0.5
1
1.5
2
2.5
3Population growth rate (percentage)

86
Indicator: Population pressure
Variable: 17
Description: Total fertility rate (TFR)
Units: Average number of children per woman.
Source: Statistics South Africa (Stats SA) 2013. Mid-year population estimates, 2013. Statistical release P0302. www.statssa.gov.za. Logic: Fertility contributes significantly to population growth, and thus to pressures on natural resources.
Discussion: This entry gives a figure for the average number of children that would be born per woman if all women lived to the end of their childbearing years and born children according to a given fertility rate at each age. South Africa’s experience in the fertility transition is among the most advanced in Sub-Saharan Africa. South Africa displays demographic regimes that are typical of both developed and developing worlds. These tend to be linked to socio-economic divisions along racial and urban-rural lines.
Fertility rate has declined from an average of 2.92 children per women in the year 2001 to 2.34 children per women in 2013. The estimates show that fertility in South Africa is on a downward trend. Dropping fertility is due partly to social and economic trends, including economic growth in South Africa, urbanization, social mobility and migration. Empowerment of women in terms of education, family planning and access to jobs has contributed to driving fertility down. HIV/AIDS also contribute in declining the fertility and increasing mortality.
Population change profoundly affects the environment. The demographic trends such as natural population growth and urbanisation increased the pressure on land, air, energy and water resources. High level of poverty and unemployment also contribute to further heavy reliance on natural resources.

87
Year South Africa2001 2.922002 2.712003 2.682004 2.612005 2.562006 2.532007 2.532008 2.522009 2.512010 2.502011 2.442012 2.392013 2.34
Table 13: Estimated total fertility rate (2001–2013)
Source: Statistics South Africa (Stats SA) 2013. Mid-year population estimates, 2013. Statistical release P0302
Figure 20: Estimated total fertility rates in South Africa (2001–2013)Source: Statistics South Africa (Stats SA) 2013. Mid-year population estimates, 2013. Statistical release P0302
0
0.5
1
1.5
2
2.5
3
2001 2002 2003 2004 2005 2006 2007 2008 2009 2010 2011 2012 2013
Estimated total fertility rate (2001-2013)

88
Indicator: Population pressure
Variable: 18
Description: Migration
Units: Number of people.
Source: Statistics South Africa (Stats SA) 2013. Mid-year population estimates 2013. Statistical release P0302. www.statssa.gov.za Statistics South Africa (Stats SA) 2012. Documented immigrants in South Africa. Statistical release P0351.4. www.statssa.gov.za
Logic: Migration (Inter-city, inter-provincial and rural-to-urban migration) can create additional demands for water resources, energy supplies, waste disposal sites, housing and biological resources. This variable aims to investigate the migration patterns between provinces in South Africa between 2001 and 2006 and furthermore provides some predictions on future migration trends between provinces (2006–2011).
Discussion: Human migration is movement by humans from one place to another, sometimes over long distances or in large groups. Unlike birth and death, migration is not a once-off event in a person’s life. It is driven by complex interactions of social, economic and political factors. There are varied ways in which migration can be categorized such as internal or international. Internal migration relates to population movement within the borders of a country whilst international migration deals with movement across the borders of a country. These movements are always linked to two locations namely – the place where it starts and the place where it ends. Thus an international migrant is always an emigrant with respect to the previous country of residence; and an immigrant with reference to the current country of residence.
The Mid-year population estimates Survey performed by Statistics South Africa show that Gauteng and Western Cape are the provinces that receive the highest number of migrants, Mpumalanga and North West provinces also received positive net migration. The Eastern Cape, Free State and Limpopo experienced the largest outflow net immigration rate throughout the period 2001-2011.

89
Figure 21: Provincial emigration and immigration rates (2001–2006)
Source: South African Cities Network 2006. State of the Cities report 2006
0 200 000 400 000 600 000 800 000 1000 000
Eastern Cape
Free State
Gauteng
KwaZulu-Natal
Limpopo
Mpumalanga
Northern Cape
North West
Western Cape
Provincial emigration and immigration rates during 2001-2006
Immigration Emigration

90
Figure 22: Estimated provincial migration streams (2006–2011)
Source: South African Cities Network 2006. State of the Cities report 2006
0 200 000 400 000 600 000 800 000 1000 000
Eastern Cape
Free State
Gauteng
KwaZulu-Natal
Limpopo
Mpumalanga
Northern Cape
North West
Western Cape
Estimated provincial migration streams 2006 - 2011
Immigration Emigration
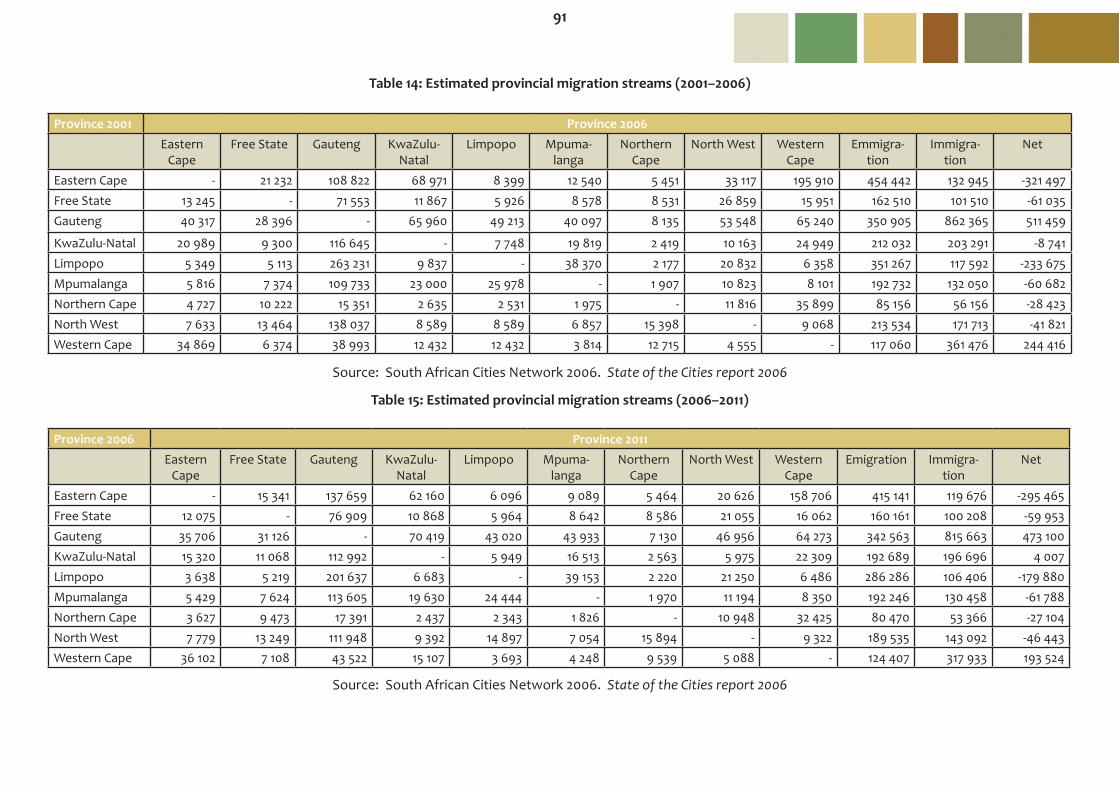
91
Province 2001 Province 2006Eastern
CapeFree State Gauteng KwaZulu-
NatalLimpopo Mpuma-
langaNorthern
CapeNorth West Western
CapeEmmigra-
tionImmigra-
tionNet
Eastern Cape - 21 232 108 822 68 971 8 399 12 540 5 451 33 117 195 910 454 442 132 945 -321 497Free State 13 245 - 71 553 11 867 5 926 8 578 8 531 26 859 15 951 162 510 101 510 -61 035Gauteng 40 317 28 396 - 65 960 49 213 40 097 8 135 53 548 65 240 350 905 862 365 511 459
KwaZulu-Natal 20 989 9 300 116 645 - 7 748 19 819 2 419 10 163 24 949 212 032 203 291 -8 741Limpopo 5 349 5 113 263 231 9 837 - 38 370 2 177 20 832 6 358 351 267 117 592 -233 675Mpumalanga 5 816 7 374 109 733 23 000 25 978 - 1 907 10 823 8 101 192 732 132 050 -60 682Northern Cape 4 727 10 222 15 351 2 635 2 531 1 975 - 11 816 35 899 85 156 56 156 -28 423North West 7 633 13 464 138 037 8 589 8 589 6 857 15 398 - 9 068 213 534 171 713 -41 821Western Cape 34 869 6 374 38 993 12 432 12 432 3 814 12 715 4 555 - 117 060 361 476 244 416
Source: South African Cities Network 2006. State of the Cities report 2006
Province 2006 Province 2011Eastern
CapeFree State Gauteng KwaZulu-
NatalLimpopo Mpuma-
langaNorthern
CapeNorth West Western
CapeEmigration Immigra-
tionNet
Eastern Cape - 15 341 137 659 62 160 6 096 9 089 5 464 20 626 158 706 415 141 119 676 -295 465Free State 12 075 - 76 909 10 868 5 964 8 642 8 586 21 055 16 062 160 161 100 208 -59 953Gauteng 35 706 31 126 - 70 419 43 020 43 933 7 130 46 956 64 273 342 563 815 663 473 100KwaZulu-Natal 15 320 11 068 112 992 - 5 949 16 513 2 563 5 975 22 309 192 689 196 696 4 007Limpopo 3 638 5 219 201 637 6 683 - 39 153 2 220 21 250 6 486 286 286 106 406 -179 880Mpumalanga 5 429 7 624 113 605 19 630 24 444 - 1 970 11 194 8 350 192 246 130 458 -61 788Northern Cape 3 627 9 473 17 391 2 437 2 343 1 826 - 10 948 32 425 80 470 53 366 -27 104North West 7 779 13 249 111 948 9 392 14 897 7 054 15 894 - 9 322 189 535 143 092 -46 443Western Cape 36 102 7 108 43 522 15 107 3 693 4 248 9 539 5 088 - 124 407 317 933 193 524
Table 14: Estimated provincial migration streams (2001–2006)
Source: South African Cities Network 2006. State of the Cities report 2006
Table 15: Estimated provincial migration streams (2006–2011)
92
Indicator: Waste and consumption pressures
Variable: 19
Description: Ecological footprint
Units: Hectares of biological productive land required per capita.
Source: Living Planet Reports 2000 - 2012. Biodiversity, biocapacity and development. www.wwf.org.za
Redefining Progress. Ecological Footprint of Nations 2006. Logic: The Ecological Footprint is a measure of how much land and water area a human population requires to produce the resources it consumes and to absorb its wastes under prevailing consumption levels and technology.
Discussion: The Ecological Footprint measures how much land and water area a human population requires to produce the resources it consumes and to absorb its wastes under prevailing consumption levels and technology. The footprint of a country includes all the cropland, grazing land, forest, and fishing grounds required to produce the food, fibre, and timber it consumes, to absorb the wastes emitted in generating the energy it uses, and to provide space for its infrastructure.
Results from Ecological Footprint analysis shed light on a country’s ecological performance. For example, the National Footprint Accounts (NFA) identify whether or not a country’s Ecological Footprinta exceeds its biological capacityb. A country has an ecological reserve if its Footprint is smaller than its biological capacity. Otherwise it runs an ecological deficit. Since the 1970’s the world has been in ecological overshoot with the annual demand on resources exceeding what the Earth generates within one year. At this present moment in time it takes the earth one year six months to generate the resources that are consumed within one year. The 20th of August 2013 marked the overshoot day which is the date when humanity has exhausted its resources for the entire year. Looking at the trends of the dates on which overshoot day falls each year it is clear that this day arrives earlier each year.
In 2008, the combined Ecological Footprint exceeded the earth’s biocapacity by more than 50%. During this same period the Ecological Footprint per person in South Africa was 2.59 global hectaresc which is somewhat higher than average for Africa (1.45 hectares per person) and somewhat lower than the global average of 2.7 hectares per person. During 2010 South Africa had an ecological reserve of (-)1.38 global hectares per capita.

93
The biocapacity has decreased from 3.2 global hectares per person in 1961 to 1.8 global hectares per person in 2008. It is clear that human development, based on increased consumption and a reliance on fossil fuels coupled with population growth and overall poor management and governance of natural resources is unsustainable. A vast number of countries and populations already face risks from biodiversity loss, degradation of ecosystem services and climate change which include aspects such as food, water and energy scarcity, an increase in vulnerability to disasters and health risks. Some governments and businesses have started efforts to mitigate the abovementioned risks by for example promoting renewable energy, resource efficiency and a more environmentally friendly production and socially inclusive development.
Limitations: The national figure masks regional differences. The Ecological Footprint methodology is still under development which makes comparisons with previously published data difficult.
Notes: a) A country’s Ecological Footprint is determined by its population, the amount consumed by its average resident, and the resource intensity used in providing the goods and services consumed. It includes the area required to meet people’s consumption from cropland (food, animal feed, fibre, and oil); grassland and pasture (grazing of animals for meat, hides, wool, and milk); fishing grounds (fish and seafood); and forest (wood, wood fibre, pulp, and fuel wood). It also estimates the area required to absorb the CO2 released when fossil fuels are burned, less the amount taken up by the oceans. The footprint of nuclear power, about 4% of the global footprint, is included by estimating the footprint for the equivalent amount of energy from fossil fuels. The area used for a country’s infrastructure, including hydropower, is included as the built-up land footprint component.
b) A country’s bio-capacity is a function of the number and type of biologically productive hectares within its borders, and their average yields. More intensive management can boost yields, but if additional resources are used this also increases the footprint. A global hectare is a hectare with world-average ability to produce resources and absorb wastes.

94
Figure 23: South Africa’s ecological footprint, bio-capacity and ecological reserve or deficit compared to that of the World and Africa
Source: Living Planet Report 2002 - 2010. Biodiversity, biocapacity and development. www.wwf.org.za
- 2
0
2
4
6
1996 1999 2001 2003 2005 2007 2008 2003 2005 2007 2008 2003 2005 2007 2008
Total ecological footprint, bio-capacity and ecological reserve/deficit (global ha/person) for South Africa, the world and Africa
Total ecological footprint Total bio-capacity Ecological deficit or reserve
World Average Africa AverageSouth Africa

95
Year Total ecological footprint (Global ha/person) Total bio-capacity (Global ha/person) Ecological deficit or reserve SA 2008 2.6 1.2 -1.4SA 2007 2.3 1.1 -1.2SA 2005 2.1 2.2 0.1SA 2003 2.3 2 -0.3SA 2001 2.8 2 -0.8SA 1999 4.02 2.42 -1.6SA 1996 3.81 2.27 -1.09World Average 2008 2.7 1.8 -0.9Africa Average 2008 1.5 1.5 0.7
Note: Freshwater is not included in the Ecological Footprint because the demand for and use of this resource cannot be expressed in terms of the global hectares that make up the footprint. It is nonetheless critical to both human and ecosystem health. South Africa currently withdraws about 25% from the available water, most by
the agricultural sector. (Living Planet Report 2006, p13).
Value for SA for 1999 replaced in data tables with 2001 data which shows footprint in 2001 to be 2.19. Source: Living Planet Report 2002 - 2010. Biodiversity, biocapacity and development. www.wwf.org.za
Table 16: Ecological Footprint (global hectares per person)
96
Indicator: Waste and consumption pressures
Variable 20
Description: Energy use
Units: Terrajoule per year.
Source: Department of Energy (Energy) 2010. Digest of South African Energy Statistics. www.energy.gov.za. Department of Mineral and Energy (DME) 2006. Digest of South African Energy Statistics
Department of Energy (Energy) 2010. National Energy Balances Version 4. www.energy.gov.za.
Logic: The combustion of fossil fuels for energy purposes is the major contributor to carbon dioxide (greenhouse gas) emissions. In South Africa, the energy sector is responsible for more than 70% of the total national carbon dioxide emissions. Over 90% of South Africa’s energy supply is the result of burning fossil fuels.
Discussion: Internationally, coal is currently the most widely used primary fuel, accounting for approximately 36% of the world’s electricity production (http://www.eskom.co.za/c/article/200/coal-power/, 12/09/2012). This situation is likely to remain until at least 2020. Energy is one of the most important contributors to an economy, both through direct consumption by households and as an important input into economic production efforts. Both the production and the use of energy have considerable impacts on the environment. These impacts differ depending on the energy source utilized or produced. Negative impacts include: air pollution, reduction in water quality, changes in land use and impacts relating to the extraction, transport and use of fossil fuels.
South Africa is a country endowed with abundant energy resources. Fossil fuels, such as coal, uranium, liquid fuel, and gas, play central a role in the socio-economic development of South Africa, while simultaneously providing the necessary infra-structural economic base for the country to become an attractive host for foreign investment in the energy sector.
Coal (the country’s major indigenous energy resource) has traditionally dominated the energy supply sector in South Africa, from as early as 1880. Presently, about 77% of our country’s primary energy needs are provided by coal (http://www.eskom.co.za/c/article/200/coal-power/, 12/09/2012). This is unlikely to change significantly in the next decade, due to the relative lack of suitable alternatives to coal as an energy source. Coal is also used to generate most of the country’s electricity and a significant proportion of its liquid fuels. Because of this, South Africa is the 14th highest emitter of greenhouse gases. Energy use causes significant environmental change – taking the form of air pollution, water pollution, biodiversity loss, and land use change. The burning of fossil fuels for energy releases approximately 80% of all human-induced greenhouse gas emissions in the country.

97
The country is however committed to reducing emissions, and is a signatory to the United Nations Framework Convention on Climate Change (UN FCCC) and the Kyoto Protocol. A White Paper on Renewable Energy (2003) has set a target of 10 000 GWh of energy to be produced from renewable energy sources (mainly from biomass, wind, solar and small-scale hydro) by 2013.
Figure 24: Primary energy supply from fossil fuels and non-fossil fuels (1992–2009)
Source: Department of Energy (Energy) 2009. Digest of South African Energy Statistics. Department of Mineral and Energy (DME) 2006. Digest of South African Energy Statistics
Department of Energy (Energy) 2009. National Energy Balances Version 4
0
1 000 000
2 000 000
3 000 000
4 000 000
5 000 000
6 000 000
1992 1993 1994 1995 1996 1997 1998 1999 2000 2001 2002 2003 2004 2005 2006 2007 2008 2009
Primary energy supply (Terrajoules)
fossil fuels non-fossil fuels
98
Indicator: Waste and consumption pressures
Variable: 21
Description: Grazing capacity
Units: Hectares per livestock unit.
Source: Morgenthal, T.L., Newby, T., Smith, H.J.C., and Pretorius, D.J. 2004. Developing and refinement of a grazing capacity map for South Africa using NOAA (AVHRR) satellite-derived data. Report GW/A/2004/66. Agricultural Research Council (ARC) - Institute for Soil, Climate and Water, Pretoria.
Department of Environmental Affairs and Tourism (DEAT) 2006. South Africa Environment Outlook. A report on the state of the environment. Pretoria.
Logic: The long-term grazing capacity of South Africa, based on 13 years of satellite data, is shown in the map below. Grazing capacity is clearly related to rainfall, with an east–west decrease in grazing capacity across the country.
Discussion: Grazing capacity is considered to be the average number of animals that a particular area will sustain over-time. The main forage resource for livestock in South Africa is rangeland grazing. In the higher rainfall zones crop residues are a very important food supplement in the communal areas during the dry season.
Approximately 69% of agricultural land in South Africa is used for extensive grazing because it is unsuitable for more intensive uses. Total animal production has been on the increase since 1975. Areas used for grazing declined in the 1990’s owing to expanding human settlements and activities (such as crops, forestry, conservation, and mining). This decline was most notable in Gauteng and the Western Cape, with their high rates of urbanization, but communal districts also lost grazing lands.

99
Figure 25: Long term grazing capacity (hectares/large stock unit)
Source: Morgenthal, T.L., Newby, T., Smith, H.J.C., and Pretorius, D.J. 2004. Developing and refinement of a grazing capacity map for South Africa using NOAA (AVHRR) satellite-derived data. Report GW/A/2004/66. Agricultural Research Council (ARC) - Institute for Soil, Climate and Water, Pretoria

100
Indicator: Water stress
Variable: 22
Description: Fertilizer sales
Units: Kilograms fertilizer sold per year.
Source: Fertilizer Society of South Africa (FSSA) 2011. www.fssa.org.za. Grain South Africa. Grain SA Fertiliser Report, 2011. www.grainsa.co.za Agricultural Geo-referenced Information System (AGIS). www.agis.agric.za
Logic: Excessive use of fertilizers from agricultural activities has a negative impact on soil and water, altering chemistry and levels of nutrients and leading to eutrophication of water bodies.
Discussion: South Africa imports more than 50 % of its plant nutrient requirements. Although South Africa produces nitrogen-based fertilizer products in the form of LAN and nitrate-based N: P: K blends and can produce all its phosphate requirements, all the country’s potassium and urea requirements needs to be imported. The South African fertilizer industry annually supplies about 2 million tons of fertilizer products (750 000 tons of N + P2O5 + K2O) to the local market at a value of around R3 billion. This represents approximately 20% of the South African chemical industry (excluding oil). Gauteng, Mpumalanga, Limpopo and the North West provinces account for approximately 40% of total domestic fertilizer consumption, and the Free State, KwaZulu-Natal and the Western Cape for approximately 20% each. Maize is estimated to be the largest single consumer of fertilizer, with almost 40% of the total fertilizer market, followed by sugar cane with 15% and wheat with 10% (FSSA, 2010).
Consumption of fertilizer is determined by mainly two factors. The first is the total area planted to fertilizer using crops and the second is the amount of fertilizer these crops use per hectare. Maize and sugar cane are the two biggest users of fertilizer in South Africa, while soft and stone fruit, wheat and vegetables are the other important users (Grain SA Fertilizer Report, 2011). Looking at the total metric tons of fertilizer consumption from 1955 through to 2010 there has been a decrease in the number of tons consumed. Since 1983 the value fluctuates between 550 000 and 650 000 tons. These were interesting considering that the total number of hectares planted has decreased from 9.721 million in 1997 to 7.814 million in 2004. 80% Of South Africa’s land area is used for agriculture and subsistence livelihoods, but only 11% has arable potential the remaining 69% is used for grazing. In the past couple of years there has been an intensification of agriculture which has led to an increase of the input into the land such as fertilizers, pesticides and irrigation. The effects of this increase in fertilizer runoff into water systems could possibly be very significant.
Limitations: Ideally this variable should be fertilizer consumption per hectare of arable land. Arable land refers to that land that has the potential for agricultural purposes therefore the measurement thereof is not easy.

101
Figure 26: Metric tons of fertilizer sales in South Africa (1955–2010)
Source: Fertilizer Society of South Africa (FSSA) 2011. www.fssa.org.za
50000
250000
450000
650000
850000
1050000
1955 1960 1965 1970 1975 1980 1985 1990 1995 2000 2005 2010
Fertilizer sales in South Africa in metric tons (1955-2010)

102
Indicator: Water stress
Variable: 23
Description: Water stress
Units: Balance between local yield and local requirements per water management area.
Source: Department of Water Affairs (2013). National Water Resources Strategy, 2ndEdition. Pretoria. www.dwa.gov.za Department of Water Affairs (2011). Planning level review of water quality in South Africa. www.dwa.gov.za Department of Water Affairs and Forestry (DWAF) 2004. National Water Resources Strategy (NWRS). Pretoria.
Logic: The regional distribution of water availability relative to population and consumption needs is as important as its overall water availability.
Discussion: Water resources management in South Africa is divided into 19 Water Management Areas (WMA). Large-scale inter-basin transfers of water between catchments are a further characteristic of the South African water situation. These transfers are necessary to supplement water to metropolitan areas like Cape Town, Durban, Port Elizabeth and the Gauteng region, which are located far away from major water courses (DWA, 2011).
The quantity of water available for use varies across different catchments depending on a number of conditions. Demands on South Africa’s finite water resources are increasing and as a result competition between South Africa’s water users is also increasing (agricultural, industrial, power generation, mining, and domestic needs). In order for the country to meet these demands all sectors must improve water-use efficiency and conserve water. Agricultural irrigation represents more than 60 percent of the total water requirements in the country, urban requirements constitute about 18 percent and the remaining 15 percent is shared by the other five sectors (rural, power generation, afforestation, transfer out and mining) (DWA, 2013).
The quantity of water available for human use or to support aquatic ecosystems depends on the availability and sustainability of the water resource. Rainfall, surface flows and groundwater recharge are intimately linked in the hydrological cycle and need to be managed in an integrated way.
Limitations: Previous measures of water stress focussed on the percentage of the country where demand exceeds 40% of the available water. Unfortunately no information exists in this regard in South Africa. The best measure of water stress is thus looking at supply and demand at the 19 water management areas.
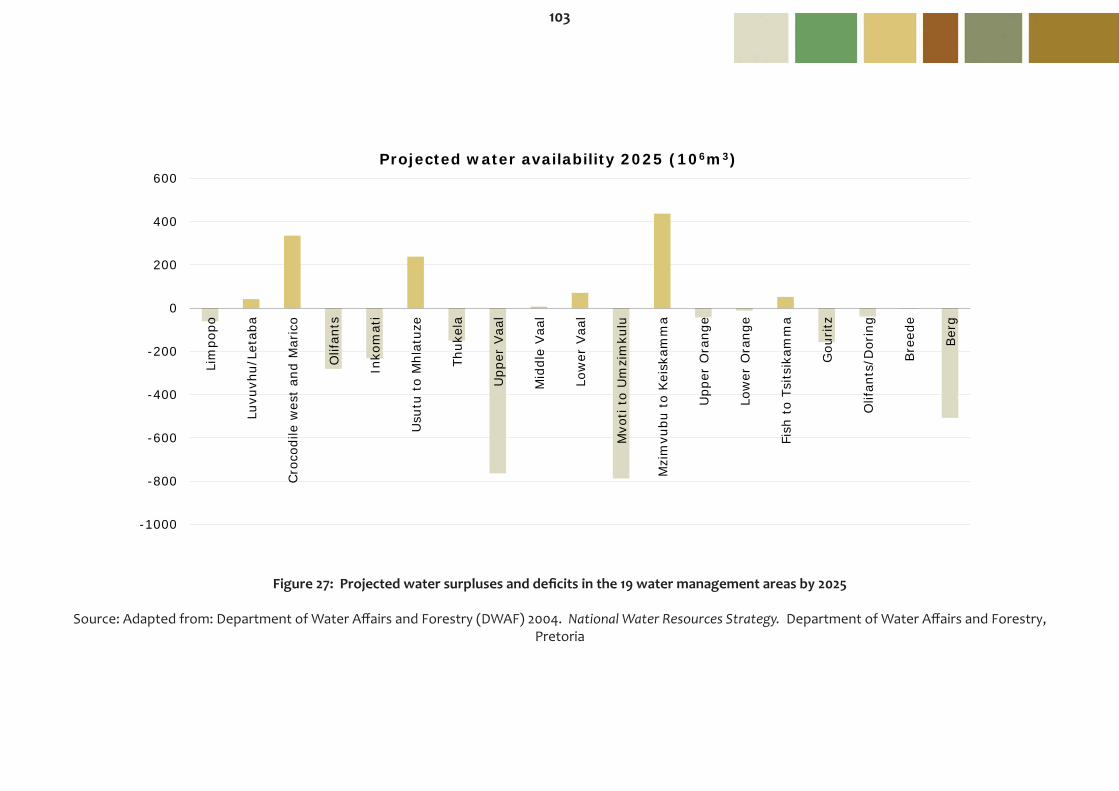
103
-1000
-800
-600
-400
-200
0
200
400
600
Lim
popo
Luvu
vhu/
Leta
ba
Cro
codi
le w
est
and
Mar
ico
Olif
ants
Inko
mat
i
Usu
tu t
o M
hlat
uze
Thuk
ela
Upp
er V
aal
Mid
dle
Vaa
l
Low
er V
aal
Mvo
ti to
Um
zim
kulu
Mzi
mvu
bu t
o Kei
skam
ma
Upp
er O
rang
e
Low
er O
rang
e
Fish
to
Tsits
ikam
ma
Gou
ritz
Olif
ants
/Dor
ing
Bre
ede
Ber
g
Projected water availability 2025 (106m3)
Figure 27: Projected water surpluses and deficits in the 19 water management areas by 2025
Source: Adapted from: Department of Water Affairs and Forestry (DWAF) 2004. National Water Resources Strategy. Department of Water Affairs and Forestry, Pretoria

104
WMA Reliable local yield a Transfers in b Local requirements c Transfers Outb Balanced
1 Limpopo 295 23 379 0 -61
2 Luvuvhu/Letaba 405 0 351 13 413 Crocodile west and Marico 1 084 1 159 1 898 10 3354 Olifants 665 210 1 143 13 -2815 Inkomati 1 036 0 957 311 -2326 Usutu to Mhlatuze 1 124 40 812 114 2387 Thukela 776 0 420 506 -1508 Upper Vaal 1 486 1 630 1 742 2 138 -7649 Middle Vaal 67 911 415 557 610 Lower Vaal 127 646 703 0 7011 Mvoti to Umzimkulu 614 34 1 436 0 -78812 Mzimvubu to Keiskamma 886 0 449 0 43713 Upper Orange 4 755 2 1 122 3 678 -4314 Lower Orange -956 2 100 1 102 54 -1215 Fish to Tsitsikamma 452 653 1 053 0 5216 Gouritz 288 0 444 1 -15717 Olifants/Doring 337 3 380 0 -4018 Breede 897 1 704 196 -219 Berg 602 194 1 304 0 -508
Total for country 14 940 0 16 814 170 -2 044
a) Based on infrastructure in existence and under construction in the year 2000. Also includes return flows resulting from a growth in requirements.b) Transfers into and out of water management areas may include transfers between water management areas as well as to or from
neighbouring countries. Yields transferred from one water management area to another may also not be numerically the same in the source and recipient water man-agement area. For this reason, the addition of transfers into and out of water management areas does not necessarily correspond to the country total.
c) Urban and rural requirements based on high growth in water requirements as a result of population growth and the high impact of economic development. Allow-ance has been made for known developments in urban, industrial, and mining sectors only, with no general increase in irrigation.
d) For more detail for each water management area, see the corresponding tables in Appendix D of NWRS. Source: Department of Water Affairs and Forestry 2004. National Water Resources Strategy (NWRS). Department of Water Affairs and Forestry, Pretoria.
Table 17: Reconciliation of the requirements for and availability of water for year 2025 (million m3/a)

105

106
107
Introduction
Environmental sustainability can only be realized if people and social systems are not vulnerable to environmental change. Vulnerability is affected by an individual’s exposure to environmental hazards, and an individual’s capability to cope with exposure to environmental hazards.
Environmental hazards can be brought on by human activities, or they can have natural origins. Natural hazards include earthquakes, volcanoes, drought and flood. Hazards brought on by human activities can include inappropriate practices such as unsuitable agricultural methods which may exacerbate drought or floods, or water pollution, air pollution and inadequate sanitation facilities.
Human Vulnerability to Environmental Change
Human vulnerability to environmental change should be reduced in order to move towards environmental sustainability. This can be done in a number of ways, either by reducing the risk of environmental hazards or by increasing the ability of humans to cope.
Correct management of the environment will ultimately lead to a reduced likelihood of disasters. This should preferably be done through a precautionary approach which requires early warning of impending environmental disasters and hazards, as well as mitigation of risks associated with environmental disasters and hazards, and response measures for dealing with the aftermath of environmental disasters and hazards. If the environment is managed correctly, disasters caused by human activi-ties will be less likely to occur. In addition, natural environmental disasters may have reduced impact due to the resilience of the natural environment.
The ability of humans to cope with environmental disasters and hazards can vary between individuals and communities, as well as through time. The ability of an indi-vidual or community to cope with and prepare for change will affect their vulnerability to that change. Vulnerability is affected by numerous factors, including access to a wide variety of resources, competition for resources, and current state of health and welfare.
The state of vulnerability is affected by having limited choices, being unable to adapt, being marginalised and dependent on others, and being insecure about the future. The opposite end of the spectrum represents a state of security which is characterised by a diversity of choices, being highly adaptable, having power and control over your situation, and being secure about the future.

108
The indicators and variables representing human vulnerability are:
• Basic human sustenance - Households with access to sanitation - Access to water - Access to refuse removal
• Environmental health - Death rate from respiratory diseases and tuberculosis - HIV prevalence - Malaria - Under five mortality
For further information on human vulnerability please refer to the following:
United Nations Environment Programme 2004. Global Environment Outlook 3. http://www.unep.org/geo/
United Nations Environment Programme, Various. Global Environment Outlook Yearbooks. http://www.unep.org/geo/
United Nations Environment Programme 2002. Africa Environment Outlook. http://www.unep.org/dewa/Africa/
United Nations Environment Programme 2006. Africa Environment Outlook 2. Our Environment, Our Wealth Website http://www.unep.org/dewa/Africa

109
Indicator: Basic human sustenance
Variable: 24
Description: Households with access to sanitation
Units: Number and percentage of households with access to sanitation.
Source: The Presidency. Development Indicators 2012. www.thepresidency.gov.za
Department of Water Affairs (DWA) 2012. National Information System. www.dwa.gov.za. Accessed 27 August 2012 11:15 Department of Water Affairs and Forestry (DWAF) 2006. Annual Report 2005-2006. www.dwaf.gov.za/ Statistics South Africa (Stats SA) 2011. General Household Survey (Statistical release P0318), 2011. www.statssa.gov.za Department of Provincial and Local Government (DPLG) Municipal Infrastructure Grant (MIG) 2004-2007. Logic: This variable is important as it visually indicates population growth within South Africa as well as provides an indication of whether access to basic sanitation has improved within the country. Target 10 of Goal 7 of the Millennium Development Goals requires a halving of the proportion of households without sustainable access to safe drinking water and basic sanitation.
Discussion: In 1994, the new government acknowledged the lack of basic services such as water supply and sanitation as key indicators of the underdevelopment of certain sectors of the community and as critical elements in the experiential manifestation of poverty. The bucket sanitation system was immediately considered an unacceptable level of sanitation. An increased access to sanitation is a key component of development and poverty reduction, as it has major health benefits as well as associated social, economic and environmental benefits. Inadequate sanitation can cause several diseases which are transmitted to humans through exposure to sewage. Sanitation is a critical intervention needed to improve living conditions among South Africa’s poor and to reduce or prevent diarrhoea and other seriously debilitating conditions, especially among children.
An estimation of 2 million households in South Africa do not have adequate sanitation. South Africa has reduced the relative proportion of households without sanitation infrastructure from 50.1% in 1994 to 16.6% in 2012. South Africa’s government set a target of providing sanitation services to all people in the country by 2010 which was not met. As a result, a revised target has been set for 2014 whereby all people in the country must have access to adequate sanitation. It should be noted that the figure reflects the provision of infrastructure and does not reflect actual use if the service has been provided. Access to toilet facilities has increased since 2002. The total number of households still using the bucket system has declined from 609 675 in 1994 to 8 126 in 2012.

110
Year Percentage of HH with access to sanitation infrastructure1994 49.91995 50.91996 51.61997 53.21998 54.41999 56.22000 57.62001 59.22002 62.52003 64.12004 66.12005 69.12006 70.72007 72.6
2008 74.62009 77.12010 79.92011 82.02012 83.4
Table 18: Percentage of households (HH) with access to basic sanitation services
Source: The Presidency. Development Indicators 2012. www.thepresidency.gov.za Department of Water Affairs (DWA) 2012. National Information System. www.dwa.gov.za. Accessed 27 August 2012 11:15
Department of Provincial and Local Government (DPLG) Municipal Infrastructure Grant (MIG) 2004-2007
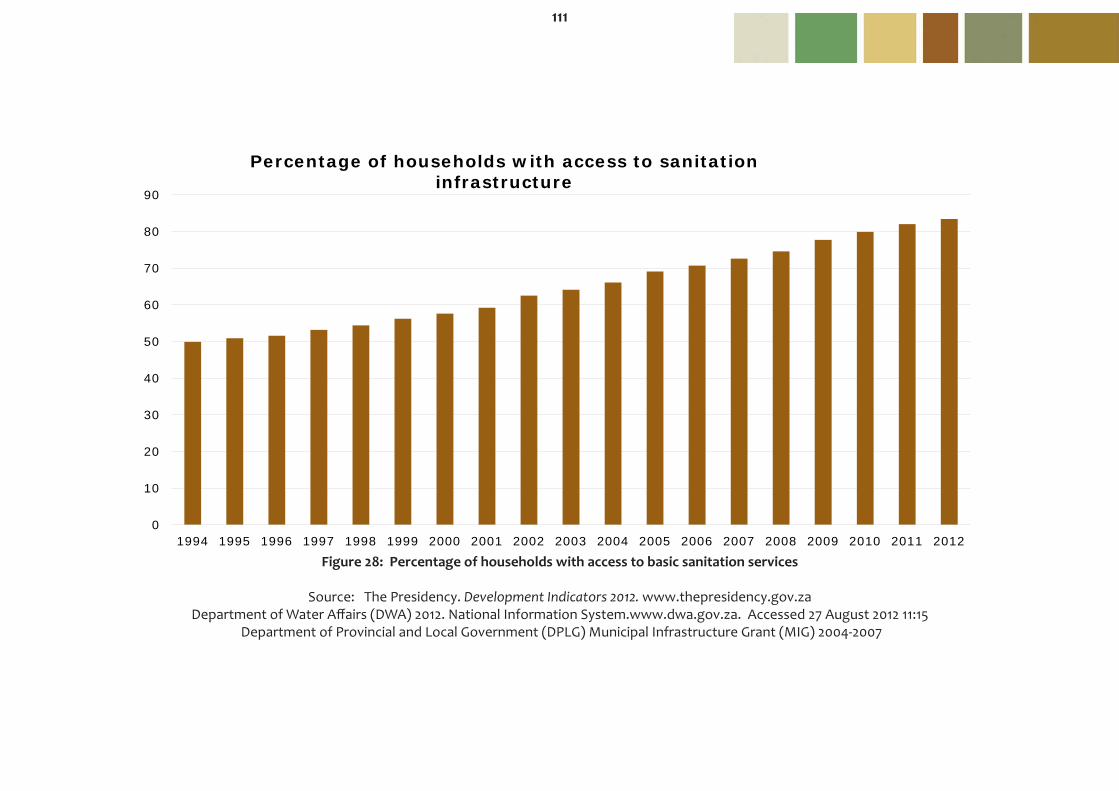
111
Figure 28: Percentage of households with access to basic sanitation services
Source: The Presidency. Development Indicators 2012. www.thepresidency.gov.zaDepartment of Water Affairs (DWA) 2012. National Information System.www.dwa.gov.za. Accessed 27 August 2012 11:15
Department of Provincial and Local Government (DPLG) Municipal Infrastructure Grant (MIG) 2004-2007
0
10
20
30
40
50
60
70
80
90
1994 1995 1996 1997 1998 1999 2000 2001 2002 2003 2004 2005 2006 2007 2008 2009 2010 2011 2012
Percentage of households with access to sanitation infrastructure

112
Year Total number of households Number of households using the bucket system1994 10 150 478 609 6751995 10 347 884 608 7381996 10 550 871 605 4941997 10 759 617 575 5941998 10 974 185 555 9321999 11 194 976 516 8582000 11 422 150 490 0212001 11 656 059 456 7522002 11 950 115 413 4812003 12 139 159 441 6932004 12 396 707 439 7782005 12 656 163 231 0402006 12 802 423 211 5082007 12 879 070 113 0852008 13 028 214 23 0832009 13 104 966 9 0442010 13 283 883 8 4212011 13 362 031 8 5992012 13 754 529 8 126
Table 19: Number of households using the bucket system
Source: The Presidency. Development Indicators 2012. www.thepresidency.gov.zaDepartment of Water Affairs (DWA) 2012. National Information System.www.dwa.gov.za. Accessed 27 August 2012 11:15
Department of Provincial and Local Government (DPLG) Municipal Infrastructure Grant (MIG) 2004-2007

113
Indicator: Basic human sustenance
Variable: 25
Description: Access to water
Units: Percentage of the population of South Africa with access to water.
Source: The Presidency. Development Indicators 2012. www.thepresidency.gov.za Department of Water Affairs (DWA) 2011. Strategic overview of the water sector in South Africa 2011 Department of Water Affairs and forestry (DWAF) 2006. Annual Report 2005–2006. http://www.dwaf.gov.za Population Census 1991, 1996, 2001; Department of Water Affairs and Forestry (DWAF) Internal processes. Department of Provincial and Local Government (DPLG) Municipal Infrastructure Grant (MIG) 2004-2007.
Logic: The percentage of the population with access to improved drinking water supply is related to our capacity to provide a healthy environment, reducing risks associated with water-borne diseases and exposure to pollutants. The Water Service Act (Act No. 108 of 1997) provides for the right of access to basic water supply. The Millennium Development Goals require that countries by 2015 halve the proportion of people without sustainable access to safe drinking water. South Africa has exceeded this goal to date.
Discussion: Historically South Africa has undergone separate development which has ultimately resulted in some areas not having access to basic water supply. A dedicated Basic Services Development Programme has been established that aims to eradicate these historical backlogs which is one of the key challenges facing the South African Government. One of the key target dates under the Basic Services Development Programme is that all people in South Africa have access to a functioning basic water supply facility by 2014.
Prior to 1994, an estimated 40% of the South Africa population had no adequate water supply services. In those rural areas where water supply existed, drinking water quality was often poor and could not be considered safe for human consumption. The resulting impact on primary health was significant with diarrhoea being responsible for some 25% of all deaths in the one to five group and an annual estimated 43 000 deaths and 3 million incidences of illness.
114
Since 1994, South Africa has made remarkable progress towards providing its population with access to basic water supply infrastructure equal to or above RDP levelsa. In 1994 only 61.7% of households had access to basic water services and this figure has increased to 95.5% of households in 2012. As of 2012 approximately 1.9% of households had no access to water and a further 2.6% of households had access to water below RDP levels. This indicator is important as it visually indicates population growth within South Africa as well as provides an indication of whether access to basic water has improved within the country. Target 10 of Goal 7 of the Millennium Development Goals requires a halving of the proportion of households without sustainable access to safe drinking water and basic sanitation.
Notes: a) RDP levels are defined as a minimum quantity of 25 litres of potable water per person per day within 200m of the household which should not be interrupted for more than 7 days in any year. This current water use component translates to 459 million cubic meters (or 13% of urban and rural water use, or 3% of total water use) per annum.

115
Year % HH with access equal to or above RDP levels % HH with access below RDP levels % with no access Total number of households1994 61.7 2.7 35.6 10 150 4781995 61.9 4.4 33.7 10 347 8841996 62.4 6.1 31.5 10 550 8711997 64.3 7.5 28.2 10 759 6171998 65.8 9.0 25.1 10 974 1851999 68.8 10.3 21.0 11 194 9762000 71.0 11.8 17.2 11 422 1502001 73.6 13.2 13.2 11 656 0592002 78.2 11.8 10.0 11 950 1152003 76.3 14.4 9.3 12 139 1592004 79.8 12.1 8.1 12 396 7072005 82.7 10.6 6.7 12 656 1632006 84.7 9.3 6.0 12 802 4232007 87.2 7.8 5.0 12 879 0702008 89.7 6.0 4.3 13 028 2142009 91.8 4.6 3.5 13 104 9662010 93.8 3.4 2.7 13 283 8832011 94.5 3.2 2.3 13 362 0202012 95.5 2.6 1.9 13 754 529
Table 20: Percentage of households (HH) with access to water infrastructure (no access, below RDP and above or equal to RDP levels)
Source: The Presidency. Development Indicators 2012. www.thepresidency.gov.za
Department of Water Affairs (DWA) 2011. Strategic overview of the water sector in South Africa Population Census 1991, 1996, 2001; Department of Water Affairs and Forestry (DWAF) Internal processes; Department of Provincial and Local Government (DPLG) Municipal Infrastructure Grant (MIG) 2004-2007.

116
Figure 29: Percentage of households with no access, access below and access equal to or above RDP levels to water infrastructure
Source: The Presidency. 2013. Development Indicators 2012. www.thepresidency.gov.zaDepartment of Water Affairs (DWA) 2011. Strategic overview of the water sector in South Africa
Population Census 1991, 1996, 2001; Department of Water Affairs and Forestry (DWAF) Internal processes; Department of Provincial and Local Government (DPLG) Municipal Infrastructure Grant (MIG) 2004-2007.
0
20
40
60
80
100
1994 1996 1998 2000 2002 2004 2006 2008 2010 2012
Percentage of access levels to water infrastructure
% HH with access equal to or above RDP levels % HH with access below RDP levels % with no access

117
Indicator: Basic human sustenance
Variable: 26
Description: Access to refuse removal
Units: Number of households with access to various types of refuse removal.
Source: Statistics South Africa (Stats SA) 2002–2013. General Household Survey (Statistical release P0318). http://www.statssa.gov.za The Council for Scientific and Industrial Research (CSIR) 2011. The CSIR’s Municipal Waste Management - Good Practices Toolkit Booklet
Department of Environmental Affairs. 2010. National Policy For The Provision of Basic Refuse Removal Services to Indigent Households.
Logic: The access to refuse removal is a critical part in the healthy functioning of a community.
Discussion: The collection of household refuse is one of the most powerful visual benchmarks of inequality in South Africa. South African municipalities face a number of challenges with respect to delivering an effective and sustainable waste service to all households including: insufficient budget, skilled capacity, lack of appropriate equipment and poor access to service areas. It has emerged over the years that South Africa has a backlog in terms of provisioning of basic refuse removal services. As a result, municipal governments have been turning increasingly to commercialization (i.e privatization, outsourcing) as a way of addressing refuse collection backlog. Most of the households which suffer from the prolonged lack of refuse removal are those from previously disadvantaged localities such as the high density, low-income areas. The proper disposal of household waste and refuse is important to maintain environmental hygiene which plays a vital role in the prevention of many diseases which are caused by waste. Environmental hygiene further impacts on the natural environment and the preservation of important natural assets, such as water resources. Preservation of important natural resources ultimately leads to improvement in the growth of the economy.
Table below showed that, the percentage of households which had access to the refuse disposal services provided by their respective municipality increased from 58.3% in 2002 to 64% in 2012. Access and use of refuse removal services were the lowest in Limpopo where only 20.8% of the population had their refuse removed by the municipality at least once a week. Households in Gauteng (90.9%) and Western Cape (90.8%) were most likely to have their refuse removed by the municipality at least once per week and they were also the ones with the highest access to refuse removal.

118
Province 2002 2003 2004 2005 2006 2007 2008 2009 2010 2011 2012
Removed by local authority/ private company at least once a week 6 401 7 118 6 755 7 503 7 666 7 846 7 833 1 280 7 777 8 357 8 498
Removed by local authority/ private company less often than once a week 246 178 211 149 190 188 271 23 326 279 222
Removed by community members, contracted by the Municipality, at least once a week * * * * * * * 232 583 326 452
Removed by community members, contracted by the Municipality, less often than once a week * * * * * * * 16 34 46 37
Removed by community members at least once a week 65 56 44 43 77 43 75 12 52 59 50
Removed by community members less often than once a week 29 12 17 13 11 30 72 * 19 7 26
Communal refuse dump/ Communal container 357 394 431 433 314 317 223 16 241 265 226
Own refuse dump 3 942 4 373 4 238 4 048 3 919 3 972 4 256 79 4 355 4 491 4 374
No rubbish removal 677 344 415 450 646 664 583 * * * *
Dump or leave rubbish anywhere * * * * * * * 1 059 572 591 480
Other 41 60 67 72 127 122 85 85 92 33 26
Unspecified 23 * 16 16 22 80 49 * 254 303 240
Total 11 781 12 535 12 194 12 727 12 972 13 262 13 447 2 802 14 305 14 757 14 631
Table 21: Number of households in each province with different access levels to refuse removal
Source: Statistics South Africa (Stats SA) 2002–2013. General Household Survey (Statistical release P0318). www.statssa.gov.za

119
Table 22: Percentage of households who have their refuse removed by the municipality (2002–2012)
Year Eastern Cape Free State Gauteng KwaZulu-Natal Limpopo Mpumalanga Northern Cape North West Western Cape South Africa Average
2002 33.0 63.4 88.2 54.8 12.6 38.7 70.3 42.4 84.5 58.32003 34.0 67.5 88.3 55.2 13.6 46.3 65.7 43.5 85.0 59.12004 34.5 67.1 87.0 54.5 14.2 42.7 63.0 44.3 87.7 59.52005 43.3 73.4 84.9 56.9 17.8 39.4 68.7 51.8 91.6 61.7
2006 43.3 78.6 85.2 56.4 19.3 40.2 66.4 49.3 91.9 62.7
2007 44.2 76.0 86.3 53.9 20.5 42.3 67.7 50.2 90.8 62.12008 39.8 76.0 88.1 49.6 15.4 38.2 63.8 47.3 88.3 60.82009 34.5 62.4 82.1 46.4 12.8 31.8 54.8 36.2 73.6 53.12010 43.4 80.6 89.7 52.0 17.1 39.8 67.4 51.4 91.3 63.62011 44.0 81.2 87.9 46.3 16.5 38.5 63.0 50.5 88.1 61.02012 43.2 79.2 90.9 48.5 20.8 39.2 74.8 53.4 90.8 64.0
Source: Statistics South Africa (Stats SA) 2002–2012. General Household Survey (Statistical release P0318). www.statssa.gov.za

120
Indicator: Environmental health
Variable: 27
Description: Death rate from respiratory diseases and tuberculosis
Units: Number of deaths.
Source: Statistics South Africa 2013. Mortality and causes of death in South Africa 2003 - 2010. Statistical release P0309.3.
Logic: Indicator of the degree to which people are affected and impacted on by poor air quality. Poor air quality in a country often manifests in respiratory problems and diseases and also plays a role in the increase of the transmission of infectious diseases.
Discussion: The use of solid fuels in households can lead to death from respiratory diseases and tuberculosis. Using solid fuels such as wood and charcoal is associated with increased mortality from pneumonia and other acute lower respiratory diseases among children, as well as increased mortality from chronic obstructive pulmonary disease and lung cancer (where coal is used) among adults. Air pollution is a threat to human health for many reasons, but especially because poor air quality can lead to respiratory distress. Air pollution aggravates asthma and other allergic respiratory diseases, and can result in adverse pregnancy outcomes, such as stillbirth and low birth weight.
Tuberculosis was the leading cause of death in all provinces except Free State and Limpopo where it ranked second in both provinces. The highest proportion of deaths due to tuberculosis was noted in. Tuberculosis was the leading cause of death during the last three years reporting periods (2008-2010), accounting for around 12% of all deaths each year (12.6% in 2008; 12.0% in 2009; and 11.6% in 2010).
The leading cause of neonatal death in 2010 was respiratory and cardiovascular disorders specific to the perinatal period, which accounted for over 40% of all neonatal deaths. The table provided indicates a huge drop in the number of death caused by both Tuberculosis and Respiratory diseases between the years 2009 and 2010. The number of deaths caused by Tuberculosis decreased by 8.95%, while deaths caused by respiratory diseases decreased by 7.06%.

121
Of the different types of air pollution, indoor air pollution poses by far the most severe threat, accounting for several million premature deaths per year. Yet there are no international targets or action plans, and there is very little regional or national activity. Regarding urban air pollution, policy targets, monitoring networks, and mitigation efforts are most advanced in regions where the problem is least severe. There are no international policy targets, though the World Health Organization (WHO) has set standards that some countries have adopteda.
Notes: a) World Health Organization (WHO) 2002. World Health Report 2002. Geneva, World Health Organization.
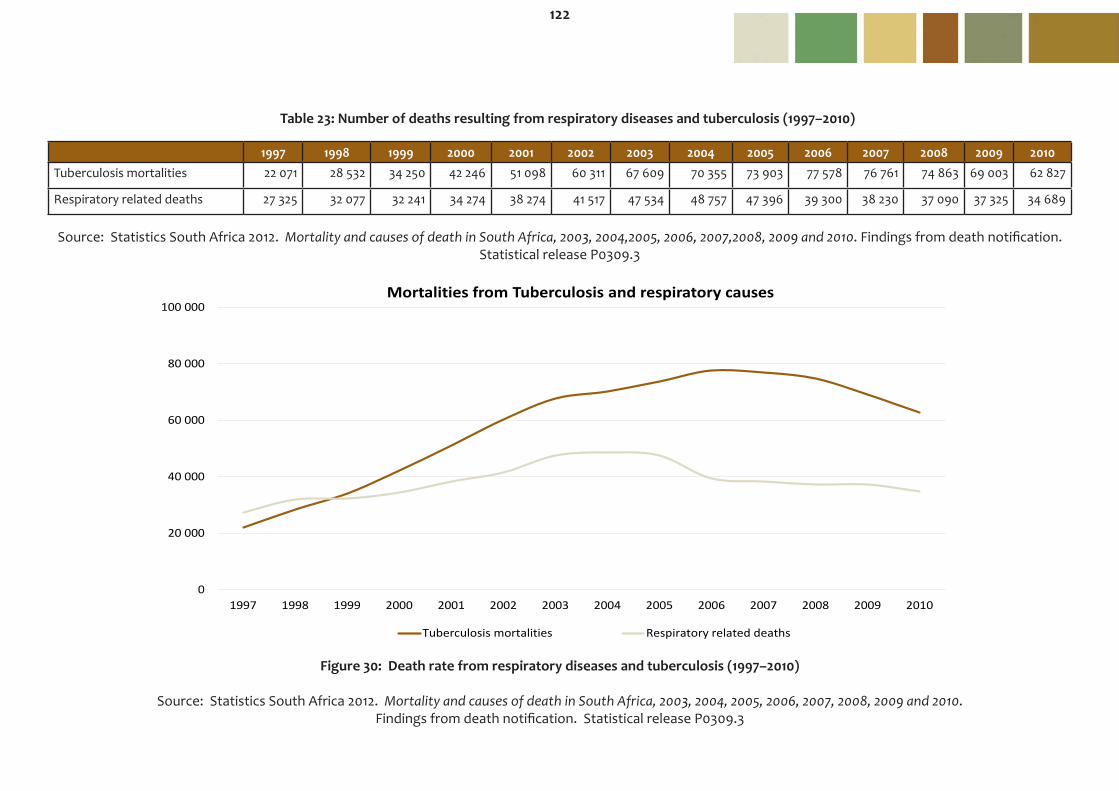
122
Figure 30: Death rate from respiratory diseases and tuberculosis (1997–2010)
Source: Statistics South Africa 2012. Mortality and causes of death in South Africa, 2003, 2004, 2005, 2006, 2007, 2008, 2009 and 2010. Findings from death notification. Statistical release P0309.3
Source: Statistics South Africa 2012. Mortality and causes of death in South Africa, 2003, 2004,2005, 2006, 2007,2008, 2009 and 2010. Findings from death notification. Statistical release P0309.3
1997 1998 1999 2000 2001 2002 2003 2004 2005 2006 2007 2008 2009 2010Tuberculosis mortalities 22 071 28 532 34 250 42 246 51 098 60 311 67 609 70 355 73 903 77 578 76 761 74 863 69 003 62 827
Respiratory related deaths 27 325 32 077 32 241 34 274 38 274 41 517 47 534 48 757 47 396 39 300 38 230 37 090 37 325 34 689
Table 23: Number of deaths resulting from respiratory diseases and tuberculosis (1997–2010)
0
20 000
40 000
60 000
80 000
100 000
1997 1998 1999 2000 2001 2002 2003 2004 2005 2006 2007 2008 2009 2010
Mortalities from Tuberculosis and respiratory causes
Tuberculosis mortalities Respiratory related deaths

123
Indicator: Environmental health
Variable: 28
Description: HIV prevalence
Units: Percentage of people infected by HIV (total population and antenatal attendees).
Source: Department of Health (DOH) 2005 - 2011. The 2011 National Antenatal Sentinel HIV & Syphilis Prevalence Survey in South Africa Statistics South Africa (Stats SA) 2013. Mid-year population estimates. Statistical release P0302. www.statssa.gov.za WHO, UNAIDS and UNICEF, Global HIV/AIDS Response. Epidemic update and health sector progress towards universal access, Progress Report 2011. World Health Organisation (WHO). Number of Women and Children living with AIDS. http://www.who.int/gho/hiv/epidemic_status/cases_adults_wom en_children_text/en/index.html. Access date: 11/09/2013
Logic: Disease in informal settlements compounds vulnerability, with HIV/AIDS being a major development issue in South Africa. The loss of family members to AIDS-related death; productivity losses due to illness, caring for the sick, and funerals; the direct costs of medication, as well as other burdens, have forced poorer households to the very brink of survival.
Discussion: According to WHO, almost 70 million people have been infected with the HIV virus and about 35 million people have died of AIDS since the beginning of the epidemic. It was estimated that 31.4 - 35.9 million people globally were living with HIV at the end of 2011. The estimated number of children living with HIV globally was 2.8–3.4 million (total number of deaths estimated at 200 000–270 000) in 2011 and the global number of women living with AIDS was estimated at about 15 million. The Burden of HIV vary considerably between countries and regions however Sub-Saharan Africa remains most severely affected, with nearly 1 in every, 20 adults living with HIV and accounted for 69% of the people living with HIV worldwide in 2011. The total number of people living with HIV in South Africa increased from an estimated 9.4% in 2001 to 10% in 2013 (Stats SA, 2013). The antenatal HIV prevalence in South Africa was 30.2% in 2010 and 29.5% in 2011, this accounted for 0.7% decrease in antenatal HIV prevalence in the year 2011. From Table 24, it can be noted that KwaZulu-Natal had the highest provincial antenatal HIV Prevalence at 37.4% in 2011. Provinces which displayed an increase in HIV prevalence were: Mpumalanga (36.7%), Free State (32.5%) and North West (30.2%). The remaining provinces displayed a decrease in antenatal HIV prevalence. Northern Cape had the lowest provincial antenatal HIV prevalence rate at 17% in 2011. The HIV epidemic in South Africa has a profound impact on society, economy as well as the health sector. This contributed to a decline in life expectancy, increased infant and child mortality and deaths. The HIV epidemic also causes negative impact on the socio economic development. The South African government adopted a comprehensive response that includes both prevention and treatment. The use of antiretroviral treatment has a significant impact on reducing the number of AIDS deaths per year.
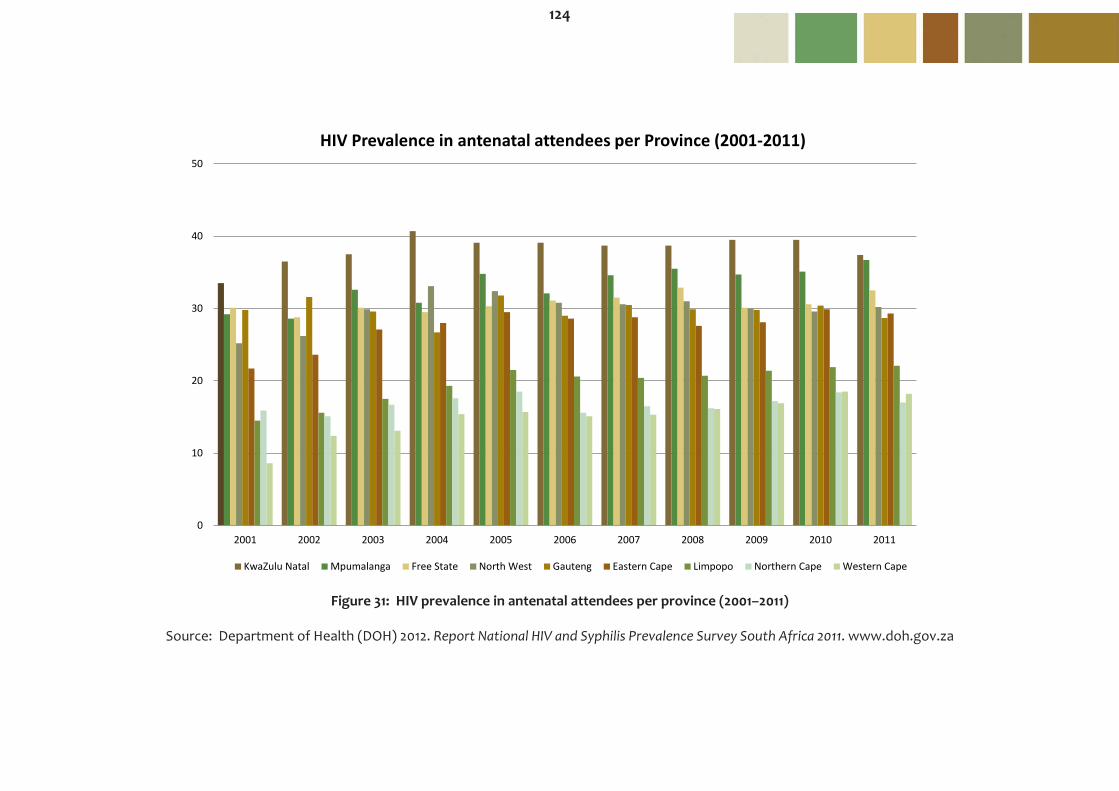
124
Figure 31: HIV prevalence in antenatal attendees per province (2001–2011)
Source: Department of Health (DOH) 2012. Report National HIV and Syphilis Prevalence Survey South Africa 2011. www.doh.gov.za
0
10
20
30
40
50
2001 2002 2003 2004 2005 2006 2007 2008 2009 2010 2011
HIV Prevalence in antenatal attendees per Province (2001-2011)
KwaZulu Natal Mpumalanga Free State North West Gauteng Eastern Cape Limpopo Northern Cape Western Cape

125
2001 2002 2003 2004 2005 2006 2007 2008 2009 2010 2011KwaZulu-Natal 33.5 36.5 37.5 40.7 39.1 39.1 38.7 38.7 39.5 39.5 37.4Mpumalanga 29.2 28.6 32.6 30.8 34.8 32.1 34.6 35.5 34.7 35.1 36.7Free State 30.1 28.8 30.1 29.5 30.3 31.1 31.5 32.9 30.1 30.6 32.5North West 25.2 26.2 29.9 33.1 32.4 30.8 30.6 31.0 30 29.6 30.2Gauteng 29.8 31.6 29.6 26.7 31.8 29.0 30.5 29.9 29.8 30.4 28.7Eastern Cape 21.7 23.6 27.1 28.0 29.5 28.6 28.8 27.6 28.1 29.9 29.3Limpopo 14.5 15.6 17.5 19.3 21.5 20.6 20.4 20.7 21.4 21.9 22.1Northern Cape 15.9 15.1 16.7 17.6 18.5 15.6 16.5 16.2 17.2 18.4 17Western Cape 8.6 12.4 13.1 15.4 15.7 15.1 15.3 16.1 16.9 18.5 18.2
Table 24: HIV prevalence (percentage) in antenatal attendees per province (2001–2011)
Figure 32: HIV prevalence (percentage) among antenatal attendees aged 15–49 (1990–2011)
Source: Department of Health (DOH) 2012. Report National HIV and Syphilis Prevalence Survey South Africa 2011.
Source: Department of Health (DOH) 2012. Report National HIV and Syphilis Prevalence Survey South Africa 2011.http://www.doh.gov.za
0
5
10
15
20
25
30
35
1990 1992 1994 1996 1998 2000 2002 2004 2006 2008 2010
HIV/AIDS Prevalence (percentage) in antenatal attendees in aged 15-49 (1990-2011)
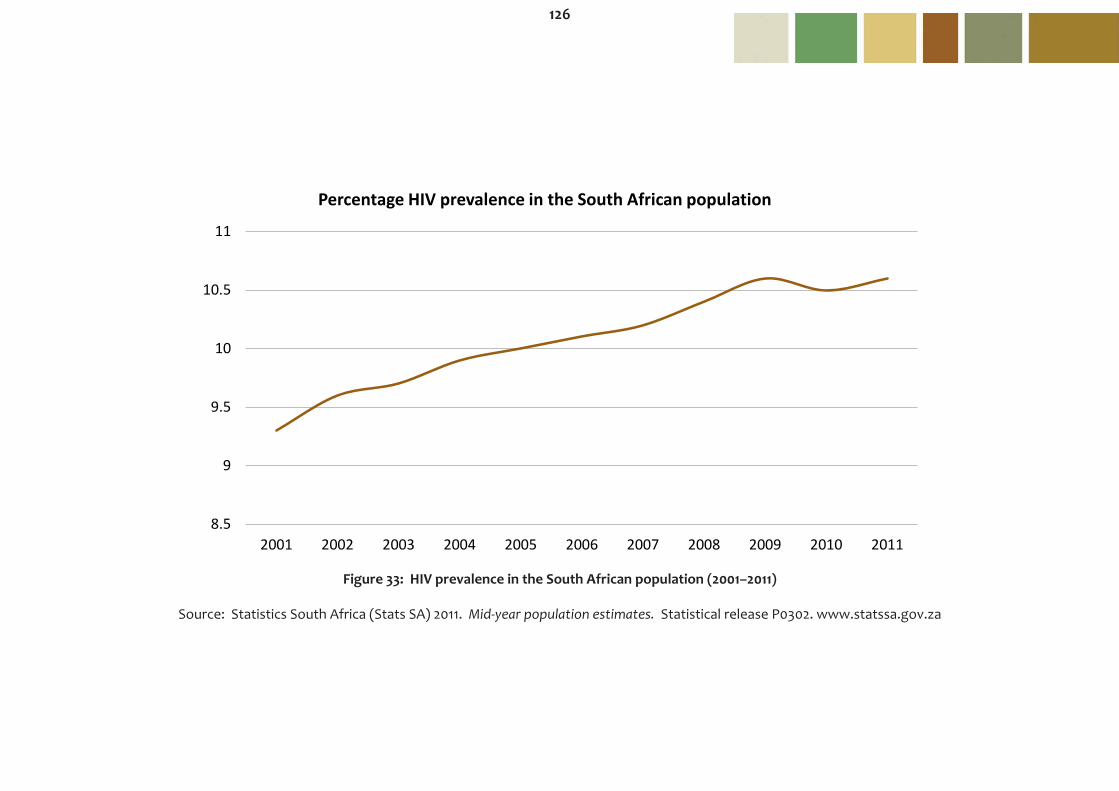
126
Figure 33: HIV prevalence in the South African population (2001–2011)
Source: Statistics South Africa (Stats SA) 2011. Mid-year population estimates. Statistical release P0302. www.statssa.gov.za
8.5
9
9.5
10
10.5
11
2001 2002 2003 2004 2005 2006 2007 2008 2009 2010 2011
Percentage HIV prevalence in the South African population
127
Indicator: Environmental health
Variable: 29
Description: Malaria
Units: Number of malaria cases and fatality rates.
Source: Department of Health (DOH) 2013. www.doh.gov.za Africa Fighting Malaria. www.fightngmalaria.org Malaria Organisation 2013. www.malaria.org.za World Bank 2010. http://web.worldbank.org
Logic: Malaria is a preventable and curable infectious disease caused by the Plasmodium parasite transmitted by the female Anopheles mosquito. Malaria affects a large number of South Africans especially in areas that are hot and humid. Malaria can be managed by means of human intervention, thus this variable is important in providing information on the effectiveness of malaria control programmes in the country.
Discussion: Malaria kills over one million people each year, most of whom are children under 5, and almost 90% of whom live in Africa, south of the Sahara. Clinical cases of Malaria are estimated at 300-500 million each year. Malaria is responsible for one out of every four childhood deaths in Africa. Resistance to Chloroquine which is the cheapest and safest malaria drug is common. Malaria is resistant to the four leading front-line drugs in some parts of the world, this is because it can quickly adapt and rebound when efforts are fragmented and uncoordinated. Despite all these, it had been noticed that, more determined interventions to malaria can lead to the reduction of its impacts.
According to the World Bank 2010, poorly designed irrigation and water systems, inadequate housing, poor waste disposal and water storage, deforestation and loss of biodiversity, all may be contributing factors to the most common vector-borne diseases including malaria, dengue and leishmaniasis. Land use changes are also influencing the pattern of vector-borne diseases. Rapid urbanization is exacerbating the situation, partly because peri-urban settlements often provide similar breeding environments to those in rural areas and partly because expansion of water supply has allowed year-round breeding of mosquitoes.
128
Malaria is endemic to the low-altitude areas of Limpopo, Mpumalanga and North-Eastern KwaZulu-Natal. About 10% of the South African population reside in malaria-risk areas. In South Africa a total of 6 846 malaria cases and 72 deaths were reported to the National Department of Health during 2012, this was a decrease of 30.61% compared to 9 866 cases reported in 2011.
The year 2 000 marked the highest number of malaria cases and deaths ever recorded in South Africa with 64 622 cases and 458 deaths. South Africa has made significant progress in controlling malaria transmission over the past decade; malaria cases declined by 89.41% (64 622 in 2000 compared to 6 846 in 2012) and deaths decreased by 84.28% (458 in 2 000 compared to 72 in 2012). This achievement is largely due to changes in the prevention and treatment policies that ensure that the most effective insecticides and the best combination of anti-malaria treatments are implemented. One of the most important indicators for evaluating the overall impact of malaria control is malaria case fatality rates (CFR). An elimination programme has been adopted to reduce the local transmission of malaria to zero by the year 2018. Notes: Fatality rate is the number of reported deaths due to malaria divided by the number of malaria reported cases multiplied by 100. transmission of malaria to zero by the year 2018.

129
1996 1997 1998 1999 2000 2001 2002 2003 2004 2005 2006 2007 2008 2009 2010 2011 2012
Cases 27 035 23 121 26 445 51 444 64 622 26 506 15 649 13 459 13 399 7 755 12 163 5 210 7 785 6 112 8 066 9 866 6 846
Deaths 163 104 198 406 458 119 96 142 89 64 89 48 43 51 87 89 72Fatality rate 0.60 0.45 0.75 0.79 0.71 0.45 0.61 1.06 0.66 0.83 0.73 0.92 0.55 0.83 1.07 0.9 1.05
Table 25: Number of malaria cases, deaths and fatality rate (1996–2012)
Source: Department of Health (DOH) 2013. www.doh.gov.za
Figure 34: Total number of reported malaria cases in South Africa (1996–2012)
Source: Department of Health (DOH) 2013. www.doh.gov.za
0
10000
20000
30000
40000
50000
60000
70000
1996 1997 1998 1999 2000 2001 2002 2003 2004 2005 2006 2007 2008 2009 2010 2011 2012
Total number of malaria cases reported

130
Indicator: Environmental health
Variable: 30
Description: Under 5 mortality
Units: Number of deaths per age category.
Sources: Statistics South Africa (2013). Mortality and causes of death in South Africa, 2003, 2004, 2005, 2006,2007, 2008, 2009 and 2010. Statistical release P0309.3 Census 2011.Statistical release (Revised). P0301.4 Statistics South Africa (2012).
Statistics South Africa. Mid-year population estimates. 2013. Statistical release P0302. www.statssa.gov.za.
Dorrington, R. et al. (2004). The Demographic Impact of HIV/AIDS in South Africa. National Indicators for 2004. The Centre for Actuarial Research, South African Medical Research Council and Actuarial Society of South Africa, Cape Town. Department of Environmental Affairs and Tourism (2006). South Africa Environment Outlook. A report on the state of the environment. Department of Environmental Affairs and Tourism, Pretoria.
Logic: Under-5 mortality rate is a measure of the vulnerability of the most vulnerable population group.
Discussion: The under mortality rate indicates the probability of dying between birth and exactly four years of age, expressed per 1 000 live births. This measure of mortality has several advantages as a barometer of child well-being in general and child health in particular. The under 5 mortality rate measures an outcome of the development process rather than an input such as per capita calorie availability or the number of doctors per 1 000 population. The under 5 mortality rate can also be the result of a wide variety of inputs: nutritional status and the health knowledge of mothers, the levels of immunization and oral rehydration therapy, the availability of maternal and child health services (including prenatal care), income and food availability in the family, the availability of safe drinking water and basic sanitation. The table shows that there has been a steady decline in the Under 5 mortality rate from 92.9 in 2002 to an estimated 56.6 in 2013.
The graph shows the average percentage distributions of death for the period 1997 to 2010 classified by age group of five intervals. The number of deaths at age group 0-4 has slightly decreased from 8.90% in 2009 to 8.70% in 2010. The highest average percentage of deaths is particularly observed at age groups 0-4 years. Looking at the trends for deaths in various age classes it was evident that the mortality rate in age classes 0-4 and 30-34 where elevated compared to the other classes. In addition age groups 5-9 and 10-14 showed a lower mortality rate when compared to deaths at other ages. The trend in mortality has remained fairly constant over the observed period.

131
For overall infant deaths, the leading cause of death was intestinal infectious diseases (17.7%), followed by respiratory and cardiovascular disorders specific to the perinatal period (15,2%) and influenza and pneumonia (11,8%). These three causes accounted for 44.7% of all infant deaths. The three leading causes of death for those aged 1–4 years were intestinal infectious diseases (21,1%), influenza and pneumonia11,5%) and malnutrition (7,9%). Tuberculosis (4.7%) was the fourth leading cause of death while HIV disease (2.1%), other viral diseases (2.0%) and certain disorders involving the immune mechanism (1.7%) were the fifth, sixth and seventh positions, respectively.

132
1997 1998 1999 2000 2001 2002 2003 2004 2005 2006 2007 2008 2009 20100–4 10.30% 10.40% 10.10% 9.50% 9.10% 9.30% 9.37% 10.00% 10.43% 10.52% 10.22% 10.30% 8.80% 9.80%5–9 0.90% 0.90% 0.90% 0.90% 0.80% 0.90% 0.90% 1.05% 1.04% 0.91% 0.89% 0.80% 0.80% 0.89%10–14 0.90% 0.80% 0.80% 0.70% 0.70% 0.70% 0.66% 0.68% 0.68% 0.71% 0.69% 0.70% 0.80% 0.74%15–19 2.00% 1.90% 2.00% 1.90% 1.90% 1.80% 1.71% 1.63% 1.57% 1.55% 1.51% 1.50% 1.50% 1.71%20–24 4.30% 4.30% 4.50% 4.50% 4.40% 4.40% 4.44% 4.44% 4.27% 4.21% 4.10% 4.00% 3.70% 4.24%25–29 5.80% 6.30% 7.00% 7.40% 7.90% 8.30% 8.36% 8.26% 7.84% 7.40% 7.15% 7.10% 6.80% 7.30%30–34 6.00% 6.60% 7.50% 8.20% 8.70% 9.40% 10.05% 10.30% 10.10% 9.80% 9.55% 9.10% 8.50% 8.70%35–39 5.90% 6.40% 7.10% 7.70% 8.10% 8.70% 8.87% 9.31% 9.36% 9.10% 9.01% 9.00% 8.60% 8.24%40–44 5.70% 6.00% 6.30% 6.80% 7.10% 7.40% 7.80% 8.20% 8.23% 8.18% 8.02% 7.80% 7.60% 7.33%45–49 5.90% 6.00% 6.20% 6.20% 6.30% 6.40% 6.60% 6.86% 7.03% 7.05% 7.10% 7.10% 7.20% 6.66%50–54 5.50% 5.50% 5.70% 5.90% 6.00% 6.00% 6.04% 6.14% 6.13% 6.28% 6.40% 6.40% 6.60% 6.06%55–59 6.50% 6.30% 6.00% 5.50% 5.20% 5.10% 5.09% 5.24% 5.55% 5.70% 5.98% 6.10% 6.40% 5.80%60–64 6.50% 6.10% 6.00% 6.10% 6.00% 5.80% 5.54% 5.29% 5.06% 4.98% 5.14% 5.30% 5.80% 5.71%65–69 7.40% 7.10% 6.60% 5.90% 5.70% 5.40% 5.16% 5.06% 5.31% 5.49% 5.61% 5.70% 5.90% 5.86%70–74 6.80% 6.70% 6.60% 6.60% 6.40% 5.80% 5.57% 5.03% 4.71% 4.78% 4.92% 5.00% 5.40% 5.73%75–79 7.40% 6.60% 5.90% 5.30% 5.10% 4.80% 4.73% 4.51% 4.73% 4.87% 4.92% 5.00% 5.30% 5.31%80–84 4.90% 5.20% 5.00% 5.10% 5.10% 4.70% 4.18% 3.59% 3.41% 3.49% 3.63% 3.90% 4.30% 4.38%85–89 3.40% 3.30% 3.30% 3.10% 2.90% 2.50% 2.83% 2.53% 2.66% 2.97% 3.08% 2.90% 3.00% 2.97%90+ 2.10% 2.20% 2.00% 2.20% 2.30% 2.20% 2.08% 1.88% 1.88% 2.01% 2.07% 2.30% 2.90% 2.20%
Table 26: Percentage of deaths by age and year of death (1997–2010)
Source: Statistics South Africa (Stats SA) 2013. Mortality and causes of death in South Africa, 2003, 2004, 2005. 2006, 2007, 2008, 2009 and 2010. Statistical release P0309. www.statssa.gov.za
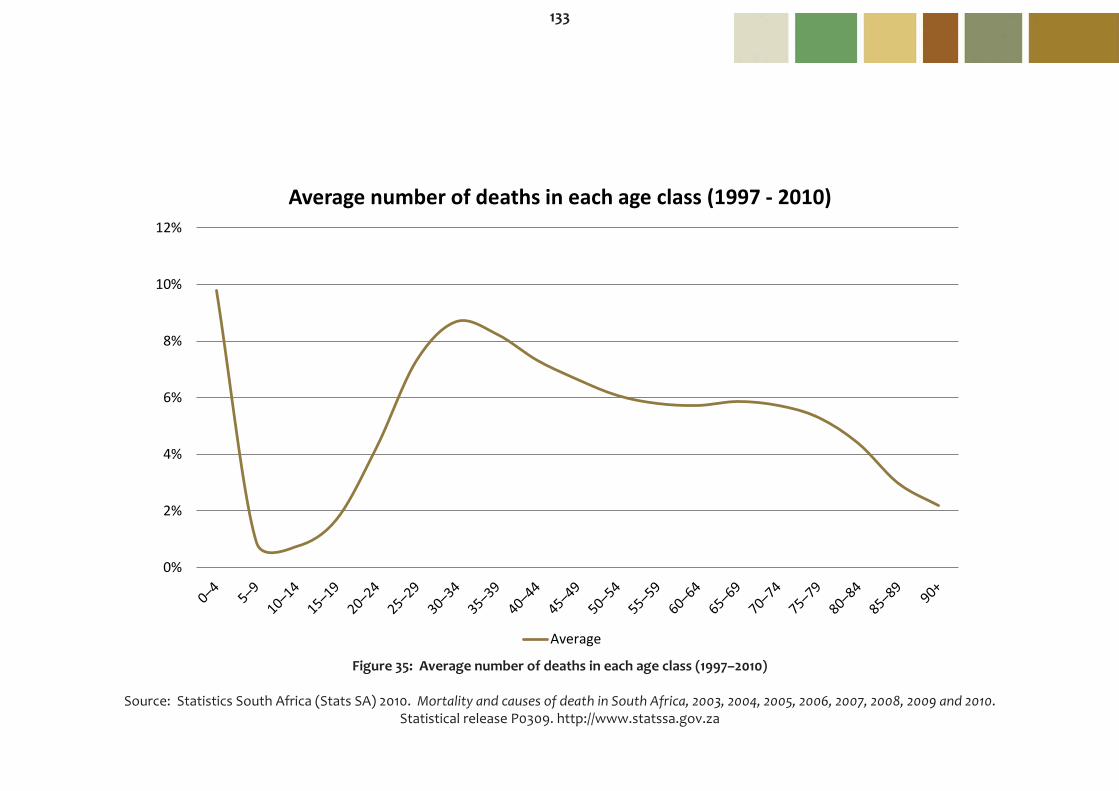
133
Figure 35: Average number of deaths in each age class (1997–2010)
Source: Statistics South Africa (Stats SA) 2010. Mortality and causes of death in South Africa, 2003, 2004, 2005, 2006, 2007, 2008, 2009 and 2010. Statistical release P0309. http://www.statssa.gov.za
0%
2%
4%
6%
8%
10%
12%
Average number of deaths in each age class (1997 - 2010)
Average

134
135
IntroductionEnvironmental sustainability can only be realised if the necessary institutional capacity and underlying social patterns of skills, attitudes and networks that foster effec-tive responses to environmental challenges exist. Our capacity to cope with environmental stresses and associated environmental change is affected by our ability to cope with each situation, as well as the resources available to us.
In a country such as South Africa with a dual economy, the first (or formal) economy and the second (or informal) economy need to be aligned to eliminate stress from unequal institutional frameworks.
Social and Institutional Capacity to CopeCapacity to cope with change can be categorised into social and institutional capacity, more specifically these can be divided into economic, legislative, management, scientific, technological and infrastructural capacity. Economic capacity would include the ability of a country to make economic resources available to assist with cop-ing, whilst legislative capacity would include both policy and legislative flexibility to deal with environmental change, as well as institutional and legal mechanisms to reduce societies vulnerability to that change (such as social welfare). Governments that are able to quickly and effectively adapt policy and legislation to new situations will enable greater capacity for society to cope with change.
Management capacity includes the availability of both human and financial resources for management, as well as the ability to manage successfully in times of crisis. Scientific, technological and infrastructural capacity includes the ‘know how’ to adapt to change, the technology to allow adaptation, and the infrastructure to enable adaptation (e.g. electricity, roads, telecommunications).
The history of adaptation in a particular location would also influence the ability to cope with change. Those areas that have to regularly deal with natural environmental change are more likely to be flexible to change, allowing them to cope more easily.
The indicators and variables representing our social and institutional capacity to cope are:
• Energy efficiency - Eco efficiency - Hydropower and renewable energy production as percentage of total energy consumption
• Environmental governance - Percentage of total land area under protected status - Percentage variables missing from the “Rio to Joburg Dashboard”

136
• Private sector responsiveness - Environmental management systems
• Science and technology - Budget for the environment - Digital access index - Number of researchers per 1 000 total employment - Budget for research and development (R&D) - Gross tertiary enrolment rate - Education (primary, secondary and Adult basic education and training (ABET))
For further information on the social and institutional capacity please refer to the following:
United Nations Environment Programme 2004. Global Environment Outlook 3. http://www.unep.org/geo/
United Nations Environment Programme, Various. Global Environment Outlook Yearbooks. http://www.unep.org/geo/
United Nations Environment Programme 2002. Africa Environment Outlook. http://www.unep.org/dewa/Africa/
United Nations Environment Programme 2006. Africa Environment Outlook 2. Our Environment, Our Wealth Website http://www.unep.org/dewa/Africa

137
Indicator: Energy efficiency
Variable: 31
Description: Eco efficiency
Units: Terrajoule energy consumption.
Source: The Department of Energy (Energy) 2010. National Energy Balances The Department of Minerals and Energy (DME) 2008. Energy Efficiency Strategy - First Review
Department of Energy (Energy) 2009. Digest of South Africa Energy Statistics
Department of Energy (Energy) 2010. South African Energy Synopsis
Logic: The more efficient an economy is, the less energy it needs to produce a given set of goods and services.
Discussion: Globally, countries are in the stage where they are facing the challenge of Sustainable energy in a sense that energy is utilized so that social, environmental and economic aims of sustainable development.
South Africa is a developing nation with significant heavily industry, which is by its nature energy intensive. This energy intensive economy largely relies on indigenous coal reserves for its driving force. Coal contributes more than 70% of South Africa’s primary energy. South Africa has proven coal reserves of 48 Gt, representing 5.7% of total global reserves. Eskom generates over 92% of its electricity from coal and it is probable that new coal stations will be built to meet growing demand for electricity.
This energy intensity is above average, with only 10 other countries having higher commercial primary energy intensities. It is largely a result of the economy’s structure, with dominating large-scale, energy-intensive primary mineral beneficiation and mining industries. Mining, Mineral processing, metal smelting and synfuel production are inherently intensive users of energy. South African gold mines are very deep with low ore concentration and therefore necessarily need a lot of energy per ounce of gold.
South Africa’s economic growth as measured by the growth in Gross Domestic Product (GDP) was 136% for the period 1993 to 2009. Table 27, indicates the total primary energy supply for these years increased from 3 924 PJ in 1993 to 5 695 PJ in 2009, an increase of 45%.

138
Limitation: Energy intensity is measured by the quantity of energy require per unit output or activity, so that using less energy to produce a product reduces the intensity. Energy efficiency improves when a given level of service is provided with reduced amounts of energy inputs or services are enhanced for a given amount of energy input. A simple E/GDP ratio measure of energy intensity overstates the extent to which energy efficiency improvements have occurred in the economy, because factors that affect intensity that are unrelated to the efficiency of energy use are included in the ratio. A shift from steel to electronics influences the simple E/GDP ratio, but is not indicative of improvements in energy efficiency.

139
Year GDP at market prices (R million) Primary energy supply (TJ) Intensity (TJ/R)2000 1 301 813 4 298 220 3.302001 1 336 962 3 972 681 2.972002 1 386 435 4 637 437 3.342003 1 427 322 4 507 518 3.162004 1 492 330 5 240 908 3.51
2005 1 571 082 5 078 962 3.232006 1 659 122 5 536 070 3.342007 1 750 139 5 449 933 3.112008 1 814 521 9 589 296 5.282009 1 782 059 10 108 812 5.67
Table 27: Energy intensity
Source: The Department of Energy (DoE) 2010. National Energy Balances. www.energy.gov.za Department of Energy (2009) Digest of South Africa Energy Statistics

140
Figure 36: Energy intensity depicted as TJ/R measured (2000–2009)
Source: The Department of Energy (DoE) 2010. National Energy Balances Statistics South Africa (P0441), Gross Domestic Product 1st quarter 2009
0
1
2
3
4
5
6
2000 2001 2002 2003 2004 2005 2006 2007 2008 2009
Energy Intensity (TJ/R)
Intensity
141
Indicator: Energy efficiency
Variable: 32
Description: Hydropower and renewable energy production as a percentage of total energy consumption
Units: Terrajoule.
Source: Department of Energy (Energy) 2009. National energy balances. www.energy.gov.za. Department of Minerals and Energy (DME) 2004 and 2006. Digest of South African Energy Statistics
Logic: The higher the proportion of hydroelectric and other renewable energy sources used, the less reliance on more environmentally damaging sources such as fossil fuels.
Discussion: The government’s 2003 White Paper on Renewable Energy sets a target of 10 000 GWh renewable energy contribution to final energy consumption by 2013. Achieving the target will add about 1 667 MWe new renewable energy capacity. The capacity of South African’s renewable energy resources have the potential to produce energy from biomass, wind, solar, small-scale hydro and waste; most of these resources have not yet been utilized. The highest potential for power generation from wind lies within the coastal regions of South Africa. Applications of wind energy also include water pumping, wind farms for hydroelectric systems, solar-hydro hybrid systems and distributed power generation. Wave energy and ocean currents will also be considered for power generation in the longer term.
Biomass: Biomass is usually used by both the industry (sugar refining plus the paper and pulp industry) and by households for domestic energy. The estimations indicate that about 10% of South Africa’s primary energy used this type of energy resource. Biomass can be divided into wood and bagasse. Wood obtained mainly from natural woodlands, is the primary source of energy used by over 2 million households for cooking, and just over 2.8 million household for heating purposes (data from stats in brief, 2010). The total annual sustainable supply of wood from natural woodlands in communal rural areas is estimated at about 12 Mt. The exact amount of residential wood fuel used is unknown but estimates put it at 86 PJ/y, roughly equivalent to 7 Mt of wood per year. Bagasse, the waste fibre from sugar cane, is the most important energy source for South Africa’s sugar refining industry. The total sugar cane crop is estimated to be over 20 Mt a year, which yields about 7 Mt of bagasse with a heating value of 6.7 MJ/kg, most of which is used as energy in raising steam for process heat and electricity generation. The installed generation capacity of the industry is about 245 MWe.
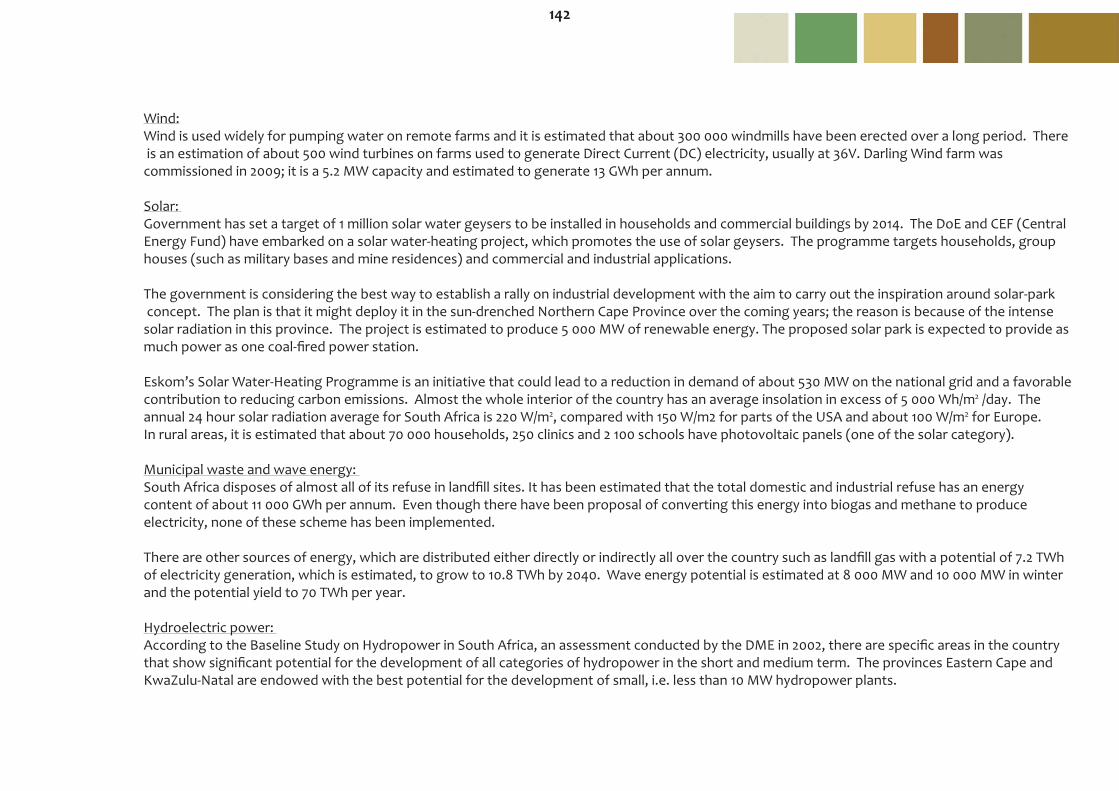
142
Wind: Wind is used widely for pumping water on remote farms and it is estimated that about 300 000 windmills have been erected over a long period. There is an estimation of about 500 wind turbines on farms used to generate Direct Current (DC) electricity, usually at 36V. Darling Wind farm was commissioned in 2009; it is a 5.2 MW capacity and estimated to generate 13 GWh per annum.
Solar: Government has set a target of 1 million solar water geysers to be installed in households and commercial buildings by 2014. The DoE and CEF (Central Energy Fund) have embarked on a solar water-heating project, which promotes the use of solar geysers. The programme targets households, group houses (such as military bases and mine residences) and commercial and industrial applications.
The government is considering the best way to establish a rally on industrial development with the aim to carry out the inspiration around solar-park concept. The plan is that it might deploy it in the sun-drenched Northern Cape Province over the coming years; the reason is because of the intense solar radiation in this province. The project is estimated to produce 5 000 MW of renewable energy. The proposed solar park is expected to provide as much power as one coal-fired power station.
Eskom’s Solar Water-Heating Programme is an initiative that could lead to a reduction in demand of about 530 MW on the national grid and a favorable contribution to reducing carbon emissions. Almost the whole interior of the country has an average insolation in excess of 5 000 Wh/m2 /day. The annual 24 hour solar radiation average for South Africa is 220 W/m2, compared with 150 W/m2 for parts of the USA and about 100 W/m2 for Europe. In rural areas, it is estimated that about 70 000 households, 250 clinics and 2 100 schools have photovoltaic panels (one of the solar category).
Municipal waste and wave energy: South Africa disposes of almost all of its refuse in landfill sites. It has been estimated that the total domestic and industrial refuse has an energy content of about 11 000 GWh per annum. Even though there have been proposal of converting this energy into biogas and methane to produce electricity, none of these scheme has been implemented.
There are other sources of energy, which are distributed either directly or indirectly all over the country such as landfill gas with a potential of 7.2 TWh of electricity generation, which is estimated, to grow to 10.8 TWh by 2040. Wave energy potential is estimated at 8 000 MW and 10 000 MW in winter and the potential yield to 70 TWh per year.
Hydroelectric power: According to the Baseline Study on Hydropower in South Africa, an assessment conducted by the DME in 2002, there are specific areas in the country that show significant potential for the development of all categories of hydropower in the short and medium term. The provinces Eastern Cape and KwaZulu-Natal are endowed with the best potential for the development of small, i.e. less than 10 MW hydropower plants.

143
There is 668 MWe of domestic installed hydroelectric power in South Africa. Some hydroelectric power is imported from neighboring countries
Notes: a) The DME website gives capacity as 2.5 MW. http://www.dme.gov.za/pdfs/energy/cabeere/case friedenheim.pdf
Station Maximum capacity (MW) LocationGariep 360 Orange riverVan der Kloof 240 Orange riverColly Wobbles 42 Mbashe riverSecond Falls 11 Umtata riverFirst Falls 6 Umtata riverFriedenheim 3a Crocodile riverLydenburg 2 Ncora riverNcora 2 Ncora riverPiet Retief 1Ceres 1TOTAL 668
Table 28: Hydroelectric capacity in South Africa
Source: Energy policies for sustainable development in South Africa. Options for the future. Energy Research Centre, University of Cape Town. 2006

144
1992 1993 1994 1995 1996 1997 1998 1999 2000Coal 2 990 691 3 028 745 3 117 230 3 243 737 3 299 784 3 370 254 3 268 198 3 413 499 3 425 725Crude oil 414 946 334 047 428 321 459 980 376 059 450 863 933 682 764 067 420 746Gas 11 969 71 814 71 814 71 814 71 814 71 814 53 983 70 628 65 024Nuclear 101 324 79 145 105 785 123 284 128 455 137 967 148 375 140 040 141 927Hydro 2 707 526 3 866 1 904 4 748 7 531 5 742 2 614 4 835Renewablesc 414 000 419 000 433 432 408 739 408 739 408 739 237 400 237 400 237 400Hydro and Renewables (%) 10.58 10.66 10.51 9.52 9.63 9.36 5.23 5.18 5.63TOTAL 3 935 637 3 933 277 4 160 448 4 309 458 4 289 602 4 447 168 4 647 379 4 628 248 4 295 657
2001 2002 2003 2004 2005 2006 2007 2008 2009
Coal 3 065 619 2 961 026 3 277 600 3 573 343 3 651 726 3 721 156 3 842 131 4 220 649 4 077 676
Crude oil 452 895 1 018 769 615 689 1 016 664 724 774 1 115 574 820 023 904 801 904 800Gas 84 478 83 764 50 218 84 152 153 078 160 318 137 834 -24 720 -24 720Nuclear 116 935 130 811 138 142 145 801 123 193 109 375 123 458 141 862 141 862Hydro 7 420 8 485 2 890 2 890 4 199 9 895 21 041 14 514 14 514Renewablesc 237 400 426 467 422 979 418 058 421 992 419 753 428 396 428 396 428 396Hydro and Renewables (%) 6.17 9.39 9.45 8.03 8.39 7.76 8.36 7.79 7.99TOTAL 3 964 746 4 629 322 4 507 518 5 240 908 5 078 962 5 536 070 5 372 883 5 685 501 5 542 528
b) The energy balances in this table are in accordance with the format developed by the International Energy Agency (IEA), adopted by the Department of Minerals and Energy.
c) Renewables include wind, solar and geothermal energy.Source: The Department of Energy 2009. National Energy Balances
Table 29: Total primary energy supply TJb
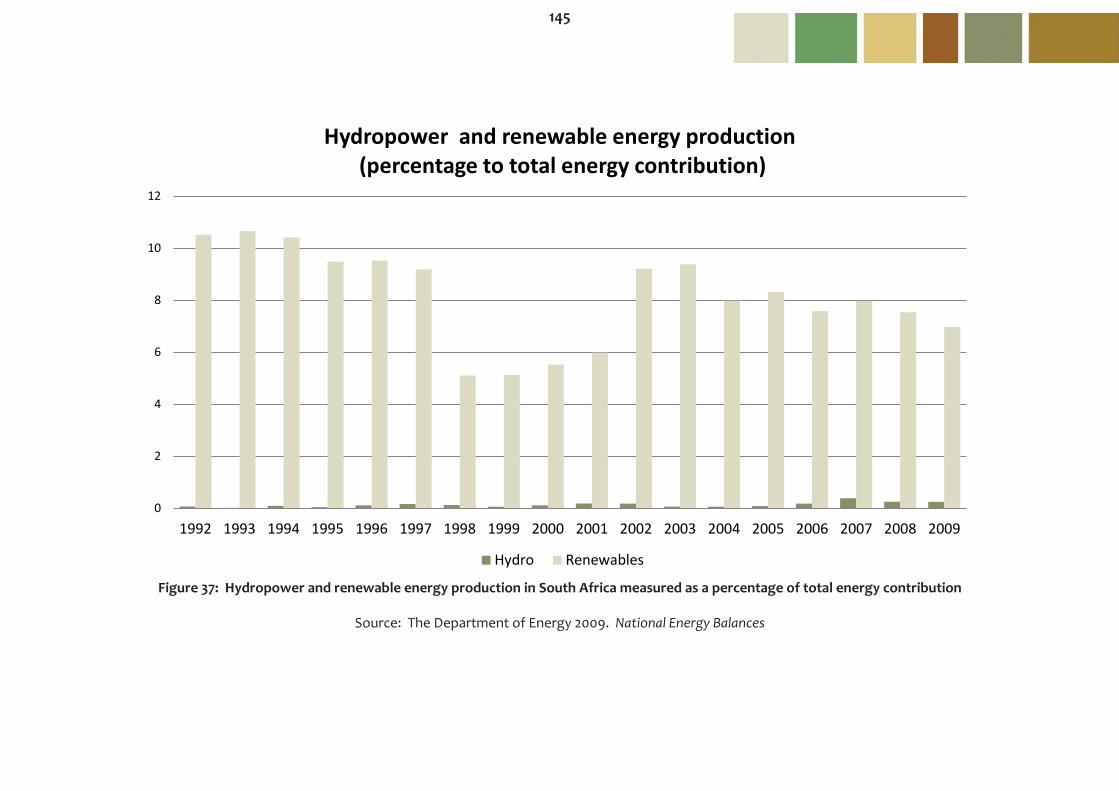
145
Figure 37: Hydropower and renewable energy production in South Africa measured as a percentage of total energy contribution
Source: The Department of Energy 2009. National Energy Balances
0
2
4
6
8
10
12
1992 1993 1994 1995 1996 1997 1998 1999 2000 2001 2002 2003 2004 2005 2006 2007 2008 2009
Hydropower and renewable energy production(percentage to total energy contribution)
Hydro Renewables

146
Indicator: Environmental governance
Variable: 33
Description: Percentage of total land area under protected status
Units: Percentage of total land area under protected status.
Source: Driver, A., Sink, K.J., Nel, J.L., Holness, S., Van Niekerk, L., Daniels, F., Jonas, Z., Majiedt, P.A., Harris, L. & Maze, K. 2012. National Biodiversity Assessment 2011: An assessment of South Africa’s biodiversity and ecosystems. Synthesis Report. South African National Biodiversity Institute and Department of Environmental Affairs, Pretoria.
Convention on Biological Diversity. www.cbd.int/countries/profile/shtml : accessed 22 October 2012 at 10:30 am Logic: The percentage of land area dedicated to protected areas represents an investment by the country in biodiversity conservation.
Discussion: South Africa is a country rich in biodiversity. Although the country occupies only 2% of the world’s surface area it is home to nearly 10% of the world’s plant species (24 000 species), about 7% of the world’s vertebrate species, and 5.5% of the world’s known insect species (only about half of the latter have been described). South Africa is ranked as the 5th richest country in Africa in terms of the number of endemic species and 24th in the world. In addition to its high terrestrial biodiversity the country also has a high marine biodiversity profile. More than 11 000 species are found in South African waters, amounting to about 15% of global species, with in excess of 25% of these marine species (or 3 496 species) being endemic to South Africa.
The 2011 assessment assessed 223 river ecosystem types (main rivers and smaller tributaries) and found that 57% are threatened with 25% are critically endangered, while 19% are endangered, 13% are vulnerable and 43% are least threatened. The percentage land area under protected status equals 6.71% (8 million ha) of the total land area. However, biomes such as grasslands and succulent Karoo are under-conserved. The Grassland biome is one of South Africa’s most under-protected biomes and only 10% are well protected. The lowveld savanna are well protected by the Kruger National Park and the arid savanna by Kgalagadi TFCA. Grassland, Thicket and Nama-Karoo biomes have the highest proportion of under-protected ecosystems. Forest, Desert and Fynbos are the best protected biomes. The total extent of the land-based protected area network increased from 6% in 2004 to 6.5% in 2011 which represent an increase of approximately 10% in the extent of the protected area network.

147
For coastal and inshore ecosystem types, 58% are threatened with 24% critically endangered, 10% endangered and 24% vulnerable, compared with 41% of offshore ecosystems types (11% critically endangered, 8% endangered and 22% vulnerable), reflecting the fact that coastal and inshore ecosystems are more heavily impacted by human activities. Only 9% of coastal and inshore ecosystem types are well protected, but the majority have at least some form of protection, with only 16% not protected at all. In the offshore environment, only 4% of ecosystem types are well protected and 69% are not protected at all.
The 2010 Biodiversity Target 1.1 states that at least 10% of the world’s ecological regions should be effectively conserved. Currently South Africa falls well short of this target when taking type 1 protected areas into account.
Limitations: Protected areas include: National Parks, Provincial and Local Protected Areas, World Heritage Sites, Forest Nature reserves, Marine Protected Areas and Wilderness Areas.
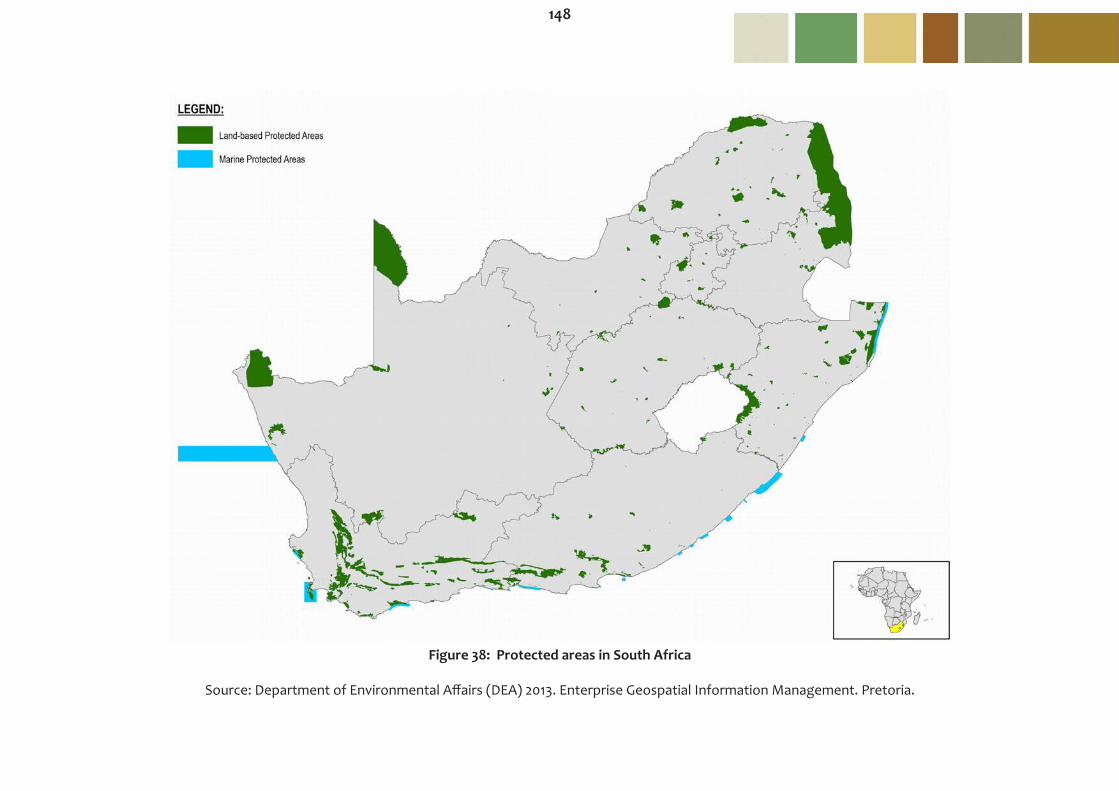
148
Figure 38: Protected areas in South Africa
Source: Department of Environmental Affairs (DEA) 2013. Enterprise Geospatial Information Management. Pretoria.
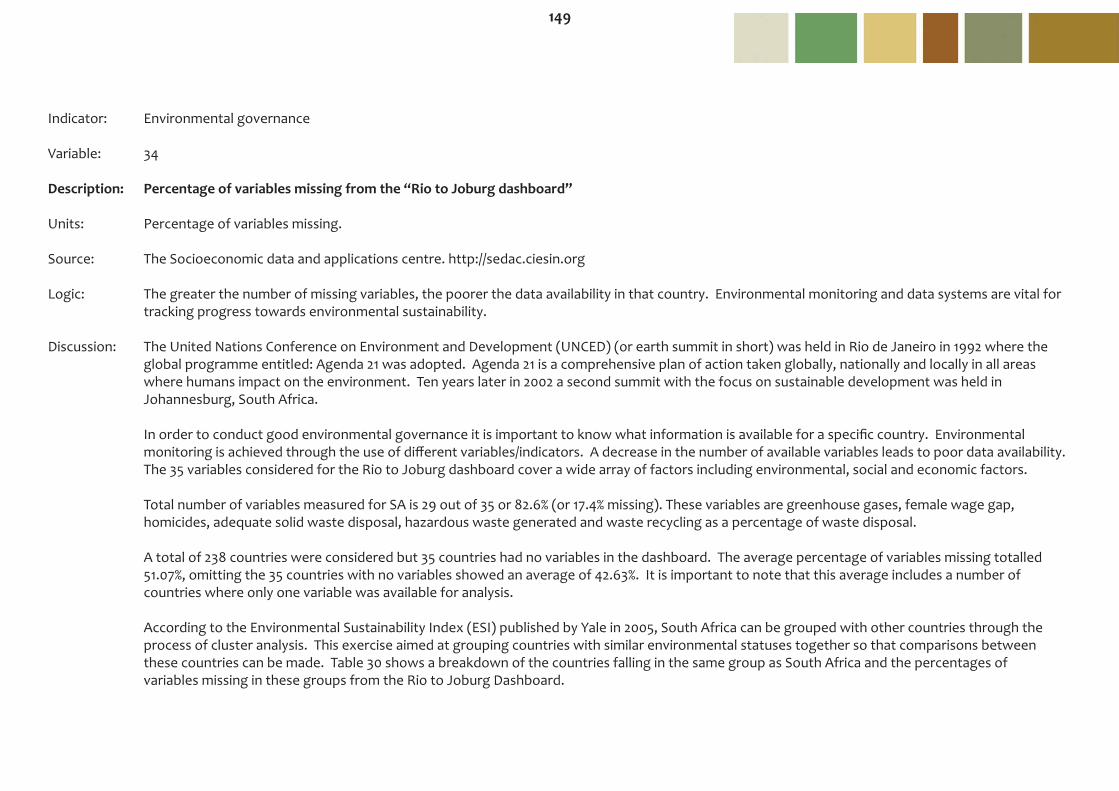
149
Indicator: Environmental governance
Variable: 34
Description: Percentage of variables missing from the “Rio to Joburg dashboard”
Units: Percentage of variables missing.
Source: The Socioeconomic data and applications centre. http://sedac.ciesin.org
Logic: The greater the number of missing variables, the poorer the data availability in that country. Environmental monitoring and data systems are vital for tracking progress towards environmental sustainability.
Discussion: The United Nations Conference on Environment and Development (UNCED) (or earth summit in short) was held in Rio de Janeiro in 1992 where the global programme entitled: Agenda 21 was adopted. Agenda 21 is a comprehensive plan of action taken globally, nationally and locally in all areas where humans impact on the environment. Ten years later in 2002 a second summit with the focus on sustainable development was held in Johannesburg, South Africa.
In order to conduct good environmental governance it is important to know what information is available for a specific country. Environmental monitoring is achieved through the use of different variables/indicators. A decrease in the number of available variables leads to poor data availability. The 35 variables considered for the Rio to Joburg dashboard cover a wide array of factors including environmental, social and economic factors.
Total number of variables measured for SA is 29 out of 35 or 82.6% (or 17.4% missing). These variables are greenhouse gases, female wage gap, homicides, adequate solid waste disposal, hazardous waste generated and waste recycling as a percentage of waste disposal.
A total of 238 countries were considered but 35 countries had no variables in the dashboard. The average percentage of variables missing totalled 51.07%, omitting the 35 countries with no variables showed an average of 42.63%. It is important to note that this average includes a number of countries where only one variable was available for analysis.
According to the Environmental Sustainability Index (ESI) published by Yale in 2005, South Africa can be grouped with other countries through the process of cluster analysis. This exercise aimed at grouping countries with similar environmental statuses together so that comparisons between these countries can be made. Table 30 shows a breakdown of the countries falling in the same group as South Africa and the percentages of variables missing in these groups from the Rio to Joburg Dashboard.

150
The average percentage of variables missing in this group amounts to 21.31%. South Africa is still well under the average total percentage of variables missing from the Rio to Joburg dashboard with an average of 17.14% compared to the global average of countries in the same group as South Africa being 21.31a%.
Notes: a) O’Connor, John and Jochen Jesinghaus 2002. Data from the: Rio to Johannesburg Dashboard of Sustainability. Software tool distributed at the 2002 World Summit on Sustainable Development in Johannesburg, South Africa.
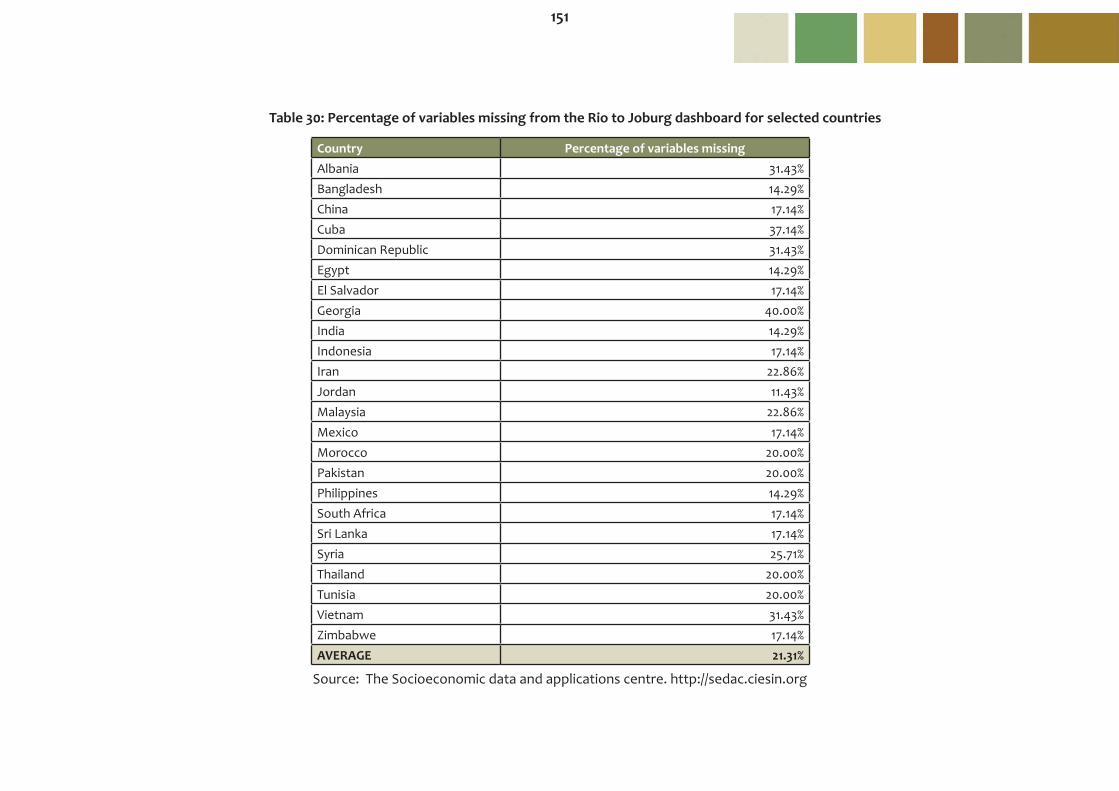
151
Country Percentage of variables missingAlbania 31.43%Bangladesh 14.29%China 17.14%Cuba 37.14%Dominican Republic 31.43%Egypt 14.29%El Salvador 17.14%Georgia 40.00%India 14.29%Indonesia 17.14%Iran 22.86%Jordan 11.43%Malaysia 22.86%Mexico 17.14%Morocco 20.00%Pakistan 20.00%Philippines 14.29%South Africa 17.14%Sri Lanka 17.14%Syria 25.71%Thailand 20.00%Tunisia 20.00%Vietnam 31.43%Zimbabwe 17.14%AVERAGE 21.31%
Table 30: Percentage of variables missing from the Rio to Joburg dashboard for selected countries
Source: The Socioeconomic data and applications centre. http://sedac.ciesin.org

152
Indicator: Private sector responsiveness
Variable: 35
Description: Environmental management systems
Units: Number of businesses that obtained the ISO 14001 Environmental Standard.
Source: South African Bureau of Standards (SABS) 2013. Search of system certification with SABS ISO 14001 in South African provinces. www.certification.sabs.co.za
Environmental Quality Certification Services (Pty) Ltd. 2007. http://gin.confex.com/gin/2003/techprogram/p162html
SGS South Africa (Pty) Ltd 2007. http://gin.confex.com/gin/2003/techprogram/p162html
Department of the Environment, Water, Heritage and the Arts - Australia. http://www.environment.gov.au/settlements/industry/corporete/ems.html
Logic: This variable reflects corporate institutional support for environmental management. By adopting an environmental management system such as ISO 14001, companies are promoting practices that protect the environment and strive for continuous improvement.
Discussion: An Environmental Management System (EMS) is a tool for managing the impacts of an organization’s activities on the environment. It provides a structured approach to planning and implementing environment protection measures. An EMS monitors environmental performance and it also integrates environmental management into a company’s daily operations, long term planning and other quality management systems. There are three fundamental commitments required in an environmental policy that meets the requirements of ISO 14001. These include: prevention of pollution, compliance with legislation and continual improvement of the EMS.
Compliance with ISO 14001 is voluntary in South Africa; however legislation has been promulgated to transfer the burden of proof of sound environmental management to organisations. Environmental concerns are being incorporated in an increasing number of business strategies, in order to meet the environmental demands from the different stakeholders or to create a market demand for greener products. Many companies have integrated the responsibility for pollution prevention in their management system, where actions have to take place, in order to reduce the environmental impacts.

153
The increasing interest among companies for self-regulation in relation to their environmental impacts has resulted in a need for methods and tools to support reliability and the process of change towards systematic development of cleaner production processes and products. In July 2013, a total of 422 businesses held ISO 14001 certification through various environmental management systems certification Boards, this is an increase of 66 as compared to the total number of businesses with accreditation in 2012. In addition, the overall observation of the number of businesses which held ISO 14001 certificate showed an increase of 169 from 2007 to present. This is an indication that more and more businesses are becoming aware of the certificate and its importance in Environmental Management and also in business opportunities such as: loans, funding and increase in supplies and customers.
Limitations: Some certificates were grouped in a “various category” because they are issued for organisations which are based in more than one province. As a result of this, the total number of businesses having ISO 14001 certificate by July 2013 on the provincial level, may not be a true reflection in some provinces.

154
Figure 39: Number of businesses in each province with ISO 14001 accreditation
Source: South African Bureau of Standards (SABS) 2013. Search of system certification with SABS ISO 14001 in South African provinces.
0
20
40
60
80
100
120
140
EC FS GP KZN L MP NC NW WC
Number of business with ISO 14001 certificate
2007 2010 2011 2012 2013

155
Indicator: Science and technology
Variable: 36
Description: Budget for the environment
Units: Rands (1 000’s) per year.
Source: National Treasury. National Medium Term Budget Policy Statement and Adjusted Estimates of National Expenditure. Vote 30 Environmental Affairs. www.treasury.gov.za/documents/budget.
Logic: This variable reflects the political commitment to overall environmental issues by the government. There has been a significant increase in the budget allocated to the environment. South Africa’s international commitments to improved environmental management and environmental social responsi- bilities to all South Africans.
Discussion: Environmental expenditure between 2008/2009 and 2013/2014 increased from R2.8 billion to R5.4 billion. The spending focus over the medium term will be on improving service delivery and creating jobs in the environmental sector. The bulk of the budget will be spent on the expanded public work projects within Environmental Programmes to create 113 748 full time equivalent jobs and 219 089 work opportunities.
Expenditure in Environmental Programmes grew significantly between 2009/10 and 2012/13 due the rollout of the expanded public works programme, which also accounted for the significant increase in transfers and subsidies over this period. The programme created 54 301 full time equivalent jobs and 172 979 work opportunities between 2009/10 and 2012/13. Over the same period, the significant increase in expenditure on the Administration programme was due to the expanded mandate of the Environmental Advisory Services subprogramme, which manages and facilitates the department’s international relations, engagements and cooperation agreements, and the infrastructure development programme.
The 2013 Budget sets out the additional allocations over Oceans and Coasts programmes (and the operation and manning of the SA Agulhas II and the Algoa research vessels), to upgrade research laboratories, the expanded public works programme, Green Fund to fund projects, improved conditions of services for the department and its public entities, pre-assessment of projects, and South African National Parks to combat rhino poaching.

156
Figure 40: Budget allocated to different sectors in the environmental field in R1 000’s (2001–2013)
Source: National Treasury. National Medium Term Budget Policy Statement and Adjusted Estimates of National Expenditure. Vote 30: Department of Environmental Affairs. www.treasury.gov.za
0
500 000
1 000 000
1 500 000
2 000 000
2 500 000
3 000 000
3 500 000
2001/02 2002/03 2003/04 2004/05 2005/06 2006/07 2007/08 2008/09 2009/10 2010/11 2011/12 2012/13 2013/14
Budget spent on the environment (R1 000's)
Administration Legal, Authorisations and ComplianceEnvironmental Quality and Protection Oceans and Coastal ManagementClimate Change Biodiversity and ConservationEnvironmental Sector Programmes and Projects Chemicals and Waste Management

157
Indicator: Science and technology
Variable: 37
Description: Digital access index (DAI)
Units: Index value between 0 and 1.
Source: International Telecommunication Union. http://www.itu.intHuman Sciences Research Council (HSRC). 2007. Mapping ICT access in South Africa. Press Cape Town.
Department of Communication .2012. Broadband Presentation
Broadband Commission .2013. The State of Broadband 2013: Universalizing Broadband. Statistics South Africa .2013. General household survey 2010, 2011 and 2012. Statistical release P0318 Laura Nistor.2010. The role of the Internet in shaping environmental concern: A focus on post-communist Europe (Journal of Comparative Research in Anthropology and Sociology)
Logic: The internet has increased the amount of environmental information that can be accessed and disseminated. Access to the internet is important for access to information, stakeholder participation, decision-making, generating awareness as well as generating innovative solutions to environmental problems.
Discussion: The Digital Access Index measures the overall ability of individuals in a country to access and use new information and communication technologies (ICTs). The index is built around four fundamental vectors that impact a country’s ability to access ICTs: infrastructure (fixed and mobile phone subscribers), affordability (internet access price), knowledge (literacy and school enrolment) and quality and actual usage (international internet band width and broadband subscribers) of ICTs. The DAI has been calculated for 181 economies. South Africa was ranked 36th in 2002 with a score of 0.45, but dropped six places in ranking since 1998. Countries are classified into one of four digital access categories: high, upper, medium and low. South Africa’s ranking places it in the medium access category.
According to the Department of Communication, as of March 2012 there were around 3.5 million broadband connections in South Africa, with around 850,000 of these being ADSL (26%), over 2.5 million being 3G/HSPA mobile wireless broadband based (69%) and the balance using other access technologies (5%).

158
From the 2013 State of Broadband Report, South Africa was ranked number 111th on the Fixed Broadband Penetration per 100 inhabitants category Worldwide, 62nd on the Mobile Broadband Penetration per 100 inhabitants Worldwide, 44th on the percentage of households with internet in developing countries category, 92nd on the percentage of individuals using the internet Worldwide and 47th on Percentage of Individuals using the Internet in Developing Countries.
Stats SA indicated that 40.6% of South African households had at least one member who had access to or used the internet either at home, work, place of study or internet cafes in 2012. Access to the internet was highest in Gauteng (54.7%), Western Cape (54.3%) and Free State (42.1%) and the lowest in Limpopo (21.3%) and Eastern Cape (25.5%). Looking at South Africa as a whole, there was an increase of 17.1% in access to internet from 23.5% in 2009 to 40.6% in 2012.
The HSRC developed two composite indicators of access to ICT which supplements the Digital access index and provides some information on a subnational (municipal) level. These indicators present two dimensions of ICT access; private access and public provision. With regard to private access the results from the HSRC study show that in only 13 municipalities are at least one in four households able to access all four ICT items (telephone, cellular phone, personal computer and the internet). Even in areas with maximum ICT access, not more than 42.6% of households have access. When considering public access to community ICT facilities (Multi-Purpose Community Centres, Telecenters and Cyberlabs, libraries and Public Information Terminals), the results show that the overwhelming majority of municipalities have less than two public ICT service centres per 1 000 people. A high concentration of ICT service centres are found in urban municipalities, and low levels in rural municipalities. These differences illustrate the unequal distribution of public ICT service between urban and rural areas.

159
Figure 41: Access to internet by Province (2009-2010)
Source: Statistics South Africa (2013). General household survey 2010, 2011 and 2012. Statistical release P0318
0
10
20
30
40
50
60
WC EC NC FS KZN NW GP MP LP RSA
Access to internet by province
2009 2010 2011 2012

160
Figure 42: Private access to ICTs per municipality
Source: Human Sciences Research Council (HSRC) 2007. Mapping ICT access in South Africa. Press Cape Town

161
Indicator: Science and technology
Variable: 38
Description: Number of researchers per 1 000 total employment
Units: Number of researchers.
Source: Department for Science and Technology (DST) 2013. National Survey of Research and Experimental Development (R&D) (2010/2011 Fiscal Year). High Level key Results. www.dst.gov.za Logic: Scientific capacity is important for the development of new technologies for sustainable environmental management. The Frascati Manual’s definition of research and development (R&D) is as follows: “Research and Experimental Development (R&D) is creative work undertaken on a systematic basis in order to increase the stock of knowledge, including knowledge of humanity, culture and society, and the use of this stock knowledge to devise new applications.”
Discussion: The full time equivalent (FTE) researchers per 1 000 employment in South Africa was 1.4% in 2010/11 and 1.5% full time equivalent (FTE) researchers per 1 000 employment in 2009/10.The 2010/11 survey further indicated a total number of 18 719 FTE researchers in South Africa, a decrease of the number of full time equivalent from 19 793 in 2009/2010 (Table 31).
South Africa performed well in comparison with Organisation for Economic Co-operation and Development (OECD) and other selected countries with regard to the proportion of female researchers. Between 2009 and 2010 women researchers as a percentage of total researchers in South Africa increased slightly by 1% from 41% to 42%. Of the selected countries, Argentina had the largest proportion of female researchers at 52.2%, followed by Brazil at 48.0%, and both the Russian Federation and South Africa at 42% (HSRC 2013).
The largest percentage of Gross domestic expenditure on Research and Development GERD in South Africa during 2010/11 was spent on the engineering sciences (17.8%); followed by the medical and health sciences (17.1%); information, computer and communication technologies (13.9%) and social sciences (12.4%). The largest decrease was observed in the engineering sciences where GERD decreased from 24.4% in 2008/09 to 17.8% in 2010/11, and this is associated with the decline in Business Expenditure on R&D (HSRC 2013).

162
The largest proportion of R&D in 2009–2010 focused on engineering sciences (21.9%), followed by the natural sciences (17.6%), and the medical and health sciences (16.7%). South Africa currently has a total of 30 891 full-time equivalent R&D personnel, comprising researchers, technicians and other support staff. Meanwhile, the demographic profile of female researchers in South Africa is changing, with women now comprising 40.8% of the total researchers, compared to 13.6% in Japan, and 35.2% in Norway. Among the developing countries, Argentina leads the way with 50.3% women researchers.
Limitations: A gap in the R&D surveys in the 2002–2003 financial period.
Notes: a) International comparisons – OECD Main Science and Technology Indicators, (2005/2 Edition).

163
a) Following the Organization for Economic Co-operation and Development (OECD) practice, doctoral students are included as researchers.b) Following OECD practice, total employment is now provided by the International Labour Organization based on the Labour Force.
c) The 0.76% for 2001-2002 is as reported in the 2001-2002 R&D Survey Report and is not based on revised gross domestic product (GDP) figures.d) Changes in the methodology used by Statistics South Africa in the Survey of Employment and Earnings have resulted in a 39% increase in the total number of em-
ployees reported for the formal non-agricultural sectors between March 2002 and March 2004.Source: Department for Science and Technology (DST) 2013. National Survey of Research and Experimental Development (R&D) (2010/2011 Fiscal Year). High
Level key Results. www.dst.gov.za
2001–2002d 2003–2004a 2004–2005a 2005–2006 2006–2007 2007–2008 2008–2009 2009–2010 2010–2011
Gross domestic expenditure on R&D (GERD) (Rand millions) 7 488 10 083 12 010 14 149 16 520 18 624 21 041 20 955 20 254
GERD as a percentage of gross domestic product (GDP) 0.76% 0.81% 0.87% 0.92% 0.95% 0.93% 0.92% 0.87% 0.76%
Total R&D personnel full time equivalent 21 195 25 185 29 692 28 798 30 986 31 325 30 802 30 891 29 486
Total researchersb (FTE) 14 182 14 129 17 910 17 303 18 572 19 320 19 384 19 793 18 720
Total women researchers 9 689 11 667 14 163 15 392 15 718 16 154 15 862 16 645 15 918
Total researchers (headcount) 26 913 30 703 36 979 39 266 39 591 40 084 39 955 40 797 37 901
Women researchers as a percentage of total researchers 36% 38% 38% 39.2% 39.7% 40.3% 39.7% 40.8% 42%
Total researchers per 1000 total employmentc, e (FTE) 3.10 1.20 1.60 1.5 1.5 1.5 1.4 1.5 1.4
Total R&D personnel per 1000 total employmente (FTE) 4.60 2.20 2.60 2.4 2.5 2.4 2.2 2.3 2.2
Civil GERD as a percentage of GDP 0.71% 0.72% 0.80% 0.86% 0.89% 0.87% 0.87 0.82 0.77
Table 31: Number of researchers and research and development personnel (R&D) expressed as a percentage of gross domestic product (GDP)

164
Figure 43: Number of reseachers and research and development personnel in South Africa (2001–2011)
Source: Department of Science and Technology (DST) 2013. National Survey of Research and Experimental Development (R&D) (2010/2011 Fiscal Year). www.dst.gov.za
0
5 000
10 000
15 000
20 000
25 000
30 000
35 000
40 000
Total research anddevelopment (R&D)personnel full timeequivalent (FTE)
Total researchers(b)(FTE)
Total women researchers Total researchers(headcount)
Total number of researchers
2001-2002d 2003-2004a 2004-2005a 2005-2006 2006-2007
2007-2008 2008-2009 2009-2010 2010-2011
165
Indicator: Science and technology
Variable: 39
Description: Budget for research and development (R&D)
Units: Percentage of GDP per year.
Source: Department for Science and Technology (DST). National Survey of Research and Experimental Development (R&D) (2010/2011 Fiscal Year). High Level Key Results. www.dst.gov.za
Logic: Applied research and experimental development contribute to economic development by providing new R&D based products and processes with potential for introduction to the market. The strengthening of the R&D system through various mechanisms lead to a more competitive international position through R&D based knowledge and innovation.
Discussion: A survey conducted by the Human Sciences Research Council (HSRC) has found that South Africa spent R20.2 billion on Research and Development (R&D) during the 2010/11 financial year, showing a marked decreased when compared to the R20.9 billion spent during the 2009/10 financial year. The 2010/11 survey has shown a second consecutive year of decline in Gross Domestic Expenditure, following over a decade and a half of real increases during which R&D expenditure increased from R2.5 billion in 1993/94 and peaked at R21 billion in 2008/09 financial year. South Africa needs to escalate its expenditure on research and development in order to increase its international competitiveness in Science and Innovation. Applied research and experimental development contribute to economic development by providing new Research and Development based products and processes with potential for introduction to the market.
According to the 2010/11 R&D survey the Gross Domestic Expenditure on research and development (GERD) as percentage of GDP averaged 2.34% in Organization for Economic Co-operation and Development (OECD) countries and 1.91% in the European Union(EU). The Research and Development survey in South Africa recorded GERD as percentage of Gross Domestic Product (GDP) at 0.76% in 2010/11, this was a decrease of 0.11% as compared to 0.87% recorded in 2009/10. It is concerning that, the weakening of this value is occurring in an environment of modest increases in Gross Domestic Production (GDP). South Africa’s R&D intensity compares with that of middle-income and developing countries such as Turkey (0.84%), India (0.76%) and Poland (0.74%). South Africa has the highest GERD as a percentage of GDP in Africa, where R&D intensity in most countries is below 0.5%. South Africa is not the only country experiencing a decline in GERD as a percentage of GDP, there are several other countries including the Russian Federation, China and Romania which also experienced a decline in GERD/GDP since 2008/09. The South African Department of Science and Technology has set a target of spending 2% of the country’s GDP towards research by 2018.
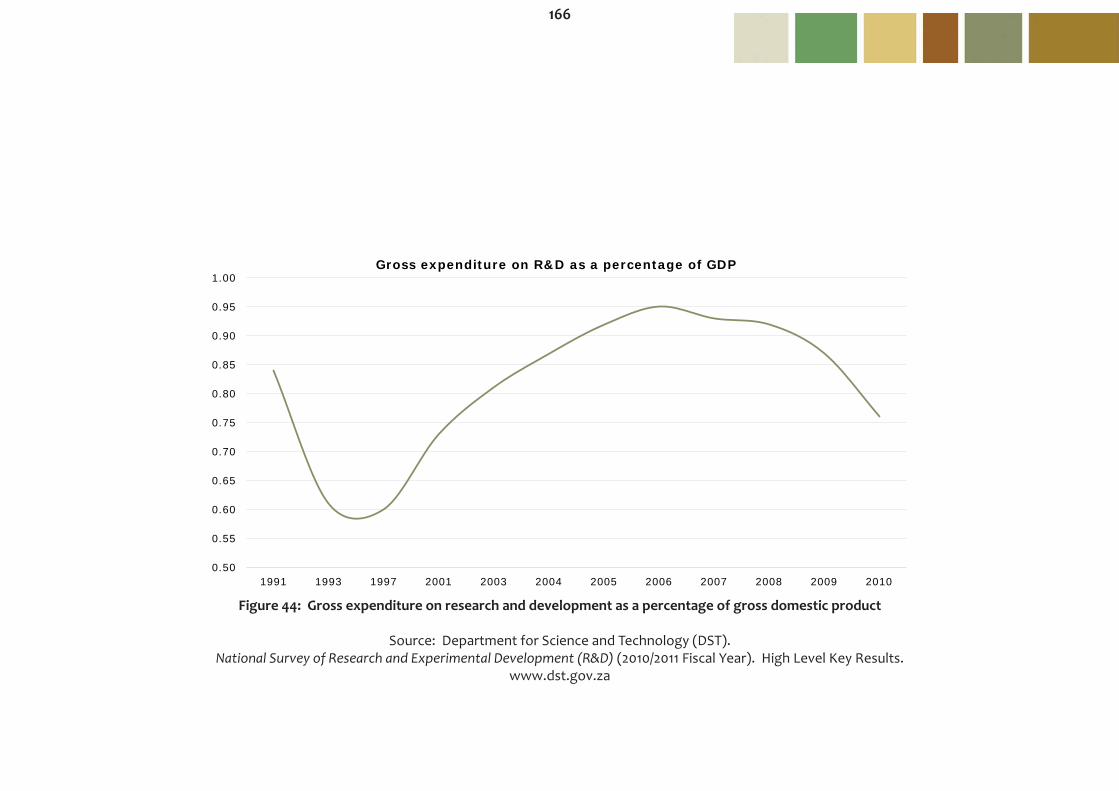
166
Figure 44: Gross expenditure on research and development as a percentage of gross domestic product
Source: Department for Science and Technology (DST). National Survey of Research and Experimental Development (R&D) (2010/2011 Fiscal Year). High Level Key Results.
www.dst.gov.za
0.50
0.55
0.60
0.65
0.70
0.75
0.80
0.85
0.90
0.95
1.00
1991 1993 1997 2001 2003 2004 2005 2006 2007 2008 2009 2010
Gross expenditure on R&D as a percentage of GDP
167
Indicator: Science and technology
Variable: 40
Description: Gross tertiary enrolment rate
Units: Percentage of pupils enrolled at tertiary level of schooling.
Source: Department of Higher Education (Dhet) 2013. Statistics on Post-School Education and Training in South Africa (2011) Department of Higher Education (Dhet) 2013. www.dhet.gov.za Department of Higher Education (Dhet) 2011/2012. Annual report
Logic: The higher the level of education within a population, the higher the capacity for scientific and technological innovation, environmental awareness and ability to address environmental problems.
Discussion: This variable gives a good indication of the literacy level of the country. A higher percentage of students enrolled into a tertiary institution leads to a higher capacity for innovation, awareness and the capacity to solve environmental, social and financial problems faced by the country. During 2011 a total of 938 200 students were enrolled in tertiary institutions in South Africa, this was an increase of 45 264 students as compared to the 2010 total of 892 936. From the 2011 total, 59% of the students were enrolled in contact programmes, while 41% were enrolled in distance education programmes.
Tertiary enrolment in South Africa reached its lowest value of 538 292 in 2004, it then rose from 2005 until 2011 when it reached its peak of 938 200 students. Looking at the entire trend from 2000 to 2011, it can be noted that tertiary enrolment in South Africa has been on the rise year by year except in 2004 were there was a drastic decrease (Figure 46). From Figure 45, it can be noted that Business and Commerce constituted the highest percentageof students registered in tertiary institutions both in 2010 (31%) and 2011 (30%) although there was a slight decrease in 2011. Science and Technology accounted for 28% of the tertiary enrolment in 2011 and it was the stream with the second highest enrolment percentage. The remaining streams (Other Humanities, Education and Unknown) showed enrolment rates of 23%, 17% and 2% respectively. At tertiary level Government committed itself to producing 51 460 Engineering, 51 747 Animal and Human Health and 40 607 Teacher graduates for the period 2011-2014 (Department of Higher Education annual report 2011/2012).
Notes: Notes: The percentage of students enrolled into tertiary institutions falling into the 5 main areas of study where: Unkn = Unknown; OHum = Other Humanities; Edu = Education; BC = Business and Commerce and SET = Science, Engineering and Technology

168
Figure 45: Percentage of students enrolled in each main study area
Source: Department of Higher Education (Dhet) 2012. www.dhet.gov.za
0
10
20
30
40
2000 2001 2002 2003 2004 2005 2006 2007 2008 2009 2010 2011
Percentage of students out of the total in each main area of study
SET BC Edu O Hum Unkn

169
Figure 46: Percentage people enrolled into tertiary education out of the total South African population
Source: Department of Higher Education (Dhet) 2012. www.dhet.gov.za
0
0.1
0.2
0.3
0.4
0.5
2000 2001 2002 2003 2004 2005 2006 2007 2008 2009 2010 2011
Percentage people out of the population enrolled in tertiary education according to the main study areas
SET BC Edu O Hum Unkn

170
Indicator: Science and technology
Variable: 41
Description: Education (primary, secondary and adult basic education and training (ABET))
Units: Number of pupils enrolled at primary, secondary and ABET level of schooling.
Source: Department of Basic Education 2013: Education Statistics in South Africa 2011. www.education.gov.za/
Department of Higher Education: Annual Report 2011/12. www.dhet.gov.za
Logic: The higher the level of education within a population, the higher the capacity for scientific and technological innovation, environmental awareness and ability to address environmental problems.
Discussion: This variable gives a good indication of the literacy level of the country. A higher percentage of pupils enrolled into an education institution leads to a higher capacity for innovation, awareness and the capacity to solve environmental, social and financial problems faced by the country. Education is considered as the most powerful instrument for reducing poverty and inequality and lays a foundation for sustained growth. Access to educational facilities and skills development are key to human well-being which in turn offers opportunities to improve people’s livelihoods and reduces high dependency on the natural environment for subsistence. Education and skills also directly influence economic development and global competitiveness.
Counts for the number of learners were made on the 10th day of schooling and were represented in Gross Enrolment Rate (GER). GER is the level of participation in education and is defined as the number of learners enrolled into a specific school phase (irrespective of age) as a percentage of the appropriate school-age population. A GER of more than 100% thus indicates that there are over- or under-aged learners enrolled in that specific school phase.
The statistics showed that, South Africa had 12 680 829 learners enrolled in all sectors of the basic education system in 2011. Out of these 11 808 036 (93.1%) were in Ordinary Public Schools and 479 958 (3.8%) were in ordinary independent schools. For those Learners who were in other institutions, 284 595 (2.2%) were in Early Childhood Development (ECD) and 108 240 (0.9%) were in special schools. The Adult Basic Education and Training on the other hand had 229 068 students enrolled in 2011. The GER of learners in primary schools showed a 1% decrease (94% in 2010 compared to 93% in 2011). The GER of learners in primary level reached its peak at 108% in 2005 while the GER of learners in secondary level reached its peak at 91% in 2006 and 2007.
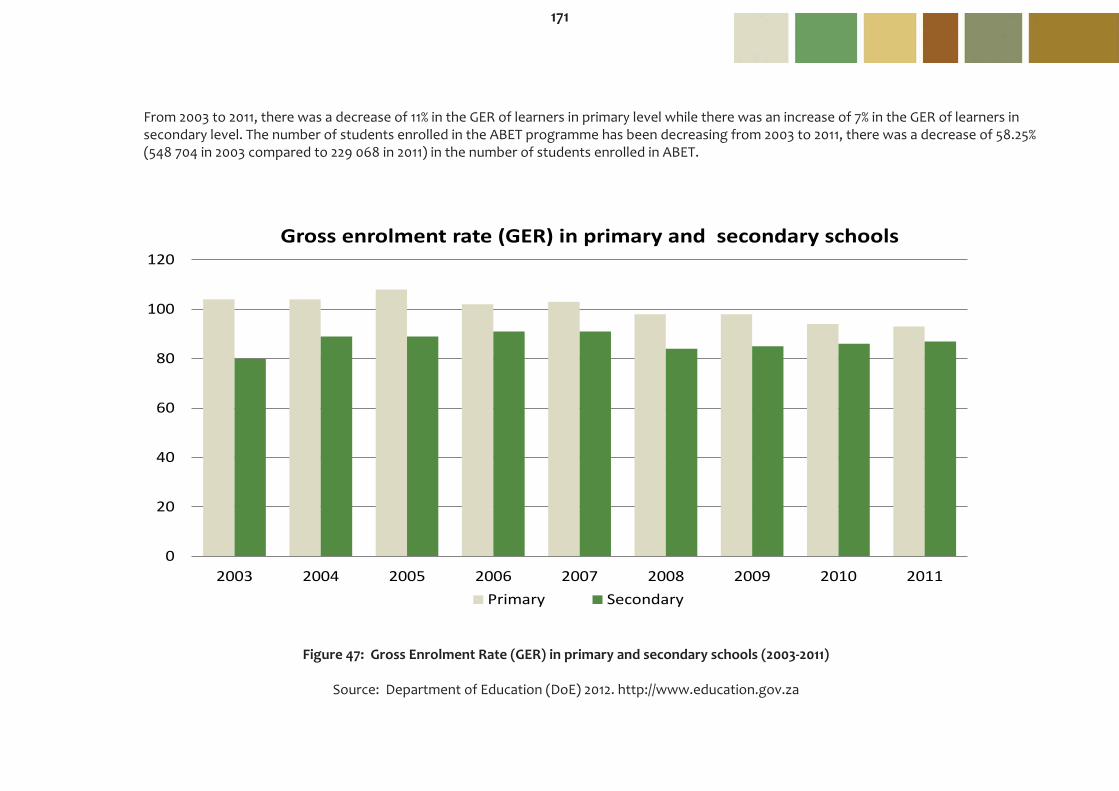
171
From 2003 to 2011, there was a decrease of 11% in the GER of learners in primary level while there was an increase of 7% in the GER of learners in secondary level. The number of students enrolled in the ABET programme has been decreasing from 2003 to 2011, there was a decrease of 58.25% (548 704 in 2003 compared to 229 068 in 2011) in the number of students enrolled in ABET.
Figure 47: Gross Enrolment Rate (GER) in primary and secondary schools (2003-2011)
Source: Department of Education (DoE) 2012. http://www.education.gov.za
0
20
40
60
80
100
120
2003 2004 2005 2006 2007 2008 2009 2010 2011
Gross enrolment rate (GER) in primary and secondary schools
Primary Secondary

172
Number of learners
Public ABET2003 12 038 922 548 7042004 12 176 391 548 3672005 12 217 795 269 1402006 12 293 785 251 6102007 12 410 501 292 7342008 12 239 363 290 6182009 12 214 845 297 900 2010 12 260 099 214 3842011 12 680 829 229 068
Source: Department of Basic Education 2013: Education Statistics in South Africa 2011. http://www.education.gov.za/Department of Higher Education: Annual Report 2011/12.www.dhet.gov.za
Table 32: The total number of learners enrolled into public schools (primary and secondary combined) and into the Adult Basic Education and Training centres

173

174

175
IntroductionEnvironmental sustainability can only be realized if there is cooperation with other countries to manage common environmental problems. Stewardship is the commitment to responsible management of world resources through leadership. Responsibility is shown in participating internationally in global programmes aimed at addressing biophysical, social, economic and institutional issues that go beyond the country’s borders.
Ability to Respond to Global Stewardship CollectivelyThe ability of a country to respond to the need for global stewardship of the environment is important in dealing with transboundary and global environmental issues.
Managing common environmental problems together can lead to greater commitment and effort. South Africa hosted the World Summit on Sustainable Development (WSSD) in September 2002. Agreements from this Summit include the Johannesburg Declaration and the Johannesburg Plan of Implementation (JPOI). The JPOI con-tains 37 time-bound targets, inclusive of the internationally agreed development goals of the Millennium Declaration.
South Africa has already taken a number of steps towards responding to these targets, and is in the process of conceptualizing and developing a coherent national strategy which would voice our commitment in the global community.
The indicators and variables representing our ability to respond to global stewardship collectively are:
• Greenhouse gas emissions - Carbon emissions per capita
• Participation in international collaborative efforts - Multilateral environmental agreements
• Reducing transboundary environmental pressures - Production and consumption of CFCs - Transfrontier conservation areas (TFCAs)
For further information on the global stewardship please refer to the following:
Department of Foreign Affairs, 2005. The South African Treaty Index.United Nations Environment Programme 2004. Global Environment Outlook 3. http://www.unep.org/geo/ United Nations Environment Programme 2002. Africa Environment Outlook. http://www.unep.org/dewa/Africa United Nations Environment Programme 2006. Africa Environment Outlook 2. Our Environment, Our Wealth. http://www.unep.org/dewa/Afric

176
Indicator: Greenhouse gas emissions
Variable: 42
Description: Carbon emissions per capita
Units: Metric tons of carbon emissions per capita.
Source: IEA (International Energy Agency) 2012. CO2 emissions from fuel combustion Highlights. IEA Statistics. Accessed 06 June 2013 IEA (International Energy Agency) 2002. Key World Energy Statistics from the IEA. Paris.
Logic: Emissions of carbon dioxide contribute to climate change. All countries emit carbon dioxide, but the amount per person varies considerably.
Discussion: According to the International Energy Agency (IEA) 2012, Global CO2 emissions rose by 4.6% in 2010, after having declined by 1% in 2009 due to the impact of the financial crisis, in particular on Western economies. Emissions in Annex I1 countries increased by 3.3% in 2010 after falling sharply in 2009, while emissions in non-Annex I2 countries continued to increase rapidly (5.6%).
The highly energy-intensive South African economy makes the country one of the highest emitters of greenhouse gasses in Africa. South Africa currently relies heavily on fossil fuels as a primary energy source (87% in 2010); with coal providing 74% of it. Although South Africa accounted for 37% of CO2 emissions from fuel combustion across all of Africa in 2010, it represented only 1% of the global total. The electricity and heat sector produced 69% of South Africa’s CO2 emissions in 2010 (IEA 2012).
South Africa was the 19th most carbon-intensive economy, measuring kg CO₂ / 95$ PPP in 2000 (IEA, 2002). An abundance of coal resources and subsidized coal-fired electricity led to a reliance on energy intensive mining and heavy industry as the historical drivers of economic development. South African per capita emissions are higher than those of many European countries, and more than 3.5 times the average for developing countries (IEA, 2002).
Figure 48 indicates that the per-capita CO2 emission in South Africa reached its peak of 9.73 metric tons in 2008. From 2008 to 2010, CO2 per capita decreased by 2.79 metric tons (9.73 metric tons in 2008 and 6.94 metric tons in 2010). Per capita CO2 emission in South Africa has been fairly constant since 1978 up to 2007. Based on the discussion above, it is clear that South Africa needs to pay more attention on reducing its CO2 emissions in order to cut down its carbon footprint.
177
Notes 1. Annex I countries are industrialised countries which took on obligations to reduce their greenhouse gas emissions under the Kyoto Protocol. Their combined emissions, averaged out during the 2008-2012 period, should be 5.2% below 1990 levels. The Annex I Parties to the 1992 UN Framework Convention on Climate Change (UNFCCC) are: Australia, Austria, Belarus, Belgium, Bulgaria, Canada, Croatia, the Czech Republic, Denmark, Estonia, European Economic Community, Finland, France, Germany, Greece, Hungary, Iceland, Ireland, Italy, Japan, Latvia, Lichtenstein, Lithuania, Luxembourg, Malta, Monaco, the Netherlands, New Zealand, Norway, Poland, Portugal, Romania, Russian Federation, the Slovak Republic, Slovenia, Spain, Sweden, Switzerland, Turkey, Ukraine, United Kingdom and United States.
2. Non-Annex I countries are the group of developing countries which have signed and ratified the Kyoto Protocol however, they do not have binding emission reduction targets. For the list of Non-Annex I countries, visit the link below. https://unfccc.int/parties_and_observers/parties/non_annex_i/ items/2833.php

178
1991 1992 1993 1994 1995 1996 1997 1998 1999 2000
Emissions per capita (metric tons) 6.96 6.69 6.72 6.73 7.02 7.12 7.31 7.31 6.74 6.74
2001 2002 2003 2004 2005 2006 2007 2008 2009 2010Emissions per capita (metric tons) 6.29 6.44 6.93 7.20 6.67 6.91 7.36 7.93 7.48 6.94
Figure 48: Total carbon emissions per capita in metric tons
Source: IEA (International Energy Agency) 2012. CO2 emissions from fuel combustion highlights. IEA Statistics
Source: IEA (International Energy Agency) 2012. CO2 emissions from fuel combustion highlights. IEA Statistics
Table 33: Carbon emissions (1991–2010)
0
1
2
3
4
5
6
7
8
9
1971 1974 1977 1980 1983 1986 1989 1992 1995 1998 2001 2004 2007 2010
Carbon emission per capita (metric tons)

179
Indicator: Participation in international collaborative efforts
Variable: 43
Description: Multilateral environmental agreements
Units: Number of agreements signed and in-force.
Source: United Nations Environmental Programme. www.unep.org
Socioeconomic Data and Applications Center (SEDAC). http://sedac.ciesin.org
Logic: Multilateral environmental agreements promote the protection of the environment through the individual and collaborative efforts. South Africa’s ratification of these agreements demonstrates the country’s support for international treaties as well as efforts to manage common environmental resources.
Discussion: A Multilateral Environmental Agreement (MEA) is considered to be a legally binding agreement between several States related to the environmental issues. MEAs play a critical role in the overall framework of environmental laws and conventions. Complementing national legislation and bilateral or regional agreements, MEAs form the over-arching international legal basis for global efforts to address particular environmental issues (UNEP).
The list of multilateral environmental agreements provides an indication of priority environmental issues for the country. The table can be used to understand where our greatest focus lies and those areas where South Africa has a weak policy approach. Cross-referencing implementation actions/ policy against date of rectification will show level of commitment in the multilateral agreement. These can be viewed on the Environmental Treaties and Resource Indicators website: http://sedac.ciesin.org
Limitations: Participation in international agreements should go beyond the becoming signatures to treaties. Aspects such as participation and compliance with treaty obligations are currently not measured.

180
Multilateral Environmental Agreement Status a
Biodiversity and Heritage CBD- Convention on Biological Diversity Signed: 1999, Ratification: 1995 , Accession: 2003 (R), Into force:
1993CPB- Cartagena Protocol on Biosafety Signed: 2000, Into force: 2004Nagoya Protocol on Access and Benefit-sharing Signed: 2011CCD-Convention to Combat Desertification Signed: 1995, Ratification: 1997, Into force: 1997CITES- Convention on International Trade in Endangered Species of Wild Fauna and Flora Signed: 1973, Ratification: 1975 (R), Into force: 1975CMS- Convention on the Conservation of Migratory Species of Wild Animals Signed: 2003, Ratification: 2003, Into force: 1991, 1999
WHC-World Heritage Committee Ratification: July 1997, Into force: 1975Ramsar Convention on Wetlands Wetlands of International importance, especially as waterfowl habitant
Signed: 1975, Ratification: 1975 (R), Into force: 1971
Climate ChangeUNFCCC- United Nations Framework Convention on Climate Change Signed: 1993, Ratification: 1997 (R), Accession: 2002 (Ac), Into
force: 1997,1990 (Ac)KP- Kyoto Protocol Ratification: 2002, Into force: 2005Chemicals and WasteBasel Convention on the Control of Transboundary movements of Hazardous Waste and their Disposal
Signed: 1989, Accession: 1994 (Ac), Into force: 1992
Rotterdam- Convention on Prior Informed Consent for certain Hazardous Chemicals and Pesti-cides in International Trade
Signed: 1998, Accession: 2004, Into force: 2004
Stockholm Convention on Persistent Organic Pollutants Signed: 2001, Ratification: 2002, Into force: 2001Vienna Convention for the Protection of the Ozone Layer Signed: 2005, Accession: 1990 (Ac) Into force: 1988Montreal Protocol on substance that deplete the ozone layer Signed: 1987, Accession: 1990 (Ac), Into force: 1989
Table 34: Examples of multilateral environmental agreements signed

181
Marine and CoastalAbidjan Convention for Cooperation in the Protection and Development of the Marine and Coastal Environment of the East and Central African Region and related Protocols
Signed: 1981, Into force: 1984
Antarctic Treaty COMNAP Date Signed: 1998, Ratification: 1961, Into force: 1961, 1988CCMLAR-Convention on the Conservation of Antarctic Marine Living Resources Entry into force: 1982IWC-International Whaling Commission Signed: 1948, Into force: 1948LC-London Convention and 1996 Protocol Signed: 1978, Ratification: 1978, Entry into force: 1975Nairobi Convention for the Protection, management and development of the Marine and Coastal Environment of the East African Region and Related Protocol
Date Signed: 1985, Entry into force: 1996
UNCLOS- United Nations Convention of the Law of the Sea Date Signed: 1982, Ratification: 1997, Entry into force: 1994BCC- Benguela Current Large Marine EcosystemIMO-International Maritime Organization Signed: 1995, Into force: 1948
ASCLME- Agulhas and Somali Current Large Marine Ecosystems
ACAP- Agreement on the Conservation of Albatrosses and PetrelsIOSEA-MOU Turtle- Indian Ocean-South East Asian- Marine Turtle Memorandum of Understanding
Entry into force: 2005
International Governance
AMCEN- The African Ministers Conference on the Environment Entry into force: 1985
GEF-Global Environmental Facility Date of Participation: 1994
OECD Environmental Policy Committee 2008
World Bank’s Climate Investment Funds – Clean Technology Fund Trust Fund Committee 2008
a) When a government representative signs an international convention on behalf of the country, a State becomes party to that convention. The convention is later ratified by the government, which signifies agreement to be bound by the convention. If the state does not sign the convention when it was open for signature, but
later formally agrees to be bound by the convention, a government accedes to the convention.
Source: Environmental Treaties and Resource Indicators. http://sedac.ciesin.org

182
International environmental agreements by subject Agreements signed Agreements in force (party to)Soil quality/ pollution 0 3Water quality/ pollution 0 1Water resources conservation/ management 1 1Seawater quality/ pollution 0 26Marine resources conservation/ management 1 11Sea navigation 0 7Sea jurisdiction 0 4Air 0 9Plant species protection/ management 3 13Control of plants considered pests/ diseases 0 2Maintenance of thickets/ groups of trees 0 1Forest conservation/ management/ exploitation 1 0Animal species protection/ management 2 16Control of animals considered pests/ diseases 0 3Hunting/ management/ use of harvestable species 0 3Fishing/ management/ use of harvestable fish 0 10Hazardous substances 1 20Radiation 2 12Non renewable resources use/ mining 0 4Land use and land use planning 0 2Atmosphere/ climate/ outer space 1 7Wastes (general) 1 12Noise 0 2Renewable energy sources and energy conservation 1 2Protected areas 0 9Legal and Institutional Questions 3 11Natural resources and nature conservation 0 9Environmental conservation (general) 2 6
Source: Environmental Treaties and Resource Indicators. http://sedac.ciesin.org
Table 35: Numbers of agreements signed and in force

183
Indicator: Reducing transboundary environmental pressures
Variable: 44
Description: Production and consumption of CFCs
Units: Ozone Depleting (ODP) tons.
Source: United Nations Environment Program (UNEP) 2012. Ozone Secretariat. Millennium Development Goals. Country Report 2010. South Africa
Logic: This variable shows South Africa’s production and consumption of ozone depleting substances. Ozone depleting substances are controlled through the Montreal Protocol on Substances that deplete the ozone layer. Ozone depleting substances are causing a thinning in the stratospheric ozone layer. An increase in ozone concentrations in the atmosphere and more radiation reaching the earth have negative impacts on human health and ecosystem functioning. The Montreal Protocol was agreed upon in 1987 at the Headquarters of the International Civil Aviation Organization. This protocol aims to halve the consumption of the main chlorofluorocarbon (CFC) gasses in relation to the 1986 figures and later to ban them entirely.
Discussion: The ozone layer is crucial for life on earth. It protects us from harmful UV rays which can have serious effects on animals, biodiversity and people’s health, including skin cancer and eye cataract. Experts have proven that ozone-layer depletion on man-made chemicals containing chlorine and bromine that are emitted from a number of products and industrial processes. CFCs are halo alkanes containing both chlorine and fluorine. Bromine and chlorine-based chemicals including (Chlorofluorocarbons) CFCs have been found to destroy ozone. Because they were widely used in industry in applications such as refrigerants, propellants and cleaning solvents, they were the focus of early action under the Montreal Protocol. They are no longer used in most applications. CFCs also contribute to global warming, with a global warming potential (GWP) of 6 000–9 800 times that of carbon dioxide (over a period of 100 years).
South Africa has almost completely phased out the use of ozone-depleting substances such as CFCs and carbon tetrachloride, and stopped using ozone-depleting CFCs in aerosol spray-can propellants as far back as July 1992. However, a small amount of legal CFCs are imported and exported to fill asthma inhalers as well as air conditioners and refrigerators manufactured before 1996. The CFC methyl bromide (used as a pesticide in the agricultural sector) is still being imported and used. Consumption of ozone-depleting substances in South Africa, weighted according to the ozone - depleting potential of each substance (expressed in ODP tons), were reduced by more than 97% during the period 1986-2012. This is mainly a result of reduced imports of halons and CFCs. Hydro-CFC’s are to be phased out by 2040 and methyl bromide (used in pesticides) is to be phased out by 2015.

184
The variable signifies the commitment to progress in phasing out the consumption of CFCs by countries that have ratified the Montreal Protocol. The Vienna Convention for the Protection of the Ozone Layer (1985) and the Montreal Protocol (1987) are now recognized as having been successful in preventing the global environmental catastrophe that could have been caused by stratospheric ozone depletion. The Montreal Protocol aims to reduce and eventually eliminate the emissions of anthropogenic ozone-depleting substances by ceasing their production and consumption.
The analysis for the period 2012 highlights the fact that hydrochlorofluorocarbons (HCFCs) dominate consumption at 100% of total ODS consumed during 2011 and 2012. Methyl bromide (MeBr) decreased significantly from 2008 (52%) to 2009 (3%) and was not consumed from 2010 to 2012. Bromochloromethane (BCM) increased from 2003 (2%) to 2004 (4%) and thereafter consumption ceased from 2005 to 2012.

185
Figure 49: Production and consumption of ozone depleting substances (CFCs) in South Africa (1986–2012)
Source: UNEP Ozone Secretariat (2013). http://ozone.unep.org/Data Access/
-2000
0
2000
4000
6000
8000
10000
12000
14000
1986 1990 1992 1994 1996 1998 2000 2002 2004 2006 2008 2010 2012
Production and consumption of ozone depleting substances (CFC's) in ODP tons
Consumption Production
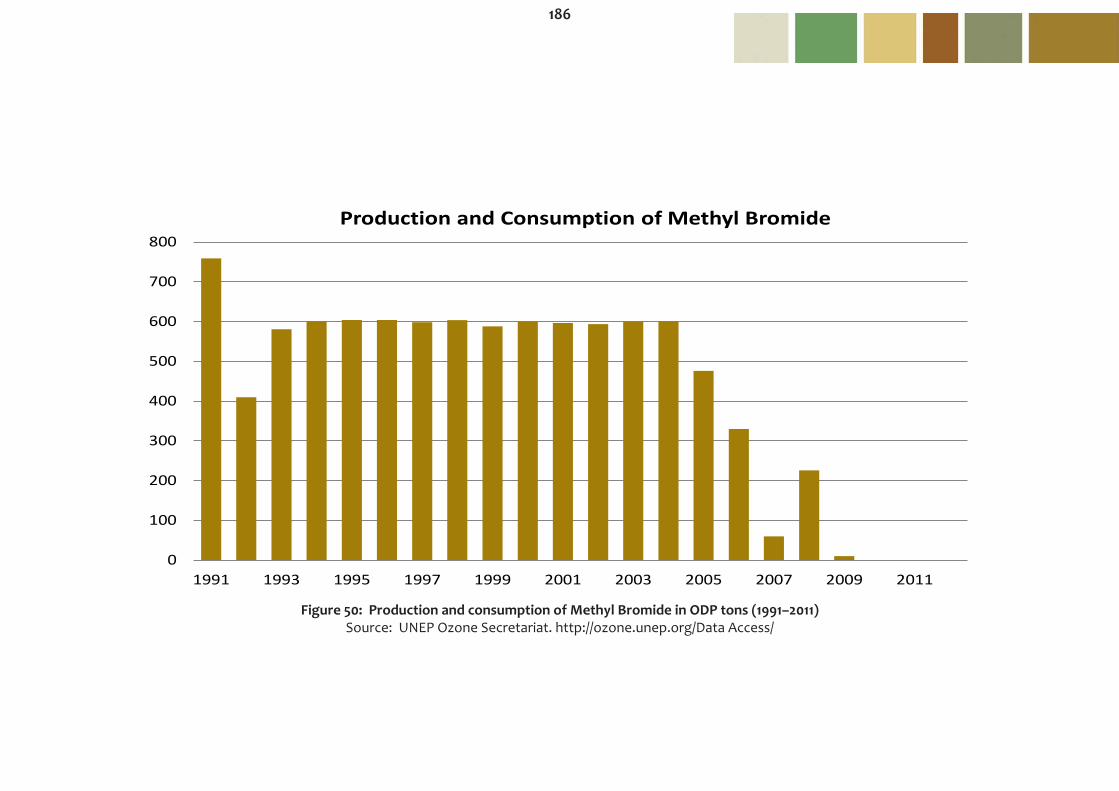
186
Figure 50: Production and consumption of Methyl Bromide in ODP tons (1991–2011)Source: UNEP Ozone Secretariat. http://ozone.unep.org/Data Access/
0
100
200
300
400
500
600
700
800
1991 1993 1995 1997 1999 2001 2003 2005 2007 2009 2011
Production and Consumption of Methyl Bromide

187
Figure 51: Production and consumption of HCFC’s in ODP tons (1986–2012)
Source: UNEP Ozone Secretariat.http://ozone.unep.org/Data Access/
0
50
100
150
200
250
300
350
400
450
500
1986 1990 1992 1994 1996 1998 2000 2002 2004 2006 2008 2010 2012
Production and consumption of HCFC's in ODP tons
Consumption Production

188
Anx Group Name 1986 1989 1990 1991 1992 1993 1994 1995 1996 1997 1998 1999 2000A I CFCs 12,449.0 10 656.0 6 804.5 4 795.3 3 951.4 4 127.4 2 416.6 1 679.6 0.0 98.3 155.1 117.3 80.5A II Halons 6,222.0 3 807.0 1 264.0 1 121.0 5 372.0 1 059.0 0.0 0.0 0.0 0.0 0.0 0.0 0.0B I Other Fully Halogen-
ated CFCs0.0 666.9 0.0 0.0 0.0 0.0 0.0 0.0 0.0 0.0 0.0 0.0 0.0
B II Carbon Tetrachloride 8 919.5 8 919.5 10 104.5 0.0 82.5 134.2 53.9 0.0 0.0 0.0 0.0 0.0 0.0B III Methyl Chloroform 450.0 450.0 450.0 450.0 448.8 362.0 113.7 60.3 0.0 0.0 0.0 0.0 0.0C I HCFCs 89.2 89.2 103.3 0.0 63.4 142.2 205.1 152.5 194.3 256.9 260.8 269.7 134.7C II HBFCs 0.0 0.0 0.0 0.0 0.0 0.0 0.0 0.0 0.0 0.0 0.0 0.0 0.0C III Bromochloromethane 0.0 0.0 0.0 0.0 0.0 0.0 0.0 0.0 0.0 0.0 0.0 0.0 0.0E I Methyl Bromide 0.0 0.0 0.0 759.0 409.8 580.8 601.2 604.2 604.2 598.5 604.0 588.1 600.1
Anx Group Name 2001 2002 2003 2004 2005 2006 2007 2008 2009 2010 2011 2012 Baseline
A I CFCs 16.0 86.6 60.8 61.8 30.0 0.0 0.0 0.0 0.0 0.0 0.0 0.0 592.6A II Halons 0.0 0.0 0.0 0.0 0.0 0.0 24 0.0 0.0 0.0 0.0 0.0 0.0B I Other Fully Halogen-
ated CFCs0.0 0.0 0.0 0.0 0.0 0.0 0.0 0.0 0.0 0.0 0.0 0.0 0.0
B II Carbon Tetrachloride 0.0 0.0 0.0 0.0 0.0 0.0 0.0 0.0 0.0 0.0 0.0 0.0 0.0B III Methyl Chloroform 0.0 0.0 0.0 0.0 0.0 0.0 0.0 0.0 0.0 0.0 0.0 0.0 0.0C I HCFCs 111.1 168.4 253.7 173.1 209.9 222.6 335 209.2 339.2 400.1 379.3 461.71 369.7C II HBFCs 0.0 0.0 0.0 0.0 0.0 0.0 0.0 0.0 0.0 0.0 0.0 0.0 0.0C III Bromochloromethane 0.0 0.0 14.4 36.0 20.8 0.0 0.0 0.0 0.0 -6.9 0.0 0.0 602.7E I Methyl Bromide 596.5 593.8 600.7 601.2 476.2 330 60 225.9 10 0.0 0.0 0.0 602.7
Source: UNEP Ozone Secretariat. 2013. http://ozone.unep.org/Data Access/
Table 36: Consumption of ozone depleting substances in ODP tons for South Africa

189
Anx Group Name 1986 1989 1990 1991 1992 1993 1994 1995 1996 1997 1998 1999 2000A I CFCs 10 800.0 9 500.0 6 639.0 4 748.0 3 437.0 3 722.0 1 947.0 1 627.0 0.0 0.0 0.0 0.0 0.0B II Carbon Tetrachloride 0.0 12 697.3 10 264.1 0.0 7 139.0 4 774.0 6 340.4 4 931.3 0.0 0.0 0.0 0.0 0.0C I HCFCs 0.0 0.0 0.0 0.0 56.5 84.5 87.0 56.8 0.0 0.0 0.0 0.0 0.0
Anx Group Name 2001 2002 2003 2004 2005 2006 2007 2008 2009 2010 2011 2012 BaselineA I CFCs 0.0 0.0 0.0 0.0 0.0 0.0 0.0 0.0 0.0 0.0 0.0 0.0 542.3B II Carbon Tetrachloride 0.0 0.0 0.0 0.0 0.0 0.0 0.0 0.0 0.0 0.0 0.0 0.0 0.0C I HCFCs 0.0 0.0 0.0 0.0 0.0 0.0 0.0 0.0 0.0 0.0 0.0 0.0 0.0
Source: UNEP Ozone Secretariat. 2013. http://ozone.unep.org/Data Access/
Table 37: Production in ODP tons for South Africa

190
Indicator: Reducing transboundary environmental pressures
Variable: 45
Description: Transfrontier Conservation Areas (TFCAs)
Units: Area covered by Transfrontier Conservation Areas and the countries involved in the transboundary partnerships.
Source: Peace Parks Foundation (2013). www.peaceparks.org Department of Environmental Affairs (2013). Enterprise Geospatial Information Management.
Logic: Transfrontier Conservation Areas is a good indicator of a country’s ability to work in partnership with other countries with the goal of conserving biodiversity.
Discussion: A Transfrontier Conservation Areas (TFCAs) is defined as a cross border region comprising of different component areas that have different forms of conservation statuses. These areas can comprise national parks, private game reserves, communal natural resource management areas and hunting concession areas. The Department of Environmental Affairs and Tourism has developed a focused Transfrontier Conservation Area (TFCA) programme, in partnership with South Africa’s neighbouring countries, to achieve the establishment of conservation areas at this large-scale. Benefits include conserving globally significant biological diversity and ecosystems, their components, process and functions such as re-establishing the seasonal migration routes of wildlife. The establishment of TFCAs also encourages linkages between conservation and economic development through activities such as cross-border tourism, cultural tourism, infrastructure development and the sustainable use of natural resources.
There are six Transfrontier Conservation Areas (TFCAs) and respective countries involved are:
•/Ai/Ais – Richtersveld TP - South Africa, Namibia, •Great Limpopo TP - South Africa, Mozambique, Zimbabwe, •Kgalagadi TFCA- South Africa, Botswana, •Greater Mapungubwe TFCRA - South Africa, Botswana, Zimbabwe, •Lubombo TFCA - South Africa, Mozambique, Swaziland, •Maloti-Drakensberg TFCDA - South Africa, Lesotho.
Besides the TFCAs there are also Transfrontier Conservation Parks. These parks are defined as an area comprising of two or more areas that border each other across international boundaries with the primary focus being wildlife conservation. The first establishment development and management of such a Transfrontier Conservation Area was the Kgalagadi Transfrontier Park. This park was established on the 7th April 1999. Since its inception 5 more Transfrontier Conservation Areas have been established.

191
Figure 52: Distribution of Transfrontier Conservation Areas in South Africa and neighbouring countries
Source: Peace Parks Foundation. www.peaceparks.co.zaDepartment of Environmental Affairs. Enterprise Geospatial Information Management
Limitations: It should be noted that the establishment of a Transfrontier Conservation Area/Park is a complex process and involves various cross-cutting issues between different countries.

192
Park name When established Area Area in South Africa Bordering Countries!Ai-!Ais/Richtersveld TP 2001 5921.14 km2 1589.99 km2 (26.85%) NamibiaKgalagadi TFCA 1999 35549.58 km2 9540.75 km2 (26.84%) BotswanaGreat Mapungubwe TFCA 2006 54376.42 km2 2491.37 km2 (4.58%) Botswana and ZimbabweGreat Limpopo TP 2002 37580.11 km2 18951.86 km2 (50.43%) Mozambique and ZimbabweLubombo TFCRA 2002 9358.49 km2 3583.55 km2 (38.29%) Swaziland and MozambiqueMaloti-Drakensberg TFCDA 2001 14744.71 km2 8759.98 km2 (59.41%) Lesotho
Table 38:Transfrontier Conservation Area names and information regarding establishment date, area currently occupied and bordering countries
Source: Peace Parks Foundation 2013. Transfrontier Conservation Area. www.peaceparks.co.za