team project report - university of cincinnati€¦ · web viewa digital microscope (keyence...
TRANSCRIPT

TEAM PROJECT REPORT
Application of Nanocomposites on Controlling Biofilms in Drinking Water Distribution System
Submitted To
The RET Site
For
“Challenge-Based Learning and Engineering Design Process Enhanced Research Experiences for Middle and High School In-Service Teachers”
Sponsored By
The National Science Foundation
Grant ID No.: EEC-1404766
College of Engineering and Applied Science
University Of Cincinnati, Cincinnati, Ohio
Prepared By
Participant # 1: Amy Parker, Environmental Science, 9-12th, Finneytown High School, Cincinnati, Ohio
Participant # 2: Nancy A. Schreder-Vossen, Biology, Grade 9, William Harrison High School, Harrison, Ohio
Approved By
(_______________________)(Dr. Margaret J. Kupferle)
Department of Biomedical, Chemical, and Environmental EngineeringCollege of Engineering and Applied Science
University of Cincinnati
Reporting Period: June 13 – July 28, 2016
1

Abstract
Biofilm formation in drinking water distribution systems can negatively impact drinking water quality. Biofilm reactors are commonly used in research to grow biofilm and test how the bacteria grow in different environments. This research paper will focus on whether or not nanocomposites have an effect on the growth of biofilm, specifically comparing Polyethylene Multi-Walled Carbon Nanotubules (PE-MWCNTs) with a copper control. The models and methods used in this research will be documented. They include using a biofilm reactor to grow the bacteria Pseudomonas fluorescens and utilizing the Laser Scanning Microscope for biofilm imaging. Image J software was used to quantify the number of living and dead bacteria cells and this data was statistically analyzed using JMP® software. The results of this research project will provide insight on biofilm formation and could potentially provide an alternative material that could be used in water distribution systems.
Key Words
Biofilms, nanocomponents, Extracellular Polymeric Substance (EPS), potable water, Carbon Nanotubes (CNTs)
Main Body
1. INTRODUCTION
Biofilm, a community of bacteria that are held together and adhere to a surface with the aid of an extracellular polymeric substance (EPS), are found to form naturally in both nature and in engineered systems. Biofilm can be found in various locations including but not limited to the hulls of ships, implanted medical devices, pond surfaces, and human teeth. More often than not, the actual risk / danger of biofilm is less due to the bacteria composing the biofilm than it is due to the pathogens that use the biofilm as a habitat for protection (Batté et al. 2003). Despite popular belief, not all biofilm is harmful. In fact, some biofilm have a positive impact on their environment, such as biofilm located in the human gut.
One biofilm location of particular interest is biofilm in the potable water system. Water transportation systems exhibit ideal conditions for bacterial attachment and growth, even when nutrients are lacking. Mature biofilm provide the increased risk of biofilm chunks breaking off, traveling through the water, and colonizing in a different location in the piping (Batté et al. 2003). Biofilm also present a potential health risk because they serve as an ideal reservoir for viruses and pathogens, that if transported through the water and ingested by humans, may lead to severe illness, or even death (Percival et al. 2000).
Multiple methods are currently being employed to reduce biofilm growth in potable water systems, including chlorination, the minimization of stagnant water in pipes, and alternative pipe materials (Mathieu et al. 2013). Due to significant limitations in previously studied methods, research is beginning to explore the application of nanotechnology as an alternative biofilm prevention method. One commonly used form of nanotechnology that will be further researched in this study is carbon nanotubes (CNTs). Three ways nanoparticles are applied currently include dispersal, coating, and embedded in nanocomposites. Due to factors hindering the efficiency of dispersal and coating, the latter will be the current study’s focus (Dong et al. 2012).
In this specific research study, biofilm will be cultured in two separate biofilm reactors and its growth monitored on coupons, or small samples, of two different materials, copper and a nanocomposite, Polyethylene Multi-walled Carbon Nanotubes (PE-MWCNTs). Polyethylene was selected as the medium to hold the carbon nanotubes together, but the specific material of interest is the carbon nanotubes. Biofilm growth will be recorded for eight consecutive weeks, with a focus placed on the impact of the material and its surface properties on biofilm growth as well as on the impact of coupon position in the reactor on biofilm formation and viability. The study results will then be analyzed to determine the possibility of further researching nanocomposites as an alternative material for pipe construction in potable water systems.
2

2. LITERATURE REVIEW
Living in community rather than as independent cells improves the survival of microorganisms. These aggregations of microorganisms and the extracellular polymeric substance (EPS), which they produce, are commonly known as biofilms (Percival et al. 2000; Kjelleberg and Givskov, 2007). Although biofilm may be cultured in a lab to consist of only one species, the majority of all naturally occurring biofilms consist of a great variety of different microorganisms (Chen and Li, 2002; Laspidou et al. 2014; Schmeisser et al. 2003). According to Upadhyayula et al. (2010), a good definition of biofilm is “a complex aggregation of a genetically diverse group of microorganisms, all encapsulated within a matrix of extracellular polymeric substances (EPS)”.
Composed of water, lipids, nucleic acids, polysaccharides, and proteins, the extracellular polymeric substance (EPS) is vital for biofilm formation. However, by volume, water makes up the majority of the EPS, providing bacteria with an extra protective layer of hydration in times of water deprivation (Flemming and Wingender, 2010). The EPS, which is produced by the bacteria cells that eventually form the biofilm, aids in surface adhesion, nutrient acquisition, and biofilm stability. Within a biofilm, the majority of the mass comes from the EPS, leaving roughly 10% to be composed of microbials (Thuptimdang et al. 2015; Chen and Li, 2002; Kostakioto et al. 2004). Although individual bacterial cell mobility is no longer possible within a biofilm, the scaffolding provided by the EPS encourages and enhances individual cell interactions (Flemming and Wingender, 2010).
Although a disparity exists in the precise number of steps or stages in the biofilm formation process, the one thing that researchers can agree on is that multiple stages are required. Four general steps in the formation process of biofilms are as follows: planktonic, attachment, maturation, and dispersion (Thuptimdang et al. 2015). The major difference between the four-stage or five-stage biofilm formation process occurs within the final stages. Occasionally the maturation stage is subdivided into multiple parts, such as monolayer, active biofilm, and matured biofilm (Upadhyayula et al. 2010). The biofilm formation stage of attachment is complex, impacted by the surface properties of the substrate on which the biofilm lands. A few surface properties of interest include hydrophobic vs. hydrophilic, zeta potential, and surface texture (Renner and Weibel, 2011). According to Upadhyayula et al. (2010), scientists have yet to discover a material that is 100% microbial resistant, resulting in a greater research focus on biofilm maturation and dispersion prevention. The final stage in the biofilm formation process, dispersal of mature biofilm, may occur as a result of multiple different signals. One major cause of dispersal is shear or parallel stress, but bacteria can also leave a biofilm due to detecting shortages in required nutrients or harmful environmental changes (Abe et al. 2012; Kostakioti et al. 2004).
Biofilms can inhabit essentially any surface, with limitless locations for their growth and formation. They can have a very negative impact when located on medical devices or on medical implants, leading to infection and illness. Dental plaque, a type of biofilm on human teeth, can also lead to enamel decay and eventual gum disease (Laspidou et al. 2014). Although commonly referred to as a negative thing, when located in desirable places, biofilm can actually benefit the environment. Within aquifers, biofilm can serve as biobarriers to prevent the entrance of contaminants (Chen and Li, 2002). Biofilms are also essential to the filtration process of wastewater, because they are used to break down and digest substances, prior to additional stages in the filtration process (Laspidou et al. 2014).
As the human population increases, so too does the demand for clean potable water. Although water is purified within the filtration / treatment system, the risk still exists for recontamination in the process of distributing the water to the consumer (Batté et al. 2003). Almost 95% of the microbial cells located in potable water systems live within biofilm, rather than being dispersed throughout the water (Wu et al. 2015). The presence of biofilms in the potable water system are harmful because biofilm increase the likelihood of corrosion, increase nitrification rates, and provide shelter and protection for various pathogens (Wu et al. 2015). Every year worldwide, just shy of 2 million people die from diseases involving diarrheal complications, and ultimately dehydration. Poor hygiene and water-borne illness result in close to 4,000 children deaths each day (Street et al. 2014). Discovering reliable and effective methods for the eradication of biofilms is essential for human health.
3

A few major current methods being employed to prevent or kill biofilms in potable water systems include chlorination, prevention or minimization of stagnant water, and use of alternative pipe materials. The first method involves the addition of chlorine to drinking water. Chlorination injures, but is not able to kill the bacteria present in the potable water (Mathieu et al. 2014; Zheng et al. 2012). In a study conducted by Cantor (2003), addition of free chlorination to water flowing through pipes resulted in increased levels of corrosion. Also, using chlorine in water purification produces byproducts that may be carcinogenic (Batté et al. 2003; Frimmel et al. 2010; Mathieu et al. 2014). Maintaining the appropriate level of chlorine residuals in the potable water to prevent microbial / biofilm growth, yet not cause adverse health effects is a difficult balance to maintain (Zheng et al. 2012). The second method is the prevention or minimization of stagnant water in the potable water system pipes. When water conditions are stagnant, the sedimentary microbials can easily attach to pipe surfaces and begin the process of biofilm formation (Percival et al. 2000). Within the potable water system, preventing stagnant pipe water is very difficult to control because it relies entirely on the consumer’s use of the water.
The third method for mitigating the presence of biofilm in potable water systems is through the use of alternative pipe materials. Selection of pipe materials depends on two major factors: resistance to microbial growth and corrosion and service life (Percival et al. 2000). Originally, pipe materials consisted of lead, wood, clay, and stone, but more recently, materials such as copper, cast iron, and plastics are being utilized (Batté et al. 2003; Percival et al. 2000). In a study conducted by Kerr et al. (1998), pipe material had an impact on biofilm growth and formation, with cast iron allowing for more rapid biofilm formation than unplasticized polyvinyl chloride (uPVC) pipes and medium-density polyethylene (MDPE) pipes. An additional study by Seth and Edyvean (2006) further supports the need for alternative pipe materials. In this study, corrosion occurred more quickly on cast iron than on any other material. Corrosion increases surface area, which allows more locations for microbial attachment and biofilm growth. Within the category of alternative pipe materials, materials incorporating nanotechnology are increasingly being explored.
Nanotechnology applications are of interest in various research fields in both the science and the engineering worlds. Nanoparticles, or particles within the size range of 1-100 nanometers, exhibit antibacterial properties, making their use a possible mechanism for decontaminating potable water (Parandhaman et al. 2015; Street et al. 2014). In a study by Parandhaman et al. (2015), a nanomaterial formed with Ag+ nanoparticles was found to successfully prevent biofilm growth 99% of the time with Ag+ nanoparticles causing damage to the bacterial cell membrane, eventually causing the cell to lyse. Nanomaterials owe their effectiveness more to their structure and surface area than to their chemical composition. Sturctures of interest include nanotubes. One specific type of nanotubes applied and investigated in this research project is carbon nanotubes (CNTs).
Lijima first discovered CNTs in 1991 and their popularity in the research field has grown quickly over the past few decades (Upadhyayula et al. 2010). Carbon nanotubes, similar to graphite and diamond, are just another allotrope of carbon; however, due to their unique cylindrical nanostructure, they exhibit unique antibacterial properties (Dong et al. 2012). As signified by their names, single walled carbon nanotubes (SWCNTs) are distinguished by their seamless, tubular shape, formed from a single graphite sheet. In contrast, multi-walled carbon nanotubes (MWCNTs) are formed from multiple graphite sheets, layered to form one seamless cylinder. SWCNTs are significantly smaller in both length and diameter than MWCNTs (Dong et al. 2012; Upadhyayula et al. 2010; Street et al. 2014). Due to strong van der Waals forces between molecules present in SWCNTs that result in clumping, MWCNTs are more likely to be found occurring as single tubes (Dong et al. 2012). Researchers actually anticipated the existence of SWCNTs prior to their discovery, due to the researchers’ inability to prevent clumping (Dresselhaus, 2010).
For CNTs to be effective in any antimicrobial role, contact with the microbes of interest is necessary. The nanoscale dimensions of CNTs aid in cell wall perforation, cell lysis, and eventually cell expulsion of internal components (Upadhyayula et al. 2010). Currently, there are three different general methods of application, including distribution, coating, and embedding in nanocomposites.
Distribution involves the dispersal of CNTs in a suspension, allowing free movement throughout the solvent. However, van der Waals forces decrease the dispersal of the CNTs, causing aggregation, decreasing surface area, and lessening antimicrobial properties (Upadhyayula et al. 2010). Coating
4

involves the creation of a layer of CNTs, spread over the surface of another material, such as concrete. The main limitation of this method of application is the lifespan of the coating layer. The exposure of CNTs to the liquid-solid interface opens the door for surface friction, which may result in a complete or partial loss of the coating layer (Dong et al. 2012). The third method of application is the creation of a nanocomposite, an entirely new hybrid material created from a small amount of CNTs and usually a simple polymer (Dong et al. 2012). This nanocomposite then contains the CNTs embedded within it, providing more structure and stability, while also ensuring dispersal and preventing aggregation.
In this research project, MWCNTs will be embedded in a polyethylene matrix, forming an entirely new compound, Polyethylene Multi-walled Carbon Nanotubes (PE-MWCNTs). MWCNTs were selected for their increased stability. Polyethylene, a polymer with a very simple structure, was selected for its cost effectiveness and easy accessibility. Biofilm will be cultured and grown on this nanocomposite and compared to biofilm grown on copper as a control surface.
3. GOALS AND OBJECTIVES
There are three separate goals for this RET research project. The first goal is to research and understand the impact of biofilms on the quality of potable water. The second goal is to investigate the influence of surface properties of nanomaterials in the prevention of biofilm growth. The third and final goal of this research project is to discover the relationship between research in academia and concepts taught in today’s classroom. To accomplish these three goals, there are three major objectives.
The first objective is to establish and maintain two different biofilm reactors. One reactor will contain PE-MWCNTs coupons and the other reactor will contain copper coupons, serving as the experimental control. The biofilm growth on the two different materials will be monitored for multiple weeks, with data gathered and analyzed every seven days.
The second objective is to use a Laser Scanning Microscope (LSM) to track biofilm growth over the determined time and compare the impact of the two different materials on the growth. Data gathered using the LSM will be quantified using ImageJ software, an open platform for science image analysis, to determine the number of living and dead bacteria in the biofilm.
The third objective is to utilize JMPⓇ statistical analysis software on the data collected to determine the impact of surface properties on bacterial growth. These surface properties include hydrophobic vs. hydrophilic, zeta potential, and surface texture.
4. RESEARCH STUDY DETAILS
4.1. Methodology and Study Scope
4.1.1.Scope of Study
The bacteria Pseudomonas fluorescens was grown in CDC biofilm reactors in a nutrient source that contained primarily carbon, nitrates, and phosphates. A buffer solution was added to maintain the pH at 7.5. To research the effect of nanocomposites on the drinking water distribution systems, coupons of copper, the control, were placed in one biofilm reactor and the second biofilm reactor contained coupons of a nanocomposite material, Polyethylene Multi-Walled Nanocomposites (PE-MWNCTs). The surface characteristics of both materials were tested to determine if the substrates’ hydrophilic or hydrophobic properties, zeta potential, and surface texture impact biofilm growth.
4.1.2. Data Collection
There were two different types of data collected regarding the growth of biofilms. The amount of biofilm growth on the PE-MWCNTs and copper coupons was quantified by looking at the number of living and dead cells for 27 days, using ImageJ and color pixel counting software.
The different surface properties of copper and PE-MWCNTs were studied and data was collected regarding the substrates affinity towards hydrophobic and hydrophilic, zeta potential, and surface texture. Hydrophobic and hydrophilic properties were determined using ImageJ and Drop Analysis - DropSnake,
5

software. The zeta potential was calculated by streaming an electrolyte solution into the SurPASS Surface Electrokinetic Analyzer (Anton Paar, Australia) and surface texture was analyzed using a digital microscope (Keyence VHX-600, Keyence Corporation) and Gwyddion software. The data was analyzed using JMP software, specifically looking at biofilm growth on two different materials, the location of the material (coupon) and surface properties of the material.
4.1.3 Data Analysis
JMP software was used to analyze biofilm growth on two different materials, taking into account the location of the material (coupon) and surface properties of the material. More specifically, analysis of variance (ANOVA) was used to determine whether or not to reject the null hypothesis, that coupon material has no impact on biofilm growth.
4.2 Experimental Design
4.2.1 Biofilm Reactor Setup
The CDC biofilm reactor, manufactured by Biosurface Technologies, Inc (Bozeman, MT, USA) is a one liter container that has an effluent spout that allows wastewater to be removed at the 400 ml mark. It contains a stir rod that is magnetically driven, allowing the nutrient source to circulate within the biofilm reactor.
The reactor contains eight coupon rods that are suspended from the vessels lid. Each coupon rod holds three, 12.7 mm diameter coupons, which allows for a total of 24 sampling surfaces. The coupons used in this research project were copper, as the control and PE-MWCNTs as the experimental surface. Two biofilm reactors were set up for the research, one biofilm reactor contained only copper coupons, and the second contained PE-MWCNTs coupons (Fig. 1).
The top of the biofilm reactor has three inlet tubing holes embedded on the top. A 0.45μm filter was attached to the center hole to prevent bacteria from entering the reactor. Silicon tubing was inserted into the two remaining inlet tops of each reactor to allow the nutrient media to enter the biofilm reactor. Pseudomonas fluorescens bacteria obtained from MircoBiologics, Inc (St.Cloud, MN) was added to each reactor. This strain of nonpathogenic bacteria is commonly found in soil and water. After tightly sealing the biofilm reactor and adding an aluminum foil covering to keep out the light, silicon tubing was then ran through a peristaltic pump and connected the nutrient media (Fig. 2). The peristaltic pump continued to pump at a rate of 1ml/minute for the duration of the experiment, providing nutrients for the biofilm.
6

Fig. 1: Biofilm reactor with copper coupons Fig. 2: Peristaltic pump
4.2.2 Biofilm Reactor Maintenance
A mixed fluid nutrient stock solution was kept at a pH of 7.5 by 0.005M NaHCO 3 buffer solution and fed into the biofilm reactor from two different five gallon carboy containers using a peristaltic pump. The nutrient stock solution in one carboy was mainly NaNO3 and NaH2PO4 (Table 1). The other contained a nutrient carbon source composed mainly of glucose (Fisher Scientific, Inc.). The control and the experimental setup both contained the same nutrients. All experiments were conducted in a room temperature of 25 ̊C.
Table 1: Major components of the nutrient stock solution
7

4.2.3 Biofilm Sampling
One coupon rod was removed for each sampling period, which provided three coupons for each material tested. The coupons were removed from the coupon rod and a blank coupon rod was placed back into the biofilm reactor to maintain a stable environment. Each individual coupon was placed in a 50 ml polypropylene centrifuge test tube with nutrient solution and capped. The test tube was labeled with the type of substrate material and their location on the coupon rod. The coupons used for sampling were transported the LSM and remained in the nutrient solution until they were place into the Live/Dead Viability stain. The coupons were sampled at days 7, 14, 20, and 21. The center and edge of each coupon, (for each coupon rod location; top, center, and bottom) was scanned under the LSM for each substrate material. Prior to being viewed under the confocal laser scanning microscope, each coupon was placed in 0.5 ml of a premixed stain solution made from the Live/Dead® Viability Kit (Life Technologies Corporation) for 15 minutes. The stain solution, is composed of three components, STRYO® 9(green fluorescent), Propidium Iodide (red), and filtered sterilized deionized water. The mixed ratio was 6μL:6μL:2mL, respectively.
4.3 Data Collection
4.3.1 Biofilm Imaging Using Laser Scanning Microscope
A confocal laser scanning microscope, using a 40X lens, was used to scan the biofilm growth on a surface area that covered a 212.21μm X 212.55 μm on the coupon. The laser beam was focused on the center and the edge of each coupon. To find the depth of the biofilm growth, a z-stack scan at slice intervals of 1.6 μm was also done at the center and edge of each coupon.
4.3.2 Biofilm Quantification Using ImageJ Software
The images from the LSM were imported into ImageJ software to quantify biofilm growth. The pixels counting software in ImageJ counts the number of pixels on an image of a specified color. The live cells in the biofilm image scan are green, while the red represents the dead. The number of each type of cell (red and green) was recorded for each coupon on the coupon rod for day 7, 14, 20, and 27. Data
8

collected represents the position of the coupon on the coupon rod, top middle and bottom, and the location tested on the coupon itself (center or edge).
4.3.3 Surface Property Analysis
Hydrophobic vs. Hydrophilic
A drop of nutrient solution was pipetted onto each substrate material (copper and PE-MWCNTs) and a photo was taken from a position perpendicular to the surface of the coupon. The contact angle was calculated using ImageJ software. The photos were downloaded into the Drop Analysis-DropSnake software to calculate the contact angle.
Zeta Potential
The SurPASS Surface Electrokinetic Analyzer (Anton Paar, Australia) was used to measure the surface charge (electrokinetic) potential of copper and PE-MWCNTs coupons. Two coupons of the same substrate were mounted in the adjustable gap cell and the gap height (distance between the two coupons) was adjusted to 100±10μm. A 0.001M KCl electrolyte solution was prepared and streamed through the gap of the two coupons with a pressure of 300 mbar. The flow rate was controlled at 100±50 ml/min and zeta potential, as a function of pH, ranging from pH 6.0 -11.0 with 0.2 increments was measured based on the Helmholtz-Smoluckowski equation (Elimelich et, al 1994). The zeta potential of both copper and PE-MWCNTs coupons were measured, following the same protocol.
Surface Texture
A digital microscope (Keyence VHX-600, Keyence Corporation) was used to take images of both copper and the PE-MWCNTs surfaces to determine surface texture. The magnification was set at 50X, 100X, and 200X and observed at the center and edge of the coupons. The roughness of the material was calculated at the center and edge of both materials using Gwyddion Software.
5. RESEARCH RESULTS
5.1 Impact of Material on Biofilm Growth
In figure 3, the live cell count per observed area versus time was graphed for both copper and PE-MWCNTs. At the first data collection point of 7 days, more significant biofilm growth had occurred, and continued to occur, on the PE-MWCNTs than on the copper coupons.
Fig. 3. Initial growth of biofilm on different materials surfaces, copper and PE-MWCNTs nanocomposites: live cells count of P. fluorescens biofilm using a 40X lens scanned by LSM covering a 212.21μm X 212.55 μm surface area.
In figure 4, the average thickness of biofilm growth versus time was graphed for both copper and PE-MWCNTs. Over the course of the entire study, the biofilm thickness for the PE-MWCNTs was always greater than the thickness for copper. More specifically, the biofilm thickness for the PE-MWCNTs was
9

roughly double the thickness of the biofilm on copper for the entire 27 days. Taking into account the data displayed in both figure 3 and figure 4, the results indicate that PE-MWCNTs had more biofilm growth over the time observed. This increase in biofilm growth cannot be explicitly connected to the presence of CNTs in the PE-MWCNTs coupons, due to no currently available data for pure polyethylene coupons to use as a comparison.
Fig. 4. Thickness of biofilm growth on different material surfaces, copper and PE-MWCNTs nanocomposites: average live cell thickness in μm of P. fluorescens biofilm using a 40X lens scanned by LSM covering a 212.21μm X 212.55 μm surface area.
5.2 Impact of Coupon Position on Biofilm Growth
Figure 5 displays live cell count per observed area on the copper coupon verses time for different locations in the biofilm reactor. These locations include top coupon, middle coupon, and bottom coupon. After 14 days, significant greater biofilm growth occurred on the bottom copper coupon, slightly greater on the middle coupon, and the least amount on the top coupon. One possible explanation for the increase in biofilm growth as coupon depth in biofilm reactor increases is the effect of gravity on the microorganisms that form the biofilm. When the biofilm reactors were both inoculated with the microorganism pellets, gravity pulled the pellets to the bottom of the biofilm reactors, where the pellets began to slowly dissolve and diffuse to other parts of the reactor. It is possible that a greater concentration of microorganisms may have adhered and begun to produce EPS on the lower coupon surfaces than on the higher coupon surfaces. An alternative explanation for this growth pattern is that the biofilm that matures on the top and middle coupons may slough off and settle to the bottom of the reactor. Once the biofilm reaches the reactor bottom, it may reattach to the bottom coupons and begin to grow a new colony of biofilm. Following the gravity reference from above, there is a possibility that the concentration of nutrients and glucose could be greater toward the bottom of the reactor as well.
Fig. 5 Initial biofilm growth on copper surfaces at different locations in the reactor: live cells count of P. fluorescens biofilm using a 40X lens scanned by LSM covering a 212.21μm X 212.55 μm surface area.
10

5.3 Impact of Surface Properties on Biofilm Growth
The criteria used to determine if a substrate is hydrophobic or hydrophilic is the degree of the contact angle. A contact degree angle greater than 90° indicates a hydrophobic compound and an angle with less than 90° is hydrophilic. The contact angle for copper was calculated to 103°. The contact angle for PE-MWCNTs was 95.9 °, giving both a hydrophobic value, as shown in Table 2. There was a difference of surface roughness for copper and PE-MWCNTs, Table 2, when values were calculated at the center and edge of each coupon. Copper, tested at the center, was 101.0 μm and 115.7μm at the edge. The PE-MWCNTs nanocomposite was 33.8 μm at the center and 68.6 μm at the edge. The surface texture impacts biofilm growth in that the smoother the surface, the harder it is for biofilm to attach. Fig. 8, taken with a digital microscope, illustrates the difference in surface roughness at 100X at the edge of copper and PE-MWCNTs. When the surface texture is increased, there is more surface area for cells to adhere to.
The Zeta Potential values for copper and PE-MWCNTs, shown in table 2, show that both have negative values. However, the zeta potential of copper was -3.04 mV, compared to -43.10mV for PE-MWCNTs. The zeta potential values determine how negative or positive a surface is and predicts how the surface will interact with the substance it is coming in contact with. A surface with a positive zeta potential will attract a negative substance. Biofilm and the PE-MWCNTs both have a negative zeta potential charge, which should decreases the likelihood of biofilm growth when compared to two substances that have a difference in charges.
Table 2: Surface properties of Copper and PE-MWCNTs nanocomposites. The degree of contact angle in the table shows both copper and PE-MWNCTs as hydrophobic. Zeta potential, values (mV) for both copper and PE-MWCNTs nanocomposites show a difference in negativity values. Surface roughness of copper and the PE-MWNCTs calculated in μm at edge and center of coupon. Copper in center and on the edge have greater surface roughness.
Surface Properties of Copper and PE-MWNCTs Nanocomposites
Test Copper PE-MWNCTs
Contact Angle 103.20° 95.9°
Zeta Potential -3.04 mV -43.10 mV
Surface Roughness 101.0 μm (Center)115.7 μm (Edge)
33.8 μm (Center)68.6 μm (Edge)
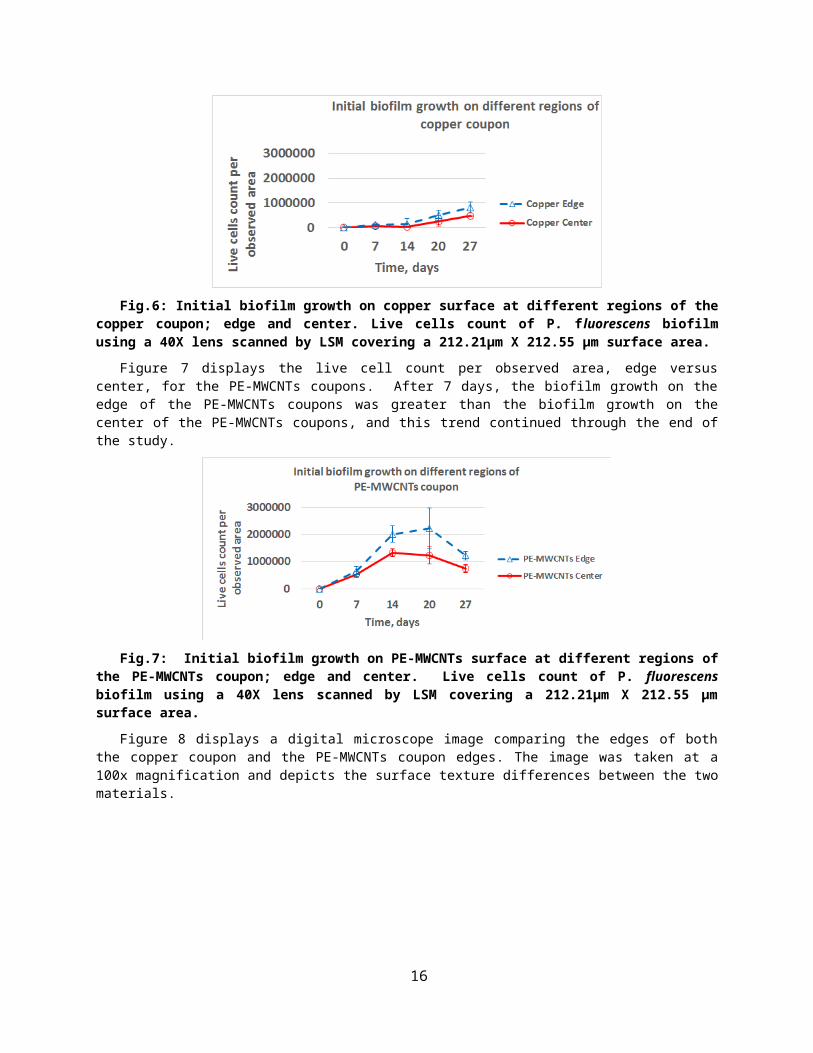
Figure 6 displays the live cell count per observed area, edge versus center, for the copper coupon. After 14 days, the growth rate of biofilm on the edge of the copper coupons increased more than the growth rate of the biofilm on the center of the copper coupons.
11

Fig.6: Initial biofilm growth on copper surface at different regions of the copper coupon; edge and center. Live cells count of P. fluorescens biofilm using a 40X lens scanned by LSM covering a 212.21μm X 212.55 μm surface area.
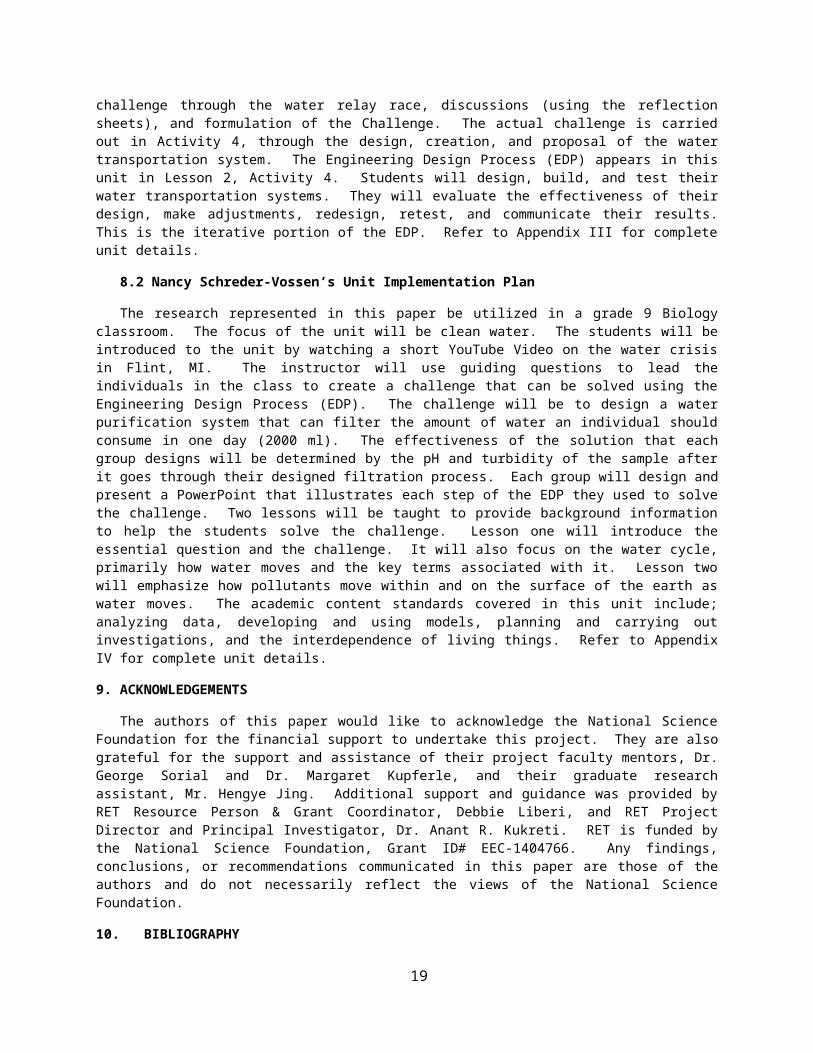
Figure 7 displays the live cell count per observed area, edge versus center, for the PE-MWCNTs coupons. After 7 days, the biofilm growth on the edge of the PE-MWCNTs coupons was greater than the biofilm growth on the center of the PE-MWCNTs coupons, and this trend continued through the end of the study.
Fig.7: Initial biofilm growth on PE-MWCNTs surface at different regions of the PE-MWCNTs coupon; edge and center. Live cells count of P. fluorescens biofilm using a 40X lens scanned by LSM covering a 212.21μm X 212.55 μm surface area.
Figure 8 displays a digital microscope image comparing the edges of both the copper coupon and the PE-MWCNTs coupon edges. The image was taken at a 100x magnification and depicts the surface texture differences between the two materials.
Fig. 8: Digital microscope image; edge comparison copper and PE-MWCNTs 100X
The surface roughness was greater for copper than for the PE-MWCNTs, both in the center of the coupon and at the edges. Although the biofilm growth for PE-MWCNTs was greater, indicating a possible connection between the increased biofilm growth and the smoother surface, other surface properties of the two materials may have influenced the biofilm growth as well. When comparing the surface roughness values for the center and edge on the same coupon, both materials demonstrated a greater surface roughness value for the coupon edge than for the coupon center. In relation to the biofilm growth for both locations on each of the two materials, this data suggests that as surface roughness increases, biofilm growth also increases. This final point provides more conclusive evidence to support a connection between increased surface roughness and increased biofilm growth.
12

6. CONCLUSIONS
The nanocomposites, in particular PE-MWCNTs, did not prevent biofilm growth compared to the copper samples. Biofilm growth initially spiked on the PE-MWCNTs coupons, then the growth rate began to slow. In comparison, the copper coupons initially caused the microbial cells of the biofilm to grow at a slower rate, then gradually increase with time. Over the course of this study, biofilm thickness was greater on the PE-MWCNTs coupons than on the copper coupons. Coupon position in the reactor demonstrated a slight increase in live cells per observed area for the bottom coupons in comparison with the top coupons for both materials. On average, within the same coupon, surface roughness values were greater for the edge versus the center of both coupon materials. Biofilm growth was also greater on the coupon edges, signifying a connection between surface roughness and increased biofilm growth. The data signifies that PE-MWCNTs are not a potential alternative pipe material for long term prevention of biofilm growth, in comparison with copper. The beginning trends of the biofilm growth on the two different material coupons provide a foundation of data that needs to be expanded with future research.
7. RECOMMENDATIONS
Thoughtful consideration should be given to biofilm growth and monitoring studies on copper and PE-MWCNTs that span for greater length trials. Potable water pipes are utilized for decades and future research needs to examine the effects of both materials on biofilm growth over longer, more realistic, time spans. The 27 day trial from this research paper provided bench scale data that signifies a need for additional data gathered from longer trials of identical materials and methods.
The topics addressed in this research report can be further extended for more real-life applicable results through the growth and monitoring of biofilm in copper and PE-MWCNTs pipe samples, rather than in biofilm reactors. Furthermore, potable water should be used instead of DI water to more accurately simulate biofilm growth in the potable water distribution system.
The conclusions gathered from this research demonstrate increased biofilm growth on PE-MWCNTs, but they are not able to determine if the increase in growth is a result of the CNTs or the polyethylene when grown as a composite and compared with copper. Additional experimentation needs to occur comparing polyethylene and PE-MWCNTs to determine if the increase in biofilm growth is a result of the polyethylene or the CNTs. One hypothesis is that the CNTs are killing the biofilm, but not quickly enough to counteract the polyethylene’s increase in biofilm growth. This experimentation would also eliminate additional variables (zeta potential differences, hydrophobic/ hydrophilic, etc).
8. CLASSROOM IMPLEMENTATION PLAN
8.1 Amy Parker’s Unit Implementation Plan
This research will be implemented in Amy Parker’s high school environmental science classroom, in the unit entitled “How Does Your Garden Grow?” addressing the standards relating to potable water, agriculture, and sustainable food production. This unit will last roughly 12 days and will consist of 4 activities, with Activity 4 being the challenge. The three activities leading up to the challenge scaffold the students’ learning, preparing the students to successfully complete the challenge. Activity 1 will begin with a water relay race as a “hook,” then lead to the generation of the essential questions, guiding questions, and ultimately the creation of the Challenge, the design and creation of a water transportation system to water the school community garden. In Activity 2, students will explore different plant / agricultural needs, including but not limited to, soil saturation, water needs, and rainfall. In Activity 3, students will begin to investigate existing models / practices for watering currently being used in other school and community gardens. Students will gather their data, analyze, and draw conclusions to assist in their designs. In Activity 4, using their gathered data from the previous activities in this unit, students will design, build a model, and create a proposal for a water transportation system they would like to see implemented, complete with justification. Challenge Based Learning (CBL) is evident in this unit, because the students begin to flesh out the challenge through the water relay race, discussions (using the reflection sheets), and formulation of the Challenge. The actual challenge is carried out in Activity 4, through the design, creation, and proposal of the water transportation system. The Engineering Design Process (EDP) appears in this unit in Lesson 2, Activity 4. Students will design, build, and test their water
13

transportation systems. They will evaluate the effectiveness of their design, make adjustments, redesign, retest, and communicate their results. This is the iterative portion of the EDP. Refer to Appendix III for complete unit details.
8.2 Nancy Schreder-Vossen’s Unit Implementation Plan
The research represented in this paper be utilized in a grade 9 Biology classroom. The focus of the unit will be clean water. The students will be introduced to the unit by watching a short YouTube Video on the water crisis in Flint, MI. The instructor will use guiding questions to lead the individuals in the class to create a challenge that can be solved using the Engineering Design Process (EDP). The challenge will be to design a water purification system that can filter the amount of water an individual should consume in one day (2000 ml). The effectiveness of the solution that each group designs will be determined by the pH and turbidity of the sample after it goes through their designed filtration process. Each group will design and present a PowerPoint that illustrates each step of the EDP they used to solve the challenge. Two lessons will be taught to provide background information to help the students solve the challenge. Lesson one will introduce the essential question and the challenge. It will also focus on the water cycle, primarily how water moves and the key terms associated with it. Lesson two will emphasize how pollutants move within and on the surface of the earth as water moves. The academic content standards covered in this unit include; analyzing data, developing and using models, planning and carrying out investigations, and the interdependence of living things. Refer to Appendix IV for complete unit details.
9. ACKNOWLEDGEMENTS
The authors of this paper would like to acknowledge the National Science Foundation for the financial support to undertake this project. They are also grateful for the support and assistance of their project faculty mentors, Dr. George Sorial and Dr. Margaret Kupferle, and their graduate research assistant, Mr. Hengye Jing. Additional support and guidance was provided by RET Resource Person & Grant Coordinator, Debbie Liberi, and RET Project Director and Principal Investigator, Dr. Anant R. Kukreti. RET is funded by the National Science Foundation, Grant ID# EEC-1404766. Any findings, conclusions, or recommendations communicated in this paper are those of the authors and do not necessarily reflect the views of the National Science Foundation.
10. BIBLIOGRAPHY
Abe, Y., Skali-Lami, S., Block, J., and Francius, G. (2012). "Cohesiveness and hydrodynamic properties of young drinking water biofilms." Water Res., 46(4), 1155-1166.
Batté, M., Appenzeller, B., Grandjean, D., Fass, S., Gauthier, V., Jorand, F., Mathieu, L., Boualam, M., Saby, S., and Block, J. (2003). "Biofilms in Drinking Water Distribution Systems." Reviews in Environmental Science and Biotechnology, 2(2-4), 147-168.
Cantor, A. F. (2003). "Effect of chlorine on corrosion in drinking water systems." Journal - American Water Works Association, 95(5), 112; 112-122; 122
Chen, B., and Li, Y. (2002). "Special Issue on Applied and Computational Mathematics: Selected Papers of the Third PanAmerican Workshop Simulation of thick biofilm growth at the microscale." Applied Numerical Mathematics, 40(1), 261-271.
Dong, X., Tang, Y., Lilly, M., Aferchich, K., and Yang, L. (2012). "Antimicrobial Effects Of Carbon Nanotubes." Nano LIFE, 2(4), 1793-9844.
Dresselhaus, M. S. (2010). "NT10: Recent advances in carbon nanotube science and applications." ACS Nano, 4(8), 4344-4349.
Elimelech, E., Chen, W.H., Waypa, J.J., 1994. Measuring the zeta (electrokinetic) potential of reverse osmosis membrane by streaming a potential analyzer. Desalination 95, 275-276.
Flemming, H., and Wingender, J. (2010). "The biofilm matrix." Nature Reviews Microbiology, 8(9), 623-633.
14

Frimmel, F., and Niessner, R. (2010). Nanoparticles in the Water Cycle. Springer Berlin Heidelberg, Heidelberg, Germany.
Kerr, C. J., Osborn, K. S., Robson, G. D., and Handley, P. S. (1999). "The relationship between pipe material and biofilm formation in a laboratory model system." Blackwell Science Ltd., Osney Mead Oxford OX2 0EL UK, [URL:http://www.blacksci.co.uk], 29S-38S.
Kjelleberg, S., and Givskov, M. (2007). The biofilm mode of life: mechanisms and adaptations. Horizon Bioscience, Wymondham.
Kostakioti, M., Kostakioti, M., Hadjifrangiskou, M., and Hultgren, S. (2004). "Bacterial Biofilms: Development, Dispersal, and Therapeutic Strategies in the Dawn of the Postantibiotic Era." Cold Spring Harbor Perspectives in Medicine, 3(4), a010306; a010306-a010306; a010306.
Laspidou, C. S., Spyrou, L. A., Aravas, N., and Rittmann, B. E. (2014). "Material modeling of biofilm mechanical properties." Math.Biosci., 251 11-15.
Mathieu, L., Bertrand, I., Abe, Y., Angel, E., Block, J. C., Skali-Lami, S., and Francius, G. (2014). "Drinking water biofilm cohesiveness changes under chlorination or hydrodynamic stress." Water Res., 55 175-184.
Parandhaman, T., Das, A., Ramalingam, B., Samanta, D., Sastry, T. P., Mandal, A. B., and Das, S. K. (2015). "Antimicrobial behavior of biosynthesized silica–silver nanocomposite for water disinfection: A mechanistic perspective." J.Hazard.Mater., 290 117-126.
Percival, S. L., Walker, J. T., and Hunter, P. R. (2000). Microbiological aspects of biofilms and drinking water. CRC Press, Boca Raton.
Renner, L. D., and Weibel, D. B. (2011). "Physicochemical regulation of biofilm formation." MRS Bull, 36(5), 347-355.
Schmeisser, C., Jaeger, K., Streit, W. R., Stöckigt, C., Raasch, C., Wingender, J., Timmis, K. N., Wenderoth, D., Flemming, H.., Liesegang, H., and Schmitz, R. (2003). "Metagenome Survey of Biofilms in Drinking-Water Networks." Appl.Environ.Microbiol., 69(12), 7298-7309.
Seth, A. D., and Edyvean, R. G. J. (2006). "The function of sulfate-reducing bacteria in corrosion of potable water mains." Int.Biodeterior.Biodegrad., 58(3–4), 108-111.
Street, A., Sustich, R., Duncan, J., and Savage, N. (2014). Nanotechnology applications for clean water: solutions for improving water quality. William Andrew, Oxford.
Thuptimdang, P., Limpiyakorn, T., McEvoy, J., Prüß, B. M., and Khan, E. (2015). "Effect of silver nanoparticles on Pseudomonas putida biofilms at different stages of maturity." J.Hazard.Mater., 290 127-133.
Upadhyayula, V. K. K., and Gadhamshetty, V. (2010). "Appreciating the role of carbon nanotube composites in preventing biofouling and promoting biofilms on material surfaces in environmental engineering: A review." Biotechnol.Adv., 28(6), 802-816.
Wu, H., Zhang, J., Mi, Z., Xie, S., Chen, C., and Zhang, X. (2015). "Biofilm bacterial communities in urban drinking water distribution systems transporting waters with different purification strategies." Appl.Microbiol.Biotechnol., 99(4), 1947-1955.
Zheng, M., He, C., He, Q. (12). "Fate of free chlorine in drinking water during distribution in premise plumbing." Ecotoxicology (London), 24(10), 2151; 2151-2155; 2155.
15
11. APPENDIX I: NOMENCLATURE USED
M = molarity (moles of solute per liter of solution)
µm = micrometer
16

12. APPENDIX II: RESEARCH SCHEDULE
17

13. APPENDIX III: TEACHER UNIT TEMPLATE: AMY PARKER
Name: Amy Parker Contact Info: [email protected] Date: 07/22/16
Unit Number and Title: Unit 1: How Does Your Garden Grow?
Grade Level: 11-12
Total Estimated Duration of Entire Unit: 12 Days
Part 1: Designing the Unit
1. Unit Academic Standards (Identify which standards: NGSS, OLS and/or CCSS. Cut and paste from NGSS, OLS and/or CCSS and be sure to include letter and/or number identifiers.):
Ohio Learning Standards
Scientific Inquiry and Application
o Identify question and concepts that guide scientific investigations;
o Design and conduct scientific investigations;
o Use technology and mathematics to improve investigations and communications;
o Formulate and revise explanations and models using logic and evidence (critical thinking);
o Recognize and analyze explanations and models; and
o Communicate and support a scientific argument.
Global Environmental Problems and Issues
o Potable water quality, use and availability
o Sustainability
o Food production and availability
Earth’s Resources
o Water and water pollution
o Potable water and water quality
o Point source and non-point source contamination
Soil and Land
o Mass wasting and erosion
o Land use and land management (including food production, agriculture and zoning)
18
Subject Area: Environmental Science
2. Unit Summary
The Big Idea (including global relevance):
Water transportation / distribution
Global Relevance:
o The need for irrigation in other countries / parts of the United States.
o Water transportation for drinking and cooking in underdeveloped countries.
o Flooding is an issue in some parts of the world, while drought is a harsh reality in others.
o Water use: Industrial vs. agriculture
The (anticipated) Essential Questions: List 3 or more questions your students are likely to generate on their own. (Highlight in yellow the one selected to define the Challenge):
1. How do we efficiently and sustainably transport water to where it is needed for agricultural purposes?
2. What are some reasons that water needs to be transported from one location to another?
3. Where does water come from and where does it go (more specifically, OUR water)?
4. How is the efficiency of water transportation different in first world vs third world countries?
5. In what ways can we make water transportation more efficient?
6. Why is the efficiency of water transportation different in first world vs third world countries?
7. Why do some countries have cleaner water to transport than others?
8. How can we ensure equal access to clean water for everyone?
3. Unit Context
Justification for Selection of Content– Check all that apply:
☐ Students previously scored poorly on standardized tests, end-of term test or any other test given in the school or district on this content.
☐ Misconceptions regarding this content are prevalent.
X Content is suited well for teaching via CBL and EDP pedagogies.
X The selected content follows the pacing guide for when this content is scheduled to be taught during the school year. (Unit 1 covers atomic structure because it is taught in October when I should be conducting my first unit.)
X Other reason(s): Traditionally, the students taking this course struggle academically, lack motivation / focus, and learn much better kinesthetically. Through using the EDP and CBL, the students in this course will hopefully gain motivation and see a clear connection between what they are learning in the classroom and what is happening in the world around them. ________ ___________________________________________________________________________
19

The Hook: (Describe in a few sentences how you will use a “hook” to introduce the Big Idea in a compelling way that draws students into the topic.)
For the Hook, the students will undergo a Mini-challenge. Students will have a race in teams to get as much water from one end of the parking lot to the other in as short a time as possible. Each team will have two buckets (one filled with water and one empty) and different supplies to use (small cups, spoons, forks, etc.). Each group will also have the name of a country on the bottom of the bucket (both first world and third world), and the water transportation “tools” will relate to the level of water distribution efficiency of that country. Also, the “quality” of the water will relate to the country’s water quality. A reflective sheet after the race will help to hash out the “Big Idea,” essential questions, challenge, etc.). The class will compare and discuss the time it took and the amount of water lost in the process, aka, efficiency.
The Challenge and Constraints:
Challenge: Design and build a way to transport enough water to water the new community garden to ensure plant growth.
Constraints:
Designing for the June 1 – July 1 interval of time
Time
Money (each group will have a specific amount of “funds” in their account and they will have to budget and “buy” supplies from the teacher’s store to use to build their system).
Possible water sources (based on location in relation to the gardens).
Amount of water needed to water the entire garden area.
X Product or ☐ Process (Check one)
Description of Challenge (Either Product or Process is clearly explained below):
List the Constraints Applied
Design and build a way to transport enough water to water the new community garden to ensure plant growth.
The system designed and built by the students will be tested on a “model” of the garden, constructed by the teacher.
Students will test, evaluate, and redesign their systems to improve efficiency.
A final PowerPoint will be created for presentation to the PTA Garden Committee and / or School Board of their proposed solution for a watering system for the community garden.
Designing for the June 1 – July 1 interval of time
Time
Money (each group will have a specific amount of “funds” in their account and they will have to budget and “buy” supplies from the teacher’s store to use to build their system).
Possible water sources (based on location in relation to the gardens).
Amount of water needed to water the entire garden area.
20
Teacher’s Anticipated Guiding Questions (that apply to the Challenge and may change with student input.):
What is the water demand of the community garden space?
What is the average rainfall for the designated time period?
What water resources are located nearby and how can they be utilized as sources of water?
What properties of water allow / prevent the water’s transport?
Where does our local water come from?
How much do different sources of water cost?
What are the components of transporting water / what is needed?
What water transportation systems / designs are currently being used by other schools / communities?
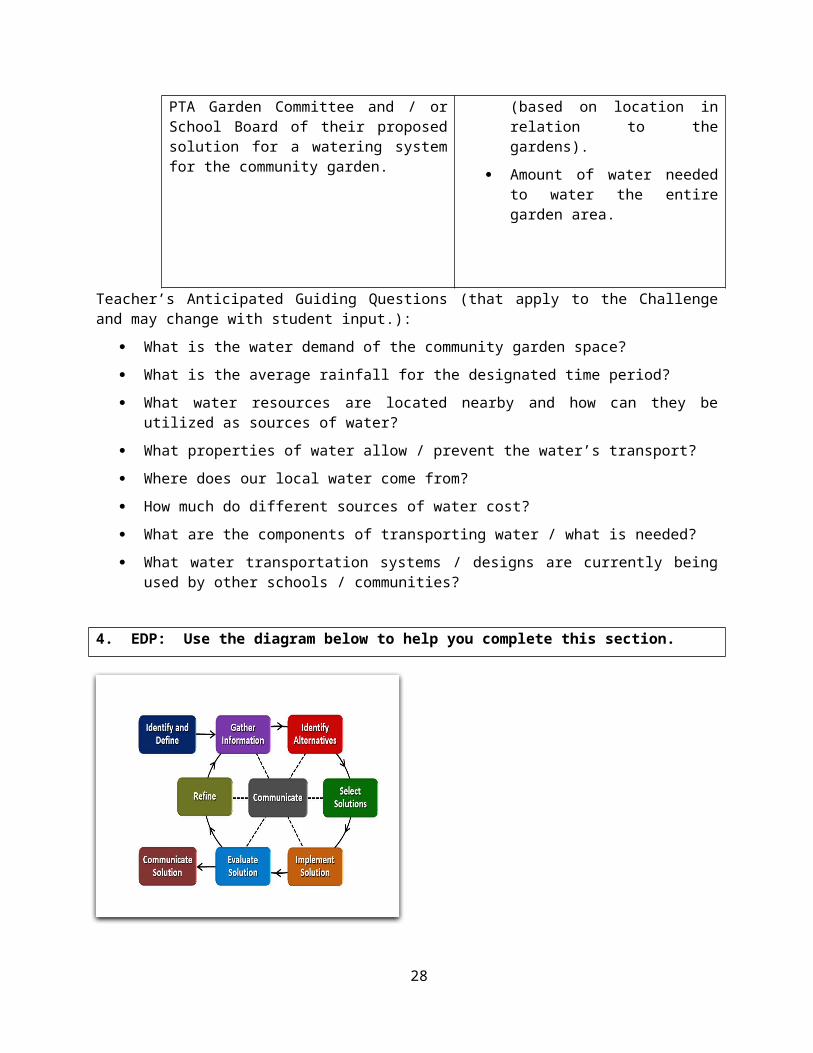
4. EDP: Use the diagram below to help you complete this section.
How will students test or implement the solution? What is the evidence that the solution worked? Describe how the iterative process from the EDP applies to your Challenge.
Testing / Implementing Solution:
The system designed and built by the students will be tested on a “model” of the garden, constructed by the teacher. Students will test, evaluate, and redesign their systems to improve efficiency.
A final PowerPoint will be created for presentation to the PTA Garden Committee and / or School Board of their proposed solution for a watering system for the community garden.
Evidence the Solution Worked:
Students will build their final model of a water transportation system for the school community garden. Students will then implement their system on the teacher-created model that represents the school garden. The students’ solution will be deemed successful if the provided water is transported to the plants in the model and the desired soil saturation is reached.
Iterative Portion:
21

The iterative portion is the continual testing, evaluating, and redesign of the water transportation system throughout the Challenge.
Students will also present their PowerPoint presentations of their water transportation designs to the class for peer feedback and make alterations before presenting their ideas to the school board and / or the Parent Teacher Association (PTA) Community Garden Board.
How will students present or defend the solution? Describe if any formal training or resource guides will be provided to the students for best practices (e.g., poster, flyer, video, advertisement, etc.) used to present work.
Students will present their proposals to their peers, receive peer feedback, make adjustments to their presentations, and add any final touches to their designs. The students will then present their final plans (via PowerPoint) to the school board and / or the Parent Teacher Association (PTA) Community Garden Board.
Students will be presented with formal training on how to make a good PowerPoint presentation using Google Slides.
What academic content is being taught through this Challenge?
Through this challenge, students will apply their learning from the first quarter of school to design a watering system for the school gardens. Students will need to understand the properties of water that allow it to flow, the need of water for agriculture, and sustainability in relation to food production. Students will also need to explore land use and both soil and water sources of contamination. Students will need to take into account the possibility of pollution negatively impacting the growth of produce in the gardens, depending on the source of their water.
Assessment and EDP:
Using the diagram above, identify any places in the EDP where assessments should take place, as it applies to your Challenge. Describe below what kinds of assessment are most appropriate.
What EDP Processes are ideal for conducting an Assessment? (List ones that apply.)
List the type of Assessment (Rubric, Diagram, Checklist, Model, Q/A etc.) Check box to indicate whether it is formative or summative.
_Gather Information ____
_Identify Alternatives____
_Select Solution _______
_Implement Solution ____
_Communicate Solution___
__Graphic Organizer of existing systems (community and schools)_______________________ X formative ☐ summative
__Create one design / proposal per person, then as a group, list 3 pros and cons for each. _____________ X formative ☐ summative
_Select one prototype to construct, make iterations and record changes _________________________ X formative ☐ summative
_Test final model _______________ X formative ☐ summative
_Proposal Presentation (Rubric)___ ☐ formative X summative
22

Check below which characteristic(s) of this Challenge will be incorporated in its implementation using EDP. (Check all that apply.)
X Has clear constraints that limit the solutions
X Will produce more than one possible solution that works
X Includes the ability to refine or optimize solutions
X Assesses science or math content
X Includes Math applications
☐ Involves use of graphs
X Requires analysis of data
X Includes student led communication of findings
5. ACS (Real world applications; career connections; societal impact):
Place an X on the continuum to indicate where this Challenge belongs in the context of real world applications:
Abstract or Loosely Applies to the Real World
|-----------------------------------|----------------------------------X|Strongly Applies to the Real World
Provide a brief rationale for where you placed the X:_This Challenge has a solid real-world connection. The students will be designing a water transportation system for the garden behind their school, modifying the design, and presenting their proposals to the PTA and / or the school board. The students could also potentially share their ideas with other school districts considering implementing school community gardens. __________________________________________________________________
___________________________________________________________________________________
What activities in this Unit apply to real world context? __Activities 2-4 in this unit apply to a real-world context. Activity 2 involves the students gathering data through research and experimentation about plant / agriculture needs in their area. Activity 3 involves the students researching methods and systems used by other schools / communities to bring water to their gardens. Activity 4, the Challenge, involves applying their gathered knowledge to design a water transportation system that can actually be used in their local school garden. ______________________________________________________________
Place an X on the continuum to indicate where this Challenge belongs in the context of societal impact:
Shows Little or No Societal Impact |---------------------------------|-----------------------------------X-| Strongly Shows
Societal Impact
Provide a brief rationale for where you placed the X: _On a small scale, this challenge relates to the local community because the designs and models built could actually be implemented to provide water for the school’s community garden and increase the growth of produce. This produce would then serve as an additional resource of healthy food. School-based community gardens are a growing topic and the students could also present their proposed solutions to surrounding schools with community gardens. On
23

a larger scale, water is not easily available in all locations for both consumption and for agriculture, so water transportation is a very important topic. ________________________________________
___________________________________________________________________________________
What activities in this Unit apply to societal impact? _Activity 4 has the greatest connection to societal impact because the students are working to design a sustainable way to water / provide water for the local school community garden. Rather than using the school’s water as the source for garden watering, the students must select the source of t heir water and then design a system / method for transporting that water from the source to the garden beds. By not relying on the school’s water as the water source, the students would help the school district save a large amount of money each year. _______________
Careers: What careers will you introduce (and how) to the students that are related to the Challenge? (Examples: career research assignment, guest speakers, fieldtrips, Skype with a professional, etc.)
A guest speaker will be visiting from Groundworks Cincinnati (http://groundworkcincinnati.org/) prior to beginning this unit to discuss the local watershed with the students and assist them with water testing in the local stream. The guest speaker will also discuss his job, dealing with water, to the students. The guest speaker will return for a second water testing with the students in the spring following the unit implementation. The students will have an open discussion with him about water-related jobs, such as a water resource project engineer, a civil engineer designer for water resources, and a wastewater engineer, having then completed the challenge.
6. Misconceptions:
Water comes from the tap (no concept or understanding of what goes into getting water to the tap).
Water is free.
The world is running out of water.
If water looks clean, it must be clean.
If water has access to a pipe, then it will flow, even if it is uphill (no understanding of water pressure and its role in water transportation).
7. Unit Lessons and Activities: (Provide a tentative timeline with a breakdown for Lessons 1 and 2. Provide the Lesson #’s and Activity #’s for when the Challenge Based Learning (CBL) and Engineering Design Process (EDP) are embedded in the unit.)
Lesson 1: To Grow or Not to Grow….That is the Question: 5 Days
o In Lesson 1, students begin to explore water transportation and focus on the importance of transporting water for agricultural purposes. Activity 1 will lead to the generation of the essential questions, guiding questions, and ultimately the creation of the Challenge, the design and creation of a water transportation system to water the school community garden. In Activity 2, students will explore different plant / agricultural needs, including but not limited to, soil saturation, water needs, and rainfall. Students will use this knowledge to assist in the design and building of their systems..
Activity 1: Water Transportation: Mini-Hook / Relay Race – 2 Days
24

Activity 2: Plant / Agricultural Needs (soil saturation, water needs, rainfall, build rainfall collector, rain gages) – 3 Days
Lesson 2: Manager of the Water: 7 Days
o In Lesson 2, students will begin to investigate existing models / practices for watering currently being used in other school and community gardens. Students will gather their data, analyze, and draw conclusions to assist in their designs. In Activity 4, using their gathered data from the previous activities in this unit, students will design, build a model, and create a proposal for a water transportation system they would like to see implemented, complete with justification.
Activity 3: Research other school community gardens and their systems (graphic organizer???) – 2 Days
Activity 4: Water Transportation Design – 5 Days
Evidence of CBL: CBL begins in the unit in Lesson 1, Activity 1, because the students begin to flesh out the challenge through the mini-hook water race, discussions (using the reflection sheets), and formulation of the Challenge. The actual challenge is carried out in Lesson 2, Activity 4, through the design, creation, and proposal of the water transportation system.
Evidence of EDP: EDP appears in the unit in Lesson 2, Activity 4. Students will design, build, and test their water transportation systems. They will evaluate the effectiveness of their design, make adjustments, redesign, and retest. When they have a “final” design, they will create a Power Point presentation of their proposal. There will be a checkpoint where students will share their progress thus far with another group (they will use this as a “dress rehearsal” for their final presentation) for feedback. I will also observe these presentations and use it as a formative assessment. The groups will then use the feedback they receive to make modifications to improve their design and / or the clarity of their presentation. This is the iterative portion of the EDP.
8. Keywords:
Environmental science
High school
Water transportation
Garden
Sustainability
Food production
Agriculture
Soil saturation
9. Additional Resources:
http://groundworkcincinnati.org/
25

10. Pre-Unit and Post-Unit Assessment Instruments:
Pre-Unit Assessment
Post-Unit Assessment
11. Poster 12. Video (Link here.)
If you are a science teacher, check the boxes below that apply:
Next Generation Science Standards (NGSS)
Science and Engineering Practices (Check all that apply)
Crosscutting Concepts (Check all that apply)
X Asking questions (for science) and defining problems (for engineering)
☐ Patterns
X Developing and using models ☐ Cause and effect
☐ Planning and carrying out investigations X Scale, proportion, and quantity
☐ Analyzing and interpreting data ☐ Systems and system models
X Using mathematics and computational thinking X Energy and matter: Flows, cycles, and conservation
X Constructing explanations (for science) and designing solutions (for engineering)
☐ Structure and function.
☐ Engaging in argument from evidence X Stability and change.
X Obtaining, evaluating, and communicating information
If you are a science teacher, check the boxes below that apply:
Ohio’s Learning Standards for Science (OLS)
Expectations for Learning - Cognitive Demands (Check all that apply)
X Designing Technological/Engineering Solutions Using Science concepts (T)
X Demonstrating Science Knowledge (D)
X Interpreting and Communicating Science Concepts (C)
X Recalling Accurate Science (R)
If you are a math teacher, check the boxes below that apply:
26

Ohio’s Learning Standards for Math (OLS) or
Common Core State Standards -- Mathematics (CCSS)
Standards for Mathematical Practice (Check all that apply)
☐ Make sense of problems and persevere in solving them
☐ Use appropriate tools strategically
☐ Reason abstractly and quantitatively ☐ Attend to precision
☐ Construct viable arguments and critique the reasoning of others
☐ Look for and make use of structure
☐ Model with mathematics ☐ Look for and express regularity in repeated reasoning
Part 2: Post Implementation- Reflection on the UnitResults: Evidence of Growth in Student Learning - After teaching the Unit, present the
evidence below that growth in learning was measured through one the instruments identified above. Show results of assessment data that prove growth in learning occurred.
Please include:
Any documents used to collect and organize post unit evaluation data. (charts, graphs and /or tables etc.)
An analysis of data used to measure growth in student learning providing evidence that student learning occurred. (Sentence or paragraph form.)
Other forms of assessment that demonstrate evidence of learning. Anecdotal information from student feedback.
Reflection: Reflect upon the successes and shortcomings of the unit. Refer to the questions posed on the Unit Template Instruction sheet. Describe how the actual Engineering Design Process was actually used in the implementation of the Unit.
Name: Amy Parker Contact Info: [email protected] Date: 07/22/16
Lesson Title : Lesson 1: To Grow or Not to Grow…That is the Question
Unit #:
1
Lesson #:
1
Activity #:
1Activity Title: Activity 1: Water Transportation: Mini-Hook / Relay Race
27
Estimated Lesson Duration: 5 Class periods
Estimated Activity Duration: 2 Class periods
Setting: Classroom and parking lot (or large outdoor area)
Activity Objectives:
1) Students will draw conclusions and comparisons from the “hook” / mini-race relating to water transportation differences in various countries.
2) Provided with the Big Idea, Water Transportation / Distribution, students will generate an Essential Question.
3) After producing an Essential Question (as a class), students will actively participate (individually, in groups, and as a whole class) in the creation of the Challenge.
Activity Guiding Questions:
1) Where does our local water come from?
2) What are the components of transporting water / what is needed?
3) Taking into account the four different countries associated with the water race activity, what conclusions can be drawn relating to different water transportation systems?
4) In what ways are the water transportation systems in developed countries different from those in developing countries?
Next Generation Science Standards (NGSS)
Science and Engineering Practices (Check all that apply)
Crosscutting Concepts (Check all that apply)
☒ Asking questions (for science) and defining problems (for engineering)
☐ Patterns
☐ Developing and using models ☐ Cause and effect
☒ Planning and carrying out investigations ☐ Scale, proportion, and quantity
☒ Analyzing and interpreting data ☒ Systems and system models
28

Next Generation Science Standards (NGSS)
Science and Engineering Practices (Check all that apply)
Crosscutting Concepts (Check all that apply)
☐ Using mathematics and computational thinking ☐ Energy and matter: Flows, cycles, and conservation
☒ Constructing explanations (for science) and designing solutions (for engineering)
☐ Structure and function.
☐ Engaging in argument from evidence ☐ Stability and change.
☒ Obtaining, evaluating, and communicating information
Ohio’s Learning Standards for Science (OLS)
Expectations for Learning - Cognitive Demands (Check all that apply)
☐ Designing Technological/Engineering Solutions Using Science concepts (T)
☒ Demonstrating Science Knowledge (D)
☒ Interpreting and Communicating Science Concepts (C)
☒ Recalling Accurate Science (R)
Ohio’s Learning Standards for Math (OLS) and/or
Common Core State Standards -- Mathematics (CCSS)
Standards for Mathematical Practice (Check all that apply)
☐ Make sense of problems and persevere in solving them
☐ Use appropriate tools strategically
☐ Reason abstractly and quantitatively ☐ Attend to precision
☐ Construct viable arguments and critique the reasoning of others
☐ Look for and make use of structure
☐ Model with mathematics ☐ Look for and express regularity in repeated reasoning
Unit Academic Standards (NGSS, OLS and/or CCSS):
Ohio Learning Standards
29

Scientific Inquiry and Application
o Identify question and concepts that guide scientific investigations;
o Design and conduct scientific investigations;
o Formulate and revise explanations and models using logic and evidence (critical thinking);
o Recognize and analyze explanations and models; and
o Communicate and support a scientific argument.
Global Environmental Problems and Issues
o Potable water quality, use and availability
o Sustainability
Earth’s Resources
o Water and water pollution
o Potable water and water quality
Materials: (Link Handouts, Power Points, Resources, Websites, Supplies)
8 Five gallon buckets
16 gallons of water
4 labels (United States, Europe, Kenya, Honduras)
4 containers for water transport, 2 large and 2 small (examples: 2 large cups and 2 spoons)
Classroom whiteboard and dry erase markers
About 2 cups of “contaminants” (this can be dirt, crushed Oreos, or chocolate milk).
Large whiteboards for student groups (about 8 boards, measuring roughly 3 x 4 feet each)
Dry erase markers (enough for each group)
Copies of the “Big Idea to Guiding Questions” worksheet (1 per student)
Teacher Advance Preparation:
1. Make enough copies of the “Big Idea to Guiding Questions” worksheet so that each student may have their own.
2. Designate a large, empty parking lot or large outdoor area to use for the water races, then set up the area as follows:
a. On one side of the area, place 4 five gallon buckets in a row, with about 5-10 feet of spacing between each. Place one of the following labels on the bottom of each of the buckets: United States, Europe, Kenya, and Honduras. Fill each of these buckets with 4 gallons of water.
30

b. Measure 50 meters away from the first row of buckets, and place the other 4 five gallon buckets, each bucket directly across from one of the full water buckets. These 4 buckets should be empty.
c. Place the following utensils next the corresponding bucket, on the full-bucket side.
i. United States: a large container (about 2 cups in size)
ii. Europe: a large container (about 1 ½ - 2 cups in size)
iii. Kenya: a small container (a large spoon)
iv. Honduras: a small container (a large spoon)
d. Add “contaminants” to the two buckets of water that are labeled as Kenya and Honduras. Some suggested contaminants are dirt, crushed Oreos, or chocolate milk, to give the water a polluted appearance.
3. Write the words: “Water Transportation / Distribution” on the board.
Activity Procedures:
Activity 1, Day 1: (50 mins) - Introduce the Big Idea, produce the essential questions, identify the Challenge, and brainstorm the guiding questions.
1. At the start of the class, as the students come into the room, have the following words written on the board: “Water Transportation / Distribution.” When all of the students are seated, announce to the class that the next topic that will be covered is “Water Transportation / Distribution. Then, split the class into 4 even groups and take the class to the pre-determined location for the “hook” activity.
2. On the side of the parking lot (or large outdoor area) that has the 4 buckets containing water, have each group of students line up behind one of the buckets. Provide them with the following instructions: “In your four groups, we are going to have a water race today. Please make careful observations throughout the entire race, as you will need these details for the second part of today’s activity. When I say “go,” the first person from each group will start to transport the water from the full bucket to their corresponding bucket on the other side of the large area, dump the water into the bucket, and run back to their group to pass the transportation tool to the next person in line. You may walk or run as fast as you want, but only one person may travel at a time and each group can only use the transportation tool provided to them. Some people might need to go more than once to get all of the water to the other side. When all four groups have completed the race, each group needs to measure the amount of water that they actually transported to their second bucket.”
3. As the students begin the race, the teacher needs to carefully record the finish order of the four groups. When all four groups have completed the race, have each group read the country name on the bottom of their original water bucket, and then take the class back into the classroom to reflect on the activity.
4. As the students return to the classroom, instruct them to divide their large group from the race into two smaller groups, and to then sit together and wait for your next instruction.
5. After all of the groups are seated, pass out the “Big Idea to Guiding Questions” worksheet to each student, then provide the class with 5 minutes of silent time to read the directions and fill in the
31
first box by themselves. At the end of the 5 minutes, give the students an additional 5-10 minutes to share their ideas with the rest of their group and fill in the second box on their Big Idea Sheets.
6. Have one student from each group share with the entire class what they and their partner came up with relating to the Big Idea and the Water Race. It may be helpful to foster conversation in the groups with the following questions:
a. Why did the water in the buckets of two of the groups look different than the other groups’ water?
b. Why were there country names on the bottom of the starting buckets and how do these names relate to the other details you observed?
c. Did all of the groups complete their water transportation in the same amount of time, or did some finish much faster than others? If so, what contributed to this difference?
7. Following the class discussion, give the groups 5 more minutes to brainstorm and record “Essential Questions.”
8. Circulate the room and listen to the groups working. If necessary, help plant some ideas for the groups, if they seem completely lost. Some possible “Essential Questions” that they may come up with include:
a. How do we efficiently and sustainably transport water to where it is needed for agricultural purposes?
b. What are some reasons that water needs to be transported from one location to another?
c. Where does water come from and where does it go (more specifically, OUR water)?
d. How is the efficiency of water transportation different in first world vs third world countries?
e. In what ways can we make water transportation more efficient?
f. Why is the efficiency of water transportation different in first world vs third world countries?
g. Why do some countries have cleaner water to transport than others?
9. Through class discussion, come up with a class list of essential questions (and display this list on the board). Use the Big Idea worksheet to record and organize any important background information on the unit Big Idea.
10. Use guiding mechanisms to help the students come up with the essential question that will serve as the backbone for their challenge: How do we efficiently and sustainably transport water to where it is needed for agricultural purposes? This question may have slightly different wording, but the general theme should be consistent. Be sure to have the students record this Essential Question on their worksheets.
11. Have the students discuss possible real-world challenges that they could solve relating to this essential question. Guide the students to the following design Challenge: Design and build a way to transport enough water to water the new community garden to ensure plant growth. The system designed and built by the students will be tested on a “model” of the garden, constructed by the teacher. Students will test, evaluate, and redesign their systems to improve efficiency. A final PowerPoint will be created for presentation to the PTA Garden Committee and / or School Board of their proposed solution for a watering system for the community garden. Realistically, the additional constraints of the Challenge will likely need to be expressed by the teacher (These can
32

be found in the complete unit plan. Due to time allotments, the Challenge may need to be described in more detail, including the constraints, on Day 2).
Activity 1, Day 2:
1. As students enter the room, instruct them to get out their “Big Idea to Guiding Questions” sheets from Day 1 and to sit with their groups.
2. Refresh the class about the Challenge they selected on Day 1 and give them about 3 minutes to review the notes they took the day prior.
3. As a class, on the large white board, brainstorm constraints and limitations. Try to lead the class to the constraints and limitations listed on the unit plan. If needed, make sure to introduce the missing constraints and limitations so that the students have a comprehensive list before beginning the Challenge.
4. Give each group 1 large whiteboard and a few dry erase markers. Have the students brainstorm at least 5 guiding questions for the Challenge. What do they need to know in order to complete this Challenge? (Give the groups about 5-10 minutes before moving on to the next step).
5. Share the questions as a class to produce a final class list of guiding questions for the Challenge. Make sure that all of the members in each group complete their Big Idea to Guiding Questions handout before collecting them at the end of class.
1. Observations of students actively engaging in the Essential Questions Challenge Guiding Questions process.
2. Student “Big Idea to Guiding Questions” worksheets, showing development of all parts listed above.
No summative assessments were used in this Activity.
Differentiation: Describe how you modified parts of the Lesson to support the needs of different learners.
Refer to Activity Template for details.
Reflection: Reflect upon the successes and shortcomings of the lesson.
33
Formative Assessments: Link the items in the Activities that will be used as formative assessments.
Summative Assessments: These are optional; there may be summative assessments at the end of a set of Activities or only at the end of the entire Unit.

Name: Amy Parker Contact Info: [email protected] Date: 07/22/16
Lesson Title : To Grow or Not to Grow…That is the Question
Unit #:
1
Lesson #:
1
Activity #:
2Activity Title: Plant / Agricultural Needs
Estimated Lesson Duration:
5 Class Periods
Estimated Activity Duration:
3 Class Periods
Setting:
School Community Garden and Classroom
Activity Objectives:
1. I can determine the permeability for different provided substances and create my own “permeability scale”.
2. I can determine the permeability of the soil for each of the different garden beds in the school’s community garden and rank them, using my “permeability scale.”
3. I can analyze rain gage data for Ohio to determine the estimated and expected rainfall for the determined time period.
4. I can synthesize the Ohio rain gage data and the permeability of the different garden beds to determine the amount of rain needed to achieve the desired soil saturation for the plants.
Activity Guiding Questions:
1. What is the necessary level of soil saturation needed for the types of plants in our school community garden?
2. What is the water demand of the community garden space, to achieve this desired level of soil saturation?
34

3. What is the average rainfall for the designated time period?
Next Generation Science Standards (NGSS)Science and Engineering Practices (Check all that
apply)Crosscutting Concepts (Check all that
apply)
☒ Asking questions (for science) and defining problems (for engineering)
☐ Patterns
☐ Developing and using models ☐ Cause and effect
☒ Planning and carrying out investigations ☒ Scale, proportion, and quantity
☒ Analyzing and interpreting data ☒ Systems and system models
☒ Using mathematics and computational thinking ☐ Energy and matter: Flows, cycles, and conservation
☒ Constructing explanations (for science) and designing solutions (for engineering)
☐ Structure and function.
☐ Engaging in argument from evidence ☐ Stability and change.
☒ Obtaining, evaluating, and communicating information
Ohio’s Learning Standards for Science (OLS)Expectations for Learning - Cognitive Demands (Check all that apply)
☐ Designing Technological/Engineering Solutions Using Science concepts (T)
☒ Demonstrating Science Knowledge (D)
☒ Interpreting and Communicating Science Concepts (C)
☒ Recalling Accurate Science (R)
Ohio’s Learning Standards for Math (OLS) and/or Common Core State Standards -- Mathematics (CCSS)
Standards for Mathematical Practice (Check all that apply)
☐ Make sense of problems and persevere in solving them ☐ Use appropriate tools strategically
☐ Reason abstractly and quantitatively ☐ Attend to precision
☐ Construct viable arguments and critique the reasoning of others
☐ Look for and make use of structure
☐ Model with mathematics ☐ Look for and express regularity in repeated reasoning
35

Unit Academic Standards (NGSS, OLS and/or CCSS):
Ohio Learning Standards Scientific Inquiry and Application
o Identify question and concepts that guide scientific investigations;o Design and conduct scientific investigations; o Use technology and mathematics to improve investigations and communications
Global Environmental Problems and Issues o Potable water quality, use and availabilityo Sustainability o Food production and availability
Soil and Land o Mass wasting and erosion o Land use and land management (including food production, agriculture and zoning)
Materials: (Link Handouts, Power Points, Resources, Websites, Supplies)
1. 8 oz cups and plastic spoons (enough for each group to have one cup and spoon per garden bed).
2. Sharpie markers3. White sticky labels4. Plain white paper5. Teacher computer or laptop and projector or Smart Board for youtube video6. Video link: https://www.youtube.com/watch?v=pLRAsAo5l0o7. Precipitation data from various sources (enough copies for each group). Select as many / few as
desired from the list below:a. http://www.srh.noaa.gov/ffc/?n=rainfall_scorecard b. http://www.vieuxinc.com/cincinnati/gauges c. http://water.weather.gov/precip/ d. https://www.wunderground.com/ e. https://rainfall.weatherdb.com/l/104/Cincinnati-Ohio
8. Large sheets of butcher block paper and markers or large 3 x 2.5’ whiteboards with dry erase markers
9. Permeability Lab materials (per group of 3-4 students):a. Graduated cylinderb. Large beakerc. Spoond. Timer / stopwatche. Two paper cupsf. Small amount of 5 different samples (labeled A – E) (Gravel, sand, silt, clay, and potting
soil).10. Student Handouts (1 per student)
36

Teacher Advance Preparation:
1. Separate cups, spoons, labels, and sharpies into bags or containers to make distribution to the lab groups go more smoothly (optional).
2. Set up the computer / laptop and the Smart Board / projector and test the youtube video to ensure that it plays fully and can be understood.
3. Locate precipitation data from various sources and make enough copies for each group. 4. Gather supplies for the permeability lab.
Activity Procedures:
Part 1:
1. Give each group of students a stack of 8 oz cups and a handful of plastic spoons (enough so that there is one cup and spoon for each of the garden beds). Instruct the groups to place a white label on each cup and then use a sharpie maker to identify the garden bed assigned to that cup.
2. Take the students out to the school community garden and direct each group to take a sample of dirt (about half of the cup) from each of the garden beds. When every group has retrieved their soil samples, return to the classroom.
3. Leave these samples in a dry corner of the room to be used later in this activity.
Part 2:
4. Have students run a permeability lab with 5 different substances with generally known permeability. (Follow the handout for more specific instructions).
5. Using the results from the lab, create a “permeability scale” on a sheet of plain white paper, using these 5 items as points of reference.
Part 3:
6. Have each of the groups retrieve their soil samples (from Part 1) and sit as a group at a table (or their pushed-together desks.
7. Each group will test the soil to determine the permeability of each garden bed and rank it, using their “permeability scale.”
Part 4:
8. Discuss rain gages and play the following video: https://www.youtube.com/watch?v=pLRAsAo5l0o
9. Provide students with rain gage / other precipitation data for our area of Ohio (or Ohio as a whole). The greater the variety of data that you can provide to students, the better. Multiple suggested links for precipitation data are listed in the Materials section.
37

10. In groups, the students will compare the precipitation data and look for discrepancies. Each group will construct a precipitation vs month graph for Ohio and chart the data for each on the line graph, making a key to identify each year. These line graphs can either be created on large sheets or drawn on large 3 x 2.5’ whiteboards. (If you are running behind schedule, have students research this for HW and discuss / share their results with the class the following morning as a warm-up / bell ringer activity.)
11. Have students set up their graphs around the room, and then have the students “poster-walk” around the room and examine other groups’ graphs.
12. Lead a class discussion about precipitation in Ohio over the years, and draw conclusions as a class to predict the average precipitation for the garden.
1. Student constructed “permeability scales” 2. Student rankings of the garden bed soils using their “permeability scale” (exhibited through
student handout)3. Student conclusions from Ohio rain gage data (exhibited through group graphs)4. Student predictions of the amount of rain needed to achieve the desired soil saturation for the
plants (exhibited through class discussion)
No summative assessments for this activity.
Differentiation: Describe how you modified parts of the Lesson to support the needs of different learners.
Refer to Activity Template for details.
Reflection: Reflect upon the successes and shortcomings of the lesson.
Name: Amy Parker Contact Info: [email protected] Date: 07/22/16
Lesson Title : Manager of the Water Unit #:1
Lesson #:2
Activity #:3Activity Title: Research other School / Community Gardens
38
Formative Assessments: Link the items in the Activities that will be used as formative assessments.
Summative Assessments: These are optional; there may be summative assessments at the end of a set of Activities or only at the end of the entire Unit.

Estimated Lesson Duration: 7 Class Periods
Estimated Activity Duration: 2 Class Periods
Setting: Classroom (with laptop cart or personal student devices) and / or Computer Lab
Activity Objectives:
1. I can calculate the cost of implementing different sustainable water transportation systems on our school community garden.
2. I can research different ways to decrease the cost of both implementation and upkeep on these different sustainable water transportation systems.
3. I can determine the different components needed to transport water and suggest realistic possibilities for the different parts in relation to the school community garden.
4. I can identify different water transportation systems / designs currently being used by other schools / communities, and determine the pros and cons of each.
Activity Guiding Questions:
1. What water resources are located nearby and how can they be utilized as sources of water?
2. How much do different sources of water cost?
3. What are the components of transporting water / what is needed?
4. What water transportation systems / designs are currently being used by other schools / communities?
Next Generation Science Standards (NGSS)
Science and Engineering Practices (Check all that apply)
Crosscutting Concepts (Check all that apply)
☒ Asking questions (for science) and defining problems (for engineering)
☐ Patterns
☐ Developing and using models ☐ Cause and effect
☐ Planning and carrying out investigations ☒ Scale, proportion, and quantity
☒ Analyzing and interpreting data ☒ Systems and system models
☒ Using mathematics and computational thinking ☐ Energy and matter: Flows, cycles, and
39

Next Generation Science Standards (NGSS)
Science and Engineering Practices (Check all that apply)
Crosscutting Concepts (Check all that apply)
conservation
☐ Constructing explanations (for science) and designing solutions (for engineering)
☒ Structure and function.
☐ Engaging in argument from evidence ☐ Stability and change.
☒ Obtaining, evaluating, and communicating information
Ohio’s Learning Standards for Science (OLS)
Expectations for Learning - Cognitive Demands (Check all that apply)
☐ Designing Technological/Engineering Solutions Using Science concepts (T)
☒ Demonstrating Science Knowledge (D)
☒ Interpreting and Communicating Science Concepts (C)
☒ Recalling Accurate Science (R)
Ohio’s Learning Standards for Math (OLS) and/or Common Core State Standards -- Mathematics (CCSS)
Standards for Mathematical Practice (Check all that apply)
☐ Make sense of problems and persevere in solving them
☐ Use appropriate tools strategically
☐ Reason abstractly and quantitatively ☐ Attend to precision
☐ Construct viable arguments and critique the reasoning of others
☐ Look for and make use of structure
☐ Model with mathematics ☐ Look for and express regularity in repeated reasoning
Unit Academic Standards (NGSS, OLS and/or CCSS):
Ohio Learning Standards Scientific Inquiry and Application
o Identify question and concepts that guide scientific investigations;
o Design and conduct scientific investigations;
40

o Use technology and mathematics to improve investigations and communications;
o Formulate and revise explanations and models using logic and evidence (critical thinking);
o Recognize and analyze explanations and models; and
o Communicate and support a scientific argument.
Global Environmental Problems and Issues o Sustainability
o Food production and availability
Soil and Land o Land use and land management (including food production, agriculture and zoning)
Materials: (Link Handouts, Power Points, Resources, Websites, Supplies)
1. Garden Sharing Worksheet (Student Research handout); enough for each student
2. Computers (at least 1 for every 2 students)
Teacher Advance Preparation:
1. Copy student research handouts (each student needs their own, although each group may be researching together and getting a lot of the same information. Requiring each student to collect and record the data themselves holds all members of the group more accountable).
2. Acquire a laptop cart for the room and check to make sure that all computers work / log onto the internet.
Activity Procedures:
1. One major goal of this exercise is to have the students research to gather their own data relating to possible water resources for water transportation systems, different components of water transportation systems, and the costs of each. At the beginning of the class, remind the students of the Big Idea and Challenge, to remind them of the focus and big picture (context) for this activity.
2. Pass out the student laptops from the laptop cart (if no laptop cart is available, move the class to a nearby computer lab. Pass out the Garden Sharing Worksheet (one per student). In their Challenge groups, have the students begin to research the garden data, using the Garden Sharing Worksheet as a guide.
3. Be sure to circulate around the room as the students work in pairs to ensure that all are actively contributing. Ask open-ended, broad questions to help guide the students or to help get them back on track if they seem to have hit a wall.
4. Instruct the Challenge groups to compile all of their group’s data onto one sheet of paper, in an organized fashion and to discuss their conclusion. Give the students about 5 minutes.
41

5. Have a brief class discussion about the findings of different groups, using the Garden Sharing Worksheet as a guide.
1. Garden Sharing Worksheet (Student Research Handouts)
2. Observations during student group work
No summative assessments for this activity.
Differentiation: Describe how you modified parts of the Lesson to support the needs of different learners.
Refer to Activity Template for details.
Reflection: Reflect upon the successes and shortcomings of the lesson.
Name: Amy Parker Contact Info: [email protected] Date: 07/22/16
Lesson Title : Manager of the Water Unit #:1
Lesson #:2
Activity #:4Activity Title: Rain Harvest
Estimated Lesson Duration: 7 Class Periods
Estimated Activity Duration: 5 Class Periods
Setting: Classroom
42
Formative Assessments: Link the items in the Activities that will be used as formative assessments.
Summative Assessments: These are optional; there may be summative assessments at the end of a set of Activities or only at the end of the entire Unit.

Activity Objectives:
1. I can analyze the pros and cons for different possible water sources for their use in the water transportation system, eventually selecting one.
2. I can research and take into consideration the cost of the water transportation system’s parts and upkeep, staying within my allotted budget.
3. I can synthesize my understanding to determine the water needed to saturate the garden soil to the optimal soil saturation level for the specific plants in the garden, and select a method to control this variable.
4. I can design and build a water transportation system that can be tested on a “model” of the garden (constructed by the teacher) that can transport enough water to water the new community garden and ensure plant growth.
5. I can test, evaluate, and redesign my water transportation system to improve efficiency.
6. I can create and present a final PowerPoint for presentation to the PTA Garden Committee and / or School Board of the final proposed solution for a watering system for the community garden.
Activity Guiding Questions:
1. What is the water demand of the community garden space?
2. What is the average rainfall for the designated time period?
3. What water resources are located nearby and how can they be utilized as sources of water?
4. What properties of water allow / prevent the water’s transport?
5. Where does our local water come from?
6. Does the water need to be filtered / purified at all from pollution (such as acid rain)?
7. How can we decide the purity or pollution level of rain water (if we decide to use this source)?
8. How much do different sources of water cost?
9. What are the components of transporting water / what is needed?
10. What is the estimated cost of the supplies and implementation for your group’s proposed water implementation system?
Next Generation Science Standards (NGSS)
Science and Engineering Practices (Check all that apply)
Crosscutting Concepts (Check all that apply)
☒ Asking questions (for science) and defining problems (for engineering)
☐ Patterns
☒ Developing and using models ☐ Cause and effect
☒ Planning and carrying out investigations ☒ Scale, proportion, and quantity
☐ Analyzing and interpreting data ☒ Systems and system models
43

Next Generation Science Standards (NGSS)
Science and Engineering Practices (Check all that apply)
Crosscutting Concepts (Check all that apply)
☒ Using mathematics and computational thinking ☐ Energy and matter: Flows, cycles, and conservation
☒ Constructing explanations (for science) and designing solutions (for engineering)
☒ Structure and function.
☐ Engaging in argument from evidence ☐ Stability and change.
☒ Obtaining, evaluating, and communicating information
Ohio’s Learning Standards for Science (OLS)
Expectations for Learning - Cognitive Demands (Check all that apply)
☒ Designing Technological/Engineering Solutions Using Science concepts (T)
☒ Demonstrating Science Knowledge (D)
☒ Interpreting and Communicating Science Concepts (C)
☒ Recalling Accurate Science (R)
Ohio’s Learning Standards for Math (OLS) and/or Common Core State Standards -- Mathematics (CCSS)
Standards for Mathematical Practice (Check all that apply)
☐ Make sense of problems and persevere in solving them
☐ Use appropriate tools strategically
☐ Reason abstractly and quantitatively ☐ Attend to precision
☐ Construct viable arguments and critique the reasoning of others
☐ Look for and make use of structure
☐ Model with mathematics ☐ Look for and express regularity in repeated reasoning
Unit Academic Standards (NGSS, OLS and/or CCSS):
Ohio Learning Standards Scientific Inquiry and Application
o Identify question and concepts that guide scientific investigations;
o Design and conduct scientific investigations;
44

o Use technology and mathematics to improve investigations and communications;
o Formulate and revise explanations and models using logic and evidence (critical thinking);
o Recognize and analyze explanations and models; and
o Communicate and support a scientific argument.
Global Environmental Problems and Issues o Potable water quality, use and availability
o Sustainability
o Food production and availability
Earth’s Resources o Water and water pollution
o Potable water and water quality
o Point source and non-point source contamination
Soil and Land o Mass wasting and erosion
o Land use and land management (including food production, agriculture and zoning)
Materials: (Link Handouts, Power Points, Resources, Websites, Supplies)
1. Various supplies for water transportation system model construction
2. Garden “model” for students to use to test their water transportation systems
3. Water supply (for use during testing on the garden “model”)
4. Laptops / computer lab
5. Metric measuring devices
Teacher Advance Preparation:
1. Gathering supplies and tools needed for water transportation system construction
2. Construction of garden “model” to use for testing student-designed watering systems
3. Research school policies on safety / grounds limitations that may affect the challenge
4. Arrange to attend a Board Meeting for students to present their proposals and / or arrange for the PTA Garden Committee to visit the class and hear the proposals
5. Secure laptops / computer lab for student PowerPoint / Google Slides proposal construction
Activity Procedures:
45

Day 1 – (50 minutes):
1. Instruct the students to get into their Challenge groups (these should be the same groups that the students have been working in since the beginning of the unit). Remind them of the challenge (it is a good idea to have the challenge posted clearly on the board).
Challenge: Design and build a way to transport enough water to water the new community garden to ensure plant growth. The system designed and built by the students will be tested on a “model” of the garden, constructed by the teacher. Students will test, evaluate, and redesign their systems to improve efficiency. A final PowerPoint will be created for presentation to the PTA Garden Committee and / or School Board of their proposed solution for a watering system for the community garden.
2. Students will brainstorm within their groups all of the different pieces of data that they need to collect from the garden area to accurately plan for and build a water transportation system for the school garden. As students brainstorm, one student from each group should record the list in a notebook or on a scrap piece of paper. Allow students about 10 minutes for this step (or until the groups seem to begin to run out of ideas).
3. Take the class outside to the garden area and allow the groups about 15-20 minutes to collect any / all data that they think they will need to assist them with their proposal. (Please stress that the students will be free to revisit the garden area throughout the Challenge, on their own time. However, this is the only class time that will be devoted to visiting the garden).
4. Bringing their gathered data back into the classroom, each group will use their research findings from Activity 3 to brainstorm ideas for their proposal. Important components that they will need to focus on include the efficiency, the necessary design to allow proper function, and cost.
5. Each student will sketch out one design for their group’s proposal, complete with dimensions, details, and special instructions. Students may use a digital program (such as SketchUp) or pencil and paper.
6. After each student has completed a design, the other group members will write a pro and a con for each of their group members’ designs. At this point in the Challenge, the teacher needs to sign off on the group’s individual sketches before allowing the groups to progress forward.
7. After the teacher checkpoint, each group must combine the best ideas from each of their sketches and construct one final sketch to use to build their first prototype.
8. By the end of the class period, the students in each group need to have a complete list of the different supplies needed to construct their prototype. Cost of supplies is a major factor in the student proposals, so it is essential for each group to research and find as many donated supplies as possible (a lot of non-profit organizations and / or local businesses are willing to make donations to students for school projects).
9. Various supplies will be made available by the teacher for building the in-class prototypes, however students may bring in additional supplies and / or submit a list of requested supplies to build their prototype / model to the teacher. The teacher maintains the right to deny any requests due to safety or cost reasons. (Based on teacher discretion).
Day 2 – (50 minutes):
1. Students will continue to work on their challenges.
46

2. Each group will build their prototype and test it on the teacher-made garden “model,” making iterations to improve efficiency. ALL iterations made must be recorded.
Day 3 – (50 minutes):
1. Students will continue to work on their challenges.
2. Each group will build their prototype and test it on the teacher-made garden “model,” making iterations to improve efficiency. ALL iterations made must be recorded.
3. As students finalize their system designs, encourage students to begin their proposal presentations, using PowerPoint and / or Google Slides. Encourage them to work on their proposals outside of class as well, because class time alone might not be enough time to produce a sound proposal.
Day 4 – (50 minutes):
1. Students will continue to work on their challenges.
2. About 15 minutes into the class, pause all of the groups and have them pair up with another group for their half-way checkpoint.
a. Students will share their progress thus far with another group (they will use this as a “dress rehearsal” for their final presentation) for feedback.
b. The teacher should also observe these presentations and use it as a formative assessment, providing feedback to help groups improve their proposals.
3. From both self-reflection and this feedback, the groups will each rebuild / alter their water filtration system prototype and proposal. (This is the iterative portion of the EDP).
Day 5 – (50 minutes):
1. Arrange to have the school’s PTA Garden Committee come to visit the class and allow the students 5-10 minutes for each group to present. Encourage the groups to be open to answering any questions that committee members may have at the end of their presentation.
2. When students are not presenting, they will observe closely and record the title of each other group’s proposal, one suggestion for improvement, one positive comment, and one question. (It may be helpful to write these requirements on the board).
3. Administer the post-test and collect it for assessment.
1. Individual sketches, with pros and cons for each, and final group sketch of prototype
2. Prototype of water transportation system
47
Formative Assessments: Link the items in the Activities that will be used as formative assessments.
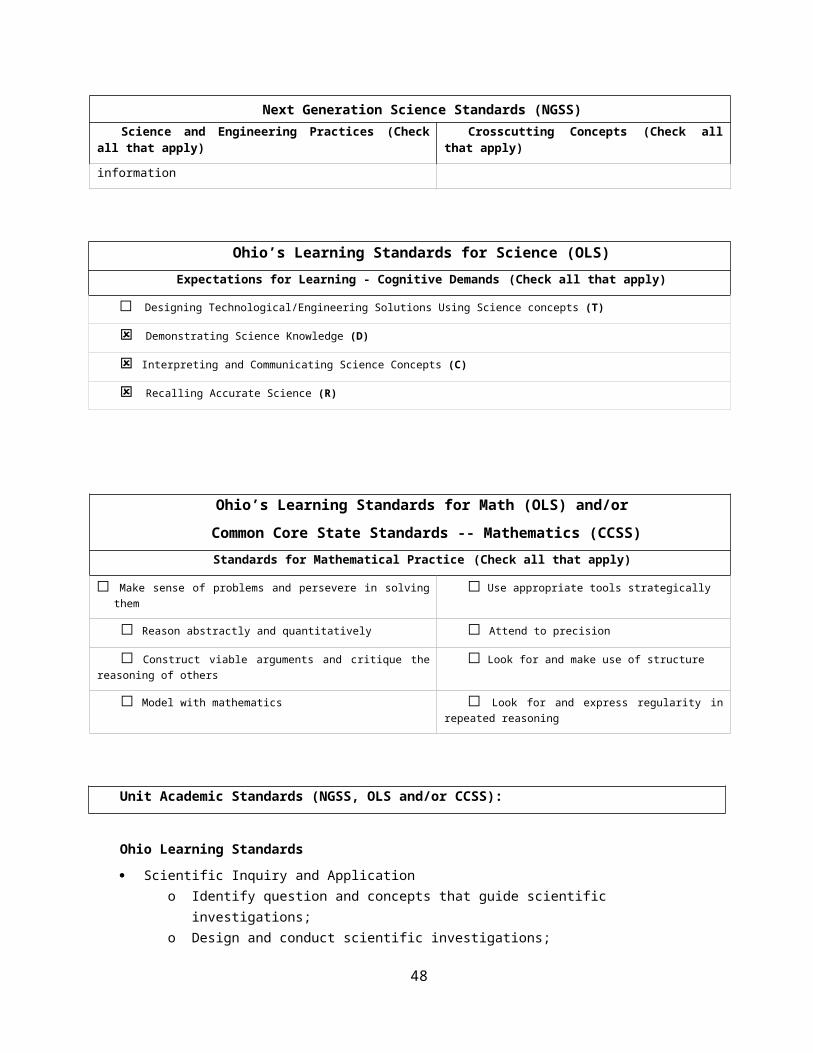
3. Water transportation system prototype refinements after initial testing to improve efficiency
4. Half-way checkpoint of peer practice presentations (teacher observations)
5. Presentation improvements after checkpoint
1. Evaluation of the water transportation system proposal, with proof of iterations
2. Evaluation of the water transportation model, with proof of iterations
Differentiation: Describe how you modified parts of the Lesson to support the needs of different learners.
Refer to Activity Template for details.
Reflection: Reflect upon the successes and shortcomings of the lesson.
48
Summative Assessments: These are optional; there may be summative assessments at the end of a set of Activities or only at the end of the entire Unit.
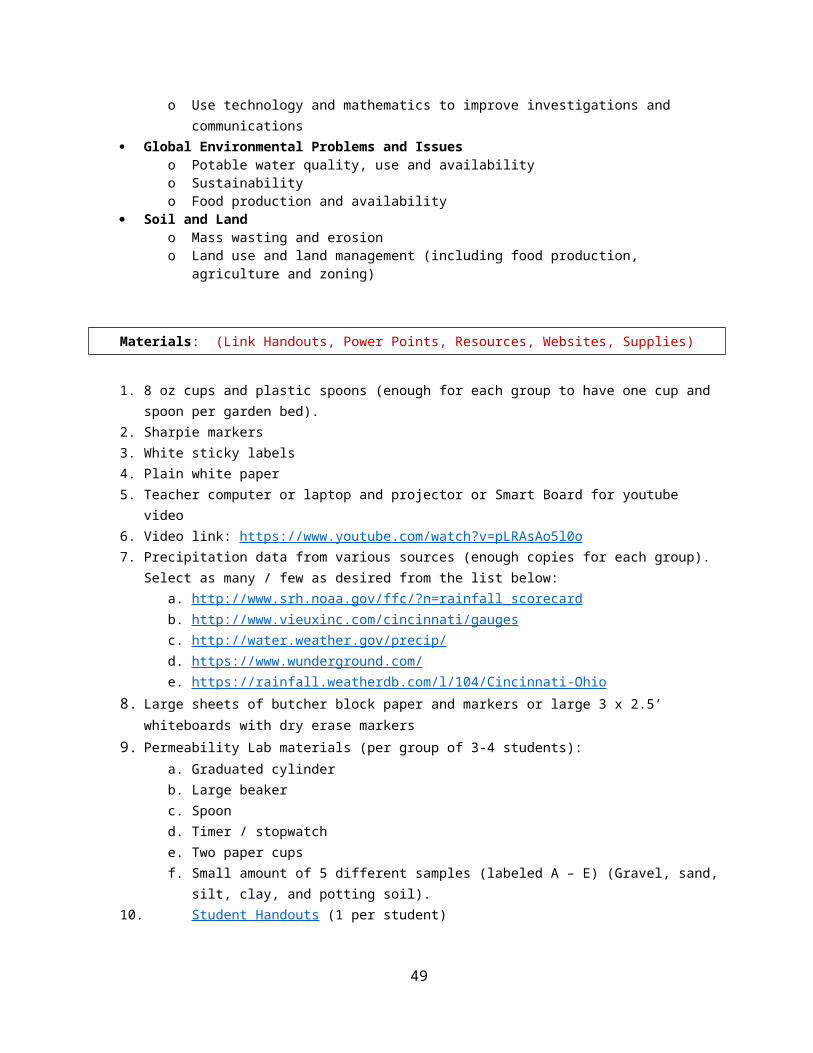
14. APPENDIX IV: TEACHER UNIT TEMPLATE: NANCY SCHREDER-VOSSEN
Name:Nancy A.Schreder-Vossen
Contact Info:[email protected] Date:7/5/16
Unit Number and Title:Unit 1: Clean Water
Grade Level: 9
Total Estimated Duration of Entire Unit:
6-50 minute class periods
Part 1: Designing the Unit
4. Unit Academic Standards (Identify which standards: NGSS, OLS and/or CCSS. Cut and paste from NGSS, OLS and/or CCSS and be sure to include letter and/or number identifiers.):
Diversity and interdependence of Life
NGSS:
Develop and use models
Planning and carrying out investigations
Analyze and interpret data
Constructing explanations and designing solutions
Obtaining, evaluating and communicating information
Cause and effect
Scale, proportion, and quantity
Stability and Change
OLS:
Designing Technological/Engineering Solutions Using Science Concept
Demonstrating Knowledge
Interpreting and Communicating Science Concepts
Recalling Accurate Science
5. Unit Summary
The Big Idea (including global relevance): Clean Water
Making sure there is enough clean, fresh water to share with all living things is vital to global health.
49
Subject Area:
Biology

All the water that is used must go through the water cycle. Whatever is put down the drain ends up in water. Solid particles and chemicals like fertilizers and pesticides pollute water sources, harming the organisms that live in them.
The (anticipated) Essential Questions: List 3 or more questions your students are likely to generate on their own. (Highlight in yellow the one selected to define the Challenge):
How do we clean water?
Where does water come from?
What is water pollution?
How do we know that water is polluted?
How do pollutants get into the water?
How are pollutants spread (dispersed)?
How can we stop pollutants from being spread from one place to another?
What are different types of pollution?
6. Unit Context
Justification for Selection of Content– Check all that apply:
☐ Students previously scored poorly on standardized tests, end-of term test or any other test given in the school or district on this content.
☐ Misconceptions regarding this content are prevalent.
☐XContent is suited well for teaching via CBL and EDP pedagogies.
☐ The selected content follows the pacing guide for when this content is scheduled to be taught during the school year. (Unit 1 covers atomic structure because it is taught in October when I should be conducting my first unit.)
☐ Other reason(s) _____________________________________________________________
_____________________________________________________________________________
The Hook: (Describe in a few sentences how you will use a “hook” to introduce the Big Idea in a compelling way that draws students into the topic.)
You Tube Video: Water Crisis in Flint MI
http://www.cnn.com/2016/03/04/us/flint-water-crisis-fast-facts/
Here’s how Flint’s water crisis happened
50

Flint resident fighting for clean water.
The Challenge and Constraints:
☐x Product or ☐ Process (Check one)
Description of Challenge (Either Product or Process is clearly explained below):
List the Constraints Applied
Design a water filtration system to remove solids and particulates from a water source.
Time:
Resources:
Household products supplied by students
Amount of water that is filtered (300ml)
Teacher’s Anticipated Guiding Questions (that apply to the Challenge and may change with student input.):
Where does water come from?
How do we get water from a well, municipal water supply to our homes/businesses?
Where does the water in lakes, rivers, streams, and other observable water sources come from?
Where does bottled water come from?
51

How do pollutants get into the water?
How are pollutants spread?
What are the steps in water purification?
What purpose does each step in the water purification process serve?
4. EDP: Use the diagram below to help you complete this section.
How will students test or implement the solution? What is the evidence that the solution worked?
Describe how the iterative process from the EDP applies to your Challenge.
Each group of students will test a water sample that has a known pH and turbidity level. The effectiveness of the solution will be determined by the pH and turbidity of the sample after it goes through the filtration process designed by each group.
How will students present or defend the solution? Describe if any formal training or resource guides will be provided to the students for best practices (e.g., poster, flyer, video, advertisement, etc.) used to present work.
At the end of the challenge, each group will design and present a power point that illustrates each step of the Engineering Design Process that they used to solve the challenge. Each group will then do a two minute presentation to the class.
What academic content is being taught through this Challenge?
52
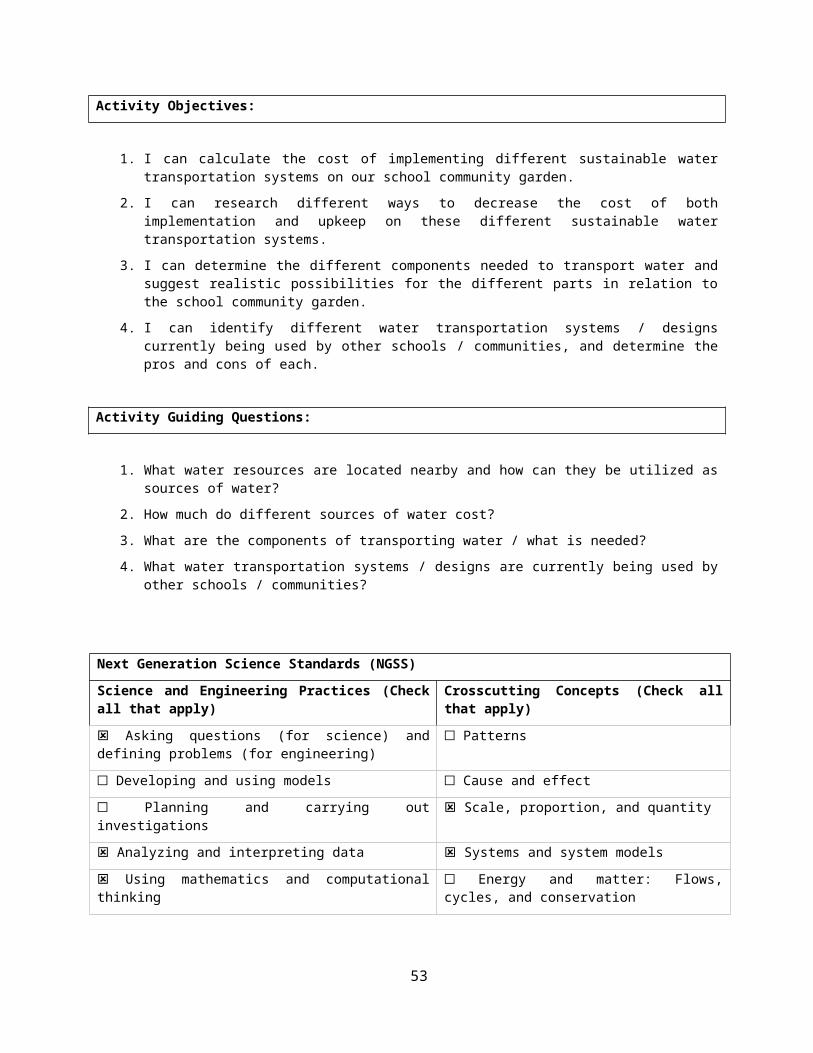
Diversity and interdependence of life.
The water cycle (biogeochemical cycles)
NGSS:
Develop and use models
Planning and carrying out investigations
Analyze and interpret data
Constructing explanations and designing solutions
Obtaining, evaluating and communicating information
Cause and effect
OLS:
Designing Technological/Engineering Solutions Using Science Concept
Demonstrating Knowledge
Interpreting and Communicating Science Concepts
Recalling Accurate Science
Assessment and EDP:
Using the diagram above, identify any places in the EDP where assessments should take place, as it applies to your Challenge. Describe below what kinds of assessment are most appropriate.
What EDP Processes are ideal for conducting an Assessment? (List ones that apply.)
List the type of Assessment (Rubric, Diagram, Checklist, Model, Q/A etc.) Check box to indicate whether it is formative or summative.
Gather information
Identify Alternatives
Implement Solution
Evaluate Solution
Q/A –Experiments ☐ formative X ☐summative
Diagram x ☐ formative ☐summative
Build Model/check list X ☐ formative ☐summative
Written Summary ☐ formative X ☐summative
53
Check below which characteristic(s) of this Challenge will be incorporated in its implementation using EDP. (Check all that apply.)
X☐ Has clear constraints that limit the solutions
X☐ Will produce than one possible solution that works
X☐ Includes the ability to refine or optimize solutions
X☐ Assesses science or math content
☐ Includes Math applications
☐ Involves use of graphs
☐ Requires analysis of data
☐ Includes student led communication of findings
5. ACS (Real world applications; career connections; societal impact):
Place an X on the continuum to indicate where this Challenge belongs in the context of real world applications:
Abstract or Loosely Applies to the Real World
|--------------------------------------|------------------------------------X---|
Strongly Applies to the Real World
Provide a brief rationale for where you placed the X:
Clean water is an essential resources for all living things. How we live in our watershed, the area that drains into a body of water, can impact water quality and quantity. In order to continue to use water as a resource both the quantity and quality of groundwater musts be maintained.
Water running off concrete and asphalt surfaces pick up gasoline, motor oil, heavy metals, trash and other pollutants from roadways and parking lots. Fertilizers and pesticides from farms, lawns, parks, and golf courses are also added to local water sources. These fertilizers are a source of nitrates and phosphorus. High levels of these nutrients can reduce oxygen and increase algae growth while limiting vegetation growth. These factors can disrupt the entire aquatic ecosystem due to limited light penetration, lower oxygen levels, and reduced food supplies in food chains.
What activities in this Unit apply to real world context?
Activity: Water run-off and soil erosion.
Diagram the water and describe how water moves in and on the earth.
Place an X on the continuum to indicate where this Challenge belongs in the context of societal impact:
Shows Little |-------------------------------------|-------------------------------- Strongly
54

or No Societal Impact ---X----| Shows Societal
Impact
Provide a brief rationale for where you placed the X:
Non-point sources of pollution do not enter groundwater at any one particular spot, for example, fertilizers, pesticides and acid precipitation. Point sources of pollution are directly identifiable sources of contamination, such as landfills, leaking chemical storage tanks or spills. These pollutants may then be leached into groundwater or washed into waterways – streams, rivers, lakes and estuaries. These pollutants can result in water systems with reduced water quality and eutrophication.
What activities in this Unit apply to societal impact?
Activity: Groundwater Contamination
Careers: What careers will you introduce (and how) to the students that are related to the Challenge? (Examples: career research assignment, guest speakers, fieldtrips, Skype with a professional, etc.)
Career Research Assignment @ My Next Move.org
Water Resource Specialist
Water or Wastewater Engineer
Plant and Systems Operator
Hydrologist
Meter Readers, Utilities
Answer the following questions about a career of interest:
a)knowledge b)skills c)abilities d)personality e)technology f)education g)job outlook
6. Misconceptions:
Bottled water is cleaner than tap water.
Water is free
Anything that is natural is not pollution
Pollution is primarily chemical
Biodegradable materials are not pollution
Water is bacteria is free
7. Unit Lessons and Activities: (Provide a tentative timeline with a breakdown for Lessons 1 and 2. Provide the Lesson #’s and Activity #’s for when the Challenge Based Learning (CBL) and Engineering Design Process (EDP) are embedded in the unit.)
Unit 1: Clean water – Design a filtration system using household products that can filter 300ml of water.
55

Lesson 1: The hydrologic cycle (3– 50 minute class periods)
Lesson 1 will focus on providing students with an opportunity to research the water cycle and understand how water moves on the planet. The second activity, porosity and permeability, will demonstrate how different soils impact the movement of water.
Activity 1: Introduction of the Big Idea, Generating the Essential Question, Challenge and Guiding Questions. (2-50 minute periods). Parts of the hydrologic cycle will be identified.
Activity 2: Porosity and Permeability of soils (1- 50 minute class period)
Lesson 2: Water Pollution (3-50 minute class periods)
Lesson 2 enables provides an opportunity to conduct research on how different types of surfaces impact watershed and how pollutants can be transported into the water supply. The challenge for students will be to design a method to filter water that has been polluted.
Activity1: Water Run-Off and Soil Erosion (1-50 minute class period)
Activity2: Design and test a water filtration system using household products that can filter 300 ml of water. (2 -50 minute class periods)
CBL: Lesson 2, Activity 2 EDP: Lesson 2, Activity 2
8. Keywords:
Porosity Point source pollution Algal Bloom
Permeability Non-point source pollution
Particulates Eutrophication Water Purification
9. Additional Resources:
10. Pre-Unit and Post-Unit Assessment Instruments:
A 17 point short answer and multiple choice test will be used as a pre-unit and post-unit assessment.
11. Poster 12. Video (Link here.)
If you are a science teacher, check the boxes below that apply:
56

Next Generation Science Standards (NGSS)
Science and Engineering Practices (Check all that apply)
Crosscutting Concepts (Check all that apply)
☐ Asking questions (for science) and defining problems (for engineering)
☐ Patterns
X☐ Developing and using models X☐ Cause and effect
X☐ Planning and carrying out investigations X☐ Scale, proportion, and quantity
X☐ Analyzing and interpreting data ☐ Systems and system models
☐ Using mathematics and computational thinking ☐ Energy and matter: Flows, cycles, and conservation
X☐ Constructing explanations (for science) and designing solutions (for engineering)
X☐ Structure and function.
☐ Engaging in argument from evidence X☐ Stability and change.
X☐ Obtaining, evaluating, and communicating information
If you are a science teacher, check the boxes below that apply:
Ohio’s Learning Standards for Science (OLS)
Expectations for Learning - Cognitive Demands (Check all that apply)
X☐ Designing Technological/Engineering Solutions Using Science concepts (T)
X☐ Demonstrating Science Knowledge (D)
X☐ Interpreting and Communicating Science Concepts (C)
X☐ Recalling Accurate Science (R)
If you are a math teacher, check the boxes below that apply:
Ohio’s Learning Standards for Math (OLS) or
Common Core State Standards -- Mathematics (CCSS)
Standards for Mathematical Practice (Check all that apply)
☐ Make sense of problems and persevere in solving them
☐ Use appropriate tools strategically
☐ Reason abstractly and quantitatively ☐ Attend to precision
☐ Construct viable arguments and critique the ☐ Look for and make use of structure
57
Ohio’s Learning Standards for Math (OLS) or
Common Core State Standards -- Mathematics (CCSS)
Standards for Mathematical Practice (Check all that apply)
reasoning of others
☐ Model with mathematics ☐ Look for and express regularity in repeated reasoning
Part 2: Post Implementation- Reflection on the Unit
Results: Evidence of Growth in Student Learning - After teaching the Unit, present the evidence below that growth in learning was measured through one the instruments identified above. Show results of assessment data that prove growth in learning occurred.
Please include:
Any documents used to collect and organize post unit evaluation data. (charts, graphs and /or tables etc.)
An analysis of data used to measure growth in student learning providing evidence that student learning occurred. (Sentence or paragraph form.)
Other forms of assessment that demonstrate evidence of learning.
Anecdotal information from student feedback.
Reflection: Reflect upon the successes and shortcomings of the unit. Refer to the questions posed on the Unit Template Instruction sheet. Describe how the actual Engineering Design Process was actually used in the implementation of the Unit.
Name: Nancy Schreder-Vossen
Contact Info:[email protected] Date:7/5/16
Lesson Title : The Hydrologic Cycle Unit #:
1
Lesson #:
1
Activity #:
1Activity Title: Identifying parts of the hydrologic cycle
Estimated Lesson Duration:
2 Class periods
Estimated Activity Duration:
1 Class Period
58

Setting:
Classroom
Activity Objectives:
Students will define key terms associated with the water cycle
Students will describe how water is able to move using the water cycle
Activity Guiding Questions:
Where do we get water?
Are there water sources available that we cannot see?
How do plants get water from the ground?
How is water in the ground stored?
How is the water that is in the ground related to the water that we see on the surface of the earth?
Next Generation Science Standards (NGSS)
Science and Engineering Practices (Check all that apply)
Crosscutting Concepts (Check all that apply)
☐ Asking questions (for science) and defining problems (for engineering)
☐ Patterns
☐ Developing and using models ☐ Cause and effect
☐ Planning and carrying out investigations ☐ Scale, proportion, and quantity
☒ Analyzing and interpreting data ☒ Systems and system models
☐ Using mathematics and computational thinking ☐ Energy and matter: Flows, cycles, and conservation
☐ Constructing explanations (for science) and designing solutions (for engineering)
☒ Structure and function.
☐ Engaging in argument from evidence ☐ Stability and change.
☐ Obtaining, evaluating, and communicating information
59

Ohio’s Learning Standards for Science (OLS)
Expectations for Learning - Cognitive Demands (Check all that apply)
☐ Designing Technological/Engineering Solutions Using Science concepts (T)
☒ Demonstrating Science Knowledge (D)
☐ Interpreting and Communicating Science Concepts (C)
☒ Recalling Accurate Science (R)
Ohio’s Learning Standards for Math (OLS) and/or
Common Core State Standards -- Mathematics (CCSS)
Standards for Mathematical Practice (Check all that apply)
☐ Make sense of problems and persevere in solving them
☐ Use appropriate tools strategically
☐ Reason abstractly and quantitatively ☐ Attend to precision
☐ Construct viable arguments and critique the reasoning of others
☐ Look for and make use of structure
☐ Model with mathematics ☐ Look for and express regularity in repeated reasoning
Unit Academic Standards (NGSS, OLS and/or CCSS):
Interdependence of living things
Biogeochemical cycles
Materials: (Link Handouts, Power Points, Resources, Websites, Supplies)
Notebook paper ( 1 sheet/student) Website: You Tube Flint water crisis http://www.cnn.com/2016/03/04/us/flint-water-crisis-fast-facts/
Here’s how Flint’s water crisis happened
Flint resident fighting for clean water
Worksheet: The Water Cycle
60

Website: water.usgs.gov
Teacher Advance Preparation:
Make copies of the water cycle worksheets
Activity Procedures:
Part 1: Introducing the Big Idea, Essential Questions, and Challenge
Have students watch the Hook Video – Flint Water Crisis
Give students the Big Idea: Clean Water
Pass out notebook paper for student to record their ideas.
Ask the students to work with the person at their table to come up with at least 8 essential questions (3-4 minutes).
Give the student teams 2 minutes to pick their top 2 essential questions and write them on the white board in the front of the room.
Find a common essential question for the unit using the information put on the board by grouping common answers.
Present the challenge to the students.
Give students 3-4 minutes to come up guiding questions, working with their table partner (they should generate at least 8).
Have each team select their top 2 guiding questions and write them on the white board in the front of the room.
Students will record their ideas about the essential question and guiding questions and turn them in to be used as a formative assessment.
Part 2: Introduce the water cycle
Handout student worksheet 1.1.1a The Water Cycle.
Direct students to the website listed.
Each student will click on the term on the website that correlates to the term on the worksheet.
After reading the information, each student will complete the worksheet by adding a brief description of each term.
Students will turn in the notes they took while generating the essential and guiding questions.
61
Formative Assessments: Link the items in the Activities that will be used as formative assessments.
Summative Assessments: These are optional; there may be summative assessments at the end of a set of Activities or only at the end of the entire Unit.

Differentiation: Describe how you modified parts of the Lesson to support the needs of different learners.
Refer to Activity Template for details.
Water cycle worksheet will be corrected for accuracy.
Reflection: Reflect upon the successes and shortcomings of the lesson.
Name: Nancy Schreder-Vossen
Contact Info:[email protected] Date:7/5/16
Lesson Title : The Hydrologic Cycle Unit #:
1
Lesson #:
1
Activity #:
2Activity Title: Soil Porosity and Permeability
Estimated Lesson Duration:
2 Class Periods
Estimated Activity Duration:
1 Class Period
Setting:
Classroom
Activity Objectives:
Describe how the terms porosity and permeability are related.
62

Calculate the porosity and permeability of different types of soil.
Describe how porosity and permeability are a natural method to clean water.
Activity Guiding Questions:
How does surface water get into the ground?
How does water move through different types of soils?
How are surface water and ground water used by living organisms?
Next Generation Science Standards (NGSS)
Science and Engineering Practices (Check all that apply)
Crosscutting Concepts (Check all that apply)
☐ Asking questions (for science) and defining problems (for engineering)
☐ Patterns
☒ Developing and using models ☒ Cause and effect
☐ Planning and carrying out investigations ☐ Scale, proportion, and quantity
☒ Analyzing and interpreting data ☒ Systems and system models
☒ Using mathematics and computational thinking ☐ Energy and matter: Flows, cycles, and conservation
☐ Constructing explanations (for science) and designing solutions (for engineering)
☐ Structure and function.
☐ Engaging in argument from evidence ☐ Stability and change.
☒ Obtaining, evaluating, and communicating information
Ohio’s Learning Standards for Science (OLS)
Expectations for Learning - Cognitive Demands (Check all that apply)
☐ Designing Technological/Engineering Solutions Using Science concepts (T)
☒ Demonstrating Science Knowledge (D)
☐ Interpreting and Communicating Science Concepts (C)
☐ Recalling Accurate Science (R)
63

Ohio’s Learning Standards for Math (OLS) and/or
Common Core State Standards -- Mathematics (CCSS)
Standards for Mathematical Practice (Check all that apply)
☐ Make sense of problems and persevere in solving them
☐ Use appropriate tools strategically
☐ Reason abstractly and quantitatively ☐ Attend to precision
☐ Construct viable arguments and critique the reasoning of others
☐ Look for and make use of structure
☐ Model with mathematics ☐ Look for and express regularity in repeated reasoning
Unit Academic Standards (NGSS, OLS and/or CCSS):
Develop and use models
Analyze and interpret data
Biogeochemical cycles
Materials: (Link Handouts, Power Points, Resources, Websites, Supplies)
Materials (per group)
2 large cups (one with hole in the bottom) Graduated Cylinder
Marker 500 ml Beaker
Timer
Calculator
Spoon or Scraper
Water
Pea gravel
Yard soil (not potting soil)
Sand
Clay
Teacher Advance Preparation:
64

Set up materials for each student workstation
Make copies of the lab worksheets
Activity Procedures:
Introduce the key terms and review the directions for the lab assignment.
Complete sample problem on how to do the calculation for porosity.
Procedure for measuring porosity
1. Measure out 100 ml of water in the graduated cylinder
2. Pour the 100 ml of water in one of the cups and use the marker to mark the level
3. Pour the water back into the graduated cylinder
4. Fill the same cup with sand up the mark you drew
5. Pour the 100 ml of water slowly into the sand. Stop when the water level just reaches the top of the sand.
6. Record the amount of water left in the graduated cylinder in the right column.
7. Calculate the pore space by subtracting the amount left in the graduated cylinder from the original 100 ml.
8. Repeat steps 4-7 with the pea gravel, yard soil, and clay.
9. Calculate the %porosity and record in the table. Use this formula:
Porosity = Pore Space Volume x 100
Total volume
Procedure for measuring permeability
1. Place the same amount of sand in the cup with a hole in the bottom.
2. Get the timer ready. Hold the cup over a beaker to catch the water.
3. Pour the entire 100 ml of water quickly into the cup of sand. Start recording as soon as the water hits the sand.
4. Stop the timing as soon as the first drop of water comes out of the hole in the bottom.
5. Repeat steps 1-5 with the pea gravel, yard soil, and clay.
*Be careful when adding the water to the clay.
65
Formative Assessments: Link the items in the Activities that will be used as formative assessments.

The porosity and permeability worksheet will be graded for a summative assessment.
Differentiation: Describe how you modified parts of the Lesson to support the needs of different learners.
Refer to Activity Template for details.
Reflection: Reflect upon the successes and shortcomings of the lesson.
Name: Nancy Schreder-Vossen
Contact Info:[email protected]
Date:7/5/16
Lesson Title : Water Pollution Unit #:
1
Lesson #:
2
Activity #:
3Activity Title: Water Run-Off and Soil Erosion
Estimated Lesson Duration:
1 Class period
Estimated Activity Duration:
1 Class Period
Setting:
Classroom
Activity Objectives:
66
Summative Assessments: These are optional; there may be summative assessments at the end of a set of Activities or only at the end of the entire Unit.

Objectives
Students will describe how pollutants are carried in water as it travels on the earth’s surface.
Students will build models to demonstrate how the steepness of an incline and vegetation impact the rate of water flow and the movement of pollution particles
Activity Guiding Questions:
What are some different sources of pollution?
What is pollution?
What is water pollution?
Is there anything in nature that can help prevent or reduce pollution?
Next Generation Science Standards (NGSS)
Science and Engineering Practices (Check all that apply)
Crosscutting Concepts (Check all that apply)
☐ Asking questions (for science) and defining problems (for engineering)
☐ Patterns
☒ Developing and using models ☐ Cause and effect
☐ Planning and carrying out investigations ☐ Scale, proportion, and quantity
☒ Analyzing and interpreting data ☒ Systems and system models
☐ Using mathematics and computational thinking ☐ Energy and matter: Flows, cycles, and conservation
☐ Constructing explanations (for science) and designing solutions (for engineering)
☐ Structure and function.
☐ Engaging in argument from evidence ☐ Stability and change.
☐ Obtaining, evaluating, and communicating information
67

Ohio’s Learning Standards for Science (OLS)
Expectations for Learning - Cognitive Demands (Check all that apply)
☐ Designing Technological/Engineering Solutions Using Science concepts (T)
☒ Demonstrating Science Knowledge (D)
☐ Interpreting and Communicating Science Concepts (C)
☐ Recalling Accurate Science (R)
Ohio’s Learning Standards for Math (OLS) and/or
Common Core State Standards -- Mathematics (CCSS)
Standards for Mathematical Practice (Check all that apply)
☐ Make sense of problems and persevere in solving them
☐ Use appropriate tools strategically
☐ Reason abstractly and quantitatively ☐ Attend to precision
☐ Construct viable arguments and critique the reasoning of others
☐ Look for and make use of structure
☐ Model with mathematics ☐ Look for and express regularity in repeated reasoning
Unit Academic Standards (NGSS, OLS and/or CCSS):
Diversity and interdependence of Life
NGSS:
Develop and use models
Planning and carrying out investigations
Analyze and interpret data
Constructing explanations and designing solutions
Obtaining, evaluating and communicating information
Cause and effect
Scale, proportion, and quantity
Stability and Change
OLS:
Designing Technological/Engineering Solutions Using Science Concept
68
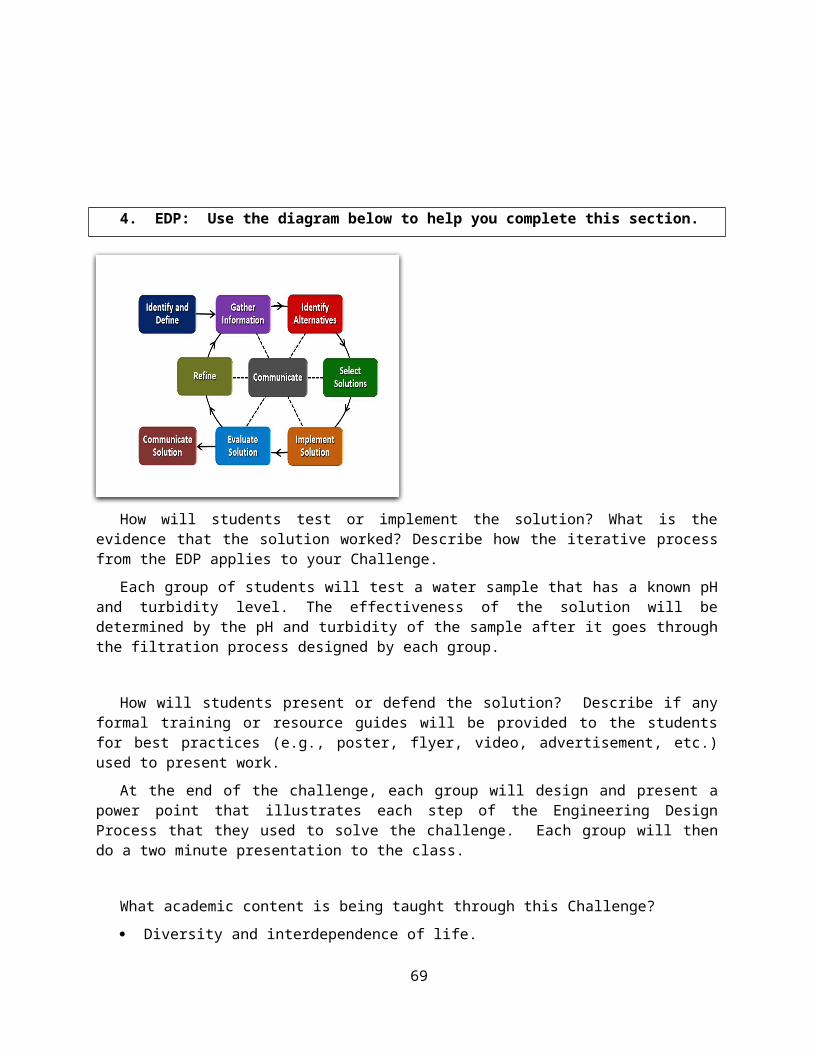
Demonstrating Knowledge
Interpreting and Communicating Science Concepts
Recalling Accurate Science
Materials: (Link Handouts, Power Points, Resources, Websites, Supplies)
What you need for the lab
1 sheet of 60 x 90 cm corflute cut into two 30 x 90 cm pieces – recycled real estate ‘for sale’ signs are ideal or cover heavy cardboard with a layer of plastic
*or a 8” x 10” board cut into 18 inch long sections also works
Wooden blocks to prop up one end of the corflute/cardboard or boards
Soil to cover the corflute/cardboard
2 watering cans to simulate rain
Water
Buckets or small bins to catch the water and eroded soil
Vegetation (grass clippings, small branches clipped from shrubs) or outdoor carpet samples from a local hardware store
Stopwatch
Camera (optional)
Pollution: small pieces of paper, tea leaves, coffee grounds, vegetable oil, bread crumbs, etc to represent pollution.
Copies of the lab
Teacher Advance Preparation:
Make copies of the lab
Locate materials for each lab group
Activity Procedures:
69
Assign student lab teams.
Handout the lab worksheet
Have students read the introduction/background and highlight the key statements and vocabulary (this will help them answer the analysis questions at the end)
Discuss the introduction with the students and review lab procedures
Demonstrate how the lab will be setup and the data will be collected.
Introduce the topic by having the student read the introduction/backerial.
Review lab procedures with the students and demonstrate the lab setup.
Laboratory worksheets will be collected and data reviewed.
Students will complete the application questions located at the end of the lab.
Differentiation: Describe how you modified parts of the Lesson to support the needs of different learners.
Refer to Activity Template for details.
Reflection: Reflect upon the successes and shortcomings of the lesson.
Name: Nancy Schreder-Vossen
Contact Info:[email protected] Date:07-20-16
70
Formative Assessments: Link the items in the Activities that will be used as formative assessments.
Summative Assessments: These are optional; there may be summative assessments at the end of a set of Activities or only at the end of the entire Unit.

Lesson Title : Water Pollution Unit #:
1
Lesson #:
2
Activity #:
4Activity Title: How can water be cleaned?
Estimated Lesson Duration:
4 Class periods
Estimated Activity Duration:
2 Class periods
Setting:
Classroom
Activity Objectives:
Understand how human actions impact the natural environment
Describe the methods used to clean water
Identify different sources of pollution
Describe methods of that could be used to reduce or eliminate pollution
Design a model that can be used to filter water
Activity Guiding Questions:
What is the difference between clean and polluted water?
What is a pollutant?
What are the different types of pollutants?
Where do pollutants come from?
How can pollutants be removed from the water?
Is there a mechanism in nature that “cleans” water?
71

Next Generation Science Standards (NGSS)
Science and Engineering Practices (Check all that apply)
Crosscutting Concepts (Check all that apply)
☐ Asking questions (for science) and defining problems (for engineering)
☐ Patterns
☒ Developing and using models ☒ Cause and effect
☒ Planning and carrying out investigations ☒ Scale, proportion, and quantity
☒ Analyzing and interpreting data ☒ Systems and system models
☐ Using mathematics and computational thinking ☐ Energy and matter: Flows, cycles, and conservation
☒ Constructing explanations (for science) and designing solutions (for engineering)
☐ Structure and function.
☒ Engaging in argument from evidence ☐ Stability and change.
☒ Obtaining, evaluating, and communicating information
Ohio’s Learning Standards for Science (OLS)
Expectations for Learning – Cognitive Demands (Check all that apply)
☒ Designing Technological/Engineering Solutions Using Science concepts (T)
☒ Demonstrating Science Knowledge (D)
☒ Interpreting and Communicating Science Concepts ®
☒ Recalling Accurate Science ®
Ohio’s Learning Standards for Math (OLS) and/or
Common Core State Standards – Mathematics (CCSS)
Standards for Mathematical Practice (Check all that apply)
☐ Make sense of problems and persevere in solving them
☐ Use appropriate tools strategically
☐ Reason abstractly and quantitatively ☐ Attend to precision
☐ Construct viable arguments and critique the reasoning of others
☐ Look for and make use of structure
72

Ohio’s Learning Standards for Math (OLS) and/or
Common Core State Standards – Mathematics (CCSS)
Standards for Mathematical Practice (Check all that apply)
☐ Model with mathematics ☐ Look for and express regularity in repeated reasoning
Unit Academic Standards (NGSS, OLS and/or CCSS):
NGSS
Develop and use models
Planning and carrying out investigations
Analyze and interpret data
Constructing explanations and designing solutions
Obtaining, evaluating and communicating information
OLS:
Designing Technological/Engineering Solutions Using Science Concept
Demonstrating Knowledge
Interpreting and Communicating Science Concepts
Materials: (Link Handouts, Power Points, Resources, Websites, Supplies)
For each group:
• 500 ml beaker that contains 300 ml of prepared waste water (see below)
• Handout: What is in the water?
• The Engineering Design Process student worksheet
73

Teacher Advance Preparation:
Make copies of “What is in the water” (1 per student)
Make copies of the worksheet “The Engineering Design Process” for the challenge
For each group, prepare a beaker of “waste water”
1) 300 ml of tap water
2) A small handful of gravel – equal amounts in all containers
3) 2 ml (or 1 Tbs) of cooking oil
4) 2 ml (or 1 Tbs) of dish soap
5) Small bread crumbs (equal amounts in all containers)
6) 2ml (or 1 Tbs) of vinegar
Activity Procedures:
Directions:
1) Hand out the “What is in the Water” worksheet to review the topic of water pollution. Allow the students to work in teams to complete it for 5 minutes.
2) Complete the table using the responses from different groups.
3) Lead the discussion to introduce the challenge: How can water get cleaned?
4) Introduce the worksheets titled “The Engineering Design Process” and explain how each student will be responsible for keeping track of how his/her team used the process to complete the challenge.
Engineering Design Process Worksheet – filled out by each group member and reviewed by the instructor to ensure that groups and individuals within the group are completing all components of the engineering design process.
74
Formative Assessments: Link the items in the Activities that will be used as formative assessments.
Summative Assessments: These are optional; there may be summative assessments at the end of a set of Activities or only at the end of the entire Unit.

Students will be assessed using the Challenge Rubric, which includes components from the engineering design process worksheet.
Differentiation: Describe how you modified parts of the Lesson to support the needs of different learners.
Refer to Activity Template for details.
Reflection: Reflect upon the successes and shortcomings of the lesson.
75