team effectiveness: a correlative study of leadership influence in the manufacturing ... · ·...
TRANSCRIPT

Team Effectiveness: a correlative study of leadership influence in the manufacturing environment
Servant Leadership Research Roundtable – May 2008
Kenneth E. Rauch Indiana Wesleyan University
The correlative study within this article considered the association between servant
leadership and team effectiveness in the manufacturing sector of business and industry. The
quantitative study had a sample size of 3896 at 28 manufacturing locations within the same
organization. The Spearman rank correlation was used to determine the direction and
significance of the association between the independent variable of servant leadership and
dependent variables of manufacturing team effectiveness.
The exploratory data analysis revealed significant correlation between servant leadership
and a reduction in both absenteeism (H1) and attrition (H2) rates. As a result, an exponential
curve was created and absenteeism was shown to decrease roughly 41.1% for each increase
of one unit within the five unit scale of servant leadership, while attrition tended to decrease
roughly 22.4% for each increase of one unit in servant leadership.
The implications related to these findings are significant in the manufacturing environment
as business and industry struggle with increased economic growth, shortage of skilled labor,
and employee attrition. It is hoped that this research study inspires additional empirical
research into the potential value of servant leadership in the industrial workplace.
In a business climate that features shared technology, instant communication, and worldwide
challenges, the presence of effective teams represents competitive advantage, especially in industrial
manufacturing settings. Within the contemporary search for understanding of what facilitates team
effectiveness, plant-based case-study strategies are becoming a widely used method and help reduce
the gap between theory and practice (Hill, Nicholson & Westbrook, 1999). As empirical research
efforts continue, leadership influence may prove to be a significant component of team effectiveness.
Background

2 Team Effectiveness: a correlative study of leadership influence in the manufacturing environment
Early leadership studies dealt with the individuality of the leader because many researchers
believed that the key to unlocking the secrets of leadership was held in an individual leader’s inherent
and distinctive talents (Bird, 1940). The notion was that, in times of need, a Great Man (leader) would
reveal himself. Subsequent studies focused on identification of the unique traits that distinguished
leaders from those who were not leaders. Failure to find universal leadership traits led researchers to
posit that leaders adopt appropriate leadership behaviors in relation to those with whom they serve.
Researchers then speculated that the leader's ability to lead is contingent upon various situational
factors.
As the 20th century ended, leaders began to engage employees with vision and passion by
injecting enthusiasm and energy, all in an effort to transform their follower (Burns, 1978; Coleman &
La Roque, 1990; Kirby, Paradise, & King, 1992). Mutual influence of leader and follower in facilitating
performance and organizational effectiveness is a common theme that permeates current leadership
research efforts. Shared or distributed leadership styles allows the employee to take initiative,
embrace risk, stimulate innovation, and cope with uncertainty (O’Toole& Lawler, 2006). An emerging
theory in this sphere of leadership study is servant leadership. Handy (1995), in his The Age of
Paradox, differentiated the old-fashioned "follow me" form of leadership from what he called
distributed leadership. He suggested that distributed leadership is present in the stewardship of all
participants in servant leadership. An essential component of this mindset asserts that leaders serve
the people they lead, thereby implying that they are an end in themselves rather than a means to an
organizational purpose (Greenleaf, 1977). Servant leadership, however, differs from other leadership
approaches by avoiding the common top-down command and control style, instead emphasizing
partnership, trust, empathy, and the ethical use of power. The objective is to enhance the growth of
individuals, increase teamwork, and expand personal involvement in the organization.
As interest in the historical importance of the leader has transitioned to consideration of the
potential of followers, research interest in servant leadership theory has increased. Leading authors of
leadership and organizational development have continued to research and discuss the effects of
servant leadership on employee satisfaction and organizational effectiveness (Blanchard, 2007;
Depree, 1989; Senge, 1990). At the same time, a number of companies have adopted servant
leadership as their corporate identity. In Focus on Leadership: Servant Leadership for the 21st
Century, Spears (2002) identified the following companies that have incorporated servant leadership
into their corporate philosophy: The Toro Company (Minneapolis, MN), Synovus Financial Corporation
(Columbus, GA), Southwest Airlines (Dallas, TX), The Men’s Wearhouse (Fremont, CA), and TD
Industries (Dallas TX) (p. 9). Servant leadership is an emerging leadership theory that exhibits promise
in revitalizing and energizing employees as business and industry brace for the challenges of the 21st
century and beyond. Consequently, servant leadership is receiving increased consideration and
mounting acceptance in the corporate world.

Servent Leadership Roundtable – May 2008 3
Significance of Research
The significance of providing empirical research related to leadership and team effectiveness
is important in today’s business environment. Recent studies have examined the importance of the
development of employee influence in the leadership process (Bryant, 2003; Hallinger & Kantamara,
2000). It has been reported that the majority of workers today are not fully engaged and this
engagement gap is costing U.S. businesses 300 billion dollars per year in lost productivity (Bates,
2004; Johnson, 2004; Kowalski, 2003). In many organizations, the followers’ desire for inclusive
leadership and follower involvement is linked to a relationship that appears to be damaged. Deal and
Kennedy in their book, The New Corporate Cultures (2000), suggested that the balanced image of a
corporation as the servant of many constituencies has shifted to a single focus on shareholders and
short-term financial performance. This shift has undermined an unspoken, long-standing belief in the
shared interest between employer and employee. This widely shared principle carried the promise that
if employees worked to the best of their abilities, a company would provide a positive working
environment, job security, and reasonable compensation.
Based on this damaged relationship, leadership research has an increasing interest in the
study of the involvement of followers within the leadership dynamic. Employee performance affects
organizational achievement, and leaders of organizations influence follower achievement (Northouse,
2004; Yukl, 2002). Research that increases understanding of leader influence on follower
achievement is significant. This study acknowledged the follower-focused nature of servant leadership
and joined other research efforts in confirming the possible correlation or lack thereof between
servant leadership and the effectiveness of organizations (Gibson & Vermeulen, 2003; Irving, 2005;
LaFasto & Larson, 2001; Naquin & Tynan, 2003).
The study also attempted to offset the unbalanced focus of prior empirical inquiry into
servant leadership theory that has favored not-for-profit (NFP) organizations. In the past, scholars
focused primarily on spiritual and educational organizations (Dillman, 2004; Drury, 2004; Hebert,
2003; Hoshaw, 1985; Iken, 2005; Irving, 2005; Sullivan, 1994; Van Kuik, 1998; Walker, 1997;
Woodward, 1988). This inclination toward the NFP sector could lead some researchers to conclude
that servant leadership theory assessment is somewhat contextually constrained. Thus, the study has
the potential to generate increased interest in servant leadership and team effectiveness research in
business and industry.
Nature of the Study
This study was designed to provide data related to servant leadership and team effectiveness
variables inside the manufacturing environment and represent the findings in a correlative format. The
Published by the School of Global Leadership & Entrepreneurship, Regent University

4 Team Effectiveness: a correlative study of leadership influence in the manufacturing environment
context of the study is contained within the manufacturing segment of business and industry in the
Midwestern U.S.
Team Effectiveness Measurements
Based on the widespread use within the manufacturing environment, the Balanced Scorecard
Method / Key Performance Indicators were used in the study when selecting measures of
effectiveness (Atkinson & Brown, 2001). Kaplan and Norton (1992) first introduced the Balanced
Scorecard concept in their Harvard Business Review article, “The Balance Scorecard – Measures that
Drive Performance.” The scorecard provides managers with a comprehensive framework that
translates a company’s strategic objectives into a coherent set of performance measures. The
company featured in this study, while utilizing the Balanced Scorecard Method (BSC) concept,
selected measures of effectiveness from the Key Performance Indicator (KPI) guidelines in the area of
human resources.
Likert and Pyle (1971) were among the earliest proponents of human resource-related
accounting measures and listed the following benefits:
To furnish cost value information for making management decisions to attain cost effective
organizational objectives,
To allow management personnel to monitor effectively the use of human resources,
To provide a sound effective basis of asset control, and
To aid in the development of management principles by classifying the financial
consequences of various practices.
In 1991, the Swedish government proposed a legal obligation for organizations with more
than 100 employees to provide an account of personnel costs such as attrition, absenteeism, and
training in their annual reports (Grojer & Johanson, 1998). The proposal was based on the opinion
that human resource investment translated to market advantage and profitability. The study
measured the effectiveness of each sample group by gathering data related to attrition and
absenteeism. To determine effectiveness levels, these measures were compared to established
manufacturing industry averages.
Selection of specific BSC / KPI Measurables for the Study
A review of the literature shows that traditional performance measurement systems (based
on traditional financial measures) have failed to identify and integrate the critical factors that
contribute to business excellence (Eccles, 1991; Fisher, 1992; Kaplan, 1984; Maskell, 1992).
Authors have posited that examinations of employee-driven measures are important and should be a
focal point of a leader’s attention (Porter & Stern, 2001). The skills of employees are company assets
just like tangible assets therefore, employees with fundamental skills are an important source when
organizations seek to raise capabilities and profits (Porter, 1985). In studies focusing on
manufacturing organizations, effective teams report benefits that include increased productivity, lower
attrition rates, and increased quality while maintaining a safe work environment (Manz & Sims, 1987).

Servent Leadership Roundtable – May 2008 5
The BCS / KPI performance measurable system provided the framework for the study’s
dependent variables. The studies performance indicators were taken from typical manufacturing BSC
/ KPI measurements and included: absenteeism and attrition. The study recognized that correlative
findings involving servant leadership and team effectiveness within business and industry that did not
feature the BSC / KPI generated goals would be rendered inconsequential and insignificant within the
manufacturing leadership community. Much of the development of leadership theory within the
manufacturing segment is predicated on the belief in the interplay between leadership and goal
achievement. The dependent variables of attrition and absenteeism provide a would-be competitive
advantage in most manufacturing environments. The value and relevancy of these effectiveness
measures are examined below.
Attrition
Firms that focus on their specific human resource advantages by attracting and retaining
highly skilled human capital increase their competitive potential in markets (Chadee & Kumar, 2001).
Dressler (2005) used a web-based survey to gather data regarding the cost of attrition. The findings
placed the total cost of each occurance at $5,700 for workers with low-complexity jobs and almost
$10,000 for high-complexity jobs. The effect on profitability is evident.
Absenteeism
Absenteeism is viewed as a measure of team effectiveness in most countries (Goodman &
Pennings, 1977). Literature investigating the causes of absenteeism has identified management style
as an important factor (Nicholson, 1977; Steers & Rhoads, 1978). In the competitive manufacturing
environment, absences can have considerable economic consequences for individual organizations.
At a time when an ever increasing number of employees telecommute or work in virtual offices,
manufacturing still relies on attendance at each manufacturing facility to meet daily production
requirements. Reduction in absenteeism provides a potential competitive advantage in most
manufacturing environments.
Servant Leadership Measurement
Servant leadership is measured in the study by using the Organizational Leadership
Assessment (OLA) instrument (Laub, 1999).
Research Questions
The research study was designed to answer the research question: To what extent
are established manufacturing performance measurables correlated with the presence of servant
leadership within the organization? Two hypotheses were tested to determine correlative relationships
between the independent variable of servant leadership and team effectiveness dependent variables.
Hypotheses
Published by the School of Global Leadership & Entrepreneurship, Regent University

6 Team Effectiveness: a correlative study of leadership influence in the manufacturing environment
Hypothesis 1
H1º¹: No significant relationship between employee absenteeism and servant leadership as
measured by the OLA.
H1ª¹: Significant relationship between employee absenteeism and servant leadership as
measured by the OLA.
Hypothesis 2
H2º²: No significant relationship between employee attrition and servant leadership as
measured by the OLA.
H2ª²: Significant relationship between employee attrition and servant leadership as
measured by the OLA.
The following pages review the data collection process and response rates, and presents
graphic displays and descriptive statistics for each variable
Population
A Midwest-based automotive parts manufacturing organization agreed to participate
in the study, allowing for anonymous representation of their company, all individual sites, and the
participants. Twenty-eight individual manufacturing facilities participated. A total of 4557 subjects
were enlisted for the study, and 4052 OLAs were completed and returned. The participation from the
28 sample sites produced a high percentage of completed OLA’s (Table 1).
Table 1.
Individual Sample Population Data
Location Population Sample %
“N”
_______________________________________________________________
A
215 199 92.5 B
175 162 92.6
C 125 111
88.8 D 255 218
85.4
E 111 88
79.3
F 162 129
79.6
G 115 101
87.8

Servent Leadership Roundtable – May 2008 7
I 199 188
94.5
J 215 190
88.4
K 188 178
94.7
L 135 115
85.2
M 201 182
90.5
N 195 181
92.8
O 214 201
93.9
P 102 99
97.1
Q 218 204
93.6
R 177 149
84.2
S 165 139
84.2
T 115 104
90.4
U 156 122
78.2
V 115 105
91.3
W 175 166
94.9
X 189 175
92.6
Y 155 128
82.6
Z 187 147
78.6
Published by the School of Global Leadership & Entrepreneurship, Regent University
8 Team Effectiveness: a correlative study of leadership influence in the manufacturing environment
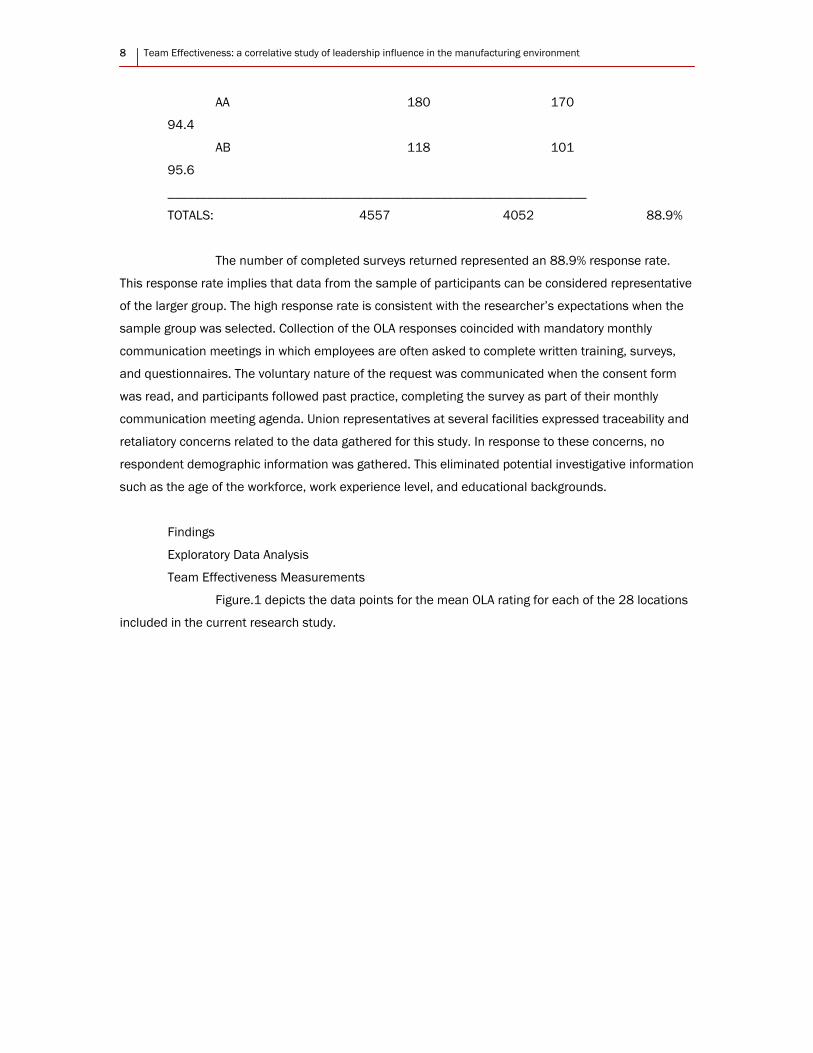
AA 180 170
94.4
AB 118 101
95.6
_______________________________________________________________
TOTALS: 4557 4052 88.9%
The number of completed surveys returned represented an 88.9% response rate.
This response rate implies that data from the sample of participants can be considered representative
of the larger group. The high response rate is consistent with the researcher’s expectations when the
sample group was selected. Collection of the OLA responses coincided with mandatory monthly
communication meetings in which employees are often asked to complete written training, surveys,
and questionnaires. The voluntary nature of the request was communicated when the consent form
was read, and participants followed past practice, completing the survey as part of their monthly
communication meeting agenda. Union representatives at several facilities expressed traceability and
retaliatory concerns related to the data gathered for this study. In response to these concerns, no
respondent demographic information was gathered. This eliminated potential investigative information
such as the age of the workforce, work experience level, and educational backgrounds.
Findings
Exploratory Data Analysis
Team Effectiveness Measurements
Figure.1 depicts the data points for the mean OLA rating for each of the 28 locations
included in the current research study.

Servent Leadership Roundtable – May 2008 9
2.00 2.50 3.00 3.50 4.00
OLA
0
2
4
6
Num
ber o
f Loc
atio
ns
Figure 1. Histogram of Servant Leadership Levels (OLA)
The overall OLA measurement average was 2.94. This placed the combined average for the
28 plants at an “organization two” on the OLA rating scale. The 28 sites’ average on the OLA scale
positions the organization as one that exhibits “poor organizational health” with regard to servant
leadership. Although at the upper end of the “organization two” scale, the 2.94 score places this
organization at the lower end of the Likert scale (1-5) of servant leadership measures. Thirteen of the
28 sites fell within the range of 2.25 and 2.75 as represented by the main peak of the histogram in
Figure 1. A smaller grouping of locations was in the 3.2 to 3.7 range.
The team effectiveness measures for each facility were provided by the plant’s human
resource manager. These measurements were common to each facility and reflect the same formula
for calculation and are standard measures within business and industry. The totals represent an
average of the first four months of 2007. The Spearman rank correlation was used to determine the
direction and significance of the association between the independent variable of servant leadership
and each of the two dependent variables of team effectiveness. The SPSS 15.0 software was used for
correlative computations, descriptive statistics, and all analyses for hypothesis tests.
Absenteeism
The Bureau of Labor Statistics defines absenteeism as the ratio of workers with absences to
total full-time wage and salary employment. Absences are defined as instances when persons who
Published by the School of Global Leadership & Entrepreneurship, Regent University

10 Team Effectiveness: a correlative study of leadership influence in the manufacturing environment
usually work 35 or more hours per week worked less than 35 hours during the reference week for one
of the following reasons: own illness, injury, or medical problems; childcare problems; other family or
personal obligations; civic or military duty; and maternity or paternity leave.
Figures 2 and 3 highlight the data that represent the individual absenteeism rates for all
research sites.
2.00 4.00 6.00 8.00 10.00
H1
2
4
6
8
Num
ber o
f Loc
atio
ns
Figure 2. Histogram of Absenteeism Rates (H1)
The histogram demonstrated a cluster of data points in the 2.0% - 4.0% range. The overall
appearance was a left-skewed distribution. Several groups of distant data points created a somewhat
bimodal appearance.
A scatterplot (Figure 3) was created to offer a visual display of the relationship between
absenteeism and the OLA for the 28 locations surveyed. There appears to be a moderately strong
negative correlation between the OLA and H1. That is, as the servant leadership increases,
absenteeism rates generally decline. For example, locations with an OLA of 2.5 had absenteeism rates
of 3% to 10%, while locations with an OLA of 4 had absenteeism rates of only 2% to 4%.

Servent Leadership Roundtable – May 2008 11
2.00 2.50 3.00 3.50 4.00
OLA
2.00
4.00
6.00
8.00
10.00
H1
Figure 3. Scatterplot of Absenteeism Rates (H1) versus OLA
Attrition
Attrition rate (H2) is defined as the number of total separations during the period of
measure divided by the average number of employees who worked or received pay during the same
period.
Figures 4.and 5 represent the attrition rate for the research sites.
Published by the School of Global Leadership & Entrepreneurship, Regent University

12 Team Effectiveness: a correlative study of leadership influence in the manufacturing environment
2.00 3.00 4.00 5.00
H2
2
4
6
8
Num
er o
f Loc
atio
ns
Figure 4. Histogram of Attrition Rates (H2)
The histogram demonstrated a bimodal distribution main cluster of data points in the
3.0% - 4.0% range and a smaller group from roughly 1.6% to 2.3%, representing the second largest
individual grouping of data points. While this attrition rate appears quite high, given it occurs at
locations with low OLA scores, it is not overly surprising.
A scatterplot (Figure 5) was created to offer a visual display of the relationship between the
OLA and the attrition rate for the 28 locations surveyed. It appears that as servant leadership
increases, the attrition rates generally exhibit a decline. Seven locations with a strong OLA measure
between 3.5 and 4.4 had attrition rates below the industry average. In contrast, 7 of 10 sites that
experienced a poor OLA measurement (between 1.5 and 2.5) exhibited attrition rates above the
manufacturing industry averages.

Servent Leadership Roundtable – May 2008 13
2.00 2.50 3.00 3.50 4.00
OLA
2.00
3.00
4.00
5.00
H2
Figure 5. Scatterplot of Attrition Rates (H2) versus OLA
The attrition measurements in the preceding figure tended to indicate a moderately
strong negative correlation between the OLA and the H2 dependent variable of attrition.
Absenteeism (H1)
The H1 null hypothesis was: no significant relationship between employee
absenteeism and servant leadership as measured by the OLA. Table 2 confirms a moderately strong
negative association between the OLA and H1 with a Spearman’s rank correlation of -.599. The p
value of .001 provides strong evidence for the alternate hypothesis: a relationship between servant
leadership and the plant’s absenteeism rate.
Table 2
Spearman’s Rho 2-Tailed Correlation Coefficient for H1
OLA H1
Spearman'
s
rho
O
LA
Correlation
Coefficient
1.0
00
-
.599(**)
. .00
Published by the School of Global Leadership & Entrepreneurship, Regent University

14 Team Effectiveness: a correlative study of leadership influence in the manufacturing environment
Sig. (2-tailed) 1
N 28 28
H
1
Correlation
Coefficient
-
.599(**)
1.0
00
Sig. (2-tailed)
.00
1 .
N 28 28
** Correlation is significant at the 0.01 level (2-tailed).
Attrition (H2)
The H2 null hypothesis was: no significant relationship between employee attrition
and servant leadership as measured by the OLA. Table 3 confirms the association between the OLA
and H2.
Table 3
Spearman’s Rho 2-Tailed Correlation Coefficient for H2
OLA H2
Spearman's
rho
O
LA
Correlation
Coefficient
1.00
0
-
.547(**)
Sig. (2-tailed) . .003
N 28 28
H
2
Correlation
Coefficient
-
.547(**)
1.00
0
Sig. (2-tailed) .003 .
N 28 28
** Correlation is significant at the 0.01 level (2-tailed).

Servent Leadership Roundtable – May 2008 15
Spearman’s rank correlation of -.547 indicates a moderately strong negative
correlation, and the p value of .003 is significant with regard to the attrition hypothesis. Thus,
statistical evidence of a relationship between servant leadership and attrition rates was established.
The evidence relating servant leadership to both H1 and H2 was extremely strong, being significant
not only at the .05 level but also at the .01 level. The alternative H2 hypothesis is supported within
this sample population. In summary, it is concluded that H1 and H2 demonstrate a moderately strong
negative correlative value with regard to the OLA.
Modeling Absenteeism and Attrition as Functions of Servant Leadership
Having established a statistically significant relationship between both absenteeism
(H1) and attrition (H2) and servant leadership (OLA), it is reasonable to model each of these
performance measures as functions of servant leadership. The development of equations to represent
how H1 and H2 decrease with increasing levels of servant leadership is needed to increase the
understanding of the established correlation. A linear equation provides the simplest model but does
not necessarily match the data’s curvature seen in the scatterplots. Thus exponential models were
also explored, representing a quantity starting at a fixed amount then decreasing by a certain
percentage with each unit increase of servant leadership (OLA).
Based on the Spearman rank measure that revealed significant correlation between
OLA and H1, a linear regression line and an exponential curve were created in Figure 6 and the
corresponding numerical output provided in Table 4.
Published by the School of Global Leadership & Entrepreneurship, Regent University

16 Team Effectiveness: a correlative study of leadership influence in the manufacturing environment
OLA
4.504.003.503.002.502.001.50
12.00
10.00
8.00
6.00
4.00
2.00
0.00
H1
ExponentialLinearObserved
Figure 6. Exponential and Linear Regression Curve for H1.
Table 4
Linear and Exponential Curve for H1 versus OLA
Dependent Variable: H1
Independent Variable: OLA
Equa
tion
Model Summary Parameter
Estimates
R
Square F
f1
d
f2
S
ig.
Co
nstant
b
1
Linea
r
.297 1
1.003
2
6
.
003
10.
907
-
2.178
Expo
nential
.327 1
2.606
2
6
.
001
18.
345
-
.530

Servent Leadership Roundtable – May 2008 17
The parameter estimates contained in the regression output provide the following
models for H1 versus OLA:
Best linear model: H1 = 10.91 – 2.18 OLA
Best Exponential model: H1 = 18.35e-.53OLA
e is the base of the natural logarithm, e≈2.18
The exponential model provides a better visual fit of the data (compared to the linear
model) as it captures the upward curve seen in the scatterplot in Figure 3. Furthermore the higher R2
value (.327 versus .297) indicates that the exponential model will have smaller errors when using OLA
to estimate H1. (An R2 value near 1 indicates that the model captures nearly all the variation in the
dependent variable, while R2 near 0 indicates that the model provides little or no useful information in
estimating the dependent variable value.) It is useful to observe that the exponential model can be
rewritten as H1=18.35 (.589)OLA (since e-.53 = .589), implying that the absentee rate is multiplied by
.589 (=58.9%) for each increase of one Likert scale unit of OLA. In other words, absenteeism tends to
decrease roughly 41.1% for each increase of one unit in servant leadership.
Based on the significant correlation of H2 (-.547), a linear regression line and an
exponential curve were created for H2 and represented by Figure 7 and the regression output is
displayed in Table 5.
Published by the School of Global Leadership & Entrepreneurship, Regent University

18 Team Effectiveness: a correlative study of leadership influence in the manufacturing environment
Figure 7. Exponential and Linear Regression Curve for H2
OLA4.504.003.503.002.502.001.50
6.00
5.00
4.00
3.00
2.00
1.00
H2
ExponentialLinearObserved
Table 5.Linear and Exponential Curve Data for H2 versus OLA
Dependent Variable: H2
Independent Variable: OLA
Equa
tion
Model Summary
Parameter
Estimates
R
Square F
df
1
d
f2
S
ig.
Consta
nt 1
Linea
r
.
326
1
2.578 1
2
6
.
002 5.675
.826
Expo
nential
.
314
1
1.911 1
2
6
.
002 6.574
.253
Servent Leadership Roundtable – May 2008 19
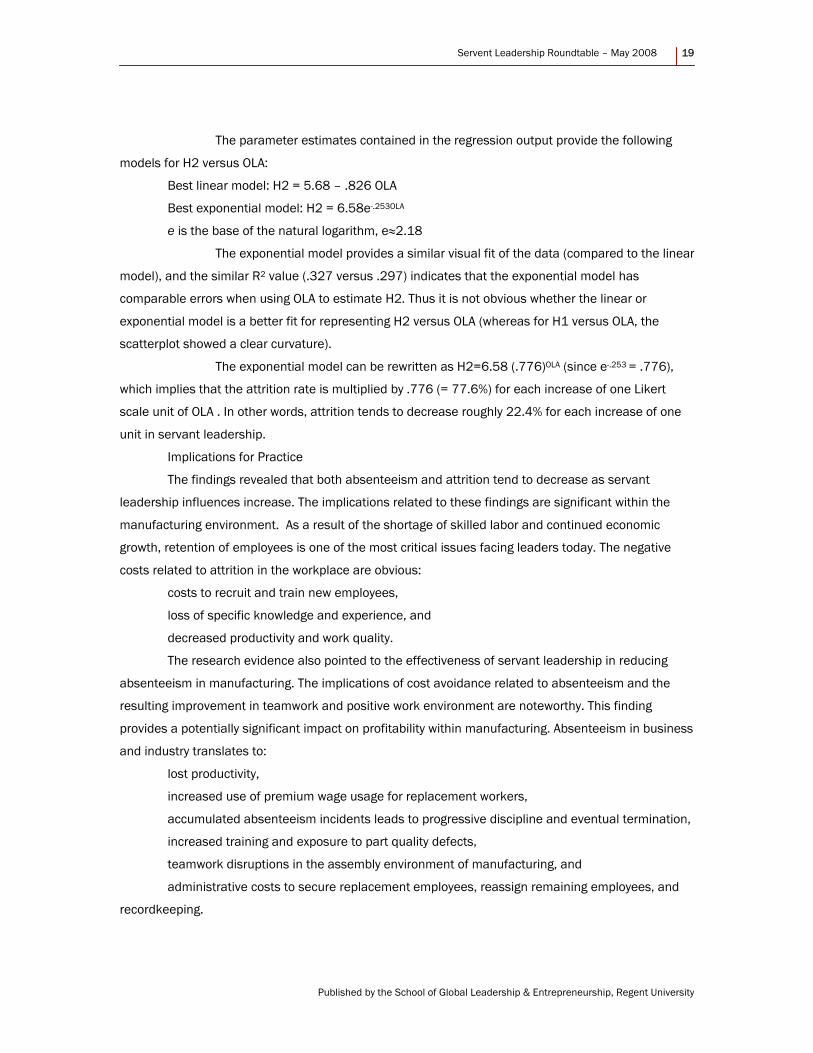
The parameter estimates contained in the regression output provide the following
models for H2 versus OLA:
Best linear model: H2 = 5.68 – .826 OLA
Best exponential model: H2 = 6.58e-.253OLA
e is the base of the natural logarithm, e≈2.18
The exponential model provides a similar visual fit of the data (compared to the linear
model), and the similar R2 value (.327 versus .297) indicates that the exponential model has
comparable errors when using OLA to estimate H2. Thus it is not obvious whether the linear or
exponential model is a better fit for representing H2 versus OLA (whereas for H1 versus OLA, the
scatterplot showed a clear curvature).
The exponential model can be rewritten as H2=6.58 (.776)OLA (since e-.253 = .776),
which implies that the attrition rate is multiplied by .776 (= 77.6%) for each increase of one Likert
scale unit of OLA . In other words, attrition tends to decrease roughly 22.4% for each increase of one
unit in servant leadership.
Implications for Practice
The findings revealed that both absenteeism and attrition tend to decrease as servant
leadership influences increase. The implications related to these findings are significant within the
manufacturing environment. As a result of the shortage of skilled labor and continued economic
growth, retention of employees is one of the most critical issues facing leaders today. The negative
costs related to attrition in the workplace are obvious:
costs to recruit and train new employees,
loss of specific knowledge and experience, and
decreased productivity and work quality.
The research evidence also pointed to the effectiveness of servant leadership in reducing
absenteeism in manufacturing. The implications of cost avoidance related to absenteeism and the
resulting improvement in teamwork and positive work environment are noteworthy. This finding
provides a potentially significant impact on profitability within manufacturing. Absenteeism in business
and industry translates to:
lost productivity,
increased use of premium wage usage for replacement workers,
accumulated absenteeism incidents leads to progressive discipline and eventual termination,
increased training and exposure to part quality defects,
teamwork disruptions in the assembly environment of manufacturing, and
administrative costs to secure replacement employees, reassign remaining employees, and
recordkeeping.
Published by the School of Global Leadership & Entrepreneurship, Regent University

20 Team Effectiveness: a correlative study of leadership influence in the manufacturing environment
As business and industry struggle with the shortage of skilled labor, economic growth, and
employee turnover, positive employee attendance patterns becomes more critical.
To leverage the potential advantages of servant leadership in reducing absenteeism and
attrition in the manufacturing environment, leaders may consider each of Laub’s 1999 servant
leadership subsets when interacting with employees:
Valuing people. Leaders approach others with an understanding that each person is valuable.
Value to others is demonstrated by active listening and careful consideration of what is being shared.
Developing people. Leaders understand the potential of others to grow as servants and
leaders. Special attention is given to create a learning environment.
Building Community. By working together and serving others, leaders model collaborative
behaviors that build a partnership for team achievement.
Displaying Authenticity. Leaders must understand that they have a number of things to learn
from followers. This openness leads to follower trust and increased involvement.
Providing Leadership. Leaders initiate action to serve the needs of the organization and team,
not for personal aspiration. Leaders serve and set direction as they communicate with the followers.
Sharing Leadership. Servant leadership recognizes the fact that leaders have positional
authority, but an important distinction is that power is shared in decision making and followers are
encouraged to act.
To facilitate this consideration of servant leadership, leadership training within the
manufacturing segment of business and industry must offer instruction in servant leadership.
Greenleaf observed that everyone is born with or is able to develop servant leadership characteristics.
As researchers continue to learn about servant leadership and further empirical studies are initiated,
more conclusions can be drawn as to its usefulness in leadership development.
Summary
In recent years there has been increased interest in the examination of servant leadership.
Respected leadership and management expert, Ken Blanchard, when addressing a group of leaders
stated, “The world is in desperate need of a different leadership role model . . . . We need servant
leaders, instead of self-serving leaders” (Oliver-Mendez, 2006). The overall interpretation of results
found that servant leadership had strong correlations with reductions in employee attrition and
absenteeism. The implications of cost avoidance related to reduced absenteeism and attrition and the
resulting improvement in teamwork and creation of a more positive work environment are noteworthy.
The findings related to this study provide preliminary evidence of the potential effectiveness of servant
leadership in the for-profit segment of business and therefore, warrant further examination.
Organizations that include servant leadership in their leadership practices may translate to
organizations that exhibit manufacturing efficiency and energized teams.
Virtually no one ever has the final word by conducting a study that provides a definitive
explanation to the research questions of the day. Conflicting opinions among researchers reflect the
fact that empirical research is a dynamic progression of discovery. It is a privilege to conduct original

Servent Leadership Roundtable – May 2008 21
empirical research, and hopefully, this embryonic study of business and industry adds a small brick to
the wall of knowledge of servant leadership and will inspire additional interest and research in this
promising leadership area.
Published by the School of Global Leadership & Entrepreneurship, Regent University

22 Team Effectiveness: a correlative study of leadership influence in the manufacturing environment
REFERENCES
Atkinson, H., & Brown, J. B. (2001). Rethinking performance measures: Assessing progress in
UK hotels. International Journal of Contemporary Hospitality Management, 13(3), 120-129. Retrieved
December 2, 2006, from Emerald Group Publishing database.
Bates, S. (2004). Getting engaged. HR Magazine, (49)2, 44-51.
Bird, C. (1940). Social psychology. New York: Appleton-Century.
Blanchard, K. (2007). Leading at a higher level. Upper Saddle River, NJ: Prentice Hall.
Bryant, M. (2003). Cross-cultural perspectives on school leadership: Lessons from Native
American interviews. In N. Bennett, M. Crawford, & M. Cartwright (Eds.), Effective Educational
Leadership (pp. 671-692). London: Paul Chapman.
Burns, J. M. (1978). Leadership. New York: Harper & Row.
Chadee, D., & Kumar, R. (2001). Sustaining the international competitive advantage of Asian
firms: A conceptual framework. Asia Pacific Journal of Management, 18(4), 461-481. Retrieved March
22, 2006, from LexisNexis Academic database.
Coleman, P., & LaRoque, L. (1990). Struggling to be 'good enough': Administrative practices
and school district ethos. New York: Falmer.
Deal, T. A., & Kennedy, A. A. (2000). The new corporate cultures: Revitalizing the workplace
after downsizing, mergers, and reengineering. Cambridge: Perseus.
Depree, M. (1989). Leadership is an art. New York: Dell.
Dillman, S. W. (2004). Leading in the land of Oz: Cross-cultural study of servant leadership in
Australia. ProQuest Digital Dissertations, 65 (06), 2273. (UMI No. AAT 3136215). Retrieved November
22, 2005, from ProQuest Digital Dissertations database.
Dressler, G. (2005). Human resource management. Upper Saddle River, NJ: Prentice Hall.
Drury, S. (2004). Employee perceptions of servant leadership: Comparisons by level and with
job satisfaction and organizational commitment. ProQuest Digital Dissertations, 65 (09), 3457. (UMI
No. AAT 3146724). Retrieved July 9, 2006, from ProQuest Digital Dissertations database.
Eccles, R. G. (1991). The performance measurement manifesto. Harvard Business Review,
69(1), 31-138. Retrieved July 9, 2006, from Expanded Academic ASAP database.
Fisher, J. (1992). Use of non-financial performance measures. Journal of Cost Management,
6(91), 31-38.
Gibson, C., & Vermeulen, F. (2003). A healthy divide: Subgroups as a stimulus for team
learning behavior. Administrative Science Quarterly, 48(2), 202-240. Retrieved May 9, 2006, from
Expanded Academic ASAP database.
Goodman, P. S., & Pennings, J. M. (1977). New perspectives on organizational effectiveness.
San Francisco: Jossey-Bass.
Greenleaf, R. K. (1977). Servant leadership. New York: Paulist.
Servent Leadership Roundtable – May 2008 23
Hallinger, P., & Kantamara, P. (2000). Educational change in Thailand: Opening a window
onto leadership as a cultural process. School Leadership & Management, 20(2), 189-205. Retrieved
March 27, 2006, from ProQuest Education Journal database.
Handy, C. (1995). The age of paradox. Boston: Harvard Business School Press.
Hoshaw, R. B. (1985). The development of a servant leadership style for the Central Baptist
College Board of Trustees. ProQuest Digital Dissertations, 46(12), 3551. (UMI No. AAT 8601748).
Retrieved July 9, 2006, from ProQuest Digital Dissertations database.
Hebert, S. C. (2003). The relationship of perceived servant leadership and job satisfaction
from the follower’s perspective. ProQuest Digital Dissertations, 64 (11), 4118. (UMI No. AAT
3112981). Retrieved August 9, 2006, from ProQuest Digital Dissertations database.
Hill, T., Nicholson, A., & Westbrook, R. (1999). Closing the gap: A polemic on plant based
research in operations management. International Journal of Operations & Production Management,
19(2), 139-156. Retrieved May 5, 2006, from Business Source Premier database.
Iken, S. L. (2005). Servant leadership in higher education: Exploring perceptions of educators
and staff employed in a university setting. ProQuest Digital Dissertations, 66(12), 4317. (UMI No. AAT
3199527). Retrieved March 27, 2006, from ProQuest Digital Dissertations database.
Irving, J. A. (2005). Servant leadership and the effectiveness of teams. ProQuest Digital
Dissertations, 66(04), p. 1421. (UMI No. AAT 3173207). Retrieved January 4, 2007, from ProQuest
Digital Dissertations database.
Johnson, G. (2004). Otherwise engaged. Training, 41(10).
Kaplan, R. S. (1984). Yesterday’s accounting undermines production. Harvard Business
Review, 64(4), 95-101. Retrieved September 6, 2006, from Business Source Premier database.
Kaplan, R. S., & Norton, D. P. (1992). The balanced scorecard – Measures that drive
performance, Harvard Business Review, 70(1), 71-79. Retrieved September 6, 2006, from Corporate
Resource Net database.
Kirby, P. C., Paradise, L. V., & King, M. I. (1992). Extraordinary leaders in education:
Understanding transformational leadership. Journal of Educational Research, 85(5), 303-311.
Retrieved December 11, 2006, from Academic Search Premier database
Kowalski, B. (2003). The engagement gap. Training, (40)4, 62.
LaFasto, F. M., & Larson, C. E. (2001). The team effectiveness questionnaire. Leadership:
Theory and practice. Thousand Oaks, CA: Sage.
Laub, J. A. (1999). Assessing the servant organization: Development of the Servant
Organizational Leadership Assessment (SOLA) instrument. ProQuest Digital Dissertations, 60(02),
308. (UMI No. AAT 9921922). Retrieved November 9, 2004, from ProQuest Digital Dissertations
database.
Published by the School of Global Leadership & Entrepreneurship, Regent University

24 Team Effectiveness: a correlative study of leadership influence in the manufacturing environment
Likert, R., & Pyle, W. C. (1971). Human resource accounting. Financial Analysts Journal,
27(1), 75-84. Retrieved December 12, 2006, from Business Source Premier database.
Manz, C. C., & Sims, H. P. (1987). Leading workers to lead themselves: The external
leadership of self-managing work teams. Administrative Science Quarterly, 32(1), 106-130. Retrieved
January 2, 2007, from Business Source Premier database.
Maskell, B. (1992). Performance measurement for world class manufacturing: A model for
American companies. Cambridge: Productivity Press.
Naquin, C. E., & Tynan, R. O. (2003). The team halo effect: Why teams are not blamed for
their failures. Journal of Applied Psychology, 88(2), 332-340. Retrieved March 16, 2006, from
Business Source Premier database.
Nicholson, N. (1977). Absence behavior and attendance motivation: A conceptual synthesis.
Journal of Management Studies, 14(3), 231-52. Retrieved March 16, 2006, from Business Source
Premier database.
Northouse, P. G. (2004). Leadership theory and practice (3rd ed.). Thousand Oaks, CA: Sage.
O’Toole, J., & Lawler, E. E. (2006). The new American workplace. New York: Palgrave
MacMillan.
Porter, M. E. (1985). Competitive advantage: Creating and sustaining superior performance.
New York: Free Press.
Porter, M. E., & Stern, S. (2001). Innovation location matters. MIT Sloan Management Review,
42(4), 28-36. Retrieved February 6, 2005, from Expanded Academic ASAP database.
Senge, P. (1990). The fifth discipline. New York: Dell.
Spears, L. C. (2002). Focus on leadership: Servant-leadership for the 21st century. New York:
Wiley.
Steers, R. M., & Rhodes, S. R. (1978). Major influences on employee attendance: A process
model. Journal of Applied Psychology, 63(4), 391-407.
Sullivan, D. R. (1994). Introduction to leadership theory and practice: A textbook for
community college students. ProQuest Digital Dissertations, 55(09), 2691. (UMI No. AAT 9501610).
Retrieved January 9, 2006, from ProQuest Digital Dissertations database.
Van Kuik, A. (1998). The meaning of servant leadership. ProQuest Digital Dissertations,
59(10), 3710. (UMI No. AAT NQ32029). Retrieved November 2, 2006, from ProQuest Digital
Dissertations database.
Walker, P. D. (1997). A case study of servant leadership. ProQuest Digital Dissertations,
58(03), p. 690. (UMI No. AAT 9728827). Retrieved September 1, 2006, from ProQuest Digital
Dissertations database.
Woodward, G. D. (1988). Two types of people-oriented leaders: An exploration of servant
leadership in the church educational system using Gestalt Therapy. ProQuest Digital Dissertations,
50(07), 1893. (UMI No. AAT 8924505). Retrieved April 22, 2006, from ProQuest Digital Dissertations
database.

Servent Leadership Roundtable – May 2008 25
Published by the School of Global Leadership & Entrepreneurship, Regent University
Yukl, G. (2002). Leadership in organizations (5th ed). Upper Saddle River, NJ: Prentice Hall.