teaching technology fellowship report “demonstration
TRANSCRIPT

Teaching Technology Fellowship Report
on
“Demonstration/Measurement System for Wireless Networks”
Robert Kinicki, Mark Claypool and Mingzhe Li
{rek,claypool,lmz}@cs.wpi.eduComputer Science Department
Worcester Polytechnic Institute
Worcester, MA, 01609
May 26, 2007
Abstract
This paper is the final report for a Teaching Technology Fellowship project conducted between July2005 and May 2007. This project involved integrating a wireless network measurement experimentinto the curriculum of CS4514, Computer Networks, during the WPI B06 undergraduate term. Afterpresenting goals and objectives, the chronology of preparation and execution of the project plan arediscussed. The paper assesses the results of the B06 wireless measurement experience against a B05offering of Computer Networks that included a wireless design assignment. A discussion of observationsabout the positive and negative aspects of this experimental pedagogical effort is provided as a summary.
1 Introduction
The WPI Computer Science Department currently offers only a single undergraduate course in ComputerNetworks, CS4514. Having been taught since the mid-1980’s, the CS4514 curriculum has continuallyevolved in response to rapid changes in the theory and practice of computer networking technologiesand architectures. For more than five years, the increasingly popular deployment of wireless networks inacademic, commercial and residential setting has significantly influenced the local networking interfaceused by people around the world to access the Internet. Reacting to this shift, networking textbookpublishers are scrambling to revise computer networking textbooks to add the details of wireless localarea networks (WLANs). Unfortunately, this trend leaves faculty teaching computer networking courseswith the challenge of developing new networking activities for students that include wireless concepts andissues. This Teaching Technology Fellowship project provides an opportunity to evaluate the impact ofadding a WLAN measurement assignment to the WPI CS4514 curriculum.
The Teaching Technology Fellowship (TTF) program, initiated by the Provost’s office and supportedby the WPI ATC staff, encourages WPI faculty to develop and utilize computer technology to improvethe delivery of WPI undergraduate courses. The two-year TTF timeline for an individual project roughlyconsists of a first year where Fellows learn about and employ computer technology to develop a pedagog-ical tool, module or component and a second year where the innovation from the first year is evaluated.
1

Throughout the Fellowship, the ATC staff provide instruction and advice about specific teaching tech-nologies and are available to support the Fellowship activities.
Beginning in 2004 through 2006 the Congestion Control (CC) research group within the WPI CSDepartment developed a set of measurement tools [3] to study WLAN performance [1, 2]. The initial ideaof this TTF project was to leverage these measurement tools to design and create a wireless measurementsystem that undergraduate CS students could use in a wireless network measurement lab as part of theCS4514 course. By providing a hands-on experience with WLANs and network performance measurement,the goal of this TTF project was to reinforce concepts seen by students in the course lectures and improvestudent knowledge of wireless networking concepts.
This paper serves as the final report for the TTF “Demonstration/Measurement System for WirelessNetworks” project that ran from the Summer 2005 until Spring 2007. The organization of the paper is asfollows. Section 2 discusses the original project objectives and briefly describes how objectives changed asthe project progressed. A thorough review of all the activities associated with the TTF project is given inSection 3. While Section 4 presents an assessment of the impact of the wireless measurement assignmenton the students, Section 5 analyzes other results that were observed. The report ends with conclusionsin Section 6.
2 Objectives
One practical objective of this study was to introduce a wireless network measurement experiment intothe WPI Computer Science undergraduate computer networks course, CS4514. The rationale for thismodification to the course curriculum is the belief that a hands-on opportunity to measure WLAN per-formance will reinforce concepts appearing in the lectures while providing the students with experience inconducting a networks measurement study. This implies including an assessment strategy to determineif this particular use of technology did in fact increase student learning. Namely:1. Did the students gain additional knowledge from the WLAN measurement experience?
A related question, given that developing and supporting the wireless measurement system requiresequipment and staff resources, is2. Do observed gains from the lab experiment warrant keeping this assignment permanently in the coursesyllabus?
The following is a list of knowledge gains by students that were originally considered possible fromthe WLAN measurement lab:
1. to better identify distinctions in the network protocol layers
2. to understand the need for a layered network architecture
3. to develop an appreciation for the complexity of network architectures
4. to increase knowledge of the details in the wireless MAC (Media Access Control) layer
5. to see interactions between concurrent wireless flows and their impact on performance
6. to be exposed to the challenges of conducting network performance measurements
The first three goals revolve around exposing the students to the layered network architecture. Whilethe students were asked to measure performance at multiple layers of the protocol stack, the succinct
2

packaging of the measurement directives tended to blur the layer boundaries. Hence, these objectiveswere really not a focus within the measurement lab.
Another component of the objectives includes providing an opportunity for students to acquire specificskills with respect to lab experiments that are valuable for future CS careers. The list of these skill setsincludes:
1. to prepare for and conduct a lab measurement experiment with directions and a specific goal
2. to work within a team
3. to learn about and employ the scientific method
4. to make design decisions on experimental methodology
To assist in exposing the students to background material associated with using scientific methodologyfor network performance, the plan was to create two videos on this topic. Students would have theopportunity to watch these videos on their own time before undertaking the laboratory sessions.
A prototype of the WLAN measurement assignment was given to graduate students in Spring 2006.The main feedback this prototype provided was on the considerable time it took the graduate students tocomplete the assignment and the ambiguity in some of the directions. Based upon this study, most of thefreedom associated with letting students make experimental design choices was sacrificed to streamlinethe lab assignment such that it could be reasonably completed by the undergraduate students in one weekof a seven-week WPI term.
3 Project Development
The initial funds provided by the Teaching Technology Fellowship were used to employ Mingzhe Li, aCS Ph.D. student who had the requisite experience with the wireless software and hardware. Minghzepulled together the set of measurement tools and traffic generators to be used by students for a WLANmeasurement lab on the WPI campus. The hardware for the WLAN configuration came from a previousNSF equipment grant1 and leftover PCs provided freely by the WPI CS Department.
The WLAN measurement lab configuration, consisting of the Fossil server, a wireless access point (AP)and two PCs running Windows XP with wireless cards, was placed in the Fossil Lab in the Fuller Labsbuilding. Since a few of the measurement components interact directly with the wireless network cardsand to simplify student offloading of measurement data from the PCs to CCC machines where Matlab isprovided, Mingzhe configured the WLAN measurement tools such that all student measurements involvedsending traffic downstream from the Fossil server through the AP to one of the two PCs. While the originalTTF proposal included using other wireless devices such as PDAs and wireless sensors in the configuration,these devices were not included due to concerns about the physical security of keeping these devices inthe Fossil Lab.
The following is a chronology of the activities associated with this Teaching Technology Fellowshipproject.
1Mark Claypool, Robert Kinicki, and Craig Wills. “Research Resources for Network Application Studies”, NSF CNS-0423362, August 2004 – July 2006.
3
1. During the summer of 2005 Mingzhe modified and improved the components of the WLAN mea-surement system.
Starting with wireless tools created by the CS CC research group to measure a variety of networkperformance metrics at multiple levels of the protocol stack2, Mingzhe spent several weeks duringthe 2005 summer upgrading these tools which were minimally documented and not intended forpublic use. Decisions were made concerning which tools could be used effectively within the WLANconfiguration in the Fossil Lab. While previous research measurements included a streaming videoserver with concurrent TCP and UDP download programs, the focus for the measurement lab wasreduced to analyzing the behavior of concurrent TCP and UDP downloads from the Fossil server tothe two PCs. However, the previous research strategy whereby one PC experiences good wirelessreception while the other PC struggles with bad wireless reception was retained in the studentmeasurement configuration. While bad reception is often related to the physical distance of thewireless node from the AP, the decision was made to remove the wireless antenna from one PC toforce fairly constant bad reception.
2. The Fossil Lab walls were painted.
Before the WPI networking staff would permit this project to operate an independently run AP atWPI, we agreed to buy a special metal additive, DefendAir Radio Shield by Force Field Wireless3,to mix with regular paint to reduce the ability of the radio signals to go through the Fossil Labwalls. While three coats of paint were applied to the Fossil Lab walls between A and B term 2005,the wall space occupied by the whiteboards and the two Fossil Lab doors could not be painted.Signal strength measurements in both the Fossil Lab and the adjoining ADP Lab indicated thatthe painting had reduced but had not completely eliminated radio signals going through the wallsof the Fossil Lab. The cost of the additive was paid out of the prior NSF equipment grant while theCS Department paid for the labor costs associated with painting the Fossil Lab walls.
3. The first of several meetings was held in August 2005 with ATC staff to discuss and plan assessmentand other aspects of the project .
The project team met with Jeanne Hubelbank and Amy Ricci in August 2005 to discuss the plans forthe WLAN measurement system and to consider techniques for assessing the impact of the hands-onlab experience with respect to our objectives. Note, this was the first of several useful meetingsheld throughout the two years of this investigation with the ATC support staff. One importantoutcome from this first meeting was the need to determine the background of the students enteringthe networks course. A survey that was historically filled out during the first CS4514 class wasmodified to include specific information about the students’ prior experience with and exposure tolocal area networks (LANs) and wireless LANs.
The decision was made that for the B05 offering of CS4514, students working in teams wouldbe assigned a project to develop a design report for a specific fictitious wireless LAN scenario.This would provide a fair comparison against the B06 student teams who would conduct wirelessmeasurement experiments in the Fossil Lab.
4. The students filled out the same surveys at the beginning of the B05 and B06 CS4514 course.
2http://perform.wpi.edu/tools/3http:/www.forcefieldwireless.com/defendair.html
4

The modified survey (see Appendix A) was filled out in the first class for both the B05 and B06offerings of CS4514 taught by Professor Kinicki.
5. The CS4514 syllabus was modified for B05.
The curriculum and assignments for CS4514 were modified to make room for approximately two50-minute lectures of new material related to wireless networks and measurement. The new materialin B05 included: half a lecture on wireless MAC layer details, half a lecture discussing the generaltopic of issues to consider when designing network measurements, and one lecture consisting ofpresentations of two research papers [1, 4] that provide good examples of wireless measurementresearch. The previous three programming assignments in CS4514 were rewritten and simplifiedto make room for the group assignment to design a wireless network configuration for a ficticioussituation (see Appendix B). Additionally, team sizes used in prior years were increased from two tothree students per group to help offset the increase in student work associated with the addition ofthe wireless assignment.
Note, the B05 wireless design assignment included a set of questions to be answered within thesubmitted design reports. After reviewing the original knowledge objectives, these questions werecrafted to provide coverage for all the knowledge objectives.
6. A prototype WLAN measurement assignment to be assigned to grad students in Spring 2006semester was developed.
Since CS513, the graduate Computer Networks course, is similar to the undergraduate CS4514course, and was being taught by Professor Kinicki during Spring 2006, the strategy was to give theproposed wireless measurement assignment to the graduate students in CS513 and then use thisexperience to adjust the WLAN assignment prior to asking the CS4514 B06 students to conductthis lab.
Based on his work during the summer of 2005, Mingzhe Li, put together version 1 of what be-came known as the ‘cookbook’. The cookbook spelled out for the students the details of where tofind and how to run the measurement tools and traffic generators needed to complete the WLANmeasurements on the Fossil Lab WLAN configuration. The cookbook was appended to the CS513assignment which included seven separate wireless measurements that the grad students were toconduct and analyze.
The graduate students were asked to complete the WLAN assignment in two-person teams (with onethree-person group) in approximately two weeks of a semester calendar. The project specificationstated that the final report was to include graphs of the measurements and an analysis of themeasurement results.
7. After grading the grad assignment, the results were reviewed to determine successes, failures andadjustments to be made to the measurement lab assignment.
After the grad group assignments were graded, the successes and failures of this assignment werereviewed. Specifically, the measurement tasks took significantly longer to complete than expected.The students found some of the cookbook directions and examples unclear and confusing. Leav-ing the graduate students to their own devices for producing graphical output of the measurementsproved to be a major stumbling block for this assignment. Most of the grad students had little expe-rience with the details of converting measurement output into graphs to be used in the experimental
5

analysis. Hence, most groups struggled with producing reasonable graphs and needed an extensionof several days to complete the final report. The group with the best graphical presentation wereECE students who had prior experience using Matlab on the CCC machines to produce graphs.
Thus, it was concluded that the assignment was too large for a week of an undergraduate courseand that the undergraduate students would require assistance with producing graphs from themeasurement data.
8. Professor Kinicki reruns all the experiments using the cookbook during the summer of 2006.
During the summer of 2006, Professor Kinicki went into the Fossil Lab and carefully went throughthe assignment given to the grad students and ran all the measurement tests to understand wherethere were problems with the assignment and to find ways to make the cookbook directions easier tofollow. One issue that emerged was that students were being asked to work on two different operatingsystems with distinctly different text editors. The Fossil server was a Linux machine where eitheremacs, vi or pico had to be used to modify the parameter settings for the traffic generators beforeexperiments were to be run and the two PCs receiving wireless traffic were running Windows XPwhere notepad, wordpad or word had to be used. A second issue was the file size choices availableto the students for sending TCP or UDP files down to the two PCs. Since one PC was deliberatelyconfigured to have bad wireless reception (the antenna was removed), one run of sending a large fileto the bad machine could take a significant time (longer than 10 minutes!) to complete.
After this review, modifications were made to the assignment including: rewriting the cookbookdirections to make them easier to understand; eliminating one of the required tests; taking severalexperimental design choices out of the assignment; and strongly recommending students use Matlabfor the graph generation while providing them with a tutorial on the use of Matlab.
9. The wireless measurement assignment was revamped to make it easier and shorter.
The assignment given to the grad students in Spring 2006 was shortened by eliminating the measure-ment task that used smaller packets and by making one of the experiments optional by designatingit as an extra credit task.
10. Mingzhe created version 2 of the cookbook prior to B06.
Based on the summer review and the feedback from the Spring 2006 grad course, Mingzhe Liproduced with help from Feng Li, another grad student who had originally worked with the wirelessmeasurement tools, a significant revamp of the cookbook for use after Thanksgiving in the B06term. The emphasis in version 2 of the cookbook was in providing clearer instructions and scriptfiles to make the measurement process more automated (see Appendix C).
11. Adriana and Mingzhe work together on the Help Session for the WLAN assignment.
Based on a suggestion by Amy Ricci, Adriana Hera, the WPI Matlab instructor, was contactedin October prior to the beginning of the B06 term. She agreed to provide student assistance forusing Matlab to produce graphs from the WLAN measurements. After meeting with Mingzhe Liwho was assigned as the TA for CS4514 in B06, the decision was made to offer an hour and a half,voluntary Help Session to prepare the student teams for the WLAN measurement lab. Mingzhegave a Powerpoint presentation covering the details of the lab assignment in the first half of theHelp session and Adriana gave a presentation on the use of Matlab in the second half of the Helpsession. Since Mingzhe had provided Adriana with sample outputs from actual WLAN experiments
6

the students were to run, Adriana was able to customize her session and discuss sample code andMatlab scripts that the students could use with few changes. The complete Help Session Powerpointpresentation with the Matlab code was placed on the course web page for easy student access.
12. Professor Kinicki created a video on computer network performance evaluation issues.
With the help of Dave Taranto in ATC, Professor Kinicki created a 90-minute video lecture onComputer Network Performance Evaluation. Originally, the plan was to create two videos - one onperformance issues and one covering statistical considerations when running experiments involvingcomputers. However, due to time constraints only one video was created. The intent was to providethis video to the students as background information prior to conducting the WLAN measurements.This was to replace the half hour lecture on this topic in the B05 syllabus and thereby free up anotherhalf hour for more details of the wireless MAC layer in the B06 syllabus.
13. CS4514 B06 student groups conduct wireless measurements in Fossil Lab.
The WLAN measurement lab assignment was scheduled to be run by the B06 networks class duringthe week beginning with the Monday after the Thanksgiving break. There were ten student teams(nine three-person groups and one four-person group) in the class. The voluntary Help Session wasgiven on Tuesday, November 28 and Mingzhe reported that about 14 students attended and thatthis included at least one student from most of the ten groups. The student teams used a sign-up liston the door of the Fossil Lab to reserve a block of time to use the WLAN system. The experimentalconfiguration was available around the clock in the Fossil Lab and the students had card-key accessto the lab to provide security for the equipment.
It quickly became clear that five weekdays was not enough time to complete the assignment andproduce a final report. Thus, the due date was extended until 4 p.m. on Monday, December 4th.With this weekend extension, only one group turned the assignment in late.
14. An itemized grade sheet was developed for the grading of the wireless measurement lab reports.
Upon reviewing the set of lab reports, it became clear that there was high variability in the mea-surements reported by the student groups. To provide a fair mechanism for grading the assignment,an itemized grading sheet (see Appendix D) was developed for grading the ten lab reports. Thisvariability tended to be caused by sloppiness in handling measurement units and differences in thegranularity of the results graphed.
15. The B06 final exam was designed with the same overall weight assigned to wireless questions as theB05 final exam.
Although both final exams consisted of short essay questions, the B06 final exam was designed tohave the same percentage of points (33 out of 100) assigned to the wireless questions as the B05 finalexam. The results of the wireless questions were to be the primary data for the project assessment.
16. Three specific questions were added to the WPI course evaluation forms to get feedback from theB06 students concerning their reaction to the WLAN measurement assignment.
The WPI course evaluation form is designed such that the instructor can add specific questions tothe course evaluation form. For the B06 course, Professor Kinicki added three questions related tothe wireless measurement experience (see Appendix E). He also encouraged students to commentin the free text portion of the form on their reaction to the lab experience.
7

4 Project Assessment
This section discusses the assessment component of the TTF project.The first meeting held with Jeanne Hubelbank and Amy Ricci held in August 2005 produced the
preliminary list of objectives presented in Section 2. At this meeting, a general approach to assessmentwas discussed and agreed upon.
One important outcome of the meeting was the decision to compare the B05 and B06 students. B05students of the networks course were assigned a wireless design project while B06 students participatedin the wireless network measurement lab.
To compare prior background of the two classes, a class survey (see Appendix A) was filled out by thestudents during the first class of both offerings of the networks course. The results tabulated by JeanneHubelbank are presented in Appendix F. With respect to mean number of important CS courses taken,self-rating of knowledge of C, C++ and programming skills, Tables 2 and 4 show no significant statisticaldifference (n.s.) between the two classes upon entry to the course. More important to this project is theresult of Table 3 that shows no significant statistical difference in the prior level of experience with LANsand WLANs between the B05 and the B06 classes.
The first row of Table 5 compares the results of the groups on the wireless assignment in terms of themean percentage of the maximum possible team score in B05 and B06. This row shows no significantdifference between the 75.8% and the 78.0% average team score.
The primary assessment metric for this project involved the final exam performance comparison be-tween the B05 and the B06 students. Each of the final exams had 33 out of a possible 100 points devotedto questions on wireless networking technology and performance issues. As the second row of Table 5indicates, the statistical test shows there was indeed a statistical difference between the B05 and B06performance on the wireless portion of the final exam. However, the B05 students performed better thanthe B06 students which was not the result expected.
Before drawing any strong conclusions from this result, possible differences in the two courses needto be considered. Since it is CS Department policy to provide students with previous year exams, it wasnot possible to ask the exact same questions for both groups. Moreover since the B06 offering includedan extra half lecture of wireless MAC layer details, the B06 wireless exam questions needed to reflect thisextra emphasis. Hence, the test questions were different for the two exams and all the questions involvedshort essay answers which require a degree of judgment when being graded. These issues and other factorssuch as differences in the difficulty of the questions and differences in the way the material was coveredin the two course offerings can also produce variability in student test scores. One example of this wasquestion 6 on both tests which were both 4-point wireless questions where the average score in B05 was2.6 while in B06 the average score was 1.3. The B06 question was very specific and covered material thatwas only covered in one class lecture.
Another anecdotal explanation concerning the lower scores in B06 is that 10 points on both examscovered the two research papers on wireless performance (one five point question per paper) that weregiven to the students to read and then presented in one lecture for both courses. However, ProfessorKinicki noticed in B06 the attendance was significantly lower for this one lecture about the two papers.Without taking into account the differences in difficulty between the questions for each year, the B06students’ average score for those two questions was 0.3 points lower than the B05 students’ average score.
Moreover, this assessment analysis that uses individual final exam test scores is blurred by the factthat both wireless assignments were done as three person groups. Particularly in the B06 measurementlab, it is natural for the groups to divide up the work such that not all the students participate in the
8

actual measurements.One additional point to note from Jeanne’s notes following Table 5 shows that students in both B05
and B06 who did well on the wireless assignments did better on the wireless final exam questions.The summary of the student responses to the three extra questions on the B06 course evaluation form
(see the bottom of Appendix E) provide an additional assessment vehicle for this project. Twenty-fivestudents responded to the three questions. On a five-point scale with five as the highest rating, on the firstquestion the students were asked to rate the learning experience for the wireless measurement assignment.It is noteworthy that 72% of the students marked a four or a five rating and only 12% marked a one or atwo.
The response to the second question to determine if the work required of the teams on the wirelesslab and report was reasonable provided similar positive results. With 60% agreeing or strongly agreeingand only 4% disagreeing, the effort to make the assignment doable within the time frame seemed to havebeen successful.
Working in programming groups can be problematic, but this team experience was part of the projectobjectives. A 80% positive ranking by the students on the third question is an indicator that the teamexperience in B06 worked reasonably well. While the groups worked on the wireless lab together, they alsoworked in teams on the second and fourth assignment for the course and on a design report for programfour.
5 Results
While the previous section used scientific methods to assess the impact of the WLAN lab experience onthe B06 students, this section is intended to consider other intangible results and side effects from thisinvestigation that were not anticipated and are supported by anecdotal observations. This includes resultsthat will impact the future teaching of the networking curriculum and the overall CS curriculum at WPI.This section will also briefly discuss the impact of the TTF experience on the project team.
A key hypothesis in this study was that providing a hands-on wireless network measurement experiencewould positively reinforce the material presented in the course lectures. However, the WLAN measurementlab was such a tight fit into the CS4514 syllabus that important aspects of the lab experience were reducedsuch that some students found simply executing the measurement cookbook not a very interesting, andperhaps correspondingly non-educational, experience. The fact that the measurement process was boringand tedious was expressed by two students in the open-ended comments on the B06 course evaluationforms. When the grad students did the wireless measurements, the original assignment included moreemphasis on the students making specific design choices and gave more opportunity for discovery by trialand error. For example, one key issue in measuring maximum throughput is determining the packet sizethat maximizes throughput. Whereas the grad students were forced to adjust the traffic generators todetermine the effects of packet size, the B06 cookbook set the parameters at one packet size. While theassignment suggested that the students consider varying the packet size on their own, unfortunately, onlytwo of the ten groups actually experimented with different packet sizes. Part of the issue is that to varythe packet size, the groups needed to go beyond the cookbook and pro-actively edit the provided scriptfiles. Moreover, given that the cookbook took care of most of the experimental design issues and left fewcreative choices for the students, the sense from the lab reports is the student mindset was to quickly runthe measurements and to not think much about what each individual test was meant to accomplish.
While the B05 students never used a real wireless network, their paper assignment emphasized designdecisions that forced the student groups to wrestle with specific configuration choices and measurement
9

decisions. This probably gave the B05 students a better understanding of wireless performance tradeoffsthan the B06 measurement activity. The B06 measurement experience included a hands-on interactionwith the wireless transmissions, but the scripts and directions within the cookbook were so ‘canned’ thatit appears to have taken some of the macroscopic thought process out of the assignment.
The wireless measurement provided a mechanism for the students to experiment with wireless trans-missions, but at a basic abstraction level these activities differ little from sending wired transmissions.The significant behaviorial differences with wireless transmissions center around contending and crossingwireless flows that significantly affect the performance of other concurrent wireless transmissions. Al-though the student teams did see and measure some of these effects, the assignment was executed duringa stressful point in the term and the sense is that the students were highly motivated to simply completethe assigned tasks following the cookbook directions. There was not significant motivation or time toactually vary some of the test settings and experiment with differing flow demands for WLAN capacity.This hurried feeling among the B06 students was probably heightened in this course because for thelast few years students have complained that there is too much material covered in the course and havesuggested the course be split into two courses.
Another observation taken from reading each of the student group measurement reports is that thecurrent CS curriculum appears to have a weakness in not adequately exposing CS majors to the tenets ofthe scientific method of investigation. The symptoms of the general lack of scientific method include littleconcern for: how long to run an experiment, how many repeated instances of a given test to run and howto try to separate and isolate effects attributed to independent variables or environmental transmissioninterference. While the video created for the TTF was intended to provide background material in thisregard, the results recorded by the ATC staff indicates that there was only one access to the video duringthe course. The conjecture is the students did not take the time to view the video because they did notsee it as critical to conducting and completing the wireless experiments.
One positive result that is quite clear from the group final reports was the success of the Matlab HelpSession in facilitating the production of high quality graphs by the student teams. Whereas the graphingproduced by the grad students had been of mixed quality and was one of the components the gradstudents struggled with in their reports, the B06 teams generally provided good graphs of the measuredresults. However, several of the groups used the exact scripts and parameter settings provided via theHelp session. Namely, they did not bother to change any settings which in several cases yielded graphsthat were unnecessarily small and difficult to read.
Since there was only one WLAN measurement system for all ten groups in the class, students had toreserve the system on a schedule that provided 24-hour per day availability. Moreover with three studentsper team and an experimental interface into at most two PCs at once, the physical lab seating was crowdedand inefficient when all three members ran experiments. Partially for this reason, the teams tended toassign specialized and partially segregated roles for the three team members. Namely, several groupsassigned one person the primary task of generating the graphs after the data was collected and assigninga second student as the primary author of the final written report. This means uneven exposure amongthe students to the actual wireless measurement experience. While the students did get an opportunity towork effectively and efficiently as a team under a stressful schedule, the likely segregation of the specificroles means uneven impact of the knowledge gained on network concepts. Given that all team membersreceived the same grade on the measurement report, it is not possible to gauge individual student effortswith respect to the wireless measurement lab.
The preparation of the video on computer network evaluation had a few positive outcomes for ProfessorKinicki. Being exposed to and being tutored by Dave Taranto on the equipment in the WPI TV studio
10

was beneficial. Specifically, the Sympodium tool was employed during the 90-minute video and ProfessorKinicki found it so useful as an aid with Powerpoint slides that he plans to use it for all lectures in thenext offering the undergrad networks course. The experience of preparing and giving a lecture that wasvideo-recorded is valuable of itself.
While the exposure to the wireless measurement is useful for students, the overriding experiencefrom this Fellowship is that careful design of such an laboratory experience is a complex task. Theproject required significant preparation effort on the part of the graduate student involved and withouthis expertise in a couple of key situations when the laboratory equipment failed, the lab system couldhave easily remained unusable for a couple of days. Thus, one key observation is that this level of qualityteaching assistant support is essential for any future use of the wireless measurement system.
Another lesson learned from this project is that good assessment is challenging and requires carefulplanning. The fact that students have access to previous exams made it impossible to use identical examquestions on the B05 and B06 final exams. This inherently introduced several uncontrolable factors intothe assessment process.
6 Conclusions
This section summaries the previous two sections on assessment and results and adds a few global com-ments on the Teaching Technology Fellowship experience.
Although the original hypothesis was that a hands-on wireless experience would reinforce lecture ma-terial and improve student knowledge about wireless network architecture, the assessment comparing finalexam performance did not bare this out. In fact, the B05 students did better on the wireless portionof the final exam. However, since the B05 student experience specifically involved wireless network con-figuration design issues and the wireless measurement assignment involved many repetitive experimentalruns, the hands-on aspect of the B06 measurement lab was not the key to the pedagogical value of thelab exercise. Rather, since most wireless design choice issues were removed from the cookbook in B06,it is the in-depth struggle with design concerns that appears to be the more important experience forstudent learning. Additionally, another factor in the value of the B05 assignment is that this assignmentincluded specific questions which were designed to cover the original design objectives, whereas in theB06 measurment lab, no such specific mapping of objectives to measurement tasks was possible.
In the initial concept of this Fellowship project, the optimistic hope was that our research experiencewith wireless measurement in a research arena would carry over to make the wireless lab environment botheasily usable and reliable. However, we learned from actual experiences with a single system in the FossilLab that has neighboring AP activity from real WPI wireless traffic that the actual lab environment for thestudent experiments could have been better. Variability in other wireless traffic and uncertainties in thebehavior of the wireless network cards introduced unexpected behavior within the student measurementsthat could not be controlled.
Having only one experimental system is not a good strategy. Without any plans for a backup system,the whole measurement experiment could have become inoperable. Initially, we worried that the reactionof the students having to reserve the system that required students to work around the clock would resultin serious problems and many complaints. This never occurred. Rather, the student groups tended toadjust their group activities and adapt individual responsibilities to work quite effectively around the labbottleneck situation. The positive ratings of the wireless lab experience on the course evaluation formreinforce these observations.
11

The biggest unexpected conclusion from this investigation was that after reading the wireless localarea network (WLAN) measurement reports is how little the current Computer Science curriculum hasprepared students to do experimental design and to be able to bring scientific methodology to bearwhen measuring physical phenomenon. This conclusion needs to be brought to the attention of the CSDepartment to urge a modification to our current undergraduate curriculum.
While the introduction of a wireless technology experience into the undergraduate computer networkscourse did not produce the anticipated gains in student knowledge, using the Teaching Technology Fel-lowship as a vehicle to understand better the undergrad CS curriculum and discovering potential newstrategies for improving the delivery of computer systems and networks concepts was a positive experiencefor the Fellwoship project team.
7 Acknowledgments
This Teaching Technology Fellowship project was enhanced due to the valuable assistance and supportfrom Adriana Hera, Jeanne Hubelbank, Feng Li, Amy Ricci and Dave Taranto. The authors wish tothank and acknowledge their contributions that made this project both an interesting and an enjoyableexperience.
References
[1] Jon Gretarsson, Feng Li, Mingzhe Li, Ashish Samant, Huahui Wu, Mark Claypool, and Robert Kinicki.Performance Analysis of the Intertwined Effects between Network Layers for 802.11g Transmissions. InProceedings of the 1st ACM Workshop on Wireless Multimedia Networking and Performance Modeling(WMuNeP), Montreal, Canada, October 2005.
[2] Feng Li, Jae Chung, Mingzhe Li, Huahui Wu, Mark Claypool, and Robert Kinicki. Application,Network and Link Layer Measurements of Streaming Video over a Wireless Campus Network. InProceedings of the 6th Passive and Active Measurement Workshop (PAM), Boston, Massachusetts,USA, April 2005.
[3] Feng Li, Mingzhe Li, Rui Lu, Huahui Wu, Mark Claypool, and Robert Kinicki. Tools and Techniquesfor Measurement of IEEE 802.11 Wireless Networks. In Proceedings of the Second InternationalWorkshop on Wireless Network Measurement (WiNMee), Boston, MA, USA, April 2006.
[4] Mark Yarvis, Konstantina Papagiannaki, and W. Steven Conner. Characterization of 802.11 WirelessNetworks in the Home. In Proceedings of 1st workshop on Wireless Network Measurements (WiNMee),Riva del Garda, Italy, April 2005.
12

APPENDIX A CS 4514 Computer Networks B06
Class Survey
Name ___________________email address _________________ Class Year ___ Please check prior CS courses that you have passed: __ CS2011 __ CS2303 __ CS2223 (Algorithms) __ CS3013 (OS) __ CS3733 (Software Engineering) __ Probability __ Statistics __ CS4241 (Webware) __ CS4513 (DOS) List the other CS courses you are taking this term __________ __________ Are you taking this course for BS/MS credit? ___ Yes ___ No ___ Maybe Self Rate your knowledge/skill level (check one): Excellent Good Fair Poor None C ____ ____ ____ ____ ____ C++ ____ ____ ____ ____ ____ programming skills ____ ____ ____ ____ ____ Are you currently working a part-time or full –time job? Yes ____ hours/week ____ No ____ Wireless Local Area Network (WLAN) Questions:
1. Estimate your level of experience with bringing up or administering a Local Area Network (LAN)? This includes experience working with Ethernet hubs or switches.
__ no experience __ a little experience __ some experience __ extensive experience
2. Estimate your level of experience with bringing up or administering a Wireless LAN.
__ no experience __ a little experience __ some experience __ extensive experience
3. Define network throughput and network delay and explain why they are important in providing Quality
of Service to network users. 4. Do you know what a network “sniffer” does? __ Yes __ No
If you answered Yes, briefly explain the function of a network sniffer.
APPENDIX B

CS4514 Computer Networks B05 Updated November 28, 2005
2
Assignment 3 30 pts. Evaluating the Performance of a WLAN in Alumni Gym Due: Monday, December 5, 2005 1 p.m. Introduction Assume the following scenario: Your programming team has been hired by FEMA (the Federal Emergency Management Agency) as a consultant to evaluate Wireless Local Area Networks (WLAN’s) consisting of a central access point (AP) and up to 70 wireless nodes made up of approximately 90% PC’s and laptops and 10% PDA’s or cell phones equipped for Internet access. After Hurricanes Katrina and Rita, FEMA wants to improve its preparedness at providing for disaster evacuees who would be housed temporarily for up to two months in small high school gymnasiums. In addition to providing food and shelter, FEMA desires to deploy instantly WLAN’s at these locations that would connect to the Internet via a single broadband cable connection already available at the high schools. FEMA wishes to provide the displaced families with the ability to access several specially designed “disaster evacuation” application tools [see program 4] plus a few standard Internet services to improve the morale of the evacuees. Particular applications to consider in your study include: access to Internet games, instant messaging, downloading of government forms that need to be filled out and returned electronically, streaming movies (especially government assistance films) from a FEMA controlled multimedia server, streaming of cartoons for small children, and the ability to talk to relatives over a VOIP application.
FEMA has hired your team to conduct a preliminary prototype WLAN measurement study in WPI’s Alumni Gym where you would be free to select one off-the-shelf AP that supports 802.11g, purchase 10 wireless nodes of various types and one wireless sniffer. Using the specific layout of the Alumni Gym, your assignment is to provide a design document that provides a detailed plan of exactly which measurements you would conduct that includes specifics concerning the equipment that your team recommends purchasing for the prototype measurement and the use of publicly available measurement tools and traffic generators that could be utilized. (Assume for this discussion that you will be provided with free access to all the wireless measurement tools developed by the WPI CS Department Wireless Streaming Mulitmedia Lab (WSML) (see http://perform.wpi.edu/wsml/ ) and discussed in the [Li et al.] and the [Gretarsson et al.] papers.)

CS4514 Computer Networks B05 Updated November 28, 2005
3
Design Assignment Each team is to submit a Design Report (not to exceed 12 pages) providing the details for your prototype WLAN measurement tests to be conducted in Alumni Gym. Specific emphasis in your final grade will be placed on your specific justification for how the performance results derived from your prototype measurement study can be used be FEMA to determine: the limitations of using a single AP, the number of wireless clients that can be reasonably supported by one AP, location considerations for wireless client nodes and whether some of the Internet applications proposed by FEMA need to be restricted or dropped from the list of applications to support. Requirements List Your measurement design report must include: 1. a recommended list of equipment to purchase for the prototype measurement that includes AP and
client nodes [Note well – The TA will provide you with documentation for a “home-brew” wireless sniffer that the WSML will provide for your experiments in Alumni Gym].
2. an itemized list of experiments that your team proposed to conduct. This list must have a minimum of
five distinct experiments and may have more but assume WPI will only give your team total access to Alumni Gym for two days between Christmas and New Years Day 2006. Discuss what tools will be used to generate traffic for the proposed experiments.
3. An itemized list of all network performance metrics that you propose to measure. Group these metrics
by which layer in the protocol stack the measurement tool will operate. Discuss which specific tools will be employed to measure each individual performance metric.
4. A detailed discussion of your exact experimental methodology that includes such details: applications
to run, the number of repeated experiments, duration of experiments, schedule of measurements over a 48 hour period, location and movement of the AP and the client nodes during experiments, the number of people needed to conduct the experiments and preliminary thoughts on software tools that might need to be developed to automate the experiments and provide an organized scheme for storage of all experimental results.
5. A discussion of tools to be used to provide performance graphs to present to FEMA. Propose 10
distinct graphs that you would produce from your experiments with a brief discussion of the value of each graph to the prototype study objectives.
6. A preliminary list of hypotheses that you expect to test during your prototype measurements in Alumni
Gym.
When making your choices with respect to your design report, keep in mind the robustness of your design such that your procedures could easily deployed in different configurations that might include temporary
CS4514 Computer Networks B05 Updated November 28, 2005
4
cubicle barriers for families and the ability to compare the performance of all the top recommended access points within the framework of your experimental procedures. Questions
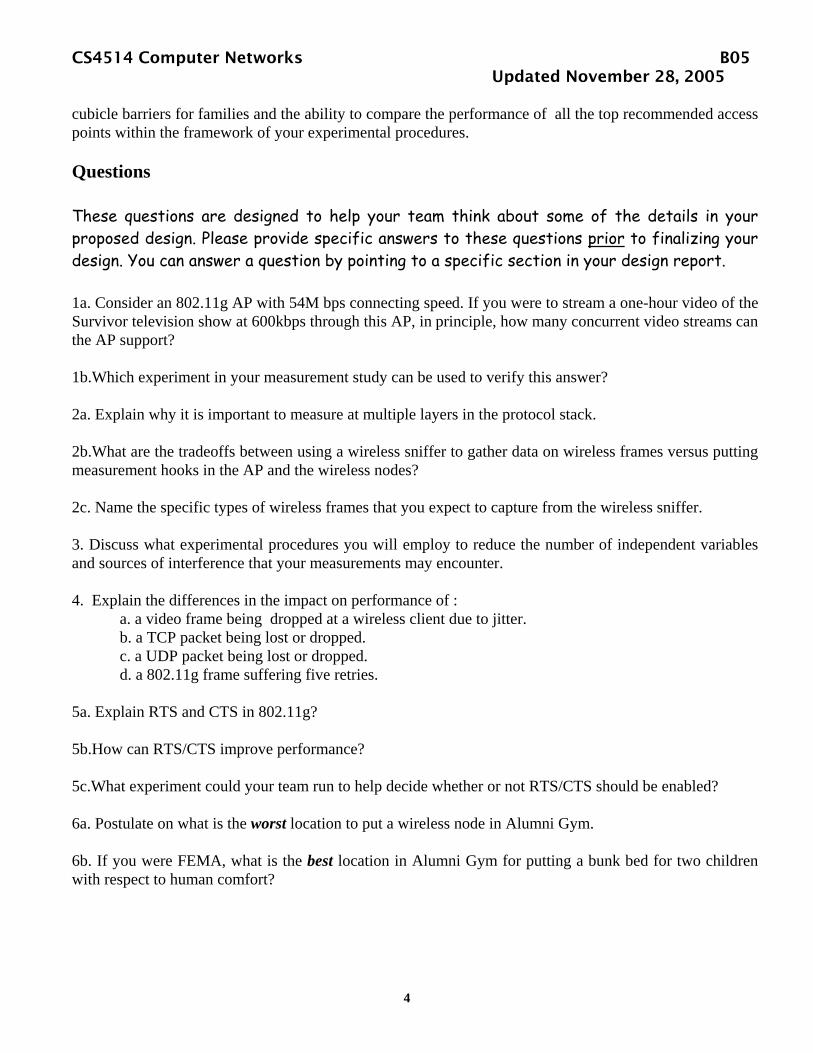
These questions are designed to help your team think about some of the details in your proposed design. Please provide specific answers to these questions prior to finalizing your design. You can answer a question by pointing to a specific section in your design report. 1a. Consider an 802.11g AP with 54M bps connecting speed. If you were to stream a one-hour video of the Survivor television show at 600kbps through this AP, in principle, how many concurrent video streams can the AP support? 1b.Which experiment in your measurement study can be used to verify this answer? 2a. Explain why it is important to measure at multiple layers in the protocol stack. 2b.What are the tradeoffs between using a wireless sniffer to gather data on wireless frames versus putting measurement hooks in the AP and the wireless nodes? 2c. Name the specific types of wireless frames that you expect to capture from the wireless sniffer. 3. Discuss what experimental procedures you will employ to reduce the number of independent variables and sources of interference that your measurements may encounter. 4. Explain the differences in the impact on performance of :
a. a video frame being dropped at a wireless client due to jitter. b. a TCP packet being lost or dropped. c. a UDP packet being lost or dropped. d. a 802.11g frame suffering five retries.
5a. Explain RTS and CTS in 802.11g? 5b.How can RTS/CTS improve performance? 5c.What experiment could your team run to help decide whether or not RTS/CTS should be enabled? 6a. Postulate on what is the worst location to put a wireless node in Alumni Gym. 6b. If you were FEMA, what is the best location in Alumni Gym for putting a bunk bed for two children with respect to human comfort?

CS4514 Computer Networks B05 Updated November 28, 2005
5
6c. Assume you must predict best and worst case performance for two concurrently running wireless clients located at the 6a and 6b locations. How would you decide on the best place to locate the AP in the scenario where it ONLY served these two client machines? 7. Assume that your research shows a generic VOIP application that is compressed using an 8kbps codec. Given that conversations usually required a delay less than 100ms, explain what you need to measure and how you would measure it to insure that Quality of Service is high when a high number of concurrent VOIP applications are running over the WLAN in Alumni Gym. References [Gretarsson et al.] Jon Gretarsson, Feng Li, Mingzhe Li, Ashish Samant, Huahui Wu, Mark Claypool, and Robert Kinicki, “Performance Analysis of the Intertwined Effects between Network Layers for 802.11g Transmissions”, 1st ACM Workshop on Wireless Multimedia Networking and Performance Modeling (WMuNeP '05), Montreal, Canada, October, 2005. [Li et al.] F. Li, J. Chung, M. Li, H. Wu, M.L. Claypool, and R.E. Kinicki, “Application, Network and Link Layer Measurements of Streaming Video over a Wireless Campus Network”, Proceedings of the 6th Passive and Active Measurement Workshop (PAM), Boston, April 2005.

APPENDIX C

CS4514 Computer Networks B06
2
Programming Assignment 3 45 Points November 30,2006 Wireless LAN Measurements Due: Monday, December 4, 2006 at 1 p.m. This assignment is to be done by the programming teams. The goal of this assignment is to provide hands on experience with a wireless local area network (WLAN) and to provide an opportunity to conduct real measurements. The WLAN equipment is available in the Fossil Lab. We will provide the students in the class access to the Fossil Lab via WPI card id access and create accounts for the students on the machine, fossil, which will be the server for the WLAN measurements. You will need to log in remotely to fossil from a client machine using ssh. The configuration for your WLAN measurements will consist of the fossil server which can communicate through a host AP to two wireless clients (PC’s running Windows XP). One of the PC’s will be labeled as the Good machine at a good location and the other PC will be labeled as the Bad machine. We have guaranteed that the bad machine will get poor reception quality by removing its antenna. The host AP is a PC configured to operate as a wireless access point. RTS/CTS will be turned off on the WLAN. Both clients will operate in 802.11b mode and the host AP will be set at automatic mode. The host AP will use channel 6. Unless the host AP dies, you should have no reason to interact with it. The task of each program team is to conduct measurements to determine the performance of the WLAN. All the experiments involve sending traffic downstream from the fossil server to the two wireless clients. One important component of this assignment is the ability to collect measurement data and provide graphs that show performance concurrently at multiple layers of the protocol stack. While you are free to run more experiments than those assigned, the minimum assignment includes the design and implementation of reasonable measurement experiments to determine:
1. Throughput** when sending a large file using TCP from the server to the good client.
2. Throughput when sending a large file using TCP from the server to the bad client. 3. Throughput when concurrently sending one large file using TCP from the server
to the good client and a copy of the large file using TCP from the server to the bad client.
4. Repeat experiments 1-3 replacing the TCP file transfers with UDP file transfers of equivalent time duration using the mgen tool. Choose your parameters for
CS4514 Computer Networks B06
3
mgen such that the goal of this experiment is to determine the maximum throughput that can be sent over the WLAN.
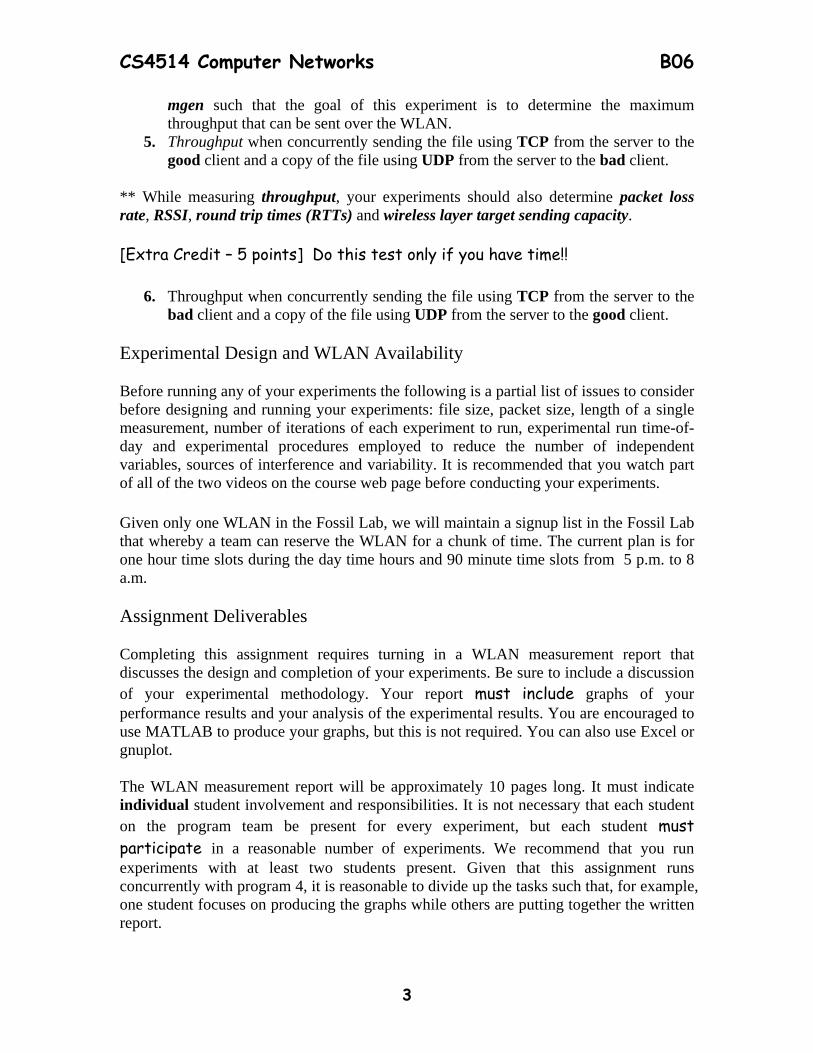
5. Throughput when concurrently sending the file using TCP from the server to the good client and a copy of the file using UDP from the server to the bad client.
** While measuring throughput, your experiments should also determine packet loss rate, RSSI, round trip times (RTTs) and wireless layer target sending capacity. [Extra Credit – 5 points] Do this test only if you have time!!
6. Throughput when concurrently sending the file using TCP from the server to the bad client and a copy of the file using UDP from the server to the good client.
Experimental Design and WLAN Availability Before running any of your experiments the following is a partial list of issues to consider before designing and running your experiments: file size, packet size, length of a single measurement, number of iterations of each experiment to run, experimental run time-of-day and experimental procedures employed to reduce the number of independent variables, sources of interference and variability. It is recommended that you watch part of all of the two videos on the course web page before conducting your experiments. Given only one WLAN in the Fossil Lab, we will maintain a signup list in the Fossil Lab that whereby a team can reserve the WLAN for a chunk of time. The current plan is for one hour time slots during the day time hours and 90 minute time slots from 5 p.m. to 8 a.m. Assignment Deliverables Completing this assignment requires turning in a WLAN measurement report that discusses the design and completion of your experiments. Be sure to include a discussion of your experimental methodology. Your report must include graphs of your performance results and your analysis of the experimental results. You are encouraged to use MATLAB to produce your graphs, but this is not required. You can also use Excel or gnuplot. The WLAN measurement report will be approximately 10 pages long. It must indicate individual student involvement and responsibilities. It is not necessary that each student on the program team be present for every experiment, but each student must participate in a reasonable number of experiments. We recommend that you run experiments with at least two students present. Given that this assignment runs concurrently with program 4, it is reasonable to divide up the tasks such that, for example, one student focuses on producing the graphs while others are putting together the written report.

CS4514 Computer Networks B06
4
WLAN Measurement Tools Updated: November 21, 2006 The WPI Wireless Streaming Multimedia Lab has a webpage that will be useful for this assignment (see http://perform.wpi.edu/wsml/ ). Additionally, the WPI Congestion Control (CC) research group has a web page specifically designed to discuss tools to be used in network measurements (see http://perform.wpi.edu/tools/ ). The following is a list of tools that are available to collect measurement data at multiple levels in the protocol stack: wget is a standard tool for transferring TCP files that is available on fossil (see item 4 in the cookbook). mgen is a tool available on fossil that generates UDP traffic and provides measurement
data. The mgen user’s manual can be found at: http://pf.itd.nrl.navy.mil/mgem/ (see item 5 in the cookbook).
WRAPI+ is an extension to the open-source WRAPI tool developed by the WPI WSML
(see http://perform.wpi.edu/tools/ ). WRAPI+ monitors and records wireless statistics that includes received signal strength (RSSI), transmitted frame count, failed frame transmissions on a Windows XP end hosts' IEEE 802.11b/g network device. We have installed WRAPI+ on both the good and the bad client (see item 6 in the cookbook).
ping is a standard tool available on XP that can be used to measure RTT and packet lost
rates (see item 8 in the cookbook). typeperf is the command-line version of Performance Monitor of Windows XP which
can be used to collect processor utilization and network data including data received bit rate (i.e., throughput) and the current wireless target capacity (see item 7 in the cookbook).
Assistance Graduate students Mingzhe Li and Feng Li, are very knowledgeable with respect to the configuration and tools that you will use. As the course TA, Mingzhe is the primary source for help with WLAN measurements. In a critical situation, you also contact Feng Li at [email protected] , but note well he is a TA for another course. Below is a document prepared by these two students. We refer to the latest version as the cookbook for this assignment. The Help Session for this assignment will include discussion and examples of how to use MATLAB to produce the graphs of your experimental results.

CS4514 Computer Networks B06
5
WLAN Experiments Cookbook [Version 2.0] November 21, 2006 by Mingzhe Li ([email protected]) and Feng Li ([email protected]) It is highly recommended that each group to put everything together into a BAT file. This will enable you to run all your commands automatically. While the eight steps below form the cookbook for your WLAN measurements, once you understand the details of all the steps your group needs to go to step 9 to use the BAT file to actually run your experiments. 1. All the tools you need for this measurement project are installed, you do not need to install them yourself. 2. How to start a console for command line interface on Windows XP computer: Click on “Start” -> “Run”, input “cmd” and click on “OK”. A dos console will pop up. On the command line, use:
“cd "C:\Documents and Settings\groupX\Desktop" To change the current directory to the place you want to store your test data – in the example it is on the Windows Desktop. Where groupX is the assigned user name of your group. Create your working folder to store your data using: “mkdir data” and “cd data” to change the current directory to the data directory, which is the place you start to execute the commands to perform the measurements. 3. How to copy the data out for processing: You can copy your “data” directory from the client machine onto a USB drive to simplify the transfer of your experimental data to other computers for processing. Alternatively, you can use the “scp” command at the command line to copy your data to CCC computers using: “scp your_data_file_name [email protected]:˜/” 4. How to generate TCP traffic using "wget": A. We put files named "filesize-XXM.dat" on fossil' http server. XX represents the size of the file: 01, 02, 04 … indicates the file size is 1MB, 2MB, 4MB, … 100MB. For example: the size of filesize-04M.dat is
4 Mbytes. You can get the file list from webpage: http://fossil.wpi.edu/cs4514/
Select wget TCP file sizes such that the download time is longer than the ping time or change the number of packeta sent by ping to reduce the ping time.
Before starting your tests, you should run a few pilot runs to make sure the downloading time fits your test design. Note - the big files may
take a very long time to complete on the “bad” computer. B. Run wget to download "filesize-XXM.dat", wget will give you the TCP throughput information at the end of download. C. To record the info to a file, you can use -o option to redirect the output to a log file. Example: “wget.exe -o wget.dat http://fossil.wpi.edu/cs4514/filesize-XXM.dat” D. Run "wget.exe --help" and visit http://www.gnu.org/software/wget/manual/wget.html for more information on wget. 5. How to generate UDP traffic using mgen: A. mgen is a client/server application that sends UDP traffic from the
server to client. mgen is installed on both the server (fossil) and the two clients. For the UDP tests, the default time is 120 seconds.

CS4514 Computer Networks B06
6
B. Start the client on the Windows XP side first: Open a new cmd window, run “mgen.exe output NUL port 5000”
this will start mgen receiver on port 5000. Since we don't analyze the mgen log files, we use "NUL" as the log file name to discard the output log on Windows computers.
C. Start the sender on fossil server by running the following command from another cmd window: “ssh fossil.wpi.edu mgen input config_file_name txlog log /dev/null”
The "/dev/null" is used on Linux to represent a "NULL" file and here it is used as the logfile name to discard the mgen sender’s output log. mgen uses the configuration file to generate traffic. For example, we
provide the configuration files “udp-load-good.mgn/udp-load-bad.mgn in fossil:/home/public/cs4514: Example mgen configuration file “udp-load-good.mgn”: # start the UDP Load traffic at time 0.0 sec 0.0 ON 1 UDP SRC 5000 DST 192.168.3.4/5000 PERIODIC [ 800 1400 ] #stop the UDP load traffic at time 120:00 sec 120.0 OFF 1 The key words in the example file: 0.0 ON: start send at 0.0 second 1 UDP: 1 UDP flow SRC 5000: Source port is 5000 DST 192.168.3.4/5000: Destination IP/Port PERIODIC [800 1400]: Traffic with packet rate 800pps and
packet size 1400 Bytes. 120.0 OFF 1: Stop UDP flow 1 at 120.0 seconds You can follow the example in fossil:/home/public/cs4514 to create
your own configuration files and put them in your home directory. Make sure you have the right mgen configuration file for the good/bad client in the bat file.
6. How to use wrapi+ to record wireless signal strength (RSSI): A. First, to allow wrapi to take control of the wireless card, you need to stop a windows zero configuration service by inputting the following in a cmd window: "net stop WZCSVC" B. Running the command in cmd window: "wrapi.bat log_prefix"
will log all data gathered by wrapi to log_prefix_en.dat and log_prefix_log.dat (change log_prefix to the name you want to use)
C. After finishing a test, kill wrapi+ by closing the wrapi window or run “killwrapi.bat” in cmd window. Finally, restart the Windows wireless service:
"net start WZCSVC" This step is very IMPORTANT – if you do not restart the WZCSVC, Windows will not reconnect to the wireless networks automatically. This will cause a disconnection problem when signal strength is low (e.g. the “bad” computer) D. In the log file “log_prefix_log.dat”, column 1 is the current time, and column 2 is the RSSI of the wireless networks. Log file “log_prefix_en.dat” provides extra information about the current connected wireless network. 7. How to use typeperf to record wireless links adaptation capacity and the IP layer throughputs: A. We put a configuration file on each of the XP computers: “wlan.cfg” Run "typeperf.exe -cf C:\bin\wlan.cfg -si 1 -f CSV –y -o typeperf.cvs" This will log everything listed in the "wlan.cfg" file. You may
CS4514 Computer Networks B06
7
want to change the configuration in wlan.cfg to log only the data you want to analyze, but the default configuration is enough for this project. B. In the log file “typeperf.cvs”, column 1 is the time, column 4 is the current capacity, and column 5 is the total throughput”. However, you may find more interesting data in other columns. C. For more information about typeperf visit: http://www.microsoft.com/resources/documentation/windows/xp/all/proddocs/en- us/nt_command_typeperf.mspx?mfr=true 8. How to use ping to measure round trip time and packet loss rate: A. Open a new cmd window and start ping program: “ping –n 100 fossil” “-n” option gives you the total number of packets send by ping, at a rate of 1 packet/second. So the execute time of “–n 100” will be close to 100
seconds. B. When your experiment is done, use Ctrl-C to kill ping. C. The ping program will print out the following statistics
Ping statistics for 130.215.28.161: Packets: Sent = 100, Received = 99, Lost = 1 (1% loss),
Approximate round trip times in milliseconds: Minimum = 10ms, Maximum = 50ms, Average = 12ms Write done the round trip time and loss rate for your report. D. You should run ping before the test and during the test, and compare the round trip time and loss rate changes. 9. How to put everything together in a BAT file: We provide two examples: starttcp.bat and startudp.bat in C:\bin directory Copy them into your working directory and modify them to fit your experimental
design. A. Example: ...
ping -n 50 fossil > ping-before-test.dat net stop WZCSVC start wrapi.bat wrapi.log start typeperf.exe -cf C:\bin\wlan.cfg -si 1 -f CSV –y -o typeperf.csv
start cmd /K "ping -n 50 fossil > ping-during-test.dat" wget.exe -o wget.dat http://fossil.wpi.edu/dummy.zip del dummy*.zip
start killwrapi
taskkill /F /IM typeperf.exe ... “start” command will start a new dos window to run the command and continue to next command in bat file. This is helpful to run multiple
commands simultaneously.
B. Start mgen server remotely in a BAT file without input passwd everytime: The basic idea is that a personal private/public key pair is generated using the ssh-keygen command. The public key is then copied onto a remote system’s .ssh/authorized_keys file. You are now able to SSH over to the remote system's account without the use of a password. For more detail, visit: http://rcsg-gsir.imsb-dsgi.nrc-cnrc.gc.ca/documents/internet/node31.html And/or: http://cc.jlab.org/docs/services/unix/SSH2/ssh-intro.html 10. Tips to manage your experiments: A. Be careful with the configuration files that may be different for good/bad clients, such as the IP addresses. In cmd windows, you can get the IP
address by using “ipconfig”. B. Using a bat file can be helpful to sync the time stamps for different tools.

CS4514 Computer Networks B06
8
Additionally, be aware that the time stamps given by different tool are different. You need to convert them and sync them when drawing the figures.
One easy way to sync the time stamp is to consider the first time stamp of the typeperf log and the wrapi+ log as representing the same time – time 0. Then convert the time values in each log to the relative time value according to time 0.
C. Choose your log names carefully so that you will not forget which
test generates which log. Copy the log after each run to avoid overwriting of data mistakes.
D. Even though you can copy the logs by using “scp”, the efficient way is to use an USB drive because a network transfer from the bad client will be VERY slow.
E. Prepare before you entering the Lab, because the time for each group is limited.

APPENDIX D CS 4514 Computer Networks B06 Group _______________
Wireless Network Measurements 1. Ran five wireless measurements _____ a. ran extra credit measurement _____ 2. Measurements reported: a. Throughput _____ b. RSSI _____ c. Wireless capacity _____ d. Packet loss rates {ping data} _____ 3. Design issues discussed/presented: a. file sizes _____ b. packet sizes _____ c. length of a single measurement _____ d. number of iterations _____ e. time of day/experimental environment _____ f. efforts to reduce variability/interference _____ 4. Full discussion of experimental methodology _____ 5. Graphs/ Measurement output a. complete _____ b. quality of graphs (size, axes, units) _____ c. accuracy/ mistakes _____ d. clarity of presentation _____ 6. Analysis a. depth of analysis _____ b. reasonable conclusions _____ 7. Report a. organization _____ b. writing style _____ c. overall presentation _____ 8. Other Issues/ Comments

APPENDIX E
Additional Questions on B06 CS4514 Course Evaluations The following three additional questions were placed on the whiteboard for students to answer on the additional question portion of the WPI course evaluation forms:
1. Rate the value of the learning experience for the wireless measurement assignment.
2. Was the amount of work associated with the assignment reasonable? 3. Rate your team programming experience.
Since the questions were to be answered by filling in boxes labeled 1-5, the following specific note was also placed on the whiteboard to eliminate confusion in responding to these three questions: Note for question 1: 1 is low value 5 is high value for question 2: 1 is strongly disagree 5 is strongly agree for question 3: 1 is bad experience 5 is good experience. Summary of B06 Student Responses {Extracted from Official Course Evluation Form}

APPENDIX F
1
CS4514 - B05 and B06 Comparisons Final Wireless Assignment and Wireless Component on Final Exam
[Students with a Final Exam] Table 1. Sample
Year of TTF Program Students with Pre Survey N %
Students with Final Data N %
B05 29 47.5 23 43.4
B06 32 52.5 30 56.6
Total 61 100.0 53 100.0 Six students dropped from Final set in B05 (20.7%) and two students dropped in B06 (6.3%) Table 2. Ratings of Knowledge/Skill
Rating of knowledge/skill
B05
N 0
B06
N 0
Statistical significance
C 23 2.78 29 2.53 n.s. C++ 23 3.09 30 2.85 n.s. Programming skills
23
3.35
30
3.15
n.s.
Ratings: Excellent = 4, Good = 3, Fair = 2, Poor = 1, None = 0 Table 3. Ratings of Level of Experience
Level of Experience
B05 N 0
B06 N 0
Statistical significance
LAN 23 1.83 30 1.80 n.s. WLAN 23 1.57 30 1.47 n.s. No experience = 0, A little experience = 1, Some experience = 2, Extensive experience = 3 Table 4. Number of CS courses and Year
CS Courses B05 N 0
B06 N 0
Statistical significance
Mean number 23 6.57 30 6.70 n.s.

APPENDIX F
2
Table 5. Comparison of Mean Percent Correct and Year
Final Assessment
B05 N 0
B06 N 0
Statistical significance
Wireless Assignment
23 75.8 30 78.0 n.s.
Final Wireless Items
23 69.4 30 53.7 p <.01
Notes: I ran‘t’-tests, Mann-Whitney U, and ANOVA where appropriate. When entered as covariates in analysis of variance, number of courses and ratings do not make a difference in statistical significance for either of the final measures. There is a statistically significant difference between the final and the assignment for the whole group. The grand mean is 77.0% on the assignment and 69.5% on the final. As expected, those who did better on the assignment did better on the final. I caution making inferences about the assignment because the grades are based on group work. Sometimes one or two students may complete the bulk of the work. Possible explanations: Students in B05 and B06 were different on other measures.
I think I remember that you do not have final exams for some students in B05; indicating that they “dropped” may not be accurate. Also, their scores may have made a difference in your results, especially if they were lower on the final than the average for that year. Your items on the B06 year may have been harder (or less clear) than the wireless items for B05. Students may show that they learned in other ways than on written assignments or exams.
J. Hubelbank, April 2007