teaching, technology and learning - … · teaching best practices and technology frequently the...
TRANSCRIPT

TEACHING, TECHNOLOGY AND LEARNINGUnderstanding the interconnectionResearch Findings | February, 2016
Sponsored by SMART Technologies, Inc.

TABLE OF CONTENTSINTRODUCTION 1 HIGHLIGHTS 2BACKGROUND 9DETAILED FINDINGS 17CONCLUSIONS 36

INTRODUCTION
The most recently published large-scale research study shows that technology is not having the impact on student learning that we’d all hoped. This revelation has increased the urgency for both educational institutions and industry to work harder to find a more effective approach. SMART Technologies initiated research aimed at uncovering the interconnections between success, technology and teaching/learning practices. The purpose of this research is to help guide decisions in the education and technology sectors.

342%more likely to achieve outstanding success when using teaching best practices and technology frequently
The highest success comes from great teaching practices, complemented by software and hardware, in that order.
70%achieve positive success when using collaborative
software frequently
HIGHLIGHTSGreat teachers get results.
But when they’re able to use education technology to enable the best teaching practices, their ability to achieve successful outcomes is greatly enhanced.
Teaching practices
Education software
Hardware Success+ + =

23%
2%
55%
20%
The Respondents
Research was conducted using over 400 education professionals, with a variety of roles in the education sphere.
Geography
The majority of respondents are from the United States, UK, Germany, Canada, Netherlands and Sweden.
26 other countries are also represented.
More than 400 survey respondents
Specialists Administrators and IT professionals
Other Educators

0%1%
4%
9%
15%
19%
Less than a year 1 year to lessthan 5 years
5 years to lessthan 10 years
10 years to lessthan 20 years
20 years or more
5%
10%
15%
20%
25%
30%
35%
40%
28%
38% 38%33%
14%
40%
45%
50%
0%
43%
4 to less than 11 years old
11 to less than 15 years old
15 to less than 19 years old
19 years old or older
5%
10%
15%
20%
25%
30%
35%
40%37%
25%
Experience
The education and technology experience of most respondents is quite high. This allows us to gain deeper insight into the behaviors and practices of those that use technology regularly.
Education Technology
Grade Level
Teachers were primarily drawn from K-12, with some Higher Education representation.

Conclusions:
• The fusion of great teaching practice with technology-rich environments results in much higher reporting of success
• The frequent use of active learning practices relates strongly to success
• SEL skills are becoming more prioritized than standardized tests by many in the education sphere
• A teacher’s view on how learning works relates to success outcomes
• Evidence suggests the importance of software, even over hardware when trying to achieve success
• Assessment software is most closely tied to success, followed by collaborative and content creation software
• Interactive front-of-room display hardware outperforms projectors
• The successful integration of varied technologies in the classroom positively impacts success
• Group activity in the classroom is significantly and positively related to social-emotional skill development and supportive metrics

Best Practices and Technology
A constant use of best practices paired with a technology-rich environment results in more instances of outstanding success.
Constant use of best practices and technology
Infrequent use of best practicesand technology

37%
20%
High Practice / High Tech33% of Respondents
9%
High Practice / Low Tech7% of Respondents
Low Practice / High Tech31% of Respondents
Low Practice / Low Tech28% of Respondents
8%
40%
45%
0%
28%
OutstandingSuccess
Good Success Mixed Success Limited Succes
5%
10%
15%
20%
25%
30%
35%
40%
24%
40%
45%
0%
38%
OutstandingSuccess
Good Success Mixed Success Limited Succes
5%
10%
15%
20%
25%
30%
35%
28%
25%
40%
45%
0%
11%
OutstandingSuccess
Good Success Mixed Success Limited Succes
5%
10%
15%
20%
25%
30%
35%
23%
29%
40%
45%
0%
20%
OutstandingSuccess
Good Success Mixed Success Limited Succes
5%
10%
15%
20%
25%
30%
35%
23%
37%
Success Matrix
This matrix displays the relationship between:
1) How frequently technology is used
2) How frequently best practices are used
3) Reported success
Technology Use Frequency
Pra
ctic
e Fr
eque
ncy

The findings of the matrix are as follows:
High Practice/High Technology3.4x more likely to report outstanding success, if using both technology and best practices frequently, than if using neither frequently.
Largely saw good success, and were more successful than Low Practice/High Technology respondents.
Saw good and mixed success, but not as much as the High Practice/Low Technology respondents. Yet still saw more success than the Low Practice/Low Technology group.
Substantially less success than any of the other three groupings.
High Practice/Low Technology
Low Practice/High Technology
Low Practice/Low Technology
A Connected Approach Works

Teac
hing
, Tec
hnol
ogy
and
Lear
ning
: und
erst
andi
ng th
e in
terc
onne
ctio
n | 2
016
9
BACKGROUND

OECD Research: Students, Computers and Learning
In September 2015, the Organisation for Economic Co-operation and Development (OECD) released a report concluding, based on their research, that a new approach to technology in schools is needed. This report was used as a starting point for this research, so identifying some of the key points is relevant.
The primary finding was that literacy and numeracy performance scores were not effected by technology.
• Some countries with high adoption of technology ranked lower on literacy and numeracy scores • Some countries with low adoption of technology ranked higher than most other countries
That said, members of OECD cautioned against drawing conclusions about technology in the classroom based on this finding.
“This should not be used as an ‘excuse’ not to use technology, but as a spur to finding a more effective approach.”
ANDREAS SCHLEICHER
Director for Education and Skills/Special Advisor on Education Policy OECD
Other notable researchers in the field have drawn similar conclusions.
“For the last 50 years the average effect size of technology has barely changed. It’s not that it can’t work…it just hasn’t yet.”
JOHN HATTIE
Professor of Education and Director of the Melbourne Education Research Institute University of Melbourne
Source: OECD (2015), Students, Computers and Learning: Making the Connection, PISA, OECD Publishing. http://www.dx.doi.org/10.1787/9789264239555-en

OECD Insights
Rather than removing technology from classrooms, the OECD report offers reasons why the impact of technology has not been as strong as it could be. These insights include:
1) The impact of technology depends more on how teachers use it in the classroom than district or school level policies around the use of technology
Training teachers on technology and encouraging them to collaborate on what is working in their respective classrooms has a far larger impact than high-level policy decisions.
2) It is integral to success that the technology being used promotes teacher-student interaction, not distracts from it
Technology that allows students to better interact and receive feedback from their teachers is much more likely to produce positive results.
3) Technology tools that encourage students to be active participants and promote collaborative learning are key
Technology that empowers students to actively participate and create their own content, and to work together with their peers and teachers, produces better results.
Assumptions
Areas to extend the OECD findings include:
• The reliance on standardized test performance as the sole success metric
• Exclusively focusing on computers as classroom technology (excluding front-of-room interactive and non-interactive displays, tablets, smartphones and a variety of software)
• Opportunity to go into more detail on the way students use technology, both in the classroom and at home
Source: OECD (2015), Students, Computers and Learning: Making the Connection, PISA, OECD Publishing. http://www.dx.doi.org/10.1787/9789264239555-en

0 10 20 30 40 50 60 70 80 90 100
My role as a teacher is to facilitate students’ own inquiry
Students should be allowed to think of solutions to practical problems themselves before the teacher shows them how they are solved
Thinking and reasoning processes are more important than specific curriculum content
Students learn by finding solutions to problems on their own
Views on Teaching
Findings from the OECD TALIS study indicate most teachers believe that 21st-century pedagogies are integral to their role.
Source: OECD (2014), New Insights from TALIS 2013: Teaching and Learning in Primary and Upper Secondary Education, OECD Publishing. http://www.dx.doi.org/10.1787/9789264226319-en
Percentage who “agree” or “strongly agree” that:

0 20 40 60 80 100
Present a summary of recently learned content
Check students’ exercise books or homework
Let students practice similar tasks until teacher knows that every student has understood the subject matter
Students work in small groups to come up with a joint solution to a problem or task
Give di erent work to students who have diculties learning and/or to those who can advance faster
Students use ICT for projects or class work
Students work on projects that require at least a week to complete
Refer to a problem from eveyday life or work to demonstrate why new knowledge is useful
Yet most teachers don’t engage students in ICT work frequently.
Percentage who report using the following ‘frequently’ or ‘in nearly all lessons’*:
Source: OECD (2014), New Insights from TALIS 2013: Teaching and Learning in Primary and Upper Secondary Education, OECD Publishing. http://www.dx.doi.org/10.1787/9789264226319-en

0 5 10 15 20 25 30 35 40
Approaches to individualised learning
Student career guidance and counselling
Teaching cross-curricular skills
Developing competencies for future work
Predagogical competencies
School management and administration
Knowledge of the subject field(s)
Knowledge of the curriculum
Student evaluation and assessment practice
Teaching students with special needs
ICT skills for teaching
New technologies in the workplace
Student behaviour and classroom management
Teaching in a multicultural or multilingual setting
And most teachers expressed support with ICT as one of their top PD priorities.
Teachers’ Needs for Professional Development
Source: OECD (2014), New Insights from TALIS 2013: Teaching and Learning in Primary and Upper Secondary Education, OECD Publishing. http://www.dx.doi.org/10.1787/9789264226319-en

Classroom Technology
Classroom technology was defined to include:
• Student devices (laptops, Chromebooks, tablets, cell phones)
• Front-of-room technology (interactive whiteboards, interactive flat panels, interactive projectors, projectors, streaming devices)
• Software
High-impact Teaching Practices
Respondents were also asked to identify how frequently they used and engaged students in a variety of teaching/learning practices, including specific active learning pedagogies.
• Teacher clearly defines learning goals and criteria for success before learning begins
• The ability of the teacher to gain insight into the progress of a student’s learning and have that insight guide the teacher’s next steps
• The use of effective direct instruction
• Active participation of students
• Students applying knowledge in new contexts
• Ample opportunities for feedback (student to teacher & student to student)
• Collaborative learning
Research Approach
This report used the following approach:
• Leverage insights from the OECD report• Focus on the use of high-impact teaching practices• Incorporate a larger variety of technology used in classrooms• Broader success criteria

Success Measures
The following variables were used to determine success:
Visible learning
Teacher reports greater insight into student learning as it happened and more opportunities to intervene.
Preparation for standardized tests
Students are adequately prepared for standardized assessments.
SEL development
Social and emotional learning – preparing students to be active contributors to society and growing their individual well-being and social progress (ie: life skills, social skills, collaboration, communication & problem solving).
Students feel safe to contribute
In the classroom, students feel safe to contribute their ideas, answers and thoughts without hesitation.
Peer discussion
Students discuss their findings with each other.
Every student participating
Active engagement/rich discussions (everyone is part of the lesson, everyone participates).
Interdependence
Group work involves all participants, not just some.

Teac
hing
, Tec
hnol
ogy
and
Lear
ning
: und
erst
andi
ng th
e in
terc
onne
ctio
n | 2
016
17
DETAILED FINDINGS

0%
Learn by: Doing Learn by: Association Learn by: PracticeLearn by: Relate new information
Learn by: Social interaction
10%
20%
30%
40%
50%
60%
70%
80%
90%
100%
32%
68%
44%
56%
3%
97%
3%
98%
10%
90%
Views on Teaching Practice
Amongst the respondents, there were two major similarities held almost unanimously about philosophies on how learning works:
These numbers were particularly high amongst respondents who had been involved in education and using technology for 10+ years.
*It should be noted that according to Fiorella and Mayer’s generative learning view, ‘learning by doing’, can focus too much on behavioral activity and not enough on cognitive activity. Doing things does not necessarily cause learning, but thinking about what you are doing does cause learning.
L.Fiorella and R. Mayer, Introduction to Learning as a Generative Activity, Jan 2015
Strongly Disagree/Disagree
Strongly Agree/Agree
97%98%98% strongly agree/agree that learning works when students make sense of new material they encounter by striving to relate this new information to their prior knowledge.
97% strongly agree/agree that students also learn by engaging in hands-on activity, so it is better to learn by doing than by being told*

Teac
hing
, Tec
hnol
ogy
and
Lear
ning
: und
erst
andi
ng th
e in
terc
onne
ctio
n | 2
016
19
78%
68%
66%
48% 57%
Technology Use Frequency
Prac
tice
Freq
uenc
y
56%
51% 55%
A Teacher’s Beliefs on Learning Impacts Success
Participants in the high practice groups more frequently agreed with the notion that learning works by relating new information and by doing than those in the low practice groups.
Strongly agree with Learn work by relate new information
Strongly agree with Learn work by doing

0%
24%
28%
31%
12%
5%
10%
20%
30%
40%
Teacher Action:Assign Groups
50%
Teacher Action:Instruct Whole Class
1%
5%
26%
47%
22%
Teaching Practice
Whole-class instruction is the most frequently used teaching method.
Never Monthly Weekly
Daily Most Lessons
Classrooms that do group activities frequently see the following benefits, when compared to classrooms that do them weekly or less.
• 20% ↑ social and emotional skill development
• 13% ↑ safety to contribute (in the classroom, students feel safe to contribute their ideas, answers and thoughts without hesitation)
• 16% ↑ peer discussion (students discuss their findings with each other)
• 23% ↑ active engagement/rich discussions (everyone is part of the lesson, everyone participates)
• 27% ↑ interdependence (group work involves all participants, not just some)

0%
7%
15%
45%
22%
11%10%
20%
30%
40%
Teacher Action:Written Feedback
Teacher Action:Assign Collaborative
Homework
50%
24%
28%
31%
12%
5%
• Those that reported higher use of project work saw a strong positive impact in ‘Visible learning’, ‘SEL development’ and ‘Interdependence’
• Assigning collaborative homework is infrequent, but when done reported a strong positive impact in ‘Visible learning’, ‘Peer discussion’ and ‘Interdependence’
• Providing written feedback daily (rather than weekly, as is more common) resulted in a strong positive impact in ‘Students feel safe to contribute’, ‘Peer discussion’ and ‘Every student participating’
Teaching Practice
The results showed that teaching practices are directly related to success. Some practices and the success metrics most positively impacted by them include:
Never
Monthly
Weekly
Daily
Most Lessons

0%
8%
22%
35%
25%
10%
4% 5% 6%
14%
39%
15%13%
30%33%
19%
6%
31%
39%
18%
SALTISE:Visualization
SALTISE:Analysis & Problem
SALTISE:Think-Pair-Share
SALTISE:Less Structured
5%
10%
15%
20%
25%
30%
35%
40%
45%
28%
What is active learning?*
Active learning calls for student participation that is not just social, but involves meaningful cognitive engagement with the content, both individually and collectively.
Common methods to create active learning opportunities include:
• Think-Pair-Share Activities [most common]
• Analysis and Problem Solving Activities [least common, most impact]
• Visualization Activities
• Less Structured Activities
Source: SALTISE
Never
Monthly
Weekly
Daily
Most Lessons
Active Learning
76%76% of respondents indicated active learning is an important approach at their school.
0% 10% 20% 30% 40% 50% 60% 70%
Tablets with keyboards
Desktops/Laptops
Chromebooks
Smartphones
Interactive Flat Panels/Display
Interactive whiteboards
31%
70%
69%
Tablets without keyboards
80% 90%
48%
53%
28%
72%
81%
19%
50%
43%
18%
30%
82%
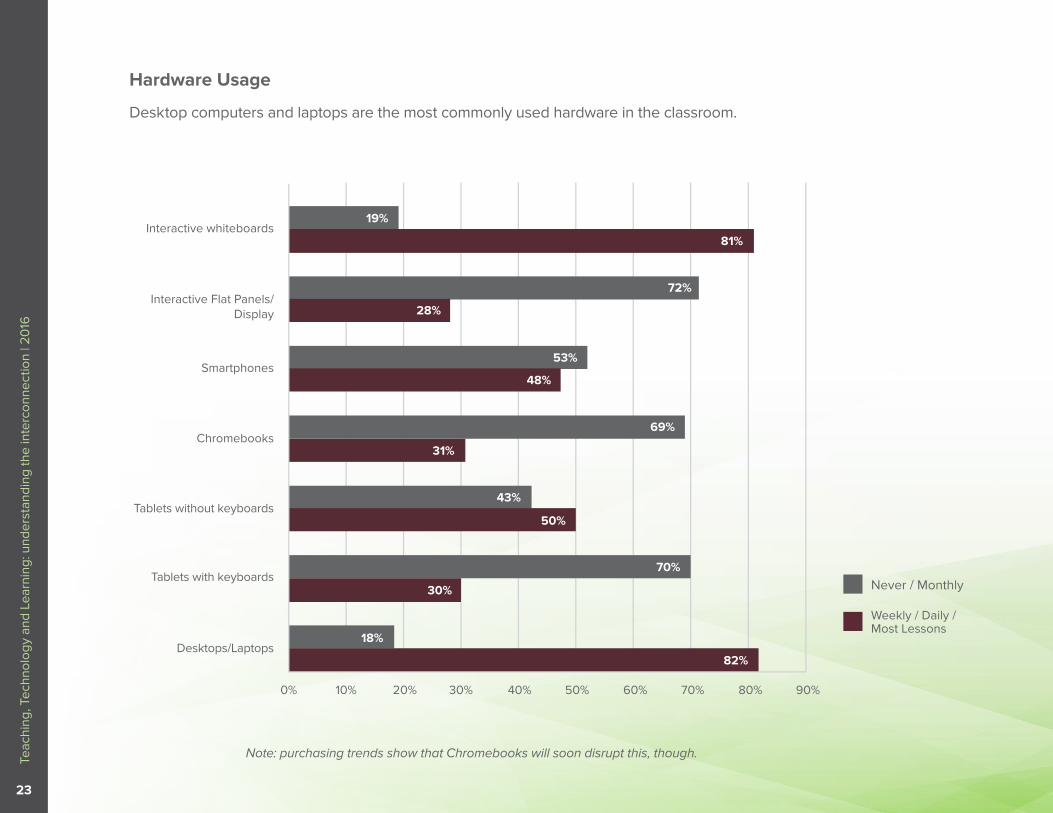
Hardware Usage
Desktop computers and laptops are the most commonly used hardware in the classroom.
Note: purchasing trends show that Chromebooks will soon disrupt this, though.
Never / Monthly
Weekly / Daily / Most Lessons
0%
20%
0 to .4
5%
10%
15%
20%
25%
30%
35%
16%
> .4 to .6
14%
>.6 to .9
43%
> .9 to 1.1
8%
> 1.1
40%
45%
0%
10%
20%
30%
40%
50%
60%
0 to .9 >.9 to 1.1 > 1.1
56%
13%
31%
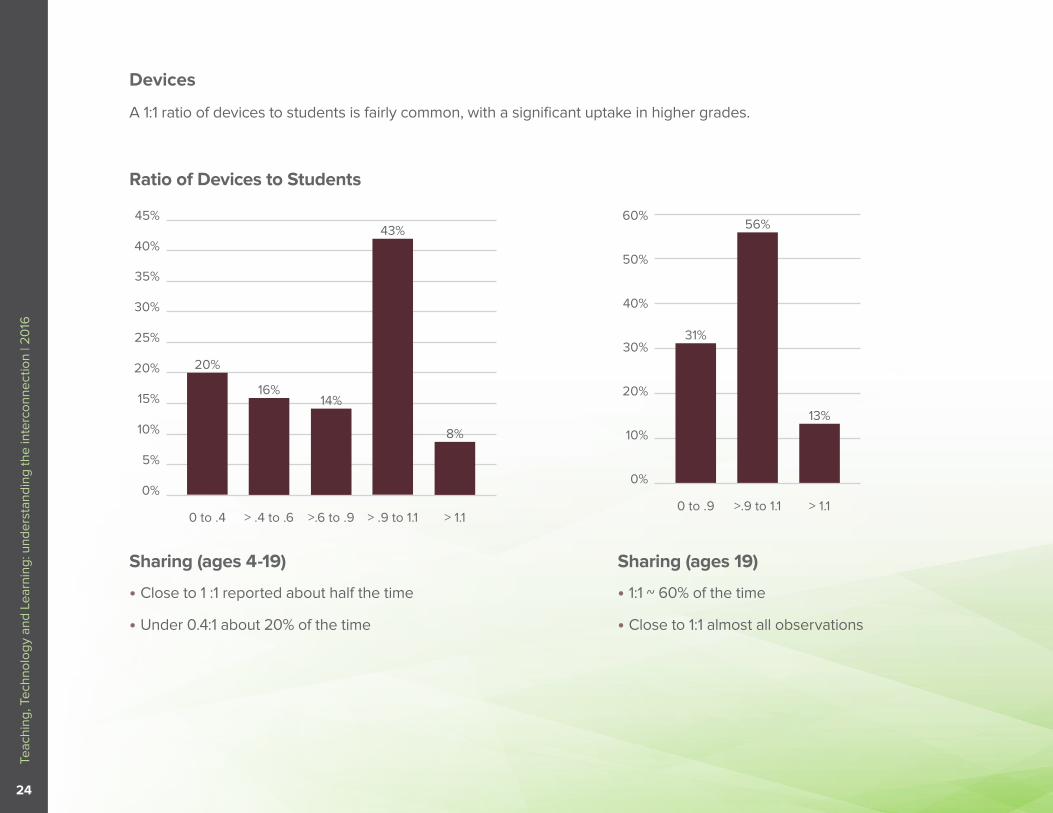
Devices
A 1:1 ratio of devices to students is fairly common, with a significant uptake in higher grades.
• Close to 1 :1 reported about half the time
• Under 0.4:1 about 20% of the time
• 1:1 ~ 60% of the time
• Close to 1:1 almost all observations
Sharing (ages 4-19)
Ratio of Devices to Students
Sharing (ages 19)

0%
4%
12%
38%
33%
14% 15%
20%
34%
23%
8%
4%
13%
37%38%
9%
14%
31%32%
17%
6%
Consume Content Communicate Interactive Consumption
Create New Content
5%
10%
15%
20%
25%
30%
35%
40%
45%
Students’ Use of Devices
The majority of students use devices to consume content, yet in trying to develop higher order thinking skills it’s known that creating content is far more impactful than consuming content.
Never
Weekly
Daily
Monthly
Most Lessons
23%47%Consume content daily or most lessons
Create content daily or most lessons

41%Passive
Consumption37%
InteractiveConsumption
14%Communication
3%Creation
39%Passive
Consumption
3%Creation
26%
25%Interactive
Consumption
Communication41%
Passive Consumption
37%Interactive
Consumption
14%Communication
3%Creation
39%Passive
Consumption
3%Creation
26%
25%Interactive
Consumption
Communication
Students’ Use of Devices Outside of School
The findings from the previous page are consistent with the latest research from Common Sense Media, which looked at how students make use of media for non-school related tasks. The trend of using devices to consume rather than create content is also present in most students’ personal lives.
Tweens Teens
*Source: Common Sense Media Inc. (2015) The Common Sense Census: Media Use by Tweens and Teens

0%
36%
19%
32% 31% 31%
Infrequent Moderate Frequent
10%
20%
30%
40%
50%51%
0%
51%49%
60%
40%
Non Interactive Interactive
10%
20%
30%
40%
50%
60%
Interactive vs Non-Interactive Hardware
Interactive hardware was defined as:
• Digital capture boards
• Interactive projectors
• Interactive whiteboards
• Interactive flat panels/displays
Non-interactive hardware was defined as:
• Projectors
• Streaming devices
Those who use non-interactive projectors frequently reported the lowest impact across all success factors.
Those who use interactive hardware frequently saw a more positive impact on the ‘Visible Learning’ success metric.
Positive Success Non InteractiveMixed or Limited Success Interactive
High Use of Classroom Hardware Impact on Insight to Learning

Software vs Hardware
When comparing high frequency users of software and hardware we found that overall software is more closely related to success than hardware.
Below represents just a sample of the data:
Software
Hardware
Positive success
Mixed or limited success
Positive success
Mixed or limited success
Whole-class Collaborative Software
Tablets
Student Co-Creation Software
Laptops, PCs
Assessment Software
Smartphones
Gamification Software
Non-Interactive Projectors

0%1%
9%
28%
49%
12%
2%
9%
37%
41%
11% 11%
51%
24%
10%
5%6%
22%
39%
25%
8%10%
20%
30%
40%
Student Action:Indivudual
Student Action:Groups
Student Action:Projects
Student Action:Feedback
50%
60%
Never
Weekly
Daily
Monthly
Most lessons
Learning Strategies
While the strongest impact on success measures came from assessment and collaboration software, it is more common for students to work individually. They also tend not to receive feedback daily.

Stud
ent A
ctio
n: In
divi
dual
Stud
ent A
ctio
n: G
roup
s
Stud
ent A
ctio
n: P
roje
cts
Stud
ent A
ctio
n: F
eedb
ack
Teac
her A
ctio
n: In
stru
ct...
Teac
her A
ctio
n: A
ssig
n - g
roup
s
Teac
her A
ctio
n: W
ritte
n Fe
edba
ck
SALT
ISE:
Thi
nk-P
air-
Shar
e
SALT
ISE:
Ana
lysi
s &
Pro
blem
SALT
ISE:
Vis
ualiz
atio
n
SALT
ISE:
Les
s St
ruct
ured
0
0.1
0.2
0.3
0.4
0.5
0.6
0.7
0.8
0.9
1
Stud
ent A
ctio
n: In
divi
dual
Stud
ent A
ctio
n: G
roup
s
Stud
ent A
ctio
n: P
roje
cts
Stud
ent A
ctio
n: F
eedb
ack
Teac
her A
ctio
n: In
stru
ct...
Teac
her A
ctio
n: A
ssig
n - g
roup
s
Teac
her A
ctio
n: W
ritte
n Fe
edba
ck
SALT
ISE:
Thi
nk-P
air-
Shar
e
SALT
ISE:
Ana
lysi
s &
Pro
blem
SALT
ISE:
Vis
ualiz
atio
n
SALT
ISE:
Les
s St
ruct
ured
0
0.1
0.2
0.3
0.4
0.5
0.6
0.7
0.8
0.9
1
Collaboration
Though collaborative tasks are used less frequently in the classroom, the data indicates that when they are used frequently, success follows.
Low Frequency PracticeHigh Frequency Practice
Never Monthly Weekly Daily Most Lessons

Integration
Those who reported successful integration of their classroom technology (integrating devices, hardware and software) consistently reported better success.
No/Minimal Impact Very Strong Positive
Level of Integration
Content Devices
Front of room hardware
Software
Content Devices
Front of room hardware
Software

0%
< 5 years 5 to < 10 years 10 to < 20 years 20 + years
20%
40%
60%
0%
4 to < 11 11 to < 15 5 to < 19 19 + years
20%
40%
60%
0%
< 5 years 5 to < 10 years 10 to < 20 years 20 + years
20%
40%
60%
0%
4 to < 11 11 to < 15 5 to < 19 19 + years
20%
40%
60%
Device Distraction
Views on whether devices are a distraction in the classroom revealed trends that are particularly relevant when planning professional development.
Teachers with more experience are less likely to have concerns about devices being a distraction.
As students get older, their teachers are more likely to have concerns about devices being a distraction.

Challenges Associated with Technology
When asked to relate the most pressing challenges faced, respondents identified:
“My top challenge is navigating through what technology works best and well with and for my students, and for what projects and/or classwork.”
- Survey Respondent
“The top challenge for me is to make teachers realize that effective teaching is not about the technology but about the pedagogy.”
- Survey Respondent
16% 14%Choosing technology for specific teaching approaches and students’ variations (in age, skills or knowledge)
Time or resources to learn the technology, planning and creating curriculum with the technology and content availability

0%
45%
55%
Success: Preparation for Standardized Tests
24%
Success: SEL Skills
10%
20%
30%
40%
50%
60%
70%
76%
Reported Achievements
Investment in pedagogy and technology impacts SEL skills more than standardized test preparation.
Minimal / Some Positive Impact
Strong / Very Positive Impact
Success

0%
23%
78%
Success: Students Feel Safe to Contribute
27%
74%
Success: Peer Discussion
Success: Interdependence
34%
66%
31%
69%
Success: Visible Learning
10%
20%
30%
40%
50%
60%
70%
Success: Every Student Participating
75%
26%
Reported Achievements
The impact of investment in pedagogy and technology on in-classroom teaching practice:
• ‘Students feel safe to contribute’, ‘Peer discussion’ and ‘Every student participating’ all demonstrated positive success
• ‘Interdependence’ showed the least positive impact
As achieving higher forms of collaborative practices (interdependence) is the lowest rated, the suggestion is that it requires
further attention.
Minimal / Some Positive Impact Strong / Very Positive Impact

Teac
hing
, Tec
hnol
ogy
and
Lear
ning
: und
erst
andi
ng th
e in
terc
onne
ctio
n | 2
016
36
CONCLUSIONS

Conclusions:
• The fusion of great teaching practice with technology-rich environments results in much higher reporting of outstanding success
• The frequent use of active learning practices relates strongly to success
• SEL skills are becoming more prioritized than standardized tests by many in the education sphere
• A teacher’s view on how learning works relates to success outcomes
• Evidence suggests the importance of software, even over hardware, when trying to achieve success
• Assessment software is most closely tied to success, followed by collaborative and content creation software
• Interactive front-of-room display hardware outperforms non-interactive projectors
• The successful integration of varied technologies in the classroom positively impacts success
• Group activity in the classroom is significantly and positively related to social-emotional skill development and supportive metrics
Challenges:
• Students are mostly using their devices to consume content rather than to create content
• Attention needs to be given to increasing the frequency and quality of collaborative tasks
• Students need to be provided with more opportunities for feedback (daily vs weekly)
• Views on technology as a distraction vary based on teacher experience and student age

Teac
hing
, Tec
hnol
ogy
and
Lear
ning
: und
erst
andi
ng th
e in
terc
onne
ctio
n | 2
016
38
In Closing
Whereas some research (including the OECD report) leads us to conclude that technology can amplify great teaching, but not replace poor teaching, this research finds differently. It indicates that while technology can certainly amplify great teaching, it can also help those with poor practices find greater success.
That said, accelerating the impact of technology in education requires a more effective approach. An approach that considers the various interconnections of hardware, software, high-performing pedagogies and classroom contexts. Insight gathered from this type of approach will not only actualize the potential of existing classroom technology, but also spur its more effective use across the globe.
SMART can help
Decades of experience and expertise in education and technology uniquely positions SMART to stay on top of emerging pedagogies. We partner with educators to design products for schools, keeping only the goal of making
learning come alive in mind.
To learn more about our offering of education-focused software, interactive displays
and whiteboards, please visit
smarttech.com/education