teachers' retirement system of the state of kentucky · teachers’ retirement system of the...
TRANSCRIPT

A Component Unit of the Commonwealth of KentuckyFiscal Years Ended June 30, 2017 and 2016
Teachers’ Retirement Systemof the State of Kentucky
479 Versailles RoadFrankfort, Kentucky 40601-3800
This report was prepared by theTeachers' Retirement System staff.
Teachers' Retirement Systemof the State of Kentucky
GARY L. HARBIN, CPAExecutive Secretary
The 77th ComprehensiveAnnual Financial Report

ii Teachers’ Retirement System of the State of Kentucky • Years Ended June 30, 2017 and 2016
TABLE OF CONTENTS
~ INTRODUCTORY SECTION ~
Chair’s Letter ............................................................................................................................. 2Letter of Transmittal ................................................................................................................. 3Board of Trustees ....................................................................................................................... 9Administrative Staff and Professional Consultants .......................................................... 10Organizational Chart .............................................................................................................. 11GFOA Certificate of Achievement ........................................................................................ 12PPCC Achievement Award .................................................................................................... 13
~ FINANCIAL SECTION ~Independent Auditor’s Report ............................................................................................... 16Management’s Discussion & Analysis ................................................................................. 18Basic Financial Statements
Statement of Fiduciary Net Position ................................................................................ 22Statement of Changes in Fiduciary Net Position .......................................................... 24Combining Statement of Fiduciary Net Position - Other Funds ................................ 26Combining Statement of Changes in Fiduciary Net Position - Other Funds ........... 27Notes to Financial Statements .......................................................................................... 29
Required Supplemental InformationSchedule of Changes in the Net Pension Liability ........................................................ 59Schedule of Net Pension Liability .................................................................................... 60Schedule of Employer Contributions ............................................................................... 60Schedule of Changes in the Net OPEB Liability – Medical Insurance Plan ............. 62Schedule of Net OPEB Liability – Medical Insurance Plan ......................................... 63Schedule of Employer Contributions – Medical Insurance Plan ............................... 63Schedule of Investment Returns – Health Insurance Trust ........................................ 64Schedule of Changes in the Net OPEB Liability – Life Insurance Plan ..................... 64Schedule of Net OPEB Liability – Life Insurance Plan ................................................. 65Schedule of Employer Contributions – Life Insurance Plan ....................................... 65Schedule of Investment Returns – Life Insurance Trust .............................................. 66
Additional Supporting SchedulesSchedule of Administrative Expenses ............................................................................... 67Schedule of Professional Services and Contracts ............................................................ 67Schedule of Contracted Investment Management Expenses ........................................ 68
~ INVESTMENT SECTION ~Report on Investment Activity ................................................................................................ 74Consultant Letter ........................................................................................................................ 75Retirement Annuity Trust Fund
Investment Policy Summary and Objectives ................................................................. 76Risk Controls ........................................................................................................................ 76Asset Allocation ................................................................................................................... 76Distribution of Investments .............................................................................................. 78Strategic Weightings by Asset Class ................................................................................ 79Portfolio Returns .................................................................................................................. 79Fixed Income Investments ................................................................................................. 81Equity Investments ............................................................................................................. 82Real Estate Investments ..................................................................................................... 85
TABLE OF CONTENTS

Teachers’ Retirement System of the State of Kentucky • Years Ended June 30, 2017 and 2016 iii
TABLE OF CONTENTS
Alternative Assets ............................................................................................................... 86Portfolios Fair Values .......................................................................................................... 89Investment Summary ......................................................................................................... 90Contracted Investment Management Expenses ............................................................ 90Ten Largest Stock Holdings ............................................................................................... 92Top Ten Fixed Income Holdings ....................................................................................... 92Transaction Commissions .................................................................................................. 93Proxy Voting and Corporate Behavior ............................................................................ 95Security Lending .................................................................................................................. 95Kentucky Investments ........................................................................................................ 95Professional Service Providers .......................................................................................... 96
Health Insurance Trust FundInvestment Policy and Objectives .................................................................................... 97Risk Controls ........................................................................................................................ 97Asset Allocation ................................................................................................................... 98Distribution of Investments .............................................................................................. 98Portfolio Returns .................................................................................................................. 99Portfolios Fair Values ........................................................................................................ 100Investment Summary ....................................................................................................... 100Contracted Investment Management Expenses .......................................................... 101Schedule of Contracted and Administrative Investment Expenses .......................... 101Professional Service Providers ........................................................................................ 102
~ ACTUARIAL SECTIONS ~Actuarial Annual Valuation
Actuary’s Certification Letter ......................................................................................... 104Summary of Principal Results ......................................................................................... 106Membership Data .............................................................................................................. 108Assets ................................................................................................................................... 109Comments on Valuation .................................................................................................. 109Contributions Payable Under the System ..................................................................... 109Comments on Level of Funding ...................................................................................... 111Analysis of Financial Experience .................................................................................... 113Accounting Information .................................................................................................. 113Valuation Balance Sheet .................................................................................................. 115Solvency Test ...................................................................................................................... 116Development of Actuarial Value of Assets .................................................................. 116Summary of Receipts and Disbursements ..................................................................... 117Outline of Actuarial Assumptions and Methods ......................................................... 118Actuarial Cost Method ...................................................................................................... 120Summary of Main System Provisions as Interpreted for Valuation Purposes ....... 120Table of Distribution of Active Members ...................................................................... 123
Table of Active Member Valuation Data ....................................................................... 124Table of Number of Retired Members, Beneficiaries and their Benefits by Age .... 124Table of Retirees, Beneficiaries, and Survivors Added to and Removed from Rolls ......................................................................... 125Board Funding Policy.......................................................................................................... 126Sensitivity Analysis ............................................................................................................. 127

iv Teachers’ Retirement System of the State of Kentucky • Years Ended June 30, 2017 and 2016
TABLE OF CONTENTS
Actuarial Medical and Life Insurance ValuationActuary’s Certification Letter .......................................................................................... 132Summary of Principal Results .......................................................................................... 134Membership Data ............................................................................................................... 136Assets .................................................................................................................................... 137Comments on Valuation ................................................................................................... 137Derivation of Experience Gains and Losses .................................................................. 138Contributions Payable Under the Plans ......................................................................... 139Comments on Level of Funding ....................................................................................... 140Accounting Information ................................................................................................... 140Schedule of Funding Progress .......................................................................................... 141Schedule of Employer Contributions .............................................................................. 142Results of Valuation ........................................................................................................... 145Solvency Test ....................................................................................................................... 145Development of the Actuarial Value of Assets ............................................................ 146Summary of Receipts and Disbursements ..................................................................... 148Statement of Actuarial Assumptions and Methods .................................................... 149Summary of Main Plan Provisions as Interpreted for Valuation Purposes ............ 154Table of Distribution of Active Members ...................................................................... 158Table of Total Active Member Valuation Data ............................................................ 159Table of Eligible Deferred Vested Members .................................................................. 159All Retirees and Spouses Receiving Health Benefits ................................................... 160Table of Retirees, Beneficiaries, and Survivors
Added to and Removed from Rolls .......................................................................... 160Sensitivity Analysis – Medical Insurance Fund ............................................................ 161Sensitivity Analysis – Life Insurance Fund .................................................................... 164
~ STATISTICAL SECTION ~Defined Benefit Plan
Additions by Source ........................................................................................................... 169Deductions by Type ............................................................................................................ 169Changes in Plan Net Position ........................................................................................... 169
Medical Insurance PlanAdditions by Source ........................................................................................................... 170Deductions by Type ............................................................................................................ 170Changes in Plan Net Position ........................................................................................... 170
Life Insurance PlanAdditions by Source ........................................................................................................... 171Deductions by Type ............................................................................................................ 171Changes in Plan Net Position ........................................................................................... 171
Distribution of Active Contributing Members .................................................................. 171Principal Participating Employers ....................................................................................... 172TRS Schedule of Participating Employers .......................................................................... 172Geographical Distribution of Retirement and Medical Payments Worldwide .......... 174Geographical Distribution of Retirement and Medical Payments Statewide ............. 175Growth in Annuitants ............................................................................................................ 176Schedule of Annuitants by Type of Benefit ........................................................................ 176Schedule of Annuitants by Option Selected ....................................................................... 176Defined Benefit Plan Average Benefit Payments for the Past Ten Years ..................... 177Medical Insurance Plan Average Insurance Premium
Supplements for the Last Five Years .............................................................................. 178Summary of Retiree Sick Leave Payments ......................................................................... 179Funding of Additional Payments ......................................................................................... 179

2017
IntroductorySection
Teachers’ Retirement Systemof the State of Kentucky

2 Teachers’ Retirement System of the State of Kentucky • Years Ended June 30, 2017 and 2016
INTRODUCTORY SECTION
BOARD OF TRUSTEES RON SANDERSChair, HodgenvilleALISON WRIGHTVice Chair, Georgetown
MARY ADAMSBrodheadJOHN BOARDMANLexington
FRANK COLLECCHIALouisvilleHOLLIS GRITTONUnion
BRENDA MCGOWNBowling GreenLAURA SCHNEIDERWaltonJOSH UNDERWOODTollesboro
ALLISON BALLState TreasurerSTEPHEN PRUITT, Ph.D.Education Commissioner_________________________
GARY L. HARBIN, CPAExecutive Secretary
Chair’s Letter
Teachers’ Retirement Systemof the State of Kentucky
December 18, 2017 Dear Members:On behalf of the Board of Trustees and staff, I am pleased to presentthis Comprehensive Annual Financial Report of the Teachers' RetirementSystem of the State of Kentucky for the year ending June 30, 2017, the 77thyear of operation of the system. The accompanying reports from theindependent auditor and the consulting actuary substantiate the financialintegrity and the actuarial soundness of the system.TRS closed the 2016-2017 fiscal year with $19.8 billion net assets. Theactive membership totaled 72,130 and the retired membership was 52,966with an annual annuity and medical insurance benefits of $2.1 billion.The Board of Trustees is totally committed to managing the retirementsystem funds in a prudent, professional manner. Every effort will be madeto ensure that the system continues to operate in a fiscally sound manner.Present and future members of the system deserve to be able to availthemselves of the best possible retirement as authorized by statute.We appreciate the support and cooperation extended by the governorand the legislature. This cooperation allows the system to not only meetcurrent challenges but to also make timely provisions for the future.The Board of Trustees pledges to continue to administer the affairs ofthe Teachers' Retirement System in the most competent and efficientmanner possible.
Sincerely,Ron SandersChairBoard of Trustees

Teachers’ Retirement System of the State of Kentucky • Years Ended June 30, 2017 and 2016 3
INTRODUCTORY SECTION
Teachers’ Retirement Systemof the State of Kentucky
December 18, 2017
Honorable Matthew G. Bevin, GovernorCommonwealth of KentuckyCapitol BuildingFrankfort, Kentucky
Dear Governor Bevin:
It is my pleasure to submit the 77thComprehensive Annual Financial Report of theTeachers' Retirement System of the State ofKentucky (TRS), a component unit of theCommonwealth of Kentucky, for the fiscal yearended June 30, 2017. Allow me to begin again thistransmittal letter with an expression of my thanksfor your work and the work of the GeneralAssembly in approving a biennial budget for thecommonwealth that provides $973 million inadditional funding for TRS. The first year of thatfunding resulted in TRS receiving 99 percent of theactuarially determined employer contribution(ADEC) for the period - a dramatic increase overprior budgets that already is being invested to fulfillthe promise made by the state to teachers. Theimportance of the consistent full funding of theretirement plan for Kentucky's teachers cannot beoverstated.
TRS produced this annual report, which isrequired by state law and contains the annual auditand actuarial valuation of the retirement system,that provides you, the General Assembly and thepublic with information necessary to betterunderstand TRS, which is the largest financialinstitution in the commonwealth. Contained withinare numerous examples of how Kentucky teachers'future well-being is being provided for at a low costwith a great economic benefit for those educatorsand the state's businesses that receive many of theretirement dollars spent by the 89 percent ofretirees who live in Kentucky.
This report conforms with the principles ofgovernmental accounting and generally acceptedaccounting principles. Responsibility for both the
accuracy of the data and the completeness andfairness of the presentation, including alldisclosures, rests with TRS management. To thebest of management's knowledge and belief, theenclosed data is accurate in all material aspectsand reported in a manner designed to presentfairly the financial position and results ofoperations of TRS for the year ended June 30, 2017.Discussion and analysis of net assets and relatedadditions and deductions are presented inManagement's Discussion and Analysis in theFinancial Section of this report.
Management is responsible for maintaining asystem of internal controls to establish reasonableassurance that assets are safeguarded, transactionsare executed accurately and financial statementsare presented fairly. Limits are inherent in allsystems of internal control based on therecognition that the costs of such systems shouldbe related to the benefits to be derived.Management believes the system's controlsprovide this appropriate balance. The system ofinternal controls includes policies and proceduresand an internal audit department that reports tothe Board of Trustees.
Profile of TRS
TRS began operations on July 1, 1940, as a cost-sharing, multiple-employer defined benefit plan.The primary purpose of the plan is to provideretirement annuity plan coverage for local schooldistricts and other public educational agencies inthe state. TRS is a blended component unit of theCommonwealth of Kentucky. The plan is describedin the Notes to Financial Statements in theFinancial Section of this report. Also, the Summaryof Main System Provisions as Interpreted forValuation Purposes in the Actuarial Section, isuseful in understanding benefit and contributionprovisions. The number of TRS active and retiredmembers is contained in the preceding boardchair's letter.
An annual operating budget is prepared for theadministration of the retirement system andapproved by the Board of Trustees. Biennial budgetrequests also are submitted to the GeneralAssembly for adoption. TRS's investment earningspay for the agency's administrative expenses,which are among the lowest of its peers.
During fiscal year 2017, the enactment of SenateBill 2 (2017 RS) expanded the Board of Trustees
Letter of Transmittal

4 Teachers’ Retirement System of the State of Kentucky • Years Ended June 30, 2017 and 2016
INTRODUCTORY SECTION
from its longstanding makeup of nine members to11; the additional two members are appointed bythe governor with the requirement that bothappointees have financial experience.
Major Initiatives
The system continually seeks better to serve itsmembership as the highest levels ofprofessionalism, integrity, performance andteamwork are required at all levels of theorganization. TRS is an organization that "does itright." As such, during the past year, TRS hascontinued work on several major initiativesconcerning funding and cost containment forretiree health care, the investment program andinformation technology.
Implementation of the "Shared Responsibility"Solution for Funding Retiree Health Care andCareful Management of Medical Insurance Costs
Kentucky continues to be a national leader inprefunding retiree health care benefits as a resultof the shared responsibility solution enacted in2010 through the collective efforts of the Board ofTrustees, the education community and electedofficials. The plan immediately eliminated $3.1billion in actuarial liability from the retiredteacher health care plan. Combined with othercost control measures, more than $5 billion inactuarial accrued liability has been eliminatedfrom the TRS Medical Insurance Fund. In onlyseven years, the medical insurance fund hasreached 26.7 percent funding compared to pay-as-you-go status before the law took effect. With thesix-year phase-in period having ended in 2016, themedical plan saw a one-year funding ratioincrease in 2017 of 4.8 percentage points. Thisremarkable improvement confirms that themedical insurance fund is on schedule to befunded fully in 23 years. The shared responsibilitysolution is truly a significant accomplishment forthe retirement security of current and futureretired teachers.
TRS is efficient, effective and always working toimprove the retirement security of Kentucky'steachers. The latest such initiative is the additionof a new personalized medicine pilot projectunder TRS's Medicare Eligible Health Plan.Personalized medicine uses DNA testing to help apatient's doctor make more effective treatmentdecisions for better health outcomes. This pilot,which has been months in development and
began in fall 2017, is focused on making sure thata retiree's medications are safe and will bebeneficial. Without this testing, medicines may beprescribed that won't work with a retiree'sindividual physiology (as shown through DNAtesting) and that, in some cases, may be fatal.Coriell Life Sciences, which has been providingclinical research services for more than 64 years,is TRS's partner in the pilot. Besides the healthbenefit to retirees, the pilot is expected to providesignificant cost savings to the plan by reducingadverse drug reactions and the trial-and-errorperiod that some patients see.
The Board of Trustees regularly reviews thehealth care plan to contain costs and maintain ameaningful benefit for retired teachers. The moveto Medicare Advantage, now in the 11th year,continues to be stable and financially feasible forour members and the TRS medical plan. The costof coverage for 2018 is a reduction from the 2017cost.
Some recent cost-saving initiatives includemoving the TRS-sponsored Medicare Part DEmployer Group Waiver drug plan from fullyinsured to a self-funded plan to achieve thegreatest federal subsidies. Additionally, TRS ispart of the Know Your Rx Coalition, which itjoined in 2012. Through the coalition, TRS savesmoney leveraging greater prescription purchasingpower, obtaining deeper drug discounts andincreasing the rate at which prescriptions arefilled with generic drugs from 73 percent to 88percent. Additionally, coalition pharmacists workwith retired teachers and their physicians tomaximize prescription dollars both for the retireeand the medical plan.
Implementation of Senate Bill 2
In June 2017, the board adopted an investmentprocurement policy, which built upon andcentralized existing TRS investing procurementpractices, to comply with the provisions of SB 2.TRS was the first of the state’s retirement systemsto have its policy certified by the secretary of theFinance and Administration Cabinet.Implementation of the other provisions of SB 2continues.
Investment Program
For the fiscal year ended June 30, 2017, themarket value of TRS's investment programincreased a net 15.0 percent for retirement and

Teachers’ Retirement System of the State of Kentucky • Years Ended June 30, 2017 and 2016 5
INTRODUCTORY SECTION
14.4 percent for the medical insurance trust pushing total plan assets to a record of $19.9 billion. While a one-year period is not determinative for a long-term investor such as TRS, it should be noted that the gross return of 15.37 percent was among the top 8 percent of public plans with more than $1 billion under management. During the last 10 years, TRS's investment returns rank in the top 9 percent of those plans. Moreover, during the last 30 years, TRS investment returns of 8.18 percent have met the long-term assumed rate of return of 7.5 percent.
A multiyear program of diversifying theportfolio continued in line with TRS's focus onfundamental value and risk control. Theseongoing efforts are a continuation of a disciplinedinvestment process and long-term focus onretirement security. This focus has generatedexceptionally stable returns through the system'shistory, and we have every confidence that it willdo so in the future. TRS's investment programcontinues to be recognized as a leader in thepublic pension community for governancestructure, trustee education and cost effectiveness.
TRS regularly obtains independent reviews andalways is seeking to improve its investmentprogram and continue the tradition of adhering tobest governance practices that lead to soundinvestment returns. For example, with theadditional funding provided in the 2016-18biennial budget, TRS conducted an asset liabilitymodeling study and reviewed actuarialassumptions. The studies confirmed TRS'sapproach and the importance of the consistent fullfunding of the ADEC.
Information Technology
The Pathway information technology systemcontinues to be a success, allowing members toaccess account information online - availableanytime from anywhere. The member self-serviceportal in Pathway, its mobile device applicationand the TRS website continued to be updated. Asite index was added to the website. Staffcurrently is working with the KentuckyDepartment for Libraries and Archives to updateTRS's records retention schedule consistent withPathway's data and document storagecapabilities.
Communications
To reach members more easily, TRS continuedusing Facebook and Twitter accounts tocommunicate information about the system on amore timely basis. In less than two years, theFacebook account has received almost 2,100 likes,and posts often reach more than 1,000 users - ledby 33,239 users who saw a post on the system'sinvestment performance for fiscal year 2017.
Also, TRS revamped and added informationalseminar offerings for members. The new TRS OnThe Road takes place on Saturdays three times peryear in different parts of the state. Additionally,under the direction of the Member Servicesdivision, webinars of popular seminars are beingoffered and videos of popular informationalseminars began being posted to the TRS website.The Insurance division expanded the offerings ofits Turning 65 presentation for retirees about toenroll in the Medicare Eligible Health Plan.
Internal and External Reviews
TRS responds to legislative and administrationinquiries and mandates throughout the year. Inconnection with possible pension reform, TRSreceived - and responded to - numerous requestsfrom legislators, the executive branch, constituentgroups and others to provide accurateinformation about the experience of the system.
Economic Condition
The economic condition of the system is basedprimarily on investment earnings. The InvestmentSection of this report contains asset allocations,strategic target ranges for investments, discussionof the current year market environment andhistorical performance schedules, among others.
As of June 30, 2017, the retirement system'stotal funds reached $19.8 billion in market value.The retirement system's investment performancehas been strong in recent years relative to itspeers. As of June 30, 2017, TRS achieved one-yeargross returns of 15.37 percent with top 8 percentinvestment performance. The fiscal year wascharacterized by increasing global economicgrowth. This favorable environment producedstrong returns for domestic and internationalequities, the system's two largest asset classes.
TRS has beaten the independent investmentconsultant's public fund index in the one-, three-,

6 Teachers’ Retirement System of the State of Kentucky • Years Ended June 30, 2017 and 2016
INTRODUCTORY SECTION
five- and 10-year periods, achieving top 9 percentperformance over the 10-year period. This recordvalidates policy changes adopted by the board andimplemented by the Investment Committee overthe last several years. TRS's commitment to bestpractices, stringent risk controls and fundamentalvalue philosophy in investing helps ensure long-term retirement security for Kentucky's teachers.
According to KRS 161.430, the TRS Board ofTrustees is responsible for investing the assets ofthe system. The Board of Trustees delegatesinvestment authority to the InvestmentCommittee. The Investment Committee worksclosely with experienced investment counselorsand the system's professional staff in evaluatingand selecting investment allocations.
The investment objectives of the Board ofTrustees are to ensure that funds shall be investedsolely in the interest of its members and theirbeneficiaries and that investment income shall beused for the exclusive purpose of providingbenefits to the members and their beneficiaries,while making payment of reasonable expenses inadministering the plan and its trust funds. Theinvestment program shall also provide areasonable rate of total return with majoremphasis being placed upon the protection of theinvested assets.
The investment portfolio experienced anincrease in value during the 2016-2017 fiscal yearas the market value went from $17,405,060,831 to$19,433,790,384. The increase in value of theportfolio was the result of favorable marketconditions, additional funding provided by thegovernor and General Assembly for the pensionfund. Interest income, dividends and employerand employee contributions also providedsignificant income to the portfolio.
Net investment income totaled $2,572,143,912for 2016-2017 compared to negative $249,661,104for 2015-2016. The major contributing factor of theincrease in return from the system's investmentportfolio resulted from the net appreciation in fairvalue of investments of $2,254,023,748 at June 30,2017 compared to net depreciation of $598,818,560at June 30, 2016.
As mentioned earlier, it should be noted thatTRS annuities bolster the Commonwealth ofKentucky's economy, as 89 percent of retiredteachers reside within the state. TRS paid morethan $2 billion in total benefits (retirement,medical, etc.) during the fiscal year.
Funding
The first benefits from the additional funding inthe 2016-18 state budget (2016 RS HB 303) wereseen as TRS received 99 percent of the ADEC in thebiennium's initial year.
Based on recommendations of the Board ofTrustees, the General Assembly establishes, bystatute, the contribution levels that are to be madeby members and employers to fund the liabilitiesof the system. Each year, an independent actuaryperforms a valuation to determine whether thecurrent levels of contribution will be sufficient tocover the cost of benefits earned by members.
Since fiscal year 2008, the state has not paid thefull recommended annual employer contributionnecessary to prefund the benefit requirements ofmembers of the retirement system as determinedby the actuary. Over this period, because of notmaking the additional appropriation beyondsalary-based contributions, the actuary says thestate's annual additionally required employercontributions have grown significantly from $60.5million (fiscal year 2009) to $538.3 million (fiscalyear 2020). The following schedule details thegrowth of the additional annual employercontributions payable by the state:
The board always has acted as required by statelaw and recommended annual employercontributions payable by the state that wouldensure that the state meets the contractualobligations to members.
The latest actuarial valuation was for the periodending June 30, 2017. This report reflects the
FiscalYear
200920102011201220132014201520162017201820192020
CumulativeIncreaseas a %
of Payroll
1.882.463.595.817.278.02
10.4212.9713.8013.4914.6114.10
CumulativeIncrease in Annual
Retirement AppropriationsPayable by the State
$ 60,499,80082,331,200
121,457,000208,649,000260,980,000299,420,000386,400,000487,400,000520,372,000512,883,000553,597,000538,253,000
(Source: TRS Report of the Actuary on the Annual ValuationPrepared as of June 30, 2017).
%

Teachers’ Retirement System of the State of Kentucky • Years Ended June 30, 2017 and 2016 7
INTRODUCTORY SECTION
system's actuarial value of assets totaling $18.5billion and actuarially determined liabilitiestotaling $32.8 billion. The funded ratio of actuarialassets to liabilities is 56.4 percent, which is anincrease from the previous year and is dueprimarily to market appreciation of investmentsand smoothing of investment returns. The actuaryreports: "In our opinion, the system has not beenfunded on an actuarially sound basis since the fullactuarially determined contributions were notmade by the employer. However, an additionalappropriation of $498.5 million was made duringfiscal year 2017 and an additional appropriation of$474.7 million is expected to be made during fiscalyear 2018. If contributions by the employer to thesystem in subsequent fiscal years are less thanthose required, the assets are expected to becomeinsufficient to pay promised benefits. Assumingthat contributions to the system are made by theemployer from year to year in the future at ratesrecommended on the basis of the successiveactuarial valuations, the continued sufficiency ofthe assets to provide the benefits called for underthe System may be safely anticipated."
Annual required employer contributions for thedefined benefit plan are provided in the Scheduleof Employer Contributions in the RequiredSupplemental Information of the Financial Sectionof this report. Based on the 2017 valuation report,the actuary recommends a cumulative increase inemployer contributions of 14.10 percent of pay forthe 2019-2020 fiscal year as detailed in theContribution Rates tables in the Summary ofPrincipal Results in the Actuarial Section of thisreport.
TRS Medical Insurance Plan
The shared responsibility solution for fundingretiree health care, which went into effect on July1, 2010, provides a method of prefunding retireehealth care over the next 23 years. In only sevenyears, the medical insurance fund has reached 26.7percent funding compared to pay-as-you-go statusbefore the law took effect (with the most recentyear being a gain of 4.8 percentage points). Theresults confirm that the medical insurance fund ison schedule to be funded fully in 23 years and thatthe 2010 solution is working. The sharedresponsibility solution for funding retiree healthcare will help ensure the retirement security of thestate's teachers. An actuarial valuation of theMedical Insurance Plan for the fiscal year endedJune 30, 2017, indicated that the fund has an
unfunded liability of $2.71 billion. Annualrequired employer contributions for the MedicalInsurance Fund are provided in the Schedule ofEmployer Contributions in the RequiredSupplemental Information of the FinancialSection.
The actuary's opinion is: "… if the contributionsto the Medical Insurance Fund (MIF) continue atthe current statutorily required levels, the fundedratio of the Retiree Medical Plan will continue toincrease, and the ability of the MIF to fund thebenefits called for under the Retiree Medical Planwill improve."
Additionally, the system believes continuedsteps must be taken to realize true costcontainment through legislation on both the stateand national levels and TRS will continue takingadvantage of those measures.
Professional Services
Professional consultants are appointed by theBoard of Trustees to perform services that areessential to the effective and efficient operation ofTRS. Certifications from the board's externalauditor and independent actuary are enclosed inthis report. The system's consultants, which areappointed by the board, are listed in theAdditional Supporting Schedules of the FinancialSection and in the Investment Section'sProfessional Service Providers table and HealthInsurance Trust Professional Service Providerstable.
National Recognition
The System was honored by two nationalprofessional organizations in regard to theadministration of the retirement program.
GFOA Certificate of Achievement
The Government Finance Officers Associationof the United States and Canada (GFOA) awardeda Certificate of Achievement for Excellence inFinancial Reporting to the Teachers' RetirementSystem of the State of Kentucky for itsComprehensive Annual Financial Report (CAFR)for the fiscal year ended June 30, 2016. TheCertificate of Achievement is a prestigiousnational award recognizing conformance with thehighest standards for preparation of state andlocal government financial reports.
To be awarded a Certificate of Achievement, agovernment unit must publish an easily readable

8 Teachers’ Retirement System of the State of Kentucky • Years Ended June 30, 2017 and 2016
INTRODUCTORY SECTION
and efficiently organized comprehensive annualfinancial report, whose contents conform toprogram standards. Such CAFRs must satisfy bothgenerally accepted accounting principles andapplicable legal requirements.
A Certificate of Achievement is valid for oneyear. TRS has received the Certificate ofAchievement for the last 29 consecutive years(fiscal years ended 1988-2016). TRS believes thecurrent report continues to conform to theCertificate of Achievement program requirements,and is being submitted to GFOA.
PPCC Achievement Award
The Public Pension Coordinating Council (PPCC)awarded a Certificate of Achievement to theTeachers' Retirement System of the State ofKentucky for 2017 for implementing andmaintaining high professional standards inadministering the affairs of the system. The awardis based on compliance with principles judged tounderlie exemplary retirement systemachievements in the areas of benefits, actuarialvaluation, financial reporting, investments anddisclosure. Those principles widely areacknowledged to be marks of excellence in thepublic pension industry.
The PPCC is a coalition of three nationalassociations that represent public retirementsystems and administrators. Combined, theseassociations serve retirement systems that providepension coverage for most of the nation's 16 millionemployees of state and local government. Theassociations that form the PPCC are the NationalAssociation of State Retirement Administrators; theNational Council on Teacher Retirement; and theNational Conference on Public EmployeeRetirement Systems.
NCTR Executive Committee
I am past-president of the National Council onTeacher Retirement (NCTR). NCTR is a national,nonprofit organization with a mission to promoteeffective governance and benefits administration instate and local public pension systems in order thatadequate and secure retirement benefits areprovided to educators and other plan participants.NCTR membership includes 69 state, territorial,local and university pension systems withcombined assets in excess of $2 trillion, servingmore than 18 million active and retired teachers,non-teaching personnel and other publicemployees.
Public Sector HealthCare Roundtable
Additionally, I serve on the Board of Directorsand as president of the Public Sector HealthCareRoundtable. The roundtable is a national coalitionof public sector health care purchasers that wasformed to ensure that the interests of the publicsector are represented properly during theformulation, debate and implementation of federalhealth care policies. Membership in the roundtableis open to any statewide, regional or localgovernmental unit that provides health carecoverage for public employees and retirees.
Acknowledgements
The preparation of this report reflects thecombined efforts of the TRS staff, under theleadership of the Board of Trustees. The report isintended to provide complete and reliableinformation that serves as a basis for makingmanagement decisions and for determiningcompliance with legal provisions. It also is used todetermine responsible stewardship of the assetscontributed by TRS members and their employers.
This report is located at the TRS web addresshttps://trs.ky.gov/financial-reports-information/#CAFR and is made available to all systememployer members, whose cooperation continuesto contribute significantly to TRS's success, andwho form the vital link between TRS and its activemembers.
TRS management and staff are committed to thecontinued operation of an actuarially sound andefficient retirement system. Again, thanks to youand the General Assembly for the additionalbudget funding that is ensuring retirement securityfor teachers. Your support is an essential part ofthis commitment, and we look forward to workingwith you.
Respectfully submitted,
Gary L. Harbin, CPAExecutive Secretary

Teachers’ Retirement System of the State of Kentucky • Years Ended June 30, 2017 and 2016 9
INTRODUCTORY SECTION
BOARD OF TRUSTEES
Allison Ball Ex Officio Trustee
State Treasurer
Ron Sanders Chair
Lay Trustee Hodgenville
Alison Wright Vice Chair
Active Teacher Trustee Georgetown
Mary Adams Active Teacher Trustee
Brodhead
Hollis Gritton Lay Trustee
Union
Josh Underwood Active Teacher Trustee
Tollesboro
Stephen Pruitt, Ph.D. Ex Officio Trustee
Commissioner, Dept. of Education
John Boardman Appointed
Trustee Lexington
Frank Collecchia Appointed
Trustee Louisville
Brenda McGown Retired Teacher Trustee
Bowling Green
Laura Schneider Active Teacher Trustee
Walton
10 Teachers’ Retirement System of the State of Kentucky • Years Ended June 30, 2017 and 2016
INTRODUCTORY SECTION
Teachers’ Retirement Systemof the State of Kentucky
479 Versailles RoadFrankfort, Kentucky 40601-3800
PROFESSIONAL CONSULTANTS
ACTUARY
Cavanaugh Macdonald Consulting, LLC3550 Busbee Parkway, Suite 250
Kennesaw, GA 30144
AUDITOR
Mountjoy Chilton Medley LLP462 South Fourth Street2600 Meidinger Tower
Louisville, Kentucky 40202
See the Schedules of Contracted Investment Management Expenses, TransactionCommissions and Professional Service Providers in the Investment Section for a list of
investment fees and external asset managers.
ADMINISTRATIVE STAFF
GARY L. HARBIN, CPAExecutive Secretary
ROBERT B. BARNES, JDGeneral Counsel and
Deputy Executive SecretaryOperations
J. ERIC WAMPLER, JDDeputy Executive SecretaryFinance & Administration
TOM SIDEREWICZ, CFAChief Investment Officer

Teachers’ Retirement System of the State of Kentucky • Years Ended June 30, 2017 and 2016 11
INTRODUCTORY SECTION
Teachers’ Retirement SystemOrganizational Chart
Board of Trustees
TOM SIDEREWICZ
Chief InvestmentOfficer
Deputy Executive Secretaryof Finance & Administration
Executive Secretary
Chief FinancialOfficer
AdministrativeServices
MemberServices
InvestmentAccounting
Mark E.Whelan
Philip L.Webb
BeckyNiece
GARY L. HARBIN
• PortfolioManagement
• InvestmentTransactions
• PortfolioEvaluation
• AssistInvestmentCommittee
• InterestCollection
• SecuritySettlements
• CustodialServices
• RecordMaintenance
• FinancialReporting &Accounting
• BudgetPreparation &Analysis
• Tax Reporting• Cash Receipts/
Disbursements• Accounts
Payable/Receivable
• EmployerReporting
• Member &GroupCounseling
• Survivor &DeathBenefits
• Disability &ServiceRetirement
• RetirementWaivers & Re-Employment
• On SiteWorkshops
• InformationCenter
• Retiree Returnto WorkCounseling
• MemberAccountMaintenance
• BusinessAnalysis
• ApplicationDevelopment
• ApplicationSupport
• SecurityAdministration
• NetworkInfrastructure
• DatabaseAdministration
• Data Analysis
InformationTechnology
GlennTucker
• RetirementEducationthroughSeminars,Webinars,On-SiteCounseling
• Refunds &PersonalPayments
• Retiree Payroll• Record
Maintenance• Imaging
J. ERIC WAMPLER
Deputy ExecutiveSecretary of Operations
ROBERT B. BARNES
InvestmentManagement
• AdministrativeServices
• BuildingManagement
• Mailroom• Messenger
Services
NATHAN VAN SICKEL
Internal Auditor
ROBERT B. BARNES
General Counsel
RetireeHealth Care
JaneGilbert
MemberBenefits
DebiNewman
• RetireeInsurancePre andPostMedicare
• InsuranceCostContainmentand RiskManagement
• MonitorState andFederalInsuranceLegislation

12 Teachers’ Retirement System of the State of Kentucky • Years Ended June 30, 2017 and 2016
INTRODUCTORY SECTION
The Government Finance Officers Association of theUnited States and Canada (GFOA) awarded a Certificate ofAchievement for Excellence in Financial Reporting to theTeachers' Retirement System of the State of Kentucky. TheTRS has received the Certificate of Achievement for the last29 consecutive years (fiscal years ended 1988-2016).
GOVERNMENT FINANCEOFFICERS ASSOCIATION (GFOA)

Teachers’ Retirement System of the State of Kentucky • Years Ended June 30, 2017 and 2016 13
INTRODUCTORY SECTION
The Public Pension Coordinating Council awarded a Certificate of Achievementto the Teachers' Retirement System of the State of Kentucky for 2017 forimplementing and maintaining high professional standards in administering theaffairs of the System. The award is based on compliance with principles judged tounderlie exemplary retirement system achievements in the areas of benefits, actuarialvaluation, financial reporting, investments and disclosure and are acknowledgedwidely to be marks of excellence for retirement systems. It represents the higheststandards of excellence in the public pension industry.
PUBLIC PENSION COORDINATING COUNCILPUBLIC PENSION STANDARDS
Alan H. WinkleProgram Administrator
Public Pension Coordinating Council
Public Pension Standards2017 Award
Presented to
Teachers' Retirement Systemof the State of Kentucky
In recognition of meeting professional standardsfor plan design and administration as
set forth in the Public Pension Standards.
Presented by the Public Pension CoordinatingCouncil, a confederation of
National Association of State Retirement Administrators (NASRA)National Conference on Public Employee Retirement Systems (NCPERS)
National Council on Teacher Retirement (NCTR)

This page was intentionally left blank.

2017
FinancialSection
Teachers’ Retirement System
of the State of Kentucky

16 Teachers’ Retirement System of the State of Kentucky • Years Ended June 30, 2017 and 2016
FINANCIAL SECTION
Independent Auditor’s Report
Board of TrusteesTeachers’ Retirement System of the State of KentuckyFrankfort, Kentucky
Report on the Financial Statements
We have audited the accompanying statements of fiduciary net position of the Teachers' Retirement System of the State ofKentucky as of June 30, 2017 and 2016, and the related statements of changes in fiduciary net position for the years then ended,and the related notes to the financial statements which collectively comprise the component unit financial statements of theTeachers' Retirement System of the State of Kentucky as listed in the table of contents.
Management's Responsibility for the Financial Statements
Management is responsible for the preparation and fair presentation of these financial statements in accordance with accountingprinciples generally accepted in the United States of America; this includes the design, implementation, and maintenance ofinternal control relevant to the preparation and fair presentation of the financial statements that are free from materialmisstatement, whether due to fraud or error.
Auditor's Responsibility
Our responsibility is to express an opinion on these financial statements based on our audits. We conducted our audits inaccordance with auditing standards generally accepted in the United States of America and the standards applicable to financialaudits contained in Government Auditing Standards, issued by the Comptroller General of the United States. Those standardsrequire that we plan and perform the audits to obtain reasonable assurance about whether the financial statements are free ofmaterial misstatement.
An audit involves performing procedures to obtain audit evidence about the amounts and disclosures in the financial statements.The procedures selected depend on the auditor's judgment, including the assessment of the risks of material misstatement of thefinancial statements, whether due to fraud or error. In making those risk assessments, the auditor considers internal controlrelevant to the entity's preparation and fair presentation of the financial statements in order to design audit procedures that areappropriate in the circumstances, but not for the purpose of expressing an opinion of the effectiveness of the entity's internalcontrol. Accordingly we do not express such an opinion. An audit also includes evaluating the appropriateness of accountingpolicies used and the reasonableness of significant accounting estimates made by management, as well as evaluating the overallfinancial statement presentation.
We believe that the audit evidence we have obtained is sufficient and appropriate to provide a basis for our audit opinion.
Opinion
In our opinion, the financial statements referred to above present fairly, in all material respects, the fiduciary net position of theTeachers' Retirement System of the State of Kentucky, a component unit of the Commonwealth of Kentucky, at June 30, 2017and 2016 and the respective changes in its fiduciary net position for the years then ended, in conformity with accountingprinciples generally accepted in the United States of America.

Teachers’ Retirement System of the State of Kentucky • Years Ended June 30, 2017 and 2016 17
FINANCIAL SECTION
Other Matters
Required Supplementary Information
Accounting principles generally accepted in the United States of America require that the management's discussion and analysison pages 18 through 21 and the Schedule of Changes in Net Pension Liability (page 59), Schedule of Net Pension Liability (page60), Schedule of Employer Contributions (page 60) Schedule of Investment Returns (page 61), Medical Insurance Plan Scheduleof Changes in Net OPEB Liability (page 62), Medical Insurance Plan Schedule of Net OPEB Liability (page 63), MedicalInsurance Plan Schedule of Employer Contributions (page 63), Schedule of Investment Returns (page 64), Life Insurance PlanSchedule of Changes in Net OPEB Liability (page 64), Life Insurance Plan Schedule of Net OPEB Liability (page 65), LifeInsurance Plan Schedule of Employer Contributions (page 65), and Schedule of Investment Returns (page 66) be presented tosupplement the basic financial statements. Such information, although not a part of the basic financial statements, is required bythe Governmental Accounting Standards Board, who considers it to be an essential part of financial reporting for placing thebasic financial statements in an appropriate operational, economic, or historical context. We have applied certain limitedprocedures to the required supplementary information in accordance with auditing standards generally accepted in the UnitedStates of America, which consisted of inquiries of management about the methods of preparing the information and comparingthe information for consistency with management's responses to our inquiries, the basic financial statements, and otherknowledge we obtained during our audit of the basic financial statements. We do not express an opinion or provide any assuranceon the information because the limited procedures do not provide us with sufficient evidence to express an opinion or provideany assurance.
Other Supplementary Information
Our audits were conducted for the purpose of forming an opinion on the financial statements that collectively comprise theKentucky Teachers' Retirement System's basic financial statements. The additional supporting schedules (pages 67 through 69)are presented for purposes of additional analysis and are not a required part of the basic financial statements. The Schedule ofAdministrative Expenses, Schedule of Professional Services and Contracts, and Schedule of Contracted Investment ManagementExpenses are the responsibility of management and were derived from and relate directly to the underlying accounting and otherrecords used to prepare the basic financial statements. Such information has been subjected to the auditing procedures applied inthe audits of the basic financial statements and certain additional procedures, including comparing and reconciling suchinformation directly to the underlying accounting and other records used to prepare the basic financial statements or to the basicfinancial statements themselves, and other additional procedures in accordance with auditing standards generally accepted in theUnited States of America. In our opinion, the Schedule of Administrative Expenses, Schedule of Professional Services andContracts, and Schedule of Contracted Investment Management Expenses are fairly stated, in all material respects, in relation tothe basic financial statements as a whole.
The introductory, investment, actuarial and statistical sections have not been subjected to auditing procedures applied in the auditof the basic financial statements and, accordingly, we do not express an opinion or provide any assurance on them.
Other Reporting Required by Government Auditing Standards
In accordance with Government Auditing Standards, we have also issued our report dated November 14, 2017, on ourconsideration of the Teachers' Retirement System of the State of Kentucky's internal control over financial reporting and our testsof its compliance with certain provisions of laws, regulations, contracts and grant agreements and other matters. The purpose ofthat report is to describe the scope of our testing of internal control over financial reporting and compliance and the results ofthat testing, and not to provide an opinion on internal control over financial reporting or on compliance. That report is an integralpart of an audit performed in accordance with Government Auditing Standards in considering the Teachers' Retirement System ofthe State of Kentucky's internal control over financial reporting and compliance.
/s/ Mountjoy Chilton Medley LLP
Louisville, KentuckyNovember 14, 2017
Page 2Independent Auditor’s Report (continued)

18 Teachers’ Retirement System of the State of Kentucky • Years Ended June 30, 2017 and 2016
FINANCIAL SECTION
$ 681.4 58.3
- 739.7
(5.9)$ 733.8
$ 609.7 29.1
- 638.8(11.8)
$ 627.0
$ 922.6 44.6
-967.2
(8.8)$ 958.4
$ 86.61.2
87.8
$ 87.8
$ 90.11.2
91.3(0.4)
$ 90.9
$ 88.61.1
89.7
$ 89.7
Summary of Fiduciary Net Position(In millions of dollars)
Cash & InvestmentsReceivablesCapital AssetsTotal AssetsTotal LiabilitiesNet Position
$ 16,707.7 119.5
17.0 16,844.2
(31.4)$ 16,812.8
$ 17,930.0295.5
14.918,240.4
(191.3)$ 18,049.1
Defined Benefit Plan 2017 2016 2015
Medical Insurance Plan 2017 2016 2015
Life Insurance Plan 2017 2016 2015
Categories
$ 18,649.0135.018.1
18,802.1(94.4)
$ 18,707.7
* Other Funds consisting of the 403(b) TaxShelter Plan, the Excess Benefit Fund andthe Losey Scholarship fund had a combinedfiduciary net position of $1.0 million foryears ended 2017, 2016 and 2015.
** Reflects revised amounts reported for both2016 and 2015 as described in Note 2
Cash & InvestmentsReceivablesCapital AssetsTotal AssetsTotal LiabilitiesNet Position
$ 17,479.2179.017.0
17,675.2(37.7)
$ 17,637.5
$ 18,628.3325.714.9
18,968.9(203.1)
$ 18,765.8
2017 2016** 2015***TOTALS
$ 19,658.2180.818.1
19,857.1(103.2)
$ 19,753.9
TEACHERS' RETIREMENT SYSTEM OF THE STATE OF KENTUCKYMANAGEMENT'S DISCUSSION AND ANALYSIS
This discussion and analysis of the Teachers' Retirement System of the State of Kentucky (TRS, System, or Plan) financialperformance provides an overview of the defined benefit and medical insurance plans' financial year ended June 30, 2017.Please read it in conjunction with the respective financial statements, which begin on page 22.
USING THIS FINANCIAL REPORTBecause of the long-term nature of the defined benefit retirement annuity plan, and the medical and life insurance
plans, financial statements alone cannot provide sufficient information to properly reflect the ongoing perspective ofthe System. The Statement of Fiduciary Net Position and Statement of Changes in Fiduciary Net Position (on pages22-25) provide information about the activities of the defined benefit retirement annuity plan, medical insurance plan,life insurance plan and the tax-sheltered annuity plan as a whole. The Teachers' Retirement System of the State ofKentucky is the fiduciary of funds held in trust for its members.
The Required Supplementary Information includes historical trend information about the funded status of thedefined benefit retirement annuity plan, the medical insurance plan and life insurance plan presented as required byaccounting standards. The Schedules of Employer Contributions present historical trend information about therequired contributions of employers and the contributions made by employers in relation to the requirement. Theseschedules provide information that contributes to understanding the changes over time in the funded status of theplans. Separate reports prepared by the actuary using board adopted funding methodology provide a long-term,ongoing plan perspective and the progress made in accumulating sufficient assets to pay benefits and insurancepremiums when due.
KENTUCKY TEACHERS' RETIREMENT SYSTEM AS A WHOLE
In the fiscal year ended June 30, 2017, the System's combined fiduciary net position increased by $2,116.3 million -from $17,638.5 million in 2016 to $19,754.8 million in 2017. In 2015, the combined net position totaled $18,766.8 million.The following summaries focus on the fiduciary net position and changes in fiduciary net position of the System'sdefined benefit retirement annuity plan, medical insurance plan, and life insurance plan.

Teachers’ Retirement System of the State of Kentucky • Years Ended June 30, 2017 and 2016 19
FINANCIAL SECTION
$ 313.0565.5
(245.2 -
633.3
1,833.227.88.6
- 1,869.6
$ (1,236.3
$ 441.1745.1
(249.7
936.5
1,837.827.810.3
188.92,064.8
$ (1,128.3
ADDITIONSMember ContributionsEmployer ContributionsNet Investment Income/(Loss)
TOTAL ADDITIONS
DEDUCTIONSBenefit PaymentsRefundsAdministrative ExpenseInsurance ExpensesTOTAL DEDUCTIONSIncrease/(Decrease) in Net Position
*TOTALS
ADDITIONSMember ContributionsEmployer ContributionsNet Investment Income/(Loss)Other IncomeTOTAL ADDITIONS
DEDUCTIONSBenefit PaymentsRefundsAdministrative ExpenseInsurance ExpensesTOTAL DEDUCTIONSIncrease/(Decrease) in Net Position
$ 313.61,060.72,475.8 /-
3,850.1
1,918.626.310.3
-1,955.2
$ 1,894.9
$ 442.41,242.02,572.3
4,256.7
1,923.826.311.8
178.52,140.4
$ 2,116.3
The fiduciary net position of the defined benefit retirement annuity plan increased by 11.3 percent ($18,707.7million compared to $16,812.8 million) and in 2015, the fiduciary net position of the defined benefit plan totaled$18,049.1 million. The increase is primarily due to additional employer contributions from the state and improvementsin market conditions which resulted in a net investment income increase of $2.7 billion more than 2016. The 2016amount was $1.1 billion less than 2015. The defined benefit retirement annuity plan assets are restricted to providingmonthly retirement allowances to members and their beneficiaries.
The fiduciary net position of the medical insurance plan increased by 30.6 percent ($958.4 million compared to $733.8million) primarily due to contributions from members and employers exceeding insurance expenses due to legislationpassed in 2010. This compares to 2015 where fiduciary net position of the medical insurance fund totaled $627 million.Plan assets are restricted to providing hospital and medical insurance benefits to members and their spouses.
$ 128.8180.395.5
- 404.6
1.5 - 178.5
180.0
$ 224.6
$1.01.0
2.0
5.2
5.2
$ (3.2
$ 308.2559.6862.2
- 1,730.0
1,741.523.18.9
- 1,773.5
$ (43.5
$ 408.8 705.9871.6
1,986.3
1,745.623.110.5
160.7 1,939.9
$ 46.4
$ 128.1178.6
(9.3 -
297.4
1.7 - 188.9
190.6
$ 106.8
$ 100.6 145.3
7.4
253.3
- -
1.6160.7
162.3
$ 91.0
Defined Benefit Plan 2017 2016 2015
Medical Insurance Plan 2017 2016 2015
Life Insurance Plan 2017 2016 2015
Categories
$1.04.8
5.8
4.6
4.6
$ 1.2
Summary of Changes in Fiduciary Net Position(In millions of dollars)
$ -1.02.0
3.0
4.1
4.1
$ (1.1
2017 2016** 2015**
* Other Funds consisting of the 403(b) Tax ShelterPlan, the Excess Benefit Fund and the LoseyScholarship fund had a combined change in fiduciarynet position of $1.0 million for years ended 2017,2016 and 2015.
** Reflects revised amounts reported for both 2016 and2015 as described in Note 2.
DEFINED BENEFIT RETIREMENT ANNUITY PLAN ACTIVITIES
Retirement contributions are calculated by applying a percentage factor to salary and are paid monthly by eachmember. Members may also pay contributions to repurchase previously refunded service credit or to purchase varioustypes of elective service credit.
)
)
)
)
)
)
))
Management’s Discussion and Analysis (continued)

20 Teachers’ Retirement System of the State of Kentucky • Years Ended June 30, 2017 and 2016
FINANCIAL SECTION
In 2017, Employer contributions totaled $1,060.7 million, a net increase of $495.2 million from the prior fiscal year.The increase was due to additional employer contributions paid by the state. In 2016, Employer contributions increased$5.9 million compared to the prior fiscal year.
In 2017, the defined benefit plan experienced an increase in net investment income compared to the previous year($2,475.8 million compared to negative $245.2 million). For 2015, net investment income totaled $862.2 million. Theincrease in net investment income is mainly due to favorable market conditions for the year ended June 30, 2017compared to 2016. Total deductions in 2017 increased $85.6 million. The increase was caused principally by anincrease of $86.0 million in defined benefit payments. Members who were drawing benefits as of June 2016 received anincrease of one and one-half percent to their retirement allowances in July 2016. Also, there was an increase of 1,403members and beneficiaries on the retired payroll as of June 30, 2017.
OTHER POSTEMPLOYMENT BENEFIT ACTIVITIES
During the 2017 fiscal year, the medical insurance plan member contributions increased $0.7 million and employercontributions increased $1.7 million from fiscal year 2016. The member, employer and state contributions increasedprimarily due to the implementation of the Shared Responsibility Plan beginning July 1, 2010 which includes increasedcontributions from active and retired members, employers and the state.
Net investment income for the medical insurance plan increased $104.8 million from negative $9.3 million in 2016 to$95.5 million in 2017. In 2015, net investment income totaled $7.4 million.
The life insurance plan has an actuarial valuation conducted independently from the defined benefit plan. Total lifeinsurance benefits paid for 2017, 2016 and 2015 were $5.2, $4.6 and $4.1 million respectively.
FUNDING
For the 2016-2018 biennium, the State budgeted $973 million of additional employer contributions for the unfundedliability of the System. The latest actuarial valuation was for the period ending June 30, 2017. This report reflects theSystem's actuarial value of assets totaling $18.5 billion and actuarial determined liabilities totaling $32.8 billion. Thefunded ratio of actuarial assets to liabilities is 56.4%. The additional funding provided in the budget resulted in 99% ofthe Actuarially Determined Employer Contribution being made for fiscal year 2017. Assuming that contributions to theSystem are made by the State from year to year in the future as recommended by the actuary, the System should havesufficient assets to provide the benefits defined by law.
The actuarial funding of the medical insurance and life insurance plans is provided in the Schedule of FundingProgress presented in the Required Supplementary Information. The asset value, stated in the Schedule of FundingProgress, is determined by the System's independent actuary. The actuarial accrued liability is calculated using theentry age cost method. Although the medical insurance plan continues to have a large unfunded actuarial liability, thecurrent obligations are being met by current funding. Effective July 1, 2010 the Shared Responsibility Plan for fundingretiree health benefits requires members, retirees, participating employers and the state to make contributions for pre-funding retiree medical benefits. Annual required contributions of the medical insurance plan are provided in theSchedule of Employer Contributions presented in the Required Supplementary Information.
HISTORICAL TRENDS
Accounting standards require that the Statement of Fiduciary Net Position present asset values at fair value andinclude only benefits and refunds due to plan members and beneficiaries and accrued investment and administrativeexpenses as of the reporting date. Detailed information regarding the funded status, including the key actuarialassumptions, target allocations and the sensitivity of the discount rate can be found in Note 4 of the financial statementsfor the defined benefit plan, Note 8 for the medical health plan, and Note 9 for the life insurance plan. The blendeddiscount rate mandated by accounting standards result in a lower funding level when compared to the actuariallydetermined funded levels reported in past years. The Schedule of Employer Contributions is provided in the RequiredSupplementary Information.
Management’s Discussion and Analysis (continued) . . .

Teachers’ Retirement System of the State of Kentucky • Years Ended June 30, 2017 and 2016 21
FINANCIAL SECTION
The System's independent consulting actuaries are members of the American Academy of Actuaries andexperienced in performing valuations for public retirement systems. As mandated by state law, the valuations of theretirement annuity and health care plans are prepared in accordance with principles of practice prescribed by theActuarial Standards Board consistent with accepted actuarial procedures. Actuarial assumptions used in the valuationsare internally consistent and reasonable based on the actual experience of the plans. An actuarial audit was completedin 2015, which confirmed the accuracy of actuarial procedures and the reasonableness of assumptions. A five-yearexperience study was completed in 2016, which also confirmed the reasonableness of assumptions based upon theactual experience of the plans. The actuarial assumptions reflected in the results may be reasonably relied upon.However, projections using other assumptions may produce significantly different results.
The Finance and Administration Cabinet commissioned a study of the state's retirement systems, including theTeachers' Retirement System. The resulting report from this study was issued in August 2017 and is the basis forongoing discussions that may lead to legislative change to the System.
This financial report is designed to provide citizens, participating employers, plan members, and other users withan overview of the Kentucky Teachers' Retirement System's fiscal practices and responsibility. If you have questions orneed additional information, please contact Mark Whelan, Chief Financial Officer, Teachers' Retirement System at 479Versailles Road, Frankfort, Kentucky 40601.
Management’s Discussion and Analysis (continued) . . .

22 Teachers’ Retirement System of the State of Kentucky • Years Ended June 30, 2017 and 2016
FINANCIAL SECTION
137,274,752 100,838
28,779,827 1,567,472
13,640,427 40,623,372 49,973,750
438,303
135,023,151
521,348,977 2,871,403,201
11,589,656,638 1,062,855,562 1,046,760,134 1,419,607,158
18,511,631,670
18,046,639
18,802,077,050
2,201,644
92,176,381
94,378,025
18,707,699,025
ASSETS
CashPrepaid Expenses
ReceivablesContributionsDue From Other Trust FundsState of KentuckyInvestment IncomeInvestment Sales ReceivableOther Receivables
Total Receivables
Investments at Fair Value (See Note 5)Short-Term InvestmentsBonds and MortgagesEquitiesAlternative InvestmentsReal EstateAdditional Categories
Total Investments
Capital Assets, at cost net of accumulated depreciation of $8,019,203 (See Note 2)
Total Assets
LIABILITIES
Accounts PayableDue to Other Trust FundsRevenues Collected in AdvanceInvestment Purchases Payable
Total Liabilities
Net Position - Restricted forPension and OtherPost-Employment Benefits
$
$
$
$
$
$
$
$
$
$
87,841,753
18,456,779
5,580,025 1,685,597
915,100 17,958,624
44,596,125
46,008,715 70,283,077
473,274,401 42,340,364 42,701,494
160,170,175
834,778,226
967,216,104
10,300 1,538,574 3,437,483 3,840,074
8,826,431
958,389,673
187,657
105,264
32,617 1,036,228
1,174,109
4,150,029 82,293,300
86,443,329
87,805,095
27,690
27,690
87,777,405
23,852
2,693
2,693
398,093 258,962 280,104
937,159
963,704
1,208
1,208
962,496
225,328,014 100,838
47,341,870 1,567,472
19,253,069 43,347,890 50,888,850 18,396,927
180,796,078
571,905,814 3,024,238,540
12,063,211,143 1,105,195,926 1,089,461,628 1,579,777,333
19,433,790,384
18,046,639
19,858,061,953
2,211,944 1,567,472 3,437,483
96,016,455
103,233,354
19,754,828,599
STATEMENT OF FIDUCIARY NET POSITIONAs of June 30, 2017
OtherFunds
LifeInsurance
Plan
MedicalInsurance
Plan
DefinedBenefit
Plan TOTAL
The “Combining Statement of Fiduciary Net Position - Other Funds” is presented on page 26.The accompanying notes are an integral part of these financial statements.

Teachers’ Retirement System of the State of Kentucky • Years Ended June 30, 2017 and 2016 23
FINANCIAL SECTION
$
$
$
$
$
$
$
$
$
$
59,843,503
21,525,458
1,359,808 1,333,953
633,642 33,481,047
58,333,908
18,186,502 62,555,400
354,369,798 23,931,317 25,433,241
137,075,842
621,552,100
739,729,511
19,811 1,747,115 2,047,051 2,134,567
5,948,544
733,780,967
15,156,496 89,235
34,664,070 3,719,997
22,766,523 39,619,872 18,182,733
559,913
119,513,108
507,724,996 2,734,474,510
10,267,066,002 932,813,350 940,860,202
1,309,513,418
16,692,452,478
16,973,670
16,844,184,987
1,917,838 1,935,385
27,499,881
31,353,104
16,812,831,883
95,285
54,392 1,090,402
1,240,079
913,077 89,200,103
90,113,180
91,353,259
325,494 36,837
362,331
90,990,928
481
2,417
2,417
410,590 290,132 242,351
943,073
945,971
660
660
945,311
75,000,480 89,235
56,284,813 3,719,997
24,180,723 42,046,644 18,816,375 34,040,960
179,089,512
527,235,165 2,886,520,145
10,621,678,151 956,744,667 966,293,443
1,446,589,260
17,405,060,831
16,973,670
17,676,213,728
2,263,143 3,719,997 2,047,051
29,634,448
37,664,639
17,638,549,089`
ASSETS
CashPrepaid Expenses
ReceivablesContributionsDue From Other Trust FundsState of KentuckyInvestment IncomeInvestment Sales ReceivableOther Receivables
Total Receivables
Investments at Fair Value (See Note 5)Short-Term InvestmentsBonds and MortgagesEquitiesAlternative InvestmentsReal EstateAdditional Categories
Total Investments, at fair value
Capital Assets, at cost net of accumulated depreciation of $6,022,382 (See Note 2)
Total Assets
LIABILITIES
Accounts PayableDue to Other Trust FundsRevenues Collected in AdvanceInvestment Purchases Payable
Total Liabilities
Net Position - Restricted forPension and OtherPostemployment Benefits
STATEMENT OF FIDUCIARY NET POSITIONAs of June 30, 2016
OtherFunds
LifeInsurance
Plan
MedicalInsurance
Plan
DefinedBenefit
Plan TOTAL
The “Combining Statement of Fiduciary Net Position - Other Funds” is presented on page 26.The accompanying notes are an integral part of these financial statements.

24 Teachers’ Retirement System of the State of Kentucky • Years Ended June 30, 2017 and 2016
FINANCIAL SECTION
220,001
220,001
6,584 10,920 5,468
231 23,203
(114 (69
23,020 243,021
224,628
1,208 225,836
17,185
945,311
962,496
))
75,496,731 104,879,255 128,819,243
309,195,229
89,058,380 5,777,776 3,787,309
98,623,465
(3,170,868
95,452,597404,647,826
178,500,546 1,538,574
180,039,120
224,608,706
733,780,967
958,389,673
1,057,795,523 184,570,140 442,444,677
1,684,810,340
2,254,023,748 162,007,193 184,090,004 30,477,797 3,660,488
2,634,259,230
(61,017,510 (1,097,808
2,572,143,912 4,256,954,252
1,923,987,769 26,305,240
178,500,546 11,881,187
2,140,674,742
2,116,279,510
17,638,549,089
19,754,828,599
881,703 167,980
1,049,683
(2,087,797 3,011,187
3,692 927,082
(10,478 (1,107
915,497 1,965,180
5,151,013
27,690 5,178,703
(3,213,523
90,990,928
87,777,405
$
$
$
$
$
$
$
$
$
$
981,417,089 79,302,904
313,625,434
1,374,345,427
2,167,046,581 153,207,310 180,297,227 30,477,797 3,656,565
2,534,685,480
(57,836,050 (1,096,632
2,475,752,798 3,850,098,225
1,918,612,128 26,305,240
10,313,715 1,955,231,083
1,894,867,142
16,812,831,883
18,707,699,025
ADDITIONSContributions
State of KentuckyOther EmployersMembers
Total Contributions
Investment Income/(Loss)Net Appreciation/(Depreciation) in Fair Value of InvestmentsInterestDividendsRental Income, NetSecurities Lending, Gross Earnings
Gross Investment Income/(Loss)
Less: Investment ExpenseLess: Securities Lending ExpenseNet Investment Income/(Loss) Total Additions
DEDUCTIONSBenefitsRefunds of ContributionsInsurance ExpensesAdministrative Expense Total Deductions
Net Increase/(Decrease)
Net Position - Restricted for Pensionand Other Postemployment Benefits
Beginning of Year
End of Year
STATEMENT OF CHANGES IN FIDUCIARY NET POSITIONFor the Fiscal Year Ended June 30, 2017
The "Combining Statement of Changes in Fiduciary Net Position - Other Funds" is presented on page 27.The accompanying notes are an integral part of these financial statements.
))
))
)
)
))
)
OtherFunds
LifeInsurance
Plan
MedicalInsurance
Plan
DefinedBenefit
Plan TOTAL

Teachers’ Retirement System of the State of Kentucky • Years Ended June 30, 2017 and 2016 25
FINANCIAL SECTION
41,543 10,013 5,187
404 57,147
(116 (121
56,910 56,910
94,665
560 95,225
(38,315
983,626
945,311
))
)
74,367,250 104,271,120 128,068,781
306,707,151
(16,291,780 8,029,465 1,207,958
(7,054,357)
(2,278,133)
(9,332,490) 297,374,661
188,869,994 1,686,070
190,556,064
106,818,597
626,962,370
733,780,967
560,227,194 184,903,535 441,113,007
1,186,243,736
(598,818,560 173,475,169 195,783,453 28,039,967 2,771,073
(198,748,898
(50,080,953 (831,253
(249,661,104 936,582,632
1,837,888,784 27,747,742
188,869,994 10,350,263
2,064,856,783
(1,128,274,151
18,766,823,240
17,638,549,089
872,990 164,779
1,037,769
1,742,044 3,095,887
3,550 4,841,481
(11,080 (1,065
4,829,336 5,867,105
4,595,489
27,195 4,622,684
1,244,421
89,746,507
90,990,928
$
$
$
$
$
$
$
$
$
$
484,986,954 80,467,636
313,044,226
878,498,816
(584,310,367 162,339,804 194,570,308 28,039,967 2,767,119
(196,593,169
(47,791,624 (830,067
(245,214,860 633,283,956
1,833,198,630 27,747,742
8,636,438 1,869,582,810
(1,236,298,854
18,049,130,737
16,812,831,883
ADDITIONSContributions
State of KentuckyOther EmployersMembers
Total Contributions
Investment Income/(Loss)Net Appreciation/(Depreciation) in Fair Value of InvestmentsInterestDividendsRental Income, NetSecurities Lending, Gross Earnings
Gross Investment Income/(Loss)
Less: Investment ExpenseLess: Securities Lending ExpenseNet Investment Income/(Loss) Total Additions
DEDUCTIONSBenefitsRefunds of ContributionsInsurance ExpensesAdministrative Expense Total Deductions
Net Increase/(Decrease)
Net Position - Restricted for Pensionand Other Postemployment Benefits
Beginning of Year
End of Year
STATEMENT OF CHANGES IN FIDUCIARY NET POSITIONFor the Fiscal Year Ended June 30, 2016
The "Combining Statement of Changes in Fiduciary Net Position - Other Funds" is presented on page 28.The accompanying notes are an integral part of these financial statements.
)
)
)))
)
)
)
)))
)
))
OtherFunds
LifeInsurance
Plan
MedicalInsurance
Plan
DefinedBenefit
Plan TOTAL

26 Teachers’ Retirement System of the State of Kentucky • Years Ended June 30, 2017 and 2016
FINANCIAL SECTION
23,852
2,693
398,093258,962280,104
937,159
963,704
1,208
1,208
962,496
233
343,750
343,750
393,983
56
56
343,927
2,460
54,343258,962280,104
593,409
595,869
97
97
595,772
23,852
23,852
1,055
1,055
22,797
AssetsCash
ReceivablesInvestment Income
Investments at Fair ValueShort Term InvestmentsBonds and MortgagesEquities
Total Investments
Total Assets
LiabilitiesDue to Other Trust Funds
Total Liabilities
Net Position - Restricted for Pension andOther Postemployment Benefits
TOTALLosey
ScholarshipSupplementalBenefit Fund
403(b) TaxShelter
$
$
$
$
$
$
$
$
Combining Statement of Fiduciary Net Position - Other FundsAs of June 30, 2017
481
2,417
410,590 290,132 242,351
943,073
945,971
660
660
945,311
111
352,773
352,773
352,884
110
110
352,774
2,306
57,817 290,132 242,351
590,300
592,606
161
161
592,445
481
481
389
389
92
AssetsCash
ReceivablesInvestment Income
Investments at Fair ValueShort Term InvestmentsBonds and MortgagesEquities
Total Investments
Total Assets
LiabilitiesAccounts PayableDue to Other Trust Funds
Total Liabilities
Net Position - Restricted for Pension andOther Postemployment Benefits
TOTALLosey
ScholarshipSupplementalBenefit Fund
403(b) TaxShelter
$
$
$
$
$
$
$
$
Combining Statement of Fiduciary Net Position - Other FundsAs of June 30, 2016
The accompanying notes are an integral part of these financial statements.

Teachers’ Retirement System of the State of Kentucky • Years Ended June 30, 2017 and 2016 27
FINANCIAL SECTION
$
$
220,001
6,584 10,920 5,468
231 23,203
(114 (69
23,020
243,021
224,628 1,208
225,836
17,185
945,311
962,496
))
6,584 9,282 5,468
231 21,565
(72 (69
21,424
21,424
18,000 97
18,097
3,327
592,445
595,772
$
$
$
$
$
$
The accompanying notes are an integral part of these financial statements.
1,638
1,638(42
1,596
1,596
10,38756
10,443
(8,847
352,774
343,927
220,001
220,001
196,2411,055
197,296
22,705
92
22,797
AdditionsOther Employers
Investment IncomeNet Appreciation in
Fair Value of InvestmentsInterestDividendsSecurities Lending, Gross
Gross Investment IncomeLess Investment ExpenseLess Securities Lending Expense
Net Investment Income
Total Additions
DeductionsBenefitsAdministrative Expense
Total Deductions
Net Increase/(Decrease)
Net Position - Restricted for Pension andOther Postemployment Benefits
Beginning of Year
End of Year
Combining Statement of Changes in Fiduciary Net Position - Other FundsFor the Fiscal Year Ended June 30, 2017
))
TOTALLosey
ScholarshipSupplementalBenefit Fund
403(b) TaxShelter
)
)

28 Teachers’ Retirement System of the State of Kentucky • Years Ended June 30, 2017 and 2016
FINANCIAL SECTION
$
$
41,543 10,013 5,187
404 57,147
(116 (121
56,910
56,910
94,665 560
95,225
(38,315
983,626
945,311
))
)
41,543 9,150 5,187
404 56,284
(73 (121
56,090
56,090
17,000 100
17,100
38,990
553,455
592,445
$
$
$
$
$
$
The accompanying notes are an integral part of these financial statements.
863
863 (43
820
820
11,858 71
11,929
(11,109
363,883
352,774
65,807389
66,196
(66,196
66,288
92
Additions
Investment IncomeNet Appreciation in
Fair Value of InvestmentsInterestDividendsSecurities Lending, Gross
Gross Investment IncomeLess Investment ExpenseLess Securities Lending Expense
Net Investment Income
Total Additions
DeductionsBenefitsAdministrative Expense
Total Deductions
Net Increase/(Decrease)
Net Position - Restricted for Pension andOther Postemployment Benefits
Beginning of Year
End of Year
Combining Statement of Changes in Fiduciary Net Position - Other FundsFor the Fiscal Year Ended June 30, 2016
))
TOTALLosey
ScholarshipSupplementalBenefit Fund
403(b) TaxShelter
)
) )

Teachers’ Retirement System of the State of Kentucky • Years Ended June 30, 2017 and 2016 29
FINANCIAL SECTION
NOTES TO FINANCIAL STATEMENTS
Note 1: Description of Retirement Annuity Plan
A. REPORTING ENTITY
The Teachers' Retirement System of the State of Kentucky (TRS) was created by the 1938 General Assembly andis governed by Chapter 161 Section 220 through Chapter 161 Section 990 of the Kentucky Revised Statutes (KRS).TRS is a blended component unit of the Commonwealth of Kentucky and therefore is included in theCommonwealth's financial statements. TRS is a cost-sharing multiple-employer defined benefit plan with a specialfunding situation established to provide retirement annuity plan coverage for local school districts and other publiceducational agencies in the Commonwealth.
KRS 161.250 provides that the general administration and management of TRS, and the responsibility for itsproper operation, is vested in a board of trustees. The board of trustees consists of the chief state school officer, theState Treasurer, two trustees appointed by the Governor and seven elected trustees. Four of the elected trustees areactive teachers, two are not members of the teaching profession, and one is an annuitant of the System.
B. PARTICIPANTSAs of June 30, 2017 a total of 207 employers participated in the plan. Employers are comprised of local school
districts, Department of Education Agencies, universities, the Kentucky Community and Technical CollegeSystem, and other educational organizations. The State under the Governmental Accounting Standards Board(GASB) No. 67 is recognized as a non-employer contributing entity providing the employer matchingcontributions for members employed by the local school districts and regional educational cooperatives.
According to KRS 161.220 " . . . any regular or special teacher, or professional occupying a position requiringcertification or graduation from a four (4) year college or university . . . " is eligible to participate in the System.The following illustrates the classifications of members:
C. BENEFIT PROVISIONS
For Members Before July 1, 2008:Members become vested when they complete five (5) years of credited service. To qualify for monthly retirement
benefits, payable for life, members must either:
1.) Attain age fifty-five (55) and complete five (5) years of Kentucky service, or
2.) Complete twenty-seven (27) years of Kentucky service.
Non-university members receive monthly payments equal to two percent (2%) (service prior to July 1, 1983) andtwo and one-half percent (2.5%) (service after July 1, 1983) of their final average salaries for each year of creditedservice. Non-university members who became members on or after July 1, 2002 will receive monthly benefits equal totwo percent (2%) of their final average salary for each year of service if, upon retirement, their total service is less thanten (10) years. New members after July 1, 2002 who retire with ten (10) or more years of total service will receivemonthly benefits equal to two and one-half percent (2.5%) of their final average salary for each year of service,including the first ten (10) years. In addition, non-university members who retire July 1, 2004 and later with more thanthirty (30) years of service will have their multiplier increased for all years over thirty (30) from two and one-half
Active contributing members:VestedNon-vested
Inactive members, vestedRetirees and beneficiaries currently receiving benefits
Total members, retirees, and beneficiaries
48,292 23,556
9,240 51,563
132,651
48,211 23,919
8,62452,966
133,720
2017 2016

30 Teachers’ Retirement System of the State of Kentucky • Years Ended June 30, 2017 and 2016
FINANCIAL SECTION
Note 1: Description of Retirement Annuity Plan continued . . .
percent (2.5%) to three percent (3%) to be used in their benefit calculation.
University employees receive monthly benefits equal to two percent (2%) of their final average salary for each yearof credited service.
The final average salary is the member's five (5) highest annual salaries except members at least age fifty-five (55)with twenty-seven (27) or more years of service may use their three (3) highest annual salaries. For all members, theannual allowance is reduced by 5% per year from the earlier of age 60 or the date the member would have completed27 years of service. The minimum annual service allowance for all members is $440 multiplied by credited service.
For Members On or After July 1, 2008:Members become vested when they complete five (5) years of credited service. To qualify for monthly retirement
benefits, payable for life, members must either:
1.) Attain age sixty (60) and complete five (5) years of Kentucky service, or
2.) Complete twenty-seven (27) years of Kentucky service, or
3.) Attain age fifty-five (55) and complete ten (10) years of Kentucky service.
The annual retirement allowance for non-university members is equal to: (a) one and seven tenths percent (1.7%) offinal average salary for each year of credited service if their service is 10 years or less; (b) two percent (2.0%) of finalaverage salary for each year of credited service if their service is greater than 10 years but no more than 20 years; (c)two and three tenths percent (2.3%) of final average salary for each year of credited service if their service is greaterthan 20 years but no more than 26 years; (d) two and one half percent (2.5%) of final average salary for each year ofcredited service if their service is greater than 26 years but no more than 30 years; (e) three percent (3.0%) of finalaverage salary for years of credited service greater than 30 years.
The annual retirement allowance for university members is equal to: (a) one and one-half percent (1.5%) of finalaverage salary for each year of credited service if their service is 10 years or less; (b) one and seven tenths percent(1.7%) of final average salary for each year of credited service if their service is greater than 10 years but no more than20 years; (c) one and eighty five hundredths percent (1.85%) of final average salary for each year of credited service iftheir service is greater than 20 years but less than 27years; (d) two percent (2.0%) of final average salary for each year ofcredited service if their service is greater than or equal to 27 years.
The final average salary is the member's five (5) highest annual salaries except members at least age fifty-five (55)with twenty-seven (27) or more years of service may use their three (3) highest annual salaries. For all members, theannual allowance is reduced by 6% per year from the earlier of age 60 or the date the member would have completed27 years of service.
Other Benefits:TRS provides post-employment medical benefits to retirees as fully described in Note 8. The Retirement System
also provides disability benefits for vested members at the rate of sixty percent (60%) of the final average salary. A lifeinsurance benefit, payable upon the death of a member, is $2,000 for active contributing members and $5,000 for retiredor disabled members.
Cost of living increases are one and one-half percent (1.5%) annually. Additional ad hoc increases and any otherbenefit amendments must be authorized by the General Assembly.

Teachers’ Retirement System of the State of Kentucky • Years Ended June 30, 2017 and 2016 31
FINANCIAL SECTION
Note 2: Summary of Significant Accounting Policies
A. BASIS OF ACCOUNTING
The financial statements are prepared on the accrual basis of accounting. Member contributions and employermatching contributions are recognized in the fiscal year due. Benefits and refunds are recognized when due andpayable in accordance with the terms of the plan.
B. CASHTRS has seven cash accounts. At June 30, 2017, the retirement annuity cash account totaled $105,013,741, the control
cash account totaled $32,163,714 and the administrative expense fund cash account was $97,297 for a total of$137,274,752 as carrying value of cash in the defined benefit plan. The medical insurance trust cash account totaled$80,806,325, the medical insurance 401(h) cash account totaled $6,921,861 and the medical insurance claims cashaccount totaled $113,567 for a total of $87,841,753 as carrying value of cash in the medical insurance plan. The lifeinsurance plan cash account totaled $187,657. The excess benefit fund cash account contained $23,852. Therefore, thecarrying value of cash was $225,328,014 and the bank balance was $222,173,747 and funds controlled by theCommonwealth of Kentucky of $5,245,371. The variance is primarily due to outstanding checks and items notprocessed by the bank as of June 30, 2017.
C. CAPITAL ASSETSProperty and equipment are carried at cost, less accumulated depreciation. All costs of property and equipment
$5,000 (actual dollars) or greater are capitalized. Expenditures for maintenance and repairs are charged to operationsas incurred. Depreciation is calculated using the straight-line method, with estimated lives ranging from five to fortyyears in the following major classes: office furniture and equipment, five years; other equipment, five years; computersoftware, ten years; TRS office buildings, forty years. The Pathway System replaced TRS’s legacy computer system andis TRS’s primary line of business information technology system. The Pathway System was capitalized and is beingamortized or depreciated over ten years. As of June 30, 2016, the project to build and implement the Pathway Systemwas substantially complete.
D. INVESTMENTSPlan investments are reported at fair value. Fair value is the amount that a plan can reasonably expect to receive for
an investment in a current sale between a willing buyer and a willing seller. Short-term securities are carried at cost,which approximates fair value. Fixed income and common and preferred stocks are generally valued based onpublished market prices and quotations from national security exchanges and securities pricing services. Real estate isprimarily valued based on appraisals performed by independent appraisers. Alternative investments such as privateequity, timberland, and other additional categories, such as opportunistic credit, high yield bonds, and direct lendingare valued using the most recent general partner statement of fair value based on independent appraisals, updated forany subsequent partnership interests’ cash flows.
Purchase and sales of debt securities, equity securities, and short-term investments are recorded on the trade date.Real estate equity transactions are recorded on the settlement date. Upon sale of investments, the difference betweensales proceeds and cost is reflected in the statement of changes in fiduciary net position. Investment expenses consist ofinvestment manager and consultant fees along with fees for custodial services.
E. COMPENSATED ABSENCES
Expenses for accumulated vacation days and compensatory time earned by TRS’s employees are recorded whenearned. Upon termination or retirement, employees of TRS are paid for accumulated vacation time limited to sixty (60)days and accumulated compensatory time limited to two hundred-forty (240) hours. As of June 30, 2017 and 2016accrued compensated absences were included in the accounts payable on the balance sheet amounting to $1,272,405and $1,166,764, respectively.
F. RISK MANAGEMENT
Destruction of assets, theft, employee injuries and court challenges to administrative policy are among the variousrisks to which TRS is exposed. In order to cover such risks TRS carries appropriate insurance policies such as fire andtornado, employee bonds, fiduciary liability, worker’s compensation and equipment insurance.

32 Teachers’ Retirement System of the State of Kentucky • Years Ended June 30, 2017 and 2016
FINANCIAL SECTION
G. OTHER RECEIVABLES
TRS allows qualified purchases of service credit to be made by installment payments not to exceed a five (5) yearperiod. Revenue is recognized in the initial year of the installment contract agreement. The June 30, 2017 and 2016installment contract receivables were $438,303 and $559,913, respectively.
H. USE OF ESTIMATESThe preparation of financial statements in accordance with accounting principles generally accepted in the United
States of America requires management to make estimates and assumptions that affect certain reported amounts anddisclosures. Accordingly, actual results could differ from those estimates. The most significant estimates impacting thefinancial statements relate to the actuarial assumptions.
I. INCOME TAXESThe defined benefit plan is organized as a tax-exempt retirement plan under the Internal Revenue Code. The tax
sheltered annuity plan is no longer continued and will be fully terminated when all lifetime annuities have expired.The System’s management believes that it has operated the plans within the constraints imposed by federal tax law.
J. RECENT PRONOUNCEMENTSGASB Statement No. 74 which was adopted during the year ended June 30, 2017, addresses accounting and
financial reporting requirements for postemployment benefits other than pensions (OPEB). The requirements for GASBNo. 74 requires changes in presentation of the financial statements, notes to the financial statements, and requiredsupplementary information. Significant changes include an actuarial calculation of total and net OPEB liability. It alsoincludes comprehensive footnote disclosures regarding the OPEB liability, the sensitivity of the OPEB liability to thediscount rate, and increased investment activity disclosures. The implementation of GASB No. 74 did not significantlyimpact the accounting for accounts receivable and investment balances. The total OPEB liability, determined inaccordance with GASB No. 74 is presented in Note 8 for the Medical Insurance Plan, Note 9 for the Life Insurance Planand in the Required Supplementary Information.
GASB Statement No. 75 replaces GASB Statement No. 45, Accounting and Financial Reporting by Employers forPostemployment Benefit Plans Other Than Pensions and is effective for fiscal years beginning after June 15, 2017. TRSwill issue a report in the Summer of 2018 that will help employers implement GASB No. 75 for their June 30, 2018financial statements.
K. RECLASSIFICATIONS
Due to the implementation of GASB Statement No. 74, certain 2016 amounts have been reclassified in conformitywith the 2017 presentation regarding amounts paid by retirees for medical insurance premiums and amounts receivedfrom Medicare and formulary rebates on the Statement of Changes in Fiduciary Net Position. Previously thesepayments were reported as additions to net assets and have been reclassified to be reported as a reduction to insuranceexpenses on the Statement of Changes in Fiduciary Net Position. The reclassification had no effect on total net position.
In order to comply with GASB Statement No. 28, amounts TRS has received as collateral from securities lendingtransactions have been removed from the balance sheet because the System does not have the ability to pledge or sellthe securities unless the borrower defaults. Previously these amounts were recorded as an asset and a correspondingliability. The reclassification had no effect on total net position.
Note 2: Summary of Significant Accounting Policies continued . . .

Teachers’ Retirement System of the State of Kentucky • Years Ended June 30, 2017 and 2016 33
FINANCIAL SECTION
Note 3: Contributions and Funds of the System
A. CONTRIBUTIONS
Contribution rates are established by Kentucky Revised Statutes. Non-university members are required tocontribute 12.855 percent of their salaries to the System effective July 1, 2015; university members are required tocontribute 10.40 percent of their salaries effective July 1, 2015. KRS 161.565 allows each university to reduce thecontribution of its members by 2.215 percent; therefore, university members contribute 8.185 percent of their salary toTRS. For members employed by local school districts, the State, as a non-employer contributing entity, contributes13.105 percent of salary for those who joined before July 1, 2008 and 14.105 percent for those who joined thereafter.
Other participating employers are required to contribute the percentage contributed by members plus an additional3.25 percent of members' gross salaries.
The member and employer contributions consist of retirement annuity contributions and other post-employmentbenefit contributions to the medical and life insurance plans. The member post-employment medical contribution is3.75 percent of salary. The employer post-employment medical contribution is .75 percent of member salaries. Also,employers (other than the state) contribute 3.0 percent of members' salaries and the state contributes the net cost ofhealth insurance premiums for new retirees after June 30, 2010 in the non-Medicare eligible group. If a member leavescovered employment before accumulating five (5) years of credited service, accumulated member contributions to theretirement annuity plan plus interest are refunded upon the member's request.
B. FUNDS OF THE SYSTEM
Teacher Savings FundThis fund was established by KRS 161.420(2) as the Teacher Savings Fund and consists of contributions paid by
university and non-university members. The fund also includes interest authorized by the Board of Trustees from theGuarantee Fund. The accumulated contributions of members that are returned upon withdrawal or paid to the estateor designated beneficiary in the event of death are paid from this fund. Upon retirement, the member’s contributionsand the matching state contributions are transferred from this fund to Allowance Reserve Fund, the fund from whichretirement benefits are paid.
State Accumulation FundThis fund was established by KRS 161.420(3) as the State Accumulation Fund and receives state appropriations to
the System. The state matches an amount equal to members’ contributions. State appropriations during the year arebased on estimates of members’ salaries. At year-end when actual salaries are known, the required state matching isalso realized by producing either a receivable from or a payable to the State of Kentucky.
Allowance Reserve FundThis fund was established by KRS 161.420(4) as the Allowance Reserve Fund, the source for retirement, disability,
and survivor benefits paid to members of TRS. These benefits are paid from the retired members’ contributions untilthey are exhausted, at which time state matching contributions are used to pay the benefits. After an individualmember’s contributions and the state matching contributions have been exhausted, retirement benefits are paid frommonies transferred from the Guarantee Fund.
Guarantee FundThis fund was established by KRS 161.420(6) as the Guarantee Fund, to collect income from investments, state
matching contributions of members withdrawn from the System, and state matching contributions for cost of livingadjustments (COLAs). In addition, it receives money for which disposition is not otherwise provided. This fundprovides interest to the other funds, benefits in excess of both members’ and state matching contributions, monies foradministrative expenses of TRS, and deficiencies not covered by the other funds.
Administrative ExpenseThis fund was established by KRS 161.420(1) as the Expense Fund. Investment income transferred to this fund
from the Guarantee Fund is used to pay the administrative expenses of TRS. Administrative expenses are allocatedamong the funds based on benefits paid.

34 Teachers’ Retirement System of the State of Kentucky • Years Ended June 30, 2017 and 2016
FINANCIAL SECTION
Note 4: Net Pension Liability of Employers
A. NET PENSION LIABILITY OF EMPLOYERS
The net pension liability (i.e., the System's liability determined in accordance with GASB No. 67 less the fiduciarynet position) as of June 30, 2017 and June 30, 2016 is shown below.
EmployersNet Pension
Liability
827.40 %912.07
$ 46,966,82247,736,901
$ 28,259,12330,924,069
$ 3,415,4323,390,539
20172016
$ 18,707,69916,812,832
39.835.2
NetPension
Liability as a % ofCovered Payroll
A B (A-B) (B/A) C [A-B/C]
Fiscal YearEndingJune 30
TotalPensionLiability
PlanFiduciary
Net Position
Plan FiduciaryNet Position as
a % of TotalPension Liability
CoveredPayroll
Net Pension Liability of Employers(In thousands of dollars)
B. SUMMARY OF ACTUARIAL ASSUMPTIONSA summary of the actuarial assumptions as of the latest actuarial valuation is shown below.
Valuation Date 6/30/2016Actuarial cost method Entry AgeActuarial Assumptions:Investment rate of return 7.50%, net of pension plan investment expense,
including inflation.Projected salary increases 3.50 - 7.30%, including inflationInflation rate 3.00%Municipal Bond Index Rate 3.56%Single Equivalent Interest Rate 4.49%
Mortality rates were based on the RP-2000 Combined Mortality Table for Males or Females, as appropriate, withadjustments for mortality improvements based on a projection of Scale BB to 2025, set forward two years for males andone year for females. The actuarial assumptions used in the June 30, 2016 valuation were based on the results of anactuarial experience study for the period July 1, 2010 - June 30, 2015 adopted by the Board on September 19, 2016.
C. TARGET ALLOCATIONSThe long-term expected rate of return on pension plan investments was determined using a log-normal
distribution analysis in which best-estimate ranges of expected future real rates of return (expected returns, net ofpension plan investment expense and inflation) are developed for each major asset class. These ranges are combined toproduce the long-term expected rate of return by weighting the expected future real rates of return by the target assetallocation percentage and by adding expected inflation.
The target allocation and best estimates of arithmetic real rates of return for each major asset class, as provided byTRS's investment consultant, are summarized in the following table:
%
U.S. EquityInternational EquityFixed IncomeAdditional Categories*Real EstateAlternativesCash
Total
Asset Class
42.020.016.09.05.06.02.0
100.0
TargetAllocation
4.45.31.53.64.46.70.8
Long-TermExpected Real Rate
of Return
%
%
%
* Includes Hedge Funds, High Yield and Non-U.S. Developed Bonds.

Teachers’ Retirement System of the State of Kentucky • Years Ended June 30, 2017 and 2016 35
FINANCIAL SECTION
D. DISCOUNT RATEThe discount rate used to measure the total pension liability was 4.49%. The projection of cash flows used to
determine the discount rate assumed that plan member contributions will be made at the current contribution rates andthe Employer contributions will be made at statutorily required rates, and the additional amount appropriated forfiscal year 2018. Based on those assumptions, the pension plan's fiduciary net position was projected to be available tomake all projected future benefit payments of current plan members until the 2038 plan year. Therefore, the long-termexpected rate of return on pension plan investments was applied to all periods of projected benefit payments through2037 and a municipal bond index rate of 3.56% was applied to all periods of projected benefit payments after 2037. TheSingle Equivalent Interest Rate (SEIR) that discounts the entire projected benefit stream to the same amount as the sumof the present values of the two separate benefit payments streams was used to determine the total pension liability.
The following tables present the net pension liability of the System for 2017 and 2016. The 2017 net pension liabilityof the System is calculated using the discount rate of 4.49%, as well as what the System's net pension liability would beif it were calculated using a discount rate that is 1-percentage-point lower (3.49%) or 1-percentage-point higher (5.49%)than the current rate:
June 30, 2016 is the actuarial valuation date upon which the TPL is based. An expected TPL is determined as of June30, 2017 using standard roll forward techniques for the TPL based on the assumptions from the June 30, 2015experience study using a discount rate of 4.49%, which was based on a municipal bond index rate as of that date equalto 3.56%. An expected TPL was also determined based on the assumptions prior to the June 30, 2015 experience studyusing the prior year discount rate of 4.20%, which was based on a municipal bond index rate of 3.01%. The roll forwardcalculation adds the annual normal cost (also called the service cost), subtracts the actual benefit payments and refundsfor the plan year and then applies the assumed interest rate (SEIR) for the year. The difference between the two roll-forward amounts as of June 30, 2017 is the gain or loss due to changes in assumptions and other inputs.
In addition, we have determined an expected TPL as of June 30, 2017 based on the TPL roll-forward in the June 30,2016 GASB 67 report. The difference between this amount and the roll-forward of the actual TPL using last year'sassumptions is reflected as an experience gain or loss for the year. These procedures are shown in the following table:
Note 4: Net Pension Liability of Employers continued ...
1%Decrease(3.49%)
$ 35,029,551
(in thousands) CurrentDiscount
Rate (4.49%)
$ 28,259,123
1%Increase(5.49%)
$ 22,702,413
4.20%
$ 47,736,901
1,332,587
1,944,917
49,088,678
(a) Interest Rate
(b) TPL as of June 30, 2016
(c) Entry Age Normal Cost for the Year July 1, 2016 - June 30, 2017
(d) Actual Benefit Payments (including refunds) For the year July 1, 2016 - June 30, 2017
(e) TPL as of June 30, 2017 (b) x (1 + (a)) + (c) - (d) x (1 + 0.5 x (a))
(f) Difference between Expected and Actual Experience (Gain)/Loss
(g) Difference due to change in Assumptions and Other Inputs (Gain)/Loss
4.20%
$ 47,928,332
1,332,587
1,944,917
49,288,149
199,471
4.49%
$ 45,781,405
1,118,412
1,944,917
46,966,822
(2,321,327
TPL Roll-Forward(In thousands of dollars)
1%Decrease(3.20%)
$ 37,937,230
(in thousands) CurrentDiscount
Rate (4.20%)
$ 30,924,069
1%Increase(5.20%)
$ 25,168,197
20162017
)
System’s netpension liability
System’s netpension liability
Actual AfterAssumption Change
Actual BeforeAssumption ChangeExpected

36 Teachers’ Retirement System of the State of Kentucky • Years Ended June 30, 2017 and 2016
FINANCIAL SECTION
A. LEGAL PROVISIONS FOR INVESTMENTS
The following disclosures are meant to help the users of TRS' financial statements assess the risks TRS takes ininvesting member funds. The Board of Trustees and the Investment Committee are guided by asset allocationparameters that the Board approves through its powers as defined in KRS 161.430.
TRS administers a retirement annuity trust fund and a health insurance trust fund in accordance with state andfederal law. TRS provides service and disability retirement benefits, death and survivor benefits, health insurancebenefits, and life insurance benefits for Kentucky public education employees and their beneficiaries. The trust fundsmanaged by TRS shall be referred to collectively as the "System" unless the context requires a specific reference to aparticular fund.
The asset allocation parameters for the retirement annuity trust fund are set forth in Title 102, Chapter 1:175,Section 2 and Section 3 of the Kentucky Administrative Regulations as follows:
There shall be no limit on the amount of investments owned by the retirement annuity trust fund if theinvestments are guaranteed by the United States government.
Not more than thirty-five percent (35%) of the assets of the retirement annuity trust fund at fair value shall beinvested in corporate debt obligations.
Not more than ten percent (10%) of the assets of the retirement annuity trust fund at fair value shall be investedin foreign debt.
Not more than sixty-five percent (65%) of the assets of the retirement annuity trust fund at fair value shall beinvested in common stocks or preferred stocks.
Not more than twenty-five percent (25%) of the assets of the retirement annuity trust fund at fair value shall beinvested in a stock portfolio designed to replicate a general stock index.
Not more than thirty percent (30%) of the assets of the retirement annuity trust fund at fair value shall beinvested in the stocks of companies domiciled outside of the United States; any amounts so invested shall beincluded in the sixty-five percent (65%) limitation for total stocks.
Not more than ten percent (10%) of the assets of the retirement annuity trust fund at fair value shall be investedin real estate. This would include real estate equity, real estate lease agreements, and shares in real estateinvestment trusts.
Not more than ten percent (10%) of the assets of the retirement annuity trust fund at fair value shall be investedin alternative investments. This category may include private equity, venture capital, timberland, andinfrastructure investments.
Not more than fifteen percent (15%) of the assets of the retirement annuity trust fund at fair value shall beinvested in any additional category or categories of investments. The Board of Trustees shall approve byresolution such additional category or categories of investments.
The asset allocation parameters for the health insurance trust fund are set forth in Title 102, Chapter 1:178, Section 2of the Kentucky Administrative Regulations as follows:
In order to preserve the assets of the health insurance trust fund and produce the required rate of return whileminimizing risk, assets shall be prudently diversified among various classes of investments.
In determining asset allocation policy, the investment committee and the board shall be mindful of the healthinsurance trust fund’s liquidity and its capability of meeting both short and long-term obligations.
Note 5: Deposits With Financial Institutions and Investments(Including Repurchase Agreements)

Teachers’ Retirement System of the State of Kentucky • Years Ended June 30, 2017 and 2016 37
FINANCIAL SECTION
Note 5: Deposits With Financial Institutions and Investments (Including Repurchase Agreements) continued . . .
B. CASH AND CASH EQUIVALENTS
For cash deposits and cash equivalents, custodial credit risk is the risk that, in the event of a bank failure, theSystem's deposits may not be returned to the System. The System's total cash balance held at J.P. Morgan Chase Bankin noninterest-bearing accounts on June 30, 2017 was $222,173,747. In addition to these funds, an amount of $5,245,371represents funds transferred to and controlled by the Commonwealth of Kentucky.
On November 9, 2010, the FDIC issued a Final Rule implementing Section 343 of the Dodd-Frank Wall StreetReform and Consumer Protection Act that provides for unlimited insurance coverage of noninterest-bearing transactionaccounts. Beginning January 1, 2013, all cash balances at J.P. Morgan Chase Bank were insured up to $250,000 and theremaining balances fully collateralized with securities held by the Federal Reserve Bank of New York in the name ofthe Commonwealth of Kentucky-Teachers' Retirement.
Deposits are exposed to custodial credit risk if they are not covered by depository insurance and the deposits are:
a. uncollateralized,b. collateralized with securities held by the pledging financial institution, orc. collateralized with securities held by the pledging financial institution's trust department or agent
but not in the depositor-government's name.
As of June 30, 2017, the System's cash balance in the amount of $222,173,747 was not exposed to custodial credit risksince this amount was fully insured by the FDIC limit of $250,000 and the remaining balances collateralized withsecurities valued at $221,955,776.
C. INVESTMENTSAll of the System's assets are invested in short-term and long-term debt (bonds and mortgages) securities, equity
(stock) securities, real estate, alternative investments, and additional categories as permitted by regulation. Theseassets are reported at fair value.
Investments are governed by the Board of Trustees' policies while the Board of Trustees and the InvestmentCommittee shall execute their fiduciary responsibilities in accordance with the "prudent person rule", as identified inKRS 161.430 (2)(b). The prudent person rule establishes a standard for all fiduciaries, to act as a prudent person wouldbe expected to act, with the "care, skill, prudence, and diligence under the circumstances then prevailing that a prudentperson acting in a like capacity and familiar with these matters would use in the conduct of an enterprise of a likecharacter and with like aims".
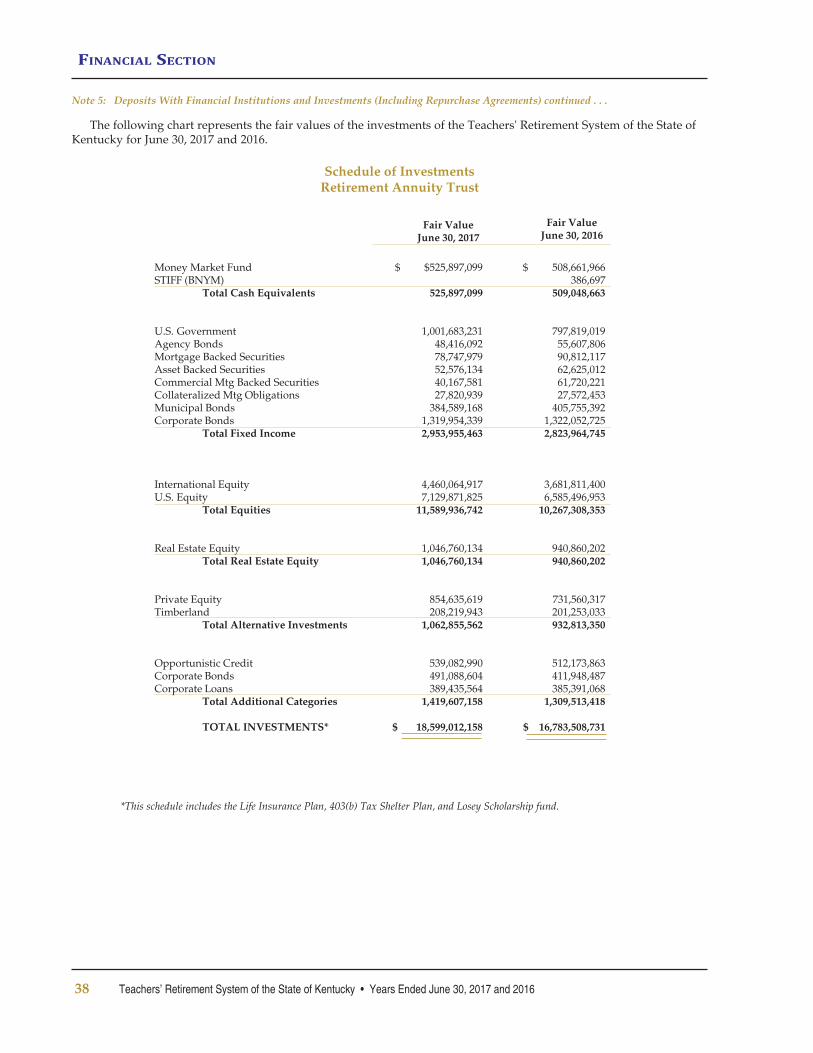
38 Teachers’ Retirement System of the State of Kentucky • Years Ended June 30, 2017 and 2016
FINANCIAL SECTION
Money Market FundSTIFF (BNYM)
Total Cash Equivalents
U.S. GovernmentAgency BondsMortgage Backed SecuritiesAsset Backed SecuritiesCommercial Mtg Backed SecuritiesCollateralized Mtg ObligationsMunicipal BondsCorporate Bonds
Total Fixed Income
International EquityU.S. Equity
Total Equities
Real Estate EquityTotal Real Estate Equity
Private EquityTimberland
Total Alternative Investments
Opportunistic CreditCorporate BondsCorporate Loans
Total Additional Categories
TOTAL INVESTMENTS*
$ $525,897,099
525,897,099
1,001,683,231 48,416,092 78,747,979 52,576,134 40,167,581 27,820,939
384,589,168 1,319,954,339 2,953,955,463
4,460,064,917 7,129,871,825
11,589,936,742
1,046,760,134 1,046,760,134
854,635,619 208,219,943
1,062,855,562
539,082,990 491,088,604 389,435,564
1,419,607,158
$ 18,599,012,158
$ 508,661,966 386,697
509,048,663
797,819,019 55,607,806 90,812,117 62,625,012 61,720,221 27,572,453
405,755,392 1,322,052,725 2,823,964,745
3,681,811,400 6,585,496,953
10,267,308,353
940,860,202 940,860,202
731,560,317 201,253,033 932,813,350
512,173,863 411,948,487 385,391,068
1,309,513,418
$ 16,783,508,731
Schedule of InvestmentsRetirement Annuity Trust
Note 5: Deposits With Financial Institutions and Investments (Including Repurchase Agreements) continued . . .
*This schedule includes the Life Insurance Plan, 403(b) Tax Shelter Plan, and Losey Scholarship fund.
Fair ValueJune 30, 2017
Fair ValueJune 30, 2016
The following chart represents the fair values of the investments of the Teachers' Retirement System of the State ofKentucky for June 30, 2017 and 2016.

Teachers’ Retirement System of the State of Kentucky • Years Ended June 30, 2017 and 2016 39
FINANCIAL SECTION
Note 5: Deposits With Financial Institutions and Investments (Including Repurchase Agreements) continued . . .
Schedule of InvestmentsHealth Insurance Trust
Custodial Credit RiskCustodial Credit Risk for an investment is the risk that, in the event of the failure of counterparty, the System will
not be able to recover the value of its investment or collateral securities that are in the possession of an outside party.Investment securities are exposed to custodial credit risk if the securities are uninsured, are not registered in the nameof the System, and are held by either:
a. the counterparty orb. the counterparty's trust department or agent, but not in the System's name.
The cash reserve of the System is primarily maintained in high quality short term investments through the DreyfusInstitutional Cash Advantage Fund. This fund invests in a diversified portfolio of high quality, short-term debtsecurities and the Fund is rated AAA by S&P, Moody's, and Fitch, Inc. The Fund's portfolio is structured within theconfines of Rule 2a-7 under the Investment Company Act of 1940, as amended. Commercial paper, U.S. Treasury andagency obligations, certificates of deposit, bankers' acceptances, repurchase agreements, time deposits, etc. are allpermissible investments within this Fund.
Whenever repurchase agreements are ordered by TRS under the terms of Master Repurchase Agreements withvarious brokers, the terms are dictated by TRS. The repurchase agreements and their supporting collateral are held bythe custodial agent's correspondent bank in an account identified by the custodian's name and TRS' nominee name.This account is unique to TRS. The Master Repurchase Agreements require that the supporting collateral have a fairvalue of at least 102 percent of the value of the repurchase agreements.
As of June 30, 2017, cash collateral reinvestment securities acquired through securities lending for the retirementannuity trust fund by TRS's custodian, who is also the lending agent/counterparty, amounted to $1,404,968,291 relatedto $1,371,172,509 securities lent consistent with the lending agreement with the custodian. (Please refer to a followingsection entitled Securities Lending.)
Money Market FundTotal Cash Equivalents
Agency BondsU.S. GovernmentCorporate Bonds
Total Fixed Income
Global EquitiesU.S. Equity
Total Equities
Real Estate EquityTotal Real Estate Equity
Private EquityTotal Alternative Investments
Opportunistic CreditCorporate BondsCorporate Loans
Total Additional Categories
TOTAL INVESTMENTS
$ 46,008,71546,008,715
20,457,755 49,825,322 70,283,077
442,726,237 30,548,164
473,274,401
42,701,494 42,701,494
42,340,364 42,340,364
49,620,098 81,742,713 28,807,364
160,170,175
$ 834,778,226
$ 18,186,502 18,186,502
6,380,550
56,174,850 62,555,400
354,369,798
354,369,798
25,433,241 25,433,241
23,931,317 23,931,317
45,955,526 64,192,800 26,927,516
137,075,842
$ 621,552,100
Fair ValueJune 30, 2017
Fair ValueJune 30, 2016

40 Teachers’ Retirement System of the State of Kentucky • Years Ended June 30, 2017 and 2016
FINANCIAL SECTION
Note 5: Deposits With Financial Institutions and Investments (Including Repurchase Agreements) continued . . .
U.S. Government
Agency
MBS
CMO
ABS
CMBS
Muni
Corporate Bonds
Corporate Loans*
TOTAL
Investment Type
1,001,683,231
48,416,092
78,747,979
27,820,939
52,576,134
40,167,581
384,589,168
1,319,954,339
2,953,955,463
8.69
7.42
14.63
13.00
13.46
20.58
11.92
8.14
4.53
8.67
FixedIncome
AverageMaturity (years)
$
$
491,088,604
381,101,026
872,189,630
AdditionalCategories
Interest Rate Risk
Interest rate risk on investments is the possibility that changes in interest rates will reduce the fair value of theSystem's investments. In general, the longer the period until an investment matures, the greater the risk of a negativeimpact on fair value resulting from changes in interest rates.
As of June 30, 2017 and 2016, the retirement annuity trust and health insurance trusts had the following investmentfair values and weighted average maturities:
2017 Retirement Annuity Trust
$
$
* Does not include 8,335,538 in cash held directly at Barings European Loan Fd.
U.S. Government
Agency
MBS
CMO
ABS
CMBS
Muni
Corporate Bonds
Corporate Loans*
TOTAL
Investment Type
797,819,019
55,607,806
90,812,117
27,572,453
62,625,012
61,720,221
405,755,392
1,322,052,725
-
2,823,964,745
8.34
8.61
12.24
12.67
14.31
20.55
12.47
7.83
4.56
8.61
FixedIncome
AverageMaturity (years)
411,948,488
380,989,944
792,938,432
AdditionalCategories
2016 Retirement Annuity Trust
InvestmentType
U.S. GovernmentCorporate BondsCorporate Loans
TOTAL
FixedIncome
20,457,75549,825,322
70,283,077
AverageMaturity (years)
8.445.995.37
6.17
AdditionalCategories
81,742,71328,807,364
110,550,077
* Does not include 4,401,123 in cash held directly at Babson Capital Management.
Health Insurance Trust
FixedIncome
6,380,55056,174,849
62,555,399
AverageMaturity (years)
11.53 4.49 5.04
4.88
AdditionalCategories
64,192,80026,927,516
91,120,316
$
$
$
$
$
$
$
$
20162017
$
$
$
$

Teachers’ Retirement System of the State of Kentucky • Years Ended June 30, 2017 and 2016 41
FINANCIAL SECTION
Note 5: Deposits With Financial Institutions and Investments (Including Repurchase Agreements) continued . . .
In addition to the above securities, the System held short-term cash investments in the Dreyfus Institutional CashAdvantage Fund and STIF, held at the Bank of New York Mellon, with a total fair value of $571,905,814 and had aweighted average maturity of twenty-two (22) days. Average maturity is used as a measure of a security's exposure tointerest rate risk due to fluctuations in market interest rates. Mortgage-backed securities and collateralized mortgageobligations are typically amortizing investments with an average life and interest rate risk significantly less thansuggested by the legal maturity. Mortgage-backed securities, which are generally pre-payable, and other callablebonds are subject to adverse changes in average life in response to market interest rate changes. The schedule abovereflects only the legal maturity of all such bonds.
Interest rate risk is the risk that changes in interest rates will adversely affect the fair value of an investment. Thisrisk is managed by using the effective duration or option adjusted methodology to quantify the risk of interest ratechanges. This methodology takes into account optionality on bonds and scales the risk of price changes on bondsdepending upon the degree of changes in rates and the slope of the yield curve. The control of interest rate risk is notset forth in a particular policy; however, the System manages interest rate risk in practice by establishing appropriatebenchmarks for its various portfolios.
Mortgage-backed securities are securities representing pass-through interests in the cash flows from pools ofmortgage loans on single-family or multi-family residential properties. All of the mortgage-backed securities owned bythe System were securitized and are guaranteed by Fannie Mae, Freddie Mac, or GNMA. The average life of amortgage-backed security depends upon the level of prepayments experienced in the underlying pool of loans. Marketinterest rates are a primary determinant of prepayment levels. Lower than anticipated market rates generally lead tohigher than anticipated prepayments and a shorter average life; higher than anticipated market rates generally lead tolower than anticipated prepayments and a longer average life. The retirement annuity trust held $78.7 million inmortgage-backed securities as of June 30, 2017, compared to $90.8 million as of June 30, 2016.
Collateralized mortgage obligations are bonds that are collateralized by whole loan mortgages, mortgage pass-through securities or stripped mortgage-backed securities. Income is derived from payments and prepayments ofprincipal and interest generated from collateral mortgages. Cash flows are distributed to different investment classes inaccordance with a collateralized mortgage obligations established payment order. The retirement annuity trust held$27.8 million in collateralized mortgage obligations as of June 30, 2017, compared to $27.6 million as of June 30, 2016.
Asset-backed securities are bonds or notes backed by loan paper or accounts receivables originated by banks, creditcard companies, or other credit providers, and are considered to be moderately sensitive to changes in interest rates.The originator of the loan or accounts receivable paper sells it to a specially created trust, which repackages it assecurities. Asset-backed securities have been structured as pass-throughs and as structures with multiple bond classes.The retirement annuity trust held $52.6 million as of June 30, 2017, compared to $62.6 million as of June 30, 2016.
Commercial mortgage-backed securities are securities representing interests in the cash flows from pools ofmortgage loans on commercial properties. The interests in a securitized pool of loans are generally divided intovarious tranches based upon planned payment order and level of seniority. The System's commercial mortgage-backedsecurities investments consist of highly rated relatively senior tranches. The average maturity of the System'scommercial mortgage-backed securities holdings in the schedule above reflects the legal maturity of those holdings.Most of the tranches held are earlier in the planned payment order than the legal maturity suggests. The retirementannuity trust held $40.2 million in commercial mortgage-backed securities investments as of June 30, 2017, compared to$61.7 million as of June 30, 2016.

42 Teachers’ Retirement System of the State of Kentucky • Years Ended June 30, 2017 and 2016
FINANCIAL SECTION
1,131,449
37,033,244
329,217,429
329,149,508
22,858,417
46,000
152,753,583
872,189,630
U.S. Government
AAA
AA
A
BBB
BB
B
CCC
CC
D
Not Rated
TOTAL
Note 5: Deposits With Financial Institutions and Investments (Including Repurchase Agreements) continued . . .
1,001,683,231
219,844,883
603,818,809
540,767,273
582,745,614
353,427,922
333,197,708
22,858,417
1,091,762
166,709,474
3,826,145,093
1,001,683,231
219,844,883
603,818,809
539,635,824
545,712,370
24,210,493
4,048,200
1,045,762
13,955,891
2,953,955,463
2017 Retirement Annuity Trust
Credit RiskCredit risk is the risk that an issuer or counterparty to an investment will not fulfill its obligations. The following
schedules list the System's fixed income investment fair values (net of cash equivalents) according to credit ratings as ofJune 30, 2017 and 2016:
$
$
$
$
$
$
Bonds &Mortgages
AdditionalCategories TotalRating
26.18%
5.74%
15.78%
14.13%
15.23%
9.24%
8.71%
0.60%
0.00%
0.03%
4.36%
100.00%
%
47,754,834
287,254,645
267,438,487
17,517,637
1,271,750
836,481
170,864,598
792,938,432
U.S. Government
AAA
AA
A
BBB
BB
B
CCC
CC
D
Not Rated
TOTAL
797,819,019
246,954,820
640,674,139
517,571,569
622,333,769
309,223,354
281,093,187
20,669,247
1,271,750
836,481
178,455,842
3,616,903,177
797,819,019
246,954,820
640,674,139
517,571,569
574,578,935
21,968,709
13,654,700
3,151,610
7,591,244
2,823,964,745
2016 Retirement Annuity Trust
$
$
$
$
$
$
Bonds &Mortgages
AdditionalCategories TotalRating
22.06%
6.83%
17.71%
14.31%
17.21%
8.55%
7.77%
0.57%
0.04%
0.02%
4.93%
100.00%
%

Teachers’ Retirement System of the State of Kentucky • Years Ended June 30, 2017 and 2016 43
FINANCIAL SECTION
$
$
20,457,755
6,427,010
11,828,664
21,162,730
9,938,418
468,500
70,283,077
$
$
Total fair value of the retirement annuity trust's fixed income portfolio was $3,826,145,093 on June 30, 2017. Thehealth insurance trust's fixed income portfolio was valued at $180,833,154 on June 30, 2017. The rating system used inthe above charts is the Standard and Poor's rating system. For securities where a Standard and Poor's rating is notprovided, another nationally recognized system is used and translated to the Standard and Poor's rating system.
In addition to the above categories, the retirement annuity trust held $545,368,716 in short term investments throughthe Dreyfus Institutional Cash Advantage Fund. The health insurance trust held $26,537,097 in the DreyfusInstitutional Cash Advantage Fund. The credit risk associated with this Fund is minimal as the securities held arerequired to maintain the highest possible short-term credit ratings by Moody's and Standard & Poor's. In addition,investments in US Government and Agency securities are also highly rated securities since they are backed by the USGovernment. Notation is made that the ratings of securities is subject to change due to circumstances and thereby mayhave a lower rating than when first purchased.
U.S. Government
AAA
AA
A
BBB
BB
B
CCC
D
Not Rated
TOTAL
5,546,635
52,006,671
47,612,272
3,693,471
1,691,028
110,550,077
2017 Health Insurance Trust
11.31%
3.55%
6.55%
11.70%
8.56%
29.02%
26.33%
2.04%
0.00%
0.94%
100.00%
20,457,755
6,427,010
11,828,664
21,162,730
15,485,053
52,475,171
47,612,272
3,693,471
1,691,028
180,833,154
Bonds &Mortgages
AdditionalCategories Total %
InvestmentType
$
$
$
$
6,380,550
5,042,219
11,085,052
26,633,606
13,413,972
62,555,399
$
$
U.S. Government
AAA
AA
A
BBB
BB
B
CCC
D
Not Rated
TOTAL
7,489,048
42,642,309
34,663,206
2,537,454
194,842
3,593,457
91,120,316
4.15%
3.28%
7.21%
17.33%
13.60%
27.75%
22.56%
1.65%
0.13%
2.34%
100.00%
6,380,550
5,042,219
11,085,052
26,633,606
20,903,020
42,642,309
34,663,206
2,537,454
194,842
3,593,457
153,675,715
Bonds &Mortgages
AdditionalCategories Total %
InvestmentType
$
$
2016 Health Insurance Trust
Note 5: Deposits With Financial Institutions and Investments (Including Repurchase Agreements) continued . . .

44 Teachers’ Retirement System of the State of Kentucky • Years Ended June 30, 2017 and 2016
FINANCIAL SECTION
2017 Retirement Annuity Trust
Commingled FundsBabson Capital European Loan FdBaillie Gifford Intrntl EAFEBaring All Country World ex USBlack Rock ACWI EX-US IMIUBS All Country World ex US
Alternative FundsCarlyle Europe Partners IV, L.P.KKR & Co European Fund IIIKKR & Co European Fund IVOaktree European Principal III
ADRs (Equities)Cross-Listed EquitiesBonds (Fixed Income)Additional Categories (Fixed Income)Additional Categories (Opportunistic)
Total
$ 83,529,164826,304,923576,106,295712,902,870704,979,730
19,731,52733,809,45826,265,45222,839,529
658,341,208688,122,140206,555,30283,459,203
109,262,717
$ 4,752,209,518
2016 Retirement Annuity Trust
Note 5: Deposits With Financial Institutions and Investments (Including Repurchase Agreements) continued . . .
The retirement annuity trust fund's policy on credit rating is set forth in 102 KAR 1:175 and reads as follows:
"A fixed income investment shall be rated at the time of purchase as investment grade by at least one (1) of themajor rating services. A private placement debt investment shall be subject to the same credit qualifications as eachfixed income investment. The fixed income investment portfolio as a whole shall maintain an average rating ofinvestment grade by at least one (1) of the major rating services."
Concentration of Credit RiskConcentration of credit risk is the risk of loss attributed to the magnitude of a government's investment in a single
issuer. Losses from credit risk are heightened if a significant portion of resources are invested with a single issuer. PerAdministrative Regulation 102 KAR 1:175, the retirement annuity trust fund is subject to the following policiesregarding single issuers of fixed income and equity securities:
"Unless the issuer is the United States Government or a government sponsored enterprise (GSE), the amountinvested in the securities of a single issuer shall not equal more than five (5) percent of the assets of the System."
"The System's position in a single stock shall not exceed two and one-half (2.5) percent of the System's assets. TheSystem's position in a single stock shall not exceed five (5) percent of the outstanding stock for that company unless theinvestment is part of a venture capital program."
TRS has not invested greater than five percent (5%) of the retirement annuity trust fund's assets at fair value in anysingle issuer and is in compliance with investment policy.
Foreign Currency RiskForeign currency risk is the risk that changes in exchange rates will adversely affect the fair value of an investment
or a deposit. As of June 30, 2017, the System's exposure to foreign currency risk consisted of $4,752,209,518 and$248,950,831 in the retirement annuity trust and health insurance trust funds respectively.
The following tables represent the fair values of investments that are subject to foreign currency as a result of cashcontributions to each portfolio manager as of June 30, 2017 and 2016:
Commingled FundsBabson Capital European Loan FdBaillie Gifford Intrntl EAFEBaring All Country World ex USBlack Rock ACWI EX-US IMIUBS All Country World ex US
Alternative FundsCarlyle Europe Partners IV, L.P.KKR & Co European Fund IIIKKR & Co European Fund IVOaktree European Principal III
ADRs (Equities)Cross-Listed EquitiesBonds (Fixed Income)Additional Categories (Fixed Income)Additional Categories (Opportunistic)
Total
$ 83,723,731734,894,403496,968,194600,737,023576,221,719
17,509,39149,515,57616,088,97924,409,242
458,137,096718,502,718247,293,462
83,423,983119,390,254
$ 4,226,815,771

Teachers’ Retirement System of the State of Kentucky • Years Ended June 30, 2017 and 2016 45
FINANCIAL SECTION
70,822,257
24,156,367
1,600,934
26,977,335
1,045,762
426,623
35,045,435
19,274
3,568,672
3,811,229
1,127,736
4,174,638
29,311,066
33,764,272
147,404,707
165,092,155
62,467,815
4,953,021
4,346,512
10,010,413
8,114,544
$ 4,752,209,518
2017 Health Insurance Trust
Commingled FundsMedical Ins. Black Rock Fund B
Alternative FundsMedical Ins. Carlyle Europe IVMedical Ins. KKR European IV
Bonds (Fixed Income)ADRs (Equities)Additional Categories (Fixed Income)Additional Categories (Opportunistic)
Total
$ 206,320,676
3,946,3075,253,0904,503,3703,658,163
15,306,1089,963,117
$ 248,950,831
Commingled FundsMedical Ins. Black Rock Fund B
Alternative FundsMedical Ins. Carlyle Europe IVMedical Ins. KKR European IV
Bonds (Fixed Income)Additional Categories (Fixed Income)Additional Categories (Opportunistic)
Total
$ 173,166,422
3,501,8793,217,7977,090,460
12,602,73911,305,351
$ 210,884,648
2016 Health Insurance Trust
Note 5: Deposits With Financial Institutions and Investments (Including Repurchase Agreements) continued . . .
Currency Fair Value
$ 116,620,840
66,974,641
36,631,654
651,726,435
297,523,837
54,684,123
14,187,093
72,872,379
6,717,571
266,000
77,878,375
320,624
1,665,892,188
231,547,001
483,670
71,413,664
8,323,019
18,361,613
627,530,830
77,277,317
2,086,293
14,649,584
Australian Dollar
Bermudian Dollar
Brazilian Real
British Pound Sterling
Canadian Dollar
Cayman Islands Dollar
Chilean Peso
Chinese Yuan
Colombian Peso
Czech Koruna
Danish Krone
Egyptian Pound
Euro
Hong Kong Dollar
Hungarian Forint
Indian Rupee
Indonesian Rupiah
Israeli New Shekel
Japanese Yen
Korean Won
Liberian Dollar
Malaysian Ringgit
2017 Retirement Annuity Trust
The following tables reflect the various foreign currencies associated with the System’s investments in the fundsoutlined previously:
Currency Fair Value
Mexican Peso
Netherlands Antillean Guilder
New Zealand Dollar
Norwegian Krone
Omani Rial
Pakastani Rupee
Panamanian Balboa
Peruvian Nuevo Sol
Philippine Peso
Polish Zloty
Qatari Rial
Russian Ruble
Singapore Dollar
South African Rand
Swedish Krona
Swiss Franc
Taiwan Dollar
Thai Baht
Turkish Lira
UAE Dirham
Various
TOTAL

46 Teachers’ Retirement System of the State of Kentucky • Years Ended June 30, 2017 and 2016
FINANCIAL SECTION
Note 5: Deposits With Financial Institutions and Investments (Including Repurchase Agreements) continued . . .
Currency Fair Value
$ 7,929,600
117,642,969
51,636,166
29,642,858
542,857,180
325,816
305,265,009
82,711,544
5,099,683
149,888,039
6,919,734
275,888
69,964,944
340,728
1,431,414,303
148,792,516
349,215
53,386,927
7,086,814
50,530,727
504,456,061
39,837,403
Argentine Peso
Australian Dollar
Bermudian Dollar
Brazilian Real
British Pound Sterling
Bulgarian Lev
Canadian Dollar
Cayman Islands Dollar
Chilean Peso
Chinese Yuan
Colombian Peso
Czech Crown
Danish Krone
Egyptian Pound
Euro
Hong Kong Dollar
Hungarian Forint
Indian Rupee
Indonesian Rupiah
Israeli New Shekel
Japanese Yen
Korean Won
2016 Retirement Annuity Trust
Currency Fair Value
Liberian Dollar
Malaysian Ringgit
Mexican Peso
Netherlands Antillean Guilder
New Zealand Dollar
Norwegian Krone
Panamanian Balboa
Peruvian Nuevo Sol
Philippine Peso
Polish Zloty
Qatari Rial
Russian Ruble
Singapore Dollar
South African Rand
Swedish Krona
Swiss Franc
Taiwan Dollar
Thai Baht
Turkish Lira
UAE Dirham
Various
TOTAL
2,717,693
$8,375,874
60,042,605
31,869,794
1,468,579
19,279,653
29,110,068
71,390
3,795,486
5,239,446
1,148,933
43,832,381
14,630,090
35,391,881
109,926,460
143,631,290
73,906,720
6,106,618
7,940,689
17,657,398
4,318,599
$ 4,226,815,771

Teachers’ Retirement System of the State of Kentucky • Years Ended June 30, 2017 and 2016 47
FINANCIAL SECTION
The majority of foreign investments are held in commingled funds managed by Babson Capital Management, UBSGlobal Asset Management, Baillie Gifford, Baring Asset Management, and Black Rock. In addition to the commingledfunds investing in foreign securities, the retirement annuity trust fund held $658,341,208 associated with foreigninterests in American Depositary Receipt investments. These American Depositary Receipts are securities that areissued by a U.S. bank in place of the foreign stock shares held in trust by that bank, thereby facilitating the trading offoreign shares in U.S. markets. American Depositary Receipts are denominated in U.S. currency. Also, the cross listedequities, in the amount of $688,122,140, represent securities domiciled in foreign countries, but are listed and traded onU.S. exchanges. Other foreign securities and investments consisted of debt securities and alternative investment
Currency Fair Value
$ 12,204,361 1,006,412 3,139,989
28,771,704 20,587,815
117,062 526,286 497,440 209,996 82,136
2,465,213 107,526
74,200,106 14,669,785
149,091 4,713,176 1,222,441
564,024 36,155,429 7,793,916 1,235,840 1,800,372
486,228 453,325
1,168,560 121,971 592,818
5,171 584,439 647,019 331,098 885,415
2,024,219 3,339,571 4,739,818
12,797,324 6,542,493 1,173,463
517,208 320,571
$ 248,950,831
Australian DollarBermudian DollarBrazilian RealBritish Pound SterlingCanadian DollarCayman Islands DollarChilean PesoChinese YuanColombian PesoCzech KorunaDanish KroneEgyptian PoundEuroHong Kong DollarHungarian ForintIndian RupeeIndonesian RupiahIsraeli New ShekelJapanese YenKorean WonMalaysian RinggitMexican PesoNew Zealand DollarNorwegian KronePakastani RupeePanamanian BalboaPeruvian Nuevo SolPhilippine PesoPolish ZlotyQatari RialRussian RubleSingapore DollarSouth African RandSwedish KronaSwiss FrancTaiwan DollarThai BahtTurkish LiraUAE DirhamVarious
TOTAL
Currency Fair Value
2017 Health Insurance Trust
$ 10,520,315 1,766,016 2,477,384
25,478,499 18,803,103 2,812,299
447,558 141,703 168,485 59,152
2,228,544 85,907
62,852,767 10,982,771
92,975 3,416,016
995,857 925,797
28,521,314 5,712,246
223,243 1,121,622 1,486,499
397,301 866,284 168,383 19,342
564,995 401,767 309,925 826,876
2,447,734 2,596,781 3,650,524
10,815,063 4,749,926
921,116 498,876 326,765
2,918
$ 210,884,648
Australian DollarBermudian DollarBrazilian RealBritish Pound SterlingCanadian DollarCayman Islands DollarChilean PesoChinese YuanColombian PesoCzech CrownDanish KroneEgyptian PoundEuroHong Kong DollarHungarian ForintIndian RupeeIndonesian RupiahIsraeli New ShekelJapanese YenKorean WonLiberian DollarMalaysian RinggitMexican PesoNew Zealand DollarNorwegian KronePanamanian BalboaPeruvian Nuevo SolPhilippine PesoPolish ZlotyQatari RialRussian RubleSingapore DollarSouth African RandSwedish KronaSwiss FrancTaiwan DollarThai BahtTurkish LiraUAE DirhamVarious
TOTAL
2016 Health Insurance Trust
Note 5: Deposits With Financial Institutions and Investments (Including Repurchase Agreements) continued . . .

48 Teachers’ Retirement System of the State of Kentucky • Years Ended June 30, 2017 and 2016
FINANCIAL SECTION
Cash Equivalents
Fixed Income ABS Agency CMBS CMO Corporate Bonds MBS Muni US Government
Total Fixed Income
Equities International US Equity
Total Equity
Real Estate Equity
Alternative Investments Private Equity Timberland
Total Alternative Investments
Additional Categories Corporate Bonds Corporate Loans Opportunistic Credit
Total Additional Categories
TOTAL INVESTMENTS
$ 525,897,099
52,576,134 48,416,092 40,167,581 27,820,939
1,319,954,339 78,747,979
384,589,168 1,001,683,231
2,953,955,463
4,460,064,917 7,129,871,825
11,589,936,742
1,046,760,134
854,635,619 208,219,943
1,062,855,562
491,088,604 389,435,564 539,082,990
1,419,607,158
$ 18,599,012,158
Note 5: Deposits With Financial Institutions and Investments (Including Repurchase Agreements) continued . . .
$ 525,897,099
4,109,212
992,472,191
996,581,403
1,326,738,184 6,888,437,450
8,215,175,634
19,262
19,262
$ 9,737,673,398
$ -
47,346,318 48,416,092 40,167,581 27,820,939
1,314,766,807 76,896,293
379,365,052 9,211,040
1,943,990,122
3,133,326,733 241,434,211
3,374,760,944
491,069,342 388,091
491,457,433
$ 5,810,208,499
$ --
5,229,816
1,078,320 1,851,686 5,224,116
13,383,938
164
164
1,046,760,134
854,635,619 208,219,943
1,062,855,562
389,047,473 539,082,990
928,130,463
$ 3,051,130,261
Investments Level 1 Inputs Level 2 Inputs Level 3 Inputs Fair Value
Retirement Annuity Trust
opportunities. Foreign holdings, including investment receivables/payables, that were not readably identifiable to aspecific country were listed in the "various" category pertaining to currency type.
The retirement annuity trust fund's policy regarding foreign equities is that not more than thirty percent (30%) ofthe assets of the retirement annuity trust fund at fair value shall be invested in the stocks of companies domiciledoutside of the United States. Any amounts so invested shall be included in the sixty-five percent (65%) limitation fortotal stocks per 102 KAR 1:175 Section 2(e).
Fair Value MeasurementA retiree pension defined benefit plan holds significant amounts of investments that are measured at fair value on a
recurring basis. In Fiscal Year 2016, TRS adopted GASB Statement No. 72 ("GASB 72"), Fair Value Measurement andApplication. The Governmental Accounting Standards Board issued GASB 72 to address accounting and financialreporting issues related to fair value measurements.
TRS categorizes its fair value measurements within the fair value hierarchy established by GAAP. The hierarchy isbased on the valuation inputs used to measure the fair value of the asset. Level 1 inputs are quoted prices (unadjusted)for identical assets or liabilities in active markets that a government can access at the measurement date. Level 2 inputsare inputs - other than quoted prices included within Level 1 - that are observable for an asset or liability, either directlyor indirectly. Level 3 inputs are unobservable inputs for an asset or liability. The fair value hierarchy gives the highestpriority to Level 1 inputs and the lowest priority to Level 3 inputs. The following tables depict the following recurringfair value measurements as of June 30, 2017.

Teachers’ Retirement System of the State of Kentucky • Years Ended June 30, 2017 and 2016 49
FINANCIAL SECTION
Cash Equivalents
Fixed Income Corporate Bonds US Government
Total Fixed Income
Equities Global US Equity
Total Equity
Real Estate Equity
Alternative Investments Private Equity
Total Alternative Investments
Additional Categories Corporate Bonds Corporate Loans Opportunistic Credit
Total Additional Categories
Total Investments
$ 46,008,715
49,825,322 20,457,755
70,283,077
442,726,237 30,548,164
473,274,401
42,701,494
42,340,364
42,340,364
81,742,713 28,807,364 49,620,098
160,170,175
$ 834,778,226
$ 46,008,715
19,464,425
19,464,425
30,548,164
30,548,164
5,253
5,253
$ 96,026,557
$ 5 6
49,825,322993,330
50,818,652
442,726,237
442,726,237
81,586,060182,662
81,768,722
$ 575,313,611
$ 5 6
42,701,494
42,340,364
42,340,364
151,40028,624,72
49,620,098
78,396,200
$ 163,438,058
Investments Level 1 Inputs Level 2 Inputs Level 3 Inputs Fair Value
Health Insurance Trust
Cash Equivalents Cash equivalents are short-term, highly liquid investments that are readily convertible to known amounts of cash
and so near their maturity that they present insignificant risk of changes in value because of changes in interest rates.Cash equivalents can be valued with inputs from quoted prices (unadjusted) for identical assets or liabilities in activemarkets that a government can access at the measurement date and therefore are classified as Level 1 assets.
Equity and Fixed Income Securities
Equity securities classified in Level 1 of the fair value hierarchy are valued using prices quoted in active marketsissued by pricing vendors for these securities. Debt and equity securities classified in Level 2 of the fair value hierarchyare valued using a matrix pricing technique that values securities based on their relationship to benchmark quotedprices. Debt and equity securities classified in Level 3 are securities whose stated market price is unobservable by themarket place and are instead priced by the issuers or industry groups for these securities.
Real Estate Real Estate falls into the level 3 classification of the fair value hierarchy. Much of our real estate is comprised of
owned properties leased to various commercial enterprises. The fair value measurement for real estate is determinedby professional appraisals recurring every five years. Real Estate also includes some Limited Partnerships that arevalued the same as Alternative Investments
Alternative Investments Alternative Investments are comprised of Private Equity and Timberland investments classified as Level 3 assets.
Private equity funds invest in equity and debt securities issued by private and publicly-held companies in connectionwith leveraged buyouts, recapitalizations and expansion opportunities. These investments do not allow redemptions.Alternatively, we receive distributions as the underlying assets of the fund liquidate. These are investments for whichexchange quotations are not readily available. Therefore, private equity investments are valued at an estimated fair
Note 5: Deposits With Financial Institutions and Investments (Including Repurchase Agreements) continued . . .

50 Teachers’ Retirement System of the State of Kentucky • Years Ended June 30, 2017 and 2016
FINANCIAL SECTION
2017 Earnings
$ 5,799,152
(2,138,664
(1,097,808
$ 2,562,680
Item
Gross Earnings (Interest and Fees)
Gross Borrower Rebates
Bank Fees
Net Earnings
2016 Earnings
$ 687,380
2,083,693
(831,253
$ 1,939,820
)
) )
value determined in good faith by the General Partner ("GP"). A GP is an owner of a partnership that has unlimitedliability and is a managing partner that is active in the day to day business of a Limited Partnership. These investmentsare initially valued at cost with subsequent adjustments that reflect third party transactions, financial operating resultsand other factors deemed relevant by the GP.
The GP values each investment by applying generally accepted valuations methods including the market approachand the income approach. The determination of fair value using these methodologies takes into consideration a rangeof factors, including but not limited to, the price at which the investment was acquired, the nature of the investment,local market conditions, trading values on public exchanges for comparable securities, current and projected operatingperformance and financing transactions subsequent to the acquisition of the investment. Because of the subjectivenature of estimated fair value of the private investments, such values may differ significantly from the values thatwould have been used had a ready market existed for these investments.
Timberland investments are managed investments regarding the acquiring, growing and disposing of timber ontimberlands owned by the System. Fair value determinations for Level 3 measurements of investments are theresponsibility of the Advisor, The Molpus Woodlands Group, LLC. The Advisor contracts with outside appraisers togenerate fair value estimates on an annual basis. The outside appraisers utilized the cost, sales comparison and incomecapitalization approaches to estimate the fair value of the timber and timberlands. The Advisor challenges thereasonableness of the assumptions used and reviews the methodology to ensure the estimated fair value complies withaccounting standards generally accepted in the United States of America.
Additional CategoriesInvestments in this category do not fit the regular parameters for the retirement annuity trust fund set forth in Title
102, Chapter 1:175 of the Kentucky Administrative Regulations. Rather, they fall into the allowable 15% of assets of theretirement annuity trust fund invested in any additional category or categories of investments approved by the Boardof Trustees. Debt securities in this category classified as Level 1 are valued using prices quoted in active markets forthose securities. Debt securities in the Additional Categories classified as Level 2 are valued using a matrix pricingtechnique that values securities based on their relationship to benchmark quoted prices. Opportunistic creditsclassified as Level 3 in the fair value hierarchy are valued using consensus pricing classified as Level 3 in the fair valuehierarchy are valued using consensus pricing.
D. SECURITIES LENDINGSection 161.430 of the Kentucky Revised Statutes empowers the Board of Trustees with complete fiduciary
responsibility for the funds of the System. The System operates a securities lending program in which it temporarilylends securities to qualified agents in exchange for a net fee and high quality collateral. U.S. Government and agencysecurities, selected domestic bonds, and domestic and international stocks are the types of securities that are lent. TheSystem's custodian, The Bank of New York Mellon, acts as lending agent in exchanging securities for collateral. Thecollateral has a value of not less than 102% of the fair value of the lent securities plus any accrued, unpaid distributions.The collateral may consist of cash, marketable U.S. Government securities, and select marketable U.S. Governmentagency securities approved by the System.
Securities lending transactions are accounted for in accordance with GASB Statement No. 28 Accounting andFinancial Reporting for Securities Lending Transactions, which established standards of accounting and financialreporting for securities lending transactions. During the fiscal year ended June 30, 2017, only the retirement annuitytrust fund had securities lending transactions. The following section details the net income earned in the retirementannuity trust fund from securities lending for the fiscal year ended June 30, 2017 and 2016:
Note 5: Deposits With Financial Institutions and Investments (Including Repurchase Agreements) continued . . .

Teachers’ Retirement System of the State of Kentucky • Years Ended June 30, 2017 and 2016 51
FINANCIAL SECTION
FairValue
Type ofSecurities
Lent
$ 309,194,938
1,061,977,571
$ 1,371,172,509
Fixed Income
Equities
TOTAL
E. ANNUAL MONEY-WEIGHTED RATE OF RETURNA money-weighted rate of return is an expression of investment performance that is net of the plan’s investment
expenses (net the plan’s administrative expenses). The following tables reflect the money-weighted rate of return forboth the retirement annuity trust fund and the health insurance trust fund:
2016
-1.32 %
-2.20 %
Retirement Annuity Trust
Health Insurance Trust
Annual Rate of Return Net of Investment Expense
Note 5: Deposits With Financial Institutions and Investments (Including Repurchase Agreements) continued . . .
CashCollateralReceived
$ 37,740,812
926,925,925
$ 964,666,737
Non-CashCollateral Value
Received
$ 282,265,094
158,036,460
$ 440,301,554
TotalCollateral
Received 2017
$ 320,005,906
1,084,962,385
$ 1,404,968,291
TotalCollateral
Received 2016
$ 135,742,272
305,638,558
$ 441,380,830
2017
15.00 %
14.37 %
Cash collateral is invested in short-term obligations fully guaranteed by the United States Government or selectGovernment agencies and Government Repurchase Agreements with qualified agents. The System cannot pledge orsell collateral securities received unless the borrower defaults. The lending agent (Bank of New York Mellon) alsoindemnifies the System from any financial loss associated with a borrower's default and collateral inadequacy. As perGASB 28, securities lending transaction collateralized by letters of credit or by securities that the governmental entitydoes not have the ability to pledge or sell unless the borrower defaults are not reported as assets and liabilities on theStatement of Fiduciary Net Position.
As of June 30, 2017, the loan average days to maturity in the retirement annuity trust fund was one (1) day and theweighted average investment maturity of cash collateral investments was one (1) day. At fiscal year end, the retirementannuity trust fund had no credit risk exposure to borrowers, since the amounts the retirement annuity trust fund owesthe borrowers exceeds the amounts the borrowers owe the retirement annuity trust fund and there were no lossesresulting during the period.
Security lending programs can entail interest rate risk and credit risk. The System minimizes interest rate risk bylimiting the term of cash collateral investments to several days.
The credit risk is controlled by investing cash collateral in securities with qualities similar to the credit worthiness oflent securities.
The following table presents the fair values of the underlying securities, and the value of the collateral pledged atJune 30, 2017 and 2016:

52 Teachers’ Retirement System of the State of Kentucky • Years Ended June 30, 2017 and 2016
FINANCIAL SECTION
Full-time employees of TRS participate in either TRS or Kentucky Employees Retirement System (KERS). Both plansare multiple-employer cost sharing defined benefit retirement annuity plans. All TRS employees in positions requiringa four-year degree are covered under TRS. The contribution rates and required employer matching are the same asstate agency employers in the System. These rates, the plan description and funding policy are fully disclosed in thenotes to the financial statements.
The System's annual required contributions for TRS employee members for the fiscal years 2017, 2016 and 2015 were$893,635, $820,077 and $767,958, respectively. TRS contributed one hundred percent of the required contribution eachyear.
All other TRS employees are covered under KERS in the Non-Hazardous Employees' Pension Plan. The planprovides for retirement, disability, and death benefits to plan members. Retirement benefits may be extended tobeneficiaries of plan members under certain circumstances. Per KRS 61.565(3), contribution rates shall be determinedby the Board on the basis of an annual actuarial valuation. Rates may be amended by the Board as needed. TRS'sadministrative budget and employer contribution rates are subject to the approval of the Kentucky General Assembly.Employee contribution rates are set by the statute and may be changed only by the Kentucky General Assembly.
Members of KERS who joined prior to July 1, 2008, are required to contribute five percent of their annual creditablecompensation and members who joined on or after July 1, 2008 contribute an additional one percent. As the employer,TRS is required to contribute the annual actuarially determined rate of the creditable compensation (or the rateapproved by legislators). The approved rate for the fiscal years 2017, 2016 and 2015 were 48.59 percent, 38.77 percentand 38.77 percent and TRS's annual required contributions to KERS were $675,300, $547,105 and $552,133, respectively.TRS contributed one hundred percent of the required contributions for each year.
KERS issues a publicly available financial report that may be obtained by writing Kentucky Retirement System, 1260Louisville Road, Frankfort, Kentucky 40601-6124.
Note 6: Retirement Plan for Employees of the Retirement System
Note 7: Other Funds
A. 403(B) TAX-SHELTERED ANNUITY PLAN
Plan DescriptionTRS has, in prior years, administered a salary deferral program as permitted by section 403(b) of the Internal
Revenue Code. Under this program members were able to voluntarily defer a portion of their compensation within thelimits established by the applicable laws and regulations. However, the System's Board of Trustees determined that thecost of providing the necessary services to assure the System of continuing compliance with these laws and regulationswas not economically feasible due to the limited participation in the program by TRS's members. The Board decided,therefore, to discontinue offering the program as of April 30, 1997. Members who were not receiving annuities fromtheir account as of April 30, 1997, were able to transfer their respective accounts directly into other tax-sheltered planson a tax-free basis. As of June 30, 2017, the eight members who are receiving annuities will continue to receivedistributions according to the terms of their respective elections.
B. SUMMARY OF SIGNIFICANT POLICIES
Basis of AccountingThe Tax-sheltered Annuity Plan financial statements are prepared using an accrual basis of accounting.
Contributions are no longer being accepted into the plan; therefore, there are no receivables to be recognized.
Method Used to Value InvestmentsThe short-term investments are reported at cost, which approximates fair value.
C. SUPPLEMENTAL BENEFIT FUNDThe Supplemental Retirement Benefit Fund is a qualified governmental excess benefit arrangement as described in
Section 415 of the Internal Revenue Code. In accordance with KRS 161.611 and KRS 161.420(8), TRS is authorized toprovide a supplemental retirement benefit fund for the sole purpose of enabling the employer to apply the sameformula for determining benefits payable to all members of the System employed by the employer, whose benefitsunder the System are limited by Section 415 of the Internal Revenue Code of 1986, as amended from time to time.Funding of benefits payable under this fund are provided by the state, as employer, and are segregated from funds thatare maintained by TRS for payment of the regular benefits provided by the System.

Teachers’ Retirement System of the State of Kentucky • Years Ended June 30, 2017 and 2016 53
FINANCIAL SECTION
A. PLAN DESCRIPTIONIn addition to the retirement annuity plan described in Note 1, Kentucky Revised Statute 161.675 requires TRS to
provide access to postemployment healthcare benefits for eligible members and dependents. The TRS medical plan(MIF) is funded by employer and member contributions. Changes made to the medical plan may be made by the TRSBoard of Trustees, the Kentucky Department of Employee Insurance and the General Assembly.
The TRS medical plan is funded by employee contributions to an account established pursuant to 26 U.S.C. sec.401(h). Additional funding is derived from the Kentucky Teachers' Retirement System insurance trust fund that wentinto effect on July 1, 2010. The insurance trust fund provides a trust separate from the account established pursuant to26 U.S.C. sec. 401(h). The insurance trust fund includes employer and retired member contributions required underKRS 161.550 and KRS 161.675(4)(b).
To be eligible for medical benefits, the member must have retired either for service or disability. The TRS medicalplan offers coverage to members under the age of 65 through the Kentucky Employees Health Plan (KEHP)administered by the Kentucky Department of Employee Insurance. TRS retired members are given a supplement to beused for payment of their health insurance premium. The amount of the member's supplement is based on acontribution supplement table approved by the TRS Board of Trustees. The retired member pays premiums in excess ofthe monthly supplement. The amount of insurance premiums paid by retirees for fiscal years 2017 and 2016 were$57,941,968 and $56,296,433, respectively. The Commonwealth of Kentucky bears risk for excess claims expenses thatexceed the premium equivalents charged for the Kentucky Employees Health Plan. Once retired members and eligiblespouses attain age 65 and are Medicare eligible, coverage is obtained through the TRS Medicare Eligible Health Plan.
At June 30, 2017, TRS insurance covered 39,497 retirees and 7,189 dependents. There are 207 participatingemployers and 72,130 active members contributing to the medical plan.
B. NET OPEB LIABILITY OF EMPLOYERS
The net OPEB liability (i.e., the System's liability determined in accordance with GASB No. 74 less the fiduciary netposition) for the medical insurance plan as of June 30, 2017 is shown below.
Note 8: Other Post-Employment Benefits - Medical Insurance Plan
D. JUNITA LOSEY SCHOLARSHIP BEQUEST
Junita Losey, a retired teacher, designated TRS as a residuary beneficiary of her estate and expressed a desire thatTRS establish a scholarship program for Kentucky students studying to be teachers. Ms. Losey died in 1997 andthereafter her estate provided a scholarship bequest to TRS. The scholarship bequest has at all times been segregatedfrom funds that are maintained by TRS for payment of the regular benefits provided by the System. The ScholarshipCommittee of the System's Board of Trustees meets each December to consider scholarship standards andadministration of the scholarship bequest.
Note 7: Other Funds continued . . .
EmployersNet
OPEB Liability(NOL)
104.40 %$ 4,524,172 $ 3,565,782 $ 3,415,4322017 $ 958,390 21.2 %
Net OPEBLiability as a
% of CoveredPayroll
A B (A-B) (B/A) C [A-B/C]
Fiscal YearEndingJune 30
TotalOPEB Liability
(TOL)
Plan FiduciaryNet
Position
Plan FiduciaryNet Position
(FNP) as a % ofTotal OPEB
LiabilityCoveredPayroll
Net OPEB Liability of Employers(In thousands of dollars)

54 Teachers’ Retirement System of the State of Kentucky • Years Ended June 30, 2017 and 2016
FINANCIAL SECTION
Note 8: Other Post-Employment Benefits - Medical Insurance Plan continued . . .
C. SUMMARY OF ACTUARIAL ASSUMPTIONS
A summary of the actuarial assumptions as of the latest actuarial valuation is shown below.
Valuation Date 6/30/2016Actuarial Assumptions:Actuarial Cost Method Entry AgeAmortization Method Level Percent of PayrollAmortization Period 30 years, openAsset Valuation Method Five-year smoothed valueInvestment Rate of Return 8.00%, net of OPEB plan investment expense, including inflation.Projected Salary Increases 3.50 - 7.20%, including wage inflationInflation Rate 3.00%Real Wage Growth 0.50%Wage Inflation 3.50%Municipal Bond Index Rate 3.56%Discount Rate 8.00%Single Equivalent Interest Rate 8.00%, net of OPEB plan investment expense,
including price inflation
Mortality rates were based on the RP-2000 Combined Mortality Table projected to 2025 with projection scale BB,and set forward two years for males and one year for females is used for the period after service retirement and fordependent beneficiaries. The RP-2000 Disabled Mortality Table set forward two years for males and seven years forfemales is used for the period after disability retirement. The demographic actuarial assumptions for retirement,disability incidence, withdrawal, rates of plan participation, and rates of plan election used in the June 30, 2016valuation were based on the results of the most recent actuarial experience studies for the System, which covered thefive-year period ending June 30, 2015. The remaining actuarial assumptions used in the June 30, 2017 valuation of theMIF were based on a review of recent plan experience done concurrently with the June 30, 2016 valuation.
D. TARGET ALLOCATIONS
The long-term expected rate of return on OPEB investments was determined using a log-normal distributionanalysis in which best-estimate ranges of expected future real rates of return (expected returns, net of pension planinvestment expense and inflation) are developed for each major asset class. These ranges are combined to produce thelong-term expected rate of return by weighting the expected future real rates of return by the target asset allocationpercentage and by adding expected inflation.
The target allocation and best estimates of arithmetic real rates of return for each major asset class, as provided byTRS's investment consultant, are summarized in the following table:
Asset Class
Global EquityFixed IncomeReal EstatePrivate EquityHigh YieldOther Additional Categories*Cash
Total
TargetAllocation
60.0%9.0%4.5%5.5%10.0%10.0%1.0%
100.0%
30-Year Expected GeometricReal Rate of Return
5.1%1.2%4.0%6.6%4.3%3.3%0.5%
* Modeled as 50% High Yield and 50% Bank Loans

Teachers’ Retirement System of the State of Kentucky • Years Ended June 30, 2017 and 2016 55
FINANCIAL SECTION
E. DISCOUNT RATE
The discount rate used to measure the TOL as of the Measurement Date was 8.00%. The projection of cash flowsused to determine the discount rate was performed in accordance with GASB 74. The projection's basis was an actuarialvaluation performed as of June 30, 2016. In addition to the actuarial methods and assumptions of the June 30, 2016actuarial valuation, the following actuarial methods and assumptions were used in the projection of cash flows:
• Total payroll for the initial projection year consists of the payroll of the active membership present on theValuation Date. In subsequent projection years, total payroll was assumed to increase annually at a rate of 3.50%.
• For the retiree health care costs of those beneficiaries under age 65, the KEHP implicit rate subsidies were assumedto be paid in all years by the employer directly to plan members as the benefits come due.
• As administrative expenses were assumed to be paid in all years by the employer as they come due, they were notconsidered.
• Cash flows occur mid-year.
• Future contributions to the MIF were based upon the contribution rates defined in statute and the projectedpayroll of active employees. Per KRS 161.540(1)(c).3 and 161.550(5), when the MIF achieves a sufficient prefundedstatus, as determined by the retirement system's actuary, the following MIF statutory contributions are to bedecreased, suspended, or eliminated:
• Employee contributions
• School District/University Contributions
• State Contributions for KEHP premium subsidies payable to retirees who retire after June 30, 2010
To reflect these adjustments, open group projections were used and assumed an equal, pro rata reduction to thecurrent statutory amounts in the years if/when the MIF is projected to achieve a Funded Ratio of 100% or more.Here, the current statutory amounts are adjusted to achieve total contributions equal to the ActuariallyDetermined Contribution (ADC), as determined by the prior year's valuation and in accordance with the MIF'sfunding policy (Schedule E). As the specific methodology to be used for the adjustments has yet to bedetermined, there may be differences between the projected results and future experience. This may alsoinclude any changes to retiree contributions for KEHP coverage pursuant to KRS 161.675(4)(b).
• In developing the adjustments to the statutory contributions in future years, the following was assumed:
• Liabilities and cash flows are net of expected retiree contributions and any implicit subsidiesattributable to coverage while participating in KEHP.
• A 0% active member growth rate was assumed for the purposes of developing estimates for newentrants (membership dates beyond June 30, 2016).
Based on these assumptions, the MIF's FNP was not projected to be depleted.
The FNP projections are based upon the MIF's financial status on the Valuation Date, the indicated set of methodsand assumptions, and the requirements of GASB 74. As such, the FNP projections are not reflective of the cash flows andasset accumulations that would occur on an ongoing basis, reflecting the impact of future members. Therefore, theresults of these tests do not necessarily indicate whether or not the MIF will actually run out of money, the financialcondition of the MIF, or the MIF's ability to make benefit payments in future years.
These paragraphs require disclosure of the sensitivity of the NOL to changes in the health care cost trend rates forthe MIF and the discount rate for the MIF. The following exhibit presents the NOL of the MIF, calculated using thehealth care cost trend rates, as well as what the MIF's NOL would be if it were calculated using a health care cost trendrate that is 1-percentage-point lower or 1-percentage-pointhigher than the current rate. Similarly, the exhibitpresents the NOL of the MIF, calculated using theSingle Equivalent Interest Rate, as well as what theMIF's NOL would be if it were calculated using aDiscount Rate that is 1-percentage-point lower or1-percentage-point higher than the current SingleEquivalent Interest Rate:
Note 8: Other Post-Employment Benefits - Medical Insurance Plan continued . . .
$ -2,986,442
Discount Rate 1% IncreaseCurrent
$ 3,077,710 3,565,977 4,152,539
System’s Net OPEB Liability(In thousands of dollars)
1% Increase (8.50%)Current (7.50%)1% Decrease (6.50%)
1% Decrease
$ -4,281,487
Health Care Cost Trends

56 Teachers’ Retirement System of the State of Kentucky • Years Ended June 30, 2017 and 2016
FINANCIAL SECTION
A. PLAN DESCRIPTON
TRS administers the Life Insurance Plan as provided by KRS 161.655 to provide life insurance benefits to retiredand active members. This benefit is financed by actuarially determined contributions from the 207 participatingemployers. The benefit is $5,000 for members who are retired for service or disability, and $2,000 for activecontributing members.
B. NET OPEB LIABILITY OF EMPLOYERS
The net OPEB liability (i.e., the System's liability determined in accordance with GASB No. 74 less the fiduciary netposition) for the life insurance fund as of June 30, 2017 is shown below.
Note 9: Other Post-Employment Benefits - Life Insurance Plan
$ 4,264,131
(178,500
333,990
95,625
8,926
$ 4,524,172
The TOL of the MIF is based upon an actuarial valuation performed as of the Valuation Date, June 30, 2016. Anexpected TOL is determined as of June 30, 2017 using standard roll-forward techniques. The roll-forward calculationbegins with the TOL, as of June 30, 2016, subtracts the actual benefit payments (net of retiree contributions, ifapplicable) for the year, applies interest at the discount rate for the year, and then adds the annual normal cost (alsocalled the Service Cost). If applicable, actuarial gains and losses arising from the difference between estimates andactual experience (excluding amounts related to benefit changes and changes in assumptions or other inputs) arereconciled to the TOL as of the Measurement Date. Last, any changes of assumptions or other inputs are reflected. Theprocedure used to determine the TOL of the MIF, as of June 30, 2017, is shown in the following table:
Note 8: Other Post-Employment Benefits - Medical Insurance Plan continued . . .
(a) TOL as of June 30, 2016*
(b) Actual Benefit Payments and Refunds for the
Year July 1, 2016 - June 30, 2017
(c) Interest on TOL
= [(a) x (0.080)] + [(b) x (0.0400]
(d) Service Cost for the Year July 1, 2016 - June 30, 2017
at the End of the Year
(e) Changes of Benefit Terms
(f) Difference between Expected and Actual
Experience at the End of the Year
(g) Changes of Assumptions or Other Inputs
(h) TOL Rolled Forward to June 30, 2017
= (a) + (b) + (c) + (d) + (e) + (f) + (g)
)
TOL Roll-Forward(In thousands of dollars)
* The TOL used in the roll-forward as of June 30, 2016 is calculated using the discount rateas of the Prior Measurement Date.
EmployersNet
OPEB Liability(NOL)
0.64 %$ 109,736 $ 21,959 $ 3,415,4322017 $ 87,777 80.0 %
Net OPEBLiability as a
% of CoveredPayroll
A B (A-B) (B/A) C [A-B/C]
Fiscal YearEndingJune 30
TotalOPEB Liability
(TOL)
Plan FiduciaryNet
Position
Plan FiduciaryNet Position
(FNP) as a % ofTotal OPEB
LiabilityCoveredPayroll
Net OPEB Liability of Employers(In thousands of dollars)

Teachers’ Retirement System of the State of Kentucky • Years Ended June 30, 2017 and 2016 57
FINANCIAL SECTION
C. SUMMARY OF ACTUARIAL ASSUMPTIONS
A summary of the actuarial assumptions as of the latest actuarial valuation is shown below.
Valuation Date 6/30/2016Actuarial Assumptions:Actuarial Cost Method Entry AgeAmortization Method Level Percent of PayrollAmortization Period 30 years, openAsset Valuation Method Market ValueInvestment Rate of Return 7.50%, net of OPEB plan investment expense, including inflation.Projected Salary Increases 4.00 - 8.10%, including wage inflationInflation Rate 3.50%Real Wage Growth 0.50%Wage Inflation 4.00%Municipal Bond Index Rate 3.56%Discount Rate 7.50%Single Equivalent Interest Rate 7.50%, net of OPEB plan investment expense,
including price inflation
Mortality rates were based on the RP-2000 Combined Mortality Table projected to 2025 with projection scale BB,and set forward two years for males and one year for females is used for the period after service retirement and fordependent beneficiaries. The RP-2000 Disabled Mortality Table set forward two years for males and seven years forfemales is used for the period after disability retirement. The demographic actuarial assumptions for retirement,disability incidence, withdrawal, rates of plan participation, and rates of plan election used in the June 30, 2016valuation were based on the results of the most recent actuarial experience studies for the System, which covered thefive-year period ending June 30, 2015.
D. TARGET ALLOCATIONSThe long-term expected rate of return on OPEB investments was determined using a log-normal distribution
analysis in which best-estimate ranges of expected future real rates of return (expected returns, net of pension planinvestment expense and inflation) are developed for each major asset class. These ranges are combined to produce thelong-term expected rate of return by weighting the expected future real rates of return by the target asset allocationpercentage and by adding expected inflation.
The target allocation and best estimates of arithmetic real rates of return for each major asset class, as provided byTRS's investment consultant, are summarized in the following table:
Note 9: Other Post-Employment Benefits - Life Insurance Plan continued . . .
Asset Class
U.S. Large Cap EquityU.S. Small Cap EquityDeveloped Int'l EquityEmerging Markets EquityFixed Income - Inv. GradeReal EstatePrivate EquityHigh YieldOther Additional Categories**Cash
Total
TargetAllocation
38.4%2.6%
15.8%4.2%
16.0%6.0%7.0%2.0%7.0%2.0%
100.0%
30-Year Expected GeometricReal Rate of Return
4.3%4.8%5.2%5.4%1.2%4.0%6.6%4.3%3.3%0.5%
* As the LIF investment policy is to change, the above table reflects the pension allocation and returnsthat achieve the targeted 7.50% long-term rate of return.
** Modeled as 50% High Yield and 50% Bank Loans

58 Teachers’ Retirement System of the State of Kentucky • Years Ended June 30, 2017 and 2016
FINANCIAL SECTION
E. DISCOUNT RATEThe discount rate used to measure the TOL as of the Measurement Date was 7.50%. The projection of cash flows
used to determine the discount rate was performed in accordance with GASB 74. The projection's basis was anactuarial valuation performed as of June 30, 2016. In addition to the actuarial methods and assumptions of the June 30,2016 actuarial valuation, the following actuarial methods and assumptions were used in the projection of the LIF's cashflows:
• Total payroll for the initial projection year consists of the payroll of the active membership present on theValuation Date. In subsequent projection years, total payroll was assumed to increase annually at a rate of3.50%.
• The employer will contribute the Actuarially Determined Contribution (ADC) in accordance with the LIF’sfunding policy (Schedule E) determined by a valuation performed on a date two years prior to the beginningof the fiscal year in which the ADC applies.
• As administrative expenses were assumed to be paid in all years by the employer as they come due, they werenot considered.
• Active employees do not explicitly contribute to the plan.
• Cash flows occur mid-year.
Based on these assumptions, the LIF's FNP was not projected to be depleted.
The FNP projections are based upon the LIF's financial status on the Valuation Date, the indicated set of methodsand assumptions, and the requirements of GASB 74. As such, the FNP projections are not reflective of the cash flowsand asset accumulations that would occur on an ongoing basis, reflecting the impact of future members. Therefore, theresults of these tests do not necessarily indicate whether or not the LIF will actually run out of money, the financialcondition of the LIF, or the LIF's ability to make benefit payments in future years.
These paragraphs require disclosure of the sensitivity of the NOL to changes the discount rate for the LIF. Theschedule below presents the NOL of the LIF, calculated using the Single Equivalent Interest Rate, as well as what theLIF's NOL would be if it were calculated using a Discount Rate that is 1-percentage-point lower or 1-percentage-pointhigher than the current Single Equivalent Interest Rate:
The TOL of the LIF is based upon an actuarial valuation performed as of the Valuation Date, June 30, 2016. Anexpected TOL is determined as of June 30, 2017 using standard roll-forward techniques. The roll-forward calculationbegins with the TOL, as of June 30, 2016, subtracts the actual benefit payments (net of retiree contributions, ifapplicable) for the year, applies interest at the discount rate for the year, and then adds the annual normal cost (alsocalled the Service Cost). If applicable, actuarial gains and losses arising from the difference between estimates andactual experience (excluding amounts related to benefit changes and changes in assumptions or other inputs) arereconciled to the TOL as of the Measurement Date. Last, any changes of assumptions or other inputs are reflected. Theprocedure used to determine the TOL of the LIF, as of June 30, 2017, is shown in the following table:
Note 9: Other Post-Employment Benefits - Life Insurance Plan continued . . .
$ 36,497
1%Increase(8.50%)
CurrentDiscount Rate
(7.50%)
$ 21,959
System’s Net OPEB Liability(In thousands of dollars)
1%Decrease(6.50%)
$ 10,055

Teachers’ Retirement System of the State of Kentucky • Years Ended June 30, 2017 and 2016 59
FINANCIAL SECTION
Note 9: Other Post-Employment Benefits - Life Insurance Plan continued . . .
$ 106,059
(5,151
7,761
1,067
$ 109,736
(a) TOL as of June 30, 2016*
(b) Actual Benefit Payments and Refunds for the
Year July 1, 2016 - June 30, 2017
(c) Interest on TOL
= [(a) x (0.075)] + [(b) x (0.0375]
(d) Service Cost for the Year July 1, 2016 - June 30, 2017
at the End of the Year
(e) Changes of Benefit Terms
(f) Difference between Expected and Actual
Experience at the End of the Year
(g) Changes of Assumptions or Other Inputs
(h) TOL Rolled Forward to June 30, 2017
= (a) + (b) + (c) + (d) + (e) + (f) + (g)
)
TOL Roll-Forward(In thousands of dollars)
* The TOL used in the roll-forward as of June 30, 2016 is calculated using thediscount rate as of the Prior Measurement Date.
2015
1,015,080 2,029,372
1,511,960 (1,741,456)
(23,033)
2,791,923
39,684,776
42,476,699
480,073 79,506
308,160 862,179
(1,741,456) (8,869)
(23,033)
(43,440)
18,092,571
18,049,131
24,427,568
Total pension liabilityService CostInterestDifference between expected and actual experienceChanges of assumptionsBenefit paymentsRefunds of contributions
Net change in total pension liability
Total pension liability - beginning
Total pension liability - ending (a)
Plan Net PositionContributions - State of KentuckyContributions - Other EmployersContributions - MembersNet investment incomeBenefit paymentsAdministrative expenseRefunds of contributions
Net change in plan net position
Plan net position - beginning
Plan net position - ending (b)
Net pension liability - ending (a) - (b)
REQUIRED SUPPLEMENTARY INFORMATION
Schedule of Changes in the Net Pension Liability(In thousands of dollars)
2014
1,002,338 1,956,610
(353,043) (1,654,376)
(25,462)
926,067
38,758,709
39,684,776
483,330 79,996
304,982 2,803,249
(1,654,376) (7,956)
(25,462)
1,983,763
16,108,808
18,092,571
21,592,205
2016
1,120,893 2,027,457
(58,035) 4,030,834
(1,833,199) (27,748)
5,260,202
42,476,699
47,736,901
484,987 80,468
313,044 (245,215)
(1,833,199) (8,636)
(27,748)
(1,236,299)
18,049,131
16,812,832
30,924,069
2017
1,332,587 1,964,107
199,471 (2,321,327) (1,918,612)
(26,305)
(770,079)
47,736,901
46,966,822
981,417 79,303
313,625 2,475,753
(1,918,612) (10,314) (26,305)
1,894,867
16,812,832
18,707,699
28,259,123
$
$
$
$
$
$
$
$
$
$
$
$
$
$
$
$
Schedule is intended to show information for 10 years. Additional years will be displayed as they become available.

60 Teachers’ Retirement System of the State of Kentucky • Years Ended June 30, 2017 and 2016
FINANCIAL SECTION
$ 3,415,4323,390,539
3,455,008 3,317,422 3,310,710 3,310,176 3,283,749 3,321,614 3,253,077 3,190,332
FiscalYear
EndedJune 30
ActuariallyDetermined
EmployerContributions
ActualEmployer
Contributions
AnnualContribution Excess
(Deficiency)
$ 1,060,720565,455
559,579 563,326 568,233 557,340
1,037,936 479,805 442,550 466,248
Schedule of Employer Contributions(In thousands of dollars)
2017 2016 2015
2014 * 2013 2012 2011 2010 2009 2008
CoveredPayroll
ActualContributions as a
Percentage ofCovered Payroll
$ 1,076,617999,270
913,654 823,446 802,985 757,822 678,741 633,938 600,283 563,789
(15,897(433,815
(354,075 (260,120 (234,752 (200,482 359,195
(154,133 (157,733 (97,541
31.0616.6816.2016.9817.1616.8431.6114.4413.6014.61
%))))))
)))
$
* Revised from previous year to reflect actual covered-employee payroll.
2015 $ 42,476,699
18,049,131$ 24,427,568
42.49 $ 3,455,008
707.02
Total pension liabilityPlan net positionNet pension liability
Ratio of plan net position to total pension liabilityCovered-employee payrollNet pension liability as a percentage of
covered-employee payroll
Schedule of Net Pension Liability(In thousands of dollars)
%
%
2014 $ 39,684,776
18,092,571$ 21,592,205
45.59 $ 3,317,422
650.87
%
%
2016 $ 47,736,901
16,812,832 $ 30,924,069
35.22 $ 3,390,539
912.07
%
%
The total pension liability contained in this schedule was provided by TRS's actuary, Cavanaugh MacdonaldConsulting, LLC. The net pension liability is measured as the total pension liability less the amount of the fiduciary netposition of the System.
Changes of Benefit Terms. None
Changes of assumptions. In the 2016 valuation, rates of withdrawal, retirement, disability, mortality and rates ofsalary increase were adjusted to more closely reflect actual experience. In the 2016 valuation and later, the expectationof retired life mortality was changed to the RP-2000 Mortality Tables projected to 2025 with projection scale BB, setforward two year for males and one year for females rather than the RP-2000 Mortality Tables projected to 2020 withprojection scale AA, which was used prior to 2016.
In the 2011 valuation, rates of withdrawal, retirement, disability and mortality were adjusted to more closely reflectactual experience. In the 2011 valuation and later, the expectation of retired life mortality was changed to the RP-2000Mortality Tables projected to 2020 with projection scale AA, set back one year for females rather than the 1994 GroupAnnuity Mortality Tables which was used prior to 2016. For the 2011 valuation through the 2013 valuation, an interestsmoothing methodology was used to calculate liabilities for purposes of determining the actuarially determinedcontributions.
NOTE 1Schedule of Changes in the Net Pension Liability
See accompanying independent auditor's report.
2017 $ 46,966,822
18,707,699$ 28,259,123
39.83$ 3,415,432
827.40
%
%
Schedule is intended to show information for 10 years. Additional years will be displayed as they become available.
Required Supplementary Information continued . . .

Teachers’ Retirement System of the State of Kentucky • Years Ended June 30, 2017 and 2016 61
FINANCIAL SECTION
Required Supplementary Information continued . . .
NOTE 2Schedule of Employer Contributions
The required employer contributions and percent of those contributions actually made are presented in theschedule.
NOTE 3Actuarial Methods and Assumptions
The actuarially determined contribution rates in the schedule of employer contributions are calculated as of June 30,three years prior to the end of the fiscal year in which contributions are reported. The following actuarial methods andassumptions were used to determine contribution rates reported in the most recent year of the schedule:
Actuarial cost method Entry ageAmortization period Level percentage of payroll, openRemaining amortization period 30 yearsAsset valuation method 5-year smoothed marketInflation 3.50 percentSalary increase 4.00 to 8.20 percent, including inflationUltimate Investment rate of return 7.50 percent, net of pension plan investment expense,
including inflation
Schedule is intended to show information for 10 years. Additional years will be displayed as they become available.
Schedule of Investment Returns
2016
-1.32%
2015
4.96%
2014
17.95%Annual money weighted rate of return,net of investment expense
2017
15.00%
See accompanying independent auditor's report.

62 Teachers’ Retirement System of the State of Kentucky • Years Ended June 30, 2017 and 2016
FINANCIAL SECTION
Required Supplementary Information continued . . .
See accompanying independent auditor's report.
2017
$ 95,625 333,990
8,926
(178,500
260,041
4,264,131
$ 4,524,172
$ 75,497 104,879 128,819 95,453
(178,500 (1,539
224,609
733,781
958,390
$ 3,565,782
Total OPEB liabilityService CostInterestChanges of benefit termsDifference between expected and actual experienceChanges of assumptionsBenefit payments
Net change in OPEB liability
Total OPEB liability - beginning
Total OPEB liability - ending (a)
Plan Net PositionContributions - State of KentuckyContributions - Other EmployersContributions - Active MembersNet investment incomeBenefit paymentsAdministrative expenseOther
Net change in plan net position
Plan net position - beginning
Plan net position - ending (b)
Net OPEB liability - ending (a) - (b)
Medical Insurance PlanSchedule of Changes in the Net OPEB Liability
(In thousands of dollars)
NOTE 1Schedule of Changes in the Net OPEB Liability
The net OPEB liability contained in this schedule was provided by TRS's actuary, Cavanaugh MacdonaldConsulting, LLC. The net OPEB liability is measured as the total OPEB liability less the amount of the fiduciary netposition of the System.
Changes of Benefit Terms. With the passage of House Bill 471, the eligibility for non-single subsidies (NSS) for theKEHP-participating members who retired prior to July 1, 2010 is restored, but the State will only finance, via its KEHP"shared responsibility" contributions, the costs of the NSS related to those KEHP-participating members who retired onor after July 1, 2010.
Changes of assumptions. None
)
))
Schedule is intended to show information for 10 years. Additional years will be displayed asthey become available.

Teachers’ Retirement System of the State of Kentucky • Years Ended June 30, 2017 and 2016 63
FINANCIAL SECTION
NetOPEB
Liability
104.40 %$ 4,524,172 $ 3,565,782 $ 3,415,4322017 $ 958,390 21.18 %
Net OPEBLiability as a
% of CoveredPayroll
Fiscal YearEndingJune 30
TotalOPEB
Liability
PlanFiduciary
Net Position
Plan FiduciaryNet Position as a% of Total OPEB
LiabilityCoveredPayroll
Medical Insurance PlanSchedule of Net OPEB Liability
(In thousands of dollars)
Required Supplementary Information continued . . .
Medical Insurance Plan – Schedule of Employer Contributions
$ 3,415,432 3,390,539 3,455,008 3,317,422 3,310,710 3,310,176 3,283,749 3,321,614 3,253,077 3,190,322
5.28%6.554.864.905.035.375.755.225.475.04
$ (77,522 (123,984 (61,478 (2,985 20,115
292,469 288,988 283,674 289,221 234,416
$ 180,376 221,967 168,084 162,568 166,611 177,748 188,735 173,380 178,092 160,866
$ 102,854 97,983
106,606 159,583 186,726 470,217 477,723 457,054 467,313 395,282
2017201620152014201320122011201020092008
ActualContributions as a
Percentage ofCovered Payroll
ValuationYear
June 30
ActuariallyDetermined
EmployerContribution
Contributions in Relation to the
Actuarially Determined
Contribution
AnnualContributionDeficiency/
(Excess)CoveredPayroll
Schedule is intended to show information for 10 years. Additional years will be displayed as they become available.
))))
(
NOTE 2Schedule of Employer Contributions
The required employer contributions and percent of those contributions actually made are presented in theschedule.
NOTE 3Actuarial Methods and Assumptions
The actuarially determined contribution rates in the schedule of employer contributions are calculated as of June 30,three years prior to the end of the fiscal year in which contributions are reported. The following actuarial methods andassumptions were used to determine contribution rates reported in the most recent year of the schedule:
Actuarial cost method Entry age normalAmortization method Level percentage of payrollAmortization period 30 years, openAsset valuation method 5-year smoothed valueInflation 3.00 percentReal wage growth 0.50 percentWage inflation 3.50 percentSalary increase 3.50 to 7.20 percent, including wage inflationDiscount rate 8.00 percent
See accompanying independent auditor's report.

64 Teachers’ Retirement System of the State of Kentucky • Years Ended June 30, 2017 and 2016
FINANCIAL SECTION
Required Supplementary Information continued . . .
See accompanying independent auditor's report.
Schedule is intended to show information for 10 years. Additional years will be displayed as they become available.
Schedule of Investment ReturnsHealth Insurance Trust
2016
-2.20 %
2015
1.38 %
2014
15.38 %Annual money weighted rate of return,net of investment expense
2017
14.37 %
2017
$ 1,067 7,761
(5,151
3,677
106,059
$ 109,736
$ 882 168
915 (5,151
(28
(3,214
90,991
87,777
$ 21,959
Total OPEB liabilityService CostInterestChanges of benefit termsDifference between expected and actual experienceChanges of assumptionsBenefit payments
Net change in OPEB liability
Total OPEB liability - beginning
Total OPEB liability - ending (a)
Plan Net PositionContributions - State of KentuckyContributions - Other EmployersContributions - Active MembersNet investment incomeBenefit paymentsAdministrative expenseOther
Net change in plan net position
Plan net position - beginning
Plan net position - ending (b)
Net OPEB liability - ending (a) - (b)
Life Insurance PlanSchedule of Changes in the Net OPEB Liability
(In thousands of dollars)
)
))
)
MIF health care cost trendsUnder age 65 7.75 percent FYE 2017, decreasing to an ultimate rate
of 5.00 percent by FYE 2023Ages 65 and older 5.75 percent FYE 2017, decreasing to an ultimate rate
of 5.00 percent by FYE 2020Medicare part B premiums 1.02 percent FYE 2017 with an ultimate rate
of 5.00 percent by FYE 2029MIF under age 65 claims The current premium charged by KEHP is used as the base cost
and is projected forward using only the health care trend
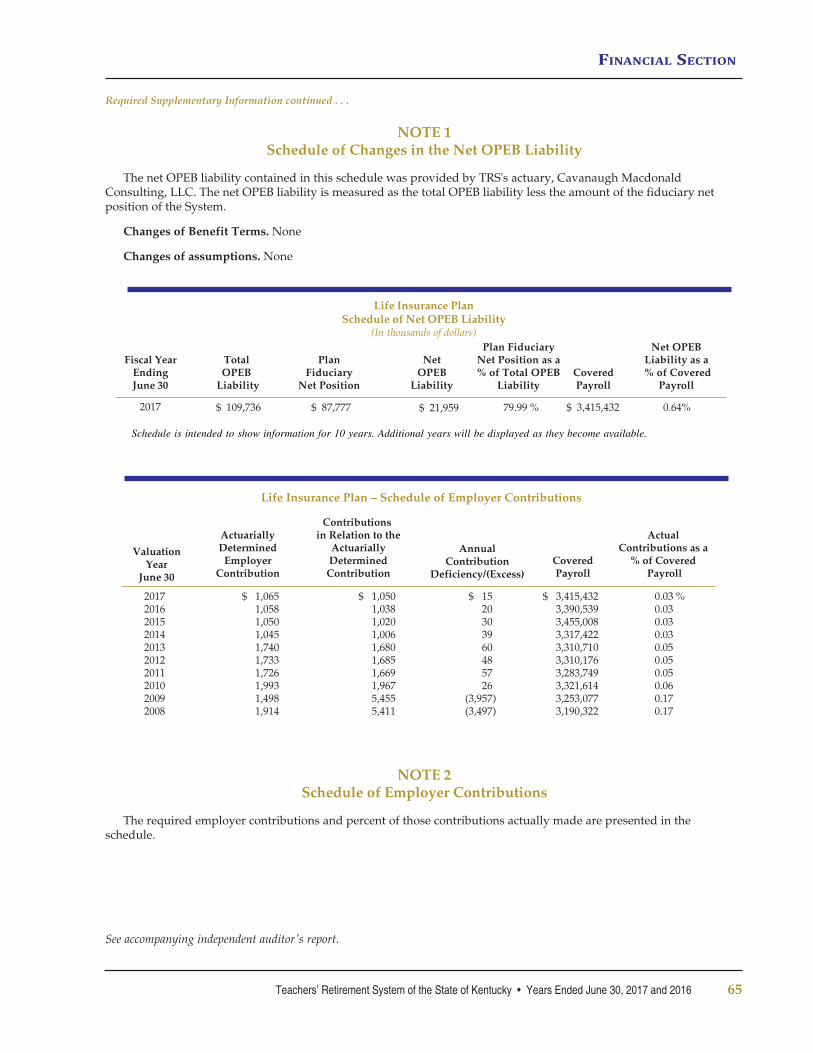
Teachers’ Retirement System of the State of Kentucky • Years Ended June 30, 2017 and 2016 65
FINANCIAL SECTION
NOTE 1Schedule of Changes in the Net OPEB Liability
The net OPEB liability contained in this schedule was provided by TRS's actuary, Cavanaugh MacdonaldConsulting, LLC. The net OPEB liability is measured as the total OPEB liability less the amount of the fiduciary netposition of the System.
Changes of Benefit Terms. None
Changes of assumptions. None
Required Supplementary Information continued . . .
See accompanying independent auditor's report.
NetOPEB
Liability
0.64%$ 109,736 $ 21,959 $ 3,415,4322017 $ 87,777 79.99 %
Net OPEBLiability as a
% of CoveredPayroll
Fiscal YearEndingJune 30
TotalOPEB
Liability
PlanFiduciary
Net Position
Plan FiduciaryNet Position as a% of Total OPEB
LiabilityCoveredPayroll
Life Insurance PlanSchedule of Net OPEB Liability
(In thousands of dollars)
Schedule is intended to show information for 10 years. Additional years will be displayed as they become available.
Life Insurance Plan – Schedule of Employer Contributions
$ 3,415,432 3,390,539 3,455,008 3,317,422 3,310,710 3,310,176 3,283,749 3,321,614 3,253,077 3,190,322
0.03 %0.030.030.030.050.050.050.060.170.17
$ 15 20 30 39 60 48 57 26
(3,957 (3,497
$ 1,050 1,038 1,020 1,006 1,680 1,685 1,669 1,967 5,455 5,411
$ 1,065 1,058 1,050 1,045 1,740 1,733 1,726 1,993 1,498 1,914
2017201620152014201320122011201020092008
ActualContributions as a
% of Covered Payroll
ValuationYear
June 30
ActuariallyDetermined
EmployerContribution
Contributions in Relation to the
Actuarially Determined
Contribution
AnnualContribution
Deficiency/(Excess)CoveredPayroll
))
NOTE 2Schedule of Employer Contributions
The required employer contributions and percent of those contributions actually made are presented in theschedule.

66 Teachers’ Retirement System of the State of Kentucky • Years Ended June 30, 2017 and 2016
FINANCIAL SECTION
NOTE 3Actuarial Methods and Assumptions
The actuarially determined contribution rates in the schedule of employer contributions are calculated as of June 30,three years prior to the end of the fiscal year in which contributions are reported. The following actuarial methods andassumptions were used to determine contribution rates reported in the most recent year of the schedule:
Actuarial cost method Entry age normalAmortization method Level percentage of payrollAmortization period 30 years, openAsset valuation method Market valueInflation 3.50 percentReal wage growth 0.50 percentWage inflation 4.00 percentSalary increase 4.00 to 8.10 percent, including wage inflationDiscount rate 7.50 percent
Required Supplementary Information continued . . .
Schedule is intended to show information for 10 years.Additional years will be displayed as they become available.
Schedule of Investment ReturnsLife Insurance Trust
Annual money weighted rate ofreturn, net of investment expense
2017
1.02 %
See accompanying independent auditor's report.

Teachers’ Retirement System of the State of Kentucky • Years Ended June 30, 2017 and 2016 67
FINANCIAL SECTION
2016
$ 284,189 89,017 32,200 45,000
2,176 46,798
6,125 21,672
531 120,000
$ 647,708
Schedule of Administrative ExpensesFor the Year Ended June 30, 2017 and 2016
SalariesOther Personnel CostsProfessional Services and ContractsUtilitiesRentalsMaintenancePostage & Related ServicesPrintingInsuranceMiscellaneous ServicesTelecommunicationsComputer ServicesSuppliesDepreciationTravelDues & SubscriptionsMiscellaneous CommoditiesFurniture, Fixtures, & Equipment not CapitalizedCompensated Absences
Total Administrative Expenses
$ 7,291,328 735,748 395,216 100,641
23,607 56,520
300,813 188,135 175,768 159,272
20,958 145,252
63,097 1,996,821
40,734 65,361 11,095
110,821
$ 11,881,187
Expense 2017
Schedule of Professional Services and ContractsFor the Year Ended June 30, 2017 and 2016
Professional
Cavanaugh Macdonald ConsultingSegal ConsultingAuditor of Public AccountsMountjoy Chilton MedleyInternational Claim SpecialistIce MillerReinhart, Boerner VanDeurenStoll, Keenon, and OgdenAttorney GeneralPeritus
Total Professional Services and Contracts
Nature of Service
Actuarial ServicesActuarial ServicesAuditing ServicesAuditing Services
Investigative Services Attorney Services Attorney Services Attorney Services Attorney Services Communications
2017
$ 157,089
89,2141,512
24,233
3,168
120,000
$ 395,216
ADDITIONAL SUPPORTING SCHEDULES
$ 5,808,287 696,933 647,708
93,633 20,991 93,521
442,610 199,837 183,329 164,405
22,126 151,789
51,059 1,535,843
45,221 63,752 12,724 85,604 30,891
$ 10,350,263
2016
See accompanying independent auditor's report.

68 Teachers’ Retirement System of the State of Kentucky • Years Ended June 30, 2017 and 2016
FINANCIAL SECTION
3,114,384 2,473,839
554,495 483,396 786,682
1,325,541 5,980,296 3,168,837
17,887,470
160,777 222,920
383,697
9,543,946
10,303,427
18,591,574
535,039
413,850 51,660 33,965
499,475
5,936 51,266
57,202
3,215,679
61,017,509
$
$
3,114,384 2,473,839
336,647 425,662 786,682
1,325,541 5,980,296 3,168,837
17,611,888
160,777 222,920
383,697
8,812,597
9,454,366
17,428,907
481,653
413,850 51,660 33,965
499,475
5,936 51,266
57,202
3,116,857
57,846,642
Equity ManagersBaillie GiffordBaring Asset Management, Inc.Black RockFort Washington Focused EquityGE Asset ManagementTodd Asset Management LLCUBS Global Asset ManagementWellington Management Company
Total Equity Managers
Fixed Income ManagersFort Washington Investment Broad MarketGalliard Capital Management
Total Fixed Income Managers
Real Estate
Additional Categories
Alternative Investments
CustodianThe Bank of New York Mellon
ConsultantHewitt Ennis Knupp, Inc.Bevis LongstrethGeorge Philip
Total Consultants
Legal & ResearchReinhart, Boerner Van DeurenIce Miller
Total Legal & Research
OtherAdministrative and Operational (includes Personnel)
Total Contracted Investment Management Expenses
Schedule of Contracted Investment Management ExpensesYear Ended June 30, 2017
217,848 57,734
275,582
731,349
849,061
1,162,667
53,386
98,822
3,170,867
Pension Medical Total
$
$
$
$
Additional Supporting Schedules continued . . .
See accompanying independent auditor’s report.

Teachers’ Retirement System of the State of Kentucky • Years Ended June 30, 2017 and 2016 69
FINANCIAL SECTION
Additional Supporting Schedules continued . . .
$
$
2,800,298 2,419,271
265,816 800,000
1,295,310 2,980,341 2,917,720
13,478,756
150,088 229,226
379,314
7,010,123
8,701,619
14,469,348
380,233
358,850 50,137 38,962
447,949
5,560 84,697
90,257
2,845,221
47,802,820
Equity ManagersBaillie GiffordBaring Asset Management, Inc.Black RockGE Asset ManagementTodd Asset Management LLCUBS Global Asset ManagementWellington Management Company
Total Equity Managers
Fixed Income ManagersFort Washington Investment AdvisorsGalliard Capital Management
Total Fixed Income Managers
Real Estate
Additional Categories
Alternative Investments
CustodianThe Bank of New York Mellon
ConsultantHewitt Ennis Knupp, Inc.Bevis LongstrethGeorge Philip
Total Consultants
Legal & ResearchReinhart, Boerner Van DeurenIce Miller
Total Legal & Research
OtherAdministrative and Operational (includes Personnel)
Total Contracted Investment Management Expenses
Schedule of Contracted Investment Management ExpensesYear Ended June 30, 2016
191,346
191,346
503,596
683,241
794,844
30,275
74,831
2,278,133
2,800,298 2,419,271
457,162 800,000
1,295,310 2,980,341 2,917,720
13,670,102
150,088 229,226
379,314
7,513,719
9,384,860
15,264,192
410,508
358,850 50,137 38,962
447,949
5,560 84,697
90,257
2,920,052
50,080,953
Pension Medical Total
$
$
$
$
See accompanying independent auditor’s report.

70 Teachers’ Retirement System of the State of Kentucky • Years Ended June 30, 2017 and 2016
FINANCIAL SECTION
REPORT ON INTERNAL CONTROL OVER FINANCIAL REPORTING AND ON COMPLIANCEAND OTHER MATTERS BASED ON AN AUDIT OF FINANCIAL STATEMENTS PERFORMED
IN ACCORDANCE WITH GOVERNMENT AUDITING STANDARDS
Independent Auditor’s Report
To the Board of TrusteesTeachers' Retirement System of the State of KentuckyFrankfort, KY
We have audited, in accordance with the auditing standards generally accepted in the United States ofAmerica and the standards applicable to financial audits contained in Government Auditing Standardsissued by the Comptroller General of the United States, the financial statements of the Teachers' RetirementSystem of the State of Kentucky, which comprise the statement of fiduciary net position as of June 30,2017, and the related statement of changes in fiduciary net position for the year then ended, and the relatednotes to the financial statements, which collectively comprise the Teachers' Retirement System of the Stateof Kentucky's basic financial statements, and have issued our report thereon dated November 14, 2017.
Internal Control over Financial Reporting
In planning and performing our audit of the financial statements, we considered the Teachers' RetirementSystem of the State of Kentucky's internal control over financial reporting (internal control) to determinethe audit procedures that are appropriate in the circumstances for the purpose of expressing our opinion onthe financial statements, but not for the purpose of expressing an opinion on the effectiveness of theTeachers' Retirement System of the State of Kentucky's internal control. Accordingly, we do not express anopinion on the effectiveness of the Teachers' Retirement System of the State of Kentucky's internal control.
A deficiency in internal control exists when the design or operation of a control does not allow managementor employees in the normal course of performing their assigned functions, to prevent, or detect and correctmisstatements on a timely basis. A material weakness is a deficiency, or a combination of deficiencies, ininternal control, such that there is a reasonable possibility that a material misstatement of the entity'sfinancial statements will not be prevented, or detected and corrected on a timely basis. A significantdeficiency is a deficiency, or a combination of deficiencies, in internal control that is less severe than amaterial weakness, yet important enough to merit attention by those charged with governance.

Teachers’ Retirement System of the State of Kentucky • Years Ended June 30, 2017 and 2016 71
FINANCIAL SECTION
Page 2Board of TrusteesTeachers’ Retirement System of the State of Kentucky
Our consideration of internal control over financial reporting was for the limited purpose described in thefirst paragraph of this section and was not designed to identify all deficiencies in internal control overfinancial reporting that might be material weaknesses or significant deficiencies. Given these limitations,during our audit we did not identify any deficiencies in internal control over financial reporting that weconsider to be material weaknesses. However, material weaknesses may exist that have not been identified.
Compliance and Other Matters
As part of obtaining reasonable assurance about whether the Teachers' Retirement System of the State ofKentucky's financial statements are free from material misstatement, we performed tests of its compliancewith certain provisions of laws, regulations, contracts, and grant agreements, noncompliance with whichcould have a direct and material effect on the determination of financial statement amounts. However,providing an opinion on compliance with those provisions was not an objective of our audit, andaccordingly, we do not express such an opinion. The results of our tests disclosed no instances ofnoncompliance or other matters that are required to be reported under Government Auditing Standards.
Purpose of this Report
The purpose of this report is solely to describe the scope of our testing of internal control and complianceand the results of that testing, and not to provide an opinion on the effectiveness of the Teachers' RetirementSystem of the State of Kentucky's internal control or on compliance. This report is an integral part of anaudit performed in accordance with Government Auditing Standards in considering the Teachers' RetirementSystem of the State of Kentucky's internal control and compliance. Accordingly, this communication is notsuitable for any other purpose.
/s/ Mountjoy Chilton Medley LLP
Louisville, KY
November 14, 2017

This page was intentionally left blank.

2017
InvestmentSection
Teachers’ Retirement System
of the State of Kentucky

74 Teachers’ Retirement System of the State of Kentucky • Years Ended June 30, 2017 and 2016
INVESTMENT SECTION
REPORT ON INVESTMENT ACTIVITY
This report is prepared by the Investment staff of theTeachers' Retirement System of Kentucky.
Mr. Tom Siderewicz, CFAChief Investment Officer
Mr. Philip L. WebbDirector of Investment Accounting
INVESTMENT COMMITTEE
Mr. Ronald L. SandersChair
Mr. Arthur GreenVice-Chair
Mr. Hollis GrittonMember
Dr. Jay MorganMember
Ms. Alison WrightMember
Mr. Bevis LongstrethInvestment Advisor to TRS Kentucky Investment Committee
Mr. George PhilipInvestment Advisor to TRS Kentucky Investment Committee
EXECUTIVE INVESTMENT STAFF
Mr. Gary L. Harbin, CPAExecutive Secretary
Mr. Tom Siderewicz, CFAChief Investment Officer

Teachers’ Retirement System of the State of Kentucky • Years Ended June 30, 2017 and 2016 75
INVESTMENT SECTION
Aon Hewitt | Retirement and Investment200 E. Randolph Street, Suite 1500 | Chicago, IL 60601t +1.312.381.1200 | f +1.312.381.1366 | aonhewitt.comInvestment advice and consulting services provided by Aon Hewitt Investment Consulting, Inc., an Aon Company
December 1, 2017
To the members of the Board of Trustees and participants of the Teachers' Retirement System of Kentucky:
The Teacher Retirement System of Kentucky (TRS) investment program produced a total return of 15.37% for the twelve-month period ended June 30, 2017, more than double the actuarial assumed rate of return of 7.5%. This returnexceeded that of the Policy Benchmark by 1.3 percentage points and ranked near the top of a universe of public pensionfunds with assets in excess of $1 billion (8th percentile ranking). Impressively, TRS also outperformed the PolicyBenchmark and ranked within or near the top-decile of the public pension fund universe for the three-, five-, and ten-yearperiods. Each of the asset classes, with the exception of the additional categories group, contributed to relativeperformance during the fiscal year. On an absolute basis, the equity portfolio fueled results with a return slightly below22%, while the fixed income allocation was a slight drag on performance as this was one of the lowest returning assetclasses during the fiscal year.
Notable manager contributions were Todd and UBS Large Cap U.S. equity and Baillie Gifford International equityportfolios, all of which outperformed their respective benchmarks by wide margins. This is in contrast to FY 2016 wheremost active equity managers struggled to outperform. This is a testament to maintaining long-term strategy and notoveremphasizing short-term performance in monitoring.
Over the past fiscal year, equity markets performed strongly driven by strong economic and corporate fundamentals. Thetop performing regions were Europe (excluding the United Kingdom) and emerging markets. In the bond market, the 10-year U.S. Treasury yield ended the fiscal year at 2.31%, 82 basis points higher than the beginning of the fiscal year.
TRS's efforts to diversify away from traditional fixed income proved particularly beneficial during FY 2017 as rising interestrates led to a slightly negative return for the U.S. Government/Credit Index whereas the additional categories asset class,which is generally comprised of alternative fixed income, private credit and below investment grade bonds, produced anabsolute return in excess of 10% for the fiscal year. The active management efforts with the fixed income asset class alsoproved fruitful as the in-house managed portfolios added value overall as did each of the externally managed portfolios.Overall, the fixed income portfolio outperformed the benchmark by 50 basis points for the fiscal year.
TRS's initiatives to diversify the real estate allocation also benefitted performance as the value added and opportunisticportfolios produced double digit gains as the returns on core and triple net lease real estate moderated during the fiscalyear. In addition to real estate, TRS has diversified its alternatives portfolio across different private equity and infrastructurestrategies over the past 10 years, resulting in a fiscal year return of 11.7% on a time-weighted basis.
We would like to thank the Board of Trustees, Investment Committee, and Investment Staff for their confidence. Weappreciate the opportunity to assist the retirement system in meeting its investment goals.
Respectfully,
Patrick J. Kelly, CFA, CAIAPartner

76 Teachers’ Retirement System of the State of Kentucky • Years Ended June 30, 2017 and 2016
INVESTMENT SECTION
RETIREMENT ANNUITY TRUST FUND
INVESTMENT POLICY SUMMARY
The TRS Board of Trustees has a statutory obligation to invest the members' assets in a manner consistent with thefiduciary standards set forth in the "prudent person rule." Consistent with these fiduciary standards, the board hasrecognized certain principles that guide investment-related decisions. First, the board will preserve the long-termcorpus of the fund. Second, the board will seek to maximize total investment return within prudent risk parameters.Third, the board will act in the exclusive interest of the members and beneficiaries of the System. This broad summaryis a reference point for management of retirement assets and outlines the investment philosophy and practice of TRS.
INVESTMENT OBJECTIVES
TRS invests the members' funds in several diverse classes of assets, including equities, bonds and real estate. Thisdiversification helps us earn the highest possible long-term rate of return within appropriate risk levels. In turn thisenables us to pay guaranteed benefits to members and their beneficiaries at the lowest possible cost to participatingemployers and the taxpayers that fund them. Generally, the retirement system's liabilities will not be paid for as manyas 30-40 years. Therefore, as a long-term investor, TRS holdings can withstand some short-term volatility. Theretirement annuity trust fund's long-term investment objective is to achieve an annualized rate of return of 7.5%.
RISK CONTROLS
The TRS investment program faces various risks; however, the primary risk to TRS is that the assets will notsupport liabilities over long periods of time. In order to control this risk and any other risks, the board has taken thefollowing steps on an ongoing basis:
• Actuarial valuations are performed each year to evaluate the funding objectives of the retirement system.In addition, every ten years an external audit of the actuary is conducted to ensure that the assumptionsmade and calculation methods used are resulting in properly computed liabilities of the System.
• Asset/liability studies are conducted approximately every five years. These studies ensure that theportfolio design is structured to meet the liabilities of the retirement system.
• The TRS Investment Committee adopts, and regularly reviews, detailed investment strategies forimplementation of the investment policy.
ASSET ALLOCATION
Operating within relevant regulatory limitations, the System's investment consultant, on an annual basis, presentsto the Investment Committee for approval target percentages and ranges for the System's various asset classes.Annually approved asset allocation parameters serve to balance the retirement system's liquidity requirements, volatilitytolerance, and return requirements to meet both short-term and long-term obligations. The System's assets arediversified across a variety of asset classes, investment management styles, and individual securities in order to reducevolatility and enhance the potential of the investment portfolio to achieve the retirement system's long-term goals.
Asset allocation decisions for pension plans are highly dependent on the unique characteristics of a particular plan.Factors such as liability requirements, the level of funding, and statutory investment restrictions are importantconsiderations within the context of the asset allocation decision making process. Consequently, asset allocations maydiffer markedly between various pension plans due to their unique circumstances.
The information below shows the System's asset allocation by fair value as of June 30, 2017, and June 30, 2016, aswell as the target and strategic range for each asset class for fiscal year 2017.

Teachers’ Retirement System of the State of Kentucky • Years Ended June 30, 2017 and 2016 77
INVESTMENT SECTION
June 30,2017
366,129,983
3,020,457,273
7,682,590,280
4,003,953,513
1,046,760,134
854,635,619
208,219,943
1,435,143,550
18,617,890,295
$
$
Cash Equivalents***
Fixed Income
Domestic Equities
International Equities
Real Estate
Private Equity
Timberland
Additional Categories
TOTALS
Retirement Annuity Trust
%
2.0
16.2
41.3
21.5
5.6
4.6
1.1
7.7
100.0
June 30,2016
294,405,676
2,878,918,409
7,210,451,881
3,220,445,062
940,860,202
731,560,317
201,253,033
1,319,326,624
16,797,221,204
%
1.7
17.1
42.9
19.2
5.6
4.4
1.2
7.9
100.0
$
$
* Includes Life Insurance Trust values of $86,443,328, Tax Shelter Annuity value of $343,792, and 401(h) value of 19,471,617.
** Includes Life Insurance Trust values of $90,113,180, Tax Shelter Annuity value of $352,815, and 401(h) value of 14,302,842.
*** Reflects only cash balances not allocated to other asset classes. Uninvested cash balances allocated to various asset classes are represented inthe respective asset classes.
***

78 Teachers’ Retirement System of the State of Kentucky • Years Ended June 30, 2017 and 2016
INVESTMENT SECTION
Distribution of InvestmentsRetirement Annuity Trust**
Fair Values
* Reflects only cash balances not allocated to other asset classes. Uninvested cash balances allocatedto various asset classes are represented in the respective asset classes.
** Includes Life Insurance Trust values.
June 30, 2016
2.6%
June 30, 2017

Teachers’ Retirement System of the State of Kentucky • Years Ended June 30, 2017 and 2016 79
INVESTMENT SECTION
Cash
Fixed IncomeGovernment/Agency/OtherCorporate
Equity Domestic All Cap Domestic Large Cap Domestic Mid Cap Domestic Small Cap International***
Real Estate
Alternative Investments*
Additional Categories
TOTAL
Unlimited35%
65%
30%
10%
10%
15%
1 - 3%
12 - 19
57 - 65
32 - 40 1 - 5 1 - 317 - 23
4 - 8
4 - 10
6 - 12
2.0%
15.0
61.0
36.0 3.0 2.0
20.0
6.0
7.0
9.0
100.0%
2.0%
16.29.17.1
62.81.3
34.03.72.3
21.5
5.6
5.7
7.7
100.0%
Asset Class
RegulatoryLimits
(Mkt Value)
StrategicRange(Mkt)
Target(Mkt)
6/30/2017(Mkt)**
* Includes private equity, venture capital, timberland, and infrastructure investments. ** Starting with 7/2008, Cash is only the unallocated cash balance. Manager cash balances will be included with the asset
type of the managers investments.*** As of 6/30/17, 20.1% of Total International Equities were invested in Emerging Markets.
Strategic Weightings by Asset Class
PORTFOLIO RETURNS
For the fiscal year, the retirement annuity trust fund's portfolio generated a total return of 15.37%, surpassing thepolicy benchmark return of 14.04%. Domestic equities returned 21.93% versus 21.17% for the Standard & Poor's 1500Index, while international equities returned 23.32% versus 21.0% for the MSCI All Country World (Ex-US) Index. Fixedincome investments outperformed, returning 0.12% versus -0.41% for the Barclays Government/Credit Index. Lesstraditional asset classes such as real estate, private equity, timberland, and alternative credit are beginning to contributemeaningfully to total return as those programs are expanded.
The table below details historical performance for the retirement annuity trust fund and its component asset classesfor the period ended June 30, 2017. The retirement annuity trust fund's returns were generated by the Segal MarcoAdivisors performance reporting system using a time-weighted rate of return calculation based upon market values.

80 Teachers’ Retirement System of the State of Kentucky • Years Ended June 30, 2017 and 2016
INVESTMENT SECTION
TOTAL PLAN Policy Benchmark**
Total EquityDomestic Equity
S&P 1500 IndexAll-Cap Equities
Russell 3000Large-Cap Equities
S&P 500 IndexMid-Cap Equities
S&P 400 IndexSmall-Cap Equities
S&P 600 IndexInternational Equity***
MSCI AC World Ex US
Fixed IncomeBarclay's Govt./Credit Index
Real EstateInhouse Triple Net Lease
CPI plus 2%Core Real Estate:
NCREIF ODCE (VW)Non-Core Real Estate:
NCREIF Property Index
Alternative InvestmentsPrivate Equity
Mature Private EquityS&P 500 plus 3%
Private Equity < 5 YearsTimberland:
NCREIF Timberland Index
Additional CategoriesB of A Merrill Lynch High Yield Master II
Cash (Unallocated)90 Day T-Bill
Total Plan Gross Return for 30-year period* 8.18
* Returns are annualized for periods longer than one year.
** Prior to July 1, 2008, TRS did not benchmark overall fund performance. Effective July 1, 2008, the Board of Trustees approved aPolicy Index that represents the returns of appropriate benchmarks for the various asset classes weighted by the mid-point of the strategicrange for the current fiscal year.
*** As of 6/30/17, 20.1% of Total International Equities were invested in Ermerging Markets.
1 Yr
15.3714.04
21.9321.1718.09
21.2717.9020.8918.5722.9822.4723.3221.00
0.12-0.41
8.933.687.937.87
11.216.97
11.706.73
21.4315.98
5.993.35
10.1312.75
0.550.44
3 Yr*
6.276.16
7.129.049.51
9.059.618.998.539.539.322.571.27
3.012.62
8.752.96
12.0811.3416.8710.17
9.407.05
12.9011.08
7.735.54
3.074.48
0.300.20
5 Yr*
10.099.69
13.1414.9714.68
14.8214.6315.9414.9215.9915.47
8.747.70
2.902.29
8.223.33
11.9311.7918.2610.49
11.008.55
18.07
5.857.16
6.756.92
0.220.15
10 Yr*
6.29
6.147.457.34
7.317.187.888.568.628.442.441.59
5.464.57
8.283.67
7.11
0.660.55
20 Yr*
6.67
7.027.64
5.865.33
8.784.12
2.382.04
Portfolio Returns continued ...
Schedule of Investment Returns - Retirement Annuity Trust - Gross
FYTD
15.3714.04
21.9321.1718.09
21.2717.9020.8918.5722.9822.4723.3221.00
0.12-0.41
8.933.687.937.87
11.216.97
11.706.73
21.4315.98
5.993.35
10.1312.75
0.550.44
Last Qtr
3.573.21
4.563.192.962.433.023.163.094.031.972.671.717.465.99
1.561.69
1.960.511.541.703.481.75
4.754.103.855.091.310.70
1.252.14
0.200.20
Market Value
18,617,890,295
11,686,543,7947,682,590,281
232,768,027
6,336,231,065
679,277,573
434,313,616
4,003,953,513
3,020,457,273
392,640,022
358,090,905
296,029,206
854,635,619 356,671,963
497,963,656 208,219,943
1,435,143,550
366,129,983
$
$$
$
$
$
$
$
$
$
$
$
$$
$$
$
$

Teachers’ Retirement System of the State of Kentucky • Years Ended June 30, 2017 and 2016 81
INVESTMENT SECTION
FIXED INCOME INVESTMENTS
As of June 30, 2017, the retirement annuity trust fund had approximately $3.0 billion, 16.2% of total assets, in thefixed income category of investments. The retirement annuity trust fund's fixed income investments maintained theaverage investment grade rating required by administrative regulation as of June 30, 2017.
In addition, the retirement annuity trust fund had $1.4 Billion, 7.7% of total assets, in other debt related investmentsunder a regulatory provision which allows for up to 15% of assets in "additional categories of investments" approved bythe Board of Trustees. Investments under this authorization included two high yield bond portfolios and twosyndicated bank loan portfolios. Also under this provision are several alternative credit portfolios including a multi -strategy opportunistic credit portfolio as well as distressed debt and specialty lending funds.
The credit quality distribution for the retirement annuity trust fund is illustrated below. This chart includes the fixedincome category of investments as well as the high yield bonds, international fixed income, and the syndicated bankloan portfolios included in "additional categories of investments". Also illustrated below is the distribution of fixedincome assets by sector, again including the high yield bonds, international fixed income, and the syndicated bank loanportfolios held under "additional categories of investments".
Schedule of Investment Returns - Retirement Annuity Trust
2017 Annual Rate of Return Net of Investment Expense 15.00%2016 Annual Rate of Return Net of Investment Expense -1.32%2015 Annual Rate of Return Net of Investment Expense 4.96%2014 Annual Rate of Return Net of Investment Expense 17.95%
FIXED INCOME SECTOR DISTRIBUTION
FIXED INCOME QUALITY DISTRIBUTION

82 Teachers’ Retirement System of the State of Kentucky • Years Ended June 30, 2017 and 2016
INVESTMENT SECTION
FIXED INCOME MARKET OVERVIEW
The retirement annuity trust fund's investment grade fixed income portfolios returned .12% for the fiscal yearending June 30, 2017. This compares favorably to the trust fund's fixed income benchmark, the Bloomberg BarclaysU.S. Government / Credit Index, which returned -.41%. The outperformance was driven by the system's overweightingin corporate bonds which provided higher coupon interest than government bonds of similar duration.
The Federal Reserve (Fed) targets an overall annual inflation rate of 2%, a pace it views as appropriate for economicgrowth and price stability. Current inflation, as measured by the year-over-year Consumer Price Index (CPI) andProducer Price Index (PPI), were mixed with CPI lower and PPI higher during the last quarter of fiscal year 2017. TheCPI was up only +1.9% year-over-year. The PPI has increased 2.4% over the past year. The CPI numbers were drivenlower partly due to falling telecom prices and some declines in medical care. For overall CPI, oil prices bottomed inFebruary of 2016, so the jump in overall CPI due to energy faded in February of 2017 and has since declined. The Fed'spreferred measure is the price index for Personal Consumption Expenditures (PCE). This measure has moved lower andis now well below the Fed's target, with an overall year-over-year increase of 1.4%. The Federal Funds rate is now at1.00% to 1.25%. The yield curve flattened significantly in FY 2017, with shorter maturities rising in yield due to the ratehikes while long rates were held down by lower inflation expectations. In summary, inflation has recently declined, andit is important to monitor and see if the data moves higher and closer to target for future Federal Funds rate increases.
The United States has now gone eleven straight years without 3 percent growth in real Gross Domestic Product(GDP), a record. The recession ended in June 2009. In the eight calendar years since then, real annual GDP growth hasnever exceeded the 2.6% it hit in 2015. Retail sales and consumer spending data were moderate, but disappointinggiven the strong employment and consumer confidence data. Consumer confidence moved much higher over the yearand has reached the highest level since 2000. Housing has been a slight positive source of growth, but it has not beenparticularly strong since before the recession. Housing prices are up +5.7% over the past year as measured by the S&P/Case-Shiller Home Price Index, the highest year-over-year gain in 2 ½ years. Measures of manufacturing activity weremixed, with strength in aircraft manufacturing, but no significant signs of overall strength.
Global risk assets (non-US treasuries) rallied during fiscal year 2017, driven largely by continued positiveexpectations for US fiscal policy, as well as continued improvements in global economic growth and inflation. Gainsacross most risk assets occurred despite persistent political divisiveness in the US, heightened geopolitical risks (mostnotably in North Korea), and a range of other international issues. However, the market is becoming more accustomedto expectations of a low growth/ low inflation environment as realized volatility in the treasury market has graduallyfallen in 2017.
Investment grade corporates tightened by 10 basis points during the last quarter of fiscal year 2017 to +111 basispoints over U.S. Treasuries of same duration, and are trading tighter than long-term averages. Spreads for InvestmentGrade Corporates ended fiscal year 2016 +162. Utilities and industrials performed slightly better than financials whilelonger duration corporates had higher returns than shorter duration corporates. In mortgages, Commercial MortgageBacked Securities (CMBS) outperformed mortgage pass-throughs and ABS. Better global economic growth, rising equityprices and the continued search for yield all led investors to buy higher yielding fixed income for fiscal year 2017.
With U.S. Treasury rates and risk premiums on corporate bonds both still relatively near the low end of theirhistorical range, investment grade fixed income is an asset class with moderately unfavorable risk / rewardcharacteristics and below average upside potential. The retirement system continues to adjust the structure of its fixedincome portfolio to control risk and maintain required liquidity. Specifically, the retirement system continues toincrease exposure to nontraditional debt-related investments, reduce exposure to investment grade fixed income, andlimit our interest rate risk by being slightly short benchmark durations.
EQUITY INVESTMENTS
As of June 30, 2017, the retirement annuity trust fund's public equity investments had a market value of $11.7billion, representing 62.8% of total assets. The Pension Plan's U.S. equity portfolio returned 21.2% for the fiscal year andoutperformed its policy benchmark by 3%. Positive equity returns over the fiscal year explains the year over yearincrease in market value. The retirement annuity trust fund divides its public equity into two broad categories: domesticand international.
The domestic portfolio had a market value of $7.7 billion as of June 30, representing 41.3% of total assets. Thebenchmark for the domestic portfolio is the S&P 1500. The S&P 1500 is made up of three well known componentindices based upon market capitalization: the S&P 500 large cap, S&P 400 mid cap, and the S&P 600 small cap. The

Teachers’ Retirement System of the State of Kentucky • Years Ended June 30, 2017 and 2016 83
INVESTMENT SECTION
retirement annuity trust fund's domestic equity holdings are comprised of twelve portfolios. Three of the portfolios areinternal passively managed index portfolios benchmarked to the S&P 400, 500, and 600. The other nine portfolios aremanaged externally by five different asset managers, with each portfolio representing a specific strategy and measuredagainst an appropriate benchmark. The collective array of portfolios provides diversification by capitalization, manager,style, and strategy.
The market value of the international equity holdings as of June 30, 2017 was $4.0 billion, representing 21.5% oftotal assets. The Pension Plan's international equity portfolio returned 23.3% for the fiscal year and outperformed itspolicy benchmark (MSCI All Country World ex-U.S. Index) by 2.3% points. The benchmark for international equities isthe Morgan Stanley Capital International All Country World Index ex US (MSCI ACWI ex US), which represents themarkets of 22 developed countries and 23 emerging market countries. Six external asset managers manage theretirement annuity trust fund's international equities, one of which is a passively managed international index fund.
EQUITY INVESTMENTS OVERVIEW
US equity markets finished the first quarter of the fiscal year with positive returns across all market capitalizationsand styles. US economic data released during the quarter continued to indicate moderate economic expansion butmany remained cautious with continued evidence of slack in labor markets. Investors experienced low levels ofvolatility in what would be a recurring theme for fiscal year 2017. There was a notable reversal in sector performance asdefensive, income-oriented stocks posted negative returns while more economically sensitive sectors outperformed.More specifically, sectors like Financials, Industrials, and Materials outperformed while Utilities andTelecommunication Services declined the most. Consumer Staples and Real Estate stocks also declined while ConsumerDiscretionary, Energy, and Health Care stocks lagged slightly. Growth moderately outperformed value for the quarterand small-caps in general performed with micro-caps having the greatest outperformance.
US equity markets started the second fiscal quarter with a slight decline, fueled largely by uncertainty surroundingthe presidential election. While many initially feared a stock market correction, results swiftly shifted post-election andall major US equity indices finished the first half of the fiscal year in positive territory. Post-election, equity marketswere characterized by increased risk appetite driven by expectations that the Trump administration could enact fiscalchange. Financial stocks led the market higher, rising more than 20% during the quarter. Infrastructure based sectorslike Industrials, Energy, and Materials also outperformed the broader index. Health Care, Real Estate, and ConsumerStaples declined in value during the quarter while Utilities and Information Technology also underperformed. Small-cap indices substantially outperformed large-cap counterparts and value stocks outperformed growth stocks
Developed international markets saw strong, positive returns in the first quarter on both an absolute basis andrelative to the broad U.S. equity market. In the UK, the Bank of England ("BOE") announced preemptive measures tocounteract potential negative effects of the Brexit vote, while the rest of Europe took a more measured response toBrexit. Country returns were largely positive with only a few in the red. During the first quarter the style trendreversed, with value outperforming growth stocks and small-cap outperforming large-caps. Emerging marketscontinued their rally and outperformed all other equity regions. OPEC agreed to limit output, providing short-termsupport for emerging market countries heavily tied to the price of oil. In contrast to developed markets, small-capstocks in emerging markets could not keep pace with the rally in larger stocks and growth outperformed value for thequarter.
Developed international markets ended the second quarter slightly negative. In Europe, the European Central Bankannounced a moderation in the pace of asset purchases but also extended the duration of the purchase program. Bycountry, there were few bright spots, with only a few European countries posting positive returns in the fourth quarter.Cyclical sectors, such as Financials and Energy, provided positive contributions for the quarter. There was an inflectionpoint for value stocks during the quarter, producing strong, absolute returns. Growth stocks continued to lag andremained in negative territory for the year and small-cap stocks underperformed large-cap stocks. Emerging Marketsunderperformed developed markets by a significant margin. Poor performance in emerging markets during the quarterstemmed from fears that stimulus programs in the US could lead to higher bond yields and a stronger dollar, whichcould draw significant capital to the currency. Emerging market small-cap stocks underperformed large- cap stocks,and value stocks outperformed growth stocks for the quarter.
The second half of the fiscal year began with US equity markets in positive territory and the stock market, again,reached a new high as the Russell 3000 Index increased 5.7%. This was largely a result of expectations for improvedcorporate earnings driven by continued improvements in US fundamentals and continued muted volatility. For the timebeing, businesses and consumers were optimistic about the U.S. economy's prospects, but so-called soft data (sentiment)
84 Teachers’ Retirement System of the State of Kentucky • Years Ended June 30, 2017 and 2016
INVESTMENT SECTION
did not appear to translate into accelerated growth as reflected in hard (quantifiable) data. The post-election rallypaused in March when the House Republicans could not agree on a replacement for Obamacare. Performance wasdriven primarily by Technology and Health Care stocks while Consumer Discretionary, Utilities, and Materials alsooutperformed the broader index. Energy stocks declined the most during the quarter, driven by a decline in global oilprices. Telecommunication Services, Financials, Real Estate, and Industrials also lagged the index. Investors preferredgrowth stocks at the expense of value and despite a general slowdown across market caps and styles, markets favoredlarge cap, growth-oriented names, as well as momentum and quality factors.
Domestic equity markets continued to rally during the second half of the fiscal year, albeit at a slower rate, but stillreaching record highs across major indices. Low volatility and expectations of strong profit growth continued to be thekey drivers of the market. Consumer and business confidence remained high despite stalled healthcare legislation thatdelayed passage of a tax bill. Expectations for fiscal stimulus were again supportive given the positive tone from theFederal Open Market Committee ("FOMC") regarding near-term economic growth and inflation expectations. TheUnemployment rate fell to cycle low of 4.2% but this was against a backdrop of a very low labor participation rate. Insome ways, US equity performance for the second half of fiscal 2017 represented a reversal of the trend experiencedduring the second half of fiscal 2016 as low volatility sectors and securities viewed as "bond proxies" performed well. Incontrast, this period proved to be more favorable to high momentum, high growth areas of the market. Facebook,Amazon, Netflix and Google (FANG) stocks continued their outperformance which at year-end accounted for a largerpercent of the S&P than all energy stocks combined. The sector that led the market higher was Health Care whileInformation Technology, Industrials, and Financials increased more than the broader index. Equities provided positivereturns across all market caps and styles, but with significant dispersion across sectors and market factors. Large-capstocks continued to outpace small-cap stocks, with the exception of micro-caps.
International equity growth stocks outperformed value in both developed and emerging markets for the thirdquarter. Underpinning the positive international equity performance was the expectation, supported by improvingeconomic fundamentals, that the global economy was on more stable footing than previously believed. This wasespecially true in the UK, where recent economic data showed a steady expansion in the face of potentially leaving theEU Common Market. From a regional standpoint, emerging markets outperformed developed markets with India,Korea, and Mexico all posting mid-teen returns while commodity sensitive economies such as Canada and Norwaylagged notably. Similarly, sector leadership rotated from Energy to Technology, Healthcare, and ConsumerDiscretionary largely for the same reason as US equities.
During the fourth quarter, International equity markets continued to react positively to signs of strengtheningeconomic growth across both developed and emerging markets, driving equities higher. Supportive developmentsinclude reduced political uncertainty and positive indicators of GDP and earnings growth. This, coupled with morereasonable valuations in comparison to the US, supported the ACWI ex US Index's quarterly outperformance versus theRussell 3000 for the end of the fiscal year. Geopolitical risks (including North Korea, French elections, and US fiscalpolicy) temporarily drove higher volatility. From a country perspective, political developments drove a generally risk-onrepricing of assets. As would be expected during periods of growth leadership, Healthcare and Technology ledperformance from a sector standpoint, with Materials, Energy, and Telecom lagging. As in the US, internationalgrowth equity broadly outperformed value. Developed small-cap equities outperformed large-cap equities, whileemerging markets equities narrowly edged out developed markets equities.
In summary, the US equity markets hit record highs in each quarter as the US continued its recovery from the GreatRecession with the lowest real GDP growth of the post war period. The continued expansion in global fundamentalsprovided a steady backdrop for equity markets in general. Global monetary policy was still accommodative but less sothan in prior years. Inflation remained near the low end of the Fed's stated goals driven by low commodities and wages.Fiscal year 2017 was a period of heighted geopolitical risks but volatility remained extremely low. Global equityvaluations ended the year more attractive than domestic equities but that divergence was somewhat diminished afterglobal fundamentals and valuations improved.

Teachers’ Retirement System of the State of Kentucky • Years Ended June 30, 2017 and 2016 85
INVESTMENT SECTION
REAL ESTATE
The retirement annuity trust fund's real estate investments had a market value of $1.05 billion as of June 30, 2017,representing 5.6% of total assets. The retirement annuity trust fund'sinvestments in real estate are intended to provide attractive long-termreturns, generate reliable cash flow, and provide diversification, therebyreducing the volatility of the overall investment portfolio.
The retirement annuity trust fund's real estate exposure is currentlyprovided through thirteen portfolios. The fund maintains an internallymanaged portfolio of directly owned properties under long-term leaseagreements with high credit quality tenants. TRS Kentucky is alsoinvested in a commingled real estate fund (PRISA Fund), which ismanaged by Prudential Real Estate Investors. This fund is a core realestate equity fund which invests primarily in existing income-producingproperties with strong cash flows and the potential for capitalappreciation. The fund is diversified across several property typesincluding office, retail, industrial, apartment, self-storage and hotel.
Additionally, the retirement annuity trust fund is invested in CarlyleProperty Investors, a core-plus commingled fund and ten real estatelimited partnerships: Carlyle Realty Partners VI, Carlyle Realty Partners VII, Blackstone Real Estate Partners VII,Blackstone Real Estate Partners VIII, Rockwood Capital Real Estate Fund IX, Rockwood Capital Real Estate Fund X, TARealty Associates Fund X, TA Realty Associates Fund XI, AG Net Lease Realty Fund III, and Landmark Real EstatePartners VII. Going forward, investment staff will continue to opportunistically add to the annuity trust fund's realestate investments.
REAL ESTATE OVERVIEW
As the economic recovery continues, market consensus is that we are deeper into the real estate cycle. That said, ina slow-growth environment with continuing low interest rates, the market has presented attractive investment invarious real estate sectors and markets through the fiscal year ended June 30, 2017.
Evaluating general business conditions, as we are 7-8 years into a recovery, we constantly evaluate the generalpossibility of a recession at this stage. If one occurs, however, it is likely that a recession would not be real estate-led, aswas the case in the Global Financial Crisis, for two main reasons. First, real estate lending activity and the amount ofoutstanding commercial debt remain relatively restrained when compared to prior cycles; there is no large sign of over-heating in the debt markets. Further, construction activity remains generally muted when compared to prior recoveries.
As a result, from the perspective of operating fundamentals, the markets present a reliable underpinning. In thiscycle, multifamily (apartment) fundamentals have shown among the most robust reliable demand characteristics of anysector. That said, the multifamily sector has seen the most corresponding new construction. Even so, net absorptionhas kept up with new construction activity in most markets. Nationally, it appears that the growth of new deliveries isdecelerating. With continued growth among expected renters, it appears that vacancy rates will drop again towardtheir prior lows of 2H 2016.
In other sectors, operating fundamentals remained generally steady. The commercial retail sector, however, sawvacancies increase as e-commerce and fundamental changes took hold. We expect commercial retail to continue to be aheadwind for real estate. As businesses become increasingly reliant on online sales growth, their brick and mortar storesbecome costly and less efficient. All leading to an oversupply of retail space and lower valuations.
In the capital markets, lending remained relatively disciplined, especially compared to prior recoveries. Inparticular, construction lending activity remained very much in check. Returns among core managers continued todecrease over the fiscal year. The core index showed quarterly returns of over 2.0% in the first half of the fiscal year; inthe second half, we show that rent growth had decelerated, dropping to a level of approximately 1.70% in the 4thquarter of the fiscal year.
In summary, due to current operating fundamentals and low lending rate, core real estate investments continued todrive equity real estate returns. However, opportunistic and non-core real estate investments began leading the sector inthe 4th quarter and have been a solid contributor throughout the year. As we find opportunities, we will continue toinvest in the real estate sector to enhance returns and serve as a diversifier to our other holdings.
Real Estate Investments$1.05 Billion Fair Value
As of June 30, 2017
ExternallyManaged
62%
InternallyManaged
38%

86 Teachers’ Retirement System of the State of Kentucky • Years Ended June 30, 2017 and 2016
INVESTMENT SECTION
ALTERNATIVE ASSETS
As of June 30, 2017, the retirement annuity trust fund had committed $2.045 billion to alternative investments andhad funded $1.186 billion of those commitments. The percentage of the retirement annuity trust fund's portfolioinvested in alternative assets was 5.7%. The retirement annuity trust fund's current alternative asset portfolio consistsof private equity investments and timberland.
Alternative Assets Committed$2.045 Billion
as of June 30, 2017
Alternative Assets Funded$1.186 Billion
as of June 30, 2017

Teachers’ Retirement System of the State of Kentucky • Years Ended June 30, 2017 and 2016 87
INVESTMENT SECTION
PRIVATE EQUITY
The retirement annuity trust fund has exposure to venture, buyout, infrastructure, energy, mezzanine and severalother private equity sectors via participation in limited partnerships as well as investments in funds of funds. Theretirement annuity trust fund has a relatively young private equity investment program, which it intends to continue togrow with a disciplined plan of commitments each year. The retirement annuity trust fund looks to diversify its privateequity portfolio by manager, country, strategy, and vintage year. Vintage year diversification is achieved by buildingout the portfolio with disciplined levels of commitments over time. A commitment to any given partnership shall notexceed 20% of the partnership's total commitments.
The Board and staff understand that private equity investments (along with many other forms of alternativeassets) are illiquid and have a long-term holding period. When added to a portfolio with other publicly traded assets,this asset class can help to diversify and reduce risk for the retirement annuity trust fund's overall portfolio whileenhancing returns. Private equity returns for the first several years of a partnership's life are routinely negative due tothe J-curve effect. Positive returns are typically realized only several years into a partnership's existence, during theharvesting period.
PRIVATE EQUITY MARKET OVERVIEW
Private equity markets are positively affected by strong public equity markets. When public markets are strongmore private equity portfolio companies are sold. The past fiscal year has seen an active IPO market as the publicmarkets grind higher. However, as result of the strong public equity markets the entry price for private equity portfoliocompanies has risen forcing many managers to pay higher multiples for underlying portfolio companies or to put theirdry powder to work at a much slower pace that in the past.
The past fiscal year was a period of elevated interest in the private equity market as investors continue to increasetheir commitment amounts but pare down their fund relationships to only the most high-quality managers. The pastfiscal year has also seen large buyout funds returning to the marketplace. We have begun to see more opportunity inthe large cap buyout space while continuing to see opportunity in the middle market space and in other niche areassuch as infrastructure and distressed credit. Additionally, the European markets continue to present investmentopportunities in the private equity space.
TIMBERLAND
In addition to private equity, the retirement annuity trust fund has invested in timberland in the alternative assetclass. As of June 30, 2017 the retirement annuity trust fund owns approximately 73,000 acres of timberland outright,has a 7.15% interest in a commingled fund that holds approximately 98,000 acres of timberland and is a member of ajoint venture that purchased an interest in approximately 124,000 acres of timberland located across seven southernstates. Timberland is, by nature, a long term investment as our anticipated time horizon in this asset category isgenerally a minimum of ten to fifteen years. Timberland provides valuable diversification, current income, and a hedgeagainst inflation. Due to the low correlation of returns with other asset classes, timberland investments should lowerthe overall volatility of the retirement annuity trust fund's portfolio. Timberland should earn real returns comparable totraditional equity investments with volatility between equities and fixed income over the long-term.
The retirement annuity trust fund diversifies its timberland investments by geography, species of trees, and maturityof timber stands. Investment returns from timberland are primarily driven from net cash flow generated from the saleof trees (referred to as stumpage sales) and capital appreciation from the biological growth of the trees. Both of thesereturn factors depend to some degree upon the direction of forest commodity prices (paper goods and lumberproducts). There can also be gains from the timely sale of timberland from the conversion of timberland into higher andbetter uses, such as vacation property sales.

88 Teachers’ Retirement System of the State of Kentucky • Years Ended June 30, 2017 and 2016
INVESTMENT SECTION
TIMBERLAND MARKET OVERVIEW
U.S. timber markets have been weak across most timber-growing regions throughout the fiscal year, with the onlyexception being the Pacific Northwest. An oversupply of timber has allowed wood-using mills to maintain sizeableinventories, pushing timber prices lower through the first part of the fiscal year. While widespread, this oversupplyissue has been more problematic in the U.S. South than other U.S. timber growing regions.
After hitting an 8-month low in May of 2017, U.S. housing starts for June 2017, jumped approximately 8 percentfrom the previous month. It was the strongest construction activity in four months and approximately 7 percent higherthan June of 2016. The price of lumber soared through the first half of 2017, reflecting a 17 percent year-over-yearincrease. This positive jump was due primarily to a reduced level of Canadian lumber exports to the U.S., driven lowerby the British Columbia wildfires and tariff uncertainty relating the Softwood Lumber Agreement.
Significant demand growth is expected for timber products. Many forest product manufacturers have announcedor completed capital investments relating to new mills, expansions, and improvements. An increasing demand, bothdomestic and foreign, for softwood logs and lumber is anticipated to drain the oversupply of logs within the nextseveral years. Historically, lumber prices and timber stumpage prices have been closely correlated, as such, the laggingtimber markets are expected to regain lost ground on the increasing lumber prices as the oversupply of timberdiminishes.

Teachers’ Retirement System of the State of Kentucky • Years Ended June 30, 2017 and 2016 89
INVESTMENT SECTION
INTERNALLY MANAGED
EXTERNALLY MANAGED
Cash EquivalentsCash Collections Fund (Unallocated)
Fixed IncomeIntermediate Bond FundLong Term Bond FundBroad Market Bond FundInternal Bond FundLife Insurance TrustTax Shelter Fund
EquityS & P 500 Stock Index Fund (Large Cap)S & P 400 Stock Index Fund (Mid Cap)S & P 600 Stock Index Fund (Small Cap)
Real EstateInternally Managed Fund
Subtotal
Fixed IncomeGalliard Capital ManagementFt. Washington Broad Market
Domestic EquityTodd Asset Management (Large Cap Core)UBS (Large Cap Value)Wellington (Large Cap Core)GE Asset Management (Large Cap Growth)Todd Asset Management Opportunity FundWellington (Mid Cap Core)UBS (130/30)Ft. Washington Focused Equity (All Cap Core)Wellington (Small Cap Core)
International EquityBaillie Gifford EAFE AlphaUBS All Country World ex USTodd Asset Management InternationalBlackrock All Country World ex US IMIBaring All Country World ex USTodd Asset Management International
Intrinsic Value
Real EstatePrudential PRISA FundCarlyle Property AdvisorsRockwood Capital Real Estate Fund IXBlackstone Partners VII, LPThe Realty Associates Fund XAG Net Lease Realty Fund III, LPCarlyle Realty Partners VII, LPLandmark Real Estate Partners, VIIBlackstone Partners VIII, LPThe Realty Associates Fund XICarlyle Realty Partners VI, LPRockwood Capital Real Estate Fund X
Alternative InvestmentsIFM Global Infrastructure LPMolpus Woodlands Group Lake
Superior Timberlands LLC
$ 366,129,983
704,741,921 549,720,953 548,178,766 173,967,739 86,443,328
343,792
2,295,781,492 347,038,280 251,837,025
392,640,022
$ 5,716,823,301
504,330,367 452,730,406
1,111,030,934 953,513,471 672,382,208 628,650,762 433,437,988 332,239,292 241,434,211 232,768,027 182,476,591
977,419,949 799,681,143 778,615,779 734,761,148 621,464,493 92,011,001
312,737,352 45,353,554 43,752,117 43,041,226 41,781,817 36,464,149 33,693,430 24,842,936 22,708,607 19,914,072 18,309,058 11,521,794
116,075,860 111,822,137
Molpus Seven States LLCHellman & Friedman Fund VIIPublic Pension Capital LLCAlinda Infrastructure Fund IIAPAX VIII, LPKKR & Co European Fund IIIActis Global Fund IVHancock Bluegrass LLC - OregonNGP Natural Resources XI, LPJ. P. Morgan Maritime FundRiverstone/Carlyle E & P Fund IVKKR & Co European Fund IVFt. Washington Fund VICarlyle Global Financial Services Partners IINGP Natural Resources X, LPOaktree European Principal Fund IIIRiverstone E & P Fund VICarlyle Europe Partners IV, LPAudax Private Equity Fund IV, LPFt. Washington Fund VIIIStepstone Pioneer Capital Fund III, LPJ. P. Morgan Maritime Fund IIGavea Investments Fund V, LPRiverstone E & P Fund VOaktree Mezzanine Fund IVChrysalis Venture Fund IIIAudax Mezzanine Fund IIILexington Capital Partners Fund VIIKKR & Co Fund 2006Landmark Equity Partners Fund XIV, LPLandmark Equity Partners Fund XV, LPFt. Washington Fund VLexington Capital Partners Fund VIIIAudax Private Equity Fund V, LPOaktree Mezzanine Fund IIIFt. Washington Fund IX-KFt. Washington Fund IXAudax Mezzanine Fund IVHellman & Friedman Fund VIIICapitalSouth Partners Fund IIIAPAX IX, LP
Additional CategoriesFt. Washington High Yield Bond FundMarathon TRS/Credit Fund LPShenkman Capital ManagementColumbia High Yield FundGolub Capital Pearls 11, LLCBaarings European Loan Fund (Babson)Marathon European Credit Opp Fund IIOaktree Opportunities IX, LPMarathon European Credit Opp Fund IIIHighbridge Principal Strategies IIIAvenue Special Situations Fund VIOaktree Opportunities X, LPOaktree European Dislocation Fund, LPOaktree European Capital Solutions FundAG Select Partners Advantage Fund
Subtotal
TOTAL ASSETS
63,114,11858,145,419 45,763,588 40,559,460 36,885,163 33,809,458 33,783,888 33,283,688 29,531,128 28,958,495 26,902,427 26,265,452 25,815,503 24,829,478 23,185,643 22,839,529 20,608,230 19,731,527 19,652,144 19,511,120 19,258,745 16,863,863 16,285,430 15,854,256 14,951,354 14,691,809 12,369,189 11,690,390 11,127,779 10,850,416 10,792,308 9,208,619 8,587,280 8,229,847 6,367,478 3,839,985 3,418,374 2,840,438 2,834,423
891,604 828,520
330,130,219 323,865,814 175,979,332 163,719,768 123,061,241 103,170,000 60,730,585 44,345,399 34,061,480 29,828,126 20,914,355 9,847,616 7,532,944 6,937,708 1,018,963
$ 12,901,066,994
$ 18,617,890,295
Retirement Annuity TrustPortfolios Fair Values *
June 30, 2017
Externally Managed continued ...
* Detailed information concerning the market values of all TRS investments is available upon request.** Includes Life Insurance Trust values of $86,443,328, Tax Shelter Annuity value of $343,792,
and 401(h) value of $19,471,617. This does not include the J. Losey Scholarship Fund.
**

90 Teachers’ Retirement System of the State of Kentucky • Years Ended June 30, 2017 and 2016
INVESTMENT SECTION
Retirement Annuity TrustContracted Investment Management Expenses
Fiscal Year 2016-17(In thousands of dollars)
Assets Under Management
8,791,888 957,060 654,120
1,435,144 1,062,856
12,901,068
18,618,484
18,618,484
Expense
17,612 384
8,813 9,454
17,429
53,692
482 499
57 3,117
4,155
57,847
Investment Counselor Fees
Equity Manager(s)Fixed Income Manager(s)Real EstateAdditional CategoriesAlternative Investments (2)
TOTAL
Administrative and Operation Expenses
Custodian FeesConsultant FeesLegal & ResearchOther Administrative and Operational
TOTAL
GRAND TOTAL
$
$
$
$
Basis Points (1)
20.04.0
134.765.9
164.0
41.6
0.30.30.01.7
2.2
31.1
(1) – One basis point is one hundredth of one percent or the equivalent of .0001.(2) – Private equity fees are either withheld from the Fund operations or paid by direct disbursement, depending on contract terms.
SalesRedemptions,
Maturities & Paydowns
$ 3,713,633,496
2,747,017,104
90,287,058
222,271,697
4,114,174,429
505,616,730
$ 11,393,000,514
Investment SummaryFair Value – Retirement Annuity Trust
June 30, 2017
Fair Value 06/30/16
$ 523,293,619
2,823,674,612
940,860,202
932,813,350
10,267,066,002
1,309,513,418
$ 16,797,221,203
Acquisitions
$ 3,735,654,179
2,967,443,502
158,240,822
265,295,943
3,382,373,692
539,702,681
$ 11,048,710,819
Appreciation (Depreciation)
(90,404,509
37,946,168
87,017,966
2,054,391,373
76,007,789
$ 2,164,958,787
Fair Value 06/30/17*
$ 545,314,302
2,953,696,501
1,046,760,134
1,062,855,562
11,589,656,638
1,419,607,158
$ 18,617,890,295
Type ofInvestment
Cash Equivalents
Fixed Income
Real Estate
Alternative
Equities
Additional Categories
TOTAL
$
$
$
$
$
* Includes Life Insurance Trust values of $86,443,328, Tax Shelter Annuity value of $343,792, and 401(h) value of $19,471,617.This does not include the J. Losey Scholarship Fund.
$
)

Teachers’ Retirement System of the State of Kentucky • Years Ended June 30, 2017 and 2016 91
INVESTMENT SECTION
ALTERNATIVE INVESTMENTS continued ...Carlyle Global Financial Services Fund II, L.P.Chrysalis Fund III, L.P.Fort Washington Fund V, L.P.Fort Washington Fund VI, L.P.Fort Washington Fund VIII, L.P.Fort Washington Fund IX, L.P.Fort Washington Fund IX-K, L.P.Gavea VHancock Bluegrass LLC OregonHellman and Friedman Fund VII, L.P.Hellman and Friedman Fund VIII, L.P.IFM GlobalJP Morgan Maritime Fund , L.P.JP Morgan Maritime Fund II, L.P.KKR Fund 2006, L.P.KKR European Fund III, L.P.KKR European Fund IV, L.P.KKR Americas Fund XII, L.P.Landmark Equity Partners Fund XIV, L.P.Landmark Equity Partners Fund XV, L.P.Lexington Capital Partners Fund VII, L.P.Lexington Capital Partners Fund VIII, L.P.Molpus Lake Superior MichiganMolpus Lake Superior HiwasseeMolpus Seven StatesNGP Natural Resources Fund X, L.P.NGP Natural Resources Fund XI, L.P.Oaktree European Principal Fund III, L.P.Oaktree Mezzanine Fund III, L.P.Oaktree Mezzanine Fund IV, L.P.Stepstone Partners Fund III, L.P.Public Pension CapitalRiverstone/Carlyle Energy and Power Fund IV, L.P.Riverstone/Carlyle Energy and Power Fund V, L.P.Riverstone Energy and Power Fund VI, L.P.
Total Alternative Managers
ADMINISTRATIVE & OPERATIONAL EXPENSES
CUSTODIANThe Bank of New York Mellon
Total Custodian FeesCONSULTANT
Aon HewittBevis LongstrethGeorge Philip
Total Consultant FeesLEGAL & RESEARCH
Reinhart Boerner Van DeurenIce Miller
Total Legal & ResearchOTHEROther Administrative and Operational(includes Personnel, Subscription services, etc.)
Total Other
TOTAL INVESTMENT EXPENSES
EQUITY MANAGERSBaillie GiffordBaring Asset Management, Inc.Fort Washington Focused EquityGE Asset ManagementTodd Asset Management LLCUBS Global Asset ManagementWellington Management CompanyBlackrock
Total Equity Managers
FIXED INCOME MANAGERSFort Washington Investment Broad MarketGalliard Capital Management
Total Fixed Income Managers
REAL ESTATEPrudential PRISAAngelo Gordon Net Lease Fund IIIBlackstone Partners Fund VII, L.P.Blackstone Partners Fund VIII, L.P.Carlyle Realty Partners Fund VI, L.P.Carlyle Realty Partners Fund VII, L.P.Carlyle Property InvestorsLandmark Real Estate Fund VIILandmark Real Estate Fund VIIIRockwood Capital Real Estate Fund IX, L.P.Rockwood Capital Real Estate Fund X, L.P.TA Realty Associates Fund X, L.P.TA Realty Associates Fund XI, L.P.
Total Real Estate Managers
ADDITIONAL CATEGORIESAngelo Gordon Select Partners Advantage FundAvenue Capital Special Situations Fund VI, L.P.Barings European Loan FundColumbia High Yield FundFort Washington Investments High YieldGolub Capital - Pearls 11, LLCHighbridge Principle Strategies Fund III, L.P.Marathon Credit FundMarathon European Credit Fund IIMarathon European Credit Fund IIIOaktree European Capital Solutions Fund, L.P.Oaktree European Dislocation Fund, L.P.Oaktree Opportunities Fund IX, L.P.Oaktree Opportunities Fund X, L.P.Shenkman Capital
Total Additional Category Managers
ALTERNATIVE INVESTMENTSActis Global Fund IV, L.P.Alinda Infrastructure Fund II, L.P.APAX Fund VIII, L.P.APAX Fund IX, L.P.Audax Mezzanine Fund III, L.P.Audax Mezzanine Fund IV, L.P.Audax Private Equity Fund IV, L.P.Audax Private Equity Fund V, L.P.Capital South Fund III, L.P.Carlyle Europe Partners IV, L.P.
3,114,384 2,473,839
425,662 786,682
1,325,541 5,980,296 3,168,837
336,647$ 17,611,888
160,777 222,920
$ 383,697
2,380,988 598,738 496,154 750,000 273,328 698,083
84,124 500,000 273,098 856,250 298,052 992,424 611,358
$ 8,812,597
12,613 178,981 402,478 597,234 650,178
1,052,994 716,902
2,552,521 740,629 433,519 (4,460)
228,174 786,258 399,831 706,514
$ 9,454,366
994,000 607,098 435,385 794,486 125,504 443,335
100,037 93,487
634,085
609,560 238,628
72,312 180,064 126,000
38,608 38,588
600,000 242,332 241,322 566,765
1,066,848 540,562 230,959 (22,227 30,418
304,564 326,388 300,000 300,000 154,246 319,487 864,015
70,606 591,339 478,796 660,075 308,573
94,328 182,021 175,816
1,432,854
171,319
164,3061,502,018
$ 17,428,907
481,653$ 481,653
413,850 51,660 33,965
$ 499,475
5,936 51,266
$ 57,202
3,116,857$ 3,116,857
$ 57,846,642
INVESTMENT COUNSELOR FEES
Schedule of Contracted and Administrative Investment ExpensesRetirement Annuity Trust
June 30, 2017
)

92 Teachers’ Retirement System of the State of Kentucky • Years Ended June 30, 2017 and 2016
INVESTMENT SECTION
Top Ten Fixed Income Holdings (2)
by Fair ValueJune 30, 2017
Description
U S Treasury-CPI Inflation
U S Treasury Note
U S Treasury Note
U S Treasury Note
U S Treasury Bond
U S Treasury Note
U S Treasury Note
U S Treasury Bond
U S Treasury Bond
U S Treasury Note
Rank
1
2
3
4
5
6
7
8
9
10
Maturity
1/15/2027
6/30/2019
5/15/2026
5/15/2020
8/15/2023
5/15/2024
2/15/2025
2/15/2047
8/15/2029
11/30/2019
Coupon
0.375
1.625
1.625
1.500
6.250
2.500
2.000
3.000
6.125
1.500
Par Value
81,311,215
45,000,000
45,000,000
40,000,000
31,900,000
31,000,000
32,000,000
29,750,000
22,000,000
30,000,000
Fair Value
79,858,915
45,200,385
42,662,115
39,954,680
39,699,295
31,761,670
31,561,248
30,688,970
30,651,324
30,028,140
Ten Largest Stock Holdings Ranked (1) (2)
by Fair ValueJune 30, 2017
Rank
1
2
3
4
5
6
7
8
9
10
Description
Apple Inc
Amazon.com Inc
Facebook Inc
JP Morgan Chase & Co
Microsoft Corp
UnitedHealth Group Inc
Allergan PLC
Alphabet Inc/CL C
Alphabet Inc/CL A
Bank of America Corp
Fair Value
181,213,021
121,056,144
113,267,612
111,105,383
92,586,914
86,350,836
84,855,426
77,283,852
71,857,756
69,889,130
(1) Includes only actively managed separate accounts.(2) Detailed information concerning these values along with book values and cost of all TRS investments
is available upon request.
Percentage of Equities
1.55
1.04
0.97
0.95
0.79
0.74
0.73
0.66
0.61
0.60
Percent of
Fixed Income
2.64
1.50
1.41
1.32
1.31
1.05
1.05
1.02
1.01
0.99

Teachers’ Retirement System of the State of Kentucky • Years Ended June 30, 2017 and 2016 93
INVESTMENT SECTION
Transaction Commissions Fiscal Year 2016-17
COMPANIES COMMISSIONSCOMMISSION
PER SHARESHARES
TRADED
Abel NoserAllen & CoApex ClearingAvondale Partners, LLCBarclaysBlair, William & CoBMO Capital MarketsBNY ConvergEX GroupBTIGBurke & Quick Partners LLCCanaccord Genuity, Inc.Cantor Fitzgerald & CoCIBC WorldmarketCitigroup GlobalConvergEx - AlgosConvergEx - FSConvergEx - TransitionsConvergEx ADR ConversionsCornerstoneCowen & CoCredit Suisse Sec. LLCCuttone & Co IncD A Davidson & CoDeutsche BankEvercore Group LLCFidelity Capital MarketsFirst Kentucky Securities CorpFreidman BillingsGoldman SachsGuggenheim Capital MarketsHSBCInstinetInvestment Tech Grp TransitionInvestment Technology GrpISI AlgosISI GroupJ.J.B. Hilliard, W.L. LyonsJanney Montgomery Scott IncJefferies & Co.JMP SecuritiesJones & AssociatesJP Morgan & ChaseKeefe Bruyette & WoodsKeybanc CapitalKnight Equity MarketsLeerink Swann & Co.Liquidnet IncLiquidnet Inc - TransitionLoop Capital Markets, LLCLuminex TradingMacQuarie Securities IncMerrill LynchMerrill Lynch ADR ConversionsMerrill Lynch, Pierce, FennerMiller Tabak & Co. LLCMizuho Securities, USAMKM Partners
4,872,893.00 1,500.00 2,192.00
10,027.00 363,505.00
50,454.00 104,249.00
27,719.00 158,424.00
11,540.00 32,070.00 57,247.00 39,782.00
201,757.00 17,901,753.00
4,409,964.00 11,625,956.00 11,574,906.00
338,950.00 267,756.00
1,512,829.00 22,785.00
9,527.00 251,622.00
11,187.00 6,231.00
132,737.00 112,106.00 790,169.00
17,657.00 600.00
325,721.00 29,266,195.00 25,624,350.00
3,123,665.00 1,014,727.00
606,548.00 26,107.00
380,284.00 4,288.00
163,501.00 612,570.00
30,964.00 52,625.00
8,206.00 64,845.00
8,577,848.00 5,136,768.00
1,500.00 20,826.00 22,795.00
3,133,004.00 68,600.00 26,369.00
4,687.00 31,764.00 59,544.00
46,279.83
76.72 350.95
9,841.81 1,652.51 3,901.83 1,065.49 6,143.68
403.93 1,122.48 1,470.81 1,507.51 4,148.50
89,508.85 44,099.64 58,129.80
160,890.62 11,754.50 10,489.39 35,134.99
455.70 333.45
5,287.53 344.04 218.09
1,644.00 4,433.29
25,579.05 607.24
25.20 3,431.57
220,835.43 237,643.02
31,236.65 25,076.47 18,196.44
938.44 11,700.06
80.08 6,789.56 9,231.50 1,153.76 1,869.14
287.22 1,886.84
85,630.08 36,979.34
67.50 52.07
822.96 83,737.00
2,058.00 793.42 164.05
1,207.33 2,110.24
0.009
0.035 0.035 0.027 0.033 0.037 0.038 0.039 0.035 0.035 0.026 0.038 0.021 0.005 0.010 0.005 0.014 0.035 0.039 0.023 0.020 0.035 0.021 0.031 0.035 0.012 0.040 0.032 0.034 0.042 0.011 0.008 0.009 0.010 0.025 0.030 0.036 0.031 0.019 0.042 0.015 0.037 0.036 0.035 0.029 0.010 0.007 0.045 0.003 0.036 0.027 0.030 0.030 0.035 0.038 0.035
% OFTOTAL
2.780.000.000.020.590.100.230.060.370.020.070.090.090.255.382.653.509.680.710.632.110.030.020.320.020.010.100.271.540.040.000.21
13.2814.29
1.881.511.090.060.700.000.410.560.070.110.020.115.152.220.000.000.055.040.120.050.010.070.13
%

94 Teachers’ Retirement System of the State of Kentucky • Years Ended June 30, 2017 and 2016
INVESTMENT SECTION
15,783.25 4,200.00
15,464.88 285.84
4,816.71 298.59
2,486.03 472.86
5,231.29 88,050.83
9,098.96 71.64
955.49 4,936.61 1,311.81
247.58 527.29 165.85
1,419.34 19,426.11
2,247.24 1,157.52
222.02 84,100.17 11,855.13 26,993.46
1,531.46 702.44
43,266.66 4,558.98
$ 1,662,765.64
0.017 0.030 0.030 0.030 0.025 0.035 0.035 0.010 0.033 0.030 0.024 0.045 0.035 0.014 0.035 0.037 0.035 0.036 0.039 0.032 0.036 0.035 0.035 0.005 0.030 0.030 0.008 0.035 0.031 0.034
0.010
916,712.00 140,000.00 515,496.00
9,498.00 191,287.00
8,531.00 70,669.00 47,286.00
159,196.00 2,899,933.00
372,916.00 1,592.00
27,300.00 340,922.00
37,480.00 6,746.00
15,065.00 4,567.00
36,499.00 604,536.00
62,949.00 32,665.00
6,343.00 16,819,981.00
393,973.00 899,782.00 194,069.00
19,974.00 1,405,926.00
135,329.00 400.00
159,686,017.00
Transaction Commissions continued . . .
COMPANIES COMMISSIONSCOMMISSION
PER SHARESHARES
TRADED% OF
TOTAL
0.950.250.930.020.290.020.150.030.315.300.550.000.060.300.080.010.030.010.091.170.140.070.015.060.711.620.090.042.600.270.00
100.00
Morgan StanleyMorgan Stanley Smith Barney-LouisvilleMorgan Stanley Smith Barney-NKYNeedhamPershing LLCPickering Energy Partners Inc.Piper JaffrayPulse TradingR W BairdRaymond James & AssocRBC Capital MarketsRosenblatt Securities LLCSandler O'NeillSanford C BernsteinScotia Capital, USASeaportSidoti & Company LLCState Street GlobalStephens Inc.Stifel, Nicolaus & CoSuntrust RobinsonSusquehanna BrokerageTelsey Advisory Group LLCTradebookUBS/Paine Webber SecuritiesUBS/Paine Webber-LouisvilleWall Street AccessWedbush Morgan SecuritiesWeeden & CoWells Fargo Securities, LLCWunderlich Securities Inc
TOTALS
The acquisition of initial public offerings (IPOs)represented a portion of small capitalization stock purchases. IPOs usuallyhave a high commission rate; however, the security issuers and not the investors pay the commissions. In 2016-17, theretirement annuity trust fund bought small capitalization IPOs that generated $157,730 in commissions. Although thesecommissions were not paid by the retirement system, they resulted from the retirement annuity trust fund's investment activitiesand are included in the total commissions of $1,662,766. Typical stock transactions occur at lower commission rates than IPOtransactions, frequently $.03 per share or less. Investment companies usually provide investment research for brokerage clients.
%

Teachers’ Retirement System of the State of Kentucky • Years Ended June 30, 2017 and 2016 95
INVESTMENT SECTION
PROXY VOTING AND CORPORATE BEHAVIOR
The System regularly votes proxy statements associated with its equity ownership. The positions assumed by theSystem are intended to represent the financial interests of the membership. The Board of Trustees has adopted a policythat directs the staff not to subjugate the financial concerns of the System to social or political protests. At the sametime, the System expects the companies in which it acquires stock to be solid corporate citizens that abide by federal,state, and local laws. The Board has adopted the following position on corporate behavior:
The Board's stated fiduciary duty is to obtain the highest return for the Fund commensurate with acceptable levels ofrisk. This implies that non-financial considerations cannot take precedence to pure risk/return considerations in theevaluation of investment decisions. However, action taken by the Fund as a shareowner can be instrumental inencouraging action as a responsible corporate citizen by the companies in which the Fund has invested.
The Board expects the managements of the companies whose equity securities are held in the Fund's portfolio toconduct themselves with propriety and with a view toward social considerations. A level of performance aboveminimum adherence to the law is generally expected. If any improper practices come into being, the Board expectscorporate management to move decisively to eliminate them and effect adequate controls to prevent recurrence.
On the other hand, the Board does not intend to supplant the duties which are the responsibility of federal or stateregulatory agencies, such as the Equal Employment Opportunity Commission, the Environmental Protection Agency,the Occupational Safety and Health Agency, the Nuclear Regulatory Commission, the Securities and ExchangeCommission, and others which are covered by the laws of the United States Government or the State of Kentucky.
Should satisfaction of the Board's criteria by any company not be adequate, the Board will consider what action totake, which may include, but not be limited to, correspondence with the company, meetings with company officials,sponsoring of shareholder resolutions or, as a last resort, liquidation of the System's holdings in the company, if the saleis consistent with sound investment policy.
SECURITY LENDING
The System operates a security lending program in which it temporarily lends securities to qualified agentsin exchange for a net fee and high quality collateral. U.S. Government and agency securities and select stocks andbonds are the types of securities loaned. The System's custodian, The Bank of New York Mellon, acts as lendingagent in exchanging securities for collateral. The collateral, at the time of the loan, has a value of not less than102% of the market value of the lent securities plus any accrued, unpaid distributions. The collateral consists ofcash, marketable U.S. Government securities, and selected marketable U.S. Government agency securitiesapproved by the System.
Cash collateral is invested in short term obligations fully guaranteed by the United States Government orselect Government agencies and Government Repurchase Agreements with qualified agents. The Systemcannot pledge or sell collateral securities unless the borrower defaults. The lending agent also indemnifies theSystem from any financial loss associated with a borrower's default and collateral inadequacy. The weightedaverage maturity of cash collateral investments is typically two days. The System has no credit risk exposureto borrowers, since the amounts the System owes borrowers exceeds the amounts the borrowers owe the System.
Security lending programs can entail considerable interest rate risk and credit risk. The System has structured itsprogram to minimize these two main categories of risk. The interest rate risk is managed, as mentioned above,by limiting the term of cash collateral investments to several days. The credit risk is controlled by investingcash collateral in securities with qualities similar to the creditworthiness of lent securities.
KENTUCKY INVESTMENTS
The System is always cognizant of its significant role in the Commonwealth's economy. Over $2 billion in benefitsare distributed to members and annuitants living in Kentucky annually. Approximately $300 million of the retirementannuity trust fund's investments directly impact the Commonwealth. These investments include: commercial realestate; bonds issued by public agencies of the Commonwealth and those of local municipalities; pools of single-familymortgages in Kentucky; financing for multi-family housing, and; investments in companies which have an impact onthe Commonwealth's economy but receive earnings from global operations. Fiduciary duty requires that investments bemade solely for the benefit of the System's members and annuitants. Investments which benefit the Commonwealth'seconomy are made only when fully consistent with this fiduciary duty.

96 Teachers’ Retirement System of the State of Kentucky • Years Ended June 30, 2017 and 2016
INVESTMENT SECTION
Professional Service Providers
Investment ConsultantAon Hewitt
Investment CustodianThe Bank of New York Mellon
Fixed Income ManagersGalliard Capital ManagementFt. Washington Investment Advisors
Domestic Equity ManagersTodd Asset Management LLCUBS Global Asset ManagementWellington Management CompanyGE Asset ManagementFt. Washington Investment Advisors
International Equity ManagersTodd Asset Management LLCUBS Global Asset ManagementBaring Asset Management, Inc.Baillie GiffordBlackRock Institutional Trust Company
Real Estate ManagersPrudential Real Estate InvestorsCarlyle Realty PartnersBlackstone Real Estate PartnersRockwood Capital Real EstateTA Associates RealtyAngelo Gordon & Co.Landmark Real Estate Partners
Alternative Investment ManagersMolpus Woodlands GroupHancock Natural Resources GroupKohlberg Kravis Roberts & Co.Chrysalis VenturesFt. Washington Private Equity InvestorsAlinda Capital Partners, LLCRiverstone Holdings, LLCCapitalSouth PartnersLandmark PartnersLexington PartnersOaktree Capital ManagementStepstone Pioneer CapitalAudax GroupJ.P. Morgan Asset ManagementHellman & Friedman Capital PartnersNatural Gas PartnersApax PartnersActis LLPCarlyle Global PartnersPublic Pension CapitalIFM InvestorsGavea Investimentos
Additional Categories Investment ManagersAvenue Capital GroupMarathon Asset ManagementFt. Washington Investment AdvisorsOaktree Capital ManagementShenkman Capital Management, IncHighbridge Principal Strategies, LLCAngelo Gordon & Co.Golub CapitalBarings Asset Management, Inc.Columbia Threadneedle Investments
AttorneyIce Miller LLPReinhert, Boerner, Van Deuren

Teachers’ Retirement System of the State of Kentucky • Years Ended June 30, 2017 and 2016 97
INVESTMENT SECTION
HEALTH INSURANCE TRUST FUND
INVESTMENT POLICY SUMMARY
The statute that created the health insurance trust fund on July 1, 2010, KRS 161.677, obliges the Board to "managethe assets of the fund in the same general manner in which it administers the retirement funds, except that the assetallocation may differ and separate accounting and financial reporting shall be maintained for the trust fund." KRS161.430, which governs the investment of funds for the retirement funds, requires that members' assets be managed in amanner consistent with fiduciary standards set forth in the "prudent person rule." Subject to this statute,administrative regulation 102 KAR 1:178 establishes investment policies for the health insurance trust fund. Thisregulation requires the Board and Investment Committee to prudently diversify assets and to consider the fund's"liquidity and its capability of meeting both short and long-term obligations" in setting asset allocation policy.
Due to an imbalance of required distributions over contributions early in the fund's existence, liquidity needs havedominated investment policy. This will evolve as contribution rate increases provided in statute improve cash flow infuture years. As near-term liquidity needs recede in importance, the focus will increasingly be on establishing aninvestment policy which achieves the required rate of return and matches the health insurance liability.
INVESTMENT OBJECTIVES
The definitive objective of the health insurance trust fund is to provide for beneficiaries' health insurance benefitobligations, both short and long-term. In support of this objective, investment policy will be designed, on an ongoingbasis, to: (1) meet all liquidity needs, (2) achieve the actuarially assumed 8.0% rate of return over the long-term, and (3)do so within appropriate risk levels.
RISK CONTROLS
Any investment program faces various risks; as with the retirement funds, the primary risk is that the assets will notsupport liabilities over the long-term. Risk control measures for the health insurance trust fund mirror those of theretirement annuity trust fund, but are customized to reflect the fund's unique liability. Primary risk control measuresinclude the following steps:
Actuarial valuations are performed each year to evaluate the funding objectives of the health insurance trustfund. Every ten years an external audit of the actuary is conducted to ensure that the assumptions made andcalculation methods used are resulting in properly computed liabilities of the fund.
Asset/liability studies are conducted approximately every five years. These studies ensure that the portfoliodesign is structured to meet the liabilities of the fund.
In accordance with administrative regulation 102 KAR 1:178, which governs investment policies for the fund,the TRS Investment Committee adopts and regularly reviews an asset allocation policy designed to meet thefund's needs.

98 Teachers’ Retirement System of the State of Kentucky • Years Ended June 30, 2017 and 2016
INVESTMENT SECTION
ASSET ALLOCATION
As of June 30, 2017, the health insurance trust fund had approximately $815.3 million in total assets. This included$73.2 million in investment grade bonds. This trust fund also had $83.5 million in high yield bonds, $474.4 million inpublic equity investments, $42.3 million in private equity investments, $30 million in bank loan investments, and $49.6million in alternative credit funds, and $42.7 million in real estate funds.
Asset allocation will be adjusted annually by the Investment Committee to reflect changing liquidity needs andactuarial funding status. Due to upcoming contribution rate increases enacted in statute, liquidity needs are expectedto decline in coming years while funding status improves. The information below shows the health insurance trustfund's asset allocation by market value as of June 30, 2017 and June 30, 2016.
Health Insurance Trust
June 30,2017**
19,312,440
73,252,237
474,453,790
42,701,494
163,246,284
42,340,364
815,306,609
$
$
Cash Equivalents*
Fixed Income
Global Equities
Real Estate
Additional Categories
Private Equity
TOTALS
%
2.4
9.0
58.2
5.2
20.2
5.0
100.0
June 30,2016
1,426,565
63,053,784
354,369,798
25,433,241
139,034,552
23,931,317
607,249,257
%
0.2
10.4
58.4
4.1
22.9
4.0
100.0
$
$
* Reflects only cash balances not allocated to other asset classes. Uninvested cash balances allocated to variousasset classes are represented in the respective asset classes.
** Does not include 401(h) value of $19,471,617.
Distribution of Investments Health Insurance Trust Fair Values
* Reflects only cash balances notallocated to other asset classes.Uninvested cash balances allocated tovarious asset classes are represented inthe respective asset classes.
June 30, 2017
June 30, 2016

Teachers’ Retirement System of the State of Kentucky • Years Ended June 30, 2017 and 2016 99
INVESTMENT SECTION
HEALTH INSURANCE TRUSTPORTFOLIO RETURNS
For the fiscal year 2017, the health insurance trust fund's portfolio returned 14.88% versus a policy index of 15.00%.The fund's global equities returned 19.38% versus 19.01% for the MSCI All Country World IMI Index. A high-qualitybond fund returned -.3% versus -.41% for the Barclays Government/Credit Index. This was the second year ofmanaging the bond fund against this index. In the previous years it was managed against 90-day T-bills. We areworking to extend duration but given the historically low interest rates we are being very selective at our extensionpoints. The additional categories returned 12.0% versus 12.75% for its benchmark (Bank of America Merrill Lynch HighYield Master II).
Prior to July 1, 2015 TRS did not benchmark overall fund performance. Effective July 1, 2015 the Board of Trusteesapproved a Policy Index which represents the returns of appropriate benchmarks for the various asset classes weightedby the mid-point of the strategic range for the current fiscal year. Returns were generated by the Segal Marco Advisorsperformance reporting system using a time-weighted rate of return calculation based upon market values.
* Returns are annualized for periods longer than one year. ** Prior to July 1, 2015, TRS did not benchmark overall fund performance. Effective July 1, 2015, the Board of Trustees approved a
Policy Index which represents the returns of appropriate benchmarks for the various asset classes weighted by the mid-point ofthe strategic range for the current fiscal year.
SCHEDULE OF INVESTMENT RETURNS - HEALTH INSURANCE TRUST
2017 Annual Rate of Return Net of Investment Expense 14.37%2016 Annual Rate of Return Net of Investment Expense -2.20%2015 Annual Rate of Return Net of Investment Expense 1.38%2014 Annual Rate of Return Net of Investment Expense 15.38%
TOTAL PLAN Policy Benchmark**
Total EquityAll Cap Equities Russell 3000Global Equities MSCI AC World IMI (Net)
Fixed Income Barclays Government Credit
Core Real Estate NCREIF ODCE (VW)
Non-Core Real Estate NCREIF Property Index
Private EquityMature Private Equity S&P 500 plus 3%Private Equity < 5 Years
Additional Categories: B of A Merrill Lynch High Yield Master II
Cash (Unallocated) 90 Day T-Bill
1 Yr
14.8815.00
18.87
19.3819.01
-0.30-0.41
7.707.87
11.916.97
20.9014.1921.4321.08
12.0012.75
0.500.44
3 Yr*
4.62
5.19
5.344.87
2.012.62
14.8913.6712.9014.95
3.274.48
0.280.20
5 Yr*
7.80
11.13
11.2210.74
1.392.29
16.5412.7418.07
5.816.92
0.210.15
10 Yr 20 YrFYTD
14.8815.00
18.87
19.3819.01
-0.30-0.41
7.707.87
11.916.97
20.9014.1921.4321.08
12.0012.75
0.500.44
Last Qtr
3.183.37
4.162.423.024.304.25
0.991.69
1.691.70
3.151.75
3.924.573.854.07
1.672.14
0.200.20
Market Value
815,306,609
474,453,78931,727,552
442,726,237
73,252,237
20,164,331
22,537,164
42,340,364 4,165,331
38,175,033
163,246,284
19,312,440
$
$$
$
$
$
$
$$
$
$
$

100 Teachers’ Retirement System of the State of Kentucky • Years Ended June 30, 2017 and 2016
INVESTMENT SECTION
Fair Value 6/30/16
3,883,661
62,555,399
25,433,241
354,369,798
23,931,316
137,075,842
607,249,257
Appreciation (Depreciation)
(1,526,759
2,906,132
69,851,382
7,351,346
10,476,279
89,058,380
HEALTH INSURANCE TRUSTPORTFOLIOS
FAIR VALUES *June 30, 2017
INTERNALLY MANAGED
Cash EquivalentsCash Collections Fund (Unallocated)
Fixed IncomeInternal Bond Fund
Subtotal
EXTERNALLY MANAGED
Global EquitiesBlackRock Fund BFt. Washington Focused Equity
Alternative InvestmentsNGP Natural Resources XIFt. Washington Fund VIIIKKR European Fund IVFt. Washington Fund VIIRiverstone E & P Fund VICarlyle Europe Fund IVActis Global Fund IVFt. Washington PE Opp IIIAudax PE Fund VLandmark Equity XVFt. Washington Fund IX-KFt. Washington Fund IXApax IX
$ 19,312,440
73,252,237
$ 92,564,677
442,726,237 31,727,552
5,906,232 5,574,607 5,253,090 4,165,331 4,121,649 3,946,307 3,378,889 3,212,860 2,743,283 1,798,715 1,097,139
976,558 165,704
SalesRedemptions,
Maturities & Paydowns
223,129,340
14,020,800
5,835,525
38,999,031
6,400,595
107,144,634
395,529,925
Investment SummaryFair Value – Health Insurance Trust
June 30, 2017
Acquisitions
245,782,777
23,275,237
20,197,646
88,052,253
17,458,295
119,762,687
514,528,895
Fair Value 6/30/17*
26,537,098
70,283,077
42,701,494
473,274,401
42,340,364
160,170,175
815,306,609
Type ofInvestment
Cash Equivalents
Fixed Income
Real Estate
Equities
Alternative
Additional Categories
TOTAL
$
$
$
$
$
$
$
$
$
$
Additional CategoriesColumbia High Yield FundFt. Washington High Yield Bond FundMarathon/TRS Credit FundShenkman Capital ManagementMarathon European Credit Opp Fund IIIMarathon European Credit Opp Fund IIHighbridge Principal Strategies IIIOaktree European Capital Solutions
Real EstatePrudential PRISA FundCarlyle Property InvestorsCarlyle Realty VIILandmark Real Estate VIIBlackstone Realty Fund VIIITA Realty Fund XIRockwood Real Estate X
Subtotal
TOTAL ASSETS
43,942,569 39,613,988 36,674,167 30,069,629
4,541,531 4,048,706 2,982,813 1,372,881
11,093,620 9,070,711 6,738,686 4,968,586 4,541,719 3,982,814 2,305,359
$ 722,741,932
$ 815,306,609
)
* Detailed information concerning the market values of all TRS investments is available upon request.
* Does not include 401(h) value of $19,471,617.

Teachers’ Retirement System of the State of Kentucky • Years Ended June 30, 2017 and 2016 101
INVESTMENT SECTION
INVESTMENT COUNSELOR FEES
EQUITY MANAGERSBlackRockFort Washington Focused Equity
Total Equity Managers
REAL ESTATEBlackstone VIIICarlyle VIICarlyle Property InvestorsLandmark VIILandmark VIIIRockwood Capital XTA Realty XIPrudential
Total Real Estate
ADDITIONAL CATEGORIESHighbridge Principal Strategies Find III,L.P.Columbia High Yield FundFort Washington Investments High YieldMarathon Credit FundMarathon European Credit Fund IIMarathon European Credit Fund IIIOaktree European Capital SolutionsShenkman Capital
Total Additional Category Managers
ALTERNATIVE INVESTMENTSActis Global Fund IV, L.P.APAX Fund IX, L.P.Audax Private Equity Fund V
Health Insurance Trust FundContracted InvestmentManagement Expenses
Fiscal Year 2016-17(In thousands of dollars)
Assets Under Management
474,454
42,701 163,246
42,340 722,741
815,307
815,307
Expense
276
731 849
1,163 3,019
53
99 $ 152
3,171
Investment Counselor Fees
Equity Manager(s)
Real Estate (2)
Additional CategoriesAlternative Investments (2) (3)
TOTAL
Other Investment Services
Custodian FeesConsultant FeesLegal & ResearchOther Administrative and Operational
TOTAL
GRAND TOTAL
$
$
$
$
Basis Points (1)
5.8
171.252.0
274.741.8
0.70.00.01.21.9
38.9
$
$
$
$1 - One basis point is one hundredth of one percent or the equivalent of .0001.2 - Accrual of fees payable as of June 30, 2017.3 - Private equity fees are either withheld from the Fund operations or paid by direct disbursement, depending on contract terms.
217,848 57,734
$ 275,582
150,000 139,616
16,826 100,000
54,620 63,610
122,272 84,405
$ 731,349
71,693 159,447
76,041 320,432
49,375 57,803 (9,044
123,314$ 849,061
99,000 158,897
33,346
Schedule of Contracted and Administrative Investment ExpensesHealth Insurance Trust Fund
June 30, 2017
ALTERNATIVE INVESTMENTS continued ...Carlyle Europe IV, L.P.Fort Washington Private Equity III, L.P.Fort Washington Fund VII, L.P.Fort Washington Fund VIII, L.P.Fort Washington Fund IX, L.P.Fort Washington Fund IX-K, L.P.KKR European IV, L.P.KKR Americas XII, L.P.Landmark Fund XV ,L.P.NGP Natural Resources XI, L.P.Riverstone Energy and Power Fund VI, L.P.
Total Alternative Managers
ADMINISTRATIVE AND OPERATIONALEXPENSES
CUSTODIANThe Bank of New York Mellon
Total Custodian
OTHEROther Administrativeand Operational(includes Personnel,Subscription services, etc…)
Total Other
TOTAL INVESTMENT EXPENSES
133,508 37,500 33,749 36,000 11,034 11,025 60,911 65,278 50,000
132,015 300,404
$ 1,162,667
53,386$ 53,386
98,822
$ 98,822
$ 3,170,867
)

102 Teachers’ Retirement System of the State of Kentucky • Years Ended June 30, 2017 and 2016
INVESTMENT SECTION
Investment ConsultantAON Hewitt
Investment CustodianThe Bank of New York Mellon
Additional Categories ManagersFt. Washington Investment AdvisorsShenkman Capital Management, Inc.Highbridge Principal Strategies, LLCMarathon Asset ManagementOaktree Capital ManagementColumbia Threadneedle Investments
Real EstateCarlyle Realty PartnersLandmark Real Estate PartnersBlackstone Real Estate PartnersTA Associates RealtyPrudential Real Estate InvestorsRockwood Capital Real Estate
Alternative Investment ManagersFt. Washington Private Equity InvestorsActis LLPLandmark PartnersKohlberg Kravis Roberts & Co.Natural Gas PartnersCarlyle Global PartnersAudax GroupRiverstone Holdings, LLCApax Partners
Equity ManagerBlackRock Institutional Trust CompanyFt. Washington Investment Advisors
AttorneyIce Miller LLP
HEALTH INSURANCE TRUST PROFESSIONAL SERVICE PROVIDERS

2017
ActuarialSection
Teachers’ Retirement System
of the State of Kentucky
Report of the Actuaryon the Annual Valuation

104 Teachers’ Retirement System of the State of Kentucky • Years Ended June 30, 2017 and 2016
ACTUARIAL SECTION
November 14, 2017
Board of TrusteesTeachers' Retirement System of the State of Kentucky479 Versailles RoadFrankfort, KY 40601-3800
Members of the Board:
Section 161.400 of the law governing the operation of the Teachers' Retirement System of the State of Kentuckyprovides that the actuary shall make an actuarial valuation of the system. We have submitted the results of the annualactuarial valuation prepared as of June 30, 2017. While not verifying the data at source, the actuary performed tests forconsistency and reasonability. The combined member and state contribution rates as a percentage of payroll for thefiscal year ending June 30, 2020 required to support the total benefits of the system are as follows:
These rates represent a decrease since the previous valuation in the total Pension actuarially determined employercontribution rates (ADEC) of 0.35% of payroll for the fiscal year ending June 30, 2020.
A breakdown of the changes in the components of the ADEC are as follows: • an increase in the expected state special appropriation from 2.83% to 3.00%, or 0.17% of payroll
• an increase in the amount required for life insurance benefits from 0.04% to 0.05%, or 0.01% of payroll
• a reduction in the additional required increase of 0.51%, from 14.61% to 14.10%
The financing objective of the system is that contribution rates will remain relatively level over time as a percentage ofpayroll. The promised benefits of the system are included in the actuarially calculated contribution rates which aredeveloped using the entry age normal cost method.
Five-year market related value of plan assets is used for actuarial valuation purposes. Gains and losses are reflected inthe total unfunded accrued liability that is being amortized by regular annual contributions as a level percentage ofpayroll in accordance with the funding policy adopted by the Board, on the assumption that payroll will increase by3.5% annually. The assumptions recommended by the actuary and adopted by the Board are reasonably related to theexperience under the system and to reasonable expectations of anticipated experience under the system.
Group Combined Member and State Contribution RequirementUniversity members hired before July 1, 2008 35.55%University members hired on or after July 1, 2008 36.55%Non-University members hired before July 1, 2008 38.51%Non-University members hired on or after July 1, 2008 39.51%

Teachers’ Retirement System of the State of Kentucky • Years Ended June 30, 2017 and 2016 105
ACTUARIAL SECTION
Board of TrusteesNovember 14, 2017Page 2
We have prepared the trend information shown in the Schedule of Funding Progress in the Financial Section of theAnnual Report and Schedule A, Schedule B, Schedule C, Solvency Test and Analysis of Financial Experience shown inthe Actuarial Section of the Annual Report.
The valuation reflects that a portion of the annual required contributions to the fund from 2005 to 2010 wereallocated to the Medical Insurance Fund and are being repaid over time. A pension obligation bond was issued August26, 2010 and was used to repay the balances of a substantial portion of the loans previously made to the MedicalInsurance Fund. No additional contributions were allocated during the 2017 fiscal year.
This is to certify that the independent consulting actuary is a member of the American Academy of Actuaries and hasexperience in performing valuations for public retirement systems, that the assumptions and methods used for fundingpurposes meet the parameters set by Actuarial Standards of Practice, and that the actuarial calculations wereperformed by qualified actuaries in accordance with accepted actuarial procedures, based on the current provisions ofthe retirement system and on actuarial assumptions that are internally consistent and reasonably based on the actualexperience of the system.
Future actuarial results may differ significantly from the current results presented in this report due to such factors asthe following: plan experience differing from that anticipated by the economic or demographic assumptions; changes ineconomic or demographic assumptions; increases or decreases expected as part of the natural operation of themethodology used for these measurements (such as the end of an amortization period or additional cost orcontribution requirements based on the plan's funded status); and changes in plan provisions or applicable law. Sincethe potential impact of such factors is outside the scope of a normal annual actuarial valuation, an analysis of the rangeof results is not presented herein.
This actuarial valuation was performed to determine the recommended funding amount for the system. The assetvalues used to determine unfunded liabilities and funded ratios are not market values but less volatile market relatedvalues. A smoothing technique is applied to market values to determine the market related values. The unfundedliability amounts and funded ratios using the market value of assets would be different. The interest rate used fordetermining liabilities is based on the expected return of assets. Therefore, liability amounts in this report cannot beused to assess a settlement of the obligation.
In our opinion, the system has not been funded on an actuarially sound basis since historically the fullactuarially determined contributions were not made by the employer. However, an additional appropriation of$498.5 million was made during fiscal year 2017 and an additional appropriation of $474.7 million isexpected to be made during fiscal year 2018. If contributions by the employer to the system in subsequentfiscal years are less than those required, the assets are expected to become insufficient to pay promisedbenefits. Assuming that contributions to the system are made by the employer from year to year in the futureat rates recommended on the basis of the successive actuarial valuations, the continued sufficiency of theassets to provide the benefits called for under the system may be safely anticipated.
Respectfully submitted,
Edward J. Koebel, EA, FCA, MAAA Alisa Bennett, FSA, EA, FCA, MAAAPrincipal and Consulting Actuary Principal and Consulting Actuary
Cathy TurcotPrincipal and Managing Director

106 Teachers’ Retirement System of the State of Kentucky • Years Ended June 30, 2017 and 2016
ACTUARIAL SECTION
1. For convenience of reference, the principal results of the valuation and a comparison with the results of theprevious valuation are summarized below (dollar amounts in thousands):
Report of Actuary on the ValuationPrepared as of June 30, 2017
Section I - SUMMARY OF PRINCIPAL RESULTS
Valuation Date
Number of active membersAnnual salaries
Number of annuitants and beneficiariesAnnual allowances
AssetsMarket valueActuarial value
Unfunded actuarial accrued liability (UAAL)Funded RatioAmortization period (years)
71,848$ 3,537,226
51,563$ 1,868,875
$ 16,812,83217,496,894
$ 14,531,33354.628.1
72,130$ 3,563,584
52,966$ 1,953,464
$ 18,707,69918,514,638
$ 14,305,24856.427.4
%%
Pension Plan:NormalAccrued liability
Total
MemberState (ARC)
Total
Life Insurance Fund:State
Medical Insurance Fund:MemberState Match
Total
Total Contributions
Member StatutoryState StatutoryRequired IncreaseState Special
Total
11.030 %24.87035.900 %
7.625 %28.27535.900 %
0.040 %
2.775 %2.775
5.550 %
41.490 %
10.400 %13.65014.610 2.83041.490 %
10.800 %24.75035.550 %
7.625 %27.92535.550 %
0.050 %
2.775 %2.775
5.550 %
41.150 %
10.400 %13.65014.100 3.00041.150 %
10.800 %25.75036.550 %
7.625 %28.92536.550 %
0.050 %
2.775 %1.775
4.550 %
41.150 %
10.400 %13.65014.100 3.00041.150 %
Contribution Rates for University Members
Members hiredbefore 7/1/2008
Members hired onor after 7/1/2008
June 30, 2016Valuation Date June 30, 2017
11.030 %25.87036.900 %
7.625 %29.27536.900 %
0.040 %
2.775 %1.775
4.550 %
41.490 %
10.400 %13.65014.610 2.83041.490 %
Members hiredbefore 7/1/2008
Members hired onor after 7/1/2008
For Fiscal Year Ending June 30, 2019 June 30, 2020
June 30, 2017 June 30, 2016
○
○
○
○
○
○
○
○
○
○
○
○
○
○
○
○
○
○
○
○
○
○
○
○
○
○
○
○
○
○
○
○
○
○
Contribution rates are shown separately for university and non-university members on the following pages.

Teachers’ Retirement System of the State of Kentucky • Years Ended June 30, 2017 and 2016 107
ACTUARIAL SECTION
Pension Plan:NormalAccrued liability
Total
MemberState (ARC)
Total
Life Insurance Fund:State
Medical Insurance Fund:MemberState Match
Total
Total Contributions
Member StatutoryState StatutoryRequired IncreaseState Special
14.940 %23.92038.860 %
9.105 %29.75538.860 %
0.040 %
3.750 %3.750
7.500 %
46.400 %
12.855 %16.10514.6102.830
46.400 %
14.840 %23.67038.510 %
9.105 %29.40538.510 %
0.050 %
3.750 %3.750
7.500 %
46.060 %
12.855 %16.10514.1003.000
46.060 %
14.840 %24.67039.510 %
9.105 %30.40539.510 %
0.050 %
3.750 %2.750
6.500 %
46.060 %
12.855 %16.10514.1003.000
46.060 %
Contribution Rates for Non-University Members
Members hiredbefore 7/1/2008
Members hired onor after 7/1/2008
June 30, 2016Valuation Date June 30, 2017
14.940 %24.92039.860 %
9.105 %30.75539.860 %
0.040 %
3.750 %2.750
6.500 %
46.400 %
12.855 %16.10514.6102.830
46.400 %
Members hiredbefore 7/1/2008
Members hired onor after 7/1/2008
For Fiscal Year Ending June 30, 2019 June 30, 2020
2. The valuation includes only the assets and liabilities associated with the pension plan. The valuation of theMedical Insurance Fund and the Active and Retired Life Insurance Benefits will be prepared separately.
3. Comments on the valuation results as of June 30, 2017 are given in Section IV and further discussion of thecontribution levels is set out in Sections V and VI.
4. Schedule B shows the development of the actuarial value of assets. The assumed investment rate of return is7.50%. Schedule D of this report outlines the full set of actuarial assumptions and methods employed in thecurrent valuation. There have been no changes since the previous valuation.
5. The current funding policy is shown in Schedule H of the Report. The funding policy has been revised since theprevious valuation, but has not yet been adopted by the Board.
6. Provisions of the system, as summarized in Schedule F, were taken into account in the current valuation. Therehave been no changes since the previous valuation.
7. The funded ratio shown in the Summary of Principal Results, is the ratio of actuarial value of assets to theactuarial accrued liability. The funded status would be different based on the market value of assets. Thefunding ratio is an indication of progress in funding the promised benefits. Since the ratio is less than 100%,there is a need for additional contributions toward the payment of the unfunded accrued liability. In addition,this funding ratio does not have any relationship to measuring the sufficiency if the plan had to settle itsliabilities.
○
○
○
○
○
○
○
○
○
○
○
○
○
○
○
○
○
○
○
○
○
○
○
○
○
○
○
○
○
○
○
○
○
○
○
Total

108 Teachers’ Retirement System of the State of Kentucky • Years Ended June 30, 2017 and 2016
ACTUARIAL SECTION
2. The following table shows the number and annual retirement allowances payable to annuitants and beneficiarieson the roll of the retirement system as of the valuation date.
3. Table 1 of Schedule G shows a distribution by age and years of service of the number and annual salaries ofactive members included in the valuation, while Table 3 shows the number and annual retirement allowances ofannuitants and beneficiaries included in the valuation, distributed by age.
1,724 1,493
36,025 20,897
2,438 9,553
72,130
University hired before 7/1/2008University hired after 7/1/2008Non-University Full Time hired before 7/1/2008Non-University Full Time hired after 7/1/2008Non-University Part Time hired before 7/1/2008Non-University Part Time hired after 7/1/2008
TOTAL
AnnualSalaries ($1,000’s)
127,690 77,914 2,339,663 947,285
20,77050,262
3,563,584
Group Number
Section II - MEMBERSHIP DATA
1. Data regarding the membership of the system for use as a basis of the valuation were furnished by the retirementsystem office. The following table shows the number of active members and their annual salaries as of June 30,2017 on the basis of which the valuation was prepared.
$ 1,780,450 82,585
90,429
$ 1,953,464
Number
46,222 2,778 3,966
52,966
Group
Service RetirementsDisability RetirementsBeneficiaries of Deceased Members
TOTAL
The Number and Annual Retirement Allowances ofAnnuitants and Beneficiaries on the Roll
as of June 30, 2017
1 Includes cost-of-living adjustments effective through July 1, 2017.
Annual RetirementAllowances1
($1,000’s)
$
$

Teachers’ Retirement System of the State of Kentucky • Years Ended June 30, 2017 and 2016 109
ACTUARIAL SECTION
Section III - ASSETS1. As of June 30, 2017, the market value of Pension Plan assets for valuation purposes held by the system amounted to
$18,707,699,025. This value excludes assets in the Medical Insurance Fund, the 403(b) Program Reserve Fund, andthe Life Insurance Fund, which are not included in the assets used for Pension Plan valuation purposes. Theestimated market investment return for the plan year was 15.02%. Schedule C shows the receipts anddisbursements for the year preceding the valuation date and a reconciliation of the asset balances for the PensionPlan.
2. The five-year market related value of Pension Plan assets used for valuation purposes as of June 30, 2017 was$18,514,638,263. The estimated investment return for the plan year ending June 30, 2017 on an actuarial value ofassets basis was 9.29%, compared to the assumed investment rate of return for the period of 7.50%. Schedule Bshows the development of the actuarial value of assets as of June 30, 2017.
Section IV - COMMENTS ON VALUATION
1. Schedule A of this report contains the valuation balance sheet which shows the present and prospective assets andliabilities of the system as of June 30, 2017. The valuation was prepared in accordance with the actuarialassumptions and the actuarial cost method, which are described in Schedule D and Schedule E.
2. The valuation balance sheet shows that the system has total prospective liabilities of $16,320,896,707 for benefitsexpected to be paid on account of the present active members. The liability on account of benefits payable toannuitants and beneficiaries amounts to $20,726,391,156 of which $798,963,061 is for special appropriationsremaining to be made toward funding minimum annuities, ad hoc increases and sick leave allowances grantedafter 1981. The liability for benefits expected to be paid to inactive members and to members entitled to deferredvested benefits is $381,559,301. The total prospective liabilities of the system amounts to $37,428,847,164. Againstthese liabilities, the system has present assets for valuation purposes of $18,514,638,263. When this amount isdeducted from the total liabilities of $37,428,847,164, there remains $18,914,208,901 as the present valuecontributions to be made in the future.
3. The employer's contributions to the system consist of normal contributions and accrued liability contributions. Thevaluation indicates that employer normal contributions at the rate of 10.80% of payroll for University and 14.84%of payroll for Non-University are required.
4. Prospective normal employer and employee contributions have a present value of $4,608,960,570. When thisamount is subtracted from $18,914,208,901, which is the present value of the total future contributions to be madeby the employer, there remains $14,305,248,331 as the amount of future unfunded accrued liability contributions.
5. The unfunded accrued liability decreased by approximately $226 million for the plan year ending June 30, 2017 andthe funding ratio increased from 54.6% to 56.4%. See Section VII for a complete breakdown of the experience of thesystem.
Section V - CONTRIBUTIONS PAYABLE UNDER THE SYSTEM
1. Section 161.540 of the retirement law provides that each university member contribute 10.400% of annual salary tothe system and each non-university member contribute 12.855% of annual salary. Of this amount, for eachuniversity member, 2.775% is paid to the Medical Insurance Fund for medical benefits and for each non-universitymember, 3.75% is paid to the Medical Insurance Fund for medical benefits. The remainder, 7.625% for universitymembers and 9.105% for non-university members, is applicable for the retirement benefits taken into account in thevaluation.
2. Section 161.550 provides that the state will match a portion of the member contributions and contribute asupplemental 3.25% of members' salaries towards discharging the system's unfunded obligations. Additionalcontributions are made to the Medical Insurance Fund as required under 161.550(3).
3. Therefore for university members, 10.875% of the salaries of active members who become members before July 1,2008 and 11.875% of the salaries of active members who become members on or after July 1, 2008 is funded bystatute or supplemental funding for the Pension Plan and Life Insurance Fund. For non-university members,12.355% of the salaries of active members who become members before July 1, 2008 and 13.355% of the salaries ofactive members who become members on or after July 1, 2008 is funded by statute or supplemental funding for the

110 Teachers’ Retirement System of the State of Kentucky • Years Ended June 30, 2017 and 2016
ACTUARIAL SECTION
Pension Plan and Life Insurance Fund. Of these amounts, 0.05% of payroll will be allocated to the Life InsuranceFund. Based on the results of the valuation, an additional 14.10% of payroll for both university and non-university will be required in order to maintain the amortization of the unfunded liability of the Pension Planbased on the funding policy adopted by the Board. An additional special appropriation of 3.00% of total payrollwill be made by the State. Therefore, the total actuarially determined employer contribution rate to the PensionPlan is 27.925% for university members who become members before July 1, 2008 and 28.925% for universitymembers who become members on or after July 1, 2008. The total actuarially determined employer contributionrate to the Pension Plan is 29.405% for non-university members who become members before July 1, 2008 and30.405% for non-university members who become members on or after July 1, 2008. The total member andemployer contribution rates to the Pension Plan are shown on the following table:
Contribution Rates by SourceUniversity
Member
Statutory TotalStatutory Medical Insurance Fund
Contribution to Pension Plan
Employer
Statutory Matching TotalStatutory Medical Insurance FundSupplemental Funding
Subtotal
Life InsuranceAdditional to Comply with Board Funding PolicySpecial Appropriation
Contribution to Pension Plan
Total Contribution to Pension Plan
10.400 %(2.775)7.625 %
10.400 % (2.775)
3.25010.875 %
(0.050) %14.1003.000
27.925 %
35.550 %
Members hiredbefore 7/1/2008
Members hired on orafter 7/1/2008
10.400 %(2.775)7.625 %
10.400 % (1.775)
3.25011.875 %
(0.050) %14.1003.000
28.925 %
36.550 %
Contribution Rates by SourceNon-University
Member
Statutory TotalStatutory Medical Insurance Fund
Contribution to Pension Plan
Employer
Statutory Matching TotalStatutory Medical Insurance FundSupplemental Funding
Subtotal
Life InsuranceAdditional to Comply with Board Funding PolicySpecial Appropriation
Contribution to Pension Plan
Total Contribution to Pension Plan
12.855 % (3.750)
9.105 %
12.855 % (3.750) 3.25012.355 %
(0.050) %14.1003.000
29.405 %
38.510 %
Members hiredbefore 7/1/2008
Members hired on orafter 7/1/2008
12.855 % (3.750)
9.105 %
12.855 % (2.750) 3.250
13.355 %
(0.050) %14.1003.000
30.405 %
39.510 %

Teachers’ Retirement System of the State of Kentucky • Years Ended June 30, 2017 and 2016 111
ACTUARIAL SECTION
4. The valuation indicates that normal contributions at the rate of 10.80% of active university members' salaries and14.84% of active non-university members' salaries are required. The difference between the total contributionrate and the normal rate remains to be applied toward the liquidation of the unfunded accrued liability. Thisaccrued liability rate is 24.75% for university members hired before July 1, 2008, 25.75% for university membershired on and after July 1, 2008, 23.67% for non-university members hired before July 1, 2008, and 24.67% for non-university members hired on and after July 1, 2008. These rates include special appropriations of 3.00% ofpayroll to be made by the State. These rates are shown in the following table:
Actuarially Determined Contribution Rates
* Includes special appropriations of 3.00% of payroll to be made by the State.
Members hiredbefore 7/1/2008
Members hired on orafter 7/1/2008
Members hiredbefore 7/1/2008
Members hired on orafter 7/1/2008
Percentage of Active Members’ Salaries
UNIVERSITY NON-UNIVERSITYRate
10.80 %24.75
35.55 %
NormalAccrued Liability *
Total
10.80 %25.75
36.55 %
14.84 %23.67
38.51 %
14.84 %24.67
39.51 %
Section VI - COMMENTS ON LEVEL OF FUNDING
1. Our calculations indicate that the contribution rates shown in the previous section will be sufficient to cover thebenefits of the system, the annual 1.5% increases in the allowances of retired members and beneficiaries, and theliabilities for minimum annuities, ad hoc increases and sick leave allowances granted after 1981.
2. The valuation indicates that the present statutory contribution rates, supplemental funding and specialappropriations, if continued at the current level percentage, along with an additional required contribution of14.10%, not currently provided in statute, are sufficient to meet the cost of benefits currently accruing andprovide for the amortization of the unfunded accrued liability in accordance with the Board funding policy.However, as existing special contributions expire, the statutory contributions or supplemental funding may berequired to increase as an equal percentage of payroll.
5. The following table shows the components of the total UAAL and the derivation of the UAAL contribution ratein accordance with the funding policy:
Total UAAL and UAAL Contribution Rate(In thousands of dollars)
UAAL RemainingAmortization Period (years)
AmortizationPayment
$ 14,744,575(351,541
340,682(428,468
$ 14,305,248
LegacyNew Incremental 6/30/2015New Incremental 6/30/2016New Incremental 6/30/2017
Total UAAL
Blended Amortization Period (years)
27181920
$ 889,290(27,46525,642
(31,151
$ 856,316
27.4
)
)
)
)

112 Teachers’ Retirement System of the State of Kentucky • Years Ended June 30, 2017 and 2016
ACTUARIAL SECTION
3. There are no excess assets or contributions available to provide additional benefits, and there is a cumulativeincrease in the required employer contribution of 14.10% of payroll for the fiscal year ending June 30, 2020, asshown in the following table:
In addition, as existing special contributions expire, the statutory contributions or supplemental funding may berequired to increase as an equal percentage of payroll, in order to amortize the unfunded actuarial accrued liability inaccordance with the Board funding policy. Any further benefit improvements must be accompanied by the entireadditional contributions necessary to support the benefits.
VALUATIONDATE
FISCALYEAR
CUMULATIVE INCREASE
June 30, 2004June 30, 2005June 30, 2006June 30, 2007June 30, 2008June 30, 2009June 30, 2010June 30, 2011June 30, 2012June 30, 2013June 30, 2014June 30, 2015June 30, 2016June 30, 2017
June 30, 2007June 30, 2008June 30, 2009June 30, 2010June 30, 2011June 30, 2012June 30, 2013June 30, 2014June 30, 2015June 30, 2016June 30, 2017June 30, 2018June 30, 2019June 30, 2020
INCREASE/(DECREASE)
0.11%1.210.560.581.132.221.460.752.402.550.83
(0.311.12
(0.51)
0.11%1.321.882.463.595.817.278.02
10.4212.9713.8013.4914.6114.10
AMOUNT
$ 3,174,60038,965,90060,499,80082,331,200
121,457,000208,649,000260,980,000299,420,000386,400,000487,400,000520,372,000512,883,000553,597,000538,253,000
)

Teachers’ Retirement System of the State of Kentucky • Years Ended June 30, 2017 and 2016 113
ACTUARIAL SECTION
1,089,850
(887,467
704
(308,14611,181
(11,66739,218
(159,758 0
0 0
(226,085
Section VII - ANALYSIS OF FINANCIAL EXPERIENCE
The following table shows the estimated gain or loss from various factors that resulted in a decrease of$226,084,753 in the unfunded accrued liability from $14,531,333,084 to $14,305,248,331 during the year ending June30, 2017. The decrease in the unfunded accrued liability was primarily due to gains for the investment return on anactuarial value basis that was greater than expected and salary increases that were less than assumed. In addition tothese gains were small demographic gains and losses due to turnover, retirement and mortality.
Analysis of Financial Experience(In thousands of dollars)
ITEM
Interest (7.50%) added to previous unfunded accrued liability
Expected accrued liability contribution
Loss due to Contribution Shortfall and Timing
Experience:Valuation asset growthPensioners’ mortalityTurnover and retirementsNew entrantsSalary increasesAmendmentsAssumption changesMethod changes
Total
AMOUNT OF INCREASE/(DECREASE)
)
)
)
)
)
$
$
Number of Active and Retired Membersas of June 30, 2017
Section VIII - ACCOUNTING INFORMATION
Governmental Accounting Standards Board (GASB) has issued Statements No. 67 and 68 which replaceStatement No. 25 and 27. The information required under the new GASB Statements will be issued in separatereports. The following information is provided for informational purposes only.
1. The following is a distribution of the number of employees by type of membership.
GROUP
Retirees and beneficiaries currentlyreceiving benefits
Terminated vested employees entitled to benefitsbut not yet receiving benefits
Inactive non-vested members
Active plan members
Total
NUMBER
52,966
8,624
42,798
72,130
176,518

114 Teachers’ Retirement System of the State of Kentucky • Years Ended June 30, 2017 and 2016
ACTUARIAL SECTION
2. The schedule of funding progress is shown below.
Schedule of Funding Progress(In thousands of dollars)
223.8 %261.7285.8320.4353.0398.1401.9396.3410.8401.4
$ 15,321,32514,885,98114,851,33014,908,13814,691,37114,962,75816,174,19917,219,52017,496,89418,514,638
$ 7,138,9798,514,4459,492,986
11,060,55412,282,48313,854,47414,010,20513,930,44214,531,33314,305,248
$ 3,190,3323,253,0773,321,6143,451,7563,479,5673,480,0663,486,3273,515,1133,537,2263,563,584
Actuarial Valuation
Date
6/30/20086/30/20096/30/20106/30/20116/30/20126/30/20136/30/20146/30/20156/30/20166/30/2017
$ 22,460,30423,400,42624,344,31625,968,69226,973,85428,817,23230,184,40431,149,96232,028,22732,819,887
* Reflects change in assumptions and methods. ** Reflects change in assumptions.
*
**
**
3. The information presented above was determined as part of the actuarial valuation at June 30, 2017. Additionalinformation as of the latest actuarial valuation follows.
Valuation date 06/30/2017
Actuarial cost method Entry age
Amortization method Level percent of pay, closed
Remaining amortization period 27.4 years
Asset valuation method 5-year smoothed market
Actuarial Assumptions:Investment rate of return*
7.50%
Projected salary increases**3.50 - 7.30%
Cost-of-living adjustments1.50% Annually
Schedule of Employer Contributions
$ 466,274,783442,549,935479,805,088
1,037,935,993557,339,552568,233,446563,326,249559,579,290565,454,590
1,060,719,993
Fiscal Year EndedJune 30
2008200920102011201220132014201520162017
PercentageContributed
%837476
153747168615799
$ 563,789,483600,282,735633,938,088678,741,428757,822,190802,984,644823,446,156913,653,854999,270,174
1,076,617,093
68.2 %63.661.057.454.551.953.655.354.656.4
ActuarialValue
of Assets(a)
ActuarialAccruedLiability (AAL)
(b)
UnfundedAAL
(UAAL)(b-a)
FundedRatio(a/b)
CoveredPayroll
(c)
UAAL as aPercentageof Covered
Payroll((b-a) /c)
ActuariallyDetermined Employer
ContributionsActual Employer
Contributions
*
* Includes Pension Obligation Bond proceeds of $465,384,165.
*Includes price inflation at 3.00%**Includes wage inflation at 3.50%

Teachers’ Retirement System of the State of Kentucky • Years Ended June 30, 2017 and 2016 115
ACTUARIAL SECTION
(1) Present value of prospective benefits payable on account ofpresent active members
- Service retirement benefits- Disability retirement benefits- Death and survivor benefits- Refunds of member contributions
Total
(2) Present value of prospective benefits payable on accountof present retired members, beneficiaries of deceasedmembers, and members entitled to deferred vested benefits
- Service retirement benefits- Disability retirement benefits- Death and survivor benefits
Total
(3) Present value of prospective benefits payable onaccount of inactive members and members entitled todeferred vested benefits
(4) TOTAL ACTUARIAL LIABILITIES
(5) Actuarial value of assets
(6) Present value of total future contributions = (4)-(5)
(7) Present value of future member contributions andemployer normal contributions
(8) Prospective unfunded accrued liabilitycontributions = (6)-(7)
(9) TOTAL PRESENT AND PROSPECTIVE ASSETS
Valuation Balance SheetShowing the Present and Prospective Assets and Liabilities
As of June 30, 2017(In thousands of dollars)
$ 15,308,828631,781127,145253,143
$ 19,152,047802,232772,112
$ 18,914,209
$ 16,320,897
$ 20,726,391
$ 381,559
$ 37,428,847
$ 18,514,638
4,608,961
14,305,248
$ 37,428,847
Actuarial Liabilities
Present and Prospective Assets
SCHEDULE A
PRES

116 Teachers’ Retirement System of the State of Kentucky • Years Ended June 30, 2017 and 2016
ACTUARIAL SECTION
Schedule A continued ...
(1) Actuarial Value of Assets Beginning of Year
(2) Net Position at Market Value at End of Year
(3) Net Position at Market Value at Beginning of Year
(4) Cash Flowa. Contributionsb. Benefit Paymentsc. Administrative Expensed. Net: (4)a - (4)b - (4)c
(5) Investment Incomea. Market total: (2) - (3) - (4)db. Assumed Ratec. Amount for Immediate Recognition:
[ (3) x (5)b ] + [ (4)d x (5)b x 0.5 ]d. Amount for Phased-In Recognition: (5)a - (5)c
(6) Phased-In Recognition of Investment Incomea. Current Year: 0.20 x (5)db. First Prior Yearc. Second Prior Yeard. Third Prior Yeare. Fourth Prior Yearf. Total Recognized Investment Gain
(7) Actuarial Value of Assets End of Year:(1) + (4)d + (5)c + (6)f
(8) Difference Between Market & Actuarial Values: (2) - (7)
(9) Net Investment Rate of Return on Actuarial Value
Development of Actuarial Value of Assetsas of June 30, 2017
Solvency Test(In millions of dollars)
ValuationDate
(1)
ActiveMember
ContributionsValuationof Assets
91837874686567696769
100 %100100100100100100100100100
(3)Active
Members(EmployerFinancedPortion)
(2)
RetirantsAnd
Beneficiaries
6/30/20086/30/20096/30/20106/30/20116/30/20126/30/20136/30/20146/30/20156/30/20166/30/2017
$ 2,899.03,042.33,196.33,325.73,415.23,514.43,629.73,700.6
3,756.03,849.9
$ 13,585.814,309.915,010.415,557.916,472.217,716.418,676.319,522.520,416.421,108.0
$ 5,975.56,048.26,137.67,085.17,086.47,586.57,878.37,926.87,855.87,862.1
$ 15,321.314,886.014,851.314,908.114,691.414,962.816,174.217,219.517,496.918,514.6
0 %000000000
(1) (2) (3)
Portion of AccruedLiabilities Covered by Assets
$ 17,496,894,437
18,707,699,025
16,812,831,883
1,374,345,4271,944,917,368
10,313,715(580,885,656
2,475,752,798 7.50%
1,239,179,1791,236,573,619
247,314,724(312,346,803(92,160,668325,163,609191,479,441359,450,303
$ 18,514,638,263
$ 193,060,762
9.29%
)
))
%
SCHEDULE B

Teachers’ Retirement System of the State of Kentucky • Years Ended June 30, 2017 and 2016 117
ACTUARIAL SECTION
$ 313,044,226565,454,590878,498,816
(245,214,860) 633,283,956
1,833,198,63027,747,742
8,636,438 1,869,582,810
(1,236,298,854
18,049,130,737(1,236,298,854
$ 16,812,831,883
(1.0)%
Summary of Receipts & Disbursements*(Market Value)
* Excludes assets for Medical Insurance Fund, the 403(b) Program Reserve Fund and the Life Insurance Fund.
Receipts for the YearContributions
MembersEmployers
TotalNet Investment Income
Total
Disbursements for the YearBenefit PaymentsRefunds to MembersMiscellaneous, including expenses
Total
Excess of Receipts over Disbursements
Reconciliation of Net PositionNet Position as of the Beginning of the YearExcess of Receipts over Disbursements
Net Position as of the End of the Year
Net Investment Rate of Return on Market Value
$ 313,625,4341,060,719,9931,374,345,4272,475,752,7983,850,098,225
1,918,612,12826,305,24010,313,715
1,955,231,083
1,894,867,142
16,812,831,8831,894,867,142
$ 18,707,699,025
15.0%
For the Year Ending June 30, 2017 June 30, 2016
SCHEDULE C
)
)

118 Teachers’ Retirement System of the State of Kentucky • Years Ended June 30, 2017 and 2016
ACTUARIAL SECTION
The assumptions and methods used in the valuation were selected based on the actuarial experience studyprepared as of June 30, 2015, submitted to and adopted by the Board on September 19, 2016.
INVESTMENT RATE OF RETURN: 7.50% per annum, compounded annually, including price inflation at3.00% per annum.
SALARY INCREASES: Representative values of the assumed annual rates of future salary increases are asfollows and include wage inflation at 3.50% per annum:
SEPARATIONS FROM SERVICE: Representative values of the assumed annual rates of death, disability,withdrawal, service retirement and early retirement are as follows:
SCHEDULE DOutline of Actuarial Assumptions and Methods
0 - 4
11.00 %11.0011.0012.0012.0012.0014.0015.0015.0015.0015.0020.0020.00
5 - 9
3.00%3.003.504.504.504.504.504.003.803.500.000.00
10+
3.00%1.401.401.301.902.402.402.402.400.000.00
MALES: Annual Rate of . . .
20253035404550556062657075
0.019 %0.0210.0250.0430.0600.0840.1190.2020.3400.4190.5650.9131.556
0.01%0.010.010.040.090.200.300.580.750.750.750.750.75
○
○
○
○
○
○
○
○
○
○
○
○
○
○
○
○
○
○
○
○
○
○
○
○
○
○
○
○
○
○
○
○
○
○
○
○
○
○
○
○
○
○
○
○
○
○
○
○
○
○
○
○
○
○
○
○
○
○
○
○
○
○
○
○
○
○
○
○
○
○
○
○
○
○
○
○
○
○
○
○
○
○
○
○
○
○
○
○
○
○
○
○
○
○
○
○
○
○
○
○
DISABILITYAGE DEATH
RETIREMENT
Before 27 Yearsof Service
5.0%13.015.020.020.0
100.0
After 27 Yearsof Service*
17.0%17.045.035.025.025.020.0
100.0
WITHDRAWAL
SERVICE
*Plus 7.5% in year when first eligible for unreduced retirement with 27 years of service.
Age
AnnualRate
20 25 30 35 40 45 50 55 60 65
7.20% 6.40% 5.40% 4.70% 4.20% 3.80% 3.70% 3.50% 3.50% 3.50%

Teachers’ Retirement System of the State of Kentucky • Years Ended June 30, 2017 and 2016 119
ACTUARIAL SECTION
DEATHS AFTER RETIREMENT: The RP-2000 Combined Mortality Table projected to 2025 using scale BB (setforward two years for males and one year for females) is used for death after service retirement and beneficiaries.The RP-2000 Disabled Mortality Table (set forward two years for males and seven years for females) is used for deathafter disability retirement. There is a margin for future mortality improvement in the tables used by the system.Based on the results of the most recent experience study adopted by the Board on September 19, 2016, the numbers ofexpected future deaths are 15-19% less than the actual number of deaths that occurred during the study period forhealthy retirees and 13-17% less thanexpected under the selected table fordisabled retirees. Representativevalues of the assumed annual rates ofdeath after service retirement andafter disability retirement are shownin this table:
ASSETS: Five-year marketrelated actuarial value, as developedin Schedule B. The actuarial value ofassets recognizes a portion of thedifference between the market valueof assets and the expected actuarialvalue of assets, based on the ultimateassumed valuation rate of return of7.50%. The amount recognized eachyear is 20% of the difference betweenmarket value and expected actuarialvalue.
EXPENSE LOAD: None.
PERCENT MARRIED: 100%, with females 3 years younger than males.
LOADS: Unused sick leave: 2% of active liability.
Schedule D continued ...
Before 27 Yearsof Service
5.5 %14.014.022.020.0
100.0
9.00 %9.00
12.0012.0012.0013.0013.0015.0015.0015.0015.0015.0015.00
4.00 %4.004.004.004.005.005.005.004.604.000.000.00
1.65 %1.501.301.201.502.002.002.002.000.000.00
20253035404550556062657075
0.007 %0.0080.0100.0180.0260.0420.0620.0960.1570.1970.2870.4950.831
○
○
○
○
○
○
○
○
○
○
○
○
○
○
○
○
○
○
○
○
○
○
○
○
○
○
○
○
○
○
○
○
○
○
○
○
○
○
○
○
○
○
○
○
○
○
○
○
○
○
○
○
○
○
○
○
○
○
○
○
○
○
○
○
○
○
○
○
○
○
○
○
○
○
○
*Plus 7.5% in year when first eligible for unreduced retirement with 27 years of service.
○
○
○
○
○
○
○
○
○
○
○
○
○
○
○
○
○
○
○
○
○
○
○
○
○
After 27 Yearsof Service*
15.0 %18.050.040.040.035.035.0
100.0
FEMALES: Annual Rate of . . .
DISABILITYDEATH
RETIREMENT WITHDRAWAL
SERVICEAGE 0 - 4 5 - 9 10+
0.01 %0.010.030.060.120.250.440.650.850.850.850.850.85
Annual Rate of Death After . . . SERVICE RETIREMENT DISABILITY RETIREMENT
AGE
4550556065707580859095
MALE
0.1609 %0.24740.42460.69851.13001.86973.21475.51609.5631
17.278727.1263
FEMALE
0.1135 %0.17180.26580.44090.81001.37392.28993.75516.3873
11.247618.1190
MALE
2.3306 %2.92793.44003.58813.82754.75666.31538.3527
10.912217.278727.1263
FEMALE
1.2482 %1.56501.78072.31643.16874.40326.08578.4679
12.757219.471824.2074
○
○
○
○
○
○
○
○
○
○
○
○
○
○
○
○
○
○
○
○
○
○
○
○
○
○
○
○
○
○
○
○
○
○
○
○
○
○
○
○
○
○
○
○
○
○
○
○

120 Teachers’ Retirement System of the State of Kentucky • Years Ended June 30, 2017 and 2016
ACTUARIAL SECTION
SCHEDULE E
Actuarial Cost Method
1. The valuation is prepared on the projected benefit basis, under which the present value, at the interest rateassumed to be earned in the future (currently at 7.50%), of each active member's expected benefit at retirement ordeath is determined, based on his age, service, sex and compensation. The calculations take into account theprobability of a member's death or termination of employment prior to becoming eligible for a benefit, as well asthe possibility of his terminating with a service, disability or survivor's benefit. Future salary increases and post-retirement cost-of-living adjustments are also anticipated. The present value of the expected benefits payable onaccount of the active members is added to the present value of the expected future payments to retired membersand beneficiaries and inactive members to obtain the present value of all expected benefits payable from thesystem on account of the present group of members and beneficiaries.
2. The employer contributions required to support the benefits of the system are determined following a levelfunding approach, and consist of a normal contribution and an accrued liability contribution.
3. The normal contribution is determined using the "entry age normal" method. Under this method, a calculation ismade to determine the uniform and constant percentage rate of employer contribution which, if applied to thecompensation of the average new member during the entire period of his anticipated covered service, would berequired in addition to the contributions of the member to meet the cost of all benefits payable on his behalf.
4. The unfunded accrued liability is determined by subtracting the present value of prospective employer normalcontributions and member contributions, together with the current actuarial value of assets held, from thepresent value of expected benefits to be paid from the system.
SCHEDULE F
Summary of Main System Provisions as Interpreted for Valuation Purposes
The Teachers' Retirement System of the State of Kentucky was established on July 1, 1940. The valuation took intoaccount amendments to the system effective through June 30, 2017. The following summary describes the main benefitand contribution provisions of the system as interpreted for the valuation.
1 - DEFINITIONS
"Final average salary" means the average of the five highest annual salaries which the member has received forservice in a covered position and on which the member has made contributions or on which the public board,institution or agency has picked up the member contributions. For a member who retires after attaining age 55 with 27years of service, "final average salary" means the average of the three highest annual salaries.
2 - BENEFITS
Service Retirement Allowance for Members Before 7/1/2008Condition for Allowance Completion of 27 years of service or attainment of age 55 and 5 years of service.
Amount of Allowance The annual retirement allowance for non-university members is equal to:
(a) 2.0% of final average salary multiplied by service before July 1, 1983, plus(b) 2.5% of final average salary multiplied by service after July 1, 1983.(c) For individuals who become members of the retirement system on or after July 1, 2002 and have less
than 10 years of service at retirement, the retirement allowance is 2.0% of final average salarymultiplied by service. If, however, they have 10 or more years, they receive a benefit percentage of2.5% for all years of service up to 30 years.
(d) For members retiring on or after July 1, 2004, the retirement allowance formula is 3.0% of finalaverage salary for each year of service credit earned in excess of 30 years.

Teachers’ Retirement System of the State of Kentucky • Years Ended June 30, 2017 and 2016 121
ACTUARIAL SECTION
The annual retirement allowance for university members is equal to 2.0% of final average salary multiplied by allyears of service.
For all members, the annual allowance is reduced by 5% per year from the earlier of age 60 or the date the memberwould have completed 27 years of service.
The minimum annual service allowance for all members is $440 multiplied by credited service.
Service Retirement Allowance for Members on and after 7/1/2008Condition for Allowance Completion of 27 years of service, attainment of age 60 and 5 years of service or attainment of age 55 and 10
years of service.
Amount of AllowanceThe annual retirement allowance for non-university members is equal to:
1.7% of final average salary if service is 10 years or less. 2.0% of final average salary if service is greater than 10 years and no more than 20 years. 2.3% of final average salary if service is greater than 20 years but no more than 26 years. 2.5% of final average salary if service is greater than 26 years but no more than 30 years. 3.0% of final average salary for years of service greater than 30 years.
The annual retirement allowance for university members is equal to: 1.5% of final average salary if service is 10 years or less. 1.7% of final average salary if service is greater than 10 years and no more than 20 years. 1.85% of final average salary if service is greater than 20 years but less than 27 years. 2.0% of final average salary if service is greater than or equal to 27 years.
For all members, the annual allowance is reduced by 6% per year from the earlier of age 60 or the date the memberwould have completed 27 years of service.
Disability Retirement AllowanceCondition for Allowance
Totally and permanently incapable of being employed as a teacher and under age 60 but after completing 5years of service.
Amount of Allowance The disability allowance is equal to the greater of the service retirement allowance or 60% of the member's
final average salary. The disability allowance is payable over an entitlement period equal to 25% of the service creditedto the member at the date of disability or five years, whichever is longer. After the disability entitlement period hasexpired and if the member remains disabled, he will be retired under service retirement. The service retirementallowance will be computed with service credit given for the period of disability retirement. The allowance will not beless than $6,000 per year. The service retirement allowance will not be reduced for commencement of the allowancebefore age 60 or the completion of 27 years of service.
Benefits Payable on Separation from Service Any member who ceases to be in service is entitled to receive his contributions with allowable interest. A
member who has completed 5 years of creditable service and leaves his contributions with the system may becontinued in the membership of the system after separation from service, and file application for service retirementafter the attainment of age 60.
Life Insurance A separate Life Insurance fund has been created as of June 30, 2000 to pay benefits on behalf of deceased
TRS active and retired members.
Death BenefitsA surviving spouse of an active member with less than 10 years of service may elect to receive an annual allowance
of $2,880 except that if income from other sources exceeds $6,600 per year the annual allowance will be $2,160.
A surviving spouse of an active member with 10 or more years of service may elect to receive an allowance which isthe actuarial equivalent of the allowance the deceased member would have received upon retirement. The allowance
Schedule F continued ...

122 Teachers’ Retirement System of the State of Kentucky • Years Ended June 30, 2017 and 2016
ACTUARIAL SECTION
will commence on the date the deceased member would have been eligible for service retirement and will be payableduring the life of the spouse.
If the deceased member is survived by unmarried children under age 18 the following schedule of annualallowances applies:
Number of Children Annual Allowance
1 $ 2,4002 4,0803 4,8004 or more 5,280
The allowances are payable until a child attains age 18, or age 23 if a full-time student.
If the member has no eligible survivor, a refund of his accumulated contributions is payable to his estate.
OptionsIn lieu of the regular Option 1, a retirement allowance payable in the form of a life annuity with refundable balance,
any member before retirement may elect to receive a reduced allowance which is actuarially equivalent to the fullallowance, in one of the following forms:
Option 2. A single life annuity payable during the member's lifetime with payments for 10 years certain.Option 3. At the death of the member his allowance is continued throughout the life of his beneficiary.Option 3(a). At the death of the beneficiary designated by the member under Option 3, the member's benefit will
revert to what would have been paid had he not selected an option.Option 4. At the death of the member one half of his allowance is continued throughout the life of his beneficiary.Option 4(a). At the death of the beneficiary designated by the member under Option 4, the member's benefit will
revert to what would have been paid had he not selected an option.
Post-Retirement AdjustmentsThe retirement allowance of each retired member and of each beneficiary shall be increased by 1.50% each July 1.
3- CONTRIBUTIONS
Member ContributionsUniversity members contribute 7.625% of salary to the retirement system. Non-university members contribute
9.105% of salary to the retirement system. Member contributions are picked up by the employer.
Schedule F continued ...
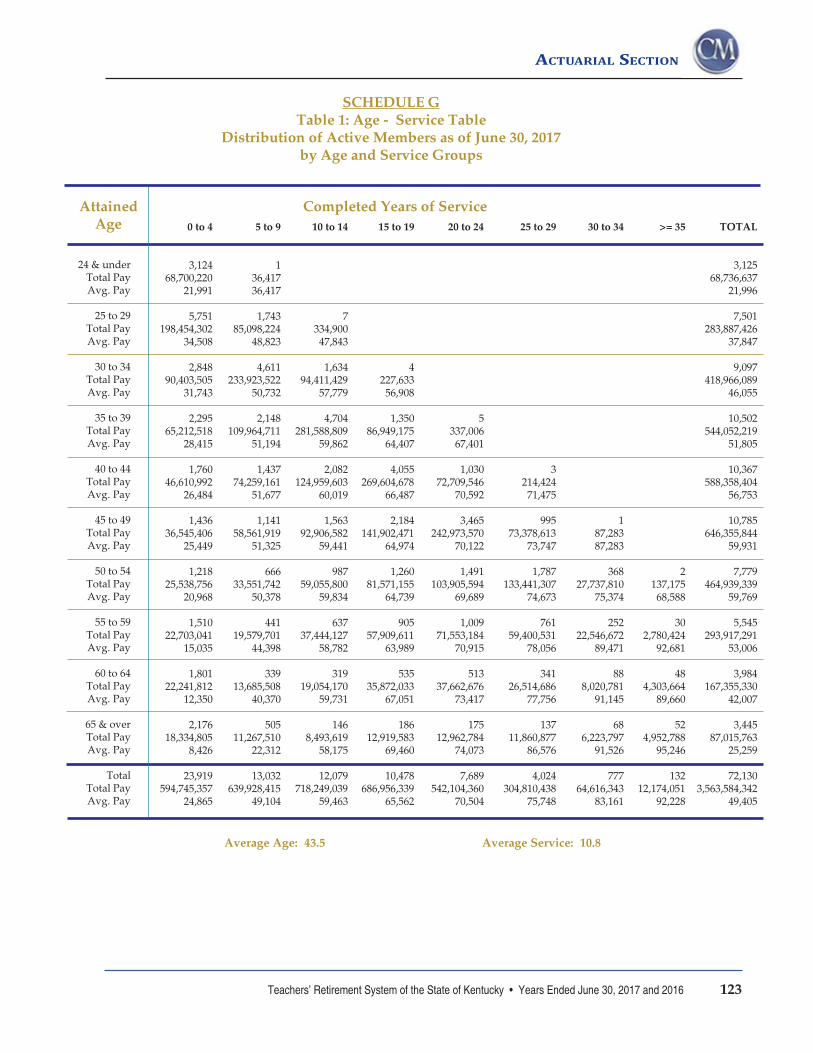
Teachers’ Retirement System of the State of Kentucky • Years Ended June 30, 2017 and 2016 123
ACTUARIAL SECTION
SCHEDULE GTable 1: Age - Service Table
Distribution of Active Members as of June 30, 2017by Age and Service Groups
Average Age: 43.5 Average Service: 10.8
24 & underTotal PayAvg. Pay
25 to 29Total PayAvg. Pay
30 to 34Total PayAvg. Pay
35 to 39Total PayAvg. Pay
40 to 44Total PayAvg. Pay
45 to 49Total PayAvg. Pay
50 to 54Total PayAvg. Pay
55 to 59Total PayAvg. Pay
60 to 64Total PayAvg. Pay
65 & overTotal PayAvg. Pay
TotalTotal PayAvg. Pay
0 to 4
3,12468,700,220
21,991
5,751198,454,302
34,508
2,84890,403,505
31,743
2,29565,212,518
28,415
1,76046,610,992
26,484
1,43636,545,406
25,449
1,21825,538,756
20,968
1,51022,703,041
15,035
1,80122,241,812
12,350
2,17618,334,805
8,426
23,919594,745,357
24,865
5 to 9
136,41736,417
1,74385,098,224
48,823
4,611233,923,522
50,732
2,148109,964,711
51,194
1,43774,259,161
51,677
1,14158,561,919
51,325
66633,551,742
50,378
44119,579,701
44,398
33913,685,508
40,370
50511,267,510
22,312
13,032639,928,415
49,104
10 to 14
7334,90047,843
1,63494,411,429
57,779
4,704281,588,809
59,862
2,082124,959,603
60,019
1,56392,906,582
59,441
98759,055,800
59,834
63737,444,127
58,782
31919,054,170
59,731
1468,493,619
58,175
12,079718,249,039
59,463
15 to 19
4227,63356,908
1,35086,949,175
64,407
4,055269,604,678
66,487
2,184141,902,471
64,974
1,26081,571,155
64,739
90557,909,611
63,989
53535,872,033
67,051
18612,919,583
69,460
10,478686,956,339
65,562
20 to 24
5337,00667,401
1,03072,709,546
70,592
3,465242,973,570
70,122
1,491103,905,594
69,689
1,00971,553,184
70,915
51337,662,676
73,417
17512,962,784
74,073
7,689542,104,360
70,504
25 to 29
3214,42471,475
99573,378,613
73,747
1,787133,441,307
74,673
76159,400,531
78,056
34126,514,686
77,756
13711,860,877
86,576
4,024304,810,438
75,748
30 to 34
187,28387,283
36827,737,810
75,374
25222,546,672
89,471
888,020,781
91,145
686,223,797
91,526
77764,616,343
83,161
>= 35
2137,17568,588
302,780,424
92,681
484,303,664
89,660
524,952,788
95,246
13212,174,051
92,228
TOTAL
3,12568,736,637
21,996
7,501283,887,426
37,847
9,097418,966,089
46,055
10,502544,052,219
51,805
10,367588,358,404
56,753
10,785646,355,844
59,931
7,779464,939,339
59,769
5,545293,917,291
53,006
3,984167,355,330
42,007
3,44587,015,763
25,259
72,1303,563,584,342
49,405
Completed Years of ServiceAttainedAge

124 Teachers’ Retirement System of the State of Kentucky • Years Ended June 30, 2017 and 2016
ACTUARIAL SECTION
2017201620152014201320122011201020092008
72,13071,84872,24673,40774,83175,95176,34976,38775,93775,539
Table 3: Number of Retired Members, Beneficiariesand their Benefits by Age
as of June 30, 2017
AttainedAge
Number ofMembers
Total AnnualPayments
AverageAnnual Benefits
49 & Under
50 - 54
55 - 59
60 - 64
65 - 69
70 - 74
75 - 79
80 - 84
85 - 89
90 & Over
TOTAL
839
1,355
4,100
8,441
13,307
10,572
6,570
3,969
2,373
1,440
52,966
$ 11,271,278
53,461,765
177,488,529
346,499,640
516,625,458
389,151,744
229,669,782
127,197,393
67,342,576
34,755,811
$ 1,953,463,976
$ 13,434
39,455
43,290
41,050
38,824
36,810
34,957
32,048
28,379
24,136
$ 36,881
Average Current Age: 69.5
Average Age at Retirementfor All Retirees and Beneficiaries: 56.0
Table 2: Schedule of Active Member Valuation Dataas of June 30, 2017
Number
AnnualAverage
PayAnnualPayroll
$ 3,563,584,3423,537,226,3483,515,113,1273,486,326,7993,480,066,4063,479,567,0043,451,756,2873,321,614,2233,253,076,6003,190,332,239
$ 49,40549,23248,65547,49346,50645,81345,21043,48442,83942,234
Schedule G continued ...
ValuationDate June 30
% Increase inAverage
Pay
0.351.192.452.121.511.333.971.511.436.67
%
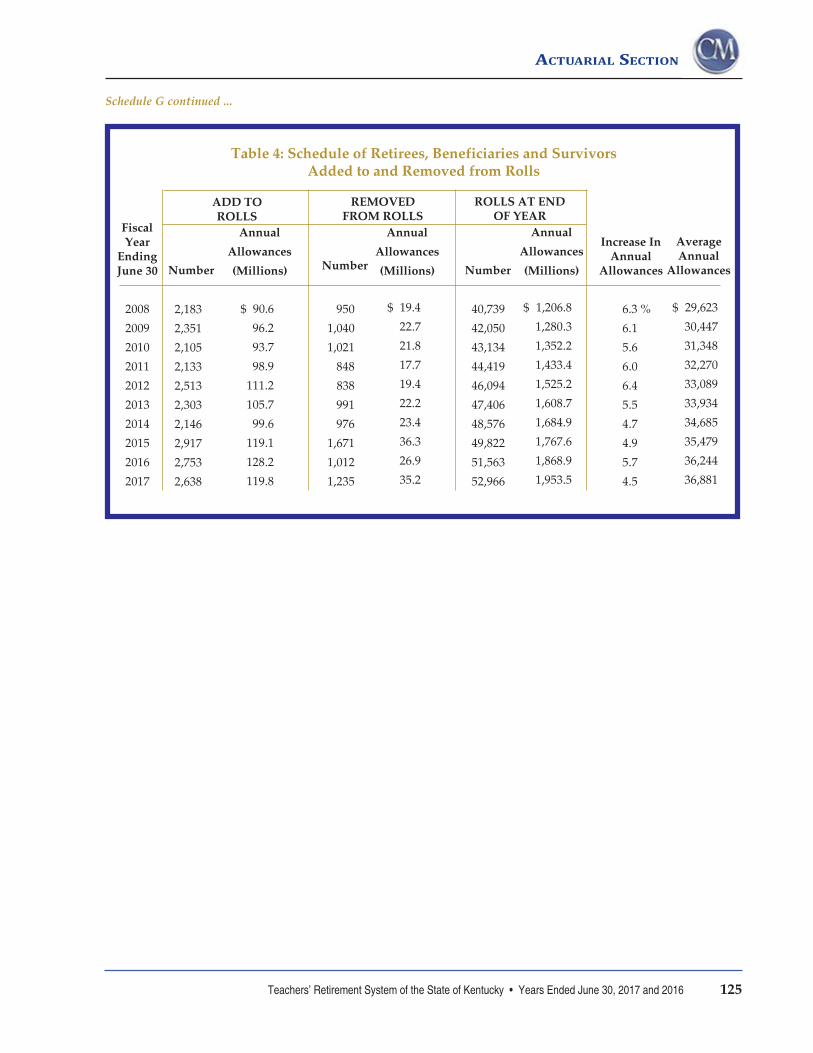
Teachers’ Retirement System of the State of Kentucky • Years Ended June 30, 2017 and 2016 125
ACTUARIAL SECTION
Table 4: Schedule of Retirees, Beneficiaries and SurvivorsAdded to and Removed from Rolls
FiscalYear
EndingJune 30
2008
2009
2010
2011
2012
2013
2014
2015
2016
2017
2,183
2,351
2,105
2,133
2,513
2,303
2,146
2,917
2,753
2,638
Annual
Allowances
(Millions)
ADD TOROLLS
$ 19.4
22.7
21.8
17.7
19.4
22.2
23.4
36.3
26.9
35.2
950
1,040
1,021
848
838
991
976
1,671
1,012
1,235
40,739
42,050
43,134
44,419
46,094
47,406
48,576
49,822
51,563
52,966
$ 1,206.8
1,280.3
1,352.2
1,433.4
1,525.2
1,608.7
1,684.9
1,767.6
1,868.9
1,953.5
REMOVEDFROM ROLLS
ROLLS AT ENDOF YEAR
6.3 %
6.1
5.6
6.0
6.4
5.5
4.7
4.9
5.7
4.5
$ 29,623
30,447
31,348
32,270
33,089
33,934
34,685
35,479
36,244
36,881
$ 90.6
96.2
93.7
98.9
111.2
105.7
99.6
119.1
128.2
119.8
Annual
Allowances
(Millions)
Annual
Allowances
(Millions)
Increase InAnnual
AllowancesNumberNumber Number
Schedule G continued ...
AverageAnnual
Allowances

126 Teachers’ Retirement System of the State of Kentucky • Years Ended June 30, 2017 and 2016
ACTUARIAL SECTION
Schedule HBoard Funding Policy
The board has always taken action as required by state law and recommended annual retirement appropriationspayable by the state that would ensure that the state meets the contractual obligations to members. This policyconfirms the board's process for recommending annual retirement appropriations payable by the state and the primaryactuarial assumptions and methodologies associated with calculating the annual retirement appropriations. Otherrelated actuarial assumptions and methodologies not listed in this policy are reported in annual valuations, the mostrecent experience study, or resolutions adopted by the board.
1. Annual Retirement Appropriations Payable by the State: In each biennial budget request, the board willrecommend annual retirement appropriations payable by the state to meet the benefit requirements of the members ofthe retirement system. The annual retirement appropriations payable by the state are the sum of the fixed employercontribution rate set by state law and the additional annual retirement appropriations necessary to fund the benefitrequirements of members of the retirement system. (KRS 161.550.) The recommended additional annual retirementappropriations payable by the state are calculated by the board's actuary based upon the results of an annual valuationpreceding the beginning of each biennium. (KRS 161.400.)
Introduction
Pursuant to the provisions of KRS 161.250, the Board of Trustees ("Board") of the Kentucky Teachers' RetirementSystems ("TRS") is vested with the responsibility for the general administration and management of the retirementsystem. The Board may adopt procedures necessary to conduct the business of the retirement system as needed. Theapplicable provisions of the Kentucky Revised Statutes ("state law") shall control if any inconsistency exists betweenstate law and this policy.
Background:
State law provides that the retirement benefits promised to members of TRS are "…an inviolable contract of theCommonwealth…." (KRS 161.714.) To satisfy this solemn commitment, the Commonwealth of Kentucky ("state") isrequired to pay annual retirement appropriations necessary to fund the benefit requirements of members of theretirement system. All employers participating in TRS are responsible for paying the fixed employer contribution rateset forth in state law. However, the state-as plan guarantor-is solely responsible for paying the additional annualretirement appropriations necessary to keep the retirement system actuarially sound and able to satisfy the contractwith members to provide promised benefits. (KRS 161.550(6).)
Since fiscal year 2008, the state has not paid the recommended annual retirement appropriations necessary to pre-fund the benefit requirements of members of the retirement system as determined by the actuary. Over this period oftime, because of the failure to fund, the state's annual retirement appropriations have grown significantly from $60.5million (Fiscal Year 2009) to $520 million (Fiscal Year 2017). The following schedule details the growth of the annualretirement appropriations payable by the state:
200920102011201220132014201520162017
CumulativeIncreaseas a % ofPayroll
1.882.463.595.817.278.0210.4212.9713.80
Cumulative Increaseof Annual Retirement
AppropriationsPayable by the State
(Source: TRS Report of the Actuary on the AnnualValuation Prepared as of June 30, 2014).
$ 60,499,80082,331,200
121,457,000208,649,000260,980,000299,420,000386,400,000487,400,000520,372,000
%

Teachers’ Retirement System of the State of Kentucky • Years Ended June 30, 2017 and 2016 127
ACTUARIAL SECTION
2. Calculation of Annual Retirement Appropriations Payable by the State: The Board will recommend annualretirement appropriations payable by the state, which-if paid-will meet the benefit requirements of the members of theretirement system consistent with generally accepted actuarial principles. Based upon technical advice from theBoard's actuary, the Board hereby adopts the following principles for calculating the recommended annual retirementappropriations payable by the state:
Use the Entry Age Normal actuarial cost method;
Use a five-year asset smoothing method;
Use a 30-year closed period to amortize legacy unfunded liability ("legacy unfunded liability" isthat unfunded liability recognized as of the valuation prepared for June 30, 2014);
Use a 20-year closed period to amortize new sources of unfunded liability ("new sources ofunfunded liability" is that unfunded liability consisting of all benefit changes, assumption andmethod changes, and experience gains and/or losses that have occurred since the previousvaluation); and
Reach a 100 percent minimum funded ratio within the thirty-year closed amortization period.
The Board also recognizes that, from time to time, the state may desire to contribute lump sum payments towardsatisfaction of unfunded liability rather than amortization of the debt. Total unfunded liability is published in everyannual valuation of the retirement system and TRS will work with the state to develop reasonable and appropriateplans for receipt of lump sum payments toward the satisfaction of unfunded liability.
This policy will be reviewed regularly and amended or revised as necessary.
Schedule ISensitivity Analysisas of June 30, 2017
The valuation results are projections based on the actuarial assumptions. Actual experience will differ from theseassumptions, either increasing or decreasing cost. The charts on the following pages provide a simple analysis on howthe costs are sensitive to changes to the assumed discount rate, the assumed inflation rate and the rate of payrollgrowth. The charts show the actuarial accrued liability, the unfunded liability, the funded ratio and the employercontribution rate under the following scenarios:
The discount rate assumption sensitivity analysis shows the valuation results with the baseline discount rateassumption, and 7.50% together with a decrease in the discount rate to 6.50% and an increase in the discount rate to8.50%. Under this scenario, the underlying inflation rate assumption is held constant at 3.00% and the payroll growthassumption is held constant at 3.50%.
The inflation assumption sensitivity analysis shows the valuation results with the baseline underlyinginflation rate assumption, 3.00%, together with decreases in the inflation rate to 2.75% and 2.50%. Under this scenario,the decrease in the underlying inflation rate assumption leads to corresponding decreases in the discount rate, thepayroll growth assumption and the assumed rates of salary increase for active members.
The payroll growth assumption sensitivity analysis shows the valuation results with the baseline underlyingpayroll growth assumption, 3.50%, together with decreases in the payroll growth assumption to 2.00% and 0.00%.Under this scenario, all other assumptions, including the individual member salary scale, are held constant so that theonly impact is in the amortization of the unfunded liability, leading to higher employer contribution rates.
Schedule H continued ...

128 Teachers’ Retirement System of the State of Kentucky • Years Ended June 30, 2017 and 2016
ACTUARIAL SECTION
DecreaseDiscount Rate
IncreaseDiscount
RateValuation
Results
Actuarial Accrued LiabilityActuarial Value of Assets
Unfunded LiabilityFunded RatioEmployer ADEC - University*Employer ADEC - Non-University*Discount RatePayroll GrowthInflation Rate
$ 36,634,86318,514,638
$ 18,120,22550.5%
37.325%38.805%
6.50%3.50%3.00%
$ 32,819,88618,514,638
$ 14,305,24856.4%
28.925%30.405%
7.50%3.50%3.00%
$ 29,621,49918,514,638
$ 11,106,86162.5%
21.645%23.125%
8.50%3.50%3.00%
ValuationResults
DecreaseInflation
Rate50 Basis Points
DecreaseInflation
Rate25 Basis Points
Actuarial Accrued LiabilityActuarial Value of Assets
Unfunded LiabilityFunded RatioEmployer ADEC - University*Employer ADEC - Non-University*Discount RatePayroll GrowthInflation Rate
$ 32,819,88618,514,638
$ 14,305,24856.4%
28.925%30.405%
7.50%3.50%3.00%
$ 33,592,16018,514,638
$ 15,077,52255.1%
30.945%32.425%
7.25%3.25%2.75%
$ 34,397,18418,514,638
$ 15,882,54653.8%
33.075%34.555%
7.00%3.00%2.50%
* Less 1% for members hired before July 1, 2008.
* Less 1% for members hired before July 1, 2008.
Schedule I continued ...
Assumed Discount Rate Sensitivity Analysisas of June 30, 2017
(In thousands of dollars)
Inflation Assumption Sensitivity Analysisas of June 30, 2017
(In thousands of dollars)

Teachers’ Retirement System of the State of Kentucky • Years Ended June 30, 2017 and 2016 129
ACTUARIAL SECTION
ValuationResults
NoPayrollGrowth
DecreasePayrollGrowth
to 2%
Actuarial Accrued LiabilityActuarial Value of Assets
Unfunded LiabilityFunded RatioEmployer ADEC - University*Employer ADEC - Non-University*Discount RatePayroll GrowthInflation Rate
$ 32,819,88618,514,638
$ 14,305,24856.4%
28.925%30.405%
7.50%3.50%3.00%
$ 32,819,88618,514,638
$ 14,305,24856.4%
33.285%34.765%
7.50%2.00%3.00%
$ 32,819,88618,514,638
$ 14,305,24856.4%
39.815%41.295%
7.50%0.00%3.00%
* Less 1% for members hired before July 1, 2008.
Schedule I continued ...
Payroll Growth Assumption Sensitivity Analysisas of June 30, 2017
(In thousands of dollars)

This page was intentionally left blank.

2017
ActuarialSection
Report of the ActuaryAnnual Valuation
of the Retiree Medical Planand the Life Insurance Plan
Teachers’ Retirement System
of the State of Kentucky

132 Teachers’ Retirement System of the State of Kentucky • Years Ended June 30, 2017 and 2016
ACTUARIAL SECTION
November 10, 2017
Board of TrusteesTeachers' Retirement System of the State of Kentucky479 Versailles RoadFrankfort, KY 40601-3800
Members of the Board:
This report covers the Retiree Medical Plan funded by the Medical Insurance Fund (MIF) and OPEB liabilities related to theLife Insurance Plan funded by the Life Insurance Fund (LIF). Cavanaugh Macdonald Consulting, LLC (CMC) has submittedthe results of the annual actuarial valuation prepared as of June 30, 2017. While not verifying the data at source, the actuaryperformed tests for consistency and reasonability.
The valuation indicates a total annual required contribution of 7.01% of active member payroll for the MIF payable for the fiscalyear ending June 30, 2018 is required to support the benefits of the Kentucky Employees' Health Plan (KEHP) and the MedicareEligible Health Plan (MEHP). Of this amount, 2.775% of payroll is estimated to be paid by University members and 3.750% ofpayroll is estimated to be paid by all other members, leaving 4.235% and 3.260% respectively, as the remaining annual requiredcontribution. This annual required contribution reflects the actuarial value of assets of the MIF and an 8.00% discount rate forvaluing liabilities.
The initial per capita costs of health care and the rates of health care inflation used to project the per capita health care costshave been revised since the previous valuation to reflect recent experience and revised expectations. Additionally, the results ofthe valuation include a change to the KEHP dependent subsidies offered to retirees who retired prior to July 1, 2010.
The Life Insurance Plan valuation indicates a total annual required contribution of 0.05% of active member payroll payable forthe fiscal year ending June 30, 2020 is required to support the benefits of the LIF. This annual required contribution reflects theactuarial value of assets of the LIF and a 7.50% discount rate for valuing liabilities.
The promised benefits of the Retiree Medical and Life Insurance Plans are included in the actuarially calculated contributionrates that are developed using the entry age normal actuarial cost method. Five-year market related value of plan assets is usedfor actuarial valuation purposes. Gains and losses are reflected in the unfunded accrued liability that is being amortized byregular annual contributions as a level percentage of payroll within a 23-year period for the Retiree Medical Plan and a 27-yearperiod for the Life Insurance Plan, on the assumption that payroll will increase by 3.50% annually. The assumptionsrecommended by the actuary and adopted by the Board are in aggregate reasonably related to the experience under the RetireeMedical and Life Insurance Plans and to reasonable expectations of anticipated experience under the Retiree Medical and LifeInsurance Plans and meet the parameters for the disclosures under GASB 45.

Teachers’ Retirement System of the State of Kentucky • Years Ended June 30, 2017 and 2016 133
ACTUARIAL SECTION
Board of TrusteesNovember 10, 2017Page 2
CMC has prepared the trend information shown in the Schedule of Funding Progress in the Financial Section of the AnnualReport and Section VII shown in the Actuarial Section of the Annual Report.
This is to certify that the independent consulting actuaries are members of the American Academy of Actuaries and haveexperience in performing valuations for public retirement systems, that the valuation was prepared in accordance withprinciples of practice prescribed by the Actuarial Standards Board, and that the actuarial calculations were performed byqualified actuaries in accordance with accepted actuarial procedures, based on the current provisions of the Retiree Medicaland Life Insurance Plans and on actuarial assumptions that are internally consistent and reasonably based on the actualexperience of the Plans.
Future actuarial results may differ significantly from the current results presented in this report due to such factors as thefollowing: plan experience differing from that anticipated by the economic or demographic assumptions; changes ineconomic or demographic assumptions; increases or decreases expected as part of the natural operation of the methodologyused for these measurements (such as the end of an amortization period or additional cost or contribution requirements basedon the plan's funded status); and changes in plan provisions or applicable law. Since the potential impact of such factors isoutside the scope of a normal annual actuarial valuation, an analysis of the range of results is not presented herein.
This actuarial valuation was performed to determine the recommended funding amount for the system. The asset values usedto determine unfunded liabilities and funded ratios are not market values, but less volatile market-related values. Asmoothing technique is applied to market values to determine the market-related values. The unfunded liability amounts andfunded ratios using the market value of assets would be different. The interest rate used for determining liabilities is basedon the expected return of assets. Therefore, liability amounts in this report cannot be used to assess a settlement of theobligation.
In our opinion, if the contributions to the Medical Insurance Fund continue at the current statutorily required levels, thefunded ratio of the Retiree Medical Plan will continue to increase, and the ability of the MIF to fund the benefits called forunder the Retiree Medical Plan will improve.
Respectfully submitted,
Alisa Bennett, FSA, EA, FCA, MAAA Edward J. Koebel, EA, FCA, MAAAPrincipal and Consulting Actuary Principal and Consulting Actuary

134 Teachers’ Retirement System of the State of Kentucky • Years Ended June 30, 2017 and 2016
ACTUARIAL SECTION
1. For convenience of reference, the principal results of the valuation and a comparison with the results of theprevious valuation are summarized below (dollar amounts are in thousands):
NormalAccrued liability
Total
MemberEmployer (ARC)State (ARC)
Total
1.95 % 4.64
6.59 %
2.775 % 2.775
1.0406.590 %
1.94 % 5.07
7.01 %
2.775 %2.7751.4607.010 %
1.94 % 5.07
7.01 %
2.775 %1.7752.4607.010 %
Medical Insurance Fund Contribution Rates for University Members
Members hiredbefore 7/1/2008
Members hired on orafter 7/1/2008
June 30, 2016Valuation Date June 30, 2017
1.95 % 4.64
6.59 %
2.775 % 1.775
2.0406.590 %
Members hiredbefore 7/1/2008
Members hired on orafter 7/1/2008
Contribution For Fiscal Year Ending June 30, 2017 June 30, 2018
* Spouses of post-65 retirees, as well as surviving spouses of deceased retirees on or after July 1, 2002, pay 100% of the fullcontribution. The full contribution for non-Medicare-eligible dependents is paid through a combination of payments frombeneficiaries and the state.
NormalAccrued liability
Total
MemberEmployer (ARC)State (ARC)
Total
1.95 % 4.64
6.59 %
3.750 % 3.000
(0.160)6.590 %
1.94 % 5.07
7.01 %
3.750 % 3.000
0.2607.010 %
1.94 % 5.07
7.01 %
3.750 % 3.000
0.2607.010 %
Medical Insurance Fund Contribution Rates for School District Employees (Non-Federal)
Members hiredbefore 7/1/2008
Members hired on orafter 7/1/2008
June 30, 2016Valuation Date June 30, 2017
1.95 % 4.64
6.59 %
3.750 % 3.000
(0.160)6.590%
Members hiredbefore 7/1/2008
Members hired on orafter 7/1/2008
Contribution For Fiscal Year Ending June 30, 2017 June 30, 2018
Report of Actuary on the Annual Valuation of the Retiree Medical and Life Insurance PlansPrepared as of June 30, 2017
Section I - SUMMARY OF PRINCIPAL RESULTS
Valuation Date
Number of active membersAnnual salariesNumber of deferred vested membersNumber of annuitants in medical plansNumber of spouses and beneficiaries in medical plans*
Total
Assets:Market valueActuarial value
Unfunded actuarial accrued liabilityAmortization period (years)Discount rate
71,848$ 3,537,226
8,14538,815
7,18145,996
$ 733,781$ 795,055$ 2,839,018
308.00%
72,130$ 3,563,584
7,41039,497
7,18946,686
$ 963,269$ 985,694$ 2,706,025
238.00%
June 30, 2017 June 30, 2016
○
○
○
○
○
○
○
○
○
○
○
○
○
○
○
○
○
○
○
○
○
○
○
○
○
○
○
○
○
○
○
○
○
○
○
○
Medical Insurance Fund
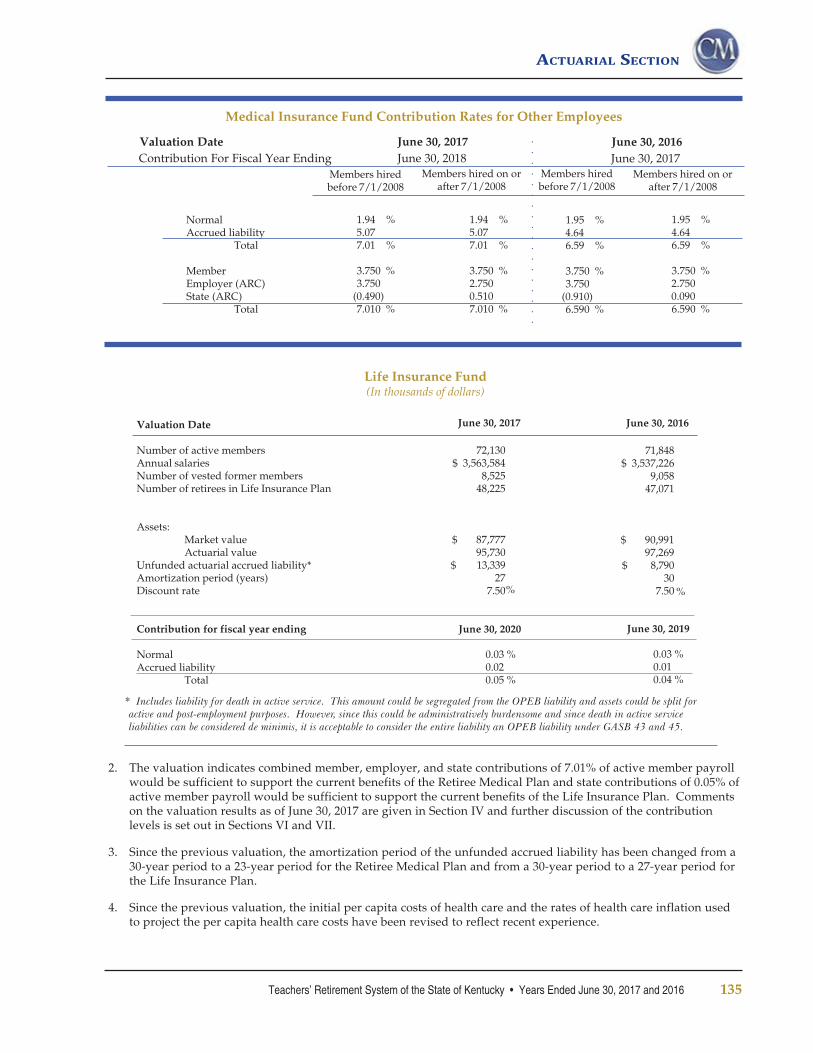
Teachers’ Retirement System of the State of Kentucky • Years Ended June 30, 2017 and 2016 135
ACTUARIAL SECTION
NormalAccrued liability
Total
MemberEmployer (ARC)State (ARC)
Total
1.95 % 4.64
6.59 %
3.750 %3.750
(0.910)6.590 %
1.94 % 5.07
7.01 %
3.750 %3.750
(0.490)7.010 %
1.94 % 5.07
7.01 %
3.750 %2.750
0.5107.010 %
Medical Insurance Fund Contribution Rates for Other Employees
Members hiredbefore 7/1/2008
Members hired on orafter 7/1/2008
June 30, 2016Valuation Date June 30, 2017
1.95 % 4.64
6.59 %
3.750 % 2.750
0.0906.590 %
Members hiredbefore 7/1/2008
Members hired on orafter 7/1/2008
Contribution For Fiscal Year Ending June 30, 2017 June 30, 2018
Valuation Date
Number of active membersAnnual salariesNumber of vested former membersNumber of retirees in Life Insurance Plan
Assets:Market valueActuarial value
Unfunded actuarial accrued liability*Amortization period (years)Discount rate
Contribution for fiscal year ending
NormalAccrued liability
Total
71,848$ 3,537,226
9,05847,071
$ 90,991 97,269
$ 8,79030
7.50
72,130$ 3,563,584
8,52548,225
$ 87,777 95,730
$ 13,33927
7.50
Life Insurance Fund(In thousands of dollars)
2. The valuation indicates combined member, employer, and state contributions of 7.01% of active member payrollwould be sufficient to support the current benefits of the Retiree Medical Plan and state contributions of 0.05% ofactive member payroll would be sufficient to support the current benefits of the Life Insurance Plan. Commentson the valuation results as of June 30, 2017 are given in Section IV and further discussion of the contributionlevels is set out in Sections VI and VII.
3. Since the previous valuation, the amortization period of the unfunded accrued liability has been changed from a30-year period to a 23-year period for the Retiree Medical Plan and from a 30-year period to a 27-year period forthe Life Insurance Plan.
4. Since the previous valuation, the initial per capita costs of health care and the rates of health care inflation usedto project the per capita health care costs have been revised to reflect recent experience.
* Includes liability for death in active service. This amount could be segregated from the OPEB liability and assets could be split foractive and post-employment purposes. However, since this could be administratively burdensome and since death in active serviceliabilities can be considered de minimis, it is acceptable to consider the entire liability an OPEB liability under GASB 43 and 45.
0.03 %0.020.05 %
0.03 %0.010.04 %
%%
○
○
○
○
○
○
○
○
○
○
○
○
○
○
○
○
○
○
June 30, 2017 June 30, 2016
June 30, 2020 June 30, 2019

136 Teachers’ Retirement System of the State of Kentucky • Years Ended June 30, 2017 and 2016
ACTUARIAL SECTION
Section II - MEMBERSHIP DATA
1. Data regarding the membership of the Retiree Medical and Life Insurance Plans for use as a basis of thevaluation were furnished by the system's office. The following tables summarize the membership of thesystem as of June 30, 2017, upon which the valuation was based. Detailed tabulations of the data are given inSchedule F.
5. Since the previous valuation, there has been a change to the KEHP dependent subsidies offered to retirees. Thepremium subsidy for KEHP-participating members who retired prior to July 1, 2010 has been restored.
Report of Actuary on the Annual Valuation of the Retiree Medical and Life Insurance Plans continued ...
1,7241,493
36,02520,8972,438
9,553
72,130
University Full Time hired before 7/1/2008University Full Time hired after 7/1/2008Non-University Full Time hired before 7/1/2008Non-University Full Time hired after 7/1/2008Non-University Part Time hired before 7/1/2008Non-University Part Time hired after 7/1/2008
TOTAL
AnnualSalaries ($1,000’s)
$ 127,69077,914
2,339,663947,28520,770
50,262
$ 3,563,584
Group Number
Active Members as of June 30, 2017
2. The following tables show the number of retired members and their beneficiaries receiving health care as of thevaluation date as well as average ages.
Under Age 65
NumberAverage Age
NumberAverage Age
Age 65 and Over TOTAL
11,09460.2
2,61859.0
28,40374.0
4,57174.8
39,49770.1
7,18969.1
Retirees Receiving Health Benefits as of June 30, 2017
Spouses Receiving Health Benefits as of June 30, 2017
3. The Retiree Medical Plan valuation includes 7,410 deferred vested members eligible for health care at age 60and the Life Insurance Plan valuation includes 8,525 deferred vested members eligible for retiree lifeinsurance at age 60.

Teachers’ Retirement System of the State of Kentucky • Years Ended June 30, 2017 and 2016 137
ACTUARIAL SECTION
Section III - ASSETS
1. As of June 30, 2017, the market value of MIF assets held by the Retiree Medical Plan amounted to $963,269,031and the market value of LIF assets held by the Life Insurance Plan amounted to $87,777,405.
2. The five-year market related value of MIF assets used for valuation purposes as of June 30, 2017 was$985,694,300 and the five-year market related value of LIF assets used for valuation purposes as of June 30, 2017was $95,730,467. Schedule B shows the development of the actuarial value of assets as of June 30, 2017.
3. Schedule C shows the receipts and disbursements for the year preceding the valuation date and a reconciliationof the asset balances for the MIF and the LIF.
Section IV - COMMENTS ON VALUATION
1. Schedule A of this report outlines the results of the actuarial valuation. The valuation was prepared inaccordance with the actuarial assumptions and the actuarial cost method, which are described in Schedule D.
2. The valuation shows the Retiree Medical Plan has an actuarial accrued liability of $1,706,563,670 for benefitsexpected to be paid on account of the present active membership, based on service to the valuation date. Theliability on account of deferred vested members amounts to $47,985,652. The liability on account of benefitspayable to retirees and covered spouses amounts to $1,937,169,564. The total actuarial accrued liability of theRetiree Medical Plan amounts to $3,691,718,886. Against these liabilities, the Retiree Medical Plan has presentassets for valuation purposes of $985,694,300. When this amount is deducted from the actuarial accrued liabilityof $3,691,718,886, there remains $2,706,024,586 as the unfunded actuarial accrued liability for the Retiree MedicalPlan.
3. The normal contribution is equal to the actuarial present value of benefits accruing during the current year. Thenormal contribution for the Retiree Medical Plan is determined to be $69,127,577, or 1.94% of payroll.
4. The valuation shows that the Life Insurance Plan has an actuarial accrued liability of $17,002,363 for benefitsexpected to be paid on account of the present active membership, based on service to the valuation date. Theliability on account of deferred vested members amounts to $3,416,394. The liability on account of benefitspayable to retirees amounts to $88,650,542. The total actuarial accrued liability of the Life Insurance Planamounts to $109,069,299. This amount includes liability for death in active service. The liability for death inactive service could be segregated from the OPEB liability and assets could be split for active and post-employment purposes. As this could be administratively burdensome and, as death in active service liabilitiescan be considered de minimis, it is viewed to be acceptable to consider the entire liability an OPEB liability underGASB 43 and 45. Against these liabilities, the Life Insurance Plan has present assets for valuation purposes of$95,730,467. When this amount is deducted from the actuarial accrued liability of $109,069,299, there remains$13,338,832 as the unfunded actuarial accrued liability for the life insurance plan.
5. The normal contribution is equal to the actuarial present value of benefits accruing during the current year. Thenormal contribution for the life insurance plan is determined to be $993,357, or 0.03% of payroll.

138 Teachers’ Retirement System of the State of Kentucky • Years Ended June 30, 2017 and 2016
ACTUARIAL SECTION
)
)
8,790
993
1,474
623
8,932
0
0
0
8,932
13,339
(4,407
(4,566
159
106,059
0.1%
Section V - DERIVATION OF EXPERIENCE GAINS AND LOSSES
1. Actual experience will never (except by coincidence) coincide exactly with assumed experience. It is assumedthat gains and losses will be in balance over a period of years, but sizable year-to-year fluctuations are common.Detail on the derivation of the experience gain (loss) for the year ended June 30, 2017 is shown below ($1,000's).
2,839,018
69,043
233,094
213,997
2,888,964
0
0
(153,125
2,735,839
2,706,025
29,814
65,870
(36,056)
3,634,073
(1.0%
(1) UAAL** as of 6/30/2016
(2) Normal cost from last valuation
(3) Expected employer contributions
(4) Interest accrual:[(1) + (2) - (3)] x interest***
(5) Expected UAAL before changes:(1) + (2) - (3) + (4)
(6) Change due to benefit provisions
(7) Change due to new actuarial assumptions
(8) Change due to claims experience
(9) Expected UAAL after changes:(5) + (6) + (7) + (8)
(10) Actual UAAL as of 6/30/2017
(11) Total gain/(loss): (9) - (10)
(a) Contribution and investment gain/(loss)(b) Experience gain/(loss) (11) - (11a)
(12) Accrued liabilities as of 6/30/2016
(13) Experience gain/(loss) as percent ofactuarial accrued liabilities at start of year(11b) / (12)
EXPERIENCE GAIN/(LOSS)* OF THE:MEDICAL
INSURANCE FUNDLIFE
INSURANCE FUND
$
$
)
)
* Rows labeled as a change, rather than a gain/(loss), are expressed as negative if the UAAL is decreased and positive if theUAAL is increased.
** Unfunded Actuarial Accrued Liability*** Interest is 8.0% for the Medical Insurance Fund and 7.5% for the Life Insurance Fund.
$
$
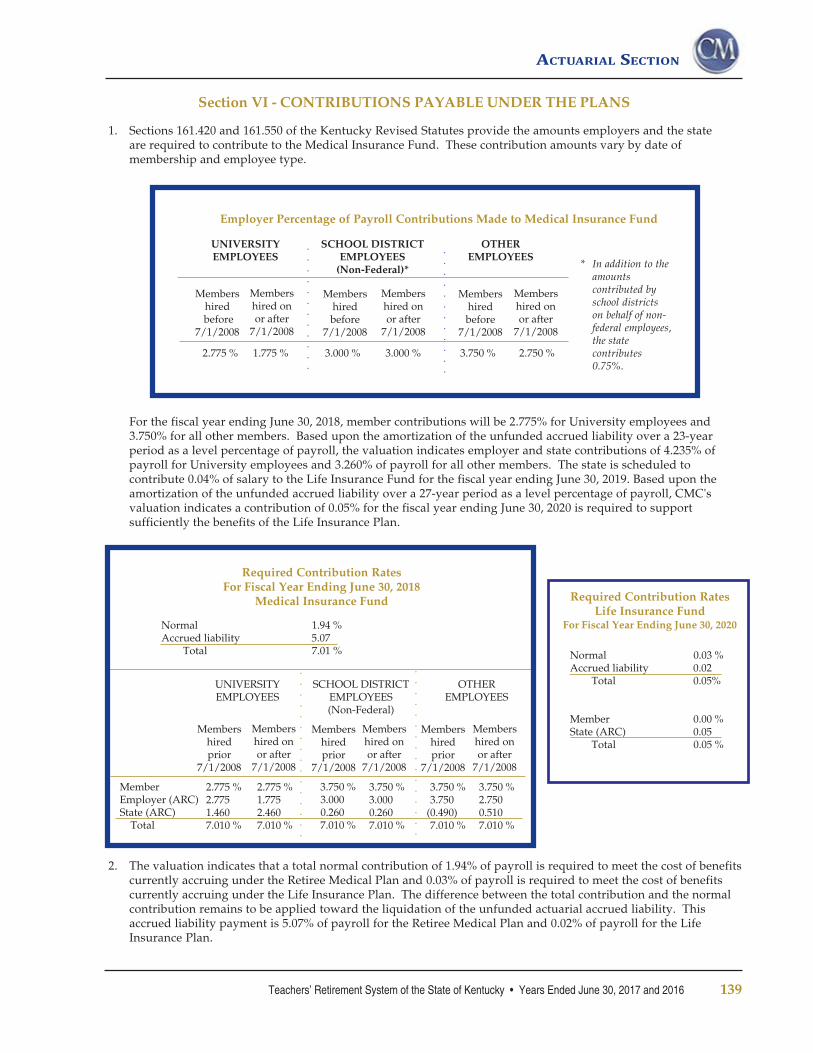
Teachers’ Retirement System of the State of Kentucky • Years Ended June 30, 2017 and 2016 139
ACTUARIAL SECTION
Required Contribution RatesFor Fiscal Year Ending June 30, 2018
Medical Insurance Fund
MemberEmployer (ARC)State (ARC) Total
2.775 %2.7751.4607.010 %
2.775 %1.7752.4607.010 %
3.750 %3.0000.2607.010 %
3.750 %3.750
(0.490)7.010 %
3.750 %2.7500.5107.010 %
Membershiredprior
7/1/2008
Membershired onor after
7/1/2008
Membershiredprior
7/1/2008
Membershired onor after
7/1/2008
Membershiredprior
7/1/2008
Membershired onor after
7/1/2008
UNIVERSITYEMPLOYEES
SCHOOL DISTRICTEMPLOYEES(Non-Federal)
OTHEREMPLOYEES
Normal 1.94 %Accrued liability 5.07 Total 7.01 % Normal 0.03 %
Accrued liability 0.02 Total 0.05%
Member 0.00 %State (ARC) 0.05 Total 0.05 %
Required Contribution RatesLife Insurance Fund
For Fiscal Year Ending June 30, 2020
Section VI - CONTRIBUTIONS PAYABLE UNDER THE PLANS
1. Sections 161.420 and 161.550 of the Kentucky Revised Statutes provide the amounts employers and the stateare required to contribute to the Medical Insurance Fund. These contribution amounts vary by date ofmembership and employee type.
Employer Percentage of Payroll Contributions Made to Medical Insurance Fund
2.775 % 1.775 % 3.000 % 3.000 % 3.750 % 2.750 %
Membershired
before7/1/2008
Membershired onor after
7/1/2008
Membershiredbefore
7/1/2008
Membershired onor after
7/1/2008
Membershiredbefore
7/1/2008
Membershired onor after
7/1/2008
UNIVERSITYEMPLOYEES
SCHOOL DISTRICTEMPLOYEES
(Non-Federal)*
OTHEREMPLOYEES
* In addition to theamountscontributed byschool districtson behalf of non-federal employees,the statecontributes0.75%.
For the fiscal year ending June 30, 2018, member contributions will be 2.775% for University employees and3.750% for all other members. Based upon the amortization of the unfunded accrued liability over a 23-yearperiod as a level percentage of payroll, the valuation indicates employer and state contributions of 4.235% ofpayroll for University employees and 3.260% of payroll for all other members. The state is scheduled tocontribute 0.04% of salary to the Life Insurance Fund for the fiscal year ending June 30, 2019. Based upon theamortization of the unfunded accrued liability over a 27-year period as a level percentage of payroll, CMC'svaluation indicates a contribution of 0.05% for the fiscal year ending June 30, 2020 is required to supportsufficiently the benefits of the Life Insurance Plan.
2. The valuation indicates that a total normal contribution of 1.94% of payroll is required to meet the cost of benefitscurrently accruing under the Retiree Medical Plan and 0.03% of payroll is required to meet the cost of benefitscurrently accruing under the Life Insurance Plan. The difference between the total contribution and the normalcontribution remains to be applied toward the liquidation of the unfunded actuarial accrued liability. Thisaccrued liability payment is 5.07% of payroll for the Retiree Medical Plan and 0.02% of payroll for the LifeInsurance Plan.
○
○
○
○
○
○
○
○
○
○
○
○
○
○
○
○
○
○
○
○
○
○
○
○
○
○
○
○
○
○
○
○
○
○
○
○
○
○
○
○
○
○
○
○
○
○
○
○
○
○
○
○
○
○
○
○
3.750 %3.0000.2607.010 %

140 Teachers’ Retirement System of the State of Kentucky • Years Ended June 30, 2017 and 2016
ACTUARIAL SECTION
Section VII - COMMENTS ON LEVEL OF FUNDING
1. The system's monthly contribution for retirees who opt into the Retiree Medical Plan is based upon date of hire,date of attaining age 65, and years of service at retirement. Additionally, beneficiary contributions may vary bydate of hire, date of attaining age 65, years of service at retirement, plan election, Medicare eligibility, andtobacco use. Beneficiary contributions for dependents are targeted to be 100% of the cost of expected claims forspouses age 65 and older. Historically, this target has been achieved. 100% of the full cost for non-Medicareeligible dependents is paid through a combination of payments from beneficiaries and the state on a currentdisbursement basis. Current employer and state contributions have been determined to be sufficient to fund thecost of the benefits to be provided. Benefits for university, school district (non-Federal), and other members areidentical, although active employee contributions collected from university, school district (non-Federal), andother members differ. A listing of active member Retiree Medical Plan contributions by fiscal year, date ofmembership, and employer type is provided in Schedule E.
2. This valuation provides the contributions required to fund sufficiently the Retiree Medical Plan and to ensure thefuture solvency of the Medical Insurance Fund. For University employees, a member contribution of 2.775% ofpayroll together with employer and state contributions of 4.235% of payroll are required to meet the cost ofbenefits currently accruing and provide for the amortization of the unfunded actuarial accrued liability over aperiod of 23 years. For the remaining membership, a member contribution of 3.750% of payroll together withemployer and state contributions of 3.260% of payroll is required to meet the cost of benefits currently accruingand provide for the amortization of the unfunded actuarial accrued liability over a period of 23 years.
1. Governmental Accounting Standards Board Statement 45 set forth certain items of required supplementaryinformation to be disclosed in the financial statements of the Retiree Medical and Life Insurance Plans and theemployer.
Number of Active and Retired Members inMedical Plan as of June 30, 2017
NUMBER
39,497
7,189
7,410
72,130
126,226
GROUP
Retirees currentlyreceiving health benefits
Spouses of retirees currentlyreceiving health benefits
Terminated employees entitled to benefitsbut not yet receiving benefits
Active plan members
Total
Section VIII - ACCOUNTING INFORMATION
Number of Active and Retired Members inLife Insurance Plan as of June 30, 2017
NUMBER
48,225
8,525
72,130
128,880
GROUP
Retirees
Terminated employees
Active plan members
Total
3. The unfunded actuarial accrued liability amounts to $2,706,024,586 for the Retiree Medical Plan and $13,338,832for the Life Insurance Plan as of the valuation date. An accrued liability contribution of 5.07% of payroll for theRetiree Medical Plan and 0.02% of payroll for the Life Insurance Plan is sufficient to amortize the unfundedactuarial accrued liabilities over a 23-year period for the Retiree Medical Plan and a 27-year period for the LifeInsurance Plan, based on the assumption that the payroll will increase by 3.50% annually.

Teachers’ Retirement System of the State of Kentucky • Years Ended June 30, 2017 and 2016 141
ACTUARIAL SECTION
Schedule of Funding ProgressMedical Insurance Fund
(In thousands of dollars)
195.9 %191.489.390.693.689.377.082.280.375.9
$ 185,883229,103241,224294,819338,746412,185508,913637,839795,055985,694
$ 6,248,6396,225,6302,965,5823,128,3303,255,7943,108,8882,685,7762,887,7452,839,0182,706,025
$ 3,190,3323,253,0773,321,6143,451,7563,479,5673,480,0663,486,3273,515,1133,537,2263,563,584
6/30/20086/30/20096/30/20106/30/20116/30/20126/30/20136/30/20146/30/20156/30/20166/30/2017
$ 6,434,5226,454,7333,206,8063,423,1493,594,5403,521,0733,194,6893,525,5843,634,0733,691,719
*
**
***
****
2.9 %3.57.58.69.4
11.715.918.121.926.7
Schedule of Funding ProgressLife Insurance Fund(In thousands of dollars)
0.21 %0.170.13
(0.01)(0.02)(0.02)0.040.040.250.37
$ 77,65884,70387,90588,52792,24194,86396,13097,18697,26995,730
$ 6,6075,6314,186(439(843(538
1,2241,5538,790
13,339
$ 3,190,3323,253,0773,321,6143,451,7563,479,5673,480,0663,486,3273,515,1133,537,2263,563,584
6/30/20086/30/20096/30/20106/30/20116/30/20126/30/20136/30/20146/30/20156/30/20166/30/2017
$ 84,26590,33492,09188,08891,39894,32597,35498,739
106,059109,069
92.2 %93.895.5
100.5100.9100.698.798.491.787.8
A B (B-A) (A/B) C [(B-A)/C]
UAALas a % ofCoveredPayroll
A B (B-A) (A/B) C [(B-A)/C]
ActuarialValuation
Date
ActuarialValue ofAssets
ActuarialAccrued
Liabilities (AAL)
UnfundedAAL
(UAAL)Funded
RatioCoveredPayroll
)))
1 Reflects change in decrement and participation assumptions.
UAALas a % ofCoveredPayroll
ActuarialValuation
Date
ActuarialValue ofAssets
ActuarialAccrued
Liabilities (AAL)
UnfundedAAL
(UAAL)Funded
RatioCoveredPayroll
1
* Reflects change in participation assumptions and plan design. ** Reflects change in discount rate to 8%, change in plan design and updating medical trend.*** Reflects change in decrement assumptions and updating medical trend.**** Reflects change in decrement and participation assumptions.

142 Teachers’ Retirement System of the State of Kentucky • Years Ended June 30, 2017 and 2016
ACTUARIAL SECTION
2. The information presented in the required supplementary schedules was determined as part of the actuarialvaluation at June 30, 2017. Additional information as of the latest actuarial valuation follows.
Pre-Medicare**7.75 %7.00 %5.00 %2024
ValuationDate
06/30/2017
ActuarialCost
Method
Entry age
AmortizationMethod
Level percent ofpay, open
RemainingAmortization
Period
23 Years RetireeMedical Plan27 Years Life
Insurance Plan
AssetValuationMethod
5-Year SmoothedMarket
Medical Trend AssumptionFiscal Year Ending 6/30/2018Fiscal Year Ending 6/30/2019Ultimate Trend RateYear of Ultimate Trend Rate
Medicare5.75 %5.50 %5.00 %2021
* Includes price inflation at 3.00%.**Alternate trend rates were used for Medicare Part B premiums and are disclosed in Schedule D.
ActuarialAssumptions:
InvestmentRate of Return*
8.00%-RetireeMedical Plan
ActuarialAssumptions:
InvestmentRate of Return*
7.50%-Retiree LifeInsurance Plan
FiscalYear
Ending
AnnualRequired
Contribution (ARC)
ActualEmployer
ContributionPercentage of ARC
Contributed
282.7 %364.298.796.797.296.696.397.198.198.6
$ 5,411,2495,455,4731,966,8261,668,8221,684,7111,680,4951,006,0911,019,5191,037,7691,049,683
$ 1,914,1991,498,0761,992,9691,725,8781,732,8311,739,9081,044,9591,050,2161,057,8511,065,122
6/30/20086/30/20096/30/20106/30/20116/30/20126/30/20136/30/20146/30/20156/30/20166/30/2017
(A) (B) (B) / (A)
Schedule of Employer ContributionsMedical Insurance Fund
$ 160,866,209178,091,867173,379,781188,734,514177,747,845166,611,420162,568,395168,084,353221,966,705180,375,986
40.7 %38.137.939.537.889.2
101.9157.7226.5175.4
$ 11,911,56513,611,74814,614,285
280,585297,639
00000
$ 148,954,644164,480,119158,765,496188,453,929177,450,206166,611,420162,568,395168,084,353221,966,705180,375,986
$ 395,282,164467,312,904457,054,117477,723,070470,217,067186,725,823159,583,400106,606,13297,982,580
102,854,017
6/30/20086/30/20096/30/20106/30/20116/30/20126/30/20136/30/20146/30/20156/30/20166/30/2017
Schedule of Employer ContributionsLife Insurance Fund
Percentage ofARC
Contributed
(A) (B) (C) (B) + (C) [(B) + (C)]/(A)
FiscalYear
Ending
AnnualRequired
Contribution (ARC)
ActualEmployer
Contribution
Retiree DrugSubsidy
ContributionTOTAL
Contribution

Teachers’ Retirement System of the State of Kentucky • Years Ended June 30, 2017 and 2016 143
ACTUARIAL SECTION
(a) Employer Annual Required Contribution
(b) Interest on Net OPEB Obligation
(c) Adjustment to Annual Required Contribution
(d) Annual OPEB Cost: (a) + (b) - (c)
(e) Employer Contributions for Fiscal Year 2017
(f) Increase (decrease) in Net OPEB Obligation: (d) - (e)
(g) Net OPEB Obligation at beginning of Fiscal Year
(h) Net OPEB Obligation at end of Fiscal Year: (f) + (g)
Annual OPEB Cost and Net OPEB Obligationfor the Medical Insurance Fund for Fiscal Year Ending June 30, 2017
$ 102,854,017
111,531,286
80,560,112
133,825,191
180,375,986
(46,550,795
1,394,141,069
$ 1,347,590,274
)
3. Following is the calculation of the Annual OPEB Cost (AOC) and the Net OPEB Obligation (NOO) for thefiscal year ending June 30, 2017. As the Retiree Medical and Life Insurance Plans are cost-sharing multiple-employer plans, GASB Statement 45 does not require the participating employers to disclose this information.
FiscalYear
EndingAnnual OPEB Cost
(AOC)
Percentageof AOC
ContributedNet OPEBObligation
Trend Information for the Medical Insurance Fund
$ 1,413,736,0731,469,685,0471,503,952,7861,480,595,8981,394,141,0691,347,590,274
37.074.982.6
116.1163.8134.8
$ 480,545,219222,560,394196,836,134144,727,465135,511,876133,825,191
6/30/20126/30/20136/30/20146/30/20156/30/20166/30/2017
%

144 Teachers’ Retirement System of the State of Kentucky • Years Ended June 30, 2017 and 2016
ACTUARIAL SECTION
(a) Employer Annual Required Contribution
(b) Interest on Net OPEB Obligation
(c) Adjustment to Annual Required Contribution
(d) Annual OPEB Cost: (a) + (b) - (c)
(e) Employer contributions for Fiscal Year 2017
(f) Increase (decrease) in Net OPEB Obligation: (d) - (e)
(g) Net OPEB Obligation at beginning of Fiscal Year
(h) Net OPEB Obligation at end of Fiscal Year: (f) + (g)
Annual OPEB Cost and Net OPEB Obligationfor the Life Insurance Fund for Fiscal Year Ending June 30, 2017
$ 1,065,122
(641,293
(468,294
892,123
1,049,683
(157,560
(8,550,579
$ (8,708,139
FiscalYear
EndingAnnual OPEB Cost
(AOC)
Percentageof AOC
ContributedNet OPEBObligation
Trend Information for the Life Insurance Fund
$ (7,940,695)(8,066,159)(8,215,089)(8,375,658)(8,550,579)(8,708,139)
108.6 %108.1117.4118.7120.3117.7
$ 1,551,0651,555,031
857,161858,950862,848892,123
6/30/20126/30/20136/30/20146/30/20156/30/20166/30/2017
)
)
)
)
)
4. On June 2, 2015, GASB Statement No. 74 and GASB Statement No. 75 (GASB 74 and 75) were unanimouslyadopted by the GASB Board. The disclosure requirements of GASB 74 and 75 will be similar to the disclosurerequirements for pension benefits under GASB Statement No. 67 and GASB Statement No. 68. GASB 74 relates toaccounting disclosures for plan sponsors and, as such, replaces GASB 43 beginning with fiscal years ending June30, 2017. GASB 75 relates to accounting disclosures for contributing employers and, as such, replaces GASB 45beginning with fiscal years ending June 30, 2018. GASB 74 and 75 will require applicable OPEB plan sponsorsand contributing employers to disclose the net OPEB liability on the statement of financial position and book anaccounting expense based upon the entry age normal actuarial cost method. Beyond the use of a specifiedactuarial cost method, GASB's new disclosure standards will also require the discount rate used to calculateliabilities to be based upon the yield of 20-year, tax-exempt municipal bonds and the expected rate of return onplan assets, to the extent plan assets are projected to be available for the payment of future benefits.Additionally, GASB 74 and 75 will bring about many other changes in the liability valuation and accountingdisclosure processes currently in place which are expected to significantly impact data collection, timing, andeffort. As details for the new GASB OPEB disclosure standards emerge, planning and coordination between plansponsors, contributing employers, actuaries, and auditors is recommended.

Teachers’ Retirement System of the State of Kentucky • Years Ended June 30, 2017 and 2016 145
ACTUARIAL SECTION
$ 3,563,584
17,0023,416
88,651 109,069
95,730
$ 13,339
Fiscal YearEnding
June 30, 2020
0.03 0.02
0.05
0.000.00
0.050.05
$ 3,563,584
1,706,56447,986
1,937,169 3,691,719
985,694
$ 2,706,025
Fiscal YearEnding
June 30, 2018
1.94 5.07
7.01
3.692.970.357.01
0000000000
Results of the ValuationJune 30, 2017
(In thousands of dollars)
PAYROLL
ACTUARIAL ACCRUED LIABILITY
Present value of prospective benefits payable in respect of:
(a) Present active members(b) Present terminated vested members(c) Present retired members and covered spouses(d) Total actuarial accrued liability
PRESENT ASSETS FOR VALUATION PURPOSES
UNFUNDED ACTUARIAL ACCRUED LIABILITY
CONTRIBUTIONS
NormalAccrued Liability
Total
MemberEmployer (ARC)State (ARC)
Total
%
%
%
%
%
%
%
%
Medical InsuranceFund
Life InsuranceFund
○
○
○
○
○
○
○
○
○
○
○
○
○
○
○
○
○
○
○
○
○
○
○
○
○
○
○
○
○
○
○
○
○
○
○
ValuationDate
(1)
ActiveMember
Contributions
n/an/an/an/an/an/an/an/an/an/a
6/30/20086/30/20096/30/20106/30/20116/30/20126/30/20136/30/20146/30/20156/30/20166/30/2017
(2)
Retirantsand
Beneficiaries
(3)Active
Members(EmployerFinancedPortion)
ValuationAssets (1) (2)
$ 3,084.43,203.71,948.61,910.12,046.72,001.81,771.91,982.21,950.91,985.1
671215172129324150
n/an/an/an/an/an/an/an/an/an/a
$ 185.9229.1241.2294.8338.7412.2508.9637.8795.1985.7
$ 3,350.23,251.01,258.21,513.11,547.91,519.31,422.81,543.41,683.21,706.6
(3)
Portion of AccruedLiabilities Covered by Assets
Medical Insurance FundSolvency Test
(In millions of dollars)
% %
SCHEDULE A

146 Teachers’ Retirement System of the State of Kentucky • Years Ended June 30, 2017 and 2016
ACTUARIAL SECTION
Development of the Actuarial Value of AssetsMedical Insurance Fund
June 30, 2017
(1) Actuarial Value of Assets Beginning of Year
(2) Market Value of Assets End of Year
(3) Market Value of Assets Beginning of Year
(4) Cash Flowa. Contributionsb. Benefit Paymentsc. Administrative Expensed. Net: (4)a - (4)b - (4)c
(5) Investment Incomea. Market total: (2) - (3) - (4)db. Assumed Ratec. Amount for Immediate Recognition:
[ (3) x (5)b ] + [ (4)d x (5)b x 0.5 ]d. Amount for Phased-In Recognition: (5)a - (5)c
(6) Phased-In Recognition of Investment Incomea. Current Year: 0.20 x (5)db. First Prior Yearc. Second Prior Yeard. Third Prior Yeare. Fourth Prior Yearf. Total Recognized Investment Gain
(7) Actuarial Value of Assets End of Year:(1) + (4)d + (5)c + (6)f
(8) Difference Between Market & Actuarial Values: (2) - (7)
(9) Rate of Return on Actuarial Value
ValuationDate
(1)
Active MemberContributions
n/an/an/an/an/an/an/an/an/an/a
6/30/20086/30/20096/30/20106/30/20116/30/20126/30/20136/30/20146/30/20156/30/20166/30/2017
(2)
RetirantsAnd
Beneficiaries
(3)Active
Members(EmployerFinancedPortion)
ValuationAssets (1) (2)
$ 66.972.074.472.275.278.181.082.789.092.1
100%100100100100100100100100100
n/an/an/an/an/an/an/an/an/an/a
$ 77.784.787.988.592.294.996.197.297.395.7
$ 17.418.417.715.916.216.216.316.017.117.0
(3)
Portion of AccruedLiabilities Covered by Assets
62 %6976
10310510493914921
Life Insurance FundSolvency Test
(In millions of dollars)
SCHEDULE B
Schedule A continued ...
))
)
)
$
$
795,055,116
963,269,031
733,780,967
367,137,197231,563,156
1,538,574134,035,467
95,452,597 8.00%
64,063,89631,388,701
6,277,740(12,827,105(7,773,8846,492,851
370,219(7,460,179
985,694,300
(22,425,269
6.57%

Teachers’ Retirement System of the State of Kentucky • Years Ended June 30, 2017 and 2016 147
ACTUARIAL SECTION
$ 97,268,990
87,777,405
90,990,928
1,049,6835,151,013
27,690(4,129,020
915,497 7.50%
6,669,481(5,753,984
(1,150,797(353,444(941,279(406,987
(1,226,477(4,078,984
95,730,467
$ (7,953,062
2.72%
Development of the Actuarial Value of AssetsLife Insurance Fund
June 30, 2017
(1) Actuarial Value of Assets Beginning of Year
(2) Market Value of Assets End of Year
(3) Market Value of Assets Beginning of Year
(4) Cash Flowa. Contributionsb. Benefit Paymentsc. Administrative Expensed. Net: (4)a - (4)b - (4)c
(5) Investment Incomea. Market total: (2) - (3) - (4)db. Assumed Ratec. Amount for Immediate Recognition:
[ (3) x (5)b ] + [ (4)d x (5)b x 0.5 ]d. Amount for Phased-In Recognition: (5)a - (5)c
(6) Phased-In Recognition of Investment Incomea. Current Year: 0.20 x (5)db. First Prior Yearc. Second Prior Yeard. Third Prior Yeare. Fourth Prior Yearf. Total Recognized Investment Gain
(7) Actuarial Value of Assets End of Year:(1) + (4)d + (5)c + (6)f
(8) Difference Between Market & Actuarial Values: (2) - (7)
(9) Rate of Return on Actuarial Value
Schedule B continued ...
)
)
))))))
)

148 Teachers’ Retirement System of the State of Kentucky • Years Ended June 30, 2017 and 2016
ACTUARIAL SECTION
RECEIPTS FOR THE YEAR Contributions
Members StatutoryPayment by Retired Members
TOTAL MEMBERS
State Statutory ContributionsEmployer ContributionsState Statutory - Transition Fund/KEHP
TOTAL EMPLOYER
GRAND TOTAL
Recovery IncomeNet Investment Income
TOTAL
DISBURSEMENTS FOR THE YEARAdministrative ExpenseMedical Insurance Expense
TOTAL
EXCESS OF RECEIPTS OVER DISBURSEMENTS
RECONCILIATION OF ASSET BALANCES
Asset Balance as of the Beginning of the YearExcess of Receipts over Disbursements
Asset Balance as of the End of the Year
Medical Insurance FundSummary of Receipts & Disbursements
(Market Value)
For the Year EndingJune 30, 2017
$ 128,819,243 57,941,968186,761,211
22,042,563104,879,255
53,454,168180,375,986
367,137,197
095,452,597
462,589,794
1,538,574 231,563,156
233,101,730
229,488,064
733,780,967 229,488,064
$ 963,269,031
June 30, 2016
$ 128,068,782 56,296,433184,365,215
21,824,740104,271,120
52,542,510178,638,370
363,003,585
43,328,335 (9,332,490396,999,430
1,686,070 288,494,763
290,180,833
106,818,597
626,962,370106,818,597
$ 733,780,967
SCHEDULE C
)

Teachers’ Retirement System of the State of Kentucky • Years Ended June 30, 2017 and 2016 149
ACTUARIAL SECTION
RECEIPTS FOR THE YEARContributions
MembersStateEmployer
TOTAL
Net Investment IncomeTOTAL
DISBURSEMENTS FOR THE YEARBenefit PaymentsRefunds to MembersMedical Insurance PaymentsMiscellaneous, including expenses
TOTAL
EXCESS OF RECEIPTS OVER DISBURSEMENTS
RECONCILIATION OF ASSET BALANCESAsset Balance as of the Beginning of the YearExcess of Receipts over Disbursements
Asset Balance as of the End of the Year
Life Insurance FundSummary of Receipts & Disbursements
(Market Value)
June 30, 2016
0 872,990 164,779 1,037,769
4,829,336 5,867,105
4,595,48900
27,195 4,622,684
1,244,421
89,746,507 1,244,421
$ 90,990,928
For the Year EndingJune 30, 2017
0 881,703 167,980 1,049,683
915,497 1,965,180
5,151,01300
27,690 5,178,703
(3,213,523)
90,990,928 (3,213,523)
$ 87,777,405
SCHEDULE DStatement of Actuarial Assumptions and Methods
The rates of retirement, disability, mortality, termination, salary increases, and rates of future benefitparticipation used in the valuation were selected based on the actuarial experience study prepared as of June 30,2015, submitted to and adopted by the Board on September 19, 2016. The health care cost trend rates, and expectedplan costs were determined by the actuary based on recent experience.
Valuation Date: June 30, 2017
Discount Rate: 8.0% per annum, compounded annually for Medical Insurance Fund.7.5% per annum, compounded annually for Life Insurance Fund.
Schedule C continued ...
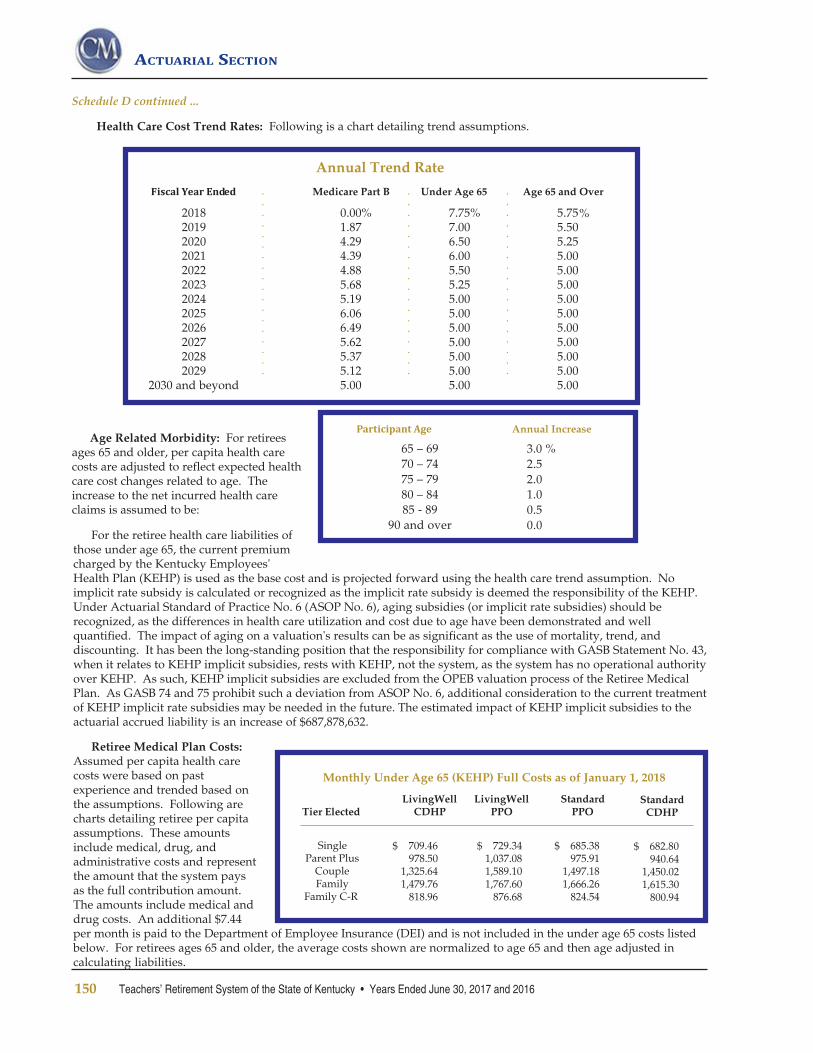
150 Teachers’ Retirement System of the State of Kentucky • Years Ended June 30, 2017 and 2016
ACTUARIAL SECTION
65 – 6970 – 7475 – 7980 – 8485 - 89
90 and over
Participant Age Annual Increase
3.0 %2.52.01.00.50.0
201820192020202120222023202420252026202720282029
2030 and beyond
Fiscal Year Ended Medicare Part B
5.755.505.255.005.005.005.005.005.005.005.005.005.00
Under Age 65○
○
○
○
○
○
○
○
○
○
○
○
○
○
○
○
○
○
Annual Trend Rate
Age 65 and Over
7.75%7.006.506.005.505.255.005.005.005.005.005.005.00
○
○
○
○
○
○
○
○
○
○
○
○
○
○
○
○
○
○
○
○
○
○
○
○
○
○
○
○
○
○
○
○
○
○
○
○
0.00%1.874.294.394.885.685.196.066.495.625.375.125.00
Age Related Morbidity: For retireesages 65 and older, per capita health carecosts are adjusted to reflect expected healthcare cost changes related to age. Theincrease to the net incurred health careclaims is assumed to be:
Schedule D continued ...
Health Care Cost Trend Rates: Following is a chart detailing trend assumptions.
Tier Elected
Single Parent Plus
Couple Family
Family C-R
$ 709.46978.50
1,325.641,479.76
818.96
LivingWellCDHP
LivingWellPPO
StandardPPO
$ 729.341,037.081,589.101,767.60
876.68
$ 685.38975.91
1,497.181,666.26
824.54
Monthly Under Age 65 (KEHP) Full Costs as of January 1, 2018
StandardCDHP
$ 682.80940.64
1,450.021,615.30
800.94
For the retiree health care liabilities ofthose under age 65, the current premiumcharged by the Kentucky Employees'Health Plan (KEHP) is used as the base cost and is projected forward using the health care trend assumption. Noimplicit rate subsidy is calculated or recognized as the implicit rate subsidy is deemed the responsibility of the KEHP.Under Actuarial Standard of Practice No. 6 (ASOP No. 6), aging subsidies (or implicit rate subsidies) should berecognized, as the differences in health care utilization and cost due to age have been demonstrated and wellquantified. The impact of aging on a valuation's results can be as significant as the use of mortality, trend, anddiscounting. It has been the long-standing position that the responsibility for compliance with GASB Statement No. 43,when it relates to KEHP implicit subsidies, rests with KEHP, not the system, as the system has no operational authorityover KEHP. As such, KEHP implicit subsidies are excluded from the OPEB valuation process of the Retiree MedicalPlan. As GASB 74 and 75 prohibit such a deviation from ASOP No. 6, additional consideration to the current treatmentof KEHP implicit rate subsidies may be needed in the future. The estimated impact of KEHP implicit subsidies to theactuarial accrued liability is an increase of $687,878,632.
Retiree Medical Plan Costs:Assumed per capita health carecosts were based on pastexperience and trended based onthe assumptions. Following arecharts detailing retiree per capitaassumptions. These amountsinclude medical, drug, andadministrative costs and representthe amount that the system paysas the full contribution amount.The amounts include medical anddrug costs. An additional $7.44per month is paid to the Department of Employee Insurance (DEI) and is not included in the under age 65 costs listedbelow. For retirees ages 65 and older, the average costs shown are normalized to age 65 and then age adjusted incalculating liabilities.
%

Teachers’ Retirement System of the State of Kentucky • Years Ended June 30, 2017 and 2016 151
ACTUARIAL SECTION
20082009201020112012201320142015201620172018
CalendarYear
$ 484545594626622635679669681680688
Under Age 65(KEHP)
Contributions
278301373289270294290240260252258
Age 65 & Over(MEHP)
Full Costs
○
○
○
○
○
○
○
○
○
○
○
○
○
○
○
○
○
○
○
○
○
Average Monthly TRS Full Costs & Contributions
Age 65 & Over(MEHP)
Contributions
2783011
3731
2891
2702
2942
2902
2402
2602
2522
2582
1 Under GASB 45, cost reductions for the amount of the Medicare Part D Retiree Drug Subsidy cannot be taken into account in the gross costcalculations.
2 2,257 current, Medicare-eligible benefit recipients have been identified by the client to be ineligible for premium-free Medicare Part A benefits. Forthese individuals, the full cost of coverage is, on average, $575 per month. It is assumed 9% of current retirees under the age of 65 who were hiredprior to 4/1/1986 will be ineligible for premium-free Medicare Part A benefits upon reaching Medicare eligibility (age 65) and 0% of these retireeswill cover a spouse. All active members are assumed to have begun contributing to Medicare as of 4/1/1986 and are assumed eligible for premium-free Medicare Part A benefits.
$
○
○
○
○
○
○
○
○
○
○
○
○
○
○
○
○
○
○
○
○
○
○
○
○
○
○
○
○
○
○
○
○
○
○
○
○
○
○
○
○
○
○
$
Current Retiree Medical Plan Participation: Actual census data and current plan elections (including waivers)provided by the system were used for those retirees currently participating in the Retiree Medical Plan. Currentparticipants are assumed to maintain their current Retiree Medical Plan coverage until they are no longer eligible.
Anticipated Retireee Medical Plan Participation: The assumed annual rates of health care plan participation forfuture retirees are as follows:
Anticipated Retiree Medical Plan Elections: Theassumed rates of plan election for future retireesparticipating in the KEHP plans are provided in thefollowing table. As the assumed plan election rates areestimates and actual results may be materiallydifferent, this assumption will need to be revised asexperience evolves.
20 %497091919191
20%204161768491
5-9.9910-14.9915-19.9920-24.9925-25.9926-26.99
27 or more
Not Eligible Not Eligible
41%61768491
Years ofService
Entered TRSBefore
7/1/2002
Entered TRS After6/30/2002 &
Before 7/1/2008
Entered TRSAfter
6/30/2008
Member Participation
42% 12%
StandardPPO
StandardCDHP
43%
LivingWellPPO
LivingWellCDHP
3%
Schedule D continued ...

152 Teachers’ Retirement System of the State of Kentucky • Years Ended June 30, 2017 and 2016
ACTUARIAL SECTION
Spouse Coverage in Medical Plans: Actual census data and current plan elections were used for MEHP andKEHP covered spouses (including beneficiaries) of current retirees. For spouses of future retirees, 25% of future maleretirees are assumed to cover their spouse and 15% of future female retirees are assumed to cover their spouse. Maleretirees are assumed to be three years older than their spouse and female retirees are assumed to be one year youngerthan their spouse.
Disabled Dependent Children in Retiree Medical Plan: The liability associated with disabled dependentchildren was determined to be de minimis and was therefore excluded from this valuation.
Withdrawal Assumption: Future vested members who terminate employment prior to retirement are assumed toelect to withdraw their contributions based upon their age and service at termination of employment as follows:
All vested members whoterminate employment prior toretirement are assumed to elect towithdraw their contributions priorto receiving a pension benefit basedupon their service as follows:
All vested members whoterminate employment prior toretirement and who are assumed to elect to receive a pension benefit are assumed to begin receiving their benefit atage 60.
Payroll Growth: 3.50% per annum, compounded annually.
Price Inflation: 3.00% per annum, compounded annually.
Affordable Care Act (ACA): The impact of the Affordable Care Act (ACA) was addressed in this valuation.Review of the information currently available did not identify any specific provisions of the ACA that are anticipatedto significantly impact results. While the impact of certain provisions such as the excise tax on high-value healthinsurance plans beginning in 2020 (if applicable), mandated benefits and participation changes due to the individualmandate should be recognized in the determination of liabilities, overall future plan costs and the resulting liabilitiesare driven by the assumed rate of health care inflation (i.e., trend). The trend assumption forecasts the anticipatedincrease to initial per capita costs, taking into account health care cost inflation, increases in benefit utilization,government-mandated benefits, and technological advances. Given the uncertainty regarding the ACA'simplementation (e.g., the impact of excise tax on high-value health insurance plans, changes in participation resultingfrom the implementation of state-based health insurance exchanges), continued monitoring of the ACA's impact onthe Retiree Medical Plan's liability will be required.
Asset Valuation Method: Five-year market related actuarial value, as developed in Schedule B. The actuarialvalue of assets recognizes a portion of the difference between the market value of assets and the expected actuarialvalue of assets, based on the ultimate assumed valuation rate of return. The amount recognized each year is 20% ofthe difference between market value and expected actuarial value. The ultimate assumed valuation rate of return isassumed to be 8.00% for the Medical Insurance Fund and 7.50% for the Life Insurance Fund.
Actuarial Cost Method: The valuation is prepared on the projected benefit basis, under which the present value,at the interest rate assumed to be earned in the future, of each active member's expected benefit at retirement or deathis determined, based on his/her age, service, and gender. The calculations take into account the probability of a
Schedule D continued ...
10 - 15
15%
10%
15+
10%
10%
5 - 10
20%
10%
Age at Terminationof Employment
Under Age 55
Ages 55+
Rates of Withdrawal Upon Termination of Employment
Years of Service
15 - 27
10%
27+
25%
10 - 15
15%
Rates of Withdrawal Prior to Receiving a Pension Benefit
Years of Service
5 - 10
25%

Teachers’ Retirement System of the State of Kentucky • Years Ended June 30, 2017 and 2016 153
ACTUARIAL SECTION
Schedule D continued ...
0 - 4
11.00%11.0011.0012.0012.0012.0014.0015.0015.0015.0015.0020.0020.00
0.75
5 - 9
3.00%3.003.504.504.504.504.504.003.803.500.000.00
10+
3.00%1.401.401.301.902.402.402.402.400.000.00
Males: Annual Rate of . . .
20253035404550556062657075
0.019%0.0210.0250.0430.0600.0840.1190.2020.3400.4190.5650.9131.556
0.01%0.010.010.040.090.200.300.580.750.750.750.750.75
○
○
○
○
○
○
○
○
○
○
○
○
○
○
○
○
○
○
○
○
○
○
○
○
○
○
○
○
○
○
○
○
○
○
○
○
○
○
○
○
○
○
○
○
○
○
○
○
○
○
○
○
○
○
○
○
○
○
○
○
○
○
○
○
○
○
○
○
○
○
○
○
○
○
○
○
○
○
○
○
○
○
○
○
○
○
○
○
○
○
○
○
○
○
○
○
○
○
○
○
○
○
○
○
○
○
○
○
○
○
○
○
○
○
○
○
○
○
○
○
○
○
○
○
○
○
○
○
○
○
○
○
○
○
○
○
○
○
○
○
○
○
○
○
○
○
○
○
○
○
○
○
○
○
○
○
○
○
○
○
○
○
○
○
○
○
○
○
○
○
○
○
○
○
○
○
○
○
○
○
○
○
○
○
○
○
○
○
○
○
○
○
DISABILITYAGE DEATH
RETIREMENT
Before 27 Yearsof Service
5.0%13.015.020.020.0
100.0
After 27 Yearsof Service**
17.0%17.045.035.025.025.020.0
100.0
WITHDRAWAL
YEARS OF SERVICE
7.20%6.405.404.704.203.803.703.503.503.503.503.503.50
SALARY*
○
○
○
○
○
○
○
○
○
○
○
○
○
○
○
○
○
○
○
○
○
○
○
○
○
○
○
○
○
○
○
○
○
○
○
○
○
○
○
○
○
○
○
○
○
○
○
○
0 - 4
9.00%9.00
12.0012.0012.0013.0013.0015.0015.0015.0015.0015.0015.00
5 - 9
4.00%4.004.004.004.005.005.005.004.604.000.000.00
10+
1.65%1.501.301.201.502.002.002.002.000.000.00
20253035404550556062657075
0.007%0.0080.0100.0180.0260.0420.0620.0960.1570.1970.2870.4950.831
0.01%0.010.030.060.120.250.440.650.850.850.850.850.85
DISABILITYAGE DEATH
RETIREMENT
Before 27 Yearsof Service
5.5%14.014.022.020.0
100.0
After 27 Yearsof Service**
15.0%18.050.040.040.035.035.0
100.0
WITHDRAWAL
YEARS OF SERVICE
* Includes wage inflation at 3.5% per annum.** Plus 7.5% in year when first eligible for unreduced retirement with 27 years of service.
7.20%6.405.404.704.203.803.703.503.503.503.503.503.50
SALARY*
member's death or termination of employment prior to becoming eligible for a benefit, as well as the possibility of his/her terminating with a service, disability or survivor's benefit. The present value of the expected benefits payable onaccount of the active members is added to the present value of the expected future payments to retired members andbeneficiaries and deferred vested members to obtain the present value of all expected benefits payable from the systemon account of the present group of members and beneficiaries.
The employer contributions required to support the benefits of the system are determined following a level fundingapproach, and consist of a normal contribution and an accrued liability contribution.
The normal contribution is determined using the "entry age normal" method. Under this method, a calculation ismade to determine the uniform and constant percentage rate of employer contribution which, if applied to thecompensation of the average new member during the entire period of his/her anticipated covered service, would berequired in addition to the contributions of the member to meet the cost of all benefits payable on his/her behalf.
The unfunded accrued liability is determined by subtracting the present value of prospective employer normalcontributions and member contributions, together with the current actuarial value of assets held, from the present valueof expected benefits to be paid from the system.
Separations from Service: Representative values of the assumed annual rates of salary increases, death, disability,withdrawal, service retirement and early retirement are as follows:
Females: Annual Rate of . . .

154 Teachers’ Retirement System of the State of Kentucky • Years Ended June 30, 2017 and 2016
ACTUARIAL SECTION
Deaths After Retirement: The RP-2000 Combined Mortality Table projected to 2025 using scale BB (set forward twoyears for males and one year for females) is used for death after service retirement and beneficiaries. The RP-2000Disabled Mortality Table (set forward two years for males and seven years for females) is used for death after disabilityretirement. There is a margin for future mortality improvement in the tables used by the system. Based on the resultsof the most recent experiencestudy adopted by the Board onSeptember 19, 2016, thenumbers of expected futuredeaths are 15-19% less than theactual number of deaths thatoccurred during the studyperiod for healthy retirees and13-17% less than expectedunder the selected table fordisabled retirees.Representative values of theassumed annual rates of deathafter service retirement andafter disability retirement areshown here:
Schedule D continued ...
Eligibility for Access to Retiree Medical Coverage
Service Retirement: For employees hired prior to July 1, 2008, Retiree Medical Plan coverage eligibility is attainedwhen an employee retires, which is possible after the completion of 27 years of service or attainment of age 55 and 5years of service. For employees hired on or after July 1, 2008, employees may retire after the completion of 27 years ofservice, the attainment of age 55 and 10 years of service, or the attainment of age 60 and 5 years of service, but mustcomplete a minimum of 15 years of service to be eligible for Retiree Medical Plan coverage.
Disability Retirement: Disabled employees hired prior to July 1, 2008 with at least 5 years of service, who are totallyand permanently incapable of being employed as a teacher, are eligible for Retiree Medical Plan coverage. Disabledemployees hired after July 1, 2008 must have 15 years of service to be eligible for Retiree Medical Plan coverage.
Members and dependents under age 65 and eligible for Medicare due to a disability after January 1, 2013 arerequired to be covered under MEHP. Under age 65 members who retired prior to Jan. 1, 2013, are grandfathered fromthis requirement and allowed a choice of KEHP or MEHP coverage. Actual census data and current plan elections wereused for current disabled retirees. Until sufficient experience emerges, the valuation conservatively assumes all futuredisabled members under the age of 65 will be covered under KEHP.
Survivors: Spouses of employees who die in service while eligible to retire, as well as survivors of service and disabledretirees, are eligible for Retiree Medical Plan coverage.
Termination: For employees hired prior to July 1, 2008 and who terminated with at least 5 years of service, RetireeMedical Plan coverage eligibility is attained at age 60. For employees hired on or after July 1, 2008 and who terminatedwith at least 15 years of service, Retiree Medical Plan coverage eligibility is attained at age 60.
Reemployed Retirees: Retirees who return to work in an agency that participates in KEHP are required to terminatetheir coverage through the system. Additionally, if a retiree returns to work somewhere that does not participate in theKEHP, but offers health insurance, the retiree must terminate system coverage unless the employer coverage is of lesservalue. For valuation purposes, active employees identified as currently receiving retiree health care through the systemare valued as retirees.
SCHEDULE ESummary of Main Plan Provisions as Interpreted for Valuation Purposes
Annual Rate of Death After . . .○
○
○
○
○
○
○
○
○
○
○
○
○
○
○
○
○
○
○
○
○
○
○
○
○
○
○
○
○
○
○
○
○
○
○
○
○
○
Service Retirement Disability Retirement
Age
4550556065707580859095
MALE
0.1609%0.24740.42460.69851.13001.86973.21475.51609.5631
17.278727.1263
FEMALE
0.1135%0.17180.26580.44090.81001.37392.28993.75516.3873
11.247618.1190
MALE
2.3306%2.92793.44003.58813.82754.75666.31538.3527
10.912217.278727.1263
FEMALE
1.2482%1.56501.78072.31643.16874.40326.08578.4679
12.757219.471824.2074

Teachers’ Retirement System of the State of Kentucky • Years Ended June 30, 2017 and 2016 155
ACTUARIAL SECTION
5 - 9.9910 - 14.9915 - 19.9920 - 24.9925 - 25.9926 - 26.99
27 or more
Years ofService
30%2010 0
0 0 0
Hired before7/1/2002: Age 65 orOlder and Covered
Before 1/1/2005
90%7555351050
Hired before7/1/2002: Age 65
After or CoveredAfter 12/31/2004
○
○
○
○
○
○
○
○
○
○
○
○
Retiree Percentage Contribution*
Entered TRSAfter 6/30/2002 and
Before 7/1/2008
75%50250000
○
○
○
○
○
○
○
○
○
○
○
○
○
○
○
○
○
○
○
○
○
○
○
○
Not Eligible Not Eligible
55%3510 50
Entered TRSAfter 6/30/2008
July 1, 2010 January 1, 2011
July 1, 2011 January 1, 2012
July 1, 2012January 1, 2013January 1, 2014January 1, 2015January 1, 2016January 1, 2017January 1, 2018
Effective Date
$ 110.50115.40115.4099.9099.90
104.90104.90104.90121.80134.00134.00
Medicare Part BMonthly Cost
$ 37.0039.0077.0066.0099.90
104.90104.90104.90121.80134.00134.00
Formula○
○
○
○
○
○
○
○
○
○
○
○
○
○
○
○
Monthly Under Age 65 Shared Responsibility Contribution Timeline
Shared ResponsibilityContribution
(1/3 x $110.50)(1/3 x 115.40)(2/3 x 115.40)(2/3 x 99.90)
99.90104.90104.90104.90121.80134.00134.00
○
○
○
○
○
○
○
○
○
○
○
○
○
○
○
○
○
○
○
○
○
○
○
○
○
○
○
○
○
○
○
TierElected
Single Parent Plus
Couple Family
Family Cross-Reference
$ 660.04851.84
1,029.021,131.64
738.64
LivingWellCDHP
LivingWellPPO
StandardPPO
$ 646.96802.26
1,060.741,105.34
719.12
$ 635.46847.99
1,197.601,314.66
743.42
Monthly Retiree Contribution Rate BasisEffective January 1, 2018
Under Age 65 (KEHP)
StandardCDHP
$ $ 656.60878.24
1,189.961,303.24
771.84
Ages 65and Older(MEHP)
$ 258.00n/an/an/an/a
Retiree Years of Service Percentage Contribution: Retirees contribute the following percentages based on years ofservice at retirement, which are then applied to the Retiree Contribution Rate Basis:
○
○
○
○
○
○
○
○
○
○
○
○
Schedule E continued ...
* 0% for disabled retirees that retired prior to 1/1/2002.
COVERED MEMBER RETIREE MEDICAL PLAN CONTRIBUTIONS
Under Age 65 Retiree Shared Responsibility Contribution: Effective July 1, 2010, retirees under the age of 65 began athree-year phase-in of the Shared Responsibility Contribution. This contribution reduces the applicable amount of thefull contribution provided by the system to retirees, by adjusting the Shared Responsibility Contribution amount by100% less the appropriate percentage from the Retiree Percentage Contribution table below. Effective July 1, 2012, thefull Shared Responsibility Contribution equals the Standard Medicare Part B premium paid by retirees ages 65 and older.

156 Teachers’ Retirement System of the State of Kentucky • Years Ended June 30, 2017 and 2016
ACTUARIAL SECTION
Under Age 65 Retiree Plan Cost Contribution: An additional contribution according to the table below is required tobe paid by retirees under the age of 65 based upon the plan elected and the date of retirement:
TierElected
Single Parent Plus
Couple Family
Family Cross-Reference
$ 49.42126.66296.62348.1280.32
LivingWellCDHP
LivingWellPPO
StandardPPO
$ 82.38234.82528.36662.26157.56
$ 49.92127.92299.58351.6081.12
Monthly Under Age 65 Plan Cost Contribution*Effective January 1, 2018
StandardCDHP
$ 26.2062.40
260.06312.0629.10
Schedule E continued ...
Spouse Contributions: 100% of the full cost for non-Medicare eligible dependents is paid through a combination ofpayments from beneficiaries and the state. Spouses of current post-65 retirees and surviving spouses of deceasedretirees with a date of death on or after July 1, 2002 pay 100% of the full contribution. Spouses of active members whodied while eligible to retire prior to July 1, 2002, are provided the same subsidy by the system that would have beenprovided to the retiree for the lifetime of the spouse, or until remarriage. Spouses of active members who die whileeligible to retire on or after July 1, 2002 later pay 100% of the full contribution.
System Retiree Medical Plan Contributions: The system contribution rate basis is determined annually by thesystem; and the full cost is projected based on historical claims data. For retirees, the following percentages are basedon years of service at retirement and are then applied to the contribution rate basis:
* Does not include the additional contribution required to be paid by retirees under the age of 65 whouse tobacco ($40 for Single or Family Cross-Reference, and $80 for Parent Plus, Couple or Family).
TierElected
SingleParent Plus
$ 716.90985.94
LivingWellCDHP
LivingWellPPO
StandardPPO
$ 736.781,044.52
$ 692.82983.35
Monthly Surviving Spouse ContributionEffective January 1, 2018
Under Age 65 (KEHP)
StandardCDHP
$ 690.24948.08
Age 65 andOlder
(MEHP)
$ 258.00n/a
5 - 9.9910 - 14.9915 - 19.9920 - 24.9925 - 25.9926 - 26.99
27 or more
Yearsof
Service
70 %8090
100100100100
Entered TRS Before7/1/2002: Age 65 orOlder & CoveredBefore 1/1/2005
102545659095100
Entered TRS Before7/1/2002: Age 65
After or CoveredAfter 12/31/2004
○
○
○
○
○
○
○
○
○
○
○
○
Percentage of System Contribution Rate Provided to Retirees*
Entered TRS After6/30/2002 and
Before 7/1/2008
25 %5075
100100100100
○
○
○
○
○
○
○
○
○
○
○
○
○
○
○
○
○
○
○
○
○
○
○
○
Not Eligible Not Eligible
45%659095
100
Entered TRSAfter
6/30/2008○
○
○
○
○
○
○
○
○
○
○
○
%
* 100% for disabled retirees that retired prior to 1/1/2002.

Teachers’ Retirement System of the State of Kentucky • Years Ended June 30, 2017 and 2016 157
ACTUARIAL SECTION
Life Insurance Plan Benefits:(1) Effective July 1, 2000, the Teachers' Retirement System shall:
(a) Provide a life insurance benefit in a minimum amount of five thousand dollars ($5,000) for itsmembers who are retired for service or disability. This life insurance benefit shall be payable uponthe death of a member retired for service or disability to the member’s estate or to a party designatedby the member on a form prescribed by the retirement system; and
(b) Provide a life insurance benefit in a minimum amount of two thousand dollars ($2,000) for its activecontributing members. This life insurance benefit shall be payable upon the death of an activecontributing member to the member's estate or to a party designated by the member on a formprescribed by the retirement system.
Note: Members employed on a substitute or part-time basis and working at least 69% of a full contract year in a singlefiscal year will be eligible for a life insurance benefit for the balance of the fiscal year or the immediately succeedingfiscal year under certain conditions. For non-vested members employed on a substitute or part-time basis, the lifeinsurance benefit is provided if death occurs as the result of a physical injury on the job. For vested members employedon a substitute or part-time basis, death does not have to be the result of a physical injury on the job for life insurancebenefits to be provided.
Active Member Retiree Medical Plan Contributions: Actively employed members make payroll contributions tothe Medical Insurance Fund based upon the following schedule:
Hired Before7/1/2008
Hired on orAfter
7/1/2008
Active Member Percentage of Payroll Contribution Made to Medical Insurance Fund
2.775 % 2.775 % 3.750 % 3.750% 3.750 % 3.750 %
HiredBefore
7/1/2008
Hired on orAfter
7/1/2008
HiredBefore
7/1/2008
Hired on orAfter
7/1/2008
UNIVERSITYEMPLOYEES
SCHOOL DISTRICTEMPLOYEES (Non-Federal)
OTHEREMPLOYEES
○
○
○
○
○
○
○
○
○
○
○
○
○
○
○
○
○
○
○
○
○
○
Schedule E continued ...
TierElected
LivingWellCDHP
LivingWellPPO
StandardPPO
Monthly System Contribution Rate BasisEffective January 1, 2018Under Age 65 (KEHP)*
StandardCDHP
Ages 65and Older(MEHP)
* Irrespective of a participating retiree's service, an additional $7.44 per month is paid by the system to the Department ofEmployee Insurance (DEI) for KEHP coverage.
Single Parent Plus
Couple Family
Family Cross-Reference
$ 660.04851.84
1,029.021,131.64
738.64
$ 646.96802.26
1,060.741,105.34
719.12
$ 635.46847.99
1,197.601,314.66
743.42
$ 656.60878.24
1,189.961,303.24
771.84
$ 258.00n/an/an/an/a

158 Teachers’ Retirement System of the State of Kentucky • Years Ended June 30, 2017 and 2016
ACTUARIAL SECTION
SCHEDULE FTable 1: Age - Service Table
Distribution of Active Members as of June 30, 2017by Age and Service Groups
Average Age: 43.5 Average Service: 10.8
24 & underTotal PayAvg. Pay
25 to 29Total PayAvg. Pay
30 to 34Total PayAvg. Pay
35 to 39Total PayAvg. Pay
40 to 44Total PayAvg. Pay
45 to 49Total PayAvg. Pay
50 to 54Total PayAvg. Pay
55 to 59Total PayAvg. Pay
60 to 64Total PayAvg. Pay
65 & overTotal PayAvg. Pay
TotalTotal PayAvg. Pay
0 to 4
3,12468,700,220
21,991
5,751198,454,302
34,508
2,84890,403,505
31,743
2,29565,212,518
28,415
1,76046,610,992
26,484
1,43636,545,406
25,449
1,21825,538,756
20,968
1,51022,703,041
15,035
1,80122,241,812
12,350
2,17618,334,805
8,426
23,919594,745,357
24,865
5 to 9
136,41736,417
1,74385,098,224
48,823
4,611233,923,522
50,732
2,148109,964,711
51,194
1,43774,259,161
51,677
1,14158,561,919
51,325
66633,551,742
50,378
44119,579,701
44,398
33913,685,508
40,370
50511,267,510
22,312
13,032639,928,415
49,104
10 to 14
7334,90047,843
1,63494,411,429
57,779
4,704281,588,809
59,862
2,082124,959,603
60,019
1,56392,906,582
59,441
98759,055,800
59,834
63737,444,127
58,782
31919,054,170
59,731
1468,493,619
58,175
12,079718,249,039
59,463
15 to 19
4227,63356,908
1,35086,949,175
64,407
4,055269,604,678
66,487
2,184141,902,471
64,974
1,26081,571,155
64,739
90557,909,611
63,989
53535,872,033
67,051
18612,919,583
69,460
10,478686,956,339
65,562
20 to 24
5337,00667,401
1,03072,709,546
70,592
3,465242,973,570
70,122
1,491103,905,594
69,689
1,00971,553,184
70,915
51337,662,676
73,417
17512,962,784
74,073
7,689542,104,360
70,504
25 to 29
3214,42471,475
99573,378,613
73,747
1,787133,441,307
74,673
76159,400,531
78,056
34126,514,686
77,756
13711,860,877
86,576
4,024304,810,438
75,748
30 to 34
187,28387,283
36827,737,810
75,374
25222,546,672
89,471
888,020,781
91,145
686,223,797
91,526
77764,616,343
83,161
>= 35
2137,17568,588
302,780,424
92,681
484,303,664
89,660
524,952,788
95,246
13212,174,051
92,228
TOTAL
3,12568,736,637
21,996
7,501283,887,426
37,847
9,097418,966,089
46,055
10,502544,052,219
51,805
10,367588,358,404
56,753
10,785646,355,844
59,931
7,779464,939,339
59,769
5,545293,917,291
53,006
3,984167,355,330
42,007
3,44587,015,763
25,259
72,1303,563,584,342
49,405
Completed Years of ServiceAttainedAge

Teachers’ Retirement System of the State of Kentucky • Years Ended June 30, 2017 and 2016 159
ACTUARIAL SECTION
72,13071,84872,24673,40774,83175,95176,34976,38775,93775,539
2017201620152014201320122011201020092008
ValuationDate June 30 Number
AnnualPayroll
AnnualAverage
Pay
PercentageIncrease in
Average Pay
$ 3,563,584,3423,537,226,3483,515,113,1273,486,326,7993,480,066,4063,479,567,0043,451,756,2873,321,614,2233,253,076,6003,190,332,239
$ 49,40549,23248,65547,49346,50645,81345,21043,48442,83942,234
0.35 %1.192.452.121.511.333.971.511.436.67
Table 2 – Schedule of Active Member Valuation Data
Under 3030-3435-3940-4445-4950-5455-59
60 & OverTotal
AttainedAge
179
288294322282204248
1,718
Number ofMales
Number ofFemales
TotalNumber
0354900940
1,116974782626
5,692
1433
1,1881,2341,4381,256
986874
7,410
Table 3 – Eligible Deferred Vested Membersas of June 30, 2017
Medical Insurance FundMale & Female Demographic Breakdown
Under 3030-3435-3940-4445-4950-5455-59
60 & OverTotal
AttainedAge
Number ofMales
Number ofFemales
TotalNumber
46645
1,0301,0511,2161,045
833656
6,522
62814
1,3711,3891,5611,3551,055
9188,525
Table 4 – Eligible Deferred Vested Membersas of June 30, 2017
Life Insurance FundMale & Female Demographic Breakdown
Schedule F continued ...
16169341338345310222262
2,003

160 Teachers’ Retirement System of the State of Kentucky • Years Ended June 30, 2017 and 2016
ACTUARIAL SECTION
Under 4040-4445-4950-5455-5960-6465-6970-7475-7980-8485-8990-9495-99100101102103104
105 & OverTotal
AttainedAge
32277
3981,1362,4613,7773,2271,9931,271
60721150110100
15,236
Number ofMales
Number ofFemales
TotalNumber
1646
194952
2,8185,5858,1895,7393,4852,1141,409
6771871165
1115
31,450
1968
2711,3503,9548,046
11,9668,9665,4783,3852,016
8882371275
1215
46,686
Table 5 – All Retirees & Spouses Receiving Health Care Benefitsas of June 30, 2017
Male & Female Demographic Breakdown
Table 6 – Retirees, Beneficiaries and Survivors Added To and Removed From Rolls *Medical Insurance Fund
201220132014201520162017
FiscalYear
Ending June 30
1,9961,8531,6631,9902,0451,835
702664638731726699
2,6982,5172,3012,7212,7712,534
1,0291,0761,1651,1901,3051,153
616619660633674691
1,6451,6951,8251,8231,9791,844
36,00036,77737,27538,07538,81539,497
7,0087,0537,0317,1297,1817,189
43,00843,83044,30645,20445,99646,686
Numberof
MembersAddedto Rolls
Numberof
Spouses**Addedto Rolls
TotalNumberAddedto Rolls
Numberof
MembersRemoved
fromRolls
Numberof
Spouses**Removed
fromRolls
TotalNumberRemoved
fromRolls
Numberof
Memberson Rolls
at the Endof theYear
Numberof
Spouses**on Rolls
at the Endof theYear
TotalNumberon Rolls
at the Endof theYear
* Reflects members, spouses, and beneficiaries participating in a health care plan.** Includes spouses, beneficiaries, and surviving spouses.
○
○
○
○
○
○
○
○
○
○
○
○
○
○
○
○
○
○
○
○
○
○
○
○
○
○
○
○
○
○
○
○
○
○
○
○
○
○
○
○
○
○
○
○
○
○
○
○
○
○
○
○
○
○
○
○
Schedule F continued ...

Teachers’ Retirement System of the State of Kentucky • Years Ended June 30, 2017 and 2016 161
ACTUARIAL SECTION
Table 7 – Retirees, Beneficiaries and Survivors Added To and Removed From Rolls *Life Insurance Fund
201220132014201520162017
FiscalYear
EndingJune 30
2,3642,1951,9642,2702,3942,175
$ 11,82010,9759,820
11,35011,97010,875
880952954
1,641807
1,021
$ 4,4004,7604,7708,2054,0355,105
42,60243,84544,85545,48447,07148,225
$ 213,010 219,225
224,275227,420235,355241,125
3.61 %2.922.301.403.492.45
$ 5,000 5,000 5,000 5,000
5,0005,000
NumberAdded
toRolls
LifeInsurance
Benefit($1,000's)
NumberRemoved
fromRolls
LifeInsurance
Benefit($1,000's)
Numberon Rolls atthe End ofthe Year
LifeInsurance
Benefit($1,000's)
Increasein Life
InsuranceBenefit
AverageLife
InsuranceBenefit
* The life insurance benefit is payable upon the death of only members retired for service or disability. Numbers donot include life insurance benefits payable upon the death of an active contributing member.
○
○
○
○
○
○
○
○
○
○
○
○
○
○
○
○
○
○
○
○
○
○
○
○
○
○
○
○
○
○
○
○
○
○
○
○
○
○
○
○
○
○
○
○
○
Schedule F continued ...
○
○
○
○
○
○
○
○
○
○
○
○
○
○
○
Sensitivity AnalysisMedical Insurance Fund
as of June 30, 2017
The June 30, 2017 valuation results of the Medical Insurance Fund (MIF) are projections based on the actuarialassumptions. Actual experience will differ from these assumptions, either increasing or decreasing cost. The charts onthe following pages provide a simple analysis on how the costs are sensitive to changes to the assumed discount rate,the assumed inflation rate, the assumed rate of payroll growth, and the assumed rates of health care inflation (trend).The charts show the actuarial accrued liability, the unfunded liability, the funded ratio and the employer contributionrate under the following scenarios:
The discount rate assumption sensitivity analysis shows the valuation results with the baseline discount rateassumption, 8.00%, together with a decrease in the discount rate to 7.00% and an increase in the discount rate to 9.00%.Under this scenario, the underlying inflation rate assumption is held constant at 3.00% and the payroll growthassumption is held constant at 3.50%.
The inflation assumption sensitivity analysis shows the valuation results with the baseline underlyinginflation rate assumption, 3.00%, together with decreases in the inflation rate to 2.75% and 2.50%. Under this scenario,the decrease in the underlying inflation rate assumption leads to corresponding decreases in the discount rate, thepayroll growth assumption, and the assumed rates of salary increase for active members. The assumed decreases ininflation are not assumed to impact the assumed rates of health care inflation (trend).
The payroll growth assumption sensitivity analysis shows the valuation results with the baseline underlyingpayroll growth assumption, 3.50%, together with decreases in the payroll growth assumption to 2.00% and 0.00%.Under this scenario, all other assumptions, including the individual member salary scale, are held constant so that theonly impact is in the amortization of the unfunded liability, leading to higher employer contribution rates.
The health care inflation (trend) assumption sensitivity analysis shows the valuation results with the baselinetrend assumption along with a 1.00% increase in all assumed trend rates and a 1.00% decrease in all assumed trendrates.

162 Teachers’ Retirement System of the State of Kentucky • Years Ended June 30, 2017 and 2016
ACTUARIAL SECTION
DecreaseDiscount Rate
IncreaseDiscount
RateValuation
Results
Actuarial Accrued LiabilityActuarial Value of AssetsUnfunded LiabilityFunded Ratio
Contributions Normal Cost Accrued Liability Total
Member
Employer/State
Discount RatePayroll GrowthInflation Rate
$ 4,197,201985,694
$ 3,211,50723.5%
2.56%5.51%8.07%
(3.69%
4.38%
7.00%3.50%3.00%
$ 3,691,719985,694
$ 2,706,02526.7%
1.94%5.07%7.01%
(3.69%
3.32%
8.00%3.50%3.00%
$ 3,274,929985,694
$ 2,289,23530.1%
1.48%4.66%6.14%
(3.69%
2.45%
9.00%3.50%3.00%
ValuationResults
DecreaseInflation
Rate50 Basis Points
DecreaseInflation
Rate25 Basis Points
Actuarial Accrued LiabilityActuarial Value of AssetsUnfunded LiabilityFunded Ratio
Contributions Normal Cost Accrued Liability Total
Member
Employer/State
Discount RatePayroll GrowthInflation Rate
$ 3,691,719985,694
$ 2,706,02526.7%
1.94%5.07%7.01%
(3.69%
3.32%
8.00%3.50%3.00%
$ 3,823,936985,694
$ 2,838,24225.8%
2.06%5.32%7.38%
(3.69%
3.69%
7.75%3.25%2.75%
$ 3,964,092985,694
$ 2,978,39824.9%
2.19%5.59%7.78%
(3.69%
4.09%
7.50%3.00%2.50%
Sensitivity Analysis continued ...
Assumed Discount Rate Sensitivity Analysisas of June 30, 2017
(In thousands of dollars)
Inflation Assumption Sensitivity Analysisas of June 30, 2017
(In thousands of dollars)
) ) )
) ) )

Teachers’ Retirement System of the State of Kentucky • Years Ended June 30, 2017 and 2016 163
ACTUARIAL SECTION
Sensitivity Analysis continued ...
ValuationResults
No PayrollGrowth
DecreasePayrollGrowth
to 2%
Actuarial Accrued LiabilityActuarial Value of AssetsUnfunded LiabilityFunded Ratio
Contributions Normal Cost Accrued Liability Total
Member
Employer/State
Discount RatePayroll GrowthInflation Rate
$ 3,691,719985,694
$ 2,706,02526.7%
1.94%5.07%7.01%
(3.69%
3.32%
8.00%3.50%3.00%
$ 3,691,719985,694
$ 2,706,02526.7%
1.94%5.77%7.71%
(3.69%
4.02%
8.00%2.00%3.00%
$ 3,691,719985,694
$ 2,706,02526.7%
1.94%6.78%8.72%
(3.69%
5.03%
8.00%0.00%3.00%
Payroll Growth Assumption Sensitivity Analysisas of June 30, 2017
(In thousands of dollars)
) ) )
DecreaseTrendRates
100 Basis Points
IncreaseTrendRates
100 Basis PointsValuation
Results
Actuarial Accrued LiabilityActuarial Value of AssetsUnfunded LiabilityFunded Ratio
Contributions Normal Cost Accrued Liability Total
Member
Employer/State
Discount RatePayroll GrowthInflation Rate
$ 3,234,273985,694
$ 2,248,57930.5%
1.53%4.21%5.74%
(3.69%
2.05%
8.00%3.50%3.00%
$ 3,691,719985,694
$ 2,706,02526.7%
1.94%5.07%7.01%
(3.69%
3.32%
8.00%3.50%3.00%
$ 4,258,265985,694
$ 3,272,57123.1%
2.49%6.13%8.62%
(3.69%
4.93%
8.00%3.50%3.00%
Health Care Trend Assumption Sensitivity Analysisas of June 30, 2017
(In thousands of dollars)
) ) )

164 Teachers’ Retirement System of the State of Kentucky • Years Ended June 30, 2017 and 2016
ACTUARIAL SECTION
Sensitivity AnalysisLife Insurance Fundas of June 30, 2017
The June 30, 2017 valuation results of the Life Insurance Fund (LIF) are projections based on the actuarialassumptions. Actual experience will differ from these assumptions, either increasing or decreasing cost. The charts onthe following pages provide a simple analysis on how the costs are sensitive to changes to the assumed discount rate,the assumed inflation rate, and the assumed rate of payroll growth. The charts show the actuarial accrued liability, theunfunded liability, the funded ratio and the employer contribution rate under the following scenarios:
The discount rate assumption sensitivity analysis shows the valuation results with the baseline discount rateassumption, and 7.50% together with a decrease in the discount rate to 6.50% and an increase in the discount rate to8.50%. Under this scenario, the underlying inflation rate assumption is held constant at 3.00% and the payroll growthassumption is held constant at 3.50%.
The inflation assumption sensitivity analysis shows the valuation results with the baseline underlyinginflation rate assumption, 3.00%, together with decreases in the inflation rate to 2.75% and 2.50%. Under this scenario,the decrease in the underlying inflation rate assumption leads to corresponding decreases in the discount rate, thepayroll growth assumption, and the assumed rates of salary increase for active members.
The payroll growth assumption sensitivity analysis shows the valuation results with the baseline underlyingpayroll growth assumption, 3.50%, together with decreases in the payroll growth assumption to 2.00% and 0.00%.Under this scenario, all other assumptions, including the individual member salary scale, are held constant so that theonly impact is in the amortization of the unfunded liability, leading to higher employer contribution rates.
DecreaseDiscount Rate
IncreaseDiscount
RateValuation
Results
Actuarial Accrued LiabilityActuarial Value of AssetsUnfunded LiabilityFunded Ratio
Contributions Normal Cost Accrued Liability Total
Member
Employer/State
Discount RatePayroll GrowthInflation Rate
$ 123,58895,730
$ 27,85877.5%
0.04%0.04%0.08%
(0.00%
0.08%
6.50%3.50%3.00%
$ 109,06995,730
$ 13,33987.8%
0.03%0.02%0.05%
(0.00%
0.05%
7.50%3.50%3.00%
$ 97,17295,730
$ 1,44298.5%
0.02% 0.00%
0.02%
(0.00%
0.02%
8.50%3.50%3.00%
Assumed Discount Rate Sensitivity Analysisas of June 30, 2017
(In thousands of dollars)
) ) )

Teachers’ Retirement System of the State of Kentucky • Years Ended June 30, 2017 and 2016 165
ACTUARIAL SECTION
ValuationResults
DecreaseInflation
Rate50 Basis Points
DecreaseInflation
Rate25 Basis Points
Actuarial Accrued LiabilityActuarial Value of AssetsUnfunded LiabilityFunded Ratio
Contributions Normal Cost Accrued Liability Total
Member
Employer/State
Discount RatePayroll GrowthInflation Rate
$ 109,06995,730
$ 13,33987.8%
0.03%0.02%0.05%
(0.00%
0.05%
7.50%3.50%3.00%
$ 112,59695,730
$ 16,86685.0%
0.03%0.03%0.06%
(0.00%
0.06%
7.25%3.25%2.75%
$ 116,32295,730
$ 20,59282.3%
0.03%0.03%0.06%
(0.00%
0.06%
7.00%3.00%2.50%
Inflation Assumption Sensitivity Analysisas of June 30, 2017
(In thousands of dollars)
) ) )
ValuationResults
NoPayrollGrowth
DecreasePayrollGrowth
to 2%
Actuarial Accrued LiabilityActuarial Value of AssetsUnfunded LiabilityFunded Ratio
Contributions Normal Cost Accrued Liability Total
Member
Employer/State
Discount RatePayroll GrowthInflation Rate
$ 109,06995,730
$ 13,33987.8%
0.03%0.02%0.05%
(0.00%
0.05%
7.50%3.50%3.00%
$ 109,06995,730
$ 13,33987.8%
0.03%0.03%0.06%
(0.00%
0.06%
7.50%2.00%7.50%
$ 109,06995,730
$ 13,33987.8%
0.03%0.03%0.06%
(0.00%
0.06%
7.50%0.00%7.50%
Payroll Growth Sensitivity Analysisas of June 30, 2017
(In thousands of dollars)
) ) )

This page was intentionally left blank.

2017
StatisticalSection
Teachers’ Retirement System
of the State of Kentucky

168 Teachers’ Retirement System of the State of Kentucky • Years Ended June 30, 2017 and 2016
STATISTICAL SECTION
This section of the Teachers' Retirement System of the State of Kentucky’s Comprehensive Annual
Financial Report presents detailed information as a context for understanding the information in
the financial statements, note disclosures, and required supplementary information regarding the
system's overall financial health.
CONTENTS
Financial Trends ..................................................................................................................................... page 169
These schedules contain trend information to help the reader understand how TRS's
financial performance and well-being have changed over time.
Demographic & Economic Information ............................................................................................ page 171
These schedules offer demographic and economic indicators to help the reader
understand the system's environment within which TRS's financial activities take place.
Operating Information ......................................................................................................................... page 176
These schedules contain benefits, service and employer contribution data to help the
reader understand how TRS's financial report relates to TRS's services and activities.

Teachers’ Retirement System of the State of Kentucky • Years Ended June 30, 2017 and 2016 169
STATISTICAL SECTION
)
))
Defined Benefit PlanPast 10 Fiscal Years
313,625,434313,044,226308,159,763304,981,620304,738,728309,729,924302,262,819297,613,965293,678,564291,423,948
2,475,752,798(245,214,860862,178,759
2,803,247,9562,039,874,263
309,696,2522,760,972,2241,509,785,381
(2,020,682,522(909,083,525
3,850,098,225633,283,956
1,729,917,8123,671,555,8252,912,846,4371,176,765,7284,101,171,0362,287,204,434
(1,284,454,023(151,411,795
2017201620152014201320122011201020092008
Additions by Source
2017201620152014201320122011201020092008
Deductions by Type(Including Benefits by Type)
1,817,594,6171,735,374,4161,647,205,4741,563,634,9931,484,132,9381,401,380,8161,326,033,6981,249,272,0571,184,075,9341,105,078,345
82,466,11479,808,43276,912,57473,501,44169,808,29165,297,49160,950,21457,782,65154,562,03851,842,271
18,551,39718,015,78217,338,04717,239,26616,781,69516,260,85815,551,80114,754,06214,342,43514,048,485
$ 1,918,612,1281,833,198,6301,741,456,0951,654,375,7001,570,722,9241,482,939,1651,402,535,7131,321,808,7701,252,980,4071,170,969,101
26,305,24027,747,74223,032,62425,461,84322,059,09419,549,07317,325,38715,310,68015,208,41915,965,083
10,313,7158,636,4388,868,9717,955,9728,377,0037,762,8807,322,7398,830,0548,165,7577,551,936
1,955,231,0831,869,582,8101,773,357,6901,687,793,5151,601,159,0211,510,251,1181,427,183,8391,345,949,5041,276,354,5831,194,486,120
2017201620152014201320122011201020092008
3,850,098,225633,283,956
1,729,917,8123,671,555,8252,912,846,4371,176,765,7284,101,171,0362,287,204,434
(1,284,454,023(151,411,795
1,955,231,0831,869,582,8101,773,357,6901,687,793,5151,601,159,0211,510,251,1181,427,183,8391,345,949,5041,276,354,5831,194,486,120
1,894,867,142(1,236,298,854
(43,439,8781,983,762,3101,311,687,416(333,485,390
2,673,987,197941,254,930
(2,560,808,606(1,345,897,915
EmployerContributions
MemberContributions
NetInvestment
Income (Loss)
Total Additionsto Plan
Net Position
DisabilityRetirants Survivors
ServiceRetirants Refunds
AdministrativeExpense
TotalDeductionsto Plan Net
PositionTotal
Benefits
Total Deductionsto Plan Net
Position
Changes inPlan Net Position
Total Additions to Plan Net
Position
1,060,719,993565,454,590559,579,290563,326,249568,233,446557,339,552
1,037,935,993479,805,088442,549,935466,247,782
Year
Year
Changes in Plan Net Position
Year
$ $ $ $
$ $ $
))
))
)
))
))
$
$ $ $ $
$

170 Teachers’ Retirement System of the State of Kentucky • Years Ended June 30, 2017 and 2016
STATISTICAL SECTION
Medical Insurance PlanPast 10 Fiscal Years
2017201620152014201320122011201020092008
404,647,826297,374,661332,906,737365,500,349317,126,036274,104,713281,216,147249,498,353248,076,914224,397,218
180,039,120190,556,064241,939,817243,170,664242,206,824230,176,755227,621,392237,377,528204,857,122179,286,229
224,608,706106,818,597
90,966,920122,329,685
74,919,212 43,927,95853,594,755 12,120,82543,219,792
45,110,989
Total Deductionsto Plan Net
Position
Changes inPlan Net Position
Total Additions to Plan Net
PositionYear
2017201620152014201320122011201020092008
124,079,802127,673,325131,396,480136,963,208142,170,438156,228,181145,544,405136,702,152123,819,475107,437,450
54,420,74461,196,669
108,998,102105,107,323
98,761,18072,746,94580,890,958
100,675,37681,037,64771,838,765
$
10,014
UnderAge 65
Age 65& Over
Total Insurance
Benefits Expense Refunds*
TotalDeductionsto Plan Net
Position
180,375,986178,638,370145,263,926 157,688,414 166,576,444 173,966,623 188,241,202 158,761,433 164,408,037 148,929,322
128,819,243128,068,781157,467,680 135,190,891 119,795,780 100,346,070
84,147,337 63,805,573 58,688,767 55,402,830
$ 95,452,597(9,332,4907,354,704
67,741,063 30,718,836 (3,989,202 8,334,296
12,312,999 11,296,280
8,128,179
404,647,826297,374,661332,906,737 365,500,349 317,126,036 274,104,713 281,216,147 249,498,353 248,076,914 224,397,218
2017201620152014201320122011201020092008
EmployerContributions
MemberContributions*
NetInvestment
Income (Loss)
Total Additionsto Plan
Net PositionRecoveryIncome*Year
Year
$ -
22,820,427 4,879,981
34,976 3,781,222
493,312 14,618,348 13,683,830 11,936,887
180,039,120190,556,064241,939,817243,170,664242,206,824230,176,755227,621,392237,377,528204,857,122179,276,215
180,039,120190,556,064241,939,817243,170,664242,206,824230,176,755227,621,392237,377,528204,857,122179,286,229
1,538,5741,686,0701,545,2351,100,1331,275,2061,201,6291,186,029
AdministrativeExpense
)
)
*Refunds are netted against member contributions beginning fiscal year 2009.
$ $ $
$ $ $ $ $
$ $ $
Additions by Source
Deductions by Type(Including Benefits by Type)
Changes in Plan Net Position
Insurance Benefit Expense
* Amounts paid by retirees and recovery income is netted against insurance expenses beginning fiscal year 2016.

Teachers’ Retirement System of the State of Kentucky • Years Ended June 30, 2017 and 2016 171
STATISTICAL SECTION
Life Insurance PlanPast 10 Fiscal Years
$ 1,049,6831,037,7691,019,519 1,006,091 1,680,495 1,684,711 1,668,822 1,966,826 5,455,473 5,411,249
$ 1,965,1805,867,1053,009,8435,578,9362,355,2558,134,7334,763,5987,350,470
10,738,43111,732,740
2017201620152014201320122011201020092008
EmployerContributions
Total Additionsto Plan
Net Position
NetInvestment
Income (Loss) Year
$ 915,4974,829,3361,990,3244,572,845
674,7606,450,0223,094,776 5,383,6445,282,9586,321,491
Deductions by Type(Including Benefits by Type)
2017201620152014201320122011201020092008
Total Deductionsto Plan Net PositionYear
$ 5,178,7034,622,6844,086,306 4,713,324 4,639,143 4,420,167 4,141,511 4,148,511 3,694,000 4,003,000
$ 5,151,0134,595,4894,061,000 4,692,000 4,614,718 4,397,281 4,120,000 4,148,511 3,694,000 4,003,000
LifeInsurance
Changes in Plan Net Position
TotalAdditions to
Plan Net Position
Changes inPlan NetPosition
$ 1,965,1805,867,1053,009,843 5,578,936 2,355,255 8,134,733 4,763,598 7,350,470
10,738,431 11,732,740
$ (3,213,5231,244,421
(1,076,463 865,612
(2,283,888 3,714,566
622,087 3,201,959 7,044,431 7,729,740
TotalDeductions to
Plan Net Position
$ 5,178,7034,622,6844,086,306
4,713,324 4,639,143
4,420,167 4,141,511
4,148,511 3,694,000 4,003,000
Female
2,5565,8216,9658,0147,8228,3076,1054,6733,2992,722
56,284
By Age By ServiceYears of Service MaleFemaleMaleAge
Less than 11-45-910-1415-1920-2425-2930-3435 or more
Total
20-2425-2930-3435-3940-4445-4950-5455-5960-6465 & over
Total
6201,7632,2182,5602,5922,5701,9931,4671,1351,151
18,069
2,4084,0003,2082,8542,3941,8241,063
27444
18,069
Distribution of Active Contributing Membersas of June 30, 2017
7,47612,636
9,7829,0867,9205,3603,191
73895
56,284
)
)
)
Additions by Source
AdministrativeExpense
$ 27,690 27,195 25,306 21,324 24,425 22,886 21,511

172 Teachers’ Retirement System of the State of Kentucky • Years Ended June 30, 2017 and 2016
STATISTICAL SECTION
TRS Schedule of Participating Employers
73. Madison74. Magoffin75. Marion76. Marshall77. Martin78. Mason79. McCracken80. McCreary81. McLean82. Meade83. Menifee84. Mercer85. Metcalfe86. Monroe87. Montgomery88. Morgan89. Muhlenberg90. Nelson91. Nicholas92. Ohio93. Oldham94. Owen95. Owsley96. Pendleton
49. Harrison50. Hart51. Henderson52. Henry53. Hickman54. Hopkins55. Jackson56. Jefferson57. Jessamine58. Johnson59. Kenton60. Knott61. Knox62. Larue63. Laurel64. Lawrence65. Lee66. Leslie67. Letcher68. Lewis69. Lincoln70. Livingston71. Logan72. Lyon
25. Clark26. Clay27. Clinton28. Crittenden29. Cumberland30. Daviess31. Edmonson32. Elliott33. Estill34. Fayette35. Fleming36. Floyd37. Franklin38. Fulton39. Gallatin40. Garrard41. Grant42. Graves43. Grayson44. Green45. Greenup46. Hancock47. Hardin48. Harlan
1. Adair2. Allen3. Anderson4. Ballard5. Barren6. Bath7. Bell8. Boone9. Bourbon10. Boyd11. Boyle12. Bracken13. Breathitt14. Breckinridge15. Bullitt16. Butler17. Caldwell18. Calloway19. Campbell20. Carlisle21. Carroll22. Carter23. Casey24. Christian
School Districts: County Schools
Principal Participating EmployersCurrent Year and Nine Years Ago
Jefferson County SchoolsFayette County Public SchoolsBoone County SchoolsWarren County SchoolsHardin County SchoolsKenton County SchoolsBullitt County SchoolsOldham County SchoolsDaviess County SchoolsMadison County SchoolsAll Other*
Total (207 Employers)
14.16%6.212.661.841.811.731.701.641.501.46
65.29
100.00%
10,5324,6161,9791,3681,3471,2831,2661,2211,1171,089
48,535
74,353
123456789
10
9,9504,1021,6711,1861,3591,3081,2301,1671,1561,136
52,512
76,777
2017 2008
CoveredEmployees Rank
Percentageof TotalSystem
CoveredEmployees Rank
Percentageof TotalSystem
123745689
10
12.96%5.342.181.541.771.701.601.521.511.48
68.40
100.00%
97. Perry98. Pike99. Powell100. Pulaski101. Robertson102. Rockcastle103. Rowan104. Russell105. Scott106. Shelby107. Simpson108. Spencer109. Taylor110. Todd111. Trigg112. Trimble113. Union114. Warren115. Washington116. Wayne117. Webster118. Whitley119. Wolfe120. Woodford
* In 2017, “all other” consisted of: Type Number EmployeesLocal School Districts 163 43,221Higher Education 6 3,319State Agencies 14 1,508Educational Cooperatives 8 366Other 6 121
Total 197 48,535

Teachers’ Retirement System of the State of Kentucky • Years Ended June 30, 2017 and 2016 173
STATISTICAL SECTION
15. Covington16. Danville17. Dawson Springs18. Dayton19. East Bernstadt20. Elizabethtown21. Eminence22. Erlanger-Elsmere23. Fairview24. Fort Thomas25. Frankfort26. Fulton27. Glasgow28. Harlan
1. Anchorage2. Ashland3. Augusta4. Barbourville5. Bardstown6. Beechwood7. Bellevue8. Berea9. Bowling Green10. Burgin11. Campbellsville12. Caverna13. Cloverport14. Corbin
TRS Schedule of Participating Employers (continued)School Districts: City Schools
1. Education Professional Standards Board
2. Kentucky Education Association
3. Kentucky Academic Association
4. Kentucky Educational DevelopmentCooperative
5. Kentucky High School Athletic Association
6. Kentucky School Boards Association
7. Kentucky Valley Educational Cooperative
8. Northern Kentucky Cooperative forEducational Services
9. Ohio Valley Educational Cooperative
10. West Kentucky Education Cooperative
11. Green River Regional Education Cooperative
12. Central Kentucky Special Education Cooperative
13. Southeast South-Central Educational Cooperative
1. Eastern Kentucky
2. Kentucky State
3. Morehead State
4. Murray State
5. Western Kentucky
6. Kentucky Community & TechnicalCollege System
1. Education and Workforce Development Cabinet
2. Department of Corrections
State of Kentucky/Other Organizations
Universities & Community/Technical Colleges
OtherOrganizations
29. Hazard30. Jackson31. Jenkins32. Ludlow33. Mayfield34. Middlesboro35. Murray36. Newport37. Owensboro38. Paducah39. Paintsville40. Paris41. Pikeville42. Pineville
43. Raceland44. Russell45. Russellville46. Science Hill47. Silver Grove48. Somerset48. Southgate50. Walton-Verona51. West Point52. Williamsburg53. Williamstown

174 Teachers’ Retirement System of the State of Kentucky • Years Ended June 30, 2017 and 2016
STATISTICAL SECTION
Number of RecipientsOutside United States
Distribution of Retirement and Medical Payments Worldwideas of June 30, 2017
AlabamaAlaskaArizonaArkansasCaliforniaColoradoConnecticutDelawareFloridaGeorgiaHawaiiIdahoIllinoisIndianaIowaKansasLouisianaMaineMarylandMassachusettsMichiganMinnesotaMississippiMissouriMontana
1434
8938
10462
812
1,275260
78
114729
17333817372352265794
8
NebraskaNevadaNew HampshireNew JerseyNew MexicoNew YorkNorth CarolinaNorth DakotaOhioOklahomaOregonPennsylvaniaSouth CarolinaSouth DakotaTennesseeTexasUtahVermontVirginiaWashingtonWest VirginiaWisconsinWyoming
District Of ColumbiaMilitary APOAustraliaBarbadosCanadaMexicoNew ZealandPhilippinesPolandSwedenSwitzerlandUnited Kingdom
926
68
1746
2762
662293061
2168
985214
271
17149
11231
5
Number of Recipients in United StatesOutside Kentucky
752161111111
Number of RecipientsOutside of Kentucky
Amount of PaymentsOutside of Kentucky
Total Number ofRecipients
Total Amount ofPayments
6,274 $ 180,867,715 55,075 $ 2,097,112,674
TOTALS

Teachers’ Retirement System of the State of Kentucky • Years Ended June 30, 2017 and 2016 175
STATISTICAL SECTION
Distribution of Retirement and Medical Payments Statewideas of June 30, 2017
County Name Number of Recipients
AdairAllenAndersonBallardBarrenBathBellBooneBourbonBoydBoyleBrackenBreathittBreckinridgeBullittButlerCaldwellCallowayCampbellCarlisleCarrollCarterCaseyChristianClarkClayClintonCrittendenCumberlandDaviessEdmonsonElliottEstillFayetteFlemingFloydFranklinFultonGallatinGarrardGrantGravesGraysonGreenGreenupHancockHardinHarlanHarrisonHartHendersonHenryHickmanHopkinsJacksonJeffersonJessamineJohnsonKentonKnottKnoxLarue
$ 8,349,4737,387,0918,651,9044,506,608
16,846,6374,781,565
14,558,77042,764,869
7,814,91322,631,08619,089,930
4,252,3859,187,8187,090,130
19,020,7894,149,7607,546,683
28,078,89430,294,774
1,837,2453,934,024
15,220,5056,156,389
22,013,75414,231,42412,186,629
5,408,6272,216,1443,679,684
47,330,1454,065,4732,373,4846,259,419
126,384,5257,271,037
21,371,33030,809,551
2,894,4861,256,6028,671,2148,227,001
16,882,94810,640,731
4,881,32015,945,630
2,902,49737,993,75315,896,423
8,109,6015,500,427
18,226,1457,385,3451,489,552
19,508,8855,357,605
325,973,16417,242,75214,370,75540,429,928
9,617,28710,648,695
6,975,948
230188246130438143384
1,022213561490110257179453109201712739
5498
421168590372313150
6997
1,217109
70164
3,258200585960
7734
229186436281127417
75945433215144467211
40496154
7,289456371
1,004260302168
Total Payments
LaurelLawrenceLeeLeslieLetcherLewisLincolnLivingstonLoganLyonMadisonMagoffinMarionMarshallMartinMasonMcCrackenMcCrearyMcLeanMeadeMenifeeMercerMetcalfeMonroeMontgomeryMorganMuhlenbergNelsonNicholasOhioOldhamOwenOwsleyPendletonPerryPikePowellPulaskiRobertsonRockcastleRowanRussellScottShelbySimpsonSpencerTaylorToddTriggTrimbleUnionWarrenWashingtonWayneWebsterWhitleyWolfeWoodford
26,062,9055,245,2983,149,4765,992,621
12,997,9607,286,404
11,822,7333,364,524
11,244,3694,454,845
57,363,7607,599,3507,347,853
14,968,5015,307,4648,328,948
29,674,2848,328,2834,969,5138,072,9122,376,989
10,167,7073,818,9546,097,439
13,314,6277,129,266
15,097,46916,862,220
2,351,1047,964,079
21,481,7204,104,8914,460,8505,511,512
16,223,63631,227,858
5,175,94628,230,623
1,054,8417,996,672
20,026,6279,518,952
18,757,88520,941,742
6,565,0486,271,919
12,383,9573,479,5557,063,5342,541,4814,662,063
69,979,9954,889,6278,981,1505,063,236
26,642,8984,570,660
12,892,052
$ 1,916,244,959
693147
88151356198299
91295116
1,453199196385144219768224124186
79293100158345196374440
63229500107119142427822133761
29198528246480510178149331
99198
61132
1,814132238144728123346
48,801
County Name Number of RecipientsTotal Payments
Total in Kentucky

176 Teachers’ Retirement System of the State of Kentucky • Years Ended June 30, 2017 and 2016
STATISTICAL SECTION
Schedule of Annuitants by Type of Benefitas of June 30, 2017
Type of Benefit*
1 2 3 4 5
Number ofAnnuitants
2,9512,3482,1052,6293,8226,8227,9046,0264,0272,8464,876
46,356
13161293389544721396161
762428
2,806
171292489422334335223148106
6095
2,675
3292
1097499896332281324
655
1 - 500501 - 1,000
1,001 - 1,5001,501 - 2,0002,001 - 2,5002,501 - 3,0003,001 - 3,5003,501 - 4,0004,001 - 4,5004,501 - 5,000
5,001 & OVER
Total
3,8472,8932,9983,5144,7997,9678,5866,3674,2372,9435,023
53,174
3470200000000
349
*Type of Benefit1-Normal Retirement for Age & Service2-Disability Retirement
Option Selected*
1 2 3 4 5Amount of Monthly
Benefit ($)
415376320403479801998685427320481
5,705
286231296325433664607472338231491
4,374
4496
148155173223221181121
96225
1,683
28
177399
1059
16
95
1 - 500501 - 1,000
1,001 - 1,5001,501 - 2,0002,001 - 2,5002,501 - 3,0003,001 - 3,5003,501 - 4,0004,001 - 4,5004,501 - 5,000
5,001 & OVER
TOTAL
395358387489753
1,4271,317
994636422664
7,842
1,9291,6321,4891,8022,3703,8084,4723,3072,1911,5252,564
27,089
6
94187326306459758859671502338573
5,073
7
6825
1527
129277103
4717
29
1,313
8
1 - Straight-life annuity with refundable balance2 - Period certain benefit and life thereafter3 - Joint-survivor annuity
Amount of MonthlyBenefit ($)
*Option selected:
Growth in Annuitantsas of June 30, 2017
FiscalYear
ServiceRetirees Disabilities
Beneficiaries ofRetired Members
Beneficiaries ofDeceased Members
Eligible to Retire Survivors
2007-082008-092009-102010-112011-122012-132013-142014-152015-162016-17
35,55036,68437,60738,70540,10741,25542,58143,63445,09646,356
2,1552,2092,2842,3792,4782,5822,6412,6912,7622,806
1,7781,8371,9152,0032,1262,2072,3042,4422,5442,675
554559567584596601596653652655
468448435430444432429349370349
4 - Joint-survivor annuity, one-half benefit to beneficiary5 - Other payment - special option6 - Joint-survivor annuity with “pop-up” option7 - Joint-survivor annuity, one-half benefit to beneficiary with “pop-up” option8 - Disability, survivors and disabled adult children - set by statute
3-Beneficiaries of Retired Members4-Beneficiaries of Deceased Member Eligible to Retire
5-Survivor Payments6-Disabled Adult Child
Schedule of Annuitants by Option Selectedas of June 30, 2017
6
3330000000000
333
DisabledAdult Child
271283291296304303316328327333

Teachers’ Retirement System of the State of Kentucky • Years Ended June 30, 2017 and 2016 177
STATISTICAL SECTION
Retirement Effective Dates
07/01/2007 TO 06/30/2008 Average monthly benefit Average final average salary Number of retired members
07/01/2008 TO 06/30/2009 Average monthly benefit Average final average salary Number of retired members
07/01/2009 TO 06/30/2010 Average monthly benefit Average final average salary Number of retired members
07/01/2010 TO 06/30/2011 Average monthly benefit Average final average salary Number of retired members
07/01/2011 TO 06/30/2012 Average monthly benefit Average final average salary Number of retired members
07/01/2012 TO 06/30/2013 Average monthly benefit Average final average salary Number of retired members
07/01/2013 TO 06/30/2014 Average monthly benefit Average final average salary Number of retired members
07/01/2014 TO 06/30/2015 Average monthly benefit Average final average salary Number of retired members
07/01/2015 TO 06/30/2016 Average monthly benefit Average final average salary Number of retired members
07/01/2016 TO 06/30/2017 Average monthly benefit Average final average salary Number of retired members
Ten Years Ended June 30, 2017 Average monthly benefit Average final average salary Number of retired members
00-4.99
$199 $3,816
50
$200 $4,617
72
$185 $3,654
28
$149 $3,570
45
$175 $3,292
45
$161 $3,362
44
$192 $4,148
56
$157 $3,331
60
$177 $3,364
61
$176 $3,691
53
$178 $3,759
514
05-9.99
$524 $3,066
130
$573 $3,942
168
$525 $3,637
133
$519 $3,640
157
$507 $3,759
197
$475 $3,660
234
$484 $3,677
211
$472 $3,577
231
$519 $3,791
254
$473 $3,506
259
$503 $3,640
1,974
10-14.99
$1,117 $4,215
112
$1,005 $3,873
137
$1,104 $4,124
98
$1,225 $4,423
144
$1,170 $4,307
146
$1,186 $4,498
156
$1,270 $4,751
161
$1,282 $4,892
183
$1,316 $4,847
194
$1,235 $4,588
162
$1,204 $4,500
1,493
15-19.99
$1,658 $4,412
150
$1,725 $4,686
115
$1,700 $4,508
103
$1,781 $4,825
112
$1,897 $4,898
162
$1,963 $4,956
154
$2,068 $5,364
145
$2,038 $5,266
206
$1,998 $5,188
217
$2,039 $5,208
212
$1,914 $4,984
1,576
20-24.99
$2,436 $4,983
217
$2,427 $4,974
242
$2,513 $5,184
242
$2,529 $5,143
235
$2,613 $5,219
303
$2,781 $5,518
294
$2,797 $5,600
258
$2,890 $5,709
314
$2,934 $5,777
356
$2,902 $5,722
346
$2,710 $5,424
2,807
25-29.99
$3,279 $5,067
557
$3,368 $5,278
505
$3,468 $5,383
442
$3,621 $5,574
544
$3,674 $5,605
778
$3,811 $5,799
685
$3,847 $5,902
678
$3,898 $5,948
806
$3,935 $6,019
807
$3,935 $6,024
766
$3,721 $5,709
6,568
30>=
$4,319 $5,786
615
$4,496 $5,960
585
$4,670 $6,102
601
$4,827 $6,235
617
$4,726 $6,109
569
$5,162 $6,632
447
$5,362 $6,860
344
$5,124 $6,552
456
$5,389 $6,858
448
$5,179 $6,666
320
$4,862 $6,308
5,002
TOTAL
$2,984 $5,017
1,831
$2,941 $5,164
1,824
$3,222 $5,316
1,647
$3,240 $5,392
1,854
$3,148 $5,331
2,200
$3,149 $5,476
2,014
$3,126 $5,589
1,853
$3,173 $5,577
2,256
$3,195 $5,664
2,337
$3,040 $5,514
2,118
$3,123 $5,41619,934
Defined Benefit PlanAverage Benefit Payments for the Past Ten Years
By Years of Service Credit

178 Teachers’ Retirement System of the State of Kentucky • Years Ended June 30, 2017 and 2016
STATISTICAL SECTION
Retirement Effective Dates
07/01/2012 to 06/30/2013 Average monthly supplement Number of retired members
07/01/2013 to 06/30/2014 Average monthly supplement Number of retired members
07/01/2014 to 06/30/2015 Average monthly supplement Number of retired members
07/01/2015 to 06/30/2016 Average monthly supplement Number of retired members
07/01/2016 to 06/30/2017 Average monthly supplement Number of retired members
Medical Insurance PlanAverage Insurance Premium Supplements for the Last Five Years
By Years of Service Credit
00-9.99
$ 80.2329
$ 51.9915
$ 78.4824
$ 86.8268
$ 74.6562
10-14.99
$ 227.3290
$ 189.5982
$ 204.26101
$ 182.4198
$ 192.3071
15-19.99
$ 366.98104
$ 335.34100
$ 369.27176
$ 323.14178
$ 333.08194
20>=
$ 499.251,373
$ 483.651,227
$ 492.301,411
$ 483.931,407
$476.861,291
TOTAL
1,596
1,424
1,712
1,751
1,618

Teachers’ Retirement System of the State of Kentucky • Years Ended June 30, 2017 and 2016 179
STATISTICAL SECTION
Funding of Additional Payments
Member Contributions ($19,914,607 x 9.105%) =Employer Contributions ($19,914,607 x 12.325%) =
TOTAL CONTRIBUTIONS
DEFICIT:
Anticipated additional payoutLess: total member and state contributions
Subtotal unfunded debtLess: current year appropriation
TOTAL UNFUNDED COST OF SICK LEAVE PAYMENTS*
1,813,2252,454,475
-4,267,700
43,962,2414,267,700
39,694,5415,623,500
34,071,041
* This amount will be amortized over a 20-year period.
NOTE: Actuarial factors used for sick leave calculations changed effective July 1, 1998. The unfunded cost of sick leave payments are amortized over 20-year periods per KRS 161.553.
$
$
$
$
$
Summary of Fiscal Year 2016-17Retiree Sick Leave Payments
Total members retiringTotal members receiving sick leave paymentsTotal amount of sick leave payments @12.855% contribution rateAverage sick leave payment per retireeTotal increase in final 3 or 5 year average salary baseAverage increase in final average salaryTotal service credit of 1,500 retireesAverage service credit of 1,500 retirees
ANTICIPATED LIFETIME PAYOUT OF ADDITIONAL ANNUITY
Actuarial cost of sick leave as salary credit
2,325 1,500
19,914,60713,276
5,356,9143,571
38,83225.89
43,962,241
$$$$
$

This page was intentionally left blank.