teachers retirement association of minnesota
TRANSCRIPT

Teachers Retirement Association of Minnesota
Actuarial Valuation Report
For Funding Purposes As of July 1, 2014

This page is intentionally left blank

Off
Cavanaugh Macdonald CC OO NN SS UU LL TT II NN GG,, LL LL CC
The experience and dedication you deserve
3906 Raynor Pkwy, Suite 106, Bellevue, NE 68123 Phone (402) 905-4461 • Fax (402) 905-4464
www.CavMacConsulting.com Offices in Englewood, CO • Kennesaw, GA • Bellevue, NE • Hilton Head Island, SC
December 5, 2014 Board of Trustees Teachers Retirement Association of Minnesota 60 Empire Drive, Suite 400 St. Paul, MN 55103 Dear Board Members: At your request, we have performed the annual actuarial valuation of the Teachers Retirement Association of Minnesota (TRA or System) as of July 1, 2014. The major findings of the actuarial valuation are contained in this report, which reflects the benefit provisions in place on July 1, 2014. There was no change to the actuarial methods or the plan provisions from the prior valuation. However, there was a change in one of the actuarial assumptions in this valuation. The 2014 Omnibus Pension Bill provided clarification regarding how the actuarial assumptions should reflect the increase in the postretirement adjustment rate when funding stability is attained. It also changed the definition of “funding stability” from attainment of a funded ratio of 90% for one year to a funded ratio of 90% for two consecutive years (measured on a market value basis). In addition, the legislation provided for the merger of the Duluth Teachers Retirement Fund Association into TRA. Since the merger will not occur until June 30, 2015, the provision had no impact on this valuation. In preparing this report, we relied, without audit, on information (some oral and some in writing) supplied by TRA staff. This information includes, but is not limited to, statutory provisions, member data and financial information. We found this information to be reasonable and comparable to information used in prior valuations. The valuation results depend on the integrity of this information. If any of this information is inaccurate or incomplete, our results may be different and our calculations may need to be revised. The statutory benefits of the System are reflected in the actuarially calculated contribution rates which are developed using the Entry Age Normal (EAN) cost method. An asset smoothing method is used for actuarial valuation purposes. Gains and losses are reflected in the unfunded actuarial accrued liability and are amortized as a level percent of payroll over a closed period set in state statutes. Actuarial assumptions, including discount rates, mortality tables and others identified in this report, are prescribed by Minnesota Statutes Section 356.215, the Legislative Commission on Pensions and Retirement (LCPR), and the Trustees. These parties are responsible for selecting the plan's funding policy, actuarial valuation methods, asset valuation method, and actuarial assumptions. The policies, methods and assumptions used in this valuation are those that have been so prescribed and are described in Appendix C of this report.

Board of Trustees December 5, 2014 Page 2
Future actuarial results may differ significantly from the current results presented in this report due to factors such as the following: plan experience differing from that anticipated by the economic or demographic assumptions; changes in economic or demographic assumptions; increases or decreases expected as part of the natural operation of the methodology used for these measurements (such as the end of an amortization period or additional cost or contribution requirements based on the plan’s funded status); and changes in plan provisions or applicable law. Since the potential impact of such factors is outside the scope of a normal annual actuarial valuation, an analysis of the range of potential results is not presented herein. The actuarial computations presented in this report are for purposes of determining the required contribution rates for funding the System. Actuarial computations for purposes of fulfilling financial accounting requirements for the System under the Governmental Accounting Standards Board (GASB) Statement Number 67 will be presented in a separate report. The calculations in the enclosed report have been made on a basis consistent with our understanding of the System’s funding requirements and goals and the plan provisions described in Appendix B of this report. Determinations for purposes other than meeting these requirements may be significantly different from the results contained in this report. Accordingly, additional determinations may be needed for other purposes. On the basis of the foregoing, we hereby certify that, to the best of our knowledge and belief, this report is complete and accurate and that the valuation was prepared in accordance with principles of practice prescribed by the Actuarial Standards Board, and that the actuarial calculations were performed by qualified actuaries in accordance with accepted actuarial procedures, based on the current provisions of the retirement System. In addition, to the best of our knowledge and belief the valuation was performed in accordance with the requirements of Minnesota Statues, Section 356.215, and the requirements of the Standards for Actuarial Work established by the State of Minnesota Legislative Commission on Pensions and Retirement (LCPR). We are members of the American Academy of Actuaries and meet the Qualification Standards to render the actuarial opinion contained herein. Also, we meet the requirements of “approved actuary” under Minnesota Statues, Section 356.215, Subdivision 1, Paragraph (c). Respectfully submitted,
Patrice A. Beckham, FSA, EA, FCA, MAAA Brent A. Banister PhD, FSA, EA, FCA, MAAA Principal and Consulting Actuary Chief Pension Actuary

TABLE OF CONTENTS
Sections Page Certification Letter I. Executive Summary ........................................................................................................................... 1 II. Plan Assets
• Statement of Fiduciary Net Position for Year Ended June 30, 2013 ....................................................... 14 • Statement of Changes in Fiduciary Net Position ..................................................................................... 16 • Actuarial Asset Value .............................................................................................................................. 17
III. Plan Liabilities
• Actuarial Valuation Balance Sheet .......................................................................................................... 22 • Determination of Unfunded Actuarial Accrued Liability ........................................................................ 23 • Changes in Unfunded Actuarial Accrued Liability .................................................................................. 24
IV. Contributions
• Determination of Normal Cost Rate ........................................................................................................ 28 • Determination of Supplemental Contribution Rate.................................................................................. 29 • Determination of Contribution Sufficiency/(Deficiency) ........................................................................ 30 • Statutory and Required Contributions Amounts – Basic Members ......................................................... 31 • Statutory and Required Contributions Amounts – Coordinated Members .............................................. 32
V. Additional Information
• Summary of Membership Data ................................................................................................................ 36 • Schedule of Funding Progress ................................................................................................................. 37 • Schedule of Contributions from the Employer and Other Contributing Entities ..................................... 38 • Projected Benefit Payments ..................................................................................................................... 39
Appendices A. Membership Data
• Member Status Reconciliation ................................................................................................................. 43 • Distribution of Active Members .............................................................................................................. 44 • Distribution of Service Retirements ......................................................................................................... 45 • Distribution of Survivors ......................................................................................................................... 46 • Distribution of Disability Retirements ..................................................................................................... 47
B. Summary of Plan Provisions ............................................................................................................ 49 C. Actuarial Methods and Assumptions
• Actuarial Cost Method ............................................................................................................................. 64 • Asset Valuation Method .......................................................................................................................... 65 • Summary of Actuarial Assumptions ........................................................................................................ 67
Glossary ..................................................................................................................................................... 74

This page is intentionally left blank

SECTION 1 – EXECUTIVE SUMMARY
1
The Teachers Retirement Association of Minnesota (TRA or System) provides retirement, disability, and death benefits to Minnesota public school teachers, administrators, and college faculty. This report presents the results of the July 1, 2014 actuarial funding valuation of the System. The primary purposes of performing the actuarial funding valuation are to:
determine the Required Contribution Rate as set forth in Chapter 356 of the Minnesota statutes; determine the sufficiency of the Statutory Contribution Rate as set forth in Chapter 354 of the Minnesota
statutes; determine the experience of the System since the last valuation date; disclose asset and liability measures as of the valuation date; and analyze and report on trends in System contributions, assets, and liabilities over the past several years.
There were no changes to the plan provisions or the actuarial methods from the prior valuation, but there was one change to the actuarial assumptions. Previously, based on limited official guidance and the fact that the increase in the postretirement adjustment (cost of living adjustment or COLA) was not expected to occur for many years, the COLA increase to 2.5% as provided in law was not anticipated in the valuation results. The 2014 Omnibus Pension Bill provided clarification in the state statutes regarding how the actuarial assumptions should reflect the increase in the postretirement adjustment rate by requiring the COLA increase to be assumed when funding stability (the defined trigger point for the increases to occur) is expected to be attained. It also changed the criteria for the measurement of “funding stability” from a funded ratio of 90% for one year to a funded ratio of 90% for two consecutive years (on a market value basis). Using this new requirement for the current valuation and the present funded status of the System, we estimate the System will have been 90% funded for two consecutive years in the July 1, 2031 valuation, if all actuarial assumptions are met in future years, and thus the COLA is assumed to increase to 2.5% at that time. In addition, the Omnibus Pension Bill provided for the merger of the Duluth Teachers Retirement Fund Association (DTRFA) into TRA and provided for additional ongoing state aid to TRA to ensure the long term funding of TRA will not be affected. Since the merger will not occur until June 30, 2015, the provision had no impact on this valuation. The actuarial valuation results provide a “snapshot” view of the System’s financial condition on July 1, 2014. The results reflect net favorable experience for the past plan year as demonstrated by an unfunded actuarial accrued liability (UAAL) that was lower than expected. The UAAL on July 1, 2014 is $6.347 billion as compared to an expected UAAL of $7.425 billion (reflecting the assumption change). The favorable experience was the combination of an experience gain of just over $1 billion on the actuarial value of assets offset by a minor net experience loss of about $1 million on System liabilities. Due to the application of the asset smoothing method, there is a deferred investment gain of $2.1 billion. A summary of the key results from the July 1, 2014 actuarial valuation is shown below. Further detail on the valuation results can be found in the following sections of this Executive Summary.
July 1, 2013 July 1, 2014
Valuation Results Valuation Results Total Required Contribution Rate (Chapter 356) 19.41% 19.15%
Statutory Contribution Rate (Chapter 354) 14.67% 15.68%
Sufficiency/(Deficiency) (4.74%) (3.47%)
Unfunded Actuarial Accrued Liability ($M) $6,644 $6,347 Funded Ratio (Actuarial Assets) 71.63% 74.13%
SECTION 1 – EXECUTIVE SUMMARY
2
The contribution deficiency decreased from 4.74% of payroll in last year’s valuation to 3.47% of payroll in the 2014 valuation. The most significant factors in the decline of the deficiency were the actual investment return of over 18% which served to decrease the Required Contribution Rate and the 0.50% scheduled increase in both the member and employer contribution rates, effective July 1, 2014. While these factors reduced the deficiency, the reduction was partially offset by the change in the COLA assumption which increased the liabilities and the Required Contribution Rate. EXPERIENCE FOR THE LAST PLAN YEAR Numerous factors contributed to the change in the Systems’ assets, liabilities and actuarial contribution rate between July 1, 2013 and July 1, 2014. The components are examined in the following discussion.
ASSETS
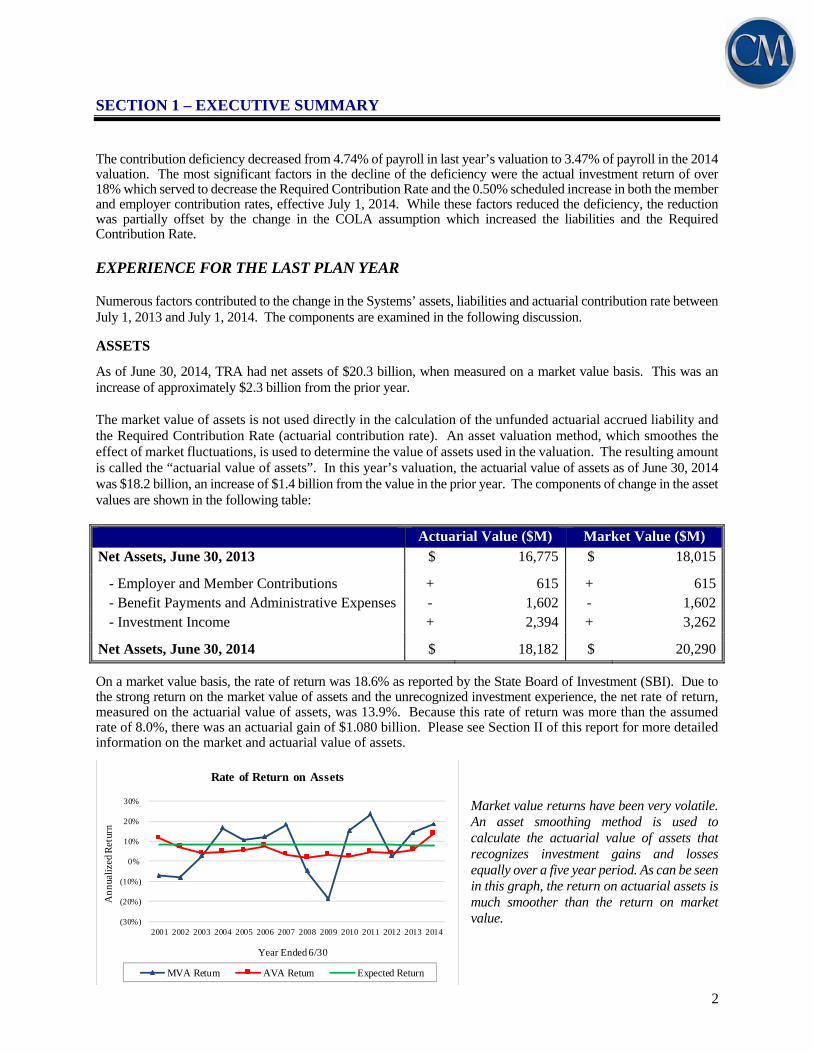
As of June 30, 2014, TRA had net assets of $20.3 billion, when measured on a market value basis. This was an increase of approximately $2.3 billion from the prior year. The market value of assets is not used directly in the calculation of the unfunded actuarial accrued liability and the Required Contribution Rate (actuarial contribution rate). An asset valuation method, which smoothes the effect of market fluctuations, is used to determine the value of assets used in the valuation. The resulting amount is called the “actuarial value of assets”. In this year’s valuation, the actuarial value of assets as of June 30, 2014 was $18.2 billion, an increase of $1.4 billion from the value in the prior year. The components of change in the asset values are shown in the following table:
Actuarial Value ($M) Market Value ($M)
Net Assets, June 30, 2013 $ 16,775 $ 18,015
- Employer and Member Contributions + 615 + 615 - Benefit Payments and Administrative Expenses - 1,602 - 1,602 - Investment Income + 2,394 + 3,262
Net Assets, June 30, 2014 $ 18,182 $ 20,290
On a market value basis, the rate of return was 18.6% as reported by the State Board of Investment (SBI). Due to the strong return on the market value of assets and the unrecognized investment experience, the net rate of return, measured on the actuarial value of assets, was 13.9%. Because this rate of return was more than the assumed rate of 8.0%, there was an actuarial gain of $1.080 billion. Please see Section II of this report for more detailed information on the market and actuarial value of assets.
Market value returns have been very volatile. An asset smoothing method is used to calculate the actuarial value of assets that recognizes investment gains and losses equally over a five year period. As can be seen in this graph, the return on actuarial assets is much smoother than the return on market value.
(30%)
(20%)
(10%)
0%
10%
20%
30%
2001 2002 2003 2004 2005 2006 2007 2008 2009 2010 2011 2012 2013 2014
Ann
ualiz
ed R
etur
n
Year Ended 6/30
Rate of Return on Assets
MVA Return AVA Return Expected Return
SECTION 1 – EXECUTIVE SUMMARY
3
LIABILITIES The actuarial accrued liability is that portion of the present value of future benefits that will not be paid by future normal costs. The difference between this liability and the actuarial value of assets at the same date is called the unfunded actuarial accrued liability (UAAL). The dollar amount of unfunded actuarial accrued liability is reduced if the contributions to the System exceed the normal cost for the year plus interest on the prior year’s UAAL. The unfunded actuarial accrued liability is shown as of July 1, 2014 in the following table:
Actuarial Market
Value of Assets Value of Assets
($Millions)
Actuarial Accrued Liability $24,529 $24,529
Value of Assets 18,182 20,290 Unfunded Actuarial Accrued Liability* 6,347 4,239
Funded Ratio 74.13% 82.72%
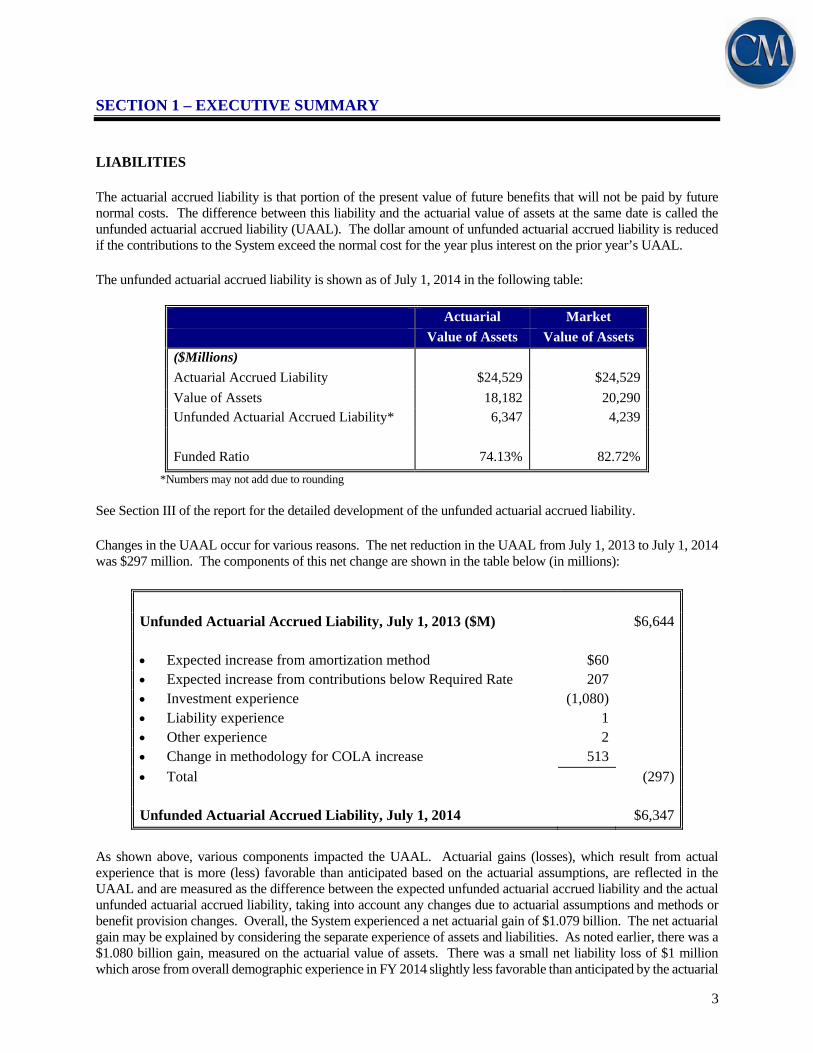
*Numbers may not add due to rounding See Section III of the report for the detailed development of the unfunded actuarial accrued liability. Changes in the UAAL occur for various reasons. The net reduction in the UAAL from July 1, 2013 to July 1, 2014 was $297 million. The components of this net change are shown in the table below (in millions):
Unfunded Actuarial Accrued Liability, July 1, 2013 ($M) $6,644
Expected increase from amortization method $60 Expected increase from contributions below Required Rate 207 Investment experience (1,080) Liability experience 1 Other experience 2 Change in methodology for COLA increase 513
Total (297)
Unfunded Actuarial Accrued Liability, July 1, 2014 $6,347
As shown above, various components impacted the UAAL. Actuarial gains (losses), which result from actual experience that is more (less) favorable than anticipated based on the actuarial assumptions, are reflected in the UAAL and are measured as the difference between the expected unfunded actuarial accrued liability and the actual unfunded actuarial accrued liability, taking into account any changes due to actuarial assumptions and methods or benefit provision changes. Overall, the System experienced a net actuarial gain of $1.079 billion. The net actuarial gain may be explained by considering the separate experience of assets and liabilities. As noted earlier, there was a $1.080 billion gain, measured on the actuarial value of assets. There was a small net liability loss of $1 million which arose from overall demographic experience in FY 2014 slightly less favorable than anticipated by the actuarial

SECTION 1 – EXECUTIVE SUMMARY
4
assumptions. The liability experience was the result of various components of actuarial gains and losses, the largest of which was a gain from salary increases that were lower than expected, offset by smaller losses from several sources.
The actuarial value of assets was slightly higher than the actuarial accrued liability in the early part of the period. Investment experience below the assumed rate of return of 8.5%, the merger of the Post Fund into TRA, and the merger of the Minneapolis Teachers Retirement Fund Association all served to increase the difference between the actuarial accrued liability and actuarial assets.
An evaluation of the unfunded actuarial accrued liability on a pure dollar basis may not provide a complete analysis since only the difference between the assets and liabilities (which are both very large numbers) is reflected. Another way to evaluate the unfunded actuarial accrued liability and the progress made in its funding is to track the funded ratio, the ratio of the actuarial value of assets to the actuarial accrued liability. The funded status information is shown below (in millions).
7/1/10 7/1/11 7/1/12 7/1/13 7/1/14
Funded Ratio 78.5% 77.3% 73.0% 71.6% 74.1%Unfunded Actuarial Accrued Liability ($M) $4,758 $5,039 $6,219 $6,644 $6,347
The funded ratio has decreased over this period largely due to investment experience less than the 8.5% assumed rate of return and the dissolution of the Minnesota Post Retirement Investment Fund (MPRIF) with the associated transfer of assets and liabilities to TRA. The benefit reductions passed by the 2010 legislature, the final recognition of the 2008 and 2009 losses, and the strong investment returns since FY10 have resulted in the funded ratio beginning to rebound in this valuation.
$0
$5
$10
$15
$20
$25
$30
2001 2002 2003 2004 2005 2006 2007 2008 2009 2010 2011 2012 2013 2014
$ B
illi
on
s
June 30
Actuarial Accrued Liability vs Actuarial Value of Assets
Actuarial Value of Assets Actuarial Accrued Liability
105.8% 105.3%103.1%
100.0%98.5%
92.1%
87.5%
82.0%
77.4%78.5%
77.3%
73.0%71.6%
74.1%
65%
70%
75%
80%
85%
90%
95%
100%
105%
110%
2001 2002 2003 2004 2005 2006 2007 2008 2009 2010 2011 2012 2013 2014
June 30
Funded Ratio

SECTION 1 – EXECUTIVE SUMMARY
5
CONTRIBUTION RATE Under the Entry Age Normal cost method, the actuarial contribution rate consists of two components: a "normal cost" for the portion of projected liabilities allocated by the actuarial cost method to service of
members during the year following the valuation date, and
an "unfunded actuarial accrued liability contribution" for the excess of the portion of projected liabilities allocated to service to date over the actuarial value of assets.
See Section IV of the report for the detailed development of these contribution rates which are summarized in the following table:
Contribution Rates July 1, 2014 July 1, 2013 1. Statutory Contribution Rate 15.68% 14.67% 2. Normal Cost Rate 8.70% 8.40%
3. UAAL Contribution Rate 10.23% 10.78%
4. Expenses 0.22% 0.23% 5. Total Required Contribution Rate 19.15% 19.41% (2) + (3) + (4) 6. Deficiency (1) - (5) (3.47%) (4.74%)
As discussed earlier, legislation passed in the 2014 session provided statutory guidance on how the assumption for the postretirement adjustment (COLA) should be set. Previously, based on limited official guidance and the fact that the increase in the COLA was not expected to occur for many years, the increase in the COLA to 2.5% was not anticipated; i.e., a 2.0% COLA assumption for all future years was used. The 2014 Omnibus Pension Bill provided clarification in the state statutes regarding how the actuarial assumptions should reflect the increase in the postretirement adjustment rate by requiring the COLA increase to be assumed when funding stability (the defined trigger point for the increases to occur) is expected to be attained. It also changed the criteria for the measurement of “funding stability” from a funded ratio of 90% for one year to a funded ratio of 90% for two consecutive years (on a market value basis). In order to determine when the System’s funded ratio would be 90% or more for two consecutive years we used the valuation model prepared in conjunction with the prior year’s valuation, reflected the actual market value investment return for the fiscal year just ended, and then further assumed that all actuarial assumptions would be met in future years. In particular, this means the assumed rate of return is earned on the market value of assets. Therefore, the current deferred investment gains flow through the asset smoothing method over the next four years and are reflected in future valuation results, including the funded ratio. The projection for the current valuation showed that TRA will have been 90% funded for two consecutive years in the July 1, 2031 valuation. As a result, the 2014 valuation reflects a COLA assumption of 2.0% until the 2031 valuation at which time the COLA is assumed to increase to 2.5%. It is important to note that the assumption that the actuarial rate of return is earned in all future years on the market value of assets directly impacts the date at which funding stability is reached, which in turn leads to reflecting the COLA increasing to 2.5%. This anticipated date is then used in the valuation and it affects both the normal cost rate and the actuarial accrued liability. However, when the Required Contribution Rate is determined, the actuarial value of assets is used and deferred investment experience is ignored. This results in a mismatch in calculation methodology between the liabilities, which are partially determined using the market value of assets, and the actuarial assets, which are determined using the asset smoothing method. As a result, the key valuation metrics of the funded ratio, unfunded actuarial accrued liability, and the contribution rate deficiency may appear less favorable than they truly are because of the deferred gains.
SECTION 1 – EXECUTIVE SUMMARY
6
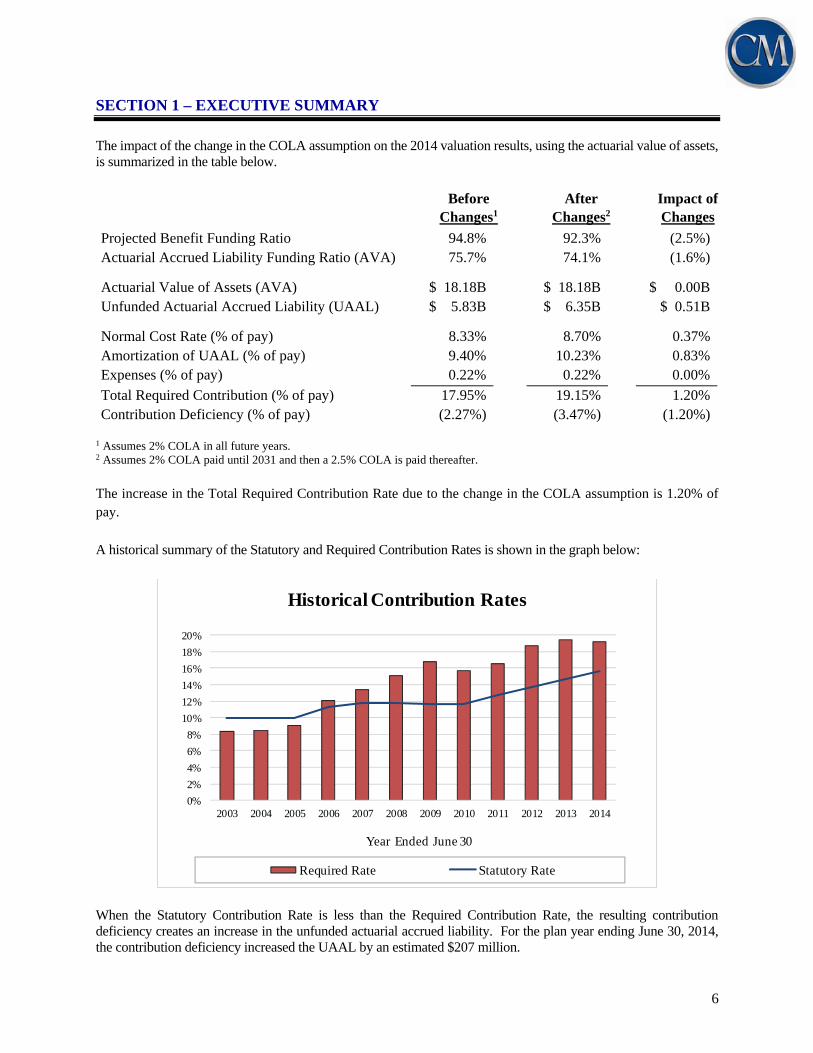
The impact of the change in the COLA assumption on the 2014 valuation results, using the actuarial value of assets, is summarized in the table below.
Before After Impact of Changes1 Changes2 Changes
Projected Benefit Funding Ratio 94.8% 92.3% (2.5%)Actuarial Accrued Liability Funding Ratio (AVA) 75.7% 74.1% (1.6%)
Actuarial Value of Assets (AVA) $ 18.18B $ 18.18B $ 0.00B Unfunded Actuarial Accrued Liability (UAAL) $ 5.83B $ 6.35B $ 0.51B
Normal Cost Rate (% of pay) 8.33% 8.70% 0.37% Amortization of UAAL (% of pay) 9.40% 10.23% 0.83% Expenses (% of pay) 0.22% 0.22% 0.00%
Total Required Contribution (% of pay) 17.95% 19.15% 1.20% Contribution Deficiency (% of pay) (2.27%) (3.47%) (1.20%)
1 Assumes 2% COLA in all future years. 2 Assumes 2% COLA paid until 2031 and then a 2.5% COLA is paid thereafter. The increase in the Total Required Contribution Rate due to the change in the COLA assumption is 1.20% of pay. A historical summary of the Statutory and Required Contribution Rates is shown in the graph below:
0%
2%
4%
6%
8%
10%
12%
14%
16%
18%
20%
2003 2004 2005 2006 2007 2008 2009 2010 2011 2012 2013 2014
Year Ended June 30
Historical Contribution Rates
Required Rate Statutory Rate
When the Statutory Contribution Rate is less than the Required Contribution Rate, the resulting contribution deficiency creates an increase in the unfunded actuarial accrued liability. For the plan year ending June 30, 2014, the contribution deficiency increased the UAAL by an estimated $207 million.

SECTION 1 – EXECUTIVE SUMMARY
7
The actuarial contribution rate (Required Contribution Rate) is determined based on the snapshot of the System taken on the valuation date, July 1, 2014. The actuarial contribution rate in future years will change each year as the deferred actuarial investment experience is recognized and other experience (both investment and demographic) impacts the System. In addition, changes in the funded status of the System from year to year will impact the date at which the COLA is assumed to increase to 2.5%, which will impact the System liabilities and costs. Significant gains or losses may significantly move the expected date of the COLA increase. Contribution rates have increased over the past few years, with the final scheduled increase taking effect July 1, 2014. At this point, a contribution deficiency still exists, although as pointed out earlier the liabilities reflect a 2.5% increase in the COLA in 2031 which is based on the market value of assets earning the assumed rate of return. On a market value basis, the deficiency is almost eliminated. Future investment returns, along with the use of the “stabilizer” provisions of the 2010 law will determine whether or not the System is fully funded by the end of the amortization period (June 30, 2037). SUMMARY The investment return on the market value of assets for FY 2014 was 18.6% as reported by SBI. Due to the deferred investment gains and losses from past years, the return on the actuarial value of assets was 13.9%. Since this return was above the assumed 8% return, the funded ratio increased from 71.63% in last year’s valuation to 74.13% this year. As mentioned earlier, the System utilizes an asset smoothing method in the valuation process. While this is a common procedure for public retirement systems, it is important to identify the potential impact of the deferred investment experience. The asset smoothing method impacts only the timing of when the actual market experience is recognized in the valuation process. The deferred investment experience gain of $2.1 billion represents about 10% of the market value of assets, providing some margin to absorb future investment experience that is less than the assumed rate of return. The key valuation results from the July 1, 2014 actuarial valuation are shown below, using both actuarial and market value of assets.
Actuarial Value Market Value
Statutory Rate 15.68% 15.68%
Required Contribution
Normal Cost 8.70% 8.70% UAAL Contribution 10.23% 6.83%
Expenses 0.22% 0.22%
Total Required Contribution 19.15% 15.75%
(Deficiency)/Sufficiency (3.47%) (0.07%)
UAAL ($M) $6,347 $4,239 Funded Ratio 74.13% 82.72%

SECTION 1 – EXECUTIVE SUMMARY
8
The long-term financial health of this retirement System, like all retirement systems, is heavily dependent on two key items: (1) future investment returns and (2) contributions to the System. Changes were made by the 2010 Legislature to strengthen the funding of TRA and enhance its long term sustainability. Contributions were increased by a total of 4%, to be phased in over four years beginning July 1, 2011, and benefit reductions were implemented. These changes, along with strong investment performance in four of the last five fiscal years, have significantly improved the projected long term funding of the System. However, a contribution deficiency still exists, based on the results of the 2014 valuation. If the deferred investment gains are reflected, the deficiency is significantly reduced to 0.07%. This indicates that if the assumed returns are realized on a market value basis, allowing the current deferred gains to be recognized in future years, the System will be close to the target date for being 100% funded in June 30, 2037. Clearly, the actual market returns over the coming years will be a significant factor in whether or not the funding goal will be reached. In addition to the market returns, the merger with the Duluth Teachers Retirement Fund Association will also change the dynamics of the funded status of the System. Prior to enactment of the legislation, a great deal of effort was spent to analyze the potential impact of the merger on TRA. We note that this analysis appropriately focused on the long term impact of the merger, reflecting the additional state aid payments that are to scheduled be made to assure that TRA’s funding is not negatively impacted by the merger. However, because the liabilities of the Duluth Teachers Retirement Fund Association will be included in the annual valuation of TRA in 2015, but the state aid payments intended to fund the unfunded actuarial accrued liability will be contributed over time, it is possible that certain measures of the financial health of TRA may be temporarily skewed in the short term. We conclude this executive summary by presenting comparative statistics and actuarial information on both the July 1, 2014 and July 1, 2013 valuations.
SECTION I - EXECUTIVE SUMMARY
9
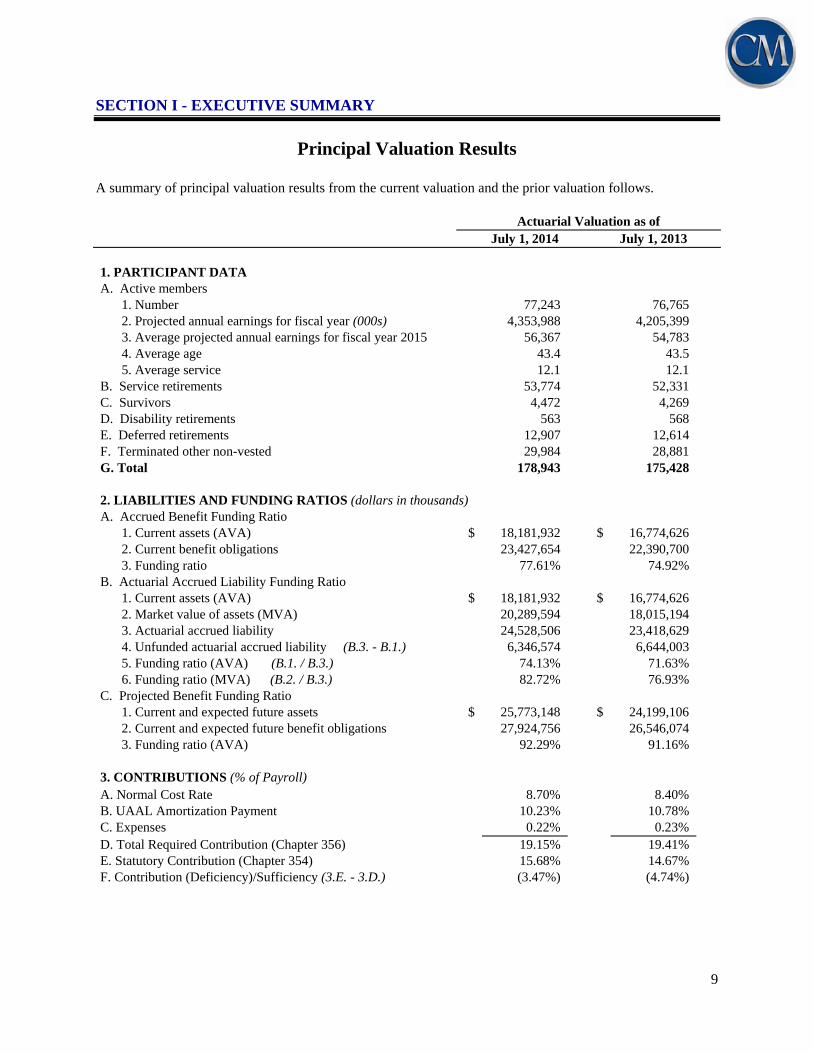
Principal Valuation Results A summary of principal valuation results from the current valuation and the prior valuation follows.
Actuarial Valuation as of July 1, 2014 July 1, 2013
1. PARTICIPANT DATA A. Active members
1. Number 77,243 76,765 2. Projected annual earnings for fiscal year (000s) 4,353,988 4,205,399
3. Average projected annual earnings for fiscal year 2015 56,367 54,783 4. Average age 43.4 43.5 5. Average service 12.1 12.1
B. Service retirements 53,774 52,331 C. Survivors 4,472 4,269 D. Disability retirements 563 568 E. Deferred retirements 12,907 12,614 F. Terminated other non-vested 29,984 28,881 G. Total 178,943 175,428
2. LIABILITIES AND FUNDING RATIOS (dollars in thousands) A. Accrued Benefit Funding Ratio
1. Current assets (AVA) $ 18,181,932 $ 16,774,626 2. Current benefit obligations 23,427,654 22,390,700 3. Funding ratio 77.61% 74.92%
B. Actuarial Accrued Liability Funding Ratio
1. Current assets (AVA) $ 18,181,932 $ 16,774,626 2. Market value of assets (MVA) 20,289,594 18,015,194 3. Actuarial accrued liability 24,528,506 23,418,629 4. Unfunded actuarial accrued liability (B.3. - B.1.) 6,346,574 6,644,003 5. Funding ratio (AVA) (B.1. / B.3.) 74.13% 71.63% 6. Funding ratio (MVA) (B.2. / B.3.) 82.72% 76.93%
C. Projected Benefit Funding Ratio 1. Current and expected future assets $ 25,773,148 $ 24,199,106 2. Current and expected future benefit obligations 27,924,756 26,546,074 3. Funding ratio (AVA) 92.29% 91.16%
3. CONTRIBUTIONS (% of Payroll) A. Normal Cost Rate 8.70% 8.40% B. UAAL Amortization Payment 10.23% 10.78% C. Expenses 0.22% 0.23% D. Total Required Contribution (Chapter 356) 19.15% 19.41% E. Statutory Contribution (Chapter 354) 15.68% 14.67% F. Contribution (Deficiency)/Sufficiency (3.E. - 3.D.) (3.47%) (4.74%)

SECTION I - EXECUTIVE SUMMARY
10
This page is intentionally left blank

SECTION II - PLAN ASSETS
11
SECTION II
PLAN ASSETS

SECTION II - PLAN ASSETS
12
This page is intentionally left blank

SECTION II - PLAN ASSETS
13
In this section, the values assigned to the assets held by the System are presented. These assets are valued on two different bases: the market value and the actuarial value. Market Value of Net Assets For certain accounting statement purposes, System assets are valued at current market prices. These values represent the "snapshot" of the fair value of System assets as of the valuation date. Actuarial Value of Net Assets The market value of assets may not necessarily be the best measure of the System’s ongoing ability to meet its obligations. To arrive at a suitable value for the actuarial valuation, a technique for determining the actuarial value of assets is used which dampens volatility in the market value while still indirectly recognizing market value. The methodology used to determine the actuarial value of assets is prescribed in Minnesota Statutes, Section 356.215, Subdivision 1, Paragraph (f). The assets are valued based on a five-year moving average of expected and market values (five-year average actuarial value) determined as follows:
• At the end of each plan year, an average asset value is calculated as the average of the market asset
value at the beginning and end of the fiscal year net of investment income for the fiscal year;
• The investment gain or (loss) is determined as the excess of actual investment income over the expected investment income based on the average asset value as calculated above;
• The investment gain or (loss) so determined is recognized over five years at 20% per year;
• The asset value is the sum of the market value plus the scheduled recognition of investment gains or
(losses) during the current and the preceding four fiscal years.

SECTION II - PLAN ASSETS
14
TABLE 1
STATEMENT OF FIDUCIARY NET POSITION (Dollars in Thousands)
June 30, 2014 June 30, 2013 Amount Amount
Cash and short-term investments Cash $ 3,391 $ 8,475 Building account cash 34 67 Short term investments 536,124 469,717
Total cash and short term investments $ 539,549 $ 478,259
Accounts Receivable 25,605 18,908
Investments (at fair value) Fixed income pool $ 4,732,983 $ 4,134,002 Alternative investments pool 2,558,422 2,610,107 Indexed equity pool 3,149,569 2,600,723 Domestic equity pool 6,119,590 5,504,431 Global equity pool 3,170,211 2,676,467
Total investments $ 19,730,775 $ 17,525,730
Securities lending collateral $ 2,194,122 $ 1,755,793
Building Land $ 171 $ 171 Building & equipment net of depreciation 7,283 7,563 Deferred bond charge net of amortization 0 84
Total building $ 7,454 $ 7,818
Capital assets net of depreciation 8,863 6,026
Total Assets $ 22,506,368 $ 19,792,534

SECTION II - PLAN ASSETS
15
TABLE 1 (continued)
STATEMENT OF FIDUCIARY NET POSITION (Dollars in Thousands)
June 30, 2014 June 30, 2013
Liabilities Amount Amount Current
Accounts payable $ 10,467 $ 8,687 Accrued compensated absences 77 67 Accrued expenses - building 32 90 Bonds payable 591 576 Bonds interest payable 14 15 Securities lending collateral 2,194,122 1,755,793
Total current liabilities $ 2,205,303 $ 1,765,228
Long term Accrued compensated absences $ 649 $ 604 Bonds payable 6,732 7,383
Total long term liabilities $ 7,381 $ 7,987
Total Liabilities $ 2,212,684 $ 1,773,215
Net position restricted for pensions $ 20,293,684 $ 18,019,319 Earnings Limitation Savings Account (ELSA) accounts payable (4,090) (4,125)
Net position restricted for pensions, after adjustment for ELSA accounts $ 20,289,594 $ 18,015,194

SECTION II - PLAN ASSETS
16
TABLE 2
STATEMENT OF CHANGES IN FIDUCIARY NET POSITION (Dollars in Thousands)
The following exhibit shows the revenue, expenses and resulting assets of the Fund as reported by the Teachers Retirement Association for the Plan’s fiscal years ended June 30, 2014 and 2013.
For Year Ended
June 30, 2014 June 30, 2013 Additions
Contributions Member $ 294,632 $ 265,809 Employer 299,300 270,708 Direct aid (state/city/district) 21,001 19,954 Earnings Limitation Savings Account (ELSA) 1,647 1,792 Total contributions $ 616,580 $ 558,263
Investment Income Investment appreciation in fair value $ 3,277,719 $ 2,326,918 Less investment expenses (28,205) (24,702) Net Investment Income $ 3,249,514 $ 2,302,216
Securities Lending activities Securities lending income $ 12,182 $ 13,230 Securities lending expenses: Borrowing rebates (107) (757) Management fees (3,896) (4,394) Total securities lending expenses (4,003) (5,151) Net income from securities lending 8,179 8,079 Total Net Investment Income $ 3,257,693 $ 2,310,295
Other Income 3,855 3,683
Total Additions $ 3,878,128 $ 2,872,241
Deductions Benefits Paid Retirement benefits $ (1,580,120) $ (1,521,477) Refunds of contributions to members (12,566) (10,463) Total benefits paid $ (1,592,686) $ (1,531,940) Administrative Expenses (9,430) (9,131) Total Deductions $ (1,602,116) $ (1,541,071)
Increase/(Decrease) in ELSA Account Value (1,612) (2,081)
Net Increase (Decrease) 2,274,400 1,329,089
Net Position Restricted for Pensions Beginning of Year $ 18,015,194 $ 16,686,105 End of Year $ 20,289,594 $ 18,015,194

SECTION II - PLAN ASSETS
17
TABLE 3
ACTUARIAL VALUE OF ASSETS AS OF JUNE 30, 2014 (Dollars in Thousands)
1. Market value of assets available for benefits $ 20,289,594
2. Determination of average balance a. Assets available at July 1, 2013* $ 18,019,319 b. Assets available at June 30, 2014* 20,293,684 c. Net investment income for fiscal year ending June 30, 2014 3,257,693 d. Average balance (a. + b. - c.) / 2 $ 17,527,655
3. Expected return (8.0% * 2.d.) 1,402,212
4. Actual return 3,257,693
5. Current year unrecognized asset return 1,855,481
6. Unrecognized asset returns Original % Not Amount Recognized a. Year ended June 30, 2014 $ 1,855,481 80% $ 1,484,385 b. Year ended June 30, 2013 1,014,336 60% 608,602 c. Year ended June 30, 2012 (1,045,252) 40% (418,101) d. Year ended June 30, 2011 2,163,878 20% 432,776 e. Total return not yet recognized $ 2,107,662
7. Actuarial value of assets at June 30, 2014 (1. - 6.e.) $ 18,181,932
* Before recognition of ELSA accounts payable.

18
This page is intentionally left blank

SECTION III - PLAN LIABILITIES
19
SECTION III
PLAN LIABILITIES

SECTION III - PLAN LIABILITIES
20
This page is intentionally left blank

SECTION III - PLAN LIABILITIES
21
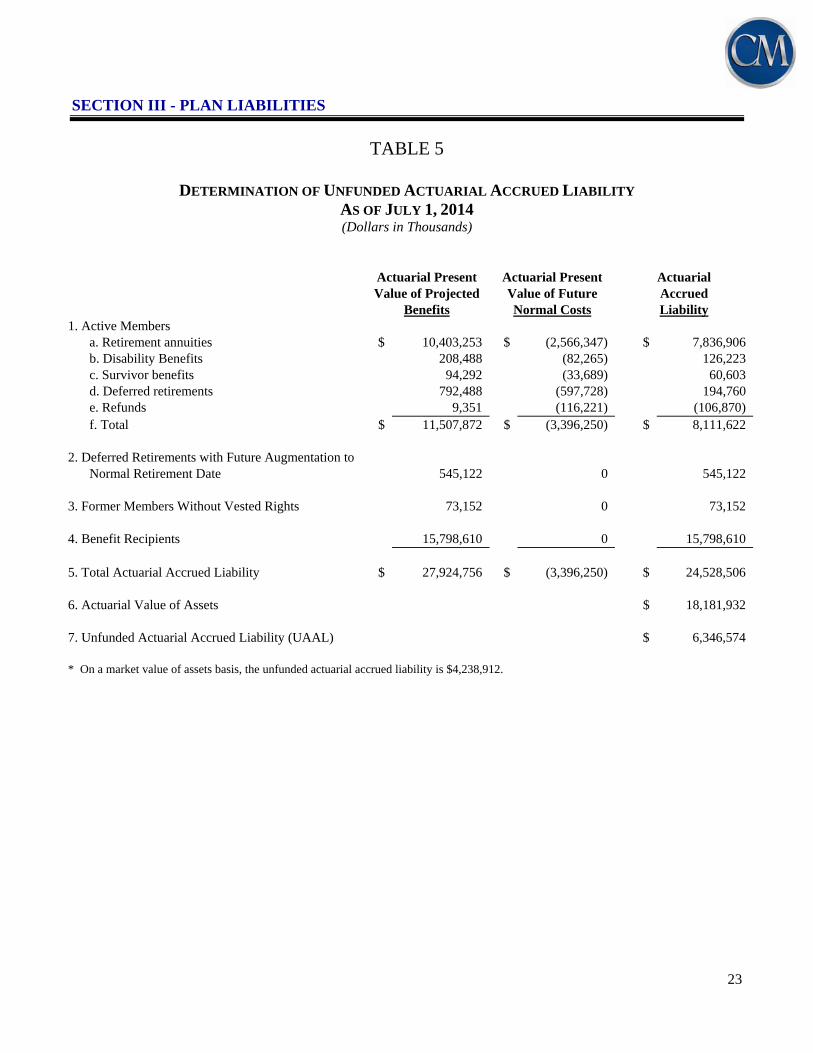
In the previous section, an analysis was given of the assets of the System as of the valuation date, July 1, 2014. In this section, the discussion will focus on the commitments of the System, which are referred to as its liabilities. Table 5 contains an analysis of the actuarial present value of all future benefits (PVFB) for contributing members, inactive members, retirees and their beneficiaries. The analysis is provided for each group. The liabilities summarized in Table 5 include the actuarial present value of all future benefits expected to be paid with respect to each member. For an active member, this value includes measures of both benefits already earned and future benefits expected to be earned. For all members, active and retired, the value extends over benefits earnable and payable for the rest of their lives and, if an optional benefit is chosen, for the lives of the surviving beneficiaries. The actuarial assumptions used to determine liabilities are based on the results of the 2004-2008 Quadrennial Experience Study. This set of assumptions is shown in Appendix C. The liabilities reflect the benefit structure in place as of July 1, 2014. Actuarial Liabilities A fundamental principle in financing the liabilities of a retirement program is that the cost of its benefits should be related to the period in which benefits are earned, rather than to the period of benefit distribution. An actuarial cost method is a mathematical technique that allocates the present value of future benefits into annual costs. In order to perform this allocation, it is necessary for the funding method to “breakdown” the present value of future benefits into two components:
(1) that which is attributable to the past and
(2) that which is attributable to the future. Actuarial terminology calls the part attributable to the past the “past service liability” or the “actuarial accrued liability”. The portion allocated to the future is known as the present value of future normal costs, with the specific piece of it allocated to the current year being called the “normal cost”. Table 5 contains the calculation of the unfunded actuarial accrued liability.

SECTION III - PLAN LIABILITIES
22
TABLE 4
ACTUARIAL VALUATION BALANCE SHEET AS OF JULY 1, 2014 (Dollars in Thousands)
The actuarial balance sheet is based on the fundamental equation that, at any given time, the present value of benefits to be paid in the future must be equal to the assets on hand plus the present value of future contributions to be received. The total contribution rate is determined as that amount which will make the total present and potential assets balance with the total present value of future benefits. The contributions made in excess of amounts required for current benefit payments are accumulated as a reserve to help meet benefit payments in later years. This reserve system is designed to enable the establishment of a level rate of contribution each year. A. Actuarial Value of Assets $ 18,181,932
B. Expected Future Assets 1. Present value of expected future statutory supplemental contributions* $ 4,194,966 2. Present value of expected future normal cost contributions 3,396,250 3. Total expected future assets (1. + 2.) $ 7,591,216
C. Total Current and Expected Future Assets** $ 25,773,148
Non-Vested Vested Benefits Benefits Total
D. Current Benefit Obligations 1. Benefit recipients a. Service retirements $ 0 $ 14,715,304 $ 14,715,304 b. Disability 0 143,924 143,924 c. Survivors 0 939,382 939,382 2. Deferred retirements with augmentation to Normal Retirement Date 0 545,122 545,122 3. Former members without vested rights*** 73,152 0 73,152 4. Active members 51,393 6,959,377 7,010,770 5. Total Current Benefit Obligations $ 124,545 $ 23,303,109 $ 23,427,654
E. Expected Future Benefit Obligations 4,497,102
F. Total Current and Expected Future Benefit Obligations 27,924,756
G. Unfunded Current Benefit Obligations (D.5. - A.) 5,245,722
H. Unfunded Current and Future Benefit Obligations (F. - C.) 2,151,608
* Under LCPR guidelines, this amount does not include supplemental payments which could occur after the expiration of the remaining 23 year amortization period.
** Does not reflect deferred investment experience in the asset smoothing method. Total expected future assets on a market value basis is $ 27,880,810.
*** Former members with insufficient service to vest who have not collected a refund of member contributions as of the valuation date.
SECTION III - PLAN LIABILITIES
23
TABLE 5
DETERMINATION OF UNFUNDED ACTUARIAL ACCRUED LIABILITY AS OF JULY 1, 2014 (Dollars in Thousands)
Actuarial Present Actuarial Present Actuarial Value of Projected Value of Future Accrued Benefits Normal Costs Liability 1. Active Members a. Retirement annuities $ 10,403,253 $ (2,566,347) $ 7,836,906 b. Disability Benefits 208,488 (82,265) 126,223 c. Survivor benefits 94,292 (33,689) 60,603 d. Deferred retirements 792,488 (597,728) 194,760 e. Refunds 9,351 (116,221) (106,870) f. Total $ 11,507,872 $ (3,396,250) $ 8,111,622 2. Deferred Retirements with Future Augmentation to Normal Retirement Date 545,122 0 545,122 3. Former Members Without Vested Rights 73,152 0 73,152 4. Benefit Recipients 15,798,610 0 15,798,610 5. Total Actuarial Accrued Liability $ 27,924,756 $ (3,396,250) $ 24,528,506 6. Actuarial Value of Assets $ 18,181,932 7. Unfunded Actuarial Accrued Liability (UAAL) $ 6,346,574 * On a market value of assets basis, the unfunded actuarial accrued liability is $4,238,912.

SECTION III - PLAN LIABILITIES
24
TABLE 6
CHANGES IN UNFUNDED ACTUARIAL ACCRUED LIABILITY (UAAL) (Dollars in Thousands)
A. Unfunded actuarial accrued liability at beginning of year $ 6,644,003
B. Changes due to interest requirements and current rate of funding* 1. Normal cost and actual administrative expenses $ 362,765 2. Contributions (616,580) 3. Interest on A., B.1., and B.2. at 8.0% 521,563 4. Total (B.1. + B.2. + B.3.) $ 267,748
C. Expected unfunded actuarial accrued liability at end of year (A. + B.4.) $ 6,911,751
D. Increase (decrease) due to actuarial losses (gains) because of experience deviations from expected 1. Salary increases $ (116,563) 2. Investment return (actuarial assets) (1,079,735) 3. Mortality of active members (1,279) 4. Mortality of benefit recipients 10,082 5. Retirement from active service 51,258 6. Other items 57,640 7. Total $ (1,078,597)
E. Unfunded actuarial accrued liability at end of year before plan amendments and changes in actuarial assumptions (C. + D.7.) $ 5,833,154
F. Change in unfunded actuarial accrued liability due to changes in assumptions** $ 513,420
G. Unfunded actuarial accrued liability at end of year (E. + F.) $ 6,346,574
* The amortization of the unfunded actuarial accrued liability (UAAL) using the current amortization method results in initial payments less than the "interest only" payment on the UAAL. Payments less than the interest only amount will result in the UAAL increasing in the absence of actuarial gains.
** Assumption changed to assume COLA will increase at expected date of satisfying requirements to increase if all actuarial assumptions are met in the future.

SECTION IV – SYSTEM CONTRIBUTIONS
25
SECTION IV
SYSTEM CONTRIBUTIONS

SECTION IV – SYSTEM CONTRIBUTIONS
26
This page is intentionally left blank

SECTION IV - CONTRIBUTIONS
27
Sections II and III were devoted to a discussion of the assets and liabilities of the System. A comparison of Tables 3 and 4 indicates that current assets fall short of meeting the actuarial present value of future projected benefits (total liability). This is expected in all but a fully closed fund, where no further contributions are anticipated. In an active system, there will almost always be a difference between the actuarial value of assets and total liabilities. This deficiency has to be made up by future contributions and investment returns. An actuarial valuation sets out a schedule of future contributions that will finance this deficiency in an orderly fashion. The method used to determine the incidence of the contributions in various years is called the actuarial cost method. Under an actuarial cost method, the contributions required to meet the difference between current assets and current liabilities are allocated each year between two elements: (1) the normal cost and (2) the payment on the unfunded actuarial accrued liability. The term “fully funded” is often applied to a system in which contributions at the normal cost rate are sufficient to pay for the benefits of existing employees as well as for those of new employees. More often than not, systems are not fully funded, either because of past benefit improvements that have not been completely funded and/or because of actuarial deficiencies that have occurred because experience has not been as favorable as anticipated. Under these circumstances, an unfunded actuarial accrued liability (UAAL) exists. Description of Rate Components The actuarial cost method for the System is the traditional Entry Age Normal (EAN) – level percent of pay cost method. Under the EAN cost method, the actuarial present value of each member’s projected benefits is allocated on a level basis over the member’s compensation between the entry age of the member and the assumed exit ages. The portion of the actuarial present value allocated to the valuation year is called the normal cost. The actuarial present value of benefits allocated to prior years of service is called the actuarial accrued liability. The unfunded actuarial accrued liability (UAAL) represents the difference between the actuarial accrued liability and the actuarial value of assets as of the valuation date. The unfunded actuarial accrued liability is calculated each year and reflects experience gains/losses (actual experience versus experience expected based on the actuarial assumptions). The UAAL is amortized over a period set in state statute (by June 30, 2037). Contributions to fund the UAAL are determined as a level percentage of payroll assuming payroll increases 3.75% each year.

SECTION IV - CONTRIBUTIONS
28
TABLE 7
NORMAL COST AT JULY 1, 2014 (Dollars in Thousands)
Percent Dollar of Pay Amount
1. Normal Cost Rate a. Retirement benefits 6.74% $ 293,494 b. Disability benefits 0.20% 8,710 c. Survivor benefits 0.09% 3,921 d. Deferred retirement benefits* 1.37% 59,654 e. Refunds 0.30% 13,064
f. Total 8.70% $ 378,843 * For vested members, includes the greater of the refund amount or the present value of the deferred monthly
benefit.

SECTION IV - CONTRIBUTIONS
29
TABLE 8
DETERMINATION OF SUPPLEMENTAL CONTRIBUTION RATE (Dollars in Thousands)
Amount A. Determination of Unfunded Actuarial Accrued Liability (UAAL)* 1. Actuarial accrued liability $ 24,528,506 2. Actuarial value of assets 18,181,932
3. Unfunded actuarial accrued liability $ 6,346,574
B. Determination of Supplemental Contribution Rate* 1. Present value of future payrolls through the amortization date of June 30, 2037 $ 62,055,712 2. Supplemental contribution rate (A.3. / B.1.)** 10.23%
* On a market value of assets basis, the unfunded actuarial accrued liability is $4,238,912 and the supplemental contribution rate is 6.83% of payroll.
** The amortization factor as of July 1, 2014 is 14.2526.

SECTION IV - CONTRIBUTIONS
30
TABLE 9
DETERMINATION OF CONTRIBUTION SUFFICIENCY/(DEFICIENCY) (Dollars in Thousands)
The annual required contribution (ARC) is the sum of normal cost, a supplemental contribution to amortize the UAAL, and an allowance for expenses. The statutory contribution rates do not reflect the scheduled increase for July 1, 2014.
Percent of Dollar Payroll Amount
A. Statutory contributions - Chapter 354
1. Employee contributions 7.50% $ 326,573
2. Employer contributions* 7.70% 335,309
3. Supplemental contributions** a. 1993 Legislation 0.11% 5,000 b. 1996 Legislation 0.07% 3,047 c. 1997 Legislation 0.30% 12,954
4. Total 15.68% $ 682,883
B. Required contributions - Chapter 356
1. Normal cost a. Retirement benefits 6.74% $ 293,494 b. Disability benefits 0.20% 8,710 c. Survivors 0.09% 3,921 d. Deferred retirement benefits 1.37% 59,654 e. Refunds 0.30% 13,064 f. Total 8.70% $ 378,843
2. Supplemental contribution for the amortization of the Unfunded Actuarial Accrued Liability by June 30, 2037 10.23% 445,413
3. Allowance for expenses 0.22% $ 9,579
4. Total annual contribution for fiscal year ending June 30, 2015*** 19.15% $ 833,835
C. Contribution Sufficiency / (Deficiency) (A.4. - B.4.)*** (3.47%) $ (150,952)
Note: Projected annual payroll for fiscal year beginning on the valuation date: $4,353,988
* Employer contribution rate is blended to reflect rates of 15.14% of pay for Basic members, 7.50% of pay for Coordinated members not employed by Special School District #1, and 11.14% of pay for Coordinated members who are employed by Special School District #1.
** Includes contributions from School District #1, the City of Minneapolis, and matching state contributions. *** On a market value of assets basis, the total required contribution is 15.75% of payroll and the contribution deficiency is
0.07% of payroll.

SECTION IV - CONTRIBUTIONS
31
TABLE 10
STATUTORY AND REQUIRED CONTRIBUTION AMOUNTS
(Dollars in Thousands)
Basic Members
Percent of Dollar Payroll Amount
A. Statutory contributions - Chapter 354 1. Employee contributions 11.00% $ 76 2. Employer contributions* 15.14% 105 3. Supplemental contributions** a. 1993 Legislation 0.11% 1 b. 1996 Legislation 0.07% 0 c. 1997 Legislation 0.30% 2 4. Total 26.62% $ 184
B. Required contributions - Chapter 356 1. Normal cost a. Retirement benefits 11.75% $ 82 b. Disability benefits 0.46% 3 c. Survivors 0.43% 3 d. Deferred retirement benefits 2.02% 14 e. Refunds 0.54% 4 f. Total 15.20% $ 106
Note: Projected annual payroll for fiscal year beginning on the valuation date: $695 for 8 members.
* All Basic active members are teachers employed by Special School District #1; employer contribution rate of 15.14% of payroll applies.
** Includes contributions from School District #1, the City of Minneapolis and matching state contributions.

SECTION IV - CONTRIBUTIONS
32
TABLE 11
STATUTORY AND REQUIRED CONTRIBUTION AMOUNTS (Dollars in Thousands)
Coordinated Members
Percent of Dollar Payroll Amount
A. Statutory contributions - Chapter 354 1. Employee contributions 7.50% $ 326,497 2. Employer contributions* 7.70% 335,204 3. Supplemental contributions** a. 1993 Legislation 0.11% 4,999 b. 1996 Legislation 0.07% 3,047 c. 1997 Legislation 0.30% 12,952 4. Total 15.68% $ 682,699
B. Required contributions - Chapter 356 1. Normal cost a. Retirement benefits 6.74% $ 293,412 b. Disability benefits 0.20% 8,707 c. Survivors 0.09% 3,918 d. Deferred retirement benefits 1.37% 59,640 e. Refunds 0.30% 13,060 f. Total 8.70% $ 378,737
Note: Projected annual payroll for fiscal year beginning on the valuation date: $4,353,293. This includes $4,115,581 for 73,152 Coordinated members who are not employed by Special School District #1 and $237,712 for 4,083 members who are employed by Special School District #1.
* Employer contribution rate is blended to reflect rates of 7.50% of pay for Coordinated members not employed by Special School District #1, and 11.14% of pay for Coordinated members who are employed by Special School District #1.
** Includes contributions from School District #1, the City of Minneapolis, and matching state contributions.

SECTION V – ADDITIONAL INFORMATION
33
SECTION V
ADDITIONAL INFORMATION

SECTION V – ADDITIONAL INFORMATION
34
This page is intentionally left blank

SECTION V – ADDITIONAL INFORMATION
35
This section contains information that may be helpful in understanding the Systems’ historical funding as well as current information regarding membership information and expected benefit payments. Some of the historical information was required under prior GASB accounting standards, but continues to provide useful information. Current financial reporting information required under Governmental Accounting Standards Board Statement No. 67 is provided in a separate report.

SECTION V – ADDITIONAL INFORMATION
36
TABLE 12
SUMMARY OF MEMBERSHIP DATA
July 1, 2014 July 1, 2013 Active members: Vested 61,552 61,398 Non-vested 15,691 15,367
Total 77,243 76,765
Pensioners and Beneficiaries 58,809 57,168
Terminated vested members entitled to, but not yet receiving, benefits: 12,907 12,614
Other terminated, non-vested members entitled to a refund of contributions 29,984 28,881
Total 178,943 175,428
SECTION V – ADDITIONAL INFORMATION
37
TABLE 13
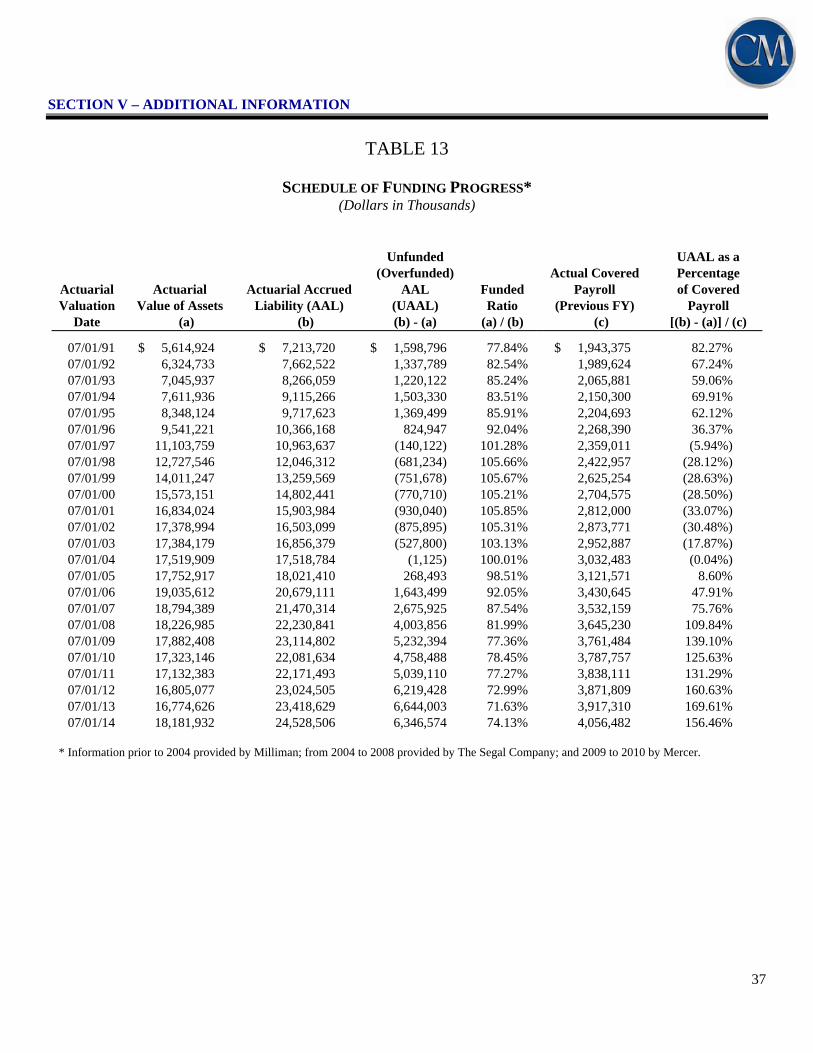
SCHEDULE OF FUNDING PROGRESS* (Dollars in Thousands)
Unfunded UAAL as a (Overfunded) Actual Covered Percentage
Actuarial Actuarial Actuarial Accrued AAL Funded Payroll of Covered Valuation Value of Assets Liability (AAL) (UAAL) Ratio (Previous FY) Payroll
Date (a) (b) (b) - (a) (a) / (b) (c) [(b) - (a)] / (c)
07/01/91 $ 5,614,924 $ 7,213,720 $ 1,598,796 77.84% $ 1,943,375 82.27% 07/01/92 6,324,733 7,662,522 1,337,789 82.54% 1,989,624 67.24% 07/01/93 7,045,937 8,266,059 1,220,122 85.24% 2,065,881 59.06% 07/01/94 7,611,936 9,115,266 1,503,330 83.51% 2,150,300 69.91% 07/01/95 8,348,124 9,717,623 1,369,499 85.91% 2,204,693 62.12% 07/01/96 9,541,221 10,366,168 824,947 92.04% 2,268,390 36.37% 07/01/97 11,103,759 10,963,637 (140,122) 101.28% 2,359,011 (5.94%) 07/01/98 12,727,546 12,046,312 (681,234) 105.66% 2,422,957 (28.12%) 07/01/99 14,011,247 13,259,569 (751,678) 105.67% 2,625,254 (28.63%) 07/01/00 15,573,151 14,802,441 (770,710) 105.21% 2,704,575 (28.50%) 07/01/01 16,834,024 15,903,984 (930,040) 105.85% 2,812,000 (33.07%) 07/01/02 17,378,994 16,503,099 (875,895) 105.31% 2,873,771 (30.48%) 07/01/03 17,384,179 16,856,379 (527,800) 103.13% 2,952,887 (17.87%) 07/01/04 17,519,909 17,518,784 (1,125) 100.01% 3,032,483 (0.04%) 07/01/05 17,752,917 18,021,410 268,493 98.51% 3,121,571 8.60% 07/01/06 19,035,612 20,679,111 1,643,499 92.05% 3,430,645 47.91% 07/01/07 18,794,389 21,470,314 2,675,925 87.54% 3,532,159 75.76% 07/01/08 18,226,985 22,230,841 4,003,856 81.99% 3,645,230 109.84% 07/01/09 17,882,408 23,114,802 5,232,394 77.36% 3,761,484 139.10% 07/01/10 17,323,146 22,081,634 4,758,488 78.45% 3,787,757 125.63% 07/01/11 17,132,383 22,171,493 5,039,110 77.27% 3,838,111 131.29% 07/01/12 16,805,077 23,024,505 6,219,428 72.99% 3,871,809 160.63% 07/01/13 16,774,626 23,418,629 6,644,003 71.63% 3,917,310 169.61% 07/01/14 18,181,932 24,528,506 6,346,574 74.13% 4,056,482 156.46%
* Information prior to 2004 provided by Milliman; from 2004 to 2008 provided by The Segal Company; and 2009 to 2010 by Mercer.

SECTION V – ADDITIONAL INFORMATION
38
TABLE 14
SCHEDULE OF CONTRIBUTIONS FROM THE EMPLOYER AND OTHER CONTRIBUTING ENTITIES (Dollars in Thousands)
Actuarially Plan Year Required Actual Actual Member Annual Required Actual
Ended Contribution Covered Payroll Contributions Contributions Employer Percentage June 30 Rate (a) (b) (c) [(a)*(b)] - (c) Contributions1 Contributed
2000 8.36% $ 2,704,575 $ 138,696 $ 87,406 $ 134,419 153.79% 20012 7.92% 2,812,000 145,075 77,635 139,799 180.07%
2002 7.85% 2,873,771 152,331 73,260 142,222 194.13% 20033 7.57% 2,952,887 155,577 67,957 149,481 219.96%
2004 8.37% 3,032,483 159,140 94,679 151,029 159.52% 2005 8.46% 3,121,571 160,982 103,103 157,693 152.95% 20064 9.05% 3,430,645 177,085 133,389 200,286 150.15%
20075 12.16% 3,532,159 199,869 229,642 209,219 91.11%
20086 13.44% 3,645,230 209,592 280,327 231,562 82.60%
20097 15.08% 3,761,484 212,043 355,189 240,718 67.72%
20108 16.81% 3,787,757 214,909 421,813 242,088 57.39%
20119 15.71% 3,838,111 218,024 384,943 244,233 63.45%
201210 16.57% 3,871,809 239,834 401,725 266,661 66.38%
201311 18.75% 3,917,310 270,708 463,788 290,662 62.67%
201412 19.41% 4,056,482 294,632 492,731 320,301 65.01%
201513 19.15%
Note: Information prior to 2004 provided by Milliman USA; 2004 to 2008 information provided by The Segal Company; 2009 and 2010 information provided by Mercer.
1 Includes contributions from other sources (if applicable) 2 Actuarially Required Contribution Rate prior to change in Actuarial Assumptions and Asset Valuation Method is 7.31%. 3 Actuarially Required Contribution Rate prior to change in Actuarial Assumptions is 8.11%. 4 Actuarially Required Contribution Rate shown is the contribution rate stated in the TRA July 1, 2005 actuarial valuation. 5 Actuarially Required Contributions calculated according to parameters of GASB 25 (30-year amortization period), and
post-merger of the Minneapolis Teachers' Retirement Fund Association. 6 Actuarially Required Contribution Rate prior to change in Asset Valuation Method is 11.58%. 7 Actuarially Required Contribution Rate prior to change in Actuarial Assumptions is 15.36%. 8 Actuarially Required Contribution Rate prior to change in Asset Valuation Method is 19.98%. 9 Actuarially Required Contribution Rate prior to change in Actuarial Assumptions and Plan Provisions is 18.91%.
10 Actuarially Required Contribution Rate prior to change in Actuarial Assumptions is 16.91%. 11 Actuarially Required Contribution Rate prior to change in Actuarial Assumptions is 18.15%. 12 Actuarially Required Contribution Rate prior to change in Plan Provisions is 19.66%. 13 Actuarially Required Contribution Rate prior to change in Actuarial Assumptions is 17.95%.

SECTION V – ADDITIONAL INFORMATION
39
TABLE 15
PROJECTED BENEFIT PAYMENTS (Dollars in Thousands)
The table below shows estimated benefits expected to be paid over the next twenty-five years, based on the assumptions used in the valuation. The “Actives” column shows benefits expected to be paid to members currently active on July 1, 2014. The “Retirees” column shows benefits expected to be paid to all other members. This includes those who, as of July 1, 2014, are receiving benefit payments or who terminated employment and are entitled to a deferred benefit.
Year Ending
June 30 Actives Retirees Total 2015 $ 39,121 $ 1,600,845 $ 1,639,965 2016 102,023 1,578,122 1,680,145 2017 161,095 1,564,289 1,725,384 2018 221,184 1,552,507 1,773,691 2019 283,332 1,541,124 1,824,456 2020 347,250 1,529,747 1,876,996 2021 411,718 1,518,218 1,929,935 2022 475,872 1,504,331 1,980,204 2023 538,978 1,488,985 2,027,964 2024 599,709 1,471,263 2,070,972 2025 659,235 1,451,941 2,111,175 2026 720,422 1,429,816 2,150,238 2027 786,042 1,404,921 2,190,962 2028 857,325 1,376,931 2,234,255 2029 935,189 1,346,126 2,281,315 2030 1,020,283 1,312,379 2,332,662 2031 1,112,895 1,276,085 2,388,979 2032 1,213,398 1,236,784 2,450,182 2033 1,327,574 1,200,402 2,527,976 2034 1,449,160 1,161,202 2,610,362 2035 1,577,764 1,120,016 2,697,780 2036 1,713,020 1,075,781 2,788,801 2037 1,854,547 1,028,782 2,883,329 2038 1,998,663 978,701 2,977,364 2039 2,142,659 925,492 3,068,152
Note: Numbers may not add due to rounding Cash flows are the expected future non-discounted payments to current members. These numbers exclude refund payouts to current nonvested inactives and assume future retirees and future terminated members make benefit elections according to valuation assumptions.

40
This page is intentionally left blank
APPENDIX A – MEMBERSHIP DATA
41
APPENDIX A
SUMMARY STATISTICS ON MEMBERSHIP DATA

APPENDIX A – MEMBERSHIP DATA
42
This page is intentionally left blank

APPENDIX A – MEMBERSHIP DATA
43
TABLE 16
RECONCILIATION OF MEMBERS* Benefit Recipients**** Active Former Service Disability Members** Members*** Retirements Retirements Survivors Total Members on 7/1/2013 76,765 41,495 52,331 568 4,269 175,428 New hires 4,852 - - - - 4,852 Return from inactive 1,724 (1,724) - - - 0 Return from zero balance 457 - - - - 457 Transfer to inactive (4,225) 4,225 - - - 0 Refunded (240) (691) - - - (931) Restored write-off - 142 - - - 142 Repay refunds - 39 - - - 39 Transfer from non-status - 20 - - - 20 Retirements (1,971) (589) 2,551 (56) - (65) Benefits began - - - 72 406 478 Benefits ended - - - (4) (57) (61) Deaths (53) (59) (1,105) (19) (146) (1,382) Adjustments for Disabilitants 1 - - - - 1 Adjustments (Other) (67) 33 (3) 2 - (35) Net changes 478 1,396 1,443 (5) 203 3,515 Members on 7/1/2014 77,243 42,891 53,774 563 4,472 178,943
* All figures in this chart were provided by the Teachers Retirement Association. Recipient counts include all pensions in force, including double counting of multiple benefit types. Service Retirements include Supplemental and Variable optional joint annuitants. We have found these results to be reasonable. ** Active members include 8 Basic and 77,235 Coordinated members. *** Former members include 28 Basic and 42,863 Coordinated members. **** Benefit recipients include 4,467 Basic members and 54,342 Coordinated members.
Former Member Statistics Vested Non-vested Total Number 12,907 29,984 42,891 Average Age 47.7 49.0 48.6 Average Service (years) 7.6 1.0 2.9 Average annual benefits, with augmentation to Normal Retirement Date and 4% Combined Service Annuity load $10,100 N/A N/A Average refund value, with 4% Combined Service Annuity load $30,283 $2,476 $10,844
APPENDIX A – MEMBERSHIP DATA
44
TABLE 17
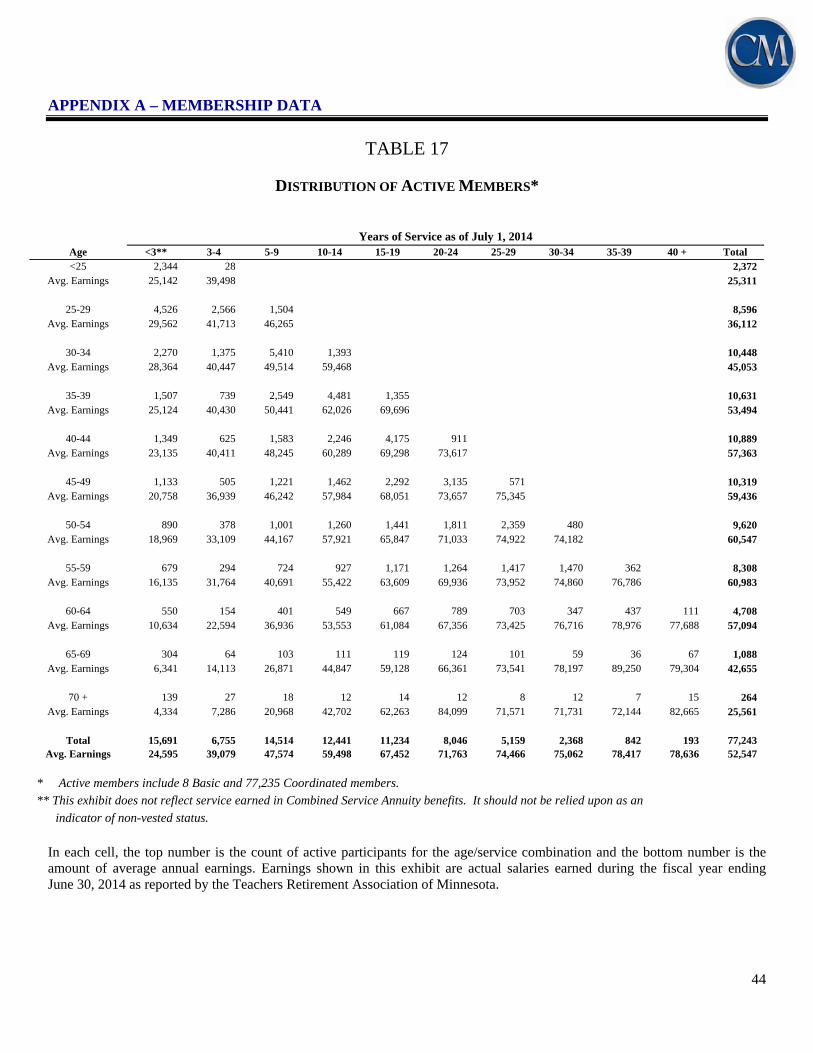
DISTRIBUTION OF ACTIVE MEMBERS*
Years of Service as of July 1, 2014
Age <3** 3-4 5-9 10-14 15-19 20-24 25-29 30-34 35-39 40 + Total <25 2,344 28 2,372
Avg. Earnings 25,142 39,498 25,311
25-29 4,526 2,566 1,504 8,596 Avg. Earnings 29,562 41,713 46,265 36,112
30-34 2,270 1,375 5,410 1,393 10,448 Avg. Earnings 28,364 40,447 49,514 59,468 45,053
35-39 1,507 739 2,549 4,481 1,355 10,631 Avg. Earnings 25,124 40,430 50,441 62,026 69,696 53,494
40-44 1,349 625 1,583 2,246 4,175 911 10,889 Avg. Earnings 23,135 40,411 48,245 60,289 69,298 73,617 57,363
45-49 1,133 505 1,221 1,462 2,292 3,135 571 10,319 Avg. Earnings 20,758 36,939 46,242 57,984 68,051 73,657 75,345 59,436
50-54 890 378 1,001 1,260 1,441 1,811 2,359 480 9,620 Avg. Earnings 18,969 33,109 44,167 57,921 65,847 71,033 74,922 74,182 60,547
55-59 679 294 724 927 1,171 1,264 1,417 1,470 362 8,308 Avg. Earnings 16,135 31,764 40,691 55,422 63,609 69,936 73,952 74,860 76,786 60,983
60-64 550 154 401 549 667 789 703 347 437 111 4,708 Avg. Earnings 10,634 22,594 36,936 53,553 61,084 67,356 73,425 76,716 78,976 77,688 57,094
65-69 304 64 103 111 119 124 101 59 36 67 1,088 Avg. Earnings 6,341 14,113 26,871 44,847 59,128 66,361 73,541 78,197 89,250 79,304 42,655
70 + 139 27 18 12 14 12 8 12 7 15 264 Avg. Earnings 4,334 7,286 20,968 42,702 62,263 84,099 71,571 71,731 72,144 82,665 25,561
Total 15,691 6,755 14,514 12,441 11,234 8,046 5,159 2,368 842 193 77,243 Avg. Earnings 24,595 39,079 47,574 59,498 67,452 71,763 74,466 75,062 78,417 78,636 52,547
* Active members include 8 Basic and 77,235 Coordinated members. ** This exhibit does not reflect service earned in Combined Service Annuity benefits. It should not be relied upon as an indicator of non-vested status.
In each cell, the top number is the count of active participants for the age/service combination and the bottom number is the amount of average annual earnings. Earnings shown in this exhibit are actual salaries earned during the fiscal year ending June 30, 2014 as reported by the Teachers Retirement Association of Minnesota.

APPENDIX A – MEMBERSHIP DATA
45
TABLE 18
DISTRIBUTION OF SERVICE RETIREMENTS
Years Since Retirement as of July 1, 2014 Age <1 1-4 5-9 10-14 15-19 20-24 25 + Total <55 2 1 3
Avg. Benefit 34,945 41,292 37,061
55-59 591 1,168 10 1,769 Avg. Benefit 33,639 33,707 37,365 33,705
60-64 918 4,777 3,166 74 1* 8,936 Avg. Benefit 27,712 30,998 27,431 34,701 1,562 29,424
65-69 507 3,661 5,469 4,321 444 4* 14,406 Avg. Benefit 22,660 22,113 24,695 23,022 29,598 2,614 23,610
70-74 57 583 2,312 4,463 3,729 83 5 11,232 Avg. Benefit 17,935 18,709 20,950 23,215 26,466 29,813 9,765 23,610
75-79 5 62 299 1,488 3,833 1,917 80 7,684 Avg. Benefit 18,788 16,276 16,760 21,267 31,133 32,787 23,043 28,864
80-84 2 11 35 150 1,309 2,602 1,065 5,174 Avg. Benefit 5,140 15,207 12,137 20,545 31,258 37,869 28,370 33,504
85-89 3 9 22 118 958 1,828 2,938 Avg. Benefit 26,153 49,888 13,904 33,048 35,437 33,987 34,312
90 + 1 3 14 64 1,550 1,632 Avg. Benefit 2,020 29,884 17,623 33,323 30,720 30,690
Total 2,082 10,266 11,301 10,521 9,447 5,624 4,533 53,774 Avg. Benefit 27,860 27,334 24,476 22,885 29,240 35,552 31,295 27,411
* Pertaining to the accounts of former participants in the Minnesota Variable Annuity Fund, abolished by law in 1989. In each cell, the top number is the count of retired participants for the age/years retired combination and the bottom number is the average annual benefit amount.
APPENDIX A – MEMBERSHIP DATA
46
TABLE 19
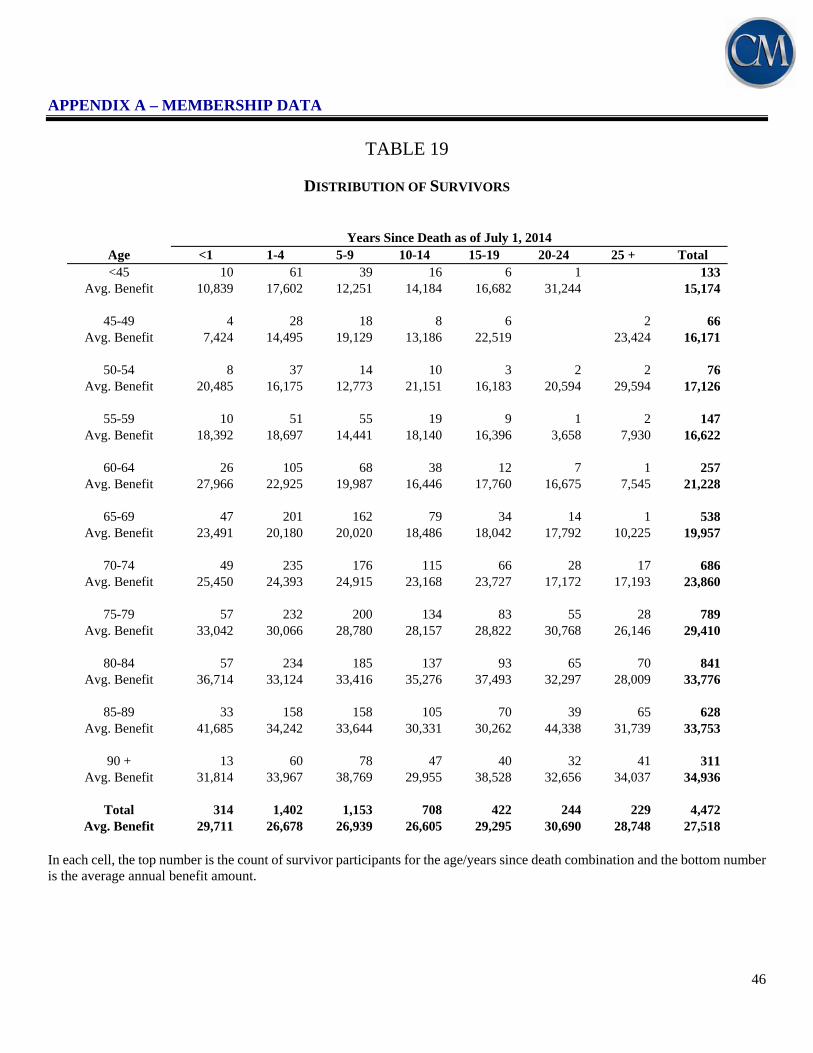
DISTRIBUTION OF SURVIVORS
Years Since Death as of July 1, 2014 Age <1 1-4 5-9 10-14 15-19 20-24 25 + Total <45 10 61 39 16 6 1 133
Avg. Benefit 10,839 17,602 12,251 14,184 16,682 31,244 15,174
45-49 4 28 18 8 6 2 66 Avg. Benefit 7,424 14,495 19,129 13,186 22,519 23,424 16,171
50-54 8 37 14 10 3 2 2 76 Avg. Benefit 20,485 16,175 12,773 21,151 16,183 20,594 29,594 17,126
55-59 10 51 55 19 9 1 2 147 Avg. Benefit 18,392 18,697 14,441 18,140 16,396 3,658 7,930 16,622
60-64 26 105 68 38 12 7 1 257 Avg. Benefit 27,966 22,925 19,987 16,446 17,760 16,675 7,545 21,228
65-69 47 201 162 79 34 14 1 538 Avg. Benefit 23,491 20,180 20,020 18,486 18,042 17,792 10,225 19,957
70-74 49 235 176 115 66 28 17 686 Avg. Benefit 25,450 24,393 24,915 23,168 23,727 17,172 17,193 23,860
75-79 57 232 200 134 83 55 28 789 Avg. Benefit 33,042 30,066 28,780 28,157 28,822 30,768 26,146 29,410
80-84 57 234 185 137 93 65 70 841 Avg. Benefit 36,714 33,124 33,416 35,276 37,493 32,297 28,009 33,776
85-89 33 158 158 105 70 39 65 628 Avg. Benefit 41,685 34,242 33,644 30,331 30,262 44,338 31,739 33,753
90 + 13 60 78 47 40 32 41 311 Avg. Benefit 31,814 33,967 38,769 29,955 38,528 32,656 34,037 34,936
Total 314 1,402 1,153 708 422 244 229 4,472 Avg. Benefit 29,711 26,678 26,939 26,605 29,295 30,690 28,748 27,518
In each cell, the top number is the count of survivor participants for the age/years since death combination and the bottom number is the average annual benefit amount.

APPENDIX A – MEMBERSHIP DATA
47
TABLE 20
DISTRIBUTION OF DISABILITY RETIREMENTS
Years Disabled as of July 1, 2014 Age <1 1-4 5-9 10-14 15-19 20-24 25 + Total <45 1 13 8 2 24
Avg. Benefit 12,825 9,827 5,083 4,432 7,921
45-49 2 14 10 5 3 34 Avg. Benefit 18,057 12,652 8,613 6,596 6,208 10,323
50-54 5 38 19 3 3 1 69 Avg. Benefit 23,706 18,228 14,026 13,013 6,003 2,735 16,485
55-59 9 59 33 17 6 5 129 Avg. Benefit 19,725 22,773 18,473 12,477 18,135 9,726 19,382
60-64 5 75 91 61 33 10 1 276 Avg. Benefit 26,046 25,256 22,845 17,120 19,527 19,856 5,242 21,724
65-69 1 20 7 2 1 31 Avg. Benefit 22,941 23,233 30,708 10,536 19,991 23,988
Total 23 219 168 90 46 16 1 563 Avg. Benefit 21,659 21,461 19,623 15,093 17,605 15,620 5,242 19,393
In each cell, the top number is the count of disabled participants for the age/years disabled combination and the bottom number is the average annual benefit amount.

48
This page is intentionally left blank

APPENDIX B - SUMMARY OF PLAN PROVISIONS
49
APPENDIX B
SUMMARY OF PLAN PROVISIONS

APPENDIX B - SUMMARY OF PLAN PROVISIONS
50
This page is intentionally left blank

APPENDIX B - SUMMARY OF PLAN PROVISIONS
51
BASIC MEMBERS
This summary of provisions reflects our interpretation of applicable Statutes for purposes of preparing this valuation. This interpretation is not intended to provide a basis for administering the Plan.
Plan year July 1 through June 30
Eligibility Teachers first hired prior to July 1, 1978 employed by the Board of Education of Special School District No. 1, other than a charter school, and not covered by the Social Security Act. Certain part-time licensed employees of Special School District No. 1 are also covered. These members were transferred to TRA as part of the merger of the Minneapolis Teachers Retirement Fund Association (MTRFA) effective June 30, 2006.
Contributions Shown as a percent of Salary:
Date of Increase Member Employer July 1, 2013 10.50% 14.64% July 1, 2014 11.00% 15.14%
After June 30, 2015, the member and employer contribution rates may be adjusted as follows: if a contribution sufficiency of at least 1% has existed for two
consecutive years, the member and employer contribution rates may be decreased to a level that is necessary to maintain a 1% sufficiency
if a contribution deficiency of at least 0.25% has existed for two
consecutive years, the member and employer contribution rates may each be increased as shown:
Contribution Deficiency
Allowable Increase in Member
and Employer Contribution Rates <2% of pay 0.25% of pay
2% to 4% of pay 0.50% of pay >4% of pay 0.75% of pay
Potential contribution increases after June 30, 2015 are not reflected in this valuation report.
Employee contributions are "picked up" according to the provisions of Internal Revenue Code 414(h).
Teaching service A year is earned during a calendar year if the member is employed in a covered position and employee contributions are deducted. Certain part-time service and military service is also included.

APPENDIX B - SUMMARY OF PLAN PROVISIONS
52
BASIC MEMBERS
Salary Periodic compensation used for contribution purposes excluding lump sum annual or sick leave payments, severance payments, any payments made in lieu of employer paid fringe benefits or expenses, and employer contributions to a Section 457 deferred compensation plan.
Average salary Average of the five highest successive years of Salary. Retirement Normal retirement
Age/Service requirements Age 60, or any age with 30 years of Teaching Service
Amount 2.50% of Average Salary for each year of Teaching Service.
Early retirement
Age/Service requirements Age 55 with less than 30 years of Teaching Service.
Amount The greater of (a) or (b):
(a) 2.25% of Average Salary for each year of Teaching Service with reduction of 0.25% for each month before the Member would first be eligible for a normal retirement benefit.
(b) 2.50% of Average Salary for each year of Teaching Service assuming augmentation to the age of first eligibility for a normal retirement benefit at 3.00% per year and actuarial reduction for each month before the member would be first eligible for a normal retirement benefit.
An alternative benefit is available to members who are at least age 50 and have seven years of Teaching Service. The benefit is based on the accumulation of the 6.50% "city deposits" to the Retirement Fund. Other benefits are also provided under this alternative depending on the member's age and Teaching Service.
Form of payment Life annuity. Actuarially equivalent options are: (a) 10 or 15 year Certain and Life (b) 50%, 75% or 100% Joint and Survivor with bounce back feature
(option is canceled if member is predeceased by beneficiary).
Benefit increases Benefit recipients received no annual increases in 2011 and 2012. Beginning January 1, 2013 the annual increase is 2.0% per year. When the funding ratio reaches 90% (on a Market Value of Assets basis) for two consecutive years, the annual increase will be 2.5%. A benefit recipient who has been receiving a benefit for at least 18 full months as of December 31 will receive a full increase. Members receiving benefits for at least six full months but less than 18 full months will receive a pro-rata increase.

APPENDIX B - SUMMARY OF PLAN PROVISIONS
53
BASIC MEMBERS
Disability
Age/service requirement Total and permanent disability with three years of Teaching Service
Amount An annuity actuarially equivalent to the continued accumulation of member and city contributions at the current rate for a period of 15 years (but not beyond age 65) plus an additional benefit equal to the smaller of 100% of the annuity provided by city contributions only or $150 per month. A member with 20 years of Teaching Service also receives an additional $7.50 per month. Payments stop earlier if disability ceases or death occurs. Benefits may be reduced on resumption of partial employment.
Form of payment Same as for retirement.
Benefit increases Same as for retirement.
Death Choice of Benefit A, Benefit B or Benefit C Benefit A Age/Service requirements Death before retirement.
Amount The accumulation of member and city contributions plus 6.00% interest. Paid as a life annuity, 15-year Certain and Life, or lump sum. If an annuity is chosen the beneficiary also receives additional benefits.
Benefit B Age/Service requirements An active member with seven years of Teaching Service. A former member age
60 with seven years of Teaching Service who dies before retirement or disability benefits begin.
Amount The actuarial equivalent of any benefits the member could have received if resignation occurred on the date of death.
Benefit C Age/Service requirements As an active member who dies and leaves surviving children.
Amount A monthly benefit of $248.30 to the surviving widow while caring for a child and an additional $248.30 per month for each surviving dependent child. The maximum family benefit is $579.30 per month.
Benefits to the widow cease upon death or when no longer caring for an eligible child. Benefits for dependent children cease upon marriage or age 18 (age 22 if a full time student).
Benefit Increases Same as for retirement.

APPENDIX B - SUMMARY OF PLAN PROVISIONS
54
BASIC MEMBERS
Withdrawal
Refund of contribution
Age/Service requirements Termination of Teaching Service.
Amount Member's contributions earn 4.00% interest compounded annually. For vested members, a deferred annuity may be elected in lieu of a refund.
Deferred annuity
Age/Service Requirements Seven years of Teaching Service
Amount The benefit is computed under law in effect at termination and increased by the following percentage compounded annually:
(a) 3.00% therefore until the earlier of January 1 of the year following attainment of age 55 and June 30, 2012;
(b) 5.00% thereafter until the earlier of June 30, 2012 and when the annuity begins; and
(c) 2.00% beginning July 1, 2012.
In addition, the interest earned on the member and city contributions between termination and age 60 can be applied to provide an additional annuity.

APPENDIX B - SUMMARY OF PLAN PROVISIONS
55
COORDINATED MEMBERS This summary of provisions reflects our interpretation of applicable Statutes for purposes of preparing this valuation. This interpretation is not intended to provide a basis for administering the Plan.
Plan year July 1 through June 30
Eligibility A public school or MNSCU teacher who is covered by the Social Security Act, except for teachers employed by St. Paul or Duluth public schools or by the University of Minnesota. Charter school teachers employed by St. Paul or Duluth public schools are covered by TRA.
No MNSCU teacher will become a new Member unless that person elects coverage as defined by Minnesota Statutes under Chapter 354B.
Contributions Shown as a percent of Salary: Date of Increase Member Employer July 1, 2013 7.00% 7.00% July 1, 2014 7.50% 7.50%
Employer also contributes Supplemental amount equal to 3.64% of Salary (members employed by Special School District #1 only).
After June 30, 2015, the member and employer contribution rates may be adjusted as follows:
if a contribution sufficiency of at least 1% has existed for two consecutive years, the member and employer contribution rates may be decreased to a level that is necessary to maintain a 1% sufficiency
if a contribution deficiency of at least 0.25% has existed for two consecutive years, the member and employer contribution rates may each be increased as shown:
Contribution Deficiency
Allowable Increase in Member and Employer Contribution Rates
<2% of pay 0.25% of pay 2% to 4% of pay 0.50% of pay
>4% of pay 0.75% of pay
Potential contribution increases after June 30, 2015 are not reflected in this valuation report. Employee contributions are "picked up" according to the provisions of Internal Revenue Code 414(h).
Teaching service A year is earned during a calendar year if the member is employed in a covered position and employee contributions are deducted. Certain part-time service and military service is also included.

APPENDIX B - SUMMARY OF PLAN PROVISIONS
56
COORDINATED MEMBERS
Salary Periodic compensation used for contribution purposes excluding lump sum annual or sick leave payments, severance payments, any payments made in lieu of employer paid fringe benefits or expenses, and employer contributions to a Section 457 deferred compensation plan.
Average salary Average of the five highest successive years of Salary. Average salary is based on all Allowable Service if less than five years.
Retirement
Normal retirement Age/Service requirements First hired before July 1, 1989:
(a) Age 65 and three years of Allowable Service; or (b) Age 62 and 30 years of Allowable Service.
Proportionate Retirement Annuity is available at age 65 and one year of Allowable Service.
First hired after June 30, 1989:
The age when first eligible for full Social Security retirement benefits (but not to exceed age 66) and three years of Allowable Service.
Proportionate Retirement Annuity is available at normal retirement age and one year of Allowable Service.
Early retirement Age/Service requirements First hired before July 1, 1989:
(a) Age 55 and three years of Allowable Service; or (b) Any age and 30 years of Allowable Service; or (c) Rule of 90: Age plus Allowable Service totals 90.
First hired after June 30, 1989:
(a) Age 55 with three years of Allowable Service.

APPENDIX B - SUMMARY OF PLAN PROVISIONS
57
COORDINATED MEMBERS
Retirement(continued)
Amount First hired before July 1, 1989:
The greater of (a), (b) or (c): (a) 1.20% of Average Salary for each of the first ten years of Allowable
Service. 1.70% of Average Salary for each year of Allowable Service in excess of 10 prior to July 1, 2006, and 1.90% of Average Salary for years of Allowable Service after July 1, 2006. No actuarial reduction if age plus years of service totals 90. Otherwise reduction of 0.25% for each month the member is under age 65 (or 62 if 30 years of Allowable Service) at time of retirement.
(b) 1.70% of Average Salary for each year of Allowable Service prior to July 1, 2006 and 1.90% for each year of Allowable Service beginning July 1, 2006, assuming augmentation to normal retirement age at 3.00% per year (2.50% per year for members hired after June 30, 2006) and actuarial reduction for each month the member is under the full Social Security benefit retirement age (not to exceed age 66). Beginning July 1, 2015, new early retirement reduction factors will apply, including special factors for members retiring at age 62 or later with at least 30 years of service.
(c) For eligible members: the monthly benefit that is actuarially equivalent to 2.2 times the members' accumulated deductions plus interest thereon.
First hired after June 30, 1989:
1.70% of Average Salary for each year of Allowable Service prior to July 1, 2006 and 1.90% for each year of Allowable Service beginning July 1, 2006, assuming augmentation to normal retirement age at 3.00% per year (2.50% per year for members hired after June 30, 2006) and actuarial reduction for each month the member is under the full Social Security benefit retirement age (not to exceed age 66). Beginning July 1, 2015, new early retirement reduction factors will apply, including special factors for members retiring at age 62 or later with at least 30 years of service.

APPENDIX B - SUMMARY OF PLAN PROVISIONS
58
Early Retirement Reduction Factors
Age
Hired before 7/1/89
Hired from 7/1/89 to 6/30/06
Hired after 6/30/06
55 43.56% 51.55% 54.08% 58 33.59% 40.46% 42.74% 60 24.65% 30.75% 32.74% 62 13.68% 18.96% 20.53% 65 0.00% 4.21% 4.68% 66 0.00% 0.00% 0.00%
Members who are age 62 with 30 years of service are eligible for a special set of reduction factors:
Age Hired before
7/1/89 Hired from 7/1/89
to 6/30/06 Hired after
6/30/06
62 10.40% 14.46% 16.11% 63 6.64% 10.40% 11.70% 64 3.18% 6.64% 7.55% 65 0.00% 3.18% 3.65% 66 0.00% 0.00% 0.00%
Form of Payment Life annuity. Actuarially equivalent options are:
(a) 50%, 75% or 100% Joint and Survivor with bounce back feature (option is canceled if member is predeceased by beneficiary).
(b) 15 year Certain and Life (c) Guaranteed Refund.

APPENDIX B - SUMMARY OF PLAN PROVISIONS
59
COORDINATED MEMBERS
Retirement(continued)
Benefit increases Benefit recipients received no annual increase in 2011 and 2012. Beginning
January 1, 2013 the annual increase is 2.0% per year. When the funding ratio reaches 90% (on a Market Value of Assets basis) for two consecutive years, the annual increase will revert to 2.5%. A benefit recipient who has been receiving a benefit for at least 18 full months as of December 31 will receive a full increase. Members receiving benefits for at least six full months but less than 18 full months will receive a pro-rata increase.
Disability Age/service requirement Total and permanent disability before Normal Retirement Age with three
years of Allowable Service. Amount Normal Retirement Benefit based on Allowable Service and Average Salary
at disability without reduction for commencement before Normal Retirement Age unless an optional annuity plan is selected.
Payments stop at Normal Retirement Age or the five year anniversary of the effective date of the disability benefit, whichever is later. Payments stop earlier if disability ceases or death occurs. Benefits may be reduced on resumption of partial employment.
Form of payment Same as for retirement.
Benefit increases Same as for retirement.
Retirement after disability Age/service requirement Normal Retirement Age or the five year anniversary of the effective date of
the disability benefit, whichever is later.
Amount Any optional annuity continues. Otherwise, the larger of the disability
benefit paid before Normal Retirement Age or the normal retirement benefit available at Normal Retirement Age, or an actuarially equivalent optional annuity.
Benefit increases Same as for retirement.

APPENDIX B - SUMMARY OF PLAN PROVISIONS
60
COORDINATED MEMBERS
Death
Surviving spouse optional annuity
Age/Service requirements Member or former member with three years of Allowable Service who dies before retirement or disability benefits commence.
Amount Survivor's payment of the 100% Joint and Survivor benefit or an actuarial equivalent term certain annuity. If commencement is prior to age 65 (age 62 if 30 years of service), the benefit is reduced for early retirement with half the applicable reduction factor used from age 55 to actual commencement age. If no surviving spouse, then an actuarial equivalent dependent child benefit is paid to age 20 or for five years if longer.
Benefit increase Same as for retirement.
Withdrawal
Refund of contributions
Age/Service requirements Thirty days following termination of teaching service.
Amount Member's contributions earn 4.00% interest compounded annually. For vested members, a deferred annuity may be elected in lieu of a refund.
Deferred annuity
Age/Service requirements Vested at date of termination. Current requirement is three years of Allowable Service.

APPENDIX B - SUMMARY OF PLAN PROVISIONS
61
COORDINATED MEMBERS
Withdrawal (continued)
Amount For members first hired prior to July 1, 2006, the benefit is computed under law in effect at termination and increased by the following percentage compounded annually:
(a) 3.00% therefore until the earlier of January 1 of the year following attainment of age 55 and June 30, 2012;
(b) 5.00% thereafter until the earlier of June 30, 2012 and when the annuity begins; and
(c) 2.00% from July 1, 2012 forward.
Amount is payable as a normal or early retirement.
A member who terminated service before July 1, 1997 whose benefit does not commence until after June 30, 1997 shall receive an actuarially equivalent increase to reflect the change from 5.00% to 6.00% in the post-retirement interest assumption; or
For eligible members; the monthly benefit that is actuarially equivalent to 2.2 times the members' accumulated deductions plus interest thereon.
For members first hired July 1, 2006 and after, the benefit computed under law in effect at termination is increased by 2.50% compounded annually until June 30, 2012 and increased by 2.00% from July 1, 2012 forward until the annuity begins.

APPENDIX C – ACTUARIAL METHODS AND ASSUMPTIONS
62
APPENDIX C
ACTUARIAL METHODS AND ASSUMPTIONS

APPENDIX C – ACTUARIAL METHODS AND ASSUMPTIONS
63
This page is intentionally left blank

APPENDIX C – ACTUARIAL METHODS AND ASSUMPTIONS
64
Actuarial Cost Method
Liabilities and contributions in this report are computed using the Individual Entry Age Normal Cost Method. This method is prescribed by Minnesota Statutes. The objective under this method is to fund each member's benefits under the Plan as payments which are level as a percentage of salary, starting at original participation date (or employment date), and continuing until the assumed date of retirement termination, disability or death. For valuation purposes, entry age for each member is determined as the age at valuation minus years of service as of the valuation date. At any given date, a liability is calculated equal to the contributions which would have been accumulated if this method of funding had always been used, the current plan provisions had always been in place, and all assumptions had been met. The difference between this liability and the assets (if any) which are held in the fund is the unfunded actuarial accrued liability. The unfunded actuarial accrued liability is typically funded over a chosen period in accordance with the amortization schedule. A detailed description of the calculation follows: The normal cost for each active member under the assumed retirement age is determined by applying to earnings the level percentage of salary which, if contributed each year from date of entry into the Plan until the assumed retirement (termination, disability or death) date, is sufficient to provide the full value of the benefits expected to be payable.
• The present value of future normal costs is the total of the discounted values of all active members' normal cost, assuming these to be paid in each case from the valuation date until retirement (termination, disability or death) date.
• The present value of projected benefits is calculated as the value of all benefit payments expected to
be paid to the Plan's current members, including active and retired members, beneficiaries, and terminated members with vested rights.
• The actuarial accrued liability is the excess of the present value of projected benefits over the present
value of future normal costs.
• The unfunded actuarial accrued liability is the excess of the actuarial accrued liability over the assets of the fund, and represents that part of the actuarial accrued liability which has not been funded by accumulated past contributions.
Amortization Method The unfunded actuarial accrued liability is amortized as a level percentage of payroll each year to the statutory amortization date of June 30, 2037, assuming payroll increases of 3.75% per year (effective with the 2011 valuation). If the unfunded actuarial accrued liability is negative, the surplus amount is amortized over 30 years as a level percentage of payroll. If there is an increase in the unfunded actuarial accrued liability due to a change in the actuarial assumptions, plan provisions, or actuarial cost method, a new amortization period is determined. This new amortization period is determined by blending the period needed to amortize the prior unfunded actuarial accrued liability over the prior amortization period and the increase in unfunded actuarial accrued liability amortized over 30 years. If there is a decrease in the unfunded actuarial accrued liability, no change is made to the amortization period.

APPENDIX C – ACTUARIAL METHODS AND ASSUMPTIONS
65
Asset Valuation Method
As prescribed in the Minnesota Statutes Section 356.215, Subdivision 1, Paragraph (f), the assets are valued based on a five-year moving average of expected and market values (five-year average actuarial value) determined as follows:
• At the end of each plan year, an average asset value is calculated as the average of the market asset
value at the beginning and end of the fiscal year net of investment income for the fiscal year;
• The investment gain or (loss) is taken as the excess of actual investment income over the expected investment income based on the average asset value as calculated above;
• The investment gain or (loss) so determined is recognized over five years at 20% per year;
• The asset value is the sum of the market value plus the scheduled recognition of investment gains or
(losses) during the current and the preceding four fiscal years. Supplemental Contributions The City of Minneapolis, the Minneapolis School District, and the State of Minnesota are scheduled to make the following supplemental contributions to the Fund in FY15:
1993 Legislation: Supplemental contributions of $5,000,000 annually are assumed to be made until full actuarial funding is achieved. Amount is fixed in statute.
1996 Legislation: Supplemental contributions of $3,047,009 annually are assumed to
be made until the amortization date of June 30, 2037 or full actuarial funding is achieved, whichever is earlier. Amount is variable as described in Minnesota Statutes, Chapter 423A.02. Assumed amount is based on actual amount received in most recent fiscal year, and information provided by the Teachers Retirement Association.
1997 Legislation: Supplemental contributions of $12,954,000 annually are assumed to
be made until full actuarial funding is achieved or the stabilizer may be used to decrease contribution rates. Amount is fixed in statute.
The 1996 Legislation amount increased from $2,000,000 to $3,047,009 since the prior valuation.

APPENDIX C – ACTUARIAL METHODS AND ASSUMPTIONS
66
Entry Age Calculation As required by the LCPR Standards for Actuarial Work, a member’s Entry Age is calculated as the age at the valuation date less years of service. Age on the valuation date is calculated as age nearest birthday. The years of service for each member are provided by TRA. Decrement Timing All decrements are assumed to occur in the middle of the plan year. This is the preferred decrement timing in the LCPR Standards for Actuarial Work. Funding Objective The fundamental financing objective of the fund is to establish contribution rates which, when expressed as a percentage of active member payroll, will remain approximately level from generation to generation and meet the required deadline for full funding. Benefits included or excluded To the best of our knowledge, all material benefits have been included in the liability. IRC Section 415(b): The limitations of Internal Revenue Code Section 415(b) have been incorporated into our calculations. Annual benefits may not exceed the limits in IRC Section 415. This limit is indexed annually. For 2014, the limit is $210,000. IRC Section 401(a)(17): The limitations of Internal Revenue Code Section 401(a)(l7) have been incorporated into our calculations. Compensation for any 12-month period used to determine accrued benefits may not exceed the limits in IRC Section 401(a)(17) for the calendar year in which the 12-month period begins. This limit is indexed annually. For 2014, the limit is $260,000. Certain members first hired before July 1, 1995 may have a higher limit.
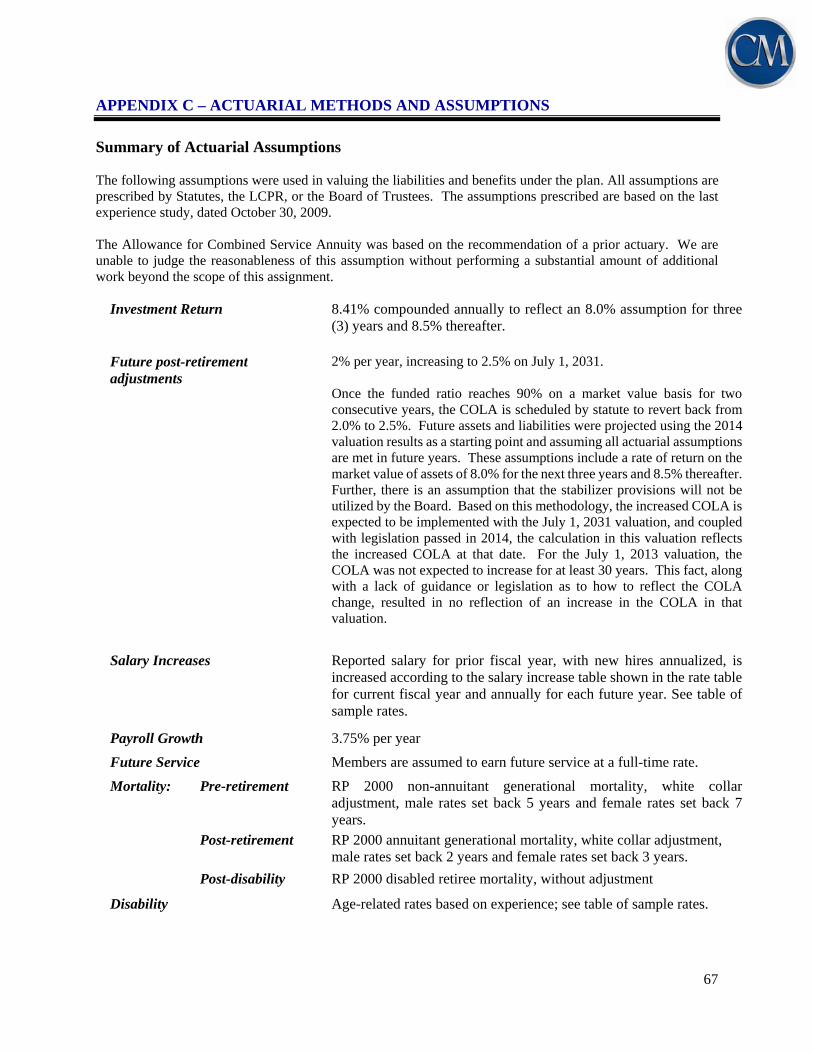
APPENDIX C – ACTUARIAL METHODS AND ASSUMPTIONS
67
Summary of Actuarial Assumptions The following assumptions were used in valuing the liabilities and benefits under the plan. All assumptions are prescribed by Statutes, the LCPR, or the Board of Trustees. The assumptions prescribed are based on the last experience study, dated October 30, 2009. The Allowance for Combined Service Annuity was based on the recommendation of a prior actuary. We are unable to judge the reasonableness of this assumption without performing a substantial amount of additional work beyond the scope of this assignment.
Investment Return 8.41% compounded annually to reflect an 8.0% assumption for three (3) years and 8.5% thereafter.
Future post-retirement adjustments
2% per year, increasing to 2.5% on July 1, 2031. Once the funded ratio reaches 90% on a market value basis for two consecutive years, the COLA is scheduled by statute to revert back from 2.0% to 2.5%. Future assets and liabilities were projected using the 2014 valuation results as a starting point and assuming all actuarial assumptions are met in future years. These assumptions include a rate of return on the market value of assets of 8.0% for the next three years and 8.5% thereafter. Further, there is an assumption that the stabilizer provisions will not be utilized by the Board. Based on this methodology, the increased COLA is expected to be implemented with the July 1, 2031 valuation, and coupled with legislation passed in 2014, the calculation in this valuation reflects the increased COLA at that date. For the July 1, 2013 valuation, the COLA was not expected to increase for at least 30 years. This fact, along with a lack of guidance or legislation as to how to reflect the COLA change, resulted in no reflection of an increase in the COLA in that valuation.
Salary Increases Reported salary for prior fiscal year, with new hires annualized, is increased according to the salary increase table shown in the rate table for current fiscal year and annually for each future year. See table of sample rates.
Payroll Growth 3.75% per year
Future Service Members are assumed to earn future service at a full-time rate.
Mortality: Pre-retirement RP 2000 non-annuitant generational mortality, white collar adjustment, male rates set back 5 years and female rates set back 7 years.
Post-retirement RP 2000 annuitant generational mortality, white collar adjustment, male rates set back 2 years and female rates set back 3 years.
Post-disability RP 2000 disabled retiree mortality, without adjustment
Disability Age-related rates based on experience; see table of sample rates.

APPENDIX C – ACTUARIAL METHODS AND ASSUMPTIONS
68
Summary of Actuarial Assumptions (continued)
Withdrawal Select and ultimate rates based on actual plan experience. Ultimate rates after the third year are shown in the rate table. Select rates are as follows: First Year Second Year Third Year Male 45% 12% 6% Female 40% 10% 8%
Expenses Prior year administrative expenses expressed as percentage of prior year payroll.
Retirement Age Graded rates beginning at age 55 as shown in rate table. Members who have attained the highest assumed retirement age will retire in one year.
Percentage Married 85% of male members and 65% of female members are assumed to be married. Members are assumed to have no children.
Age Difference Females two years younger than males.
Allowance for Combined Service Annuity
Liabilities for active members are increased by 1.40% and liabilities for former members are increased by 4.00% to account for the effect of some Participants being eligible for a Combined Service Annuity.
Refund of Contributions All employees withdrawing after becoming eligible for a deferred benefit are assumed to take the larger of their contributions accumulated with interest or the value of their deferred benefit.
Interest on member contributions
Members and former members who are eligible for the money purchase annuity are assumed to receive interest credits equal to the Pre-Retirement interest rate. All other members and former members receive the interest crediting rate as specified in statutes.
Commencement of deferred benefits
Members receiving deferred annuities (including current terminated deferred members) are assumed to begin receiving benefits at unreduced retirement age.
Form of payment Married members are assumed to elect subsidized joint and survivor form of annuity as follows: Males:
10% elect 50% J&S option
15% elect 75% J&S option 70% elect 100% J&S option Females:
20% elect 50% J&S option
10% elect 75% J&S option 50% elect 100% J&S option
Members eligible for deferred annuities (including current terminated deferred members) and future disability benefits are assumed to elect a life annuity.

APPENDIX C – ACTUARIAL METHODS AND ASSUMPTIONS
69
Summary of Actuarial Assumptions (continued) Missing data for members Membership data was supplied by TRA as of the valuation date. This
information has not been audited by CMC. We have reviewed the information for internal consistency and we have no reason to doubt its substantial accuracy. In the small number of cases where submitted data was missing or incomplete and could not be recovered from prior years, the following assumptions were applied, if needed:
Data for active members: Salary, Service, and Date of Birth Gender
Based on current active demographics. Female
Data for terminated members: Date of birth July 1, 1964 Average salary $29,000 Date of termination Derived from date of birth,
original entry age, and service
Data for in-pay members: Beneficiary date of birth Wife two years younger than
husband Gender Based on first name Form of payment Life annuity for retirees and
beneficiaries, 100% J&S option for disabled retirees.
Rate (%)
Ultimate Withdrawal Disability
Age Male Female Male Female
20 3.70 4.50 0.00 0.00 25 3.20 4.50 0.00 0.00 30 2.70 4.50 0.00 0.00 35 2.50 3.90 0.01 0.01 40 2.35 2.75 0.03 0.03 45 2.10 2.10 0.05 0.05 50 1.85 1.85 0.10 0.10 55 0.00 0.00 0.16 0.16 60 0.00 0.00 0.25 0.25 65 0.00 0.00 0.00 0.00 70 0.00 0.00 0.00 0.00 75 0.00 0.00 0.00 0.00

APPENDIX C – ACTUARIAL METHODS AND ASSUMPTIONS
70
Summary of Actuarial Assumptions (continued)
Mortality Rates (%)
Pre-Retirement* Post-Retirement** Post-Disability
Age Male Female Male Female Male Female 20 0.0269 0.0155 0.0316 0.0184 2.2571 0.745025 0.0345 0.0188 0.0373 0.0194 2.2571 0.745030 0.0376 0.0197 0.0393 0.0223 2.2571 0.745035 0.0353 0.0235 0.0481 0.0363 2.2571 0.745040 0.0591 0.0401 0.0766 0.0527 2.2571 0.745045 0.0890 0.0562 0.1124 0.0763 2.2571 0.745050 0.1342 0.0837 0.1711 0.1229 2.8975 1.153555 0.1978 0.1344 0.5716 0.2681 3.5442 1.654460 0.2747 0.2015 0.5688 0.4253 4.2042 2.183965 0.4263 0.3107 0.9232 0.6736 5.0174 2.802670 0.6725 0.4979 1.5834 1.1211 6.2583 3.763575 0.9823 0.7591 2.6710 1.8784 8.2067 5.2230
* Rates shown are RP 2000 employee mortality (base), white collar adjustment, set back 5 years for
males and 7 years for females.
** Rates shown are RP 2000 annuitant mortality (base), white collar adjustment, set back 2 years for
males and 3 years for females.

APPENDIX C – ACTUARIAL METHODS AND ASSUMPTIONS
71
Summary of Actuarial Assumptions (continued)
Salary Scale
Service Salary Increase
1 12.00% 2 9.00% 3 8.00% 4 7.50% 5 7.25% 6 7.00% 7 6.85% 8 6.70% 9 6.55% 10 6.40% 11 6.25% 12 6.00% 13 5.75% 14 5.50% 15 5.25% 16 5.00% 17 4.75% 18 4.50% 19 4.25% 20 4.00% 21 3.90% 22 3.80% 23 3.70% 24 3.60%
25 or more 3.50%
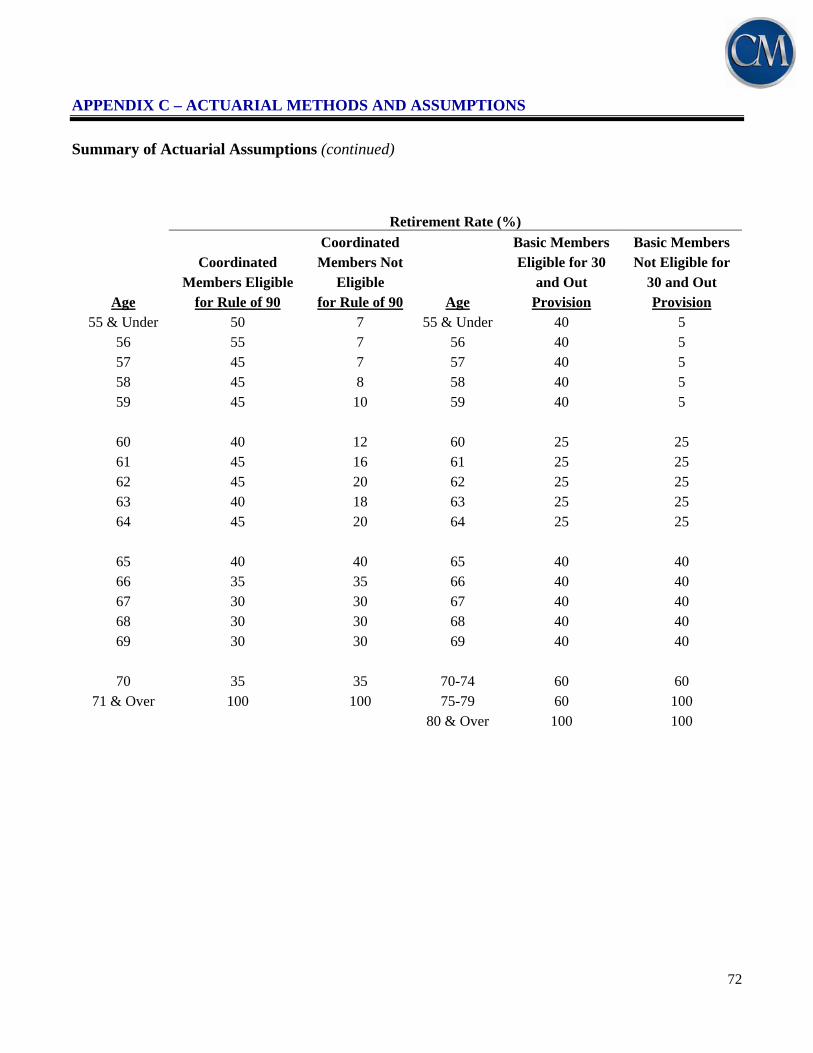
APPENDIX C – ACTUARIAL METHODS AND ASSUMPTIONS
72
Summary of Actuarial Assumptions (continued)
Retirement Rate (%)
Coordinated Basic Members Basic Members Coordinated Members Not Eligible for 30 Not Eligible for Members Eligible Eligible and Out 30 and Out
Age for Rule of 90 for Rule of 90 Age Provision Provision 55 & Under 50 7 55 & Under 40 5
56 55 7 56 40 5 57 45 7 57 40 5 58 45 8 58 40 5 59 45 10 59 40 5
60 40 12 60 25 25 61 45 16 61 25 25 62 45 20 62 25 25 63 40 18 63 25 25 64 45 20 64 25 25
65 40 40 65 40 40 66 35 35 66 40 40 67 30 30 67 40 40 68 30 30 68 40 40 69 30 30 69 40 40
70 35 35 70-74 60 60 71 & Over 100 100 75-79 60 100
80 & Over 100 100

APPENDIX C – ACTUARIAL METHODS AND ASSUMPTIONS
73
Future post-retirement adjustments
2% per year, increasing to 2.5% on July 1, 2031. Once the funded ratio reaches 90% on a market value basis for two consecutive years, the COLA is scheduled by statute to revert back from 2.0% to 2.5%. Future assets and liabilities were projected using the 2014 valuation results as a starting point and assuming all actuarial assumptions are met in future years. These assumptions include a rate of return on the market value of assets of 8.0% for the next three years and 8.5% thereafter. Further, there is an assumption that the stabilizer provisions will not be utilized by the Board. Based on this methodology, the increased COLA is expected to be implemented with the July 1, 2031 valuation, and coupled with legislation passed in 2014, the calculation in this valuation reflects the increased COLA at that date. For the July 1, 2013 valuation, the COLA was not expected to increase for at least 30 years. This fact, along with a lack of guidance or legislation as to how to reflect the COLA change, resulted in no reflection of an increase in the COLA in that valuation.
Changes in actuarial assumptions and methods since the previous valuation
The assumption for future post-retirement adjustments was changed as discussed earlier.

GLOSSARY
74
Actuarial Asset Value. The value of assets used in calculating the required contributions. The actuarial asset value may be equal to the fair market value of assets, or it may spread the recognition of certain investment gains or losses over a period of years in accordance with an asset valuation method. The goal of an asset valuation method is to produce a relatively stable asset value thereby reducing year-to-year volatility in contribution requirements. Actuarial Accrued Liability. The portion of the present value of all benefits attributable to service already rendered. Actuarial Cost Method. Sometimes called "funding method," a particular technique used by actuaries to establish the amount and incidence of the annual actuarial cost of pension plan benefits, or normal cost, and the related unfunded actuarial accrued liability. Ordinarily, the annual contribution to the plan comprises the normal cost and an amount for amortization of the unfunded actuarial accrued liability. ASA. Associate of the Society of Actuaries. Current Benefit Obligations. The present value of benefits earned to the valuation date, based on current service and including future salary increases to retirement. EA. Enrolled Actuary. FSA. Fellow of the Society of Actuaries. MAAA. Member of the American Academy of Actuaries. Normal Cost. The annual cost assigned to the current year, under the actuarial cost method in use. Present Value. Sometimes called "actuarial present value," the current worth (on the valuation date) of an amount or series of amounts payable or receivable in the future. The present value is determined by discounting the future payments at a predetermined rate of interest, taking into account the probability of payment. Statement No. 67 of the Governmental Accounting Standards Board (GASB 67). The accounting standard governing the financial reporting for defined benefit pension plans and note disclosures for defined benefit plans. Statement No. 68 of the Governmental Accounting Standards Board (GASB 68). The accounting standard governing a state or local governmental employer's accounting for pensions.