teacher shortages, teacher contracts and their impact …ftp.iza.org/dp2844.pdf · teacher...
TRANSCRIPT

IZA DP No. 2844
Teacher Shortages, Teacher Contractsand their Impact on Education in Africa
Jean BourdonMarkus FrölichKatharina Michaelowa
DI
SC
US
SI
ON
PA
PE
R S
ER
IE
S
Forschungsinstitutzur Zukunft der ArbeitInstitute for the Studyof Labor
June 2007

Teacher Shortages, Teacher Contracts and their Impact on Education in Africa
Jean Bourdon IREDU, University of Bourgogne
Markus Frölich
SIAW, University of St. Gallen, IFAU Uppsala and IZA
Katharina Michaelowa
University of Zurich
Discussion Paper No. 2844 June 2007
IZA
P.O. Box 7240 53072 Bonn
Germany
Phone: +49-228-3894-0 Fax: +49-228-3894-180
E-mail: [email protected]
Any opinions expressed here are those of the author(s) and not those of the institute. Research disseminated by IZA may include views on policy, but the institute itself takes no institutional policy positions. The Institute for the Study of Labor (IZA) in Bonn is a local and virtual international research center and a place of communication between science, politics and business. IZA is an independent nonprofit company supported by Deutsche Post World Net. The center is associated with the University of Bonn and offers a stimulating research environment through its research networks, research support, and visitors and doctoral programs. IZA engages in (i) original and internationally competitive research in all fields of labor economics, (ii) development of policy concepts, and (iii) dissemination of research results and concepts to the interested public. IZA Discussion Papers often represent preliminary work and are circulated to encourage discussion. Citation of such a paper should account for its provisional character. A revised version may be available directly from the author.

IZA Discussion Paper No. 2844 June 2007
ABSTRACT
Teacher Shortages, Teacher Contracts and their Impact on Education in Africa
Primary school enrolment rates are very low in francophone Africa. In order to enhance education supply, many countries have launched large teacher recruitment programmes in recent years, whereby teachers are no longer engaged on civil servant positions, but on the basis of (fixed-term) contracts typically implying considerably lower salaries and a sharply reduced duration of professional training. While this policy has led to a boost of primary enrolment, there is a concern about a loss in the quality of education. In this paper we analyse the impact on educational quality, by estimating nonparametrically the quantile treatment effects for Niger, Togo and Mali, based on very informative data, comparable across these countries. We find that contract teachers do relatively better for low ability children in low grades than for high ability children in higher grades. When positive treatment effects were found, they tended to be more positive at the low to medium quantiles; when negative effects were found they tended to be more pronounced at the high ability quantiles. Hence, overall it seems that contract teachers do a relatively better job for teaching students with learning difficulties than for teaching the ‘more advanced’ children. This implies that contract teachers tend to reduce inequalities in student outcomes. At the same time, we also observe clear differences between the countries. We find that, overall, effects are positive in Mali, somewhat mixed in Togo (with positive effects in 2nd and negative effects in 5th grade) and negative in Niger. This ordering is consistent with theoretical expectations derived from a closer examination of the different ways of implementation of the contract teacher programme in the three countries. In Mali and, to some extent, in Togo, the contract teacher system works more through the local communities. This may have led to closer monitoring and more effective hiring of contract teachers. In Niger, the system was changed in a centralized way with all contract teachers being public employees, so that there is no reason to expect much impact on local monitoring. In addition, the extremely fat hiring of huge numbers of contract teachers may also have contributed to relatively poor performance in Niger. These results are expected to be relevant for other sub-Saharan African countries, too, as well as for the design of new contract teacher programmes in the future. JEL Classification: O15, I 21, C14 Keywords: teacher incentives, quantile treatment effects, nonparametric estimation Corresponding author: Markus Frölich SIAW University of St. Gallen Bodanstr. 8 CH-9000 St. Gallen Switzerland E-mail: [email protected]

2
1. Introduction
With a rapidly increasing youth population and swift increases in the proportion of children
attending school, many developing countries are facing serious difficulties in recruiting and
financing qualified teachers. Therefore many African countries have been experimenting with
alternative teacher training and recruitment programmes employing so-called “contract
teachers” instead of traditional civil servants. These new teachers are usually hired on fixed-
term contracts with shorter training and lower remuneration. Similarly, contract teachers have
also been employed in Latin America and South Asia (for an overview, see Duthilleul 2005).
Despite the widespread introduction of contract teacher programmes in many countries from the
mid-1990s onwards, there does not seem to exist a detailed microeconometric evaluation of the
effects of this policy change.
In this paper, we analyse the effect of the reform process on student achievement in the three
francophone sub-Saharan African countries Mali, Niger and Togo. While these countries show
many social, economic and cultural similarities and introduced the contract teacher programmes
to cope with similar problems, the way these programmes were implemented and the
characteristics of the actual contracts used vary considerably.
The differences in the results of earlier studies for individual African countries (PASEC 2003,
2004, 2005a, 2005b, Vegas and de Laat 2003, Bourdon, Frölich and Michaelowa 2006) suggest
that these specific characteristics may determine the success or failure of these programmes. This
calls for a direct country-comparison using comparable data and a uniform estimation approach.
It is the objective of this paper to provide this comparison. In addition, this paper attempts to
improve upon the estimation techniques used in earlier studies by estimating quantile treatment
effects. Apart from the general advantage of nonparametric estimations to avoid functional form
assumptions, this has the additional benefit of providing us with detailed information on the
effect of contract teachers on different segments of the student population.
This paper is related to two distinct strands of the literature. The first concerns questions of
teacher incentives and working conditions. While studies on the effects of physical inputs have
not yet reached fully conclusive results (see e.g. Hanushek 2003 versus Krueger 2003), there is
growing recognition that these effects are, at best, rather limited. Therefore, for industrialised
and developing countries alike, scholars have turned increasingly to the analysis of incentives
and institutional conditions of teaching and learning. The discussion covers performance pay
(see e.g. Lavy 2002, 2004 for Israel; Kingdon and Teal 2007, and Muralidharan and
Sundararaman 2006 for India; Glewwe, Ilias and Kremer 2003 for Kenya; Spretsma and
Waldenberg 2007 for Brazil), standardised exams (Bishop and Wößmann 2004), private

3
education and school choice (King, Orazem and Wohlgemuth 1999, Angrist et al. 2002 and
Angrist, Bettinger and Kremer 2004 for Colombia; and Hoxby 2000, 2003a, 2003b mainly for
the United States) , teacher monitoring (Banerjee and Duflo 2006, Duflo and Hanna 2005, and
Kremer et al. 2005 for India), and monitoring by local communities (Reinikka and Svensson
2004 for Uganda, Francken Minten and Swinnen 2005 for Madagascar). In addition, the impact of
teacher quality and its relation to academic and professional qualifications has received increased
attention (Rivkin, Hanushek and Kain 2005; Hanushek et al. 2005; Clotfelter, Ladd and Vigdor
2006; Aaronson, Barrow and Sander 2003; Angrist and Guryan 2004; Rockoff 2004, for the
United States), just as specific teaching innovations (see e.g. Machin and McNally 2004 for the
“Literature hour” in the United Kingdom). For a review of some of this literature with a focus on
developing countries, see Glewwe and Kremer (2006) or Wößmann (2005).
The second strand of the literature is specific to developing countries in their efforts to reach the
objective of providing at least basic education to all. This objective has been codified not only in
the Education for All (EFA) objectives in 1990 and in 2000, but also in the Millennium
Development Goals. The countries facing the greatest problems in meeting the challenge are
primarily located in sub-Saharan Africa. According to recent estimates, granting access to school
for all primary-aged children in this region will require an expansion of the teaching force by
68% over the next decade (UNESCO-UIS 2006). This challenge is even greater in the
francophone countries of the Sahel region (Mingat and Suchaut 2000). According to Bruns et al.
(2002, Tables 1.1 and 2.4) so far, only 45% of African children complete primary school, and all
francophone sub-Saharan African countries except Gabon and Togo show figures that lie below
or around this regional average. Out of seven countries with primary completion rates at 25% or
below, six are francophone. With primary completion rates below 20% and an overall net
primary enrolment rate of only 31%, Niger held the sad record of the worst performer worldwide
at the end of the 1990s (UNESCO-UIS 2005, PASEC 2005a). With primary completion rates of
below 15%, Mali was in an even worse position until the mid 1990s, but has improved
considerably thereafter (World Bank 2006a).
Collecting evidence for the specific characteristics of the education systems in those countries
which reached the EFA objectives, MINEDAF (2002) suggests that primary teacher salaries
should not be greater than 3.5 times GDP per capita. Towards the end of the 1990s, in many
francophone African countries, including Mali, Niger and Togo, teacher salaries were clearly
beyond this benchmark. In the Sahel countries Mali and Niger, primary teacher salaries even
amounted to more than 6 times GDP per capita (MINEDAF 2002, p. 117). The most extreme
case was Niger, with a ratio as high as about 10 times GDP per capita (UNESCO-UIS 2006,

4
p. 87). This figure was more than ten times higher than the corresponding figure for India (World
Bank 2006b in combination with Duthilleul 2005, p. 25) and about six times higher than in
OECD countries (OECD 2002, Table D6.1).
At such high salaries in relation to national income, it was obviously impossible to hire the
necessary number of teachers to meet the rising demand for education exacerbated by high
population growth. To a somewhat lesser extent, the same applies for Mali and Togo as well as
for a large number of other predominantly francophone African countries. From the mid-1990s
onwards, for most countries, engaging contract teachers at considerably lower salaries than
traditional civil servants appeared to be the sole solution for staffing their schools (Ndoye 2001,
Mingat 2004). Even earlier, parents had often resorted to private initiatives, opening their own
schools with privately engaged teachers, on contracts at considerably lower rates than those
foreseen in the public sector.
However, stakeholders in the education system generally fear that an important loss in education
quality may go hand in hand with this new employment strategy. These fears have to be taken
seriously, especially as the seminal work by Rivkin, Hanushek and Kain (2005) identifies teachers
and teaching quality as the key determinant of education quality.
This paper will analyse to what extent these fears are justified, and provide some evidence on
which forms of contracts (or which types of programme implementation) exacerbate or mitigate
potential problems. The paper is structured as follows: Based on information compiled by
Bernard, Tiyab and Vianou (2004), as well as Duthilleul (2005), Section 2 first demonstrates the
quantitative relevance of contract teacher programmes and their development over time for Mali,
Niger and Togo, as well as for other countries of the region. This section also discusses the
differences of contract conditions across countries. Section 3 provides an overview of the data
available for the analysis of the contract teachers’ impact on student achievement in the three
comparison countries. Section 4 explains the estimation approach and Section 5 presents the
results. Section 6 provides some conclusions and recommendations for education policy.
2. Teacher incentives, teacher contracts and working conditions
In most countries, teachers are employed as civil servants, except for short-term replacements,
probation periods, or until they have reached the required qualification level (Duthilleul 2005).
In recent years, however, the focus on increased access to education, along with high population
growth rates and tight budget constraints, led to the broad-based introduction of contract teacher
schemes, whereby teachers were hired on contracts rather than on civil-servant positions, usually
combined with lower salaries and also lower professional pre-service training requirements. This

5
permitted a large increase in the number of teachers (see e.g. Ndoye 2001). While most countries
in South Asia and Latin America started rather early and gradually introduced these changes
without ever striving for a complete renewal of their teaching staff (see e.g. Govinda and
Josephine 2004 for India, and Castro 2004 for Nicaragua), public policy reform in Africa was
typically introduced later, i.e. towards the mid- or even late 1990s, but rather fast. In the early
years of the new century, the period our empirical analysis will refer to, contract teachers already
made up a sizeable share of the total teaching population (for current shares of contract teachers,
see Table 1).
In Niger, no more civil servants were engaged in the teaching profession at primary level after
the contract teacher programme had been put in place in 1998. In addition, as for many years
funding had been insufficient to train and recruit teachers according to earlier rules and
regulations, huge gaps had to be closed by the newly engaged contract teachers. After 1998,
almost 2800 new teachers were recruited every year, as compared to an average of 520 per year
between 1990 and 1998 (PASEC 2005a). Therefore in the year 2000, contract teachers already
made up the majority of the primary teacher population (Bernard, Tiyab and Vianou 2004, p. 5).
Thereafter this proportion has remained about constant (see left hand side of Table 1). In fact it
seems that the long-term maintenance of teacher salaries far above market rates had effectively
paved the way for a radical change in teacher employment policies once the traditional system
finally collapsed. See Figure 1 for an overview of teacher salaries in sub-Saharan Africa at the
end of 1990s, i.e. at the time when average teacher salaries (relative to GDP per capita) were at
their peak. The unsustainable level of salaries thus triggered the contract teacher reform and led
to salaries of the new contract teachers accounting for only one third of those in the civil service
(see right hand side of Table 1). Nevertheless, budgetary problems in Niger have remained so
serious that the regular payment of even the reduced salaries is not always guaranteed (see
Table 2).
In Mali and Togo, the change was somewhat more moderate than in Niger and also started
earlier. In both countries, it was initially driven by local communities who resulted in engaging
their own (private) contract teachers when the state failed to provide them with the required staff.
In Mali, the government also recruited the first contract teachers as early as in 1991, but numbers
became significant only towards the end of the decade. After 1998, public contract teachers and
traditional civil servants were typically recruited in about equal proportions (PASEC 2005b).
Overall, contract teachers made up about 30% of the teaching staff in primary schools in 2000
(Bernard et al. 2004). As the recruitment of contract teachers by local communities accelerated
even further thereafter, data for 2004 show that almost 65% of primary education teachers are

6
now working on contracts (see Table 1). It should also be noted that, while the policy shift
towards the employment of contract teachers was certainly less abrupt than in Niger, the
difference in salaries was even greater. A contract teacher in Niger still earns 3.5 times the
national GDP per capita, i.e. about 35% of the average salary of traditional teachers. In Mali, the
initial rates for contract teachers were only around 25% for public contract teachers and 15% for
community teachers. In the year 2000, this corresponded to 1.5 times and 0.9 times GDP per
capita respectively (Bernard, Tiyab and Vianou 2004). Only more recently, public teacher salaries,
especially for contract teachers, were increased to reduce the gap. However, the pay for
community teachers has remained unchanged (see Table 1).
Figure 1: Average salary of primary teachers relative to GDP per capita, 2000
Source: World Bank (quoted from MINEDAF 2002, p. 31).
In Togo, the public recognition and recruitment of contract teachers started in the mid 1990s,
when the Local Initiative Schools (EDIL) were formally recognised. The government then also
started to finance some of the EDIL teachers from the central budget. In 1999, 16% of EDIL
teachers were paid by the Togolese government (World Bank 2002, p. 27). In parallel, the
government started recruiting public contract teachers for other schools. This policy was adopted
in response to the problem that there were not enough financial resources and training capacity to
> 6
3.5 - 6
< 3.5
ND
> 6
3,5-6
< 3,5
No information
Mali Niger Togo
7
expect all new teachers to fulfil the official requirements of a one-year professional training
course in order to enter the teaching profession as a civil servant. In fact, such pre-service
training was offered only in three years (1985, 1996 and 1997) within the whole period since
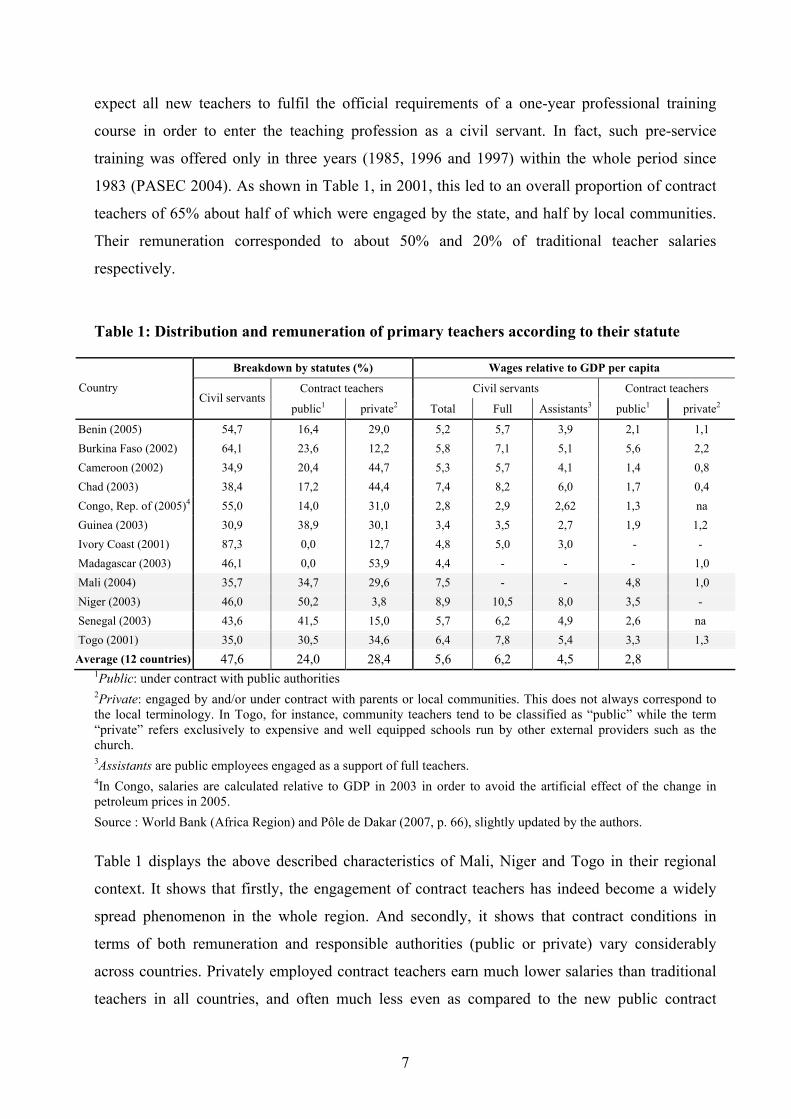
1983 (PASEC 2004). As shown in Table 1, in 2001, this led to an overall proportion of contract
teachers of 65% about half of which were engaged by the state, and half by local communities.
Their remuneration corresponded to about 50% and 20% of traditional teacher salaries
respectively.
Table 1: Distribution and remuneration of primary teachers according to their statute
Breakdown by statutes (%) Wages relative to GDP per capita
Contract teachers Civil servants Contract teachers Country Civil servants
public1 private2 Total Full Assistants3 public1 private2
Benin (2005) 54,7 16,4 29,0 5,2 5,7 3,9 2,1 1,1
Burkina Faso (2002) 64,1 23,6 12,2 5,8 7,1 5,1 5,6 2,2
Cameroon (2002) 34,9 20,4 44,7 5,3 5,7 4,1 1,4 0,8
Chad (2003) 38,4 17,2 44,4 7,4 8,2 6,0 1,7 0,4
Congo, Rep. of (2005)4 55,0 14,0 31,0 2,8 2,9 2,62 1,3 na
Guinea (2003) 30,9 38,9 30,1 3,4 3,5 2,7 1,9 1,2
Ivory Coast (2001) 87,3 0,0 12,7 4,8 5,0 3,0 - -
Madagascar (2003) 46,1 0,0 53,9 4,4 - - - 1,0
Mali (2004) 35,7 34,7 29,6 7,5 - - 4,8 1,0
Niger (2003) 46,0 50,2 3,8 8,9 10,5 8,0 3,5 -
Senegal (2003) 43,6 41,5 15,0 5,7 6,2 4,9 2,6 na
Togo (2001) 35,0 30,5 34,6 6,4 7,8 5,4 3,3 1,3
Average (12 countries) 47,6 24,0 28,4 5,6 6,2 4,5 2,8
1Public: under contract with public authorities 2Private: engaged by and/or under contract with parents or local communities. This does not always correspond to the local terminology. In Togo, for instance, community teachers tend to be classified as “public” while the term “private” refers exclusively to expensive and well equipped schools run by other external providers such as the church. 3Assistants are public employees engaged as a support of full teachers. 4In Congo, salaries are calculated relative to GDP in 2003 in order to avoid the artificial effect of the change in petroleum prices in 2005.
Source : World Bank (Africa Region) and Pôle de Dakar (2007, p. 66), slightly updated by the authors.
Table 1 displays the above described characteristics of Mali, Niger and Togo in their regional
context. It shows that firstly, the engagement of contract teachers has indeed become a widely
spread phenomenon in the whole region. And secondly, it shows that contract conditions in
terms of both remuneration and responsible authorities (public or private) vary considerably
across countries. Privately employed contract teachers earn much lower salaries than traditional
teachers in all countries, and often much less even as compared to the new public contract

8
teachers. In addition, the privately engaged contract teachers do not only face the potential
challenge of a fixed-term contract which may or may not be renewed, but must also be expected
to be much more closely monitored by the parents in the responsible local community who
actually (directly or indirectly) finance their post.
Further cross-country differences in contract teacher programmes exist with respect to entry
requirements in terms of educational attainment and professional training. Typically,
professional training has been considerably reduced from several years in specialised teacher
training institutes (“Ecoles Normales”) to a few months, or even weeks provided by diverse
institutions, or to on-the-job training under the mentorship of senior teachers. This reduction in
teacher training also reduced the cost incurred by the education system, in particular as teacher
candidates often received scholarships during this training period, i.e. before being actually
employed in schools.
In some countries like Guinea, cuts in the duration of professional training have gone hand in
hand with a redefinition of course content and an attempt to adjust the curricula to issues truly
relevant to teaching practice. A mandatory training period of 15-18 months including 6-9 months
of practical teaching experience under the supervision of a senior colleague was built into the
new recruitment procedure (Faoura 2004, pp. 105ff.). In Mali, teacher candidates who have not
attended other forms of pedagogical training, have to follow a three-month course preparing
them for their work (PASEC 2005b). As opposed to the situation in Guinea and Mali, contract
teachers in Niger initially only received a 45-day training and even the latter requirement was not
always met in practice (PASEC 2005b). If some contract teachers have effectively attended
longer training courses, they can be assumed to have been candidates for traditional teaching
positions who have not been able to find a position on the labour market. Traditional civil
servant teachers had to follow a training administered in the “Ecole Normale” for one or two
years. Only recently, yet another reform seems to have increased the initial training requirements
even for contract teachers to one year, too (Ndoye 2004). In Togo, finally, contract teachers do
not necessarily get any professional training at all. In some cases, they benefit from a three-
month course supported by the World Bank and administered ex post. NGO have also come in to
bridge the gap, but on an irregular basis.
Similar cross-country differences exist with respect to educational attainment required to enter
the teaching profession. While in Guinea and Mali upper secondary education is required as a
minimum, contract teachers in Niger may also start from a level of completed 10th grade
(“BEPC”) if they clear the entrance exam. In Togo, the baccalauréat was required initially, but

9
requirements were later reduced to junior secondary completion and the clearance of an entrance
exam just like in Niger.
Table 2 shows the magnitude of the contract teacher reforms on the French speaking part of the
African continent and gives details about their implementation.
Last but not least, it should be noted that some countries such as Mali and Togo (to some extent)
develop a career development plan for their contract teachers, e.g. by defining steps on how to
integrate contract teachers into the traditional system later. In Niger, it is intended to render
contracts permanent after four years. In surprisingly many countries – including Mali and Togo –
the contracts for public contract teachers are even supposed to be permanent right from the
beginning. Nevertheless, contract teachers are clearly in a less secure position than traditional
civil servants. In Togo, for instance, a large number of contract teachers was fired in 1999 as a
result of a strike. The differences in contract teacher schemes are summarised in Table 2.
Let us now consider what kind of effects on student learning we can expect from the various
features of the contract teacher programmes discussed so far. Theoretically, we will have to
consider the following potential effects: (1) an effect of the new educational and training
requirements for entry into the teaching profession, (2) an incentive effect of the teaching
contract, (3) a selection effect (changed demand for and supply of new teachers), and (4) a
dynamic effect. Let us consider these effects individually.

10
Table 2: Characteristics of West African contract teacher programmes
Country Category
(local names)
Reasons
for reform
Minimum level of
education and training
Duration of
professional pre-
service training
Duration of contract Career plan or
seniority
bonus
Source of
financing
Employer
Management
Regularity of
payment
State contract teachers
limited state resources
Junior secondary Training periods in a 4-year sequence
2 years renewable once Under discussion
State State Yes Benin
Community teachers “Spontaneous” schools
Flexible Flexible Parents Local Generally yes
Community teachers Flexible fixed-term contract Regional Community- Based
Burkina Faso
Contract teachers Limited state resources
Secondary+ Selection 1 year Permanent Yes State / external Decentralized level
Yes
Vacataire Limited state resources
Secondary+ Selection 1 year Formally 2 years, but considered as permanent
No till 2006 State Decentralized level till 2006
No Cameroon
Community teachers Local initiatives Flexible 1 year No Parents Community
Chad Community teacher Limited state resources /creation of community schools
end junior secondary + selection process of
applicants
9 months on the job; 4 months for those with a
diploma
9 months (school year) but can be transformed into
permanent
No Parents and state
Community No
Contract teachers Limited state resources
Junior secondary+ selection process
2 years apprentice ship with continuous training
Formally 2 years, but considered as permanent
No
Volunteers Local emergency program
Junior secondary+ selection process
not fully documented 1 year, but can be transformed into permanent
Local arrangements
Community, public service
Yes
Congo (Rep. of )
Community teachers (benevolents)
Parental initiative Limited Community
Guinea Contract teachers Limited state resources
Full secondary + selection
9 or 12 months 1 year but can be transformed into permanent
No State Decentralized level
Generally yes
Contract teachers Frozen recruitment for civil servants
Local initiatives Flexible Formally 1 year, but considered as permanent
Under discussion
State HIPC initiative
State Generally yes Madagascar
Community teachers Local initiatives Junior or full secondary sometimes No contract No Parents and aid Community No
Contract teachers
Limited state resources
grades 11 or 12 3 months Permanent In progress State Decentralized level
Yes Mali
Community teachers Local initiatives Flexible Donors / community
Communities / parents
Temporary staff Junior secondary 3 months Permanent or 1 year None State State Yes Mauritania
Retirees
Lack of competencies
None State State Yes
Niger Contract teachers Limited state resources
Junior secondary + 1 year in teacher training school + selection
1 year Permanent contract after 4 years of experience
No State + Aid Decentralized level
No
Senegal Educational volunteers
Limited state resources
Junior secondary+ selection process
3 months , 6 months after 2000
2 years for volunteers, half become permanent
Yes State Decentralized level
Yes
“Auxiliaries” or Contract teachers,
Junior secondary+ selection process
from none up to 3years
Permanent State Decentralized Togo
Community teachers (volunteers)
Limited state resources
Flexible Irregular, only administered by NGO
Yes, but limited
Communities / parents / aid
Communities / parents
Yes
Note: For further details, see Appendix A, Table A1. Sources: Adapted and updated from Mingat (2004), Ndoye (2004) and Duthilleul (2005) using various World Bank education sector Country Status Reports (see e.g. World Bank 2002, 2004, 2005a, 2005b, 2006a, 2007 and World Bank (Africa Region) and Pôle de Dakar 2007) and expert communications.

11
(1) The effect of new education and training requirements
While recent studies show that the duration of teacher education and training is not
necessarily a strong correlate of teacher quality and student learning (see e.g. Hanushek et
al. 2005 for the United States; Michaelowa and Wechtler 2006, and Michaelowa and
Wittmann 2007 for African countries), this outcome appears to result from decreasing
returns after a certain minimum level of education and training, and/or could be a result of
the low quality of the educational programmes themselves. For francophone African
countries, for instance, it has been observed frequently that increasing primary teachers’
educational attainment requirements from the BEPC to the baccalauréat does not bring
about the expected change in student achievement (Michaelowa and Wechtler 2006). On
the other hand, providing at least some professional training prior to job entry appears to
be relevant. This is clearly confirmed by prior analysis for Togo (PASEC 2004). From this
perspective, we would expect that Togolese contract teachers, many of whom might not
have received any professional training at all, should be particularly disadvantaged.
If training and other educational requirements are directly related to the status of contract
teachers, their effect cannot be disentangled from the other effects of the reform.
However, as we will see later, we typically find some contract teachers whose educational
attainment and professional training is beyond the minimum level, just as we find
traditional civil servants with levels lower than officially required. This will give us some
(albeit limited) scope to control for these effects.
(2) The incentive effect of the teaching contract
The incentive effect is the focus of what we would like to analyse in this paper. There are
two possible directions of this effect. On the one hand, the unfavourable conditions of new
teacher contracts could be regarded as unfair and demotivating, and short-term contracts
could prevent personal investments in pedagogical training and school specific human
capital. This is the main reason why many stakeholders in the education system, including
traditional teachers, teacher unions, and many policy makers, even at ministerial level, are
strongly sceptical with respect to the reforms and often consider a reversal. As Mali shows
the greatest difference in salaries (at least initially, at the time our data were collected),
from this perspective, we would expect the Malian contract teacher programme to be the
least conducive to teaching quality. At the same time, teachers in Niger suffer from
irregular payment of teacher salaries. While the recent literature does not suggest any

12
clear relationship between the level of teacher salaries and education quality (see e.g.
Kremer et al 2005; Hanushek et al. 2005), serious remuneration problems of this kind
generally remain unconsidered. They may be far more demotivating and thus put the
programme in Niger in an even more unfavourable position than the Malian.
On the other hand, contract teacher programs may also bring about incentives conducive
to better teaching and learning. These aspects seem to dominate in the eyes of policy
makers in many non-African countries like India where stakeholders appear to be much
more optimistic about the effect of contract teacher employment on education quality
(Govinda and Josephine 2004, Duthilleul 2005). For teachers on non-permanent contract
positions, further employment prospects generally depend (at least to some extent) on
performance. Among the three countries considered here, non-permanent contracts exist
in Niger (at least until four years of job experience), for community teachers in Mali, and
for the majority of community teachers in Togo (i.e. as far as they have not been fully
integrated into the public administration system yet). This may enhance their teaching
effort.
In addition, the specific employment by local communities can be expected to induce
another, even more relevant incentive effect. In the case of community teachers, parents
themselves select and pay the teachers, so that firstly, parents have a high incentive to
monitor, and secondly, the teachers are directly dependent on parents’ satisfaction. This
should ensure at least a minimum standard of performance such as regular appearance of
the teachers at their workplace. Preliminary evidence for five West African countries
indicates that this is indeed the case (Michaelowa and Wittmann 2007). Similar evidence
is presented by Duthilleul (2005) for India, while Banerjee and Duflo (2006) and Kremer
et al. (2005) suggest that results are less obvious in this country. In any case, there appears
to be a general consensus on the relevance of effective monitoring and that in principle,
local communities are in a favourable position to fulfil this role (Glewwe and Kremer
2006).
If there is a positive incentive effect of the kind discussed above, we should expect an
advantage of the contract teacher programmes in Mali and Togo over the one in Niger.
The latter relies, almost without exceptions, on public contract teachers alone. In addition,
comparing Mali and Togo, we might expect an advantage of the Malian system, not only
due to the higher share of community teachers among the contract teachers (no more now,
but at the time our data were collected), but also due to the diminishing involvement of

13
parents and communities in Togo’s EDIL, where the share of teachers directly paid by the
community is declining.
(3) The selection effect
As far as the selection effect is concerned, the changed employment conditions could lead
to a different composition of candidates applying for teaching positions. On the one hand,
the reduced entry requirements could reduce entry costs and increase the attractiveness of
(temporary) teaching positions. On the other hand, the inferior contract conditions might
reduce the number of highly skilled candidates. In addition, the generally higher demand
for teachers would lead us to expect a lower quality of the marginal (newly employed)
teacher. Given the considerable acceleration of the teacher recruitment process in all
countries, the latter is likely to dominate.
In all countries, the newly engaged teachers represent a significant percentage of young
adults with secondary education attainment. The total number of students annually
graduating from at least lower secondary education is currently around 30,000 in Mali,
12,000 in Niger, and 18,000 in Togo (see Appendix A, Table A2). Current annual increase
in teacher recruitment lies between 2,000 and 3,500 persons. In Niger, the most extreme
case, this represents about 20% of all qualified graduates. According to estimates of the
UNESCO-Institute of Statistics (UNESCO-UIS 2006, p. 41) the numbers will still have to
rise (annual requirements of ca. 6,000 additional teaching positions in Niger, 5,000 in
Mali and 1,500 in Togo). If the number of graduates remains unchanged, Niger would
then be in the extreme situation of recruiting half of all young adults with at least lower
secondary educational attainment as primary teachers. There may thus not be too much
choice among candidates. As all countries considerably accelerated their recruitment
along with the introduction of the contract teacher schemes, it is difficult to derive any
strong hypothesis with respect to the relevance of this effect in the different countries.
(4) The dynamic effect
The dynamic effect, finally, refers to a potential change of teacher behaviour regarding
their life cycle planning. In particular, the inferior contract conditions may induce a
reduced retention period of teaching staff and thus higher turnover. This effect could lead
to a different distribution of job experience before and after the reform, with a higher
proportion of young and inexperienced teachers. This in turn is likely to have an impact
on overall teaching quality (see e.g. Hanushek et al. 2005).

14
However, the actual relevance of this effect depends crucially on general labour market
conditions. In the case of all three countries considered here, alternative employment
opportunities in the modern sector are extremely limited. Currently, in Mali and Niger,
only about one out of four secondary graduates finds a job in the formal, non-agricultural
economy. In Togo, it is only one out of ten (see Appendix A, Table A2). The dynamic
effect therefore does not seem to be highly relevant in any of the three countries for the
time being.
As we will see below, the data at hand will allow us to estimate the overall impact of the
contract teacher status without, however, allowing us to distinguish between the individual
effects. A consideration of the dynamic effect cannot be provided at all because we cannot
observe teachers over time. However, as we have seen, this effect does not appear to be overly
relevant in our case anyway.
Taking together the above arguments on education and training, incentives, and selection
effects, we observe that at least the latter two let us expect Niger to face the greatest
difficulties with its contract teacher programme. In Niger, potential disincentives through
irregular pay appear to be high, and positive incentives rather limited as the programme is
fully anchored in the public administration system. And even the selection effect must be
expected to be negative due to the limited supply of qualified candidates. With respect to
Mali, the most critical issue appears to be the incentive effect. If there does exist an important
disincentive related to low salary levels, Malian contract teachers should do very badly.
However, if the positive incentive effect related to parental responsibility and community
monitoring dominates, Mali with its high percentage of community teachers should do rather
well. The case of Togo can be expected to lie somewhere in between, with a marked
disadvantage only with respect to its failure to provide pre-service teacher training on a
regular basis. The econometric part of this paper will show whether these expectations are
confirmed by the empirical evidence.
3. Data and initial descriptive statistics
The empirical study of the effect of contract teacher programmes on education quality
requires comprehensive information on teachers, schools and students. The “Programme on
the Analysis of Education Systems” (PASEC)1 collects such data for the 2nd and 5th grade of
1 Original French title: “Programme d’analyse des systèmes éducatifs de la CONFEMEN”, whereby CONFEMEN stands for the Conference of Francophone Education Ministers (“Conférence des ministres de l’éducation des pays ayant le français en partage”).

15
primary schools in francophone sub-Saharan Africa. PASEC generally uses student, teacher
and director questionnaires that are uniform for a number of core questions, so that results are
comparable across countries. Education quality is measured in terms of student achievement
in Math and French, which is assessed using standardized tests for all three countries
considered here. The Math test contains a wide variety of items ranging from calculus over
problem solving (application to situations of daily life) to simple geometry. The French test
covers general understanding and orthography as well as grammar skills. Tests were
administered in the classroom, item by item, following detailed instructions on the way to
present each question and the time to be allocated to its response. Test results are coded in
terms of the percentage of test items answered correctly in each of the two subjects French
and Math. The tests and their results are not used for any official purposes, i.e. teacher
assessments, and the final dataset is anonymous (without any names of schools, teachers or
students). The tests comprise a majority of multiple choice items. The testing language is
French.
Students are tested both at the beginning and at the end of the school year (pre-test in autumn
and post-test in summer) so that a value added approach (Hanushek 1986) becomes possible.
This is particularly relevant for our study because the effect of a contract teacher who may
have taught the students only in the year of assessment needs to be distinguished from the
effect of various other teachers who taught the class before. In francophone Africa, teachers
tend to vary a lot over the years, i.e. they usually teach the same grade and do not follow the
cohort.
PASEC surveys were carried out in Niger and Togo during the academic year 2000/2001, and
in Mali in 2001/2002. In all cases, the sampling frame consisted of all primary school teachers
included in the database available at the national Ministries of Education. Teachers of coranic
schools were not included as they follow a different curriculum and teaching generally takes
place in Arabic. Teachers in other private schools were included as long as they were
registered by the Ministry. This was generally the case in Mali and Togo, but some
community schools may have gone unnoticed or unrecognized.
In Togo, data was collected as a stratified random sample of teachers, whereby strata were
defined according to different teacher characteristics related to their education, seniority and
training. In this way, 120 teachers were drawn at both 2nd and 5th grade, and consecutively,
12 students were selected at random in their classes. The intended sample thus contained a
total number of 240 classes and 2880 students. In Niger and Mali, sampling was directly
geared towards the evaluation of the effect of contract teachers. It was carried out in a way

16
that each inspection, i.e. each school district, should be covered, and within these districts, 70
out of 140 schools were drawn at random. Within these schools, one class at 2nd grade and
one class at 5th grade level were randomly selected. Depending on whether the teacher of the
classes drawn in this way was a civil servant or a contract teacher, a nearby school with
similar characteristics was selected to provide evidence for the other type of teacher statute.
Ideally, this procedure should have resulted in an equal number of contract teachers and
traditional teachers. As, however, it was not always possible to find the opposite category for
both grades simultaneously in the same school, the final sample does not really correspond to
this ideal. In Niger, it is equally spread between contract teachers and teachers on traditional
civil servant positions only for grade 2. In grade 5, we find twice as many civil servants as
contract teachers. In Mali, contract teachers are overrepresented in the final sample in grade 2,
whereas traditional teachers are overrepresented in grade 5. In both Mali and Niger, within
each class, 15 students were randomly selected. In both countries, the intended sample
therefore includes 4200 students in a total of 280 classes (of which 140 in 2nd and 140 in 5th
grade).
To a certain extent, real numbers differ from intended numbers. In Togo, this is mainly related
to a teacher strike during the initially intended sampling period which led to a one year delay
of the sampling process and to changes in the actual teacher composition. Moreover, in all
countries, some schools did not offer both grades to be covered in the survey and appropriate
replacement schools could not always be found.2
The following table shows the actual number of classes contained in the data set for each
country, separately for 2nd and 5th grade. In addition to regular civil servant teachers and
contract teachers, there are also some other types of teachers, which include, in particular,
teaching assistants and interns. These teachers are dropped in the analysis as we aim to
compare the contract teachers with a well defined control group of regular civil servant
teachers. In addition to this, we also drop teachers with more than 10 years of job experience
for common support considerations. Since the reforms were enacted only relatively recently
there cannot be any new contract teachers with more than 10 years of experience. Hence, the
support of the variable job experience differs between civil servant and regular teachers and
we need to impose a common support restriction for the nonparametric estimation approach.
More precisely, in Togo we observe contract teachers up to eleven years of job experience.3 In
Mali, we observe contract teachers up to eight years of job experience.4 The situation is
2 For further details on the sampling procedures in the three countries, see PASEC (2004, 2005a and 2005b). 3 There is also one with 17 and one with 29 years of job experience, who are dropped. 4 There is also one with 16 years of job experience, who is dropped.

17
somewhat different in Niger, where the reform was enacted even more recently, in 1998.
There, we observe contract teachers with only up to four years of job experience, except from
one with five years and three with eight years. As we attempt to adhere to the same sample
and variable definitions across countries to keep results comparable, we use 10 years as the
cut-off point in all countries for the main analyses. In addition, Appendix D shows estimates
for Niger when only teachers with at most 4 years of job experience are retained. The results
are very similar.
Due to this sample restriction only few regular teachers remain in Mali, which is likely to lead
to rather imprecise estimates.5,6
Table 3: Number of teachers in the datasets
Niger Togo Mali
2nd grade 5th grade 2nd grade 5th grade 2nd grade 5th grade
No. of classes 125 140 116 119 139 140 Contract teachers 59 27 40 42 74 50 Civil servants 58 92 70 64 48 76 Other teachers 8 21 6 13 17 14
After deleting 'other teachers' and teachers with more than 10 years of job experience
Contract teachers 59 27 38 42 73 50 Civil servants 33 45 23 28 10 12
Note: In Niger, 10 classes were deleted where no or very limited information on student's test scores were available. In six classes, there were no test scores available at all, i.e. no tests were conducted. In four classes, test score data was available at most for four students. In Togo, 6 classes were deleted: 2 classes because of lacking any data on students (presumably since teachers had changed), 2 very small classes with only six students and lacking test score data for two of them, and 1 class where no test scores were available at all. In addition, there was only one school that used double shift class management. This school is deleted as there cannot be any adequate comparison school. In Mali, one class was deleted, since there were no student test scores available.
5 If we had used a cut-off point even smaller than ten years we would have lost another 10 regular teachers in Mali. There are only few civil servants with less than 10 years of job experience, and 10 teachers with exactly 10 years of job experience. 6 Similar constraints in the number of comparable observations also make it impossible for us to further distinguish contract teachers into the groups of public contract teachers and those engaged by parents and local communities.

18
Table 4: Selected characteristics of teachers, students and schools in our sample, by country, grade and teacher status
Variable (range) Mali Niger Togo
Grade 2 Grade 5 Grade 2 Grade 5 Grade 2 Grade 5
Type of teacher Civil
servants
Contract
teachers
Civil
servants
Contract
teachers
Civil
servants
Contract
teachers
Civil
servants
Contract
teachers
Civil
servants
Contract
teachers
Civil
servants
Contract
teachers
Number of students 123 913 146 668 429 709 584 336 245 422 308 464 Number of classes 10 73 12 50 33 59 45 27 23 38 28 42
Test scores: post-test French 0.44 0.43 0.32 0.34 0.49 0.40 0.28 0.26 0.58 0.58 0.52 0.39 Test scores: post-test Math 0.36 0.42 0.32 0.35 0.47 0.38 0.31 0.28 0.51 0.51 0.50 0.39 Test scores: pre-test French 0.29 0.19 0.33 0.31 0.18 0.16 0.24 0.23 0.39 0.39 0.55 0.41 Test scores: pre-test Math 0.44 0.32 0.38 0.36 0.39 0.32 0.27 0.27 0.49 0.49 0.62 0.54
Socio-economic index based on family possessions (1-8) 0.90 0.62 0.96 0.60 2.50 2.37 2.34 2.87 2.65 1.95 3.71 1.96 Index of school equipment (0-16) 5.48 4.85 4.82 4.90 3.78 3.90 3.77 4.31 4.29 3.00 5.68 3.23 Class size 71.41 63.51 58.77 54.33 46.00 45.68 34.43 36.14 40.46 38.36 32.81 36.83 School located in rural area (0,1) 0.10 0.50 0.36 0.52 0.34 0.38 0.30 0.41 0.40 0.52 0.31 0.58 Teachers’ age (in years) 35.01 29.83 36.53 31.93 30.08 27.79 30.07 28.74 34.62 32.52 36.01 34.09 Teachers’ job experience (in years) 8.43 3.12 7.04 3.82 4.88 2.44 5.58 2.70 6.20 5.47 7.04 5.87 Teachers’ educational attainment (0-6) 2.34 1.61 2.34 2.15 4.01 3.72 4.51 4.18 2.86 2.88 3.82 4.00 Teachers without pre-service training (0,1) 0.08 0.34 0.00 0.35 0.03 0.19 0.00 0.15 0.18 0.41 0.22 0.44
Note: The pre-test is conducted at the beginning of the school year (in autumn), the post-test is conducted at the end of the school year (in summer). Pre- and post-test are based on different items, so that the scores cannot be directly compared.

19
Table 4 provides an overview of some selected characteristics of students, teachers,
classrooms and schools collected through the additional questionnaires for students, teachers
and principals. Pupils were questioned along with the pre-test at the beginning of the school
year, whereas teachers and principals were interviewed at the end of the year. The
questionnaires provide information on a wide range of students’ personal characteristics,
family background, and prior educational history, as well as on personal characteristics and
pedagogical methods of teachers and principals, and on school and classroom equipment,
inspections, and interaction of school staff with the local community. In addition to those
variables selected for Table 4, some more variables are listed in Appendix A, Table A3. But
even the variables presented in the annex only represent a small subset of the overall
information available. In Table 4, the columns show the averages of the different variables for
classes taught by contract teachers and civil servant teachers respectively.7
Starting with test scores, Table 4 indicates that on average, in the sample for both 2nd and 5th
grade, students taught by traditional teachers typically reached a higher or about equal
percentage of correct answers than students taught by contract teachers. Only in the case of
Mali 2nd grade Mathematics, we observe strongly higher scores with contract teachers.
However, these differences may be related to factors other than the teachers’ contract status.
They may, for instance, be a consequence of the assignment of contract teachers to different
learning environments, or to different characteristics of the teachers themselves.
In particular, it might be that contract teachers get to work with children who show lower
abilities already at the beginning of the school year. The data provide some evidence for this
in Togo 5th grade and in Mali 2nd grade. Moreover, at least in Mali and Togo, our data show a
more favourable context for traditional teachers in terms of the socio-economic background of
7 For some observations data has been missing as in some (rare) cases, teacher and director questionnaires were
not duly filled in. Generally, when full questionnaires or test results were missing, the observations concerned
had to be deleted from the data set. Whenever only information for individual variables was missing, however,
missing values could generally be imputed using related questions taken from the same or other questionnaires.
If information from several other variables could be included for imputation, imputation was carried out using
linear regression on all of these variables. In addition, missing value indicators were generated. In other cases,
the students’ final scores are missing due to their absence on the day of the post-test. These missing values at the
student level account for the bulk of missing observations. As in most of francophone sub-Saharan Africa, a
relatively high rate of absence on the day of the final exam can be explained by early drop-out, by sickness, or by
household and harvesting activities on the day of the evaluation. Simple correlation indicates that the occurrence
of these missing values is independent of the teacher’s statute as a civil servant or a contract teacher. We did
some preliminary experiments with including missing value indicators in the regressions, which did not affect
the results very much.

20
their students and school equipment. In addition, we tend to find contract teachers more often
in rural than in urban schools. At the same time, for class size, there is no obvious advantage
of either type of teachers.
Overall, the differences with respect to socio-economic background and educational resources
are not very pronounced, and this should indeed not be the case given the PASEC sampling
strategy, at least for Mali and Niger. However, with respect to teacher characteristics, we must
expect considerable differences reflecting the relatively recent introduction of the contract
teacher programmes and the legal constraints related to their implementation. At the same
time, our modifications to the sample in order to insure common support for the age and job
experience variables should already have brought about a certain convergence of mean values.
Indeed, in our remaining sample, contract teachers are generally not more than two years
younger and less experienced than traditional teachers. An exception is Mali, where we get
differences up to about five years.
With respect to teachers’ educational attainment, contract teachers show somewhat lower
credentials than traditional teachers in Mali and Niger. The opposite is the case in Togo where
the “baccalauréat” was temporarily imposed as an entrance condition for contract teachers.
Indeed the value 4 of the education index, which we find in Togo 5th grade for contract
teachers, stands for the level of the “baccalauréat”. Despite prevailing regulations, this level is
not reached by 2nd grade teachers, however. In Niger, the education level in our sample is
lowest. Again this provides some evidence that official regulations are not observed. The
average educational attainment of the teachers in Niger in our sample is in fact below the
“BEPC” lower secondary attainment and corresponds to clearing grade 8-9.
Similarly, professional pre-service training that should have been attended (albeit for a short
period of time) by all contract teachers in Mali and Niger, does not seem to have regularly
been required in practice. While in Mali, the problem may come from the community
teachers, there is no explanation of this kind for the case of Niger. Almost all traditional
teachers in Mali and Niger, however, report having effectively participated in at least some
pre-service training activities. Here again, this is not the case in Togo where it was officially
required but not effectively offered for candidates to the teaching profession.
While being instructive about the only weakly binding character of public rules and
regulations in our three countries, the above discussion does not offer any clear explanations
for the difference in student achievement reached by contract teachers and traditional teachers
respectively. Nevertheless, some differences remain and it appears to be worthwhile to
compute the net effects by controlling for all confounding variables. In addition to the small

21
set of variables presented here for illustrative purposes, a much larger number of variables can
be used as a basis to select appropriate controls. Both the variable selection and the actual
estimation procedure will be described in detail in the following section.
4. Nonparametric evaluation of the impact of the contract teacher programme on
education quality
To evaluate the impact of the contract teacher status on education quality, let 0
iY denote the
outcome, e.g. Math and French proficiency at the end of the school year, of child i if being
taught by a regular civil servant teacher. 1
iY represents the outcome of child i if being taught
by a contract teacher instead. The average impact of the teacher's contract on a randomly
drawn child is
1 0[ ]E Y Y− .
While the average treatment effect provides an overall assessment of the average impact of
the contract teacher programme, it is also of particular interest how the contract teachers
change the distribution of the outcomes. Contract teachers may perform poorly e.g. with less
or very able children. Even if the average treatment effect was zero, an increase in educational
inequality could be considered as a negative impact of the contract teacher programme. For
considering the distributional impact, we would like to estimate the distribution functions 1YF
and 0YF of the potential outcomes and/or the quantile treatment effects:
1 0( ) ( )Q Y Q Yτ τ− ,
where ( )Qτ ⋅ refers to the τ-Quantile of the random variable in brackets.8 The quantile
treatment effects show the impact of the contract teacher programme for children at different
locations in the ability distribution. If the treatment effects obey rank invariance such that an
individual i who scores higher than an individual j if taught by a regular teacher also scores
higher if both are taught by a contract teacher, and vice versa, this is the effect for an
individual with ability τ. If ranks may cross-over in that the relative orderings of two
individuals might change when taught by a contract teacher instead of a regular teacher, and if
this change in the ranks is not fully random but related to the treatment variable, we cannot
directly associate the τ quantile treatment effect with the individual with ability τ. Still it will
8 Note that we are examining only the quantiles of the potential outcomes and not of the treatment effects.
Identification of 1 0( )Q Y Yτ − would require additional assumptions on the joint distribution of the potential
outcomes, which we do not want to impose. For considerations of educational inequality, the quantiles of the potential outcomes are sufficient.

22
be possible to examine the impact of contracts teachers on educational equality to see whether
contract teachers compress or widen the outcome distribution. Overall it nevertheless seems
reasonable that rank invariance should at least approximately hold: a weak pupil would still
remain in the lower end of the outcome distribution if taught by a contract teacher, and vice
versa.9
Since we are interested not only in, say, the median treatment effect, but in the entire outcome
distributions, we estimate the entire distribution function of the potential outcomes.
Identification is based on the conditional independence assumption
1 0, |Y Y D X∐ , (1)
as e.g. in Heckman, Ichimura and Todd (1997), Lechner (1999), Black and Smith (2004) or
Firpo (2007). The binary variable iD indicates whether child i was actually taught by a
contract teacher ( iD =1) or by a regular civil servant teacher ( iD =0).
The conditional independence assumption requires that X contains all variables that
determined the teacher statute and at the same time had an impact on the child's potential
outcomes. We include in X a large number of variables characterizing the school (location,
equipment and facilities, management and parental involvement), the socioeconomic
background of the parents, and the child's proficiency in French and Mathematics at the
beginning of the school year (pre-test scores). As mentioned before, the pre-test scores are
very important for the plausibility of our identification approach as they reflect the child's
otherwise unobserved ability as well as the impacts of previous inputs into the education
production process. In addition, several teacher characteristics are included to ensure that the
estimated impacts of contract teachers on student achievement are not due to differences in
these other characteristics, e.g. job experience.
By the conditional independence assumption, we can identify the distribution functions of the
potential outcomes by noting that
, d=0,1 (2)
where the last equality sign follows from the conditional independence assumption (1). Now
the quantiles can be derived by inverting the estimated distribution function. The treatment
effects are thus fully nonparametrically identified by first estimating the conditional
distribution functions nonparametrically and averaging then over the empirical distribution
of X.
9 It is rather the scarcity of teachers that led to the hiring of additional contract teachers and not a selective dismissal and replacement of regular teachers by contract teachers. The latter could have been an endogenous choice based on the anticipated treatment effects and could violate rank invariance.
( ) X
dd
YdFdDXaYEaYEaYaF d ∫ =≤=≤=≤= ],|)(1[)](1[)Pr()(

23
A nonparametric matching estimator of the potential outcome distribution is
, d=0,1 (3)
where ˆ am is a nonparametric regression estimator of
( , ) [1( ) | , ]am x d E Y a X x D d= ≤ = = , d=0,1. (4)
This nonparametric matching estimator is preferred to traditional regression analysis for two
reasons: First, we want to avoid arbitrary functional form assumptions for which no
justification can be given. Second, nonparametric regression allows for endogenous control
variables that are not permitted in OLS or logit regression (Frölich 2006b).10 This is
particularly relevant here because of the inclusion of the ability tests at the beginning of the
school year as control variables. These ability tests are correlated with unobserved ability that
also likely influences the test results at the end of the school year.
There are several ways to estimate the conditional expectation function ( , )am x d . A common
choice would be Nadaraya-Watson kernel regression (= local constant regression). However,
Nadaraya-Watson kernel regression is known to behave poorly in boundary regions (Fan
1992, Fan and Gijbels 1996). Instead of the local constant model implied by the Nadaraya-
Watson kernel regression, a local linear or local parametric model is often more appropriate
(Fan and Gijbels 1996). In particular, using a local parametric model that is closer to the true
conditional mean function reduces bias (Gozalo and Linton 2000). Since ( , )am x d is bounded
between zero and one, a local logit specification is used to implement the boundedness
restriction in a natural way. The implementation of the estimator follows Frölich (2007)
where the conditional expectation functions [1( ) | , ]E Y a X D≤ are estimated by local logit as
in Frölich (2006a). More technical details on the estimator are provided in Appendix B.
The identification strategy requires [1( ) | , ]E Y a X D≤ to be well defined for every value in
the support of X. This, in other words, requires that for every value of X contract teachers and
regular teachers are observed. As mentioned in Section 3, we observe a wide range in the job
experience of civil servant teachers but no or only extremely few contract teachers with more
than 10 years of job experience. Hence the conditional mean would not be well defined for
being contract teacher with a large job experience. Therefore all observations with more than
10 years of job experience are dropped, which also mitigates the differences in the age
distribution.
10 In other words, nonparametric matching relaxes the assumptions about the independence of the error term. Whereas in a traditional linear model it must be assumed that the error term is independent of the regressors, i.e.
∑=≤i
ia
d dXmn
aY ),(ˆ1
)r(P̂

24
5. Empirical results
The following tables and graphs provide the estimated quantile treatment effects of the
contract teacher programme. The results are shown for different sets of regressors X and
different bandwidth values to examine the robustness of the results.11
Three different sets of control variables are examined: Xset 1, Xset 2 and Xset 3. The
regressor set Xset 2 is based on a rather extensive collection of variables that have been used
as possible predictors of test scores in the literature. Estimation of education production
functions has become a focus of many studies in recent years including numerous studies for
developing countries ever since micro survey data have become available in the late 1990s. A
recent summary is provided in the EFA Global Monitoring Report 2005 on education quality
(UNESCO 2004). This set includes variables that capture the school environment and
classroom equipment, school management, characteristics of the teachers and also the
socioeconomic background of the pupils. In addition, we include French and Math
proficiency at the beginning of the school year to capture unobserved ability of the pupils.12
We do not include variables that are likely to have been causally affected by the contract
teacher status, and would thus represent direct outcomes of the teacher status, such as teacher
job satisfaction or salary.
Most of these variables, however, are not correlated with the treatment variable ‘contract
teacher’. Xset 1 therefore retains only a subset of variables that were significant in class-level
regressions of the treatment variable on all these regressors in any of the three countries
considered, see Table 5.
Table 5 shows a class-level logit regression of contract teacher status on several teacher and
school and class-average pupil characteristics. The first three columns provide the regressions
for the extensive regressor set Xset 2, where most coefficients are insignificant. Not
surprisingly, this is especially the case for Mali and Niger reflecting the initial sampling
strategy. The last three columns provide the regressions for the smaller Xset 1. Overall, the
predictive power of Xset 1 is still very large. It should also be noted that some of the variables
had to be dropped from some of the logit regressions because of coefficients tending to
infinity due to perfect predictability given the small sample size. This happened with the last
four variables in Table 5, marked with (-). These variables are retained, however, in the
E[u|X,D]=0, this assumption can be relaxed here to E[u|X,D] = E[u|X], i.e. the error term could still be correlated with the regressors X. 11 Inference is based on the bootstrap, where entire classes are re-sampled to account for within-class dependence. Otherwise, significance levels would be overstated. 500 bootstrap replications. 12 This is the essence of the value-added approach (Hanushek 1986).

25
nonparametric regressions on the pupil level, where sample sizes are much larger, since they
are in fact important predictors of contract teacher status.
Table 5: Determinants of contract teacher status
Dependent variable: Contract teacher Mali Niger Togo Mali Niger Togo
Xset 2 Xset 1 School location:
Distance to next city at least one
hour 2.51 -2.84 -1.82 2.14 -0.91 -1.47
Small village -4.49 3.77 1.29
Big village -2.14 2.66 -1.53
Pupil variables:
Initial test score French 0.20 0.07 1.47 -0.22 -0.02 0.23
Initial test score Math -0.29 -0.09 -1.59 0.08 0.00 -0.18
Indicator for 5th grade class 1.56 -1.49 2.13 -1.18 -0.62 0.94
Initial test French interacted with grade -0.08 0.00 -0.45 0.04 0.01 -0.07
Initial test Math interacted with grade 0.06 0.01 0.42 -0.01 -0.01 0.06
Boy 0.04 -2.72 -0.12
Age -0.52 0.62 -1.29 0.45 0.15 -0.46
Socioeconomic status a) 4.06 -4.43 2.13
Possession of TV, radio, rideo at home -4.66 2.19 -0.47
Indicator of child labour b) -0.54 0.02 -0.01
Regularity of meals c) -0.27 -1.54 -2.76 Number of schoolbooks (0,1,2)
d) 0.92 2.00 -6.40 0.20 1.32 -3.20
Student gets help with studies at home -1.59 3.53 4.77
Student speaks French at home -2.94 0.67 1.03 Student repeats the current grade -0.08 1.56 1.14
Number of grades repeated previously -0.19 -4.50 -0.43
School variables
Classize (on a typical day) -0.03 0.01 0.02
Percentage of girls in the class 0.02 -0.04 -0.03
Number of students in the school 0.00 0.00 0.00 School equipment e) -0.16 0.45 -0.59
Drinking water in school 1.44 -2.81 2.20 -0.87 -0.68 -0.04
Electricity in classroom -1.29 -0.85 -2.69 School has toilets 0.43 -0.74 -3.18 0.34 0.00 -2.56
Active involvement of parents in school issues
0.39 0.43 -1.80
Frequent exchange among teachers -0.70 1.37 2.53
Male Director 1.66 -2.50 1.58 0.91 -0.78 -1.03
Education of director 0.15 -0.20 -0.31 Training of director -2.20 0.19 1.59 School participates in a pilot pro-
gramme, exchange programme etc. -1.63 -0.57 2.78 -0.57 -0.23 1.78

26
Table 5 cont. Dependent variable: Contract teacher Mali Niger Togo Mali Niger Togo
Xset 2 Xset 1
Teacher variables
Male Teacher 0.26 -0.90 -0.66 Age Teacher -0.39 -0.05 -0.26 -0.15 -0.06 -0.12
Education Teacher -0.28 -0.65 0.56
Teacher speaks local language 1.94 0.11 0.32 Inspector's visit during the last year - -1.58 2.47 - -0.83 1.14 Job experience of teacher (in years) - -1.26 0.14 -0.78 -1.00 0.02
Double shift teaching -1.63 -2.18 -
Multi grade class -4.95 0.74 - -1.68 0.98 -
Blackboard and chalk available in class
- 0.83 0.21
Constant 29.44 15.60 25.77 10.30 7.74 10.36
Number of classes 142 168 129 142 168 129
Pseudo R2 0.481 0.558 0.579 0.505 0.412 0.440
Note: Coefficients significant at 5% level are marked in bold, significant at 1% are marked in bold underlined. Variable names in bold identify variables included in the regressor set Xset 1.
a) Socioeconomic status: Sum of family possessions: fridge, electricity, flush toilet, access to tab water, plough, car, TV, radio, video, adjusted to urban/rural differences (0-1). b) Indicator of child labour: Student helps with commercial activities, agricultural activities and/or animal husbandry (Sum of activities). c) Regularity of meals: Sum of regularity of breakfast, lunch and dinner. d) Student has a textbook for French, for Math or both (0-2) e) Sum of 16 indicators of school equipment: electricity in class, library, lavatory, school canteen, availability of drinking water, court yard in school, availability of a sick-room with some medical equipment, sports ground with some equipment, garden, fence around the school, office for director, room for teachers, storage room, housing for director, housing for a guardian, housing for teachers.
The difference between Xset 2 and Xset 3 is that the latter also contains the variables
educational level of the teacher and pedagogical training of the teacher. These two variables
may be important predictors of educational achievement. At the same time, as they are part of
the characteristics of the contract teacher status, they must be expected to be directly tied to
the treatment variable. In principle, by definition, contract teachers receive only very little
training and are subject to different educational requirements for admission. Hence, a change
in the treatment variable would automatically entail a change in these two variables such that
they cannot and should not be used as control variables. In practice, however, it seems that the
various administrative rules are not always adhered to so that, for instance, teachers may have
become civil servants without any pre-service training, too (see Section 3). Therefore, we
examine results with and without these two variables. If effects differed significantly, the
difference may be attributed to these two variables.
Table 6 presents the estimated quantile treatment effects for Xset 1. The results for the
enlarged regressor sets Xset 2 and Xset 3 are provided in Appendix C. All results are reported
for three different sets of bandwidth values, first for 1 2( , , ) (0.5,0.5,0.25)h h λ = , then for
1 2( , , ) (1,1,0.5)h h λ = , and finally for bandwidths chosen by cross-validation. Bandwidth h1 is

27
used for the French and Math pre-test scores, h2 for all other non-binary regressors, and λ for
binary regressors. As discussed in more detail in Appendix B, the bandwidths chosen by
cross-validation are certainly too large, since some kind of asymptotic undersmoothing is
required for the matching estimator to reduce its bias. We therefore focus our attention on the
first two sets of results and pay particular attention to the robustness of the results to
bandwidth values and regressor sets.
The subsequent graphs (Figures 1-2 for Mali, 3-4 for Niger and 5-6 for Togo) show the
estimated distributions of the potential outcomes: the solid line shows 1ˆY
F and the dashed line
0ˆY
F . The horizontal distance thus reflects the quantile treatment effects displayed in Table 6.
The graphs to the right show the effects on Math proficiency, the graphs in the middle give
the effects for French proficiency, whereas the graphs to the left refer to the average of French
and Math proficiency. Again, for Xset 2 and 3 the corresponding graphs are provided in
Appendix C.
The results for the 2nd grade in Niger are very stable to bandwidth choice and the set of
regressors. The effects are close to zero for the lower quantiles, and decrease almost
monotonously to about –20 to –25 percentage points for the high ability students. Hence,
whereas the low ability students do not seem to be affected by the teacher status, the high
ability students seem to suffer from being taught by a contract teacher. The effects are very
similar for French and for Math.
For the 5th grade, the estimates also tend to be negative but are small and insignificant. At the
lower quantiles the effects remain slightly negative with the larger regressor sets 2 and 3. For
the higher quantiles, the estimation results are unclear and sensitive to the choice of regressors
included. (For Math, the effects tend to be negative. For French the results are unstable due to
local colinearity.)13
In Togo the impacts tend to be positive for the 2nd grade and negative for the 5th grade. The
positive effects for the 2nd grade are a bit larger for French than for Math. For French, they are
significant around the median (about 10 to 14 percentage points) while they remain
insignificant for Math. The estimates with Xset 2 and 3 are similar with often somewhat
larger effects on Math.
13 The kink in the estimated regression curve at higher quantiles for French for Xset 2 and particularly for Xset 3 is due to some kind of a locally high correlation among regressors. Therefore results for an additional regressor set Xset 3a are reported, where five disturbing variables have been removed: socioeconomic status, media, child
labour, small village and active involvement of parents in school matters. For this Xset 3a the previously positive effects for French at higher quantiles vanish almost entirely. See the columns for Niger 5th grade in Table C.2.

28
The situation is different for the 5th grade. Here the effects are about zero for the low
quantiles, and then decrease almost monotonously until –13 percentage points for Math for
the high ability students. This pattern is very stable across bandwidth choices and Xsets.
Effects are negative for both French and Math but more strongly so for Math.
In Mali, to the contrary, effects tend to be positive for both grades. For the 2nd grade, effects
are insignificant for French, but significantly positive for Math. Judging from the significance
levels, this effect seems to be most precise for the lower to medium quantiles. This implies
that children at the lower end of the ability distribution seem to benefit most clearly from the
contract teachers. The effects are smaller and less precisely estimated for Xsets 2 and 3 but
remain positive for Mathematics, perhaps except for very large quantiles.
For the 5th grade, the effects are also positive for French and Math for the low to medium
quantiles, but again significant only for Math and now only at the 10% level. For Xsets 2
and 3 the results are less precise and smaller. Hence, the evidence is less stable for the 5th
grade, but overall tends to be positive rather than negative.
All in all, the above analysis quite strongly confirms our expectations that given the different
characteristics of the contract teacher programmes in the three countries considered, we
should also observe quite different results. As suggested by our initial hypotheses on both the
incentive and selection effects, the contract teacher programme in Niger shows the worst
results, i.e. either insignificant or clearly negative. To the contrary, the Malian results are
consistently positive and significant in Math for both grades. This suggests that the potentially
negative role of low salaries (if any) was overcompensated by the positive incentive effect
induced notably by parental responsibility and monitoring in the case of Malian community
teachers. As expected, Togo occupies an intermediate position which may be related to the
fact that parental monitoring responsibility was reduced through the integration of parts of the
contract teachers into the public administration system.
One could also suspect that Togo’s relatively bad performance of contract teachers in 5th
grade is related to their missing pedagogical training. However, the use of Xset 3 where this
variable is controlled for, does not lead to any significant change. There is thus no evidence
that the lack of training could drive the results. At the same time, as stated earlier, it may not
be possible to fully separate the effect of education and training from the treatment itself. This
aspect must therefore be interpreted with caution.
The second general observation is that results do indeed differ depending on students’ ability
level. Across all countries, the analysis by quantile of the ability distribution suggests that
contract teachers do a relatively better job in low ability contexts. Whenever we observe

29
positive effects, they tend to become significant in low quantiles, and whenever we observe
negative effects, they tend to become significant in high quantiles of the ability distribution.
This implies that contract teachers tend to reduce inequalities in the student distribution.
In Mali and Togo, we also observe that contract teachers tend to be relatively more successful
with younger students, i.e. they show a better performance in 2nd as compared to 5th grade.
However, the opposite is the case in Niger. Overall, the influence of contract teachers is thus
more clearly related to student ability within each grade level than to students’ ability
difference across grades.
A possible explanation for this phenomenon could be that traditional civil servant teachers
may be unwilling to move to disadvantaged areas, and unmotivated if they are still compelled
to do so. Contract teachers, however, are often locally recruited and should therefore not face
this problem. Moreover, coming from a similar background, they are more aware of the
specific problems of children with learning deficiencies; they speak their language, know
their parents and thus may be better able to deal with the situation. Contract teachers may thus
outperform traditional teachers in a low-ability context, even if traditional teachers do better
in a less disadvantaged student environment.
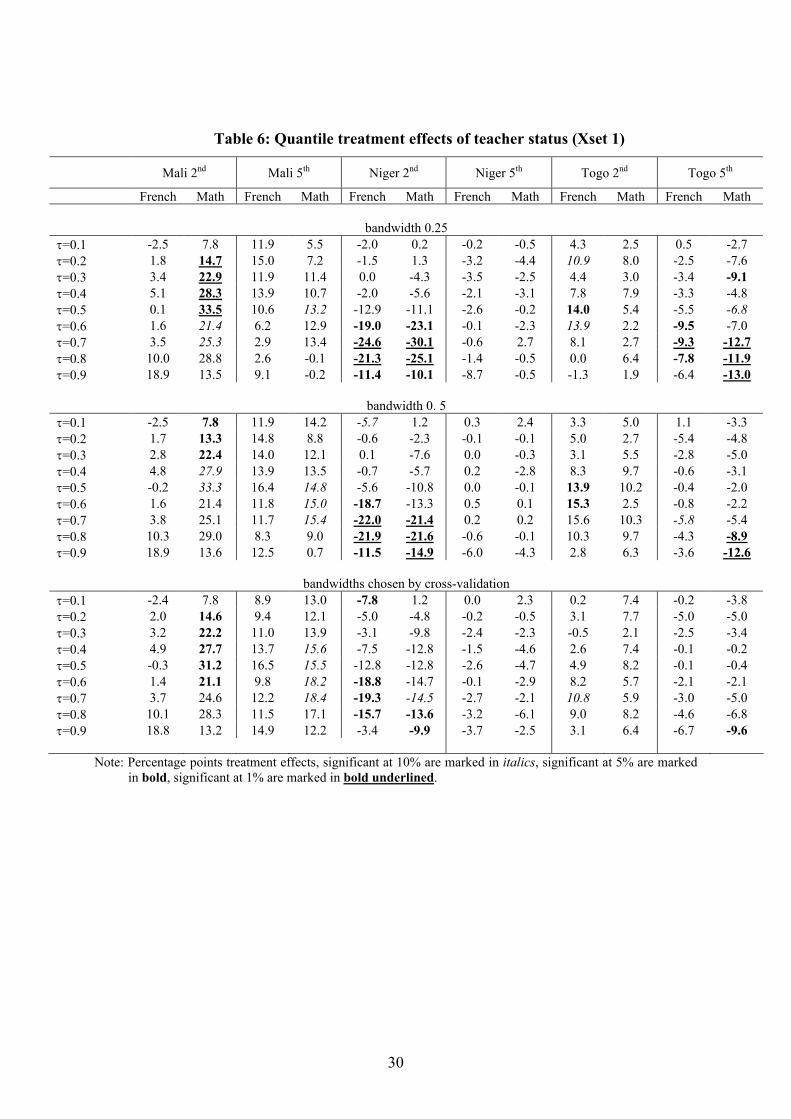
30
Table 6: Quantile treatment effects of teacher status (Xset 1)
Mali 2nd Mali 5th Niger 2nd Niger 5th Togo 2nd Togo 5th
French Math French Math French Math French Math French Math French Math
bandwidth 0.25
τ=0.1 -2.5 7.8 11.9 5.5 -2.0 0.2 -0.2 -0.5 4.3 2.5 0.5 -2.7
τ=0.2 1.8 14.7 15.0 7.2 -1.5 1.3 -3.2 -4.4 10.9 8.0 -2.5 -7.6
τ=0.3 3.4 22.9 11.9 11.4 0.0 -4.3 -3.5 -2.5 4.4 3.0 -3.4 -9.1
τ=0.4 5.1 28.3 13.9 10.7 -2.0 -5.6 -2.1 -3.1 7.8 7.9 -3.3 -4.8
τ=0.5 0.1 33.5 10.6 13.2 -12.9 -11.1 -2.6 -0.2 14.0 5.4 -5.5 -6.8
τ=0.6 1.6 21.4 6.2 12.9 -19.0 -23.1 -0.1 -2.3 13.9 2.2 -9.5 -7.0
τ=0.7 3.5 25.3 2.9 13.4 -24.6 -30.1 -0.6 2.7 8.1 2.7 -9.3 -12.7
τ=0.8 10.0 28.8 2.6 -0.1 -21.3 -25.1 -1.4 -0.5 0.0 6.4 -7.8 -11.9
τ=0.9 18.9 13.5 9.1 -0.2 -11.4 -10.1 -8.7 -0.5 -1.3 1.9 -6.4 -13.0
bandwidth 0. 5
τ=0.1 -2.5 7.8 11.9 14.2 -5.7 1.2 0.3 2.4 3.3 5.0 1.1 -3.3
τ=0.2 1.7 13.3 14.8 8.8 -0.6 -2.3 -0.1 -0.1 5.0 2.7 -5.4 -4.8
τ=0.3 2.8 22.4 14.0 12.1 0.1 -7.6 0.0 -0.3 3.1 5.5 -2.8 -5.0
τ=0.4 4.8 27.9 13.9 13.5 -0.7 -5.7 0.2 -2.8 8.3 9.7 -0.6 -3.1
τ=0.5 -0.2 33.3 16.4 14.8 -5.6 -10.8 0.0 -0.1 13.9 10.2 -0.4 -2.0
τ=0.6 1.6 21.4 11.8 15.0 -18.7 -13.3 0.5 0.1 15.3 2.5 -0.8 -2.2
τ=0.7 3.8 25.1 11.7 15.4 -22.0 -21.4 0.2 0.2 15.6 10.3 -5.8 -5.4
τ=0.8 10.3 29.0 8.3 9.0 -21.9 -21.6 -0.6 -0.1 10.3 9.7 -4.3 -8.9
τ=0.9 18.9 13.6 12.5 0.7 -11.5 -14.9 -6.0 -4.3 2.8 6.3 -3.6 -12.6
bandwidths chosen by cross-validation
τ=0.1 -2.4 7.8 8.9 13.0 -7.8 1.2 0.0 2.3 0.2 7.4 -0.2 -3.8
τ=0.2 2.0 14.6 9.4 12.1 -5.0 -4.8 -0.2 -0.5 3.1 7.7 -5.0 -5.0
τ=0.3 3.2 22.2 11.0 13.9 -3.1 -9.8 -2.4 -2.3 -0.5 2.1 -2.5 -3.4
τ=0.4 4.9 27.7 13.7 15.6 -7.5 -12.8 -1.5 -4.6 2.6 7.4 -0.1 -0.2
τ=0.5 -0.3 31.2 16.5 15.5 -12.8 -12.8 -2.6 -4.7 4.9 8.2 -0.1 -0.4
τ=0.6 1.4 21.1 9.8 18.2 -18.8 -14.7 -0.1 -2.9 8.2 5.7 -2.1 -2.1
τ=0.7 3.7 24.6 12.2 18.4 -19.3 -14.5 -2.7 -2.1 10.8 5.9 -3.0 -5.0
τ=0.8 10.1 28.3 11.5 17.1 -15.7 -13.6 -3.2 -6.1 9.0 8.2 -4.6 -6.8
τ=0.9 18.8 13.2 14.9 12.2 -3.4 -9.9 -3.7 -2.5 3.1 6.4 -6.7 -9.6
Note: Percentage points treatment effects, significant at 10% are marked in italics, significant at 5% are marked in bold, significant at 1% are marked in bold underlined.

31
Figure 1: Potential outcomes for Mali 2nd grade (Xset 1)
1 2( , , ) (0.5,0.5,0.25)Bandwidths h h λ =
1 2( , , ) (1,1,0.5)Bandwidths h h λ =
Bandwidths chosen by cross validation
Note: Distribution functions of potential outcomes, solid line 1ˆY
F , dashed line 0ˆY
F . (Horizontal distance is quantile treatment effect.)

32
Figure 2: Potential outcomes for Mali 5th grade (Xset 1)
1 2( , , ) (0.5,0.5,0.25)Bandwidths h h λ =
1 2( , , ) (1,1,0.5)Bandwidths h h λ =
Bandwidths chosen by cross validation
Note: Distribution functions of potential outcomes, solid line 1ˆY
F , dashed line 0ˆY
F . (Horizontal distance is quantile treatment effect.)

33
Figure 3: Potential outcomes for Niger 2nd grade (Xset 1)
1 2( , , ) (0.5,0.5,0.25)Bandwidths h h λ =
1 2( , , ) (1,1,0.5)Bandwidths h h λ =
Bandwidths chosen by cross validation
Note: Distribution functions of potential outcomes, solid line 1ˆY
F , dashed line 0ˆY
F . (Horizontal distance is quantile treatment effect.)

34
Figure 4: Potential outcomes for Niger 5th grade (Xset 1)
1 2( , , ) (0.5,0.5,0.25)Bandwidths h h λ =
1 2( , , ) (1,1,0.5)Bandwidths h h λ =
Bandwidths chosen by cross validation
Note: Distribution functions of potential outcomes, solid line 1ˆY
F , dashed line 0ˆY
F . (Horizontal distance is quantile treatment effect.)

35
Figure 5: Potential outcomes for Togo 2nd grade (Xset 1)
1 2( , , ) (0.5,0.5,0.25)Bandwidths h h λ =
1 2( , , ) (1,1,0.5)Bandwidths h h λ =
Bandwidths chosen by cross validation
Note: Distribution functions of potential outcomes, solid line 1ˆY
F , dashed line 0ˆY
F . (Horizontal distance is quantile treatment effect.)

36
Figure 6: Potential outcomes for Togo 5th grade (Xset 1)
1 2( , , ) (0.5,0.5,0.25)Bandwidths h h λ =
1 2( , , ) (1,1,0.5)Bandwidths h h λ =
Bandwidths chosen by cross validation
Note: Distribution functions of potential outcomes, solid line 1ˆY
F , dashed line 0ˆY
F . (Horizontal distance is quantile treatment effect.)

37
6. Conclusions
In this paper we analyzed the impact of the ‘contract teacher’ reforms on educational quality.
Traditionally, in most countries, teachers are hired as civil servants after a well regulated
initial education and training period and with clear career advancements tracks. Due to
financial pressure, high schooling demand and other reasons, many African (as well as Latin
American and South Asian) countries have experimented with alternative forms to engage
new teachers, usually providing only fixed term contracts with lower remuneration and
reduced entry requirements. In this paper we provide an overview of these contract teacher
reforms in francophone Africa and nonparametrically estimate quantile treatment effects for
Niger, Togo and Mali. Our empirical analysis is based on data collected by PASEC in several
francophone African countries, with the advantage that sampling, data collection, ability
testing, interviewing, data cleaning etc. always follow similar procedures, and that, with few
exceptions, variables are always coded and defined in the same way.
Our estimations point to two major findings. First it seems that contract teachers do relatively
better for low ability than for high ability students. When positive treatment effects are found,
they tend to be more positive at the low to medium quantiles, and when negative effects are
observed they tend to be more pronounced at the high ability quantiles. This pattern is
remarkably stable across countries, and most pronounced for Niger 2nd grade and Togo 5th
grade. This suggests that relative to traditional civil servant teachers, contract teachers are in a
better position to work in a more difficult learning environment and to react to the needs of
students with the most serious learning deficiencies. Thereby, they tend to reduce existing
inequalities in overall student outcomes.
Second, we observe clear differences in the impact of contract teachers between the three
countries. The treatment effects are highly negative for Niger in the 2nd grade and tend to be
very small, and slightly negative, for the 5th grade. In Togo we found clearly positive effects
for 2nd grade students. For the 5th grade, the effects were very small and negative for low
ability but very large and negative for high ability students. Here contract teachers do well in
low grades, but clearly fail in the 5th grade for the more advanced students. In contrast, in
Mali, the treatment effects tend to be positive for both 2nd and 5th grade, particularly in
Mathematics.
Hence, when ordering the three countries by their overall effects, we find that effects are
positive in Mali, somewhat mixed in Togo (with positive effects in 2nd and negative effects in
5th grade) and negative in Niger. This ordering can be related to the details of the
implementation of the contract teacher programme. In Mali and Togo, contract teachers have

38
been introduced in a less centralized way and, especially in Mali, the system continues to
work predominantly through the local communities. This could have led to a closer
monitoring and more effective hiring of contract teachers, which may have contributed to this
positive outcome. In Niger, apart from the centrally governed overall approach, the very fast
hiring of huge numbers of contract teachers relative to a rather limited base of qualified
secondary graduates may also have contributed to poor performance.
Hence, a focus on local community and parental involvement in hiring and monitoring
contract teachers as well as a gradual rather than immediate reform process seem to be
warranted.
Overall, our results thus indicate that the success or failure of contract teacher programmes in
terms of student performance depends on a careful implementation of the system. Despite
lower pay and adverse working conditions, the incentive effect may be positive, especially if
teachers are directly engaged by parents or the local community. In this case they will feel the
recognition of their effort and they can also be directly held responsible for their work.
These findings are encouraging, especially if we consider that in terms of purely quantitative
objectives such as universal primary education, hiring contract teachers appears to be
inevitable. According to the most recent UNESCO estimates, until the year 2015, 60 000 new
teaching positions must be created in Niger, 55 000 in Mali and 12 000 in Togo (UNESCO-
UIS 2006, p. 41). Taking into account the usual rates of turnover and attrition, it could be
estimated that overall about 150 000 teachers will have to be recruited in the three countries.
This number is twice as high as the stock of teachers currently on the job.
Our results suggest that the involvement and empowerment of parents and local communities
can help to face this challenge. It should be noted, however, that relying on the cooperation of
these groups tends to reinforce existing inequalities. If poor communities pay and monitor
their teachers while other well to do schools are equipped and managed by public authorities,
education policy becomes unacceptably regressive. The new challenge therefore is to achieve
a pro-poor distribution of educational expenditure while, at the same time, encouraging local
initiative and autonomy.

39
References
Aaronson, D., L. Barrow and W. Sander (2003): Teachers and Student Achievement in the Chicago Public High Schools, Working Paper 2002-28, Federal Reserve Bank of Chicago, Chicago.
Angrist, J., E. Bettinger, E. Blohm, E. King and M. Kremer (2002): Vouchers for Private Schooling in Colombia: Evidence from a Randomized Natural Experiment, American Economic Review Vol. 92, No. 5, 1535-1558.
Angrist, J., E. Bettinger and M. Kremer (2004): Long-Term Consequences of Secondary School Vouchers: Evidence from Administrative Records in Colombia” BREAD Working Paper 79, Harvard.
Angrist, J. and J. Guryan (2004): Teacher Testing, Teacher Education, and Teacher Characteristics, American Economic Review Vol. 94, No. 2, 241-246.
Banerjee, A. and E. Duflo (2006): Addressing Absence, Journal of Economic Perspectives Vol. 20, No. 1, 117-132.
Bernard, J.-M., B. Tiyab and K. Vianou (2004): Profils enseignants et qualité de l’éducation primaire en Afrique subsaharienne francophone: Bilan et perspectives de dix années de recherche du PASEC, mimeo, PASEC/CONFEMEN.
Bishop, J. and L. Wößmann (2004): Institutional Effects in a Simple Model of Educational Production, Education Economics Vol. 12, No.1, 17-38.
Black, D. and J. Smith (2004): How Robust is the Evidence on the Effects of College Quality? Evidence from Matching, Journal of Econometrics Vol. 121, No. 1-2, 99-124.
Bourdon, J., M. Frölich and K. Michaelowa (2006): Broadening Access to Primary Education: Contract Teacher Programs and Their Impact on Education Outcomes in Africa – An Econometric Evaluation for Niger, Lukas Menkhoff (ed.): Pro-Poor Growth: Issues, Policies, and Evidence, Berlin: Duncker & Humblot, 117-149.
Bruns, B., A. Mingat and R. Rakotomalala (2002): A Chance for Every Child, Washington: The World Bank.
Castro, V. (2004): Contratos laborales docentes y su impacto en los indicadores de Educación para
Todos, Paris: IIEP-UNESCO, http://www.unesco.org/iiep/eng/research/basic/PDF/ teachers4.pdf (accessed 20/02/07).
Clotfelter, C., H. Ladd and J. Vigdor (2006): Teacher-Student Matching and the Assessment of Teacher Effectiveness, NBER Working Paper No. 11936, http://www.nber.org/papers/w11936 (accessed 4/02/2007).
Duflo, E. and R. Hanna (2005) “Monitoring Works: Getting Teachers to Come to School”, mimeo, Poverty Action Lab, Massachusetts Institute of Technology, http://econ-www.mit.edu/faculty/download_pdf.php?id=1238 (accessed 3/02/2007).
Duthilleul, Y. (2005): Lessons Learnt in the Use of Contract Teachers, Paris: IIEP.
Fan, J. (1992): Design-adaptive Nonparametric Regression, Journal of American Statistical Association 87, 998-1004.
Fan J. and I. Gijbels (1996): Local Polynomial Modeling and its Applications, London: Chapman and Hall.
Faoura, T. (ed.) (2004): La réforme de la formation initiale des maîtres en Guinée (FIMG): étude-bilan de la mise en oeuvre, Paris: L'Harmattan (ADEA publication).
Firpo, S. (2007): Efficient Semiparametric Estimation of Quantile Treatment Effects, forthcoming in Econometrica.
Francken, N., B. Minten and J. Swinnen (2005): Listen to the Radio! Media and Corruption: Evidence from Madagascar, mimeo, Katholieke Universiteit Leuven, Leuven,

40
http://www.csae.ox.ac.uk/conferences/2006-EOI-RPI/papers/csae/Francken.pdf (accessed 18/ 02/2007).
Frölich, M. (2006a): Nonparametric Regression for Binary Dependent Variables, Econometrics Journal Vol. 9, No. 3, 511-540.
Frölich, M. (2006b): A Note on Parametric and Nonparametric Regression in the Presence of Endogenous Control Variables, IZA discussion paper 2126.
Frölich, M. (2007): Propensity Score Matching Without Conditional Independence Assumption - with an application to the gender wage gap in the UK, Econometrics Journal, forthcoming.
Glewwe, P. and M. Kremer (2006): Schools, Teachers, and Education Outcomes in Developing Countries, Eric Hanushek and Finis Welch (eds): Handbook on the Economics of Education Vol. 2, 945-1017, New York: Elsevier.
Glewwe, P., N. Ilias and M. Kremer (2003): Teacher Incentives, NBER Working Paper 9671, http://www.nber.org/papers/w9671 (accessed 04/02/2007).
Govinda, R. and Y. Josephine (2004): Para-Teachers in India, Paris: IIEP-UNESCO,
http://www.unesco.org/iiep/eng/research/basic/PDF/teachers5.pdf (accessed 20/02/07).
Gozalo P. and O. Linton (2000): Local Nonlinear Least Squares: Using parametric information in nonparametric regression, Journal of Econometrics 99, 63-106.
Hanushek, E. (1986): The Economics of Schooling: Production and Efficiency in Public Schools, Journal of Economic Literature 24, 1141-1177.
Hanushek, E. (2003): The Failure of Input-Based Schooling Policies, Economic Journal Vol. 113, No.2, F64-F98.
Hanushek, E. A., J. Kain, D. O’Brien and S. Rivkin (2005): The Market for Teacher Quality, NBER Working Paper 11154, http://www.nber.org/papers/w11154 (accessed 4/02/2007).
Heckman, J., H. Ichimura and P. Todd (1997): Matching as an Econometric Evaluation Estimator: Evidence from Evaluating a Job Training Programme, Review of Economic Studies 64, 605-654.
Hoxby, C. (2000): Does Competition among Public Schools Benefit Students and Taxpayers?, American Economic Review Vol. 90, No. 5, 1209-1238.
Hoxby, C. (ed.) (2003a): The Economics of School Choice, NBER Conference Report, Chicago: University of Chicago Press.
Hoxby, C. (2003b): School Choice and School Competition: Evidence from the United States, Swedish Economic Policy Review Vol. 10, No. 3, 9-65.
King, E., P. Orazem and D. Wohlgemuth (1999): Central Mandates and Local Incentives: The Colombia Education Voucher Program, World Bank Economic Review Vol. 13, No. 3, 467-491.
Kingdon, G. G. and F. Teal (2007): Does Performance Related Pay for Teachers Improve Student Achievement? Some Evidence from India, Economics of Education Review, forthcoming.
Kremer, M., K. Muralidharan, N. Chaudhury, J. Hammer and F. Rogers (2005): Teacher Absence in India: A Snapshot, Journal of the European Economic Association Vol. 3, No. 2-3, 658-667.
Krueger, A. (2003): Economic Considerations and Class Size, Economic Journal Vol. 113, 34-63.
Lavy, V. (2002): Evaluating the Effect of Teachers’ Group Performance Incentives on Pupil Achievement, Journal of Political Economy Vol. 110, No. 6, 1286-1317.
Lavy, V. (2004): Performance Pay and Teachers’ Effort, Productivity and Grading Ethics, NBER Working Paper 10622, Cambridge: NBER.

41
Lechner, M. (1999): Earnings and Employment Effects of Continuous Off-the Job Training in East Germany after Unification, Journal of Business and Economic Statistics Vol. 17, No. 1, 74-90.
Machin, S. and S. McNally (2004): The Literacy Hour, Discussion Paper CEE 0043, Centre for the Economics of Education, London School of Economics, London.
Michaelowa, K. and A. Wechtler (2006): The Cost-Effectiveness of Inputs in Primary Education: Insights from the Literature and Recent Student Surveys for Sub-Saharan Africa, Study
commissioned by the Association for the Development of Education in Africa (ADEA), ADEA Working Document, Paris.
Michaelowa, K. and E. Wittmann (2007): Teacher Job Satisfaction, Student Achievement, and the Cost of Primary Education in Francophone Sub-Saharan Africa, Journal of Developing Areas, forthcoming.
MINEDAF (2002): Universal Primary Education: Goal for All, statistical document, Conference of the Ministers of Education of African Member States (MINEDAF VIII), Dar-Es-Salaam: UNESCO.
Mingat, A. and B. Suchaut (2000): Une analyse économique comparative des systèmes éducatifs africains, Paris: De Boeck.
Mingat, A. (2004): La rémunération de l’enseignement primaire dans les pays francophones d’Afrique sub-saharienne. Paper presented at the Conference on Contract Teachers, Bamako, Mali, 21-23 November, 2004.
Muralidharan K. and V. Sundararaman (2006): Teacher Incentives in Developing Countries: Experimental Evidence from India, Job Market Paper, Department of Economics, Harvard University, http://www.people.fas.harvard.edu/~muralidh/Karthik_Muralidharan_JMP_ Teacher_Incentives_In_Developing_Countries.pdf (accessed 02/14/2007).
Ndoye, M. (2001): Education volunteers: new teachers to take up the challenge of Education for All, IIEP Newsletter Vol. 19, No. 2, 9-10.
Ndoye, M. (2004): Principales conclusions sur l’état des lieux (tendances, succès, défits), Paper presented at the Conference on Contract Teachers, Bamako, Mali, 21-23 November, 2004.
OECD (2002): Education at a Glance, Paris: OECD.
PASEC (2003): Le Programme de formation initiale des maîtres et la double vacation en Guinée, Dakar: CONFEMEN.
PASEC (2005a): Les enseignants contractuels et la qualité de l’enseignement de base I au Niger : Quel bilan?, Dakar: CONFEMEN.
PASEC (2005b): Impact du statut enseignant sur les acquisitions dans le premier cycle l’enseignement fondamental public au Mali, Dakar: CONFEMEN.
PASEC (2004): Recrutement et formation des enseignants du premier degré au Togo: Quelles priorités?, Dakar: CONFEMEN.
Racine J. and Q. Li (2004): Nonparametric Estimation of Regression Functions with Both Categorical and Continuous Data, Journal of Econometrics 119, 99-130.
Reinikka, R. and Svensson, J. (2004): The Power of Information: Evidence from a Newspaper Campaign to Reduce Capture, Policy Research Working Paper No. 3239, Washington: The World Bank.
Rivkin, S., E. Hanushek and J. Kain (2005): Teachers, Schools, and Academic Achievement, Econometrica Vol. 73, No. 2, 417-458.
Rockoff, J. (2004): The Impact of Individual Teachers on Student Achievement: Evidence from Panel Data, American Economic Review Vol. 94, No. 2, 247-52.
Spretsma M. and F. Waldenberg (2007): The effect of teachers’ wages on student achievement. Evidence from Brazil, Jürgen Backhaus, Raul Eamets, Jüri Sepp (eds): Advances in the

42
Economics of Education: On Markets and Post-Transformation Issues, http://www.ires.ucl.ac.be/DP/IRES_DP/2005-8.pdf (accessed 11/02/2007).
Vegas, E. and J. de Laat (2003): Do Differences in Teacher Contracts Affect Student Performance? Evidence from Togo, Working Paper No. 26955, World Bank.
UNESCO-UIS (2005): Education: Statistical Tables, http://portal.unesco.org/uis/ev.php? URL_ID=5187&URL_DO=DO_TOPIC&URL_SECTION=201 (accessed 21/3/05).
UNESCO-UIS (2006): Teachers and Educational Quality: Monitoring Global Needs for 2015,
Montreal: UNESCO Institute for Statistics, http://www.uis.unesco.org/TEMPLATE/pdf/ Teachers2006/TeachersReport.pdf (accessed 2/21/2007).
UNESCO (2004): Education for All – The Quality Imperative, EFA Global Monitoring Report 2005, Paris: UNESCO.
World Bank (2002): Le système éducatif togolais – Eléments pour une revitalisation, Africa Region Human Development Working Paper (Education sector Country Status Report for Togo).
World Bank (2004): La dynamique des scolarisations au Niger: Evaluations pour un développement durable, Africa Region Human Development Working Paper, Development Research Group (Education sector Country Status Report for Niger).
World Bank (2005a): Le système éducatif guinéen: Diagnostic et perspectives pour la politique éducative dans le contexte de contraintes macro-économiques fortes et de réduction de la pauvreté, Africa Region Human Development Working Paper, Development Research Group (Education sector Country Status Report for Guinea).
World Bank (2005b): Eléments de Diagnostic du Système Educatif Tchadien - Pour une Politique Educative Nouvelle, Africa Region Human Development Working Paper, Development Research Group (Education sector Country Status Report for Chad).
World Bank (2005c): Madagascar Public Expenditure Review 2004, The Challenge of Poverty Reduction, Report No. 30331-MG, Public Sector Reform and Capacity Building Unit, (AFTPR) Africa Region, Washington D.C., World Bank.
World Bank (2006a): Eléments de Diagnostic du Système Educatif Malien: Le besoin d’une Politique Educative Nouvelle pour l’atteinte des objectifs du millénaire et la réduction de la pauvreté, Africa Region Human Development Working Paper, Development Research Group (Education sector Country Status Report for Mali).
World Bank (2006b): World Development Indicators 2006, CD Rom, Washington.
World Bank (2007): Le système éducatif congolais: Diagnostic pour une revitalisation dans un contexte macroéconomique plus favorable, Africa Region Human Development Working Paper, Development Research Group (Education sector Country Status Report for the Republic of Congo).
World Bank (Africa Region) and Pôle de Dakar (2007): Le système éducatif congolais: Diagnostic pour une revitalisation dans un contexte macroéconomique plus favorable (Education sector Country Status Report for Congo), preliminary version, February, Dakar.
Wößmann, L. (2005): Competition, Decentralization and Accountability: Lessons for Education Policies in Developing Countries from International Achievement Tests, Nord-Süd Aktuell Vol. 19, No. 2, 142-153.

43
Appendix A: Additional information about the contract teacher reforms, labour market
conditions and the data set
Table A.1: Additional information on contracts teachers in francophone sub-Saharan
Africa (primary education)1
Country
Total
number of
teachers,
2004
EFA staff
needs,
20152
Types of
contract teachers
(local names)3
Contract teachers in %
of national primary
teaching staff, 2003
Recent
trends
Contract teacher salaries as compared to salaries for full
rank civil servants (details and trends)
Contract teachers 24% 35%
Benin 25,600 49,300 “Communautaires” 30% (2006)
17% and without any bonuses, since recently mainly paid by the central government budget (in 2006 only about one sixth, i.e. ca. 1,000, paid by parents and local communities)
Contract teachers 24% 80% Burkina Faso 23,400 76,500
Community teachers 12% 30-35%
“Instituteurs vacataires” (IVAC)
24% Sharp increase
25% to 40% (=90$ to 140$ per month); in 2006, a process started to integrate experienced IVAC into the civil service
Cameroon 55,300 78,000d Community teachers “maîtres de parents”
45% Decrease
Local arrangements, ca. 30$/month for seven months per year
Chad 16,200 61,200 Community teachers
Public contract teachers
65%
< 0,5% of teaching staff)
Permanent increase Decrease
Variable, typically 20% to 40%4
Congo, Rep. of
7,100 26,400
Contract teachers
Volunteers
Community teachers
4%
14%
30%
Increase
100%, on nine months per year
Volunteers 45% to 80% also on nine months
Variable, estimates range from 30% to 60%
Guinea 25,400 48,200 Contract teachers
Community teachers
54% (2005)
< 2% (2005)5
Increase
Decrease
55%
33%
Madagascar 64,300 89,600 Contract teachers (various types)
59% (2004) 5 Increase
30% to 50% for state contract teachers, depending on types,
figures are rapidly changing 6
Mali 26,700 82,200 Contract teachers (various types)
65% (2004) Overall increase
Temporary staff ca. 8% (2004) Hourly wages Mauritania 9,800 16,900
retirees marginal Decrease
Bonus added to regular pension
Niger 22,400 82,700 Contract teachers 56% (2004) plus 0,7% acting as teachers during
civic service.
Sharp increase
Senegal 32,000 57,100 Educational volunteers contract teacher 42% parents’ teachers 12%
Togo 22,200 34,100 Contract teachers community teachers
31% 33 %
Increasing 40%
≥16%; typically 25% to 30% for schools run by NGO 1 This table does not only provide additional details to Table 1 (and 2) of the text, it sometimes also presents more recent information. This is
notably the case when the information required for Table 1 is only partially available for the more recent year. 2 UNESCO-UIS estimates for total requirement of primary teachers to achieve universal primary education in 2015 3 In our text, “contract teacher” is used as a general term including all kinds of non-civil servant teachers hired on a contractual basis,
independently of whether they are engaged by the public administration, the community or other private entities. In the countries, various terms are used distinguishing between these groups. The term “contract teacher” then also refers more narrowly to those teachers engaged or at least paid by public authorities. However, the terms for subgroups are not used in any uniform way across different countries. 4 In some deprived areas, monthly wage is estimated only around 10$. However, in 2005 a plan was set up as to guarantee, through a state
grant a monthly salary of 45$ for community teachers with, and of 25$ for community teachers without pedagogical training. The former represents about half the wage of civil servant auxiliary teachers. The grant is financed through the state’s new petroleum receipts. 5 While officially, the status of most community teachers was changed into (public) contract teachers in 2004, some doubts remain with
respect to official statistics. In particular, it has been observed that communities continue to hire their own teachers which are not taken into account. 6 In early 2007 a five-year plan was launched to hire 13 000 “vacataires” to support the EFA process.
Sources: World Bank (2002, 2004, 2005a, 2005b, 2005c 2006a, 2007), World Bank (Africa Region) and Pôle de Dakar (2007), UNESCO-UIS (2006, p 162).

44
Table A2: School to work transition and alternative labour market opportunities for teacher candidates
Mali (1998-2004) Niger (2000-2002) Togo (1997-2000)
Lower secondary attainment 19100 7900 11800
Upper secondary attainment 6100 2200 4200
Annual number of graduates
(labour market supply, skilled or semi-skilled)
Tertiary attainment 4000 1500 1600
Professionals (skilled / highly skilled) 670 500 300 Annual job openings (labour market demand, skilled or semi-skilled and unskilled, modern sector)
Semi-skilled and unskilled 6500 3000 1700
Ratio tertiary graduates / professional positions 6,0 3,0 5,3
Ratio secondary and tertiary graduates / total modern sector positions 3,9 3,4 9,4
Sources: World Bank (2002, p. 77, 2004, p. 97, 2006a, p. 141).
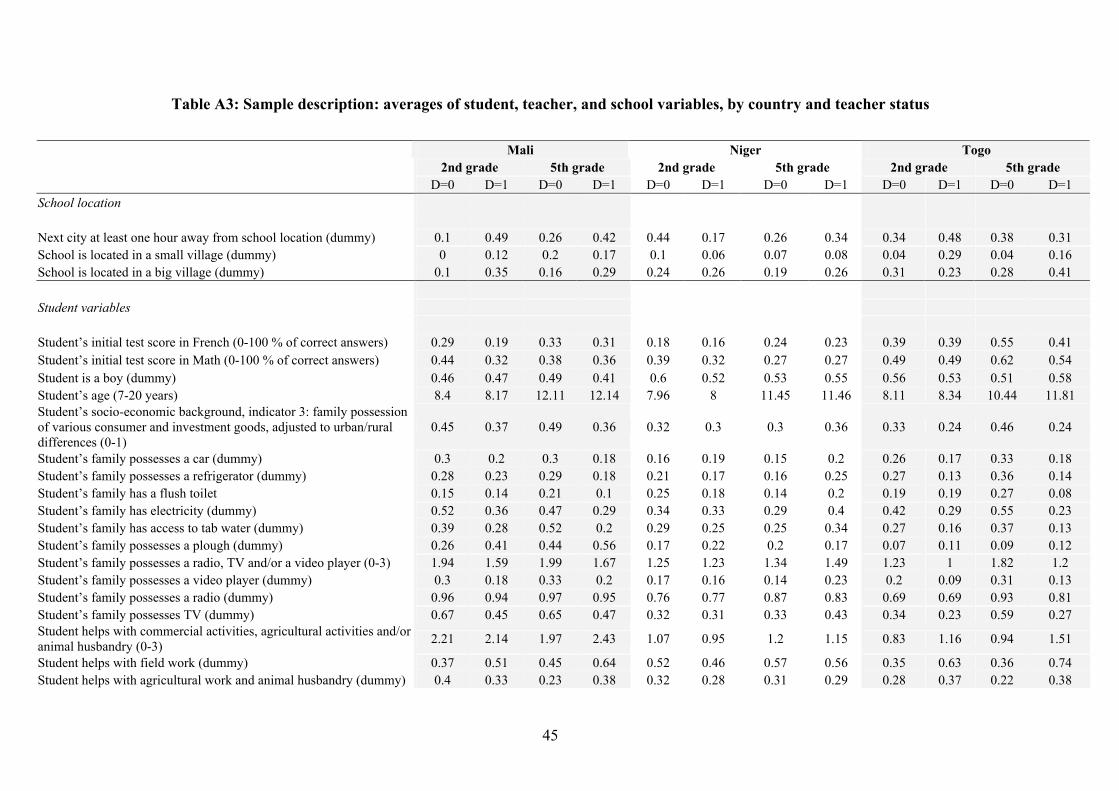
45
Table A3: Sample description: averages of student, teacher, and school variables, by country and teacher status
Mali Niger Togo
2nd grade 5th grade 2nd grade 5th grade 2nd grade 5th grade
D=0 D=1 D=0 D=1 D=0 D=1 D=0 D=1 D=0 D=1 D=0 D=1
School location
Next city at least one hour away from school location (dummy) 0.1 0.49 0.26 0.42 0.44 0.17 0.26 0.34 0.34 0.48 0.38 0.31
School is located in a small village (dummy) 0 0.12 0.2 0.17 0.1 0.06 0.07 0.08 0.04 0.29 0.04 0.16
School is located in a big village (dummy) 0.1 0.35 0.16 0.29 0.24 0.26 0.19 0.26 0.31 0.23 0.28 0.41
Student variables
Student’s initial test score in French (0-100 % of correct answers) 0.29 0.19 0.33 0.31 0.18 0.16 0.24 0.23 0.39 0.39 0.55 0.41
Student’s initial test score in Math (0-100 % of correct answers) 0.44 0.32 0.38 0.36 0.39 0.32 0.27 0.27 0.49 0.49 0.62 0.54
Student is a boy (dummy) 0.46 0.47 0.49 0.41 0.6 0.52 0.53 0.55 0.56 0.53 0.51 0.58
Student’s age (7-20 years) 8.4 8.17 12.11 12.14 7.96 8 11.45 11.46 8.11 8.34 10.44 11.81
Student’s socio-economic background, indicator 3: family possession of various consumer and investment goods, adjusted to urban/rural differences (0-1)
0.45 0.37 0.49 0.36 0.32 0.3 0.3 0.36 0.33 0.24 0.46 0.24
Student’s family possesses a car (dummy) 0.3 0.2 0.3 0.18 0.16 0.19 0.15 0.2 0.26 0.17 0.33 0.18
Student’s family possesses a refrigerator (dummy) 0.28 0.23 0.29 0.18 0.21 0.17 0.16 0.25 0.27 0.13 0.36 0.14
Student’s family has a flush toilet 0.15 0.14 0.21 0.1 0.25 0.18 0.14 0.2 0.19 0.19 0.27 0.08
Student’s family has electricity (dummy) 0.52 0.36 0.47 0.29 0.34 0.33 0.29 0.4 0.42 0.29 0.55 0.23
Student’s family has access to tab water (dummy) 0.39 0.28 0.52 0.2 0.29 0.25 0.25 0.34 0.27 0.16 0.37 0.13
Student’s family possesses a plough (dummy) 0.26 0.41 0.44 0.56 0.17 0.22 0.2 0.17 0.07 0.11 0.09 0.12
Student’s family possesses a radio, TV and/or a video player (0-3) 1.94 1.59 1.99 1.67 1.25 1.23 1.34 1.49 1.23 1 1.82 1.2
Student’s family possesses a video player (dummy) 0.3 0.18 0.33 0.2 0.17 0.16 0.14 0.23 0.2 0.09 0.31 0.13
Student’s family possesses a radio (dummy) 0.96 0.94 0.97 0.95 0.76 0.77 0.87 0.83 0.69 0.69 0.93 0.81
Student’s family possesses TV (dummy) 0.67 0.45 0.65 0.47 0.32 0.31 0.33 0.43 0.34 0.23 0.59 0.27
Student helps with commercial activities, agricultural activities and/or animal husbandry (0-3)
2.21 2.14 1.97 2.43 1.07 0.95 1.2 1.15 0.83 1.16 0.94 1.51
Student helps with field work (dummy) 0.37 0.51 0.45 0.64 0.52 0.46 0.57 0.56 0.35 0.63 0.36 0.74
Student helps with agricultural work and animal husbandry (dummy) 0.4 0.33 0.23 0.38 0.32 0.28 0.31 0.29 0.28 0.37 0.22 0.38

46
Table A3 cont.
Mali Niger Togo
2nd grade 5th grade 2nd grade 5th grade 2nd grade 5th grade
D=0 D=1 D=0 D=1 D=0 D=1 D=0 D=1 D=0 D=1 D=0 D=1
Student helps with commercial activities (dummy) 0.32 0.26 0.25 0.32 0.24 0.22 0.33 0.29 0.2 0.16 0.37 0.4
Student has breakfast, lunch and/or dinner (0-3) 2.96 2.95 2.94 2.95 2.86 2.88 2.95 2.89 2.65 2.77 2.81 2.61
Student has breakfast never, sometimes or regularly (0-1) 0.99 0.98 0.97 0.98 0.98 0.99 1 1 0.88 0.9 0.95 0.86
Student has lunch never, sometimes or regularly (0-1) 0.99 0.99 0.98 0.99 0.92 0.93 0.97 0.93 0.88 0.93 0.93 0.87
Student has dinner never, sometimes or regularly (0-1) 0.98 0.98 0.99 0.98 0.95 0.96 0.98 0.97 0.89 0.93 0.93 0.88
Student has a textbook for French, for Math or both (0-2) 0.39 0.29 0.72 0.55 0.36 0.38 0.4 0.41 1 0.48 1.34 0.72
Student gets help with studies at home (dummy) 0.71 0.6 0.75 0.55 0.49 0.52 0.65 0.68 0.6 0.65 0.68 0.55
Student speaks French at home (dummy) 0.09 0.12 0.42 0.22 0.07 0.07 0.04 0.09 0.48 0.41 0.86 0.86
Student is repeating the 5th grade (dummy) e) 0.15 0.2 0.27 0.24 0.08 0.1 0.08 0.11 0.2 0.31 0.16 0.22
Student’s number of previous grade repetitions (0-4) 0.18 0.17 0.41 0.47 0.15 0.09 0.23 0.19 0.31 0.5 0.72 1.2
School variables
Class size 71.41 63.51 58.77 54.33 46 45.68 34.43 36.14 40.46 38.36 32.81 36.83
Share of female students in the class (0-100%) 45.81 46.07 40.89 42.16 44.14 45.15 45.07 44.92 44.54 46.69 48.44 44.69
School’s overall number of students (14-2733) 304.28 234.47 251.55 211.24 348.08 368.52 391.95 445.62 511.08 460.43 441.46 512.32
School equipment indicator, low to high (0-14) 5.48 4.85 4.82 4.9 3.78 3.9 3.77 4.31 4.29 3 5.68 3.23
School has access to fresh water (dummy) 0.68 0.74 0.74 0.68 0.67 0.58 0.63 0.63 0.56 0.21 0.51 0.3
Classroom has electricity (dummy) 0.34 0.11 0.25 0.03 0.14 0.15 0.11 0.18 0.27 0.05 0.21 0.05
School has toilets 0.68 0.75 0.73 0.79 0.57 0.48 0.48 0.64 0.75 0.19 0.75 0.39
Parents easily mobilized for school issues (dummy) 0.28 0.51 0.27 0.48 0.57 0.76 0.83 0.56 0.6 0.58 0.42 0.43
Frequent exchange among teachers (dummy) 0.9 0.92 0.91 0.91 0.75 0.84 0.79 0.74 0.96 0.95 0.96 1
Director is male (dummy) 0.78 0.9 0.66 0.84 0.84 0.84 0.9 0.77 0.95 0.92 0.92 0.89
Director’s education index, from below primary completion to 3 years of higher education and above (0-6)
3.46 3.08 2.32 3.07 3.98 4.07 3.93 3.88 3.1 3.29 3.2 2.96
Director received some pedagogical training (dummy) 0.8 0.8 1 0.8 0.88 0.9 0.98 0.85 0.16 0.19 0.21 0.25
School participates in a pilot project, exchange program etc. (dummy) 0.32 0.24 0.44 0.3 0.36 0.41 0.43 0.19 0.08 0.35 0.19 0.21

47
Table A3 cont.
Mali Niger Togo
2nd grade 5th grade 2nd grade 5th grade 2nd grade 5th grade
D=0 D=1 D=0 D=1 D=0 D=1 D=0 D=1 D=0 D=1 D=0 D=1
Teacher variables
Teacher is male (dummy) 0.29 0.28 0.51 0.71 0.34 0.06 0.47 0.36 1.36 1.32 1.03 1.05
Teacher’s age (21-60 years) 35.01 29.83 36.53 31.93 30.08 27.79 30.07 28.74 34.62 32.52 36.01 34.09
Teacher’s education index, from below primary completion to 3 years of higher education and above (0-6)
2.34 1.61 2.34 2.15 4.01 3.72 4.51 4.18 2.86 2.88 3.82 4
Teacher speaks local language (dummy) 0.61 0.73 0.86 0.8 0.9 0.92 0.91 0.93 0.82 0.79 0.75 0.61
School inspected during the last 12 months (dummy) 1 0.79 1 0.81 0.78 0.83 0.86 0.73 0.57 0.69 0.64 0.79
Teacher’s job experience (0-40 years) 8.43 3.12 7.04 3.82 4.88 2.44 5.58 2.7 6.2 5.47 7.04 5.87
Class management in double shifts (dummy) 0.59 0.39 0.5 0.39 0.09 0.1 0 0 0 0 0 0
Class management with multi-grade teaching (dummy) 0.09 0.06 0.06 0.15 0 0.07 0.06 0.04 0 0.1 0 0.02
Classroom is equipped with a blackboard and chalk (dummy) 1 0.86 0.91 1 0.87 0.93 0.92 1 0.83 0.76 0.75 0.83
Notes: Range of possible values in parenthesis. Teacher status: D=0 civil servant, D=1 contract teacher. Source: PASEC database.
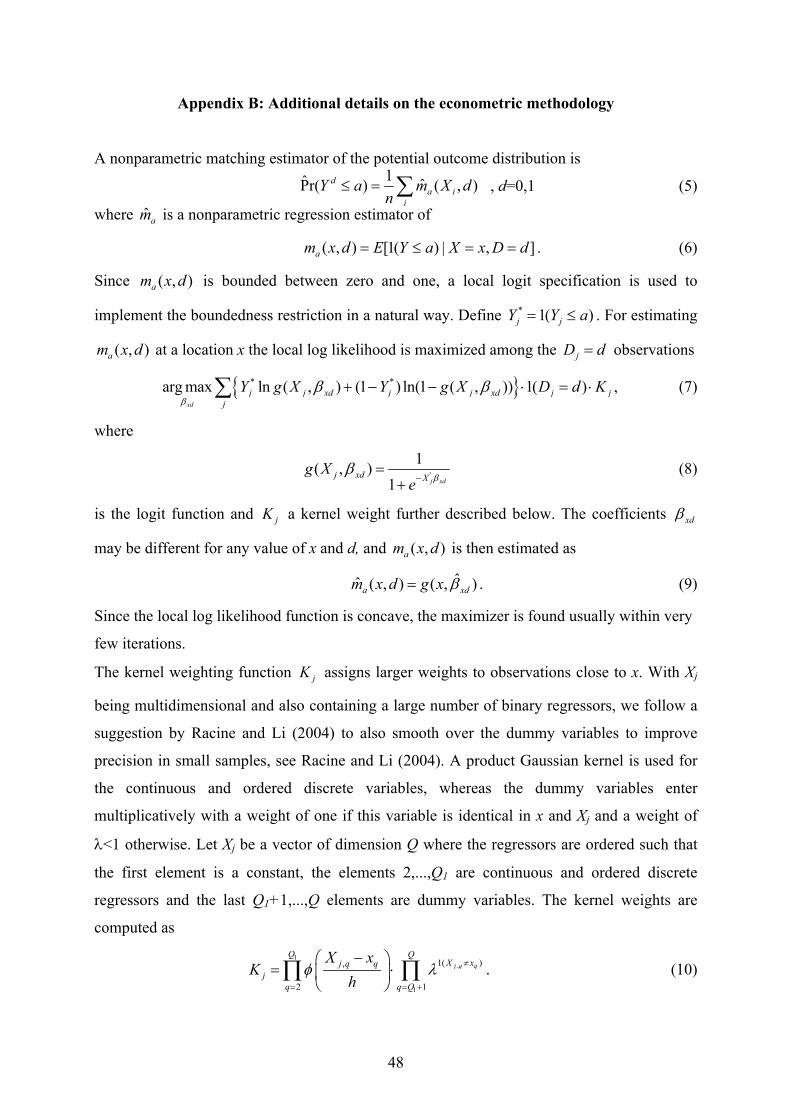
48
Appendix B: Additional details on the econometric methodology
A nonparametric matching estimator of the potential outcome distribution is
, d=0,1 (5)
where ˆ am is a nonparametric regression estimator of
( , ) [1( ) | , ]am x d E Y a X x D d= ≤ = = . (6)
Since ( , )am x d is bounded between zero and one, a local logit specification is used to
implement the boundedness restriction in a natural way. Define * 1( )j jY Y a= ≤ . For estimating
( , )am x d at a location x the local log likelihood is maximized among the jD d= observations
{ }* *argmax ln ( , ) (1 ) ln(1 ( , )) 1( )xd
j j xd j j xd j j
j
Y g X Y g X D d Kβ
β β+ − − ⋅ = ⋅∑ , (7)
where
'
1( , )
1 j xdj xd X
g Xe
ββ
−=
+ (8)
is the logit function and jK a kernel weight further described below. The coefficients xdβ
may be different for any value of x and d, and ( , )am x d is then estimated as
ˆˆ ( , ) ( , )a xdm x d g x β= . (9)
Since the local log likelihood function is concave, the maximizer is found usually within very
few iterations.
The kernel weighting function jK assigns larger weights to observations close to x. With Xj
being multidimensional and also containing a large number of binary regressors, we follow a
suggestion by Racine and Li (2004) to also smooth over the dummy variables to improve
precision in small samples, see Racine and Li (2004). A product Gaussian kernel is used for
the continuous and ordered discrete variables, whereas the dummy variables enter
multiplicatively with a weight of one if this variable is identical in x and Xj and a weight of
λ<1 otherwise. Let Xj be a vector of dimension Q where the regressors are ordered such that
the first element is a constant, the elements 2,...,Q1 are continuous and ordered discrete
regressors and the last Q1+1,...,Q elements are dummy variables. The kernel weights are
computed as
1
,
1
1( ),
2 1
j q q
Q QX xj q q
j
q q Q
X xK
hφ λ ≠
= = +
− = ⋅
∏ ∏ . (10)
∑=≤i
ia
d dXmn
aY ),(ˆ1
)r(P̂

49
If λ=0, only observations Xj that are identical to x with respect to all dummy variables receive
positive weights. This corresponds to running separate local regressions within each cell
defined by the dummy variables. If λ=1, the dummy variables would not affect the kernel
weights but would enter only in the local approximation plane ( , )j xdg X β .
In principle different bandwidth values h or λ could be used for every regressor, which
however would require choosing a very large number of smoothing parameters. Instead we
distinguish three bandwidths: h1 for the French and Math test scores at the beginning of the
school year, h2 for all the other non-binary regressors and λ for the binary regressors. Before
estimation, all the non-binary regressors are rotated such that their sample variance-
covariance matrix is the identity matrix. In other words, these transformed regressors all have
the same standard deviation and are uncorrelated. This reduces colinearity problems and also
ensures that the effective bandwidth is about proportional to the standard deviation of each
variable.
For choosing bandwidth values for nonparametric regression, least-squares cross-validation is
a frequently used approach. For matching estimators, where the nonparametric regression
enters only as a plug-in and is then averaged over, it is well known that some asymptotic
undersmoothing is required to reduce the order of the bias term. However, no data-driven
bandwidth selectors for matching estimators based on local logit regression seem to be
available so far. Therefore, we pursue a rather conservative approach in that we estimate the
potential outcome distributions for bandwidth values chosen by leave-one-out least-squares
cross-validation14 and for two sets of fixed bandwidth values: 1 2( , , ) (0.5,0.5,0.25)h h λ = and
1 2( , , ) (1,1,0.5)h h λ = . We expect the cross-validation bandwidths to generate a larger bias and
will therefore concentrate on the latter two bandwidth choices to examine sensitivity of the
estimates to the bandwidth values. Only if the estimates appear to be rather stable, one would
be confident to trust in the results.15
The precise implementation of the local logit estimator follows Frölich (2006a). For any given
bandwidths values it may occur that for some locations x and d the local likelihood estimator
is not well defined, e.g. due to local near-colinearity or perfect prediction. This happens
14 The bandwidths were chosen by leave-one-out least-squares cross-validation separately for the D=0 and the D=1 subsample, and separately for each country, grade and Xset. The list of all different bandwidth values is available from the authors upon request. They were computed for the joint achievement variable French and Math first and then also used for each of the subjects separately. 15 This procedure seems also be justified by the finding that many data-driven bandwidth selectors converge only very slowly to the true optimal bandwidth. Hence, although being consistent, the bandwidth values chosen for a particular sample might be very variable and one would still like to examine sensitivity of the estimates to alternative bandwidth choices.

50
particularly for small bandwidth values and in regions of sparse data. When this happened, the
bandwidths are locally, proportionally increased, repeatedly until a valid estimate is obtained.
If the repeated local increases of the bandwidth values did not lead to convergence, the
regressors causing local near-colinearity were dropped locally.

51
Appendix C: Robustness analysis, additional estimation results
The following tables and graphs show the estimated distribution functions and quantile treatment effects for the
larger Xsets 2 and 3, respectively. For the 5th grade in Niger additional results are shown for an Xset 3a, in
which the five variables socioeconomic status, media, child labour, small village and active involvement of
parents have been dropped. These variables induce serious local multicolinearity problems which lead to a
conspicuous kink at the higher quantiles in the estimated distribution functions for Niger 5th grade with Xset 3.
To avoid this pattern of the estimates, which is more likely to be an artefact of high correlation of regressors
than a true feature of the potential outcomes, we dropped these variables to examine the robustness of the
estimates.
Table C.1: Quantile treatment effects (Xset 2)
Mali 2nd Mali 5th Niger 2nd Niger 5th Togo 2nd Togo 5th
French Math French Math French Math French Math French Math French Math
bandwidt 0.25
τ=0.1 -2.8 4.1 0.4 -0.1 -4.9 0.4 -0.2 -0.4 -6.5 -7.1 -5.4 -1.4
τ=0.2 1.4 3.5 2.8 0.7 -2.5 4.2 -3.2 -2.6 0.2 -6.1 3.2 -1.9
τ=0.3 3.5 3.3 -2.5 3.6 -0.1 0.4 -8.2 -7.6 5.1 2.1 0.5 -0.3
τ=0.4 2.2 5.1 -0.1 5.7 2.0 -7.2 -0.9 -6.5 7.7 5.5 -3.2 -2.3
τ=0.5 -14.0 6.1 -3.2 3.5 -5.1 -15.1 -3.0 -4.9 3.3 11.4 -11.0 -7.1
τ=0.6 -13.3 3.0 -3.0 7.8 -21.0 -25.6 -0.2 1.9 -1.3 5.1 -15.1 -13.6
τ=0.7 -11.6 4.9 -2.3 4.3 -26.2 -21.8 3.2 1.8 -1.5 10.0 -16.6 -15.4
τ=0.8 -13.1 -0.3 2.2 4.6 -11.1 -17.1 5.6 4.8 -1.8 8.4 -9.5 -13.1
τ=0.9 -8.3 -18.2 2.1 5.1 -4.9 -9.4 13.7 -5.3 -2.5 9.5 -8.3 -10.3
bandwidth 0.5
τ=0.1 -2.4 4.5 0.7 3.0 -2.3 2.8 -2.6 -1.7 -0.1 -4.6 2.3 0.1
τ=0.2 1.6 3.5 2.9 2.1 -4.1 1.7 -5.5 -6.2 7.4 -2.2 3.3 2.4
τ=0.3 3.7 3.1 -2.3 4.9 0.3 -2.6 -0.9 -8.2 8.4 5.5 -2.4 -0.2
τ=0.4 2.2 5.2 -0.1 5.9 0.3 -8.6 -1.6 -4.6 13.5 7.7 -0.5 -0.1
τ=0.5 -16.2 5.9 -3.2 3.6 -5.5 -17.4 -0.2 0.2 5.3 11.6 -7.7 -5.2
τ=0.6 -13.5 2.7 -2.9 7.8 -24.0 -17.9 0.4 2.0 -1.2 13.4 -8.6 -6.3
τ=0.7 -13.1 2.1 -2.4 4.2 -27.1 -26.5 3.1 0.5 -3.7 12.9 -10.5 -13.3
τ=0.8 -13.8 -1.8 -0.1 1.9 -22.0 -20.1 -0.3 0.6 -4.4 7.9 -10.7 -14.9
τ=0.9 -11.0 -20.0 1.8 1.9 -7.8 -15.1 16.6 -2.1 -2.9 6.8 -6.7 -10.6
bandwidth cv
τ=0.1 -2.4 5.1 3.1 4.5 -5.7 -0.1 0.0 -0.3 2.3 3.0 0.3 -1.4
τ=0.2 1.5 5.0 3.2 2.2 -3.1 -1.7 -0.5 -6.3 11.0 2.0 -5.2 -2.9
τ=0.3 3.4 4.5 -2.3 4.8 -3.0 -8.1 -2.3 -5.0 10.8 9.7 -2.6 -4.4
τ=0.4 2.0 5.1 -0.2 5.8 0.1 -9.9 0.0 -0.4 11.0 9.9 -3.9 -2.8
τ=0.5 -16.7 5.8 -3.5 3.3 -4.4 -8.0 2.9 2.9 3.0 7.7 -7.5 -6.8
τ=0.6 -13.3 2.6 -3.1 7.6 -19.0 -10.4 5.6 1.6 -0.9 9.7 -8.5 -6.8
τ=0.7 -11.5 1.7 -2.4 3.8 -19.6 -16.2 3.4 0.1 -3.6 10.1 -8.9 -7.2
τ=0.8 -13.1 -2.0 -0.3 1.8 -19.1 -15.8 1.6 0.1 -4.8 3.3 -7.2 -9.2
τ=0.9 -10.7 -19.6 1.7 0.2 -9.6 -12.6 -3.5 -4.8 -0.6 2.4 -6.3 -13.1
Note: Percentage points treatment effects, significant at 10% are marked in italics, significant at 5% are marked in bold, significant at 1% are marked in bold underlined.

52
Table C.2: Quantile treatment effects (Xset 3)
Mali 2nd Mali 5th Niger 2nd Niger 5th Niger 5th Xset 3a
Togo 2nd Togo 5th
French Math French Math French Math French Math French Math French Math French Math
bandwidt 0.25
τ=0.1 -3.6 4.8 -6.0 -8.1 -3.7 0.3 -0.6 -0.6 -0.3 -6.1 -5.1 -7.3 -6.3 -1.9
τ=0.2 -1.8 9.9 -5.6 -1.7 -3.0 2.9 -5.7 -6.6 -2.9 -9.7 -2.3 -3.0 -0.1 -3.6
τ=0.3 0.1 8.4 -8.5 -4.9 -0.3 4.8 -6.0 -12.2 -6.0 -11.3 -3.3 3.0 -5.5 -3.0
τ=0.4 -2.5 8.2 -8.7 -2.4 -0.3 -4.1 -0.2 -11.1 -4.5 -9.0 -0.1 4.6 -6.2 -6.2
τ=0.5 -0.3 8.1 -6.1 -6.7 -5.1 -12.0 0.4 -1.7 -2.9 -4.5 8.2 2.0 -8.2 -9.6
τ=0.6 1.7 5.6 -3.0 -3.7 -24.2 -26.2 5.6 2.0 2.3 1.1 8.0 1.9 -14.4 -8.7
τ=0.7 4.8 11.4 0.1 -0.4 -27.0 -22.6 19.4 7.9 0.6 1.7 6.6 7.7 -11.2 -14.6
τ=0.8 8.1 14.8 8.6 2.1 -17.3 -16.4 25.9 1.7 0.1 -2.7 2.9 13.0 -14.5 -12.1
τ=0.9 6.3 7.5 12.5 7.4 -5.8 -9.5 13.6 -11.4 5.7 -7.3 -0.5 10.0 -5.2 -9.9
bandwidth 0.5
τ=0.1 -3.3 7.3 -5.6 -4.7 -2.0 0.6 -1.3 -2.0 -0.4 -6.8 -0.1 -5.2 0.0 -0.3
τ=0.2 -1.8 10.1 -5.3 -0.3 -4.1 1.7 -3.7 -9.7 -3.3 -10.4 0.5 1.6 0.0 -0.3
τ=0.3 0.1 8.4 -8.3 -3.4 -3.2 0.5 -3.0 -10.4 -3.5 -9.1 -0.7 4.5 -0.7 -0.3
τ=0.4 -2.6 8.2 -8.6 -2.2 -3.4 -7.9 0.4 -2.3 -4.2 -9.1 2.7 6.3 -0.7 -3.0
τ=0.5 -0.5 8.2 -6.1 -6.6 -5.5 -17.4 0.9 0.7 -2.7 -6.9 9.4 2.1 -6.0 -8.1
τ=0.6 1.4 5.5 -3.0 -3.9 -26.6 -28.6 9.2 5.7 -2.2 1.5 6.5 2.0 -11.2 -9.9
τ=0.7 3.1 10.2 0.1 -0.6 -27.3 -26.2 28.0 10.3 0.3 2.4 3.3 9.7 -8.1 -12.4
τ=0.8 7.5 14.4 8.7 1.6 -21.7 -22.6 28.6 6.6 0.0 -1.3 0.3 12.7 -9.0 -15.1
τ=0.9 6.0 5.8 14.3 5.1 -8.1 -12.8 14.4 -3.8 7.8 -4.2 -2.9 7.1 -5.7 -13.1
bandwidth cv
τ=0.1 -3.2 7.4 -3.2 -3.6 -5.5 -0.1 -3.3 0.1 -0.1 -5.0 0.6 0.4 -1.6 -0.3
τ=0.2 -0.4 11.2 -5.0 -0.3 -3.0 -0.1 -6.4 -11.3 -2.9 -7.5 0.6 -0.7 -5.7 -4.5
τ=0.3 0.2 9.7 -6.0 -3.7 -5.1 -0.3 -8.7 -4.4 -2.6 -9.6 -5.7 2.3 -3.0 -5.0
τ=0.4 -2.5 8.0 -6.4 -2.0 0.5 4.4 -1.5 -2.2 0.2 -7.8 -2.4 -0.2 -6.1 -4.3
τ=0.5 -0.6 7.9 -6.0 -6.6 2.8 1.8 6.0 0.6 0.2 0.5 7.8 -3.4 -5.0 -2.2
τ=0.6 1.9 4.9 -0.8 -3.8 -5.1 -3.1 6.1 5.3 2.4 1.2 6.1 -10.3 -11.3 -6.8
τ=0.7 4.7 6.8 0.4 -0.8 -15.4 -8.7 7.7 2.2 -2.4 0.0 0.9 2.7 -10.8 -12.1
τ=0.8 8.1 12.8 6.5 1.9 -11.2 -11.7 5.3 2.0 -2.4 -0.4 0.0 5.2 -11.0 -12.5
τ=0.9 6.3 5.4 14.1 1.8 -3.8 -10.0 23.3 0.0 -3.8 -9.5 -0.7 6.4 -11.5 -17.5
Note: Percentage points treatment effects, significant at 10% are marked in italics, significant at 5% are marked in bold, significant at 1% are marked in bold underlined.

53
Figure C1: Potential outcomes for Mali 2nd grade (Xset 2)
1 2( , , ) (0.5,0.5,0.25)Bandwidths h h λ =
1 2( , , ) (1,1,0.5)Bandwidths h h λ =
Bandwidths chosen by cross validation
Note: Distribution functions of potential outcomes, solid line 1ˆY
F , dashed line 0ˆY
F . (Horizontal distance is quantile treatment effect.)

54
Figure C2: Potential outcomes for Mali 5th grade (Xset 2)
1 2( , , ) (0.5,0.5,0.25)Bandwidths h h λ =
1 2( , , ) (1,1,0.5)Bandwidths h h λ =
Bandwidths chosen by cross validation
Note: Distribution functions of potential outcomes, solid line 1ˆY
F , dashed line 0ˆY
F . (Horizontal distance is quantile treatment effect.)

55
Figure C3: Potential outcomes for Niger 2nd grade (Xset 2)
1 2( , , ) (0.5,0.5,0.25)Bandwidths h h λ =
1 2( , , ) (1,1,0.5)Bandwidths h h λ =
Bandwidths chosen by cross validation
Note: Distribution functions of potential outcomes, solid line 1ˆY
F , dashed line 0ˆY
F . (Horizontal distance is quantile treatment effect.)

56
Figure C4: Potential outcomes for Niger 5th grade (Xset 2)
1 2( , , ) (0.5,0.5,0.25)Bandwidths h h λ =
1 2( , , ) (1,1,0.5)Bandwidths h h λ =
Bandwidths chosen by cross validation
Note: Distribution functions of potential outcomes, solid line 1ˆY
F , dashed line 0ˆY
F . (Horizontal distance is quantile treatment effect.)

57
Figure C5: Potential outcomes for Togo 2nd grade (Xset 2)
1 2( , , ) (0.5,0.5,0.25)Bandwidths h h λ =
1 2( , , ) (1,1,0.5)Bandwidths h h λ =
Bandwidths chosen by cross validation
Note: Distribution functions of potential outcomes, solid line 1ˆY
F , dashed line 0ˆY
F . (Horizontal distance is quantile treatment effect.)

58
Figure C6: Potential outcomes for Togo 5th grade (Xset 2)
1 2( , , ) (0.5,0.5,0.25)Bandwidths h h λ =
1 2( , , ) (1,1,0.5)Bandwidths h h λ =
Bandwidths chosen by cross validation
Note: Distribution functions of potential outcomes, solid line 1ˆY
F , dashed line 0ˆY
F . (Horizontal distance is quantile treatment effect.)

59
Figure C7: Potential outcomes for Mali 2nd grade (Xset 3)
1 2( , , ) (0.5,0.5,0.25)Bandwidths h h λ =
1 2( , , ) (1,1,0.5)Bandwidths h h λ =
Bandwidths chosen by cross validation
Note: Distribution functions of potential outcomes, solid line 1ˆY
F , dashed line 0ˆY
F . (Horizontal distance is quantile treatment effect.)

60
Figure C8: Potential outcomes for Mali 5th grade (Xset 3)
1 2( , , ) (0.5,0.5,0.25)Bandwidths h h λ =
1 2( , , ) (1,1,0.5)Bandwidths h h λ =
Bandwidths chosen by cross validation
.
Note: Distribution functions of potential outcomes, solid line 1ˆY
F , dashed line 0ˆY
F . (Horizontal distance is quantile treatment effect.)

61
Figure C9: Potential outcomes for Niger 2nd grade (Xset 3)
1 2( , , ) (0.5,0.5,0.25)Bandwidths h h λ =
1 2( , , ) (1,1,0.5)Bandwidths h h λ =
Bandwidths chosen by cross validation
Note: Distribution functions of potential outcomes, solid line 1ˆY
F , dashed line 0ˆY
F . (Horizontal distance is quantile treatment effect.)

62
Figure C10: Potential outcomes for Niger 5th grade (Xset 3)
1 2( , , ) (0.5,0.5,0.25)Bandwidths h h λ =
1 2( , , ) (1,1,0.5)Bandwidths h h λ =
Bandwidths chosen by cross validation
Note: Distribution functions of potential outcomes, solid line 1ˆY
F , dashed line 0ˆY
F . (Horizontal distance is quantile treatment effect.)

63
Figure C11: Potential outcomes for Niger 5th grade (Xset 3a)
1 2( , , ) (0.5,0.5,0.25)Bandwidths h h λ =
1 2( , , ) (1,1,0.5)Bandwidths h h λ =
Bandwidths chosen by cross validation
Note: Distribution functions of potential outcomes, solid line 1ˆY
F , dashed line 0ˆY
F . (Horizontal distance is quantile treatment effect.)

64
Figure C12: Potential outcomes for Togo 2nd grade (Xset 3)
1 2( , , ) (0.5,0.5,0.25)Bandwidths h h λ =
1 2( , , ) (1,1,0.5)Bandwidths h h λ =
Bandwidths chosen by cross validation
Note: Distribution functions of potential outcomes, solid line 1ˆY
F , dashed line 0ˆY
F . (Horizontal distance is quantile treatment effect.)

65
Figure C13: Potential outcomes for Togo 5th grade (Xset 3)
1 2( , , ) (0.5,0.5,0.25)Bandwidths h h λ =
1 2( , , ) (1,1,0.5)Bandwidths h h λ =
Bandwidths chosen by cross validation
Note: Distribution functions of potential outcomes, solid line 1ˆY
F , dashed line 0ˆY
F . (Horizontal distance is quantile treatment effect.)

66
Appendix D: Robustness to the sample definition based on job experience
The following graphs show the estimated potential distribution functions for Niger when the sample is
restricted to include only teacher with at most 4 years of job experience. The results are very similar to those of
the earlier analysis.
Figure D1: Potential outcomes for Niger 2nd grade (Xset 1)
1 2( , , ) (0.5,0.5,0.25)Bandwidths h h λ =
1 2( , , ) (1,1,0.5)Bandwidths h h λ =
Bandwidths chosen by cross validation
Note: Distribution functions of potential outcomes, solid line 1ˆY
F , dashed line 0ˆY
F . (Horizontal distance is quantile treatment effect.)

67
Figure D2: Potential outcomes for Niger 5th grade (Xset 1)
1 2( , , ) (0.5,0.5,0.25)Bandwidths h h λ =
1 2( , , ) (1,1,0.5)Bandwidths h h λ =
Bandwidths chosen by cross validation
Note: Distribution functions of potential outcomes, solid line 1ˆY
F , dashed line 0ˆY
F . (Horizontal distance is quantile treatment effect.)