teacher quality: report on the preparation and ...nces.ed.gov/pubs99/1999080.pdf · national center...
TRANSCRIPT

NATIONAL CENTER FOR EDUCATION STATISTICS
Statistical Analysis Report January 1999
Teacher Quality:A Report on the Preparationand Qualifications ofPublic School Teachers
U.S. Department of EducationOffice of Educational Research and Improvement NCES 1999-080

NATIONAL CENTER FOR EDUCATION STATISTICS
Statistical Analysis Report January 1999
Teacher Quality:A Report on the Preparationand Qualifications ofPublic School Teachers
Laurie LewisBasmat ParsadNancy CareyNicole BartfaiElizabeth FarrisWestat
Becky SmerdonPelavin Research CenterAmerican Institutes for Research
Bernie GreeneProject OfficerNational Center for Education Statistics
U.S. Department of EducationOffice of Educational Research and Improvement NCES 1999-080

U.S. Department of EducationRichard W. RileySecretaryOffice of Educational Research and ImprovementC. Kent McGuireAssistant SecretaryNational Center for Education StatisticsPascal D. Forgione, Jr.Commissioner
The National Center for Education Statistics (NCES) is the primary federal entity for collecting, analyzing,and reporting data related to education in the United States and other nations. It fulfills a congressionalmandate to collect, collate, analyze, and report full and complete statistics on the condition of education inthe United States; conduct and publish reports and specialized analyses of the meaning and significanceof such statistics; assist state and local education agencies in improving their statistical systems; andreview and report on education activities in foreign countries.
NCES activities are designed to address high priority education data needs; provide consistent, reliable,complete, and accurate indicators of education status and trends; and report timely, useful, and highquality data to the U.S. Department of Education, the Congress, the states, other education policymakers,practitioners, data users, and the general public.
We strive to make our products available in a variety of formats and in language that is appropriate to avariety of audiences. You, as our customer, are the best judge of our success in communicatinginformation effectively. If you have any comments or suggestions about this or any other NCES productor report, we would like to hear from you. Please direct your comments to:
National Center for Education StatisticsOffice of Educational Research and ImprovementU.S. Department of Education555 New Jersey Avenue NWWashington, DC 20208-5574
January 1999
The NCES World Wide Web Home Page is:http://nces.ed.gov
Suggested CitationU.S. Department of Education, National Center for Education Statistics. Teacher Quality: A Report onthe Preparation and Qualifications of Public School Teachers, NCES 1999-080, by Laurie Lewis, BasmatParsad, Nancy Carey, Nicole Bartfai, Elizabeth Farris, and Becky Smerdon. Bernie Greene, projectofficer. Washington, DC: 1999.
Contact:Edith McArthur(202) 219-1442
Bernie Greene(202) 219-1366
For sale by the U.S. Government Printing Office
Superintendent of Documents, Mail Stop: SSOP, Washington, DC 20402-9328

iii
Executive Summary
Background
In his 1997 State of the Union Address, PresidentClinton issued a “Call to Action” that included asa priority improving the quality of teachers inevery American classroom. President Clinton’sspeech reflects growing concern over thecondition of education and the nation’s need forexcellent teachers. The nation’s educationalsystem must provide our children with theknowledge, information, and skills needed tocompete in a complex international marketplace.Good teachers are the hallmark of such aneducational system; they are integral to children’sintellectual and social development.
In response to these concerns and expectations,this study, undertaken by the National Center forEducation Statistics (NCES), using its FastResponse Survey System (FRSS), provides aprofile of the quality of the nation’s teachers.Providing such a profile is not an easy task.Teacher quality is a complex phenomenon, andthere is little consensus on what it is or how tomeasure it. For example, definitions range fromthose that focus on what should be taught andhow knowledge should be imparted to the kindsof knowledge and training teachers shouldpossess. There are, however, two broad elementsthat most observers agree characterize teacherquality: (1) teacher preparation and qualifica-tions, and (2) teaching practices. The first refersto preservice learning (e.g., postsecondaryeducation, certification) and continued learning(e.g., professional development, mentoring). Thesecond refers to the actual behaviors and practicesthat teachers exhibit in their classrooms (U.S.Department of Education, 1996a). Of course,these elements of teacher quality are notindependent; excellent teacher preparation andqualifications should lead to exemplary teachingbehaviors and practices.
This FRSS report is based on current NCESefforts to collect data on the first of theseelements (i.e., teacher preparation andqualifications), using a nationally representative
survey of full-time public school teachers whosemain teaching assignment is in English/languagearts, social studies/social sciences, foreignlanguage, mathematics, or science, or who teach aself-contained classroom. Specifically, it includesindicators of preservice and continued learning(e.g., degrees held, certification, teaching assign-ment, professional development opportunities,and collaboration with other teachers). Inaddition, because schools and communities playan important role in shaping and maintaininghigh-quality teachers, this study examines thework environments in which educators teach(e.g., formal induction procedures for newteachers, parental support).
This report is timely in light of recent concernsover the quality of our educational system and ourteachers. Teachers’ professional preparation (aswell as their working conditions) has beenidentified as fundamental to improving elemen-tary and secondary education (NationalCommission on Teaching and America’s Future,1996). At the core of educational reforms to raisestandards, reshape curricula, and restructure theway schools operate is the call to reconceptualizethe practice of teaching. Teachers are beingasked to learn new methods of teaching, while atthe same time they are facing the greaterchallenges of rapidly increasing technologicalchanges and greater diversity in the classroom.
The FRSS survey indicates that currently lessthan half of American teachers report feeling“very well prepared” to meet many of thesechallenges:
n Although many educators and policy analystsconsider educational technology a vehicle fortransforming education, relatively fewteachers reported feeling very well preparedto integrate educational technology intoclassroom instruction (20 percent).
n While 54 percent of the teachers taughtlimited English proficient or culturallydiverse students, and 71 percent taughtstudents with disabilities, relatively few

iv
teachers who taught these students (about 20percent) felt very well prepared to meet theneeds of these students. Their feelings ofpreparedness did not differ by teachingexperience.
n Only 28 percent of teachers felt very wellprepared to use student performanceassessment techniques; 41 percent reportedfeeling very well prepared to implement newteaching methods, and 36 percent reportedfeeling very well prepared to implement stateor district curriculum and performancestandards.
This national profile of teacher preparation,qualifications, and work environments provides acontext for understanding why many teachers donot report feeling very well prepared to meetmany of the challenges they currently face in theirclassrooms. Key findings are provided in threemajor areas: (1) preservice learning and teachingassignment; (2) continued learning; and (3)supportive work environment.
Key Findings
Preservice Learning andTeaching Assignment
Growing concern that a number of the nation’steachers are underqualified to teach our childrenhas focused attention on their preservice learning.For example, concern regarding preservicelearning has been directed toward teachers’postsecondary degrees—that is, the idea thatteachers, particularly secondary teachers, shouldhave an academic major rather than a generaleducation degree (Ravitch, 1998). In addition,certification policies have drawn criticism—specifically, that a growing number of thenation’s teachers are entering classrooms withemergency or temporary certification (Riley,1998). Finally, attention is increasingly directedtoward teaching assignments—that is, teachersbeing assigned to teach subjects that do not matchtheir training or education (U.S. Department ofEducation, 1996b). Results of the 1998 FRSSsurvey indicate that:
n Virtually all teachers had a bachelor’s degree,and nearly half (45 percent) had a master’sdegree. More high school teachers had anundergraduate or graduate major in anacademic field (66 percent), compared withelementary school teachers (22 percent) andmiddle school teachers (44 percent).
n Most of the teachers (92 percent and 93percent, for departmentalized and generalelementary, respectively) were fully certifiedin the field of their main teaching assignment.However, emergency and temporarycertification was higher among teachers with3 or fewer years of experience compared toteachers with more teaching experience. Forexample, 12 percent of general elementaryclassroom teachers with 3 or fewer years ofexperience had emergency or temporarycertification, whereas less than 1 percent ofgeneral elementary classroom teachers with10 or more years of experience hademergency or temporary certification. Theresults are similar for departmentalizedteachers.
n Despite the fact that the measure of out-of-field teaching used in this report isconservative—it only includes teachers’ mainteaching assignments in core fields—theresults indicate that a number of educatorswere teaching out of field. For example, thepercent of teachers in grades 9 through 12who reported having an undergraduate orgraduate major or minor in their mainteaching assignment field was 90 percent formathematics teachers, 94 percent for scienceteachers, and 96 percent for teachers inEnglish/language arts, social studies/socialscience, and foreign language. This meansthat 10 percent of mathematics teachers, 6percent of science teachers, and 4 percent ofEnglish/language arts, foreign language, andsocial studies/social science teachers ingrades 9 through 12 were teaching out offield. The percent of teachers who reportedhaving an undergraduate or graduate major orminor in their main teaching assignment fieldwas significantly lower for teachers of grades7 through 12 than for teachers of grades 9through 12 for mathematics (82 percent),science (88 percent), English/language arts(86 percent), and social studies/socialsciences (89 percent), indicating that teachers

v
in grades 7 and 8 are less likely to be teachingin field than are teachers in grades 9 through12.
Continued Learning:Professional Developmentand Teacher Collaboration
In order to meet the changing demands of theirjobs, high-quality teachers must be capable andwilling to continuously learn and relearn theirtrade. Professional development and collabora-tion with other teachers are strategies for buildingeducators’ capacity for effective teaching,particularly in a profession where demands arechanging and expanding. However, traditionalapproaches to professional development (e.g.,workshops, conferences) have been criticized forbeing relatively ineffective because they typicallylack connection to the challenges teachers face intheir classrooms, and they are usually short term.Research suggests that unless professionaldevelopment programs are carefully designed andimplemented to provide continuity between whatteachers learn and what goes on in theirclassrooms and schools, these activities are notlikely to produce any long-lasting effects oneither teacher competence or student outcomes(Fullan with Stiegelbauer, 1991). In addition toquality professional development, peercollaboration has also been recognized asimportant for teachers’ continuous learning. The1998 survey indicates that:
n Virtually all teachers participated inprofessional development activities (99percent) and at least one collaborative activity(95 percent) in the last 12 months.Participation in professional developmentactivities typically lasted from 1 to 8 hours, orthe equivalent of 1 day or less of training.Teachers were most likely to participate inprofessional development activities focusedtoward areas that reformers emphasize (e.g.,implementing state or district curriculum andperformance standards, integrating tech-nology into the grade or subject taught, usingstudent performance assessment techniques).
n Nineteen percent of teachers had beenmentored by another teacher in a formal
relationship; 70 percent of teachers who werementored at least once a week reported that itimproved their teaching “a lot.”
n Increased time spent in professionaldevelopment and collaborative activities wasassociated with the perception of significantimprovements in teaching. For every contentarea of professional development, a largerproportion of teachers who participated formore than 8 hours believed it improved theirteaching “a lot” compared with teachers whoparticipated for 8 hours or less (figure E).For example, teachers who spent more than 8hours in professional development on in-depth study in the subject area of their mainteaching assignment were more likely thanthose who spent 1 to 8 hours to report thatparticipation in the program improved theirteaching a lot (41 percent versus 12 percent).Moreover, teachers who participated incommon planning periods for team teachersat least once a week were more likely thanthose who participated a few times a year toreport that participation improved theirteaching a lot (52 percent versus 13 percent).
Supportive Work Environment
Teachers’ work environment is the final aspect ofteacher quality addressed in this report. Inaddition to teacher learning, one key factor tounderstanding teacher quality is to focus on whathappens to teachers once they enter the workforce, including if they receive support from theschools and communities in which they work andfrom the parents of the children they teach. The1998 FRSS survey indicates that:
n One-third of teachers had participated in aninduction program when they first beganteaching. However, newer teachers weremore likely to have participated in some kindof induction program at the beginning of theirteaching careers than were more experiencedteachers (65 percent of teachers with 3 orfewer years of experience versus 14 percentof teachers with 20 or more years ofexperience). This FRSS survey did not elicitinformation regarding the intensity orusefulness of the induction programs.

vi
Figure E.—Percent of full-time public school teachers who participated in professionaldevelopment activities in the last 12 months indicating the extent to which they believethe activity improved their teaching a lot: 1998
712 12 12 10
138 9
20
38 39 41
3540 42
38
0
20
40
60
80
100
State or district
curriculum and
performancestandards
Integration ofeducational
technology inthe grade orsubject you
teach
New methods
of teaching(e.g.,
cooperativelearning)
In-depth studyin the subjectarea of your
main teachingassignment
Studentperformanceassessment
Classroommanagement,
includingstudent
discipline
Addressing the needs ofstudents withdisabilities
Addressingthe needs of
students withlimitedEnglish
proficiency orfrom diverse
culturalbackgrounds
Percent1 to 8 hours
More than 8 hours
SOURCE: U.S. Department of Education, National Center for Education Statistics, Fast Response Survey System, Teacher Survey onProfessional Development and Training, 1998.
n Teachers perceived relatively strong collegialsupport for their work; 63 percent stronglyagreed that other teachers shared ideas withthem that were helpful in their teaching. Inaddition, many teachers also felt supported bythe school administration, with 55 percentagreeing strongly that the school admini-stration supported them in their work and 47percent agreeing strongly that goals andpriorities for the school were clear.
n Teachers perceived somewhat less supportfrom parents than from other teachers and theschool administration. Only one-third ofteachers agreed strongly that parentssupported them in their efforts to educatetheir children.
n Collegial, school, and parental support variedby the instructional level of the school, withelementary school teachers perceivingstronger support than high school teachers.
The results of this survey provide a nationalprofile of teacher quality, specifically focused onteachers’ learning (both preservice and continued)and the environments in which they work.Included is important information regardingteachers’ education, certification, teaching assign-ments, professional development, collaboration,and supportive work environment. In addition,comparisons by instructional level and povertylevel of the school provide information about thedistribution of teacher quality. This informationprovides a context for understanding why fewteachers report feeling very well prepared to meetthe challenges they face in their classrooms. Thisreport is the first in a series of biennial reportsthat will be undertaken by NCES. Thus, theinformation provided here should provide abenchmark for these important dimensions ofteacher quality and preparation.
vii
Table of Contents
Section Page
Executive Summary............................................................................................................... iii
1 Introduction ................................................................................................................ 1
Teacher Quality: How Has It Been Defined?.............................................................. 2
Teaching Practices .............................................................................................. 2Teacher Preparation and Qualifications ............................................................... 3Supportive Working Conditions .......................................................................... 4The Definition of Teacher Quality Used in This Report....................................... 5
Teacher Quality: How Has It Been Studied?............................................................... 5
Classroom Observation ....................................................................................... 5Teacher Testing .................................................................................................. 6Student Achievement Tests ................................................................................. 6Large-Scale Surveys ........................................................................................... 7The Measurement Approach Used in This Report................................................ 7
Organization of This Report........................................................................................ 8
2 Preservice Learning and Teaching Assignment ........................................................... 9
Teacher Education ...................................................................................................... 10Teacher Certification .................................................................................................. 13Teaching Assignment: In-Field Teaching ................................................................... 16
In-Field Teaching Among Teachers in Grades 7 through 12 ................................ 17In-Field Teaching Among Teachers in Grades 9 through 12 ................................ 19
Summary .................................................................................................................... 20
3 Continued Learning .................................................................................................... 21
Formal Professional Development............................................................................... 21
Content of Professional Development.................................................................. 22Professional Development and Teaching Experience ........................................... 24Intensity of Professional Development Activities ................................................ 26Perceived Impact of Professional Development ................................................... 27
Collaboration with Other Teachers.............................................................................. 28
Participation in Collaborative Activities .............................................................. 30Frequency of Participation .................................................................................. 31Perceived Effect of Participation ......................................................................... 31
Summary .................................................................................................................... 33

viii
Table of Contents (continued)
Section Page
4 Supportive Work Environment.................................................................................... 35
Induction Programs..................................................................................................... 35Class Size ................................................................................................................... 37Parent and School Support .......................................................................................... 40Summary .................................................................................................................... 44
5 Teachers’ Feelings of Preparedness............................................................................. 47
Teachers’ Preparedness for Classroom Requirements .................................................. 47Teacher Preparedness and Teaching Experience.......................................................... 49Teacher Preparedness and Participation in Professional Development ......................... 50Teacher Preparedness and Intensity of Professional Development ............................... 51Teacher Preparedness and Collaborative Activities...................................................... 52Summary .................................................................................................................... 55
6 Conclusions ................................................................................................................ 57
References .................................................................................................................. 59Suggested Readings .................................................................................................... 63
List of Appendices
A: Survey Methodology and Data Reliability................................................................... A-1
B: Detailed Tables of Estimates and Tables of Standard Errors for the 1998 FRSS Survey B-1
C: Detailed Tables of Estimates and Tables of Standard Errors for the1993-94 SASS Study.................................................................................................. C-1
D: Standard Error Tables for Text Tables and Figures...................................................... D-1
E: 1998 Teacher Survey on Professional Development and Training Fast ResponseSurvey System Questionnaire ..................................................................................... E-1
F: Selected Questionnaire Items from the 1993-94 Schools and Staffing Survey TeacherQuestionnaire ............................................................................................................. F-1

ix
Table of Contents (continued)
List of Text Tables
Text Table Page
1 Percent of full-time public school teachers who majored in various fields of study fora bachelor’s or graduate degree, by selected school and teacher characteristics: 1998... 12
2 Percent of full-time public school teachers who majored in various fields of study fora bachelor’s or graduate degree, by selected school and teacher characteristics:1993-94......................................................................................................................... 13
3 Percent of full-time public school teachers in general elementary classrooms anddepartmentalized settings with various types of teaching certificates in their state:1998.............................................................................................................................. 14
4 Percent of full-time public school teachers in general elementary classrooms anddepartmentalized settings with various types of teaching certificates in their state:1993-94......................................................................................................................... 14
5 Percent of full-time public school teachers in grades 7 through 12 who reportedhaving an undergraduate or graduate major or minor in their main teachingassignment field, by selected school characteristics: 1998............................................. 17
6 Percent of full-time public school teachers in grades 7 through 12 who reportedhaving an undergraduate or graduate major or minor in their main teachingassignment field, by selected school characteristics: 1993-94....................................... 18
7 Percent of full-time public school teachers in grades 9 through 12 who reportedhaving an undergraduate or graduate major or minor in their main teachingassignment field, by selected school characteristics: 1998............................................. 19
8 Percent of full-time public school teachers in grades 9 through 12 who reportedhaving an undergraduate or graduate major or minor in their main teachingassignment field, by selected school characteristics: 1993-94....................................... 20
9 Percent of full-time public school teachers who participated in professionaldevelopment activities in the last 12 months in various content areas, by teachingexperience: 1998 .......................................................................................................... 25
10 Percent of full-time public school teachers who participated in professionaldevelopment activities since the end of the school year in various content areas, byteaching experience: 1993-94 ...................................................................................... 26
11 Percent of full-time public school teachers indicating the number of hours spent inprofessional development activities in the last 12 months in various content areas:1998.............................................................................................................................. 26
12 Percent of full-time public school teachers indicating the number of hours spent inprofessional development activities since the end of the last school year in variouscontent areas: 1993-94................................................................................................. 27
13 Percent of full-time public school teachers who participated in professionaldevelopment activities in the last 12 months indicating the extent to which theybelieve the activity improved their teaching: 1998 ........................................................ 27
14 Percent of full-time public school teachers who participated in professionaldevelopment activities in the last 12 months indicating that the activity improvedtheir teaching a lot, by teaching experience: 1998 ......................................................... 28

x
Table of Contents (continued)
List of Text Tables (continued)
Text Table Page
15 Percent of full-time public school teachers indicating the extent to whichparticipation in professional development activities in various content areas improvedtheir classroom teaching, by the number of hours spent in professional developmentin that content area in the last 12 months: 1998............................................................. 29
16 Percent of full-time public school teachers who participated in activities related toteaching in the last 12 months, by frequency of participation: 1998............................... 32
17 Percent of full-time public school teachers who participated in various activitiesrelated to teaching in the last 12 months indicating the extent to which they believethe activity improved their teaching: 1998 .................................................................... 32
18 Percent of full-time public school teachers indicating the extent to whichparticipation in activities related to teaching improved their classroom teaching, bythe frequency with which they participated in that activity in the last 12 months:1998.............................................................................................................................. 34
19 Average class size for full-time public school teachers in general elementaryclassrooms and departmentalized settings, by selected school characteristics: 1998....... 38
20 Average class size for full-time public school teachers in general elementaryclassrooms and departmentalized settings, by selected school characteristics:1993-94......................................................................................................................... 39
21 Percent of full-time public school teachers indicating how well prepared they feel todo various activities in the classroom: 1998.................................................................. 48
22 Percent of full-time public school teachers indicating they feel very well prepared todo various activities in the classroom, by teaching experience: 1998............................. 50
23 Comparison of recent teacher participation in professional development in variouscontent areas and perceived teacher preparedness for classroom requirements in thosecontent areas: 1998....................................................................................................... 51
24 Percent of full-time public school teachers indicating how well prepared they feel todo various activities in the classroom, by the number of hours spent in professionaldevelopment in the content area of the activity in the last 12 months: 1998................... 53
25 Percent of full-time public school teachers indicating they feel very well prepared todo various classroom activities, by whether they participated in various teaching-related activities in the last 12 months: 1998................................................................. 54

xi
Table of Contents (continued)
List of Figures
Figure Page
E Percent of full-time public school teachers who participated in professionaldevelopment activities in the last 12 months indicating the extent to which theybelieve the activity improved their teaching a lot: 1998................................................. vi
1 Percent of full-time public school teachers who hold a master’s degree, by selectedschool and teacher characteristics: 1998 ....................................................................... 11
2 Percent of full-time public school teachers who hold a master’s degree, by selectedschool and teacher characteristics: 1993-94 ................................................................. 12
3 Percent of full-time public school teachers in general elementary classrooms anddepartmentalized settings with a regular or standard state certificate or advancedprofessional certificate, by teaching experience: 1998................................................... 15
4 Percent of full-time public school teachers in general elementary classrooms anddepartmentalized settings with a regular or standard state certificate or advancedprofessional certificate, by teaching experience: 1993-94............................................. 15
5 Percent of full-time public school teachers who participated in professionaldevelopment activities in the last 12 months that focused on various topics: 1998......... 23
6 Percent of full-time public school teachers who participated in professionaldevelopment activities since the end of the last school year that focused on varioustopics: 1993-94 ........................................................................................................... 23
7 Percent of full-time public school teachers who participated in professionaldevelopment activities in the last 12 months that addressed the needs of students withlimited English proficiency or from diverse cultural backgrounds, by percentminority enrollment in the school: 1998........................................................................ 24
8 Percent of full-time public school teachers who participated in professionaldevelopment activities in the last 12 months that addressed the needs of students withlimited English proficiency or from diverse cultural backgrounds, by region: 1998....... 25
9 Percent of full-time public school teachers who participated in various activitiesrelated to teaching in the last 12 months: 1998.............................................................. 30
10 Percent of full-time public school teachers who participated in mentoring activities inthe last 12 months, by teaching experience: 1998.......................................................... 31
11 Percent of full-time public school teachers indicating the extent to which beingmentored improved their classroom teaching, by teaching experience: 1998 ................. 33
12 Percent of full-time public school teachers who participated in a formal inductionprogram when they first began teaching, by teaching experience: 1998......................... 36
13 Percent of full-time public school teachers who participated in a formal inductionprogram during their first year of teaching, by teaching experience: 1993-94............... 36
14 Percent of full-time public school teachers indicating the length of the formalinduction program in which they participated when they first began teaching: 1998..... 37
15 Percent of full-time public school teachers agreeing or disagreeing with selectedstatements about parent and school support for teachers: 1998...................................... 40

xii
Table of Contents (continued)
List of Figures (continued)
Figure Page
16 Percent of full-time public school teachers agreeing or disagreeing with selectedstatements about parent and school support for teachers: 1993-94................................ 41
17 Percent of full-time public school teachers who strongly agreed with selectedstatements about parent and school support for teachers, by school instructional level:1998.............................................................................................................................. 42
18 Percent of full-time public school teachers who strongly agreed with selectedstatements about parent and school support for teachers, by school instructional level:1993-94......................................................................................................................... 43
19 Percent of full-time public school teachers who strongly agreed with selectedstatements about parent and school support for teachers, by teaching experience:1998.............................................................................................................................. 43
20 Percent of full-time public school teachers who strongly agreed with selectedstatements about parent and school support for teachers, by teaching experience:1993-94......................................................................................................................... 44
21 Percent of full-time public school teachers agreeing or disagreeing that parentssupport them in their efforts to educate their children, by percent of students inschool eligible for free or reduced-price school lunch: 1998.......................................... 45
22 Percent of full-time public school teachers agreeing or disagreeing that they receive agreat deal of support from parents for the work they do, by percent of students inschool eligible for free or reduced-price school lunch: 1993-94 ................................... 45
23 Percent of full-time public school teachers indicating they feel very well ormoderately well prepared to address the needs of students with limited Englishproficiency or from diverse cultural backgrounds, by percent minority enrollment inthe school: 1998 ........................................................................................................... 49
24 Percent of full-time public school teachers indicating they feel very well prepared todo various classroom activities, by whether they participated in professionaldevelopment activities in the last 12 months that focused on these content areas:1998.............................................................................................................................. 52

—1—
Every child needs—and deserves—dedicated, outstanding teachers, who knowtheir subject matter, are effectively trained, and know how to teach to highstandards and to make learning come alive for students.
President Clinton, September 1996.
1. INTRODUCTION
In his 1997 State of the Union address, PresidentClinton issued a “Call to Action” that included asa priority improving the quality of teachers inevery classroom. President Clinton’s speechreflects growing concern over the condition ofeducation and the nation’s need for excellentteachers. Now more than ever, success isdetermined by an individual’s ability not only toread and write, but also to frame and solvecomplex problems and continually learn newskills. The nation’s educational system isincreasingly being asked to provide our childrenwith the knowledge, information, and skillsneeded to compete in an increasingly complexinternational marketplace. Good teachers are thehallmark of such an educational system; they areintegral to children’s intellectual and socialdevelopment. Therefore, they must know how toteach in ways that help our children reach highlevels of competence.
A national profile of teacher quality is a necessarytool for tracking our progress toward this goal.However, providing such a profile is not an easytask. Teacher quality is a complex phenomenon,and there is little consensus on what it is or howto measure it. Definitions range from those thatfocus on what should be taught and howknowledge should be imparted to the kinds ofknowledge and training teachers should possess.Efforts to collect such data have included diversemethods, such as classroom observations andvideotaping, the administration of large-scalesurveys, and the collection of artifacts (e.g.,teacher logs, homework).
There are, however, two broad elements thatcharacterize teacher quality: teacher preparationand qualifications, and teaching practices. Thefirst refers to preservice learning (e.g.,postsecondary education, certification), teaching
assignment, continued learning (e.g., professionaldevelopment, collaboration with other teachers,teaching experience), and general background(e.g., demographics, aptitude, life experience).The second refers to the actual quality of teachingthat teachers exhibit in their classrooms (U.S.Department of Education, 1996a). Of course,these two elements of teacher quality are notmutually exclusive; excellent teacher preparationand qualifications are expected to lead toexemplary teaching.
This study is based on current efforts by theNational Center for Education Statistics (NCES)to collect data on key indicators of teacherpreparation and qualifications, using a large-scalesurvey administered to a nationally representativesample of full-time, public school teachers whoseprimary teaching assignment is in English/language arts, social studies/social sciences,foreign language, mathematics, or science or whoteach a self-contained classroom. Specifically,this report includes indicators of preservice andcontinued learning (e.g., degrees held,certification, teaching assignment, professionaldevelopment opportunities, collaboration withother teachers, teaching experience). Becauseschools and communities play an important rolein shaping and maintaining high-quality teachers,this report also examines the work environmentsin which educators teach (e.g., formal inductionprocedures for new teachers, class size, parentalsupport).
This report is timely in light of recent concernsabout the quality of our educational system andour teachers. Many of these concerns drawattention to such issues as the training and supportteachers receive (National Commission onTeaching and America’s Future—NCTAF, 1996)and the number of teachers providing instruction

—2—
outside of their subject-matter fields (U.S.Department of Education, 1996b). As a recentreview of the research indicates, teacherqualifications and preparation are importantelements of teacher effectiveness and importantfactors in determining student achievement(National Commission on Teaching andAmerica’s Future, 1997). This study of teacherquality, conducted using the NCES Fast ResponseSurvey System (FRSS), provides a nationalprofile of the current state of teacher preparationand qualifications for full-time public schoolteachers, as well as several indicators of theirwork environment.
The remainder of this chapter is divided into twomain sections. The first section describes thecurrent thinking about teacher quality—the manyways it is defined—and concludes with thedefinition used in this study. The second sectiondescribes the current approaches used to measureteacher quality and concludes with a discussion ofthe measurement approach used in this study.
Teacher Quality:How Has It Been Defined?
Perhaps the most traditional approach tocharacterizing teacher quality is the “expertteacher study,” which focuses on teachers whohave been identified as successful by theiradministrators or peers. This field of research isrich in detail, describing how successful teachersconnect what they know with how they teach.For example, researchers have found that expertteachers use knowledge about the children in theirclassrooms—their backgrounds, strengths, andweaknesses—to create lessons that connect newsubject matter to students’ experiences(Leinhardt, 1989; Westerman, 1991). They alsouse this knowledge to adapt their teaching toaccommodate children who learn in differentways. Expert teachers know how to recognizechildren experiencing difficulties, diagnosesources of problems in their learning, and identifystrengths on which to build. This skill isparticularly important because a growing numberof students with a wider range of learning needs(i.e., students whose first language is not Englishand students with learning differences anddisabilities) are entering and staying in school.
One strength of the expert teacher research is thatit relies on intuitive logic, which supports thebelief that it is possible to identify good teachersby observing them and that, once identified, theteachers’ strengths can be determined andrecorded. This body of research also confirmswhat many people envision a high-quality teacherto be—someone who understands children andknows how to assist their learning. For example,the Interstate New Teacher Assessment andSupport Consortium (INTASC, 1995) established10 key principles it believes to be central tenets ofeffective teaching. The principles state thatteachers should be able to understand theirsubject matter and relate it to students, adoptteaching strategies that are responsive to differentlearners, employ diverse instructional strategies,establish proper assessment tools to measurestudent development, and engage in continualcurriculum evaluation and professional develop-ment (INTASC Core Standards).
However, aside from such broad notions ofteacher quality, there is little consensus regardingits precise definition (Stodolsky, 1996). That is,there is no single answer to the question “Whatqualifications and practices characterize high-quality teachers?” There are many different andsometimes conflicting views of what constitutes agood teacher. These views, as discussed below,address not only teaching practices, but alsoteacher preparation and qualifications as well asthe school environments where teachers work.
Teaching Practices
The disagreement over basic skills versuscomplex thinking approaches to instruction is oneexample of the key disputes currently surroundingdefinitions of high-quality teaching practice.Although viewing these techniques as opposingapproaches represents a simplification of theissue, these two instructional methods doillustrate the extremes of the current debate.
The first form of instruction traditionally has beenconceptualized as the transmission of facts tostudents, who are seen as passive receptors. Inclassrooms where this type of teachingpredominates, teachers typically conduct lessonsthrough a lecture format, instruct the entire classas a unit, write notes on the chalkboard, and pass

—3—
out worksheets for students to complete. In suchclassrooms, knowledge is presented as fact. Thisis the type of instruction with which mostAmericans are familiar.
By contrast, in classrooms characterized byhigher order tasks, typically described as“constructivist,” students are encouraged to posehypotheses and to explore ways to test them.They are encouraged to weigh information fromthese “tests” with previous experiences orunderstanding of the topic. Students then“construct” a new understanding of subjectmatter. Although many recent school reformefforts advocate such innovative instruction (e.g.,Coalition of Essential Schools—Sizer, 1992;National Association of Secondary SchoolPrincipals and the Carnegie Foundation for theAdvancement of Teaching—NASSP, 1996), thereis much debate regarding the use andimplementation of such instructional techniques.For example, opposition may come from parentsand teachers who hold more traditional views ofteaching and learning. Moreover, the concerns ofparents, teachers, and students about access tocolleges—which is based, in part, on highperformance on standardized tests of recognizedskills and facts—may discourage the use ofinnovative instructional techniques (Talbert andMcLaughlin, 1993). Studies of these construc-tivist teaching methods have been limited becausesuch instruction has only recently beenimplemented. The existing studies typically useclassroom observation in a limited number ofsettings.
Teacher Preparation and Qualifications
As with teaching practices, there is debatesurrounding the preparation and qualificationsthat characterize high-quality teachers.Compared to other fields, disputes andambiguities regarding the knowledge base andcompetence required of professionals areparticularly striking in teaching (Sykes, 1990).There is little dispute that teachers ought to havea postsecondary education and possess strongknowledge of the subjects they teach, but beyondthis there is some disagreement about whatindividuals need to know and be able to do inorder to teach effectively. Moreover, asresearchers struggle to quantify teacher
preparation and qualifications, some critics feelthat studies of teachers’ credentials andknowledge do not provide enough informationabout teacher quality—that is, indicators ofteacher preparation and qualifications do notdirectly address the actual quality of instructionalpractices. As these debates are highlighted in theparagraphs that follow, however, it is important tonote that there are some well-establishedindicators of teacher preparation and qualifi-cations that do inform researchers, policymakers,and education consumers.
During an NCES conference presentation, DavidMandel (1996, p. 3-31), former Vice President forPolicy Development at the National Board forProfessional Teaching Standards, stated:
What is known is the type ofeducation credentials teachers haveaccumulated and the type of statelicenses they have been granted. Thisinformation has proven useful ingaining a rough sense of how well-prepared teachers are to take on theassignments they are handed... Butsuch data, even when positive,provide only the most modestthreshold of confidence regarding thequality of practice in the nation’sschools.
Other researchers agree that understandingteacher preparation and qualifications requiresmore than determining whether or not a teacherhas a degree or certification. The National Boardfor Professional Teaching Standards describesteaching as a complex skill involving multipletalents (NBPTS, 1998). Ballou and Podgursky(1997, 1998) raise important measurement issuesin their discussion of ways in which to attract“brighter” individuals into the teaching pool. Inthis discussion, they insist that flexibility incertification and personnel policies facilitates theentry of talented individuals into teaching. Theimplication of their argument is that extensiveformal training may not necessarily create goodteachers. The authors suggest that talentedindividuals may be less likely to remain in teachertraining programs that require extendedcommitment; they may be more likely to seekmore lucrative professions. According to their

—4—
logic, extended formal training does notnecessarily reflect teacher quality. It is importantto note, however, the other side of the debate; thatis, in addition to talent and subject-matterknowledge, prospective teachers must also betrained to teach children (NCTAF, 1996).
Supportive Working Conditions
In addition to teacher preparation andqualifications and teaching practice, investiga-tions of teacher quality have included studies ofwhat happens to teachers once they enter theworkforce. This perspective stems from thepremise that classrooms and schools becomeeffective when talented people are teaching inworkplaces that are stimulating and rewarding(Fullan with Stiegelbauer, 1991). In order topromote high-quality teaching that will in turnproduce high-quality learning, teachers needsupport from the schools and communities inwhich they work (including such issues asinduction programs for new teachers and thenumber of students for whom teachers areresponsible) and support from the parents of thechildren they teach.
Class size. Although the research on class size issomewhat mixed—some research studies suggestpositive effects of reduced class size, otherssuggest little effect—it seems reasonable toassume that smaller class size may facilitateteachers’ work. In order for teachers to become“experts” as defined by the expert—teacherliterature, it is important for them to truly knowand understand the children in their classrooms,which clearly would be easier if there were fewerchildren. Some of the research on class sizesupports this logic. For example, studies ofTennessee’s Project STAR indicate that studentsin smaller classes (13-17 students) significantlyoutperformed students in larger classes (22-25students) on achievement tests in mathematicsand reading (Finn and Achilles, 1990; Word etal., 1990). Ferguson (1990) reported similarfindings in Texas; classes enrolling more than 18students were associated with lower reading andmath test scores for grades 1-7. To explain theclass size effects, researchers have cited thesmaller number of disruptions, the increasedteacher attention for students, and the increasedopportunity for student participation in smallerclassrooms (Achilles, 1996). Other researchers
argue that reducing class size has little or noeffect on student performance. In an examinationof trend data from the 1950s to 1986, Tomlinson(U.S. Department of Education, 1988) did notfind a consistent relationship between class sizeand standardized test scores. Moreover, based ona review of the literature, Odden (1990) arguedthat class size reduction produces only modestgains in student achievement and does not justifythe cost of implementing such reform.
Induction of new teachers. Research has foundthat the attrition rates of new teachers are fivetimes higher than those of their more experiencedcounterparts (Asian-Pacific Economic Coopera-tion, 1997). In order to introduce beginningteachers into the profession with support andguidance, many districts have implementedformal induction programs. These programs canhave two goals: to assist beginning teachers withinstruction and to prepare them to meet statecertification requirements. A key feature of manyprograms is the mentoring aspect—the pairing ofan experienced teacher with a new teacher.Responsibilities of the mentor may includeproviding guidance on curriculum, classroommanagement, and assessment (Galvez-Hjornevik,1986). It is expected that mentoring relationshipsplay a critical role in the support, training, andretention of new teachers (King and Bey, 1995).Therefore, by easing the transition into full-timeteaching, formal induction programs provide newpractitioners with skills and support structures todevelop effective teaching practices. It isimportant to note that in addition to formalinduction of new teachers, there are manyimportant avenues for informal induction (e.g.,team teaching, common planning time and otheractivities which results in informal collaborationbetween new and experienced teachers).
Parental support. An extensive body ofresearch has found what many parents andeducators already know—children prosper whentheir parents are actively involved in theireducation. Research has shown that support fromfamilies, including greater family involvement inchildren’s learning, is a critical factor leading to ahigh-quality education (U.S. Department ofEducation, 1994a). Policymakers have tappedinto this important resource; for example, theNational Education Goals included parentalinvolvement in children’s education as a toppriority. Clearly, teachers’ jobs are easier when

—5—
parents work with them rather than against them.For this reason, parental support is an importantfeature of teachers’ work environment.
The Definition of Teacher QualityUsed in This Report
The previous discussion underscores the complexand sometimes controversial nature of definingteacher quality. Two main elements werediscussed—teacher preparation and qualifica-tions, and teaching practices. The definition usedin this report is based on the former rather thanthe latter. Teachers’ professional preparation (aswell as their working conditions) has beenidentified as fundamental to improvingelementary and secondary education (CarnegieForum on Education and the Economy, 1986;Holmes Group, 1986; NCTAF, 1996).Policymakers today are especially interested inthe training and education teachers receive in thesubject areas they teach; high-quality teacherpreparation and qualifications are expected tolead to high-quality teaching. For these reasons, anational profile of teacher preparation andqualifications provides important informationabout the quality of America’s teachers.
Decisions regarding how to define teacher qualityhave implications for the method researchers useto measure it. For example, teaching practices areincreasingly measured through classroomobservation. Teacher preparation andqualifications are often measured through large-scale surveys. The following section discussesthe various ways teacher quality has beenmeasured. Included is a discussion of thedefinition(s) typically associated with eachmeasurement approach.
Teacher Quality:How Has It Been Studied?
Just as definitions about teacher quality differ, sodo the ways in which it has been studied.Conventional approaches to measuring teacherquality have typically taken four forms: (1)classroom observations of teacher practices; (2)written examinations of teachers measuring theirbasic literacy, subject-matter knowledge, andpedagogical skills; (3) student performance and
achievement; and (4) large-scale surveys ofteacher qualifications, attitudes, behaviors, andpractices. It is important to note that studies ofteacher qualifications or practices are not alwaysdriven by theories of what constitutes a goodteacher. Sometimes such indicators aredeveloped to answer specific policy questions.As described below, different approaches tomeasuring teacher qualifications or practices arebased on different conceptions of what it meansto be a high-quality teacher or on the specificneeds or interests of policymakers.
Classroom Observation
Observational research has a long and growinghistory in the field of education. Classroomobservation, as well as the collection of artifacts(e.g., teacher logs, homework) and informationfrom interviews, has been employed to documentteaching practices generally and to assessteaching quality specifically. Observation, asused by school systems for evaluation purposes,has been strongly criticized as having thefollowing problems: limited competence ofprincipals, teacher resistance and apathy, lack ofuniformity within school systems, and inadequatetraining of evaluators (Wise et al., 1984).Principals often experience role conflict as theytry to serve as both evaluators and instructionalleaders, and they tend to lack expertise inspecialized subject-matter areas, especially at thesecondary school level (Stodolsky, 1984).
Using observational data to document teachingpractices is less controversial than using it toassess individual teachers for purposes of salaryincrease, tenure, or recertification. Observationalstudies, often combined with interviews orteacher logs, include investigations of teachers’pedagogical content knowledge and reasoning(Ball and Wilson, 1996) and the connectionsbetween education policy and teacher practices(Ball, 1990; Cohen, 1990; Peterson, 1990),professional development and teaching (Ball,1996), and subject matter and curricular activity(Stodolsky and Grossman, 1995).
Observational data provide rich detail and in-depth information. As such, observation istypically used to provide a detailed picture ofclassroom instruction in a limited number ofclassrooms. Because collecting such data is

—6—
costly, this approach is rarely used to provide anational profile of instruction. However, NCESis involved in an effort to provide such a profile.The Videotape Classroom Study, part of the ThirdInternational Mathematics and Science Study(TIMSS), consists of videotaped lessons in 231eighth grade mathematics classrooms in theUnited States, Germany, and Japan. The report ofthe video study includes general findingsregarding international differences in how lessonsare structured and delivered, what kind ofmathematics is presented, and the kinds ofmathematical thinking in which students areengaged (U.S. Department of Education, 1998a).
Teacher Testing
Standardized tests, such as the National TeacherExaminations (NTE), have been used to measureteachers’ basic knowledge and skills (e.g., basicliteracy, number skills, subject-matter knowledgein particular areas). Teacher test scores have thenbeen linked to student test scores. Ferguson(1990) found that teachers’ scores on a test ofbasic literacy skills were significantly correlatedwith their students’ test scores. Results aretypically used to determine whether to granttemporary or permanent certification, andoccasionally for continuation of tenured teachers.
While most experts agree that having basicsubject knowledge is an important prerequisite toeffective teaching, critics maintain that it is not asufficient indication of the range of knowledgeand skills needed to instruct and manage groupsof children. They argue that this approach doesnot provide a complete picture of teacher quality.These tests only measure teachers’ basicknowledge and not their pedagogical knowledgeor their teaching practice. In response,organizations such as the Educational TestingService (ETS), the Interstate New TeacherAssessment and Support Consortium, and theNational Board for Professional TeachingStandards have undertaken efforts to develop newsystems of teacher assessment that feature“standards-based assessments.” One example ofthe new generation of teacher examinations is theProfessional Assessments for BeginningTeachers, the PRAXIS series, currently beingdeveloped by the Educational Testing Service asa replacement for NTE. The PRAXIS seriesconsists of three types of assessments: (1) a
computerized test of basic literacy and numeracyskills; (2) a paper-and-pencil test of subject-matter knowledge and general pedagogicalprinciples; and (3) an observational assessment ofclassroom teaching performance. The PRAXISseries is meant to assess potential and practicingteachers at different times during their trainingand practice (e.g., admitting candidates intoteacher education programs and awarding initialand ongoing certification). In addition, manystates have developed their own assessments as abasic prerequisite for teaching. Theseassessments can take the form of written tests,which may measure basic skills, subject matter orknowledge of teaching methods, and performanceevaluations, which could consist of portfolioevaluation or classroom observation (CCSSO,1998).
Such efforts have grown out of the recent push toidentify standards for teacher and studentperformance. These kinds of assessments gobeyond paper-and-pencil tests to include portfolioassessment and in-person testing, whichincorporate pedagogy, content knowledge, androle-play/interactive sessions. Teachers may alsobe required to submit examples of their workthrough videotapes and lesson plans. Teachersare asked to analyze teaching situations anddefend teaching decisions based on knowledge ofsubject, students, curriculum, and pedagogy.
Student Achievement Tests
Many would argue that the bottom line ofwhether teachers (and schools) are effective iswhether their students are successful. The use ofstudent achievement test score gains to assessteachers, rather than educational systems,however, has received substantial criticism (U.S.Department of Education, 1996a). Specifically,social scientists have argued that it is verydifficult to separate out the portion of studentachievement gains that can be reliably attributedto an individual teacher. Numerous factors affectstudent achievement over the course of a schoolyear in addition to his or her teacher: homebackground, student personality, attendance,school and community resources, and the peergroup have all been demonstrated to affect howmuch students learn. In addition, critics haveargued that standardized achievement tests assessminimum levels of student competence and are

—7—
often limited to the kinds of knowledge that canbe captured with multiple-choice formats.
Large-Scale Surveys
National surveys of teachers have been used toprovide quantifiable indicators of teacher quality.Typically, teachers have been asked to provideinformation on attributes such as their educationalbackground, major and minor fields of study,certification, and professional developmentexperiences. Such indicators have sometimesbeen linked to student test scores. For example,Ferguson (1990) found that the students ofteachers with master’s degrees had higher testscores in grades 1-7.
Over the years, there have been many efforts byNCES and others to use large-surveymethodology to describe teaching—and, moregenerally, to capture what happens in classrooms.Examples of recent efforts can be found in SchoolPolicies and Practices Affecting Instruction inMathematics (U.S. Department of Education,1998b), America’s Teachers: Profile of aProfession, 1993-1994 (U.S. Department ofEducation, 1997), Toward Better TeachingProfessional Development in 1993-94 (U.S.Department of Education, 1998c), and WhatHappens in Classrooms? Elementary andSecondary School Instruction, 1994-95 (U.S.Department of Education, forthcoming). Thesedata notwithstanding, social scientists agree thatexisting surveys on these topics leave room forimprovement. Important work continues in areassuch as curriculum content, but new tools must bedeveloped before large-scale differences ininstructional and classroom practices can bereliably reported.
The Measurement ApproachUsed in This Report
The qualities deemed relevant to effectiveteaching, the goals of the assessor, and theresources available all contribute to the choice ofassessment. The measurement approach adoptedin this report is a large-scale survey administeredto a representative sample of American teachers.Such a survey is particularly appropriate forproviding a national profile of teacherpreparation, qualifications, professional develop-
ment, and school and parental support. Providinga picture of our nation’s teachers is important intracking trends of teacher preparedness andprofessional experiences.
Because of constraints on teacher time andresources, there are few national reports of thiskind. Instead, many national reports havecompiled data from a variety of sources to makeconclusions about the status of education inAmerica. Only the Schools and Staffing Survey(SASS), conducted by NCES on a regular basis,collects data from both teachers and schools onnumerous aspects of teacher quality. SASSindicators of teacher quality include recruitment,teacher preparation, induction programs, teachingassignment (e.g., committee work, in- and out-of-field teaching), resources (e.g., class size,planning time), and professional developmentopportunities. However, the last SASS wasconducted in 1993-94, and the next one will notbe fielded until 1999-2000. The need for up-to-date, nationally representative data on thenation’s teaching force prompted this FastResponse Survey on Professional Developmentand Training in 1998. In addition to presentingcurrent findings on teacher quality from the 1998FRSS survey, this report draws comparisonsbetween the FRSS findings and findings fromcomparable questions on NCES’ 1993-94 SASS.The comparisons provide some information abouttrends over the 4-year period. See appendix A fora discussion of the comparisons between thesurveys. Both surveys are described in moredetail below.
1998 FRSS Survey. The Teacher Survey onProfessional Development and Training wasconducted through the NCES FRSS during spring1998. FRSS is a survey system designed tocollect small amounts of issue-oriented data withminimal burden on respondents and within arelatively short timeframe. Questionnaires (seeappendix E) were mailed to a nationallyrepresentative sample of 4,049 full-time teachersin regular public elementary, middle, and highschools in the 50 states and the District ofColumbia. The sample was designed to representfull-time public school teachers in grades 1through 12 whose main teaching assignment wasin English/language arts, social studies/socialsciences, foreign language, mathematics, orscience, or who taught a self-containedclassroom. Part-time, itinerant, and substitute

—8—
teachers were excluded, as were teachers whosemain teaching assignment was in another subjectarea (e.g., art, special education). Data have beenweighted to national estimates. All comparativestatements made in this report have been testedfor statistical significance using chi-square testsor t-tests adjusted for multiple comparisons usingthe Bonferroni adjustment and are significant atthe 0.05 level or better. Appendix A provides adetailed discussion of the sample and surveymethodology.1
1993-94 Schools and Staffing Survey. Since1987-88, NCES has periodically conducted theSASS, an integrated survey of public and privateschools, school districts, principals, and teachers.Most recently conducted in 1993-94, it provides acomprehensive picture of the school workforceand teacher supply and demand. Included on thepublic school teacher survey are several items onteacher training and professional development.Some of the items are similar, although notidentical, to the items on the FRSS survey (seeappendix F). Data from the similar items on the1993-94 SASS teacher survey were reanalyzedfor a subset of schools and teachers that areapproximately the same as the schools andteachers sampled for the FRSS survey.2 Resultsare incorporated into the discussion of the FRSSdata where appropriate.3 Because the SASS datawere reanalyzed in this way, the estimates thatappear in this report differ from SASS datapublished in other National Center for EducationStatistics reports.
Organization of This Report
The preparation of high-quality teachers stemsfrom the many experiences and opportunities thatthey face, both prior to and during their teachingcareers. For all teachers, learning begins beforeentering their own classrooms. Among theirlearning experiences is the formal postsecondary
1Detailed tables for the FRSS survey are in appendix B. Tables ofstandard errors for the text tables and figures are in appendix D.
2 Public school teachers targeted in the 1993-94 SASS study forcomparison to the 1998 FRSS study are full-time public schoolteachers in grades 1 through 12 whose main teaching assignmentwas in English/language arts, social studies/social sciences, foreignlanguage, mathematics, science, or general elementary.
3Detailed tables for the SASS items are presented in appendix C.
training they undergo in order to becomeeducators. This includes college work andcertification. Once on the job, teachers havemany additional opportunities to learn—rangingfrom the general learning that comes from yearsof work experience to more structuredopportunities in the form of formal professionaldevelopment activities. Not surprisingly, teacherlearning and preparation are enhanced inenvironments that support their learning and theirwork. This discussion suggests one useful modelfor thinking about teacher quality; it begins withdifferent types of teacher learning and ends withthe support teachers receive to pursue continuedlearning.
Using this model of teacher quality, the resultssections of this report first address teacherlearning (both preservice and on the job), as wellas the working conditions to which teachers areexposed; these sections then examine the extentto which teachers feel themselves prepared tomeet the challenges they face in their classrooms.The results of the 1998 survey and comparisonsbetween the 1998 and 1993-94 surveys aredivided into four chapters corresponding directlyto the four main topics investigated in this FRSSreport: (1) preservice learning and teachingassignment; (2) continued learning; (3) supportivework environment; and (4) teachers’ feelings ofpreparedness. Conclusions are provided in thefinal chapter of this report.

—9—
2. PRESERVICE LEARNING ANDTEACHING ASSIGNMENT
Teachers’ preservice learning and teachingassignment are the first features of the teacherquality model presented in this report. Aspects ofpreservice learning and teaching assignment (e.g.,completion of a teacher education program,course work or earned degree(s) beyond thebaccalaureate, and possession of some kind ofcertification or credential) have traditionally beenused to characterize teacher preparation andqualifications. Preservice learning occurs prior toentering the classroom.4 Teaching assignment isinvestigated to determine the match (or lackthereof) between teachers’ training and the mainsubject areas that they are assigned to teach.
Growing concern that a number of the nation’steachers are underqualified to teach our childrenhas focused attention on the quality of theirpreservice learning, and especially on theinstitutions that prepare prospective teachers.These institutions have been criticized for treatingthe education programs as “cash cows which areconducted on a shoestring and used to fundprograms in other fields” (NCTAF, 1997: 31).Critics argue that schools of education should bemore “intellectually solid” and more connected toelementary and secondary schools (HolmesGroup, 1986: 2). For example, colleges anduniversities should improve the screening processof teacher candidates to weed out weak students(Holmes Group, 1986), and these prospectiveteachers should be required to have academicmajors in the fields they will eventually teach(Ravitch, 1998).
Criticisms have also been launched atcertification policies. Critics argue that settingstandards and not enforcing them has increasedthe number of underqualified teachers inAmerican schools. These concerns were reflectedin a recent speech by Education Secretary
4 Although characterized as preservice learning, it is important tonote that teachers may enhance or expand their education andcertification once on the job. For example, they may earn amaster’s degree once employed as classroom teachers.
Richard Riley to the National Press Club(September 1998). In that speech, SecretaryRiley implored the nation’s colleges anduniversities to do a better job of preparingteachers and challenged every state to eliminateemergency certification.
Finally, concern over underqualified teachers hasled to increased attention toward the problem ofout-of-field teaching. In order for teachers toprovide the highest quality learning experiencesfor students, they must first understand and beable to communicate the subject matter. Thenumber of students being taught by untrained andunprepared teachers has triggered researchers,practitioners, and others vested in education tosearch for solutions. Most realize that“knowledge of subject matter and of pedagogicalmethods do not, of course, guarantee qualityteachers nor quality teaching, but they arenecessary prerequisites” (U.S. Department ofEducation, 1996b: 2). The lack of continuitybetween a teacher’s training and a teacher’sassignment leaves students learning from teachersthat have not met those prerequisites.
Researchers have debated the reasons whyteachers are assigned to teach out of field. Assummarized by Ingersoll (1998), some believethat there are not enough teachers who areadequately trained in academic coursework.Others propose that teacher unions force schoolsto retain older, less competent teachers and tosubject new, more qualified teachers to cutbacks.Finally, some researchers believe that shortagesin teacher supply force schools to hire teacherswith lower qualifications. Ingersoll proposes thatthe low status and low pay teachers receivecontributes to high turnover rates. To deal withthe frequent vacancies, he argues, schools arereduced to assigning teachers to out-of-fieldclasses (Ingersoll, 1998). These conditions mayalso contribute to the number of teachers grantedemergency certification. This FRSS reportaddresses the incidences of out-of-field teaching

—10—
and emergency certification, but does not seekexplanations for these phenomena.
This chapter addresses the following indicators ofpreservice learning: education, certification, andthe match between teachers’ preparation andteaching assignment—in-field versus out-of-fieldteaching. Each of these issues is discussed inmore detail below.
Teacher Education
Teacher education is the first measure ofpreservice learning addressed in this report. Thetype of degree held by a teacher is one measureused to determine teacher qualifications. Holdingat least a bachelor’s degree was once consideredadequate, but today teachers often are expected tohold advanced degrees. As discussed earlier, thisexpectation has been accompanied by a push forteachers, particularly those teaching in secondaryschools, to have an academic major, rather than amajor in the study of education. In fact, since1986 about 300 colleges have created extendedteacher education programs that enable studentsto obtain both a bachelor’s degree in an academicfield and a master’s degree in education (Darling-Hammond, 1998).
In 1998, virtually all full-time public schoolteachers had a bachelor’s degree, nearly half(45 percent) had a master's degree, and 1 percenthad a doctorate (table B-25). The likelihood of ateacher having a master's degree varied somewhatby the school instructional level and the numberof years of teaching experience (figure 1 and tableB-2). A higher percentage of teachers who taughtat the high school level had master's degrees(55 percent) than did those teaching in middleschools (46 percent) and those teaching inelementary schools (40 percent). The likelihoodof holding a master’s degree increased with thenumber of years of teaching experience. Thus,teachers with 3 or fewer years of teachingexperience were the least likely to have a master'sdegree (16 percent), compared with 31 percent ofteachers with 4 to 9 years of experience,48 percent of teachers with 10 to 19 years ofexperience, and 62 percent of those with 20 or
5 Tables that begin with the prefix B are detailed tables from the1998 FRSS study, which appear in appendix B.
more years of teaching experience.6 This is notsurprising, given that many states and districtshave long required that a teacher earn a master’sdegree or its equivalent within a specified periodof time.
Having a master’s degree also varied by theconcentration of poverty in the school (as definedby the percentage of students eligible for free orreduced-price lunch). Teachers in schools withhigher concentrations of poverty were generallyless likely to hold master's degrees than wereteachers in schools with low concentrations ofpoverty (figure 1 and table B-2). For example,37 percent of the teachers in the highest povertyschools had master’s degrees compared with57 percent in the lowest poverty schools. Thelikelihood of having a master’s degree also variedby geographic region, with 60 percent of teachersin the Northeast and 51 percent of teachers in theMidwest having master's degrees, compared with38 percent in the West and 39 percent in theSouth. These 1998 findings paralleled those from1993-94,7 where similar patterns emerged(figure 2 and table C-38).
Among the full-time public school teachers in the1998 study, 38 percent had an undergraduate orgraduate major in an academic field, 18 percenthad a major in subject area education (i.e., theteaching of an academic field, such asmathematics education), 37 percent had a majorin general education, and 7 percent had a major inother education fields (e.g., special education,curriculum and instruction, or educational
6The teachers in 1998 averaged 15 years of total teachingexperience, and 10 years as a teacher in their current school (tableB-3). In general, the teaching profession includes a greaterpercentage of highly experienced teachers than novice teachers; 39percent of the teachers had been teaching for 20 or more years,while 14 percent had been teaching for 3 or fewer years (table B-1). About one-quarter of the teachers had 4 to 9 years or 10 to 19years of teaching experience (22 and 25 percent, respectively).Findings from 1993-94 indicate that the percentage of teachersreporting various years of experience in the field has remainedessentially unchanged (tables C-1 and C-2).
7 Data from similar items on the 1993-94 SASS teacher survey werereanalyzed for a subset of schools and teachers that isapproximately the same as the schools and teachers sampled forthe 1998 FRSS survey. Results are incorporated into this reportwhere appropriate. See appendix A for a discussion of thecomparisons between these two surveys.
8 Tables that begin with the prefix C are detailed tables from the1993-94 SASS study, which appear in appendix C.

—11—
Figure 1.—Percent of full-time public school teachers who hold a master’s degree, by selectedschool and teacher characteristics: 1998
40
46
55
49
16
31
48
62
57
46
4137
60
51
39 38
0
20
40
60
80
100
Percent
Ele-mentary school
Middleschool
Highschool
Com-bined
Lessthan15
percent
15 to32
percent
33 to 59
percent
60percent
or more
3 orfeweryears
4 to 9
years
10 to 19years
20 or
moreyears
North-east
Mid-west
South West
School instructional levelPercent of students eligible for
free or reduced-price lunchTeaching experience Region
SOURCE: U.S. Department of Education, National Center for Education Statistics, Fast Response Survey System, Teacher Survey onProfessional Development and Training, 1998.
administration; table 1). For these analyses,each teacher was only counted once, even if heor she had more than one major or more thanone degree. Major fields of study were selectedin the order of academic field, subject areaeducation, other education, and generaleducation. See appendix A for a more detaileddiscussion of how this measure was calculatedand tables that show duplicated majors.
The percentages with majors in various fieldsvaried by the instructional level of the schooland years of teaching experience. While 58percent of elementary school teachers majoredin general education, 27 percent of middleschool teachers and only 5 percent of highschool teachers had general education majors.More high school teachers had an undergraduateor graduate major in an academic field (66
percent), compared with elementary schoolteachers (22 percent) and middle school teachers(44 percent). In addition, more high school andmiddle school teachers majored in subject areaeducation (29 and 22 percent, respectively) thandid elementary school teachers (9 percent). Thenewest teachers (i.e., those with 3 or fewer years ofteaching experience) were more likely to havemajored in an academic field than were any of themore experienced teachers. Thus, half of theteachers with 3 or fewer years of experience hadmajored in an academic field, compared with 32 to41 percent of the more experienced teachers,perhaps reflecting the recent emphasis in teachereducation on majoring in an academic field ratherthan in education. The 1993-94 data showed thesame patterns for instructional level (table 2). Thatis, most middle and high school teachers majoredin an academic field or subject area education,

—12—
Figure 2.—Percent of full-time public school teachers who hold a master’s degree, by selectedschool and teacher characteristics: 1993-94
4246
55
47
15
30
49
61
53
46
41 41
60
47
42
37
0
20
40
60
80
100
Percent
Ele-mentary school
Middleschool
Highschool
Com-bined
Lessthan15
percent
15 to32
percent
33 to 59
percent
60percent
or more
3 orfeweryears
4 to 9
years
10 to 19years
20 or
moreyears
North-east
Mid-west
South West
School instructional level Percent of students eligible for free or reduced-price lunch
Teaching experience Region
SOURCE: U.S. Department of Education, National Center for Education Statistics, 1993-94 Schools and Staffing Survey, unpublishedtabulations, 1998.
Table 1.—Percent of full-time public school teachers who majored in various fields of study for abachelor’s or graduate degree, by selected school and teacher characteristics: 1998
School characteristic Academicfield
Subject areaeducation1
Generaleducation
Othereducation2
All targeted public school teachers3 ................................................... 38 18 37 7
School instructional levelElementary school.............................................................................. 22 9 58 11Middle school..................................................................................... 44 22 27 7High school ........................................................................................ 66 29 5 1Combined........................................................................................... 55 35 8 2
Teaching experience3 or fewer years.................................................................................. 50 11 37 24 to 9 years ......................................................................................... 41 16 39 510 to 19 years ..................................................................................... 32 20 37 1120 or more years................................................................................. 36 20 36 8
1Subject area education is the teaching of an academic field, such as mathematics education.2Examples of other education fields are special education, curriculum and instruction, and educational administration.3Targeted public school teachers were full-time public school teachers in grades 1 through 12 whose main teaching assignment was inEnglish/language arts, social studies/social sciences, foreign languages, mathematics, or science, or who taught a self-contained classroom.
NOTE: Percents are computed across each row, but may not sum to 100 because of rounding. Major fields of study were selected in the order ofacademic field, subject area education, other education, and general education.
SOURCE: U.S. Department of Education, National Center for Education Statistics, Fast Response Survey System, Teacher Survey onProfessional Development and Training, 1998.

—13—
Table 2.—Percent of full-time public school teachers who majored in various fields of study for abachelor’s or graduate degree, by selected school and teacher characteristics: 1993-94
School characteristic Academicfield
Subject areaeducation1
Generaleducation
Othereducation2
All targeted public school teachers3 ................................................... 39 21 34 7
School instructional levelElementary school.............................................................................. 24 14 52 10Middle school..................................................................................... 44 26 24 6High school ........................................................................................ 67 30 3 1Combined........................................................................................... 55 32 11 2
Teaching experience3 or fewer years.................................................................................. 46 17 35 24 to 9 years ......................................................................................... 38 19 38 510 to 19 years ..................................................................................... 35 21 34 920 or more years................................................................................. 40 23 31 7
1Subject area education is the teaching of an academic field, such as mathematics education.2Examples of other education fields are special education, curriculum and instruction, and educational administration.3Targeted public school teachers were full-time public school teachers in grades 1 through 12 whose main teaching assignment was inEnglish/language arts, social studies/social sciences, foreign languages, mathematics, science, or general elementary.
NOTE: Percents are computed across each row, but may not sum to 100 because of rounding. Major fields of study were selected in the order ofacademic field, subject area education, other education, and general education.
SOURCE: U.S. Department of Education, National Center for Education Statistics, 1993-94 Schools and Staffing Survey, unpublishedtabulations, 1998.
and most elementary school teachers majored ingeneral education.9
Teacher Certification
Teachers’ certification status, the second measureof preservice learning examined in this report, isalso an indication of teachers’ qualifications. Inaddition to requirements for formal education(e.g., a bachelor’s degree), teacher certificationincludes clinical experiences (e.g., studentteaching) and often some type of formal testing.Most of the full-time public school teachers in1998 were fully certified in the field of their mainteaching assignment; that is, they had either aregular or standard state certificate, or anadvanced professional certificate in the field inwhich they taught most often. Among teachers ingeneral elementary classrooms,10 93 percent had aregular or advanced certificate, 3 percent had aprovisional certificate, 2 percent a probationary 9 There is some evidence from SASS reinterview studies thatteachers’ recollections of their major field are moderatelyinconsistent with their SASS questionnaire data. Thus, these datashould be interpreted with caution.
10 The category labeled general elementary classrooms in the 1998FRSS study includes all teachers of self-contained classrooms,regardless of instructional level. Almost all (95 percent) of theself-contained classrooms were at the elementary school level.
certificate, 1 percent a temporary certificate, and1 percent had an emergency certificate or waiver(tables 3 and B-4). No general elementaryclassroom teachers in this study indicated thatthey were teaching without any kind ofcertification. Most departmentalized teachersalso were fully certified in their main teachingassignment field; 92 percent indicated that theyhad a regular or advanced certificate in the fieldin which they taught the most courses (tables 3and B-5). For the main teaching assignment,4 percent of the departmentalized teachers had aprovisional certificate, 2 percent had a proba-tionary certificate, 1 percent had a temporarycertificate, and 1 percent had an emergencycertificate or waiver. Less than 0.5 percent of thedepartmentalized teachers in this study indicatedthat they were teaching in their main assignmentfield without any kind of certification. Thesefindings on teachers' certification statusessentially replicated those of the 1993-94 study(tables 4, C-4 and C-5).11
11
These data for both 1998 and 1993-94 may actually slightlyoverestimate the amount of underqualified teaching, as measuredby possession of a regular teaching certificate in the mainassignment field, because some teachers who do not have regularcertificates in their main assignment field do have regularcertificates in another field.

—14—
Table 3.—Percent of full-time public school teachers in general elementary classrooms and depart-mentalized settings with various types of teaching certificates in their state: 1998
Teaching assignment
Type of teaching certificate General elementary
classrooms1
Departmentalized settings:
main teaching assignment
Regular or standard state certificate, or advanced professional certificate... 93 92
Provisional or other type of certificate given while participating in an
“alternative certification program”.......................................................... 3 4
Probationary certificate................................................................................ 2 2
Temporary certificate .................................................................................. 1 1
Emergency certificate or waiver .................................................................. 1 1
No certificate ............................................................................................... 0 *
*Less than 0.5 percent.1The category labeled general elementary classrooms includes all teachers of self-contained classrooms in the 1998 FRSS study, regardless ofinstructional level. Almost all (95 percent) of the self-contained classrooms were at the elementary school level.
NOTE: Percents are computed down each column, but may not sum to 100 because of rounding. Zeros indicate that no teacher in the samplegave the indicated response.
SOURCE: U.S. Department of Education, National Center for Education Statistics, Fast Response Survey System, Teacher Survey onProfessional Development and Training, 1998.
Table 4.—Percent of full-time public school teachers in general elementary classrooms and depart-mentalized settings with various types of teaching certificates in their state: 1993-94
Teaching assignment
Type of teaching certificate General elementary
classrooms1
Departmentalized settings:
main teaching assignment2
Regular or standard state certificate, or advanced professional certificate... 94 90
Provisional or other type of certificate given while participating in an
“alternative certification program”.......................................................... 2 2
Probationary certificate................................................................................ 2 2
Temporary certificate .................................................................................. 1 1
Emergency certificate or waiver .................................................................. * *
No certificate ............................................................................................... 1 4
*Less than 0.5 percent.1The category labeled general elementary classrooms includes teachers in the 1993-94 SASS study who indicated that their main teachingassignment was general elementary.2The category labeled departmentalized settings includes teachers in the 1993-94 SASS study who indicated that their main teaching assignmentwas in English/language arts, social studies/social sciences, foreign language, mathematics, or science.
NOTE: Percents are computed down each column, but may not sum to 100 because of rounding.
SOURCE: U.S. Department of Education, National Center for Education Statistics, 1993-94 Schools and Staffing Survey, unpublishedtabulations, 1998.
Data from both the 1998 and 1993-94 studiesindicated that possessing a regular, standard, oradvanced certificate was positively related toyears of teaching experience. Almost all teachersin both studies who had been teaching for 10 ormore years, whether in general elementaryclassrooms or in departmentalized settings, werefully certified in their main teaching assignment,and most of the teachers who had been teaching 4to 9 years were also fully certified (figures 3 and4, and tables B-2, B-4, C-4, and C-5). Teacherswith 3 or fewer years of experience teaching inboth general elementary classrooms and
departmentalized settings, however, were muchless likely to have a regular, standard, oradvanced certificate than were more experiencedteachers. Since some states require new teachersto start with probationary certification, all newteachers without regular certification are notnecessarily less well qualified than those withregular certification. In 1998, most teachers with3 or fewer years of experience who did not haveregular certification had provisional orprobationary certification (tables B-4 and B-5).However, emergency and temporary certificationwas higher among teachers with 3 or fewer years

—15—
Figure 3.—Percent of full-time public school teachers in general elementary classrooms anddepartmentalized settings with a regular or standard state certificate or advancedprofessional certificate, by teaching experience: 1998
65 64
9289
99 9799 99
0
20
40
60
80
100
General elementary classrooms
Departmentalized setting: Main teaching assignment
Percent
3 or fewer years
4 to 9 years
10 to 19 years
20 or more years
1
1The category labeled general elementary classrooms includes all teachers of self-contained classrooms in the 1998 FRSS study, regardless ofinstructional level. Almost all (95 percent) of the self-contained classrooms were at the elementary school level.
SOURCE: U.S. Department of Education, National Center for Education Statistics, Fast Response Survey System, Teacher Survey onProfessional Development and Training, 1998.
Figure 4.—Percent of full-time public school teachers in general elementary classrooms anddepartmentalized settings with a regular or standard state certificate or advancedprofessional certificate, by teaching experience: 1993-94
73
66
9286
9794
9996
0
20
40
60
80
100
Self-contained classrooms Departmentalized setting: Main teaching assignment
Percent
3 or fewer years
4 to 9 years
10 to 19 years
20 or more years
1The category labeled general elementary classrooms includes teachers in the 1993-94 SASS study who indicated that their main teachingassignment was general elementary.
2The category labeled departmentalized settings includes teachers in the 1993-94 SASS study who indicated that their main teaching assignmentwas in English/language arts, social studies/social sciences, foreign language, mathematics, or science.
SOURCE: U.S. Department of Education, National Center for Education Statistics, 1993-94 Schools and Staffing Survey, unpublishedtabulations, 1998.

—16—
of experience compared to teachers with moreteaching experience. For example, in 1998, 12percent of general elementary classroom teacherswith 3 or fewer years of experience hademergency or temporary certification, whereasless than 1 percent of general elementaryclassroom teachers with 10 or more years ofexperience had emergency or temporarycertification (not shown in tables). The resultsare similar for departmentalized teachers.
Teaching Assignment:In-Field Teaching
The final measure of teacher preparation andqualifications addressed in this chapter is teachingassignment. Specifically, the FRSS surveymeasured the match between teachers’ trainingand teaching assignment in the main assignmentfield—in-field versus out-of-field teaching.According to Ingersoll (U.S. Department ofEducation, 1996b), one of the least recognizedcauses of underqualified teachers is the problemof out-of-field teaching: teachers being assignedto teach subjects that do not match their trainingor education. Findings from Ingersoll’s analysisof the 1990-91 Schools and Staffing Surveyshowed that nearly a third of all high school mathteachers had neither a major nor a minor inmathematics or mathematics education. Inaddition, almost a quarter of all high schoolEnglish teachers had neither a major nor a minorin English, literature, communications, speech,journalism, English education, or readingeducation (U.S. Department of Education,1996c). Thus, as Ingersoll concludes, a largepercentage of high school students were taught byteachers without basic qualifications in thesubjects they taught (Ingersoll, 1998).
The 1998 survey and the 1993-94 surveyprovided data on teaching assignment and teachereducation. Calculated the same way for both setsof data, a measure of in-field teaching wasconstructed to compare the fields in which full-time public school teachers had undergraduateand graduate majors and minors with the fields inwhich they had their main teaching assignments(i.e., the field in which they reported that they
taught the most courses).12 This measure wasconstructed for any teacher who taughtEnglish/language arts, foreign language, socialstudies/social science, mathematics, or science ina departmentalized setting in any of grades 7through 12. Results are presented separately forgrades 7 through 12 and grades 9 through 12,since there are different definitions of whatconstitutes secondary schooling. Because thequestionnaire collected information about degreesand teaching assignments at the aggregated fieldlevel (i.e., whether a teacher had degrees ortaught courses in science, rather than in chemistryor physics), the in-field teaching measure is alsoconstructed at this level of aggregation. Teacherswere defined as teaching in field if they had anundergraduate or graduate major or minor in thefield of their main teaching assignment. It isimportant to note that teachers may becomequalified to teach a subject in ways that are notmeasured by college majors and minors. Ateacher may take substantial coursework in a fieldwithout having an actual major or minor in thefield.13 Details of how the measure of in-fieldteaching was constructed are provided inappendix A.
The measure of in-field teaching that is presentedhere differs from some of the other measuresfrequently seen in publications on this subject.Measures usually focus on out-of-field teachingas a measure of the mismatch between teacherassignment and teacher education. For example,Ingersoll (U.S. Department of Education, 1996a)defined an out-of-field teacher as a teacherteaching one or more mathematics, science, socialstudies, or English classes without at least anundergraduate or graduate-level major or minor inthe particular subject. Another approach tostudying out-of-field teaching is to examine theproportion of students being taught by out-of-
12
A major or minor was considered in field if it was in either theacademic field (e.g., mathematics) or subject area education (e.g.,mathematics education) that matched the main teachingassignment.
13For example, in Pennsylvania, they award a “Master’s DegreeEquivalency Certificate” that is not the same as an “earnedmaster’s degree” (their wording), but is issued to qualify the holderfor salary increments provided by law. It requires 36 graduatesemester credits, at least half of which must be earned in thecontent area of the primary teaching assignment. This is as muchcoursework as may be required for a minor in a content area, yetthis coursework will not show up as a major or minor under earneddegrees, since the certificate is not considered a degree.

—17—
Table 5.—Percent of full-time public school teachers in grades 7 through 12 who reported havingan undergraduate or graduate major or minor in their main teaching assignment field,by selected school characteristics: 1998
School and teacher characteristicEnglish/
language artsForeign
language
Socialstudies/social
science
Mathematics Science
All targeted public school teachers1 ................... 86 96 89 82 88
LocaleCentral city ............................................................. 82 99 85 81 79Urban fringe/town/rural.......................................... 88 96 90 83 91
Percent minority enrollment in school50 percent or less.................................................... 87 96 90 84 90More than 50 percent.............................................. 83 # 86 76 81
Percent of students in school eligible for free orreduced-price school lunch
Less than 60 percent............................................... 89 96 89 86 9060 percent or more.................................................. 76 # 86 69 83
#Too few cases for a reliable estimate.1Targeted public school teachers were full-time public school teachers in grades 1 through 12 whose main teaching assignment was inEnglish/language arts, social studies/social sciences, foreign languages, mathematics, or science, or who taught a self-contained classroom.
SOURCE: U.S. Department of Education, National Center for Education Statistics, Fast Response Survey System, Teacher Survey onProfessional Development and Training, 1998.
field teachers. In this case, Ingersoll (U.S.Department of Education, 1996b) examined thepercentage of public secondary school studentsenrolled in 1990-91 in classes taught by teacherswithout at least a college minor in the field. Incontrast, the measure presented here looks at themain teaching assignments of teachers (i.e., thefield in which they taught the most courses).Because FRSS questionnaires are short anddesigned for quick response, information was notcollected at a detailed level about all the coursestaught. In addition, the relatively small samplesize of the FRSS survey precludes examination ofin-field teaching for the secondary teachingassignment, because too few teachers in thesample had a secondary teaching assignment toconduct these analyses.
While examination of in-field teaching in themain teaching assignment gives a generalindication of the magnitude of the match betweenteachers’ training and teaching assignment, itdoes not provide the entire picture, andunderstates the magnitude of the problem. Forexample, Bobbitt and McMillen (U.S.Department of Education, 1994b) found that if thefocus was restricted to main assignment fieldcontrasted against teachers’ college major or
minor and certification status, then almost allteachers were qualified to teach in their mainassignment field. However, if the focus waschanged to include all the classes taught by eachteacher, then many fewer teachers were fullyqualified to teach in each class subject they wereassigned to teach during the day. Thus, it isimportant to remember when reading the resultspresented below that the total magnitude of themismatch between teacher assignment andteacher education is greater than that shown bythe results for the main teaching assignment only.
In-Field Teaching Among Teachers inGrades 7 through 12
The percent of 1998 full-time public schoolteachers in grades 7 through 12 who reportedhaving an undergraduate or graduate major orminor in their main teaching assignment fieldranged from 82 percent of mathematics teachersto 96 percent of foreign language teachers (tables5 and B-7). Comparable data from 1993-94showed a somewhat similar distribution. Thepercent of the 1993-94 teachers in grades 7through 12 who reported having an under-graduate major or minor in their main teachingassignment field ranged from 77 percent of

—18—
Table 6.—Percent of full-time public school teachers in grades 7 through 12 who reported havingan undergraduate or graduate major or minor in their main teaching assignment field,by selected school characteristics: 1993-94
School and teacher characteristicEnglish/
language artsForeign
language
Socialstudies/social
science
Mathematics Science
All targeted public school teachers1 ................... 78 93 87 77 82
LocaleCentral city ............................................................. 78 96 89 76 83Urban fringe/town/rural.......................................... 78 92 86 77 82
Percent minority enrollment in school50 percent or less.................................................... 79 93 87 78 83More than 50 percent.............................................. 74 96 88 71 77
Percent of students in school eligible for free orreduced-price school lunch
Less than 60 percent............................................... 79 93 88 78 8360 percent or more.................................................. 70 95 81 70 75
1Targeted public school teachers were full-time public school teachers in grades 1 through 12 whose main teaching assignment was inEnglish/language arts, social studies/social sciences, foreign languages, mathematics, science, or general elementary.
SOURCE: U.S. Department of Education, National Center for Education Statistics, 1993-94 Schools and Staffing Survey, unpublishedtabulations, 1998.
mathematics teachers to 93 percent of the foreignlanguage teachers (tables 6 and C-7). In-fieldteaching for the main teaching assignment ingrades 7 through 12 was higher in the 1998 studythan in the 1993-94 study for English and science.
A key issue in the literature on equity concerns ineducational quality is the extent to which in-field/out-of-field teaching varies by certain schoolcharacteristics. Research has found that schoolswith factors such as a high concentration ofpoverty or location in an urban or central city areaare more likely than more affluent or suburbanschools to have higher rates of out-of-field-teaching (U.S. Department of Education, 1996b).The 1998 and 1993-94 data showed somevariations in the amount of in-field teaching in themain assignment field by these characteristics.The data in tables 5 and 6 are presenteddifferently than in other tables to allowcomparisons among schools by characteristicsoften targeted in equity research.
In 1998, differences by poverty concentration orpercent minority enrollment in the school in theprevalence of in-field teaching for mainassignment field were not statistically significantfor teachers in grades 7 through 12 (tables 5 andB-7). In-field teaching in science differed by
school locale for the 1998 teachers. Scienceteachers were somewhat less likely to be teachingin field in their main assignment field in schoolslocated in central cities than in schools located inurban fringe, town, or rural areas. The 1993-94data found that English/language arts teacherswere less likely to be teaching in field for theirmain assignment field in schools with the highestconcentration of poverty (as defined by 60percent or more of students eligible for free orreduced-price lunch) than were English teachersin schools where less than 60 percent of thestudents were eligible for free or reduced-pricelunch (tables 6 and C-7). No significantdifferences were found by locale or percentminority enrollment in the school for 1993-94teachers in grades 7 through 12.14
14
Because of the large standard errors surrounding the estimates ofin-field teaching broken out by school characteristics (because ofthe small number of teachers in each category in the 1998 survey),differences that may appear large may not be statisticallysignificant. In contrast, the sample of teachers in the 1993-94survey is much larger than it is in the 1998 survey, the standarderrors surrounding the 1993-94 estimates are smaller, and,therefore, smaller differences by school characteristics will bestatistically significant for the 1993-94 teachers.

—19—
Table 7.—Percent of full-time public school teachers in grades 9 through 12 who reported havingan undergraduate or graduate major or minor in their main teaching assignment field,by selected school characteristics: 1998
School and teacher characteristicEnglish/
language artsForeign
language
Socialstudies/social
science
Mathematics Science
All targeted public school teachers1 ................... 96 96 96 90 94
LocaleCentral city ............................................................. 94 100 96 88 90Urban fringe/town/rural.......................................... 97 95 96 90 96
Percent minority enrollment in school50 percent or less.................................................... 97 96 96 92 95More than 50 percent.............................................. 94 # 97 82 92
Percent of public school students in school eligiblefor free or reduced-price school lunch
Less than 60 percent............................................... 96 96 96 91 9460 percent or more.................................................. 93 # # 81 #
#Too few cases for a reliable estimate.1Targeted public school teachers were full-time public school teachers in grades 1 through 12 whose main teaching assignment was inEnglish/language arts, social studies/social sciences, foreign languages, mathematics, or science, or who taught a self-contained classroom.
SOURCE: U.S. Department of Education, National Center for Education Statistics, Fast Response Survey System, Teacher Survey onProfessional Development and Training, 1998.
In-Field Teaching Among Teachersin Grades 9 through 12
In-field teaching was also examined separatelyfor teachers in grades 9 through 12, since thereare different definitions of what constitutessecondary schooling. The percent of 1998 full-time public school teachers in grades 9 through12 who reported having a major or minor in theirmain teaching assignment fields was 90 percentfor mathematics teachers, 94 percent for scienceteachers, and 96 percent for teachers ofEnglish/language arts, foreign language, andsocial studies/social science (tables 7 and B-8).Comparable 1993-94 data showed a somewhatsimilar distribution. The percent of 1993-94teachers who reported having a major or minor intheir main teaching assignment fields ranged from87 percent of mathematics teachers to 93 percentof the foreign language teachers (tables 8 andC-8). In-field teaching for the main assignmentfield in grades 9 through 12 was higher in the1998 study than in the 1993-94 study for English,social studies, and science. In addition, for both
1998 and 1993-94, the percent of teachers whoreported having an undergraduate or graduatemajor or minor in their main teaching assignmentfield was significantly lower for teachers ofgrades 7 through 12 than for teachers of grades 9through 12 for mathematics, science, English/language arts, and social studies/social sciences,indicating that teachers in grades 7 and 8 are lesslikely to be teaching in field than are teachers ingrades 9 through 12.
Differences by poverty concentration, locale, orpercent minority enrollment in the school in theprevalence of in-field teaching for main teachingassignment were not statistically significant for1998 teachers in grades through 9 through 12.Mathematics teachers in 1993-94 were less likelyto be teaching in field in their main assignmentarea in schools with the highest minorityenrollment. No significant differences werefound by locale or poverty concentration in theschool for 1993-94 teachers in grades 9 through12.

—20—
Table 8.—Percent of full-time public school teachers in grades 9 through 12 who reported havingan undergraduate or graduate major or minor in their main teaching assignment field,by selected school characteristics: 1993-94
School and teacher characteristicEnglish/
language artsForeign
language
Socialstudies/social
science
Mathematics Science
All targeted public school teachers1 ................... 88 93 92 87 90
LocaleCentral city ............................................................. 86 96 94 84 90Urban fringe/town/rural.......................................... 88 93 91 87 90
Percent minority enrollment in school50 percent or less.................................................... 88 93 91 88 90More than 50 percent.............................................. 87 95 94 80 87
Percent of students in school eligible for free orreduced-price school lunch
Less than 60 percent............................................... 87 93 92 87 9060 percent or more.................................................. 89 95 90 83 91
1Targeted public school teachers were full-time public school teachers in grades 1 through 12 whose main teaching assignment was inEnglish/language arts, social studies/social sciences, foreign languages, mathematics, science, or general elementary.
SOURCE: U.S. Department of Education, National Center for Education Statistics, 1993-94 Schools and Staffing Survey, unpublishedtabulations, 1998.
Summary
This chapter on preservice learning and teachingassignment began with a description of theconcerns and critiques of the current trainingreceived by prospective teachers. Criticismsfocused on three features of their training andplacement—teachers’ education, certification,and teaching assignment. In many ways, thisreport does not address the heart of thesecritiques—the quality of the teacher educationprograms that train teachers. This report is aboutteachers, not the programs and institutions thattrain them. However, this study did investigatethree basic concerns that have received growingattention—that teachers do not have academicmajors, that many teachers may not be fullycertified, and that a large number of educators areteaching subjects for which they have notreceived training.
The 1998 study found that 38 percent of theteachers had an undergraduate or graduate majorin an academic field. Among high schoolteachers, however, the percentages were muchhigher, with two-thirds of high school teachershaving majored in an academic field. However,only 22 percent of elementary school teachers had
majored in an academic field. These findingsparalleled those from 1993-94, where the samepatterns emerged. In addition, the 1998 and1993-94 studies indicated that most teachers werefully certified (with a regular or standard statecertificate, or an advanced professionalcertificate) in the field of their main teachingassignment. Not surprisingly, however, results ofthe 1998 and 1993-94 surveys indicated that newteachers were less likely than more experiencedteachers to have regular certification.
Results of the 1998 survey suggest that teacherspossess many of the basic prerequisites forteaching—advanced degrees and the appropriatecertification and education. Most teachers ingrades 7 through 12 have a major or minor intheir main teaching assignment field. Assuggested earlier, teaching is complex, and thedemands continue to change and grow. Meetingthese challenges requires teachers to be lifelonglearners. Much of their learning, after initialpreservice training, takes place on the job. Thistype of learning is the focus of the next chapter ofthis report.

—21—
3. CONTINUED LEARNING
Teachers’ continued learning is the second featureof teacher preparation and qualificationsaddressed in this report. Continued learning isparticularly important because the nation’sschools have been increasingly challenged bypolicy initiatives to “do better, and to dodifferently” (McLaughlin and Oberman 1996: iv).At the core of educational reforms to raisestandards, reshape curricula, and restructure theway schools operate is the call to reconceptualizethe practice of teaching (Darling-Hammond andMcLaughlin, 1996). American children need abroader range of skills, including higher orderthinking skills and technological expertise.Teachers must learn to teach students in ways thatpromote such skills. At the same time, teachersface the greater challenges of rapidly increasingtechnological changes, greater diversity in theclassroom, and a push to teach in innovative ways(often different from how they were taught and/orfrom the formal preservice training theyreceived).
In order to meet the changing demands of theirjobs, high-quality teachers must be capable andwilling to continually learn and relearn theirtrade. This learning begins prior to entering theclassroom (as discussed in the previous section).However, beginning teachers are often not fullyprepared for the requirements of classroomteaching (Fullan with Stiegelbauer, 1991).Continued learning, the second aspect of teacherpreparation and qualifications addressed in thisreport, is key to building educators’ capacity foreffective teaching, particularly in a professionwhere the demands are changing and expanding.Continued learning takes multiple forms; the twokey forms discussed here are formal professionaldevelopment and collaboration with otherteachers.
Formal ProfessionalDevelopment
The first aspect of continued learning, formalprofessional development, is included in the
National Education Goals; Goal 4 states: “By theyear 2000, the nation’s teaching force will haveaccess to programs for the continuedimprovement of their professional skills and theopportunity to acquire the knowledge and skillsneeded to instruct and prepare all Americanstudents for the next century.” The inclusion of anational goal for teacher professional develop-ment represents an increased focus onprofessional development as an important vehiclefor school reform and educational excellence(Sprinthall, Reiman, and Theis-Sprinthall, 1996).Some schools and school districts require teachersto participate, and certain states have passedinitiatives encouraging or mandating certain typesof professional development. In addition, someteachers actively seek their own opportunities forprofessional development. For example, collegecoursework completed after a teacher has startedteaching is one form of professional development.However, access to professional developmentactivities may vary widely among teachers; forexample, there may be more opportunities forparticipation in districts located in closeproximity to a university or college.
Formal professional development typicallyconsists of school and district “staff-development” programs. Teachers often attendclasses sponsored by their districts and attendworkshops, conferences, and summer institutes.Workshops and conferences are the most typicalform of continuing professional development.They are usually designed to meet short-termgoals of implementing specific instructionalchange, such as the integration of technology intoclassroom teaching.
However, these traditional approaches toprofessional development (e.g., workshops,conferences) have been criticized for beingrelatively ineffective because they are usuallyshort term; they lack continuity through adequatefollowup and ongoing feedback from experts;they are typically isolated from the participants’classroom and school contexts; and they take apassive approach to training teachers, allowinglittle opportunity to learn by doing and reflecting

—22—
with colleagues. A core argument is that unlessprofessional development programs are carefullydesigned and implemented to provide continuitybetween what teachers learn and what goes on intheir classrooms and schools, these activities arenot likely to produce any long-lasting effects oneither teacher competence or student outcomes(Fullan with Stiegelbauer, 1991). In other words,as traditionally practiced, professional develop-ment activities may lack connection to thechallenges teachers face in their classrooms.
In order to investigate such issues, the 1998survey elicited information from teachersregarding their recent participation in professionaldevelopment programs in each of eight contentareas (see figure 5). Because of changes intechnology, in the notions of effective teaching,and in the types of students and students’ needsteachers encounter in their classrooms, the surveyelicited information regarding teachers’ formalprofessional development in such areas astechnology, new methods of teaching, state ordistrict curriculum or performance standards, andaccommodating students with disabilities or fromdiverse linguistic or cultural backgrounds.Because there is a good deal of skepticismregarding the value of formal professionaldevelopment for teachers’ work, the survey alsorequested information regarding the extent towhich teachers’ felt that these opportunitiesimproved their teaching. Moreover, becauselimited exposure is one of the criticisms launchedat traditional forms of professional development,the survey also asked teachers to indicate theduration of their exposure to differentprofessional development opportunities (i.e., timespent on particular activities). The data indicatethat teacher participation in professionaldevelopment in 1998 was high: almost all of theteachers surveyed in 1998 (99 percent) hadparticipated in professional developmentprograms in at least one of the listed content areasin the last 12 months (not shown in tables).
Teachers in the 1993-94 survey were also askedabout their participation in professionaldevelopment programs in the past 12 months.However, the survey covered five content areas:methods of teaching their subject field, studentassessment, cooperative learning in theclassroom, uses of education technology forinstruction, and in-depth study in their subjectfield (see figure 6). The data also indicate that an
overwhelming majority of teachers (90 percent)participated in professional developmentactivities during 1993-94 (not shown in tables).
Content of Professional Development
In 1998, teachers were more likely to haveparticipated in professional developmentactivities that appear consistent with the emphasisof education reform to do things differently andbetter (figure 5). Teachers were more likely tohave participated in implementing state or districtcurriculum and performance standards(81 percent), integrating educational technologyinto the grade or subject taught (78 percent),implementing new teaching methods (77 percent),doing in-depth study in the subject area of theirmain teaching assignment (73 percent), and usingstudent performance assessment techniques(67 percent) than in other areas. About half hadparticipated in professional development inclassroom management and addressing the needsof students with disabilities. One exception tothis pattern is participation in professionaldevelopment programs that addressed the needsof students with limited English proficiency orfrom diverse cultural backgrounds; teachers wereleast likely to have participated in these activities(31 percent).
In 1993-94, teachers were most likely to haverecent professional development that appears toemphasize pedagogical skills; 67 percent ofteachers had professional development onmethods of teaching in their subject field (figure6). Fewer teachers had any recent professionaldevelopment in student assessment (55 percent),cooperative learning (53 percent), and uses ofeducational technology for instruction(51 percent). Teachers were least likely toparticipate in in-depth study in their subject field(29 percent).
In addition to other issues, addressing the needsof students with limited English proficiency orfrom culturally diverse backgrounds has recentlybecome a central concern mainly because ofgrowing student populations with thesebackgrounds. Therefore, teacher training to meetthese needs might be particularly important toschools with large minority student populations.In 1998, teacher participation in professional

—23—
Figure 5.—Percent of full-time public school teachers who participated in professional developmentactivities in the last 12 months that focused on various topics: 1998
81 78 7773
67
49 48
31
0
20
40
60
80
100
State or district
curriculum and
performancestandards
Integration ofeducational
technology inthe grade orsubject you
teach
New methods
of teaching(e.g.,
cooperativelearning)
In-depthstudy in thesubject areaof your main
teachingassignment
Studentperformanceassessment
Classroommanagement,
includingstudent
discipline
Addressing the needs ofstudents with
disabilities
Addressingthe needs ofstudents with
limitedEnglish
proficiency orfrom diverse
culturalbackgrounds
Percent
SOURCE: U.S. Department of Education, National Center for Education Statistics, Fast Response Survey System, Teacher Survey onProfessional Development and Training, 1998.
Figure 6.—Percent of full-time public school teachers who participated in professional developmentactivities since the end of the last school year that focused on various topics: 1993-94
67
55 53 51
29
0
20
40
60
80
100
Methods ofteaching yoursubject field
Student assessment
Cooperative learning in the
classroom
Uses of educational
technology for instruction
In-depth study in your subject
field
Percent
SOURCE: U.S. Department of Education, National Center for Education Statistics, 1993-94 Schools and Staffing Survey, unpublishedtabulations, 1998.

—24—
Figure 7.—Percent of full-time public school teachers who participated in professional developmentactivities in the last 12 months that addressed the needs of students with limited Englishproficiency or from diverse cultural backgrounds, by percent minority enrollment inthe school: 1998
14
2934
51
0
20
40
60
80
100
5 percent or less 6 to 20 percent 21 to 50 percent More than 50percent
Percent minority enrollment in the school
Percent
SOURCE: U.S. Department of Education, National Center for Education Statistics, Fast Response Survey System, Teacher Survey onProfessional Development and Training, 1998.
development programs that focused on limitedEnglish proficient or culturally diverse studentsgenerally increased with the percent minorityenrollment in the school (figure 7). For example,teachers from schools with more than 50 percentminority enrollment were much more likely thanthose who taught in schools with 5 percent or lessminority enrollment to participate in professionaldevelopment programs on this topic (51 versus 14percent).
Participation in professional development inprograms that addressed the needs of limitedEnglish proficient and culturally diverse studentsalso varied by region (figure 8). For example,teachers in the West were far more likely thanteachers in the South to have had training in thiscontent area (51 versus 33 percent). Further,teachers in the South were more likely toparticipate in these programs than those in theMidwest or Northeast.
Professional Development andTeaching Experience
In an era of education reform, continuingprofessional development is equally relevant for
both new and experienced teachers as manyaspects of teaching may be changing. Teacherparticipation in professional development may beinfluenced by several factors: personalmotivation, school or district requirement, andstate initiatives requiring or encouraging certaintypes of professional development. Moreover,while certain kinds of on-the-job training, such asclassroom management and curriculumdevelopment, may be more relevant to the needsof new teachers than experienced teachers, thosewho have taught for many years may have agreater need to upgrade their skills in the use ofeducational technology. It is, therefore, useful toexamine whether teaching experience makes adifference to participation in professionaldevelopment in various content areas.
The data suggest that teaching experience makeslittle difference to teacher participation inprofessional development in most of the contentareas. One area in which teaching experiencewas, however, clearly related to teacherparticipation in professional development wasclassroom management, including studentdiscipline. The likelihood of participating inprofessional development programs that focusedon classroom management generally decreased

—25—
Figure 8.—Percent of full-time public school teachers who participated in professional developmentactivities in the last 12 months that addressed the needs of students with limited Englishproficiency or from diverse cultural backgrounds, by region: 1998
22 22
33
51
0
20
40
60
80
100
Northeast Midwest South West
Region
Percent
SOURCE: U.S. Department of Education, National Center for Education Statistics, Fast Response Survey System, Teacher Survey onProfessional Development and Training, 1998.
Table 9.—Percent of full-time public school teachers who participated in professional developmentactivities in the last 12 months in various content areas, by teaching experience: 1998
Teaching experienceContent area 3 or fewer
years4 to 9years
10 to 19years
20 or moreyears
State or district curriculum and performance standards ......................... 78 84 84 80Integration of educational technology in the grade or subject you teach 72 79 79 79New methods of teaching (e.g., cooperative learning) ........................... 82 79 78 73In-depth study in the subject area of your main teaching assignment .... 77 78 74 67Student performance assessment............................................................ 66 72 69 64Classroom management, including student discipline............................ 65 53 46 43Addressing the needs of students with disabilities ................................. 49 47 50 46Addressing the needs of students with limited English proficiency or
from diverse cultural backgrounds ..................................................... 36 34 36 25
SOURCE: U.S. Department of Education, National Center for Education Statistics, Fast Response Survey System, Teacher Survey onProfessional Development and Training, 1998.
with years of teaching experience (table 9). Forexample, in 1998, teachers with 3 or fewer yearsexperience were more likely than moreexperienced teachers to participate in such aprogram, and those with 4 to 9 years experiencewere more likely to do so than those who taughtfor 10 or more years.
In some other areas, teacher participation inprofessional development differed between theleast experienced teachers and those who were
very experienced (table 9). For example, in 1998,teachers with 3 or fewer years of experience weremore likely than those who had taught for 20 ormore years to participate in programs thataddressed new methods of teaching (82 versus 73percent). Newer teachers were also more likelythan very experienced teachers to haveparticipated in professional development on in-depth study in the subject area of the mainteaching assignment (77 versus 67 percent).Moreover, most experienced teachers (20 or more
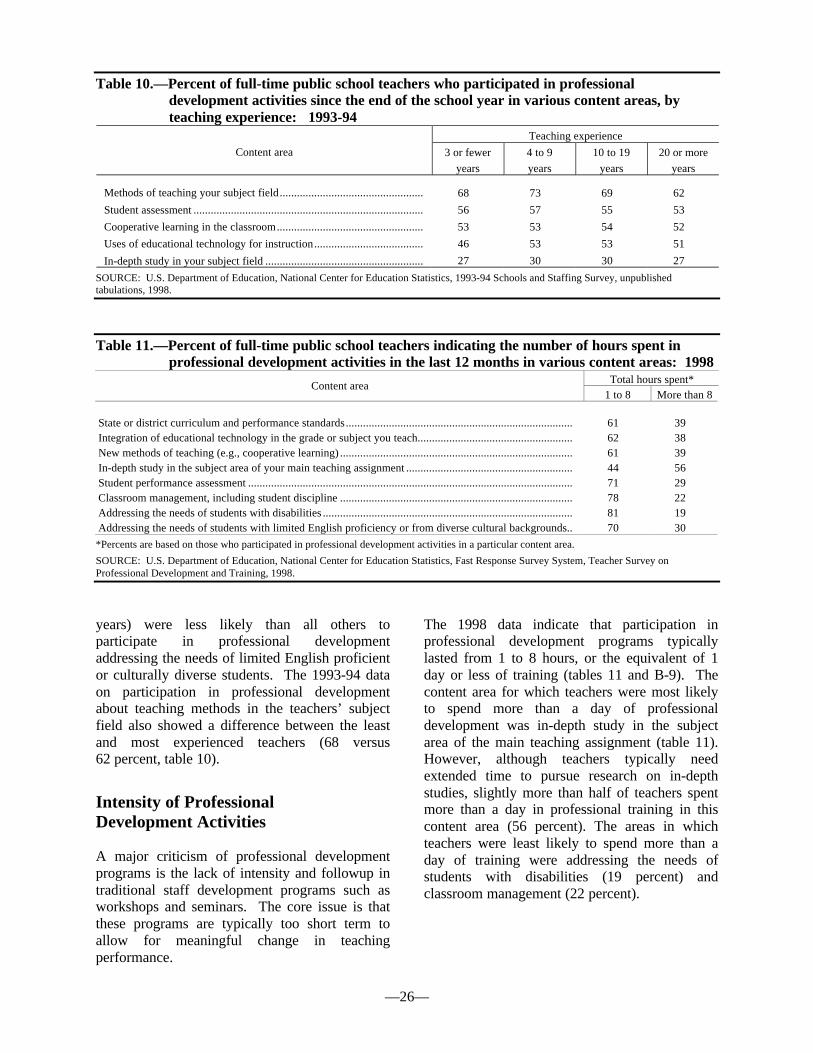
—26—
Table 10.—Percent of full-time public school teachers who participated in professionaldevelopment activities since the end of the school year in various content areas, byteaching experience: 1993-94
Teaching experience
Content area 3 or fewer
years
4 to 9
years
10 to 19
years
20 or more
years
Methods of teaching your subject field.................................................. 68 73 69 62
Student assessment ................................................................................ 56 57 55 53
Cooperative learning in the classroom................................................... 53 53 54 52
Uses of educational technology for instruction...................................... 46 53 53 51
In-depth study in your subject field ....................................................... 27 30 30 27
SOURCE: U.S. Department of Education, National Center for Education Statistics, 1993-94 Schools and Staffing Survey, unpublishedtabulations, 1998.
Table 11.—Percent of full-time public school teachers indicating the number of hours spent inprofessional development activities in the last 12 months in various content areas: 1998
Total hours spent*Content area
1 to 8 More than 8
State or district curriculum and performance standards............................................................................... 61 39Integration of educational technology in the grade or subject you teach...................................................... 62 38New methods of teaching (e.g., cooperative learning) ................................................................................. 61 39In-depth study in the subject area of your main teaching assignment .......................................................... 44 56Student performance assessment ................................................................................................................. 71 29Classroom management, including student discipline ................................................................................. 78 22Addressing the needs of students with disabilities ....................................................................................... 81 19Addressing the needs of students with limited English proficiency or from diverse cultural backgrounds.. 70 30
*Percents are based on those who participated in professional development activities in a particular content area.
SOURCE: U.S. Department of Education, National Center for Education Statistics, Fast Response Survey System, Teacher Survey onProfessional Development and Training, 1998.
years) were less likely than all others toparticipate in professional developmentaddressing the needs of limited English proficientor culturally diverse students. The 1993-94 dataon participation in professional developmentabout teaching methods in the teachers’ subjectfield also showed a difference between the leastand most experienced teachers (68 versus62 percent, table 10).
Intensity of ProfessionalDevelopment Activities
A major criticism of professional developmentprograms is the lack of intensity and followup intraditional staff development programs such asworkshops and seminars. The core issue is thatthese programs are typically too short term toallow for meaningful change in teachingperformance.
The 1998 data indicate that participation inprofessional development programs typicallylasted from 1 to 8 hours, or the equivalent of 1day or less of training (tables 11 and B-9). Thecontent area for which teachers were most likelyto spend more than a day of professionaldevelopment was in-depth study in the subjectarea of the main teaching assignment (table 11).However, although teachers typically needextended time to pursue research on in-depthstudies, slightly more than half of teachers spentmore than a day in professional training in thiscontent area (56 percent). The areas in whichteachers were least likely to spend more than aday of training were addressing the needs ofstudents with disabilities (19 percent) andclassroom management (22 percent).

—27—
Table 12.—Percent of full-time public school teachers indicating the number of hours spent inprofessional development activities since the end of the last school year in variouscontent areas: 1993-94
Total hours spent*Content area
1 to 8 More than 8
Methods of teaching your subject field........................................................................................................ 57 43
Student assessment ...................................................................................................................................... 78 22
Cooperative learning in the classroom......................................................................................................... 73 27
Uses of educational technology for instruction............................................................................................ 70 30
In-depth study in your subject field ............................................................................................................. 49 51
*Percents are based on those who participated in professional development activities in a particular content area.
SOURCE: U.S. Department of Education, National Center for Education Statistics, 1993-94 Schools and Staffing Survey, unpublishedtabulations, 1998.
Table 13.—Percent of full-time public school teachers who participated in professionaldevelopment activities in the last 12 months indicating the extent to which they believethe activity improved their teaching: 1998
Improved classroom teachingContent area
A lot Moderately Somewhat Not at all
State or district curriculum and performance standards ......................... 12 36 39 13Integration of educational technology in the grade or subject you teach 21 38 34 6New methods of teaching (e.g., cooperative learning) ........................... 22 42 31 4In-depth study in the subject area of your main teaching assignment .... 28 44 26 2Student performance assessment............................................................ 17 39 38 6Classroom management, including student discipline............................ 19 39 35 7Addressing the needs of students with disabilities ................................. 14 36 44 6Addressing the needs of students with limited English proficiency or
from diverse cultural backgrounds ..................................................... 18 34 40 9
NOTE: Percents are computed across each row, but may not sum to 100 because of rounding.
SOURCE: U.S. Department of Education, National Center for Education Statistics, Fast Response Survey System, Teacher Survey onProfessional Development and Training, 1998.
Teacher participation in professional developmentin 1993-94 was also likely to be short term,typically lasting from 1 to 8 hours (tables 12 andC-9). Moreover, the content area for whichteachers were most likely to spend more than aday of training was in-depth study in the subjectarea of the main teaching assignment. Teacherswere least likely to spend more than a day ofprofessional development on student assessment(22 percent), cooperative learning in theclassroom (27 percent), and uses of educationaltechnology for instruction (30 percent).
Perceived Impact ofProfessional Development
Since the rationale behind professional programsis to provide the forum for teachers to upgradetheir knowledge, skills, and practices, it is usefulto assess the extent to which participation in these
activities helped teachers to achieve theseobjectives. To gauge the perceived impact ofprofessional development programs, the 1998survey asked teachers to assess the extent towhich their participation in programs in aparticular content area improved their teaching.Of those teachers who participated in programs ina particular area, the extent to which theybelieved it improved their teaching “a lot” rangedfrom 28 percent for in-depth study to 12 percentfor implementing state or district curriculum andperformance standards (tables 13 and B-10). Fewteachers indicated that a program did not help atall. For every program, 70 to 80 percent of theteachers reported that it was moderately orsomewhat effective. For example, for theprogram that ranked highest in its perceivedimpact (in-depth study in the subject area of themain teaching assignment), 70 percent of teachersbelieved that participation improved their

—28—
Table 14.—Percent of full-time public school teachers who participated in professionaldevelopment activities in the last 12 months indicating that the activity improved theirteaching a lot, by teaching experience: 1998
Teaching experienceContent area 3 or fewer
years4 to 9years
10 to 19years
20 or moreyears
State or district curriculum and performance standards ......................... 12 12 14 11Integration of educational technology in the grade or subject you teach 19 23 23 21New methods of teaching (e.g., cooperative learning) ........................... 24 24 23 21In-depth study in the subject area of your main teaching assignment .... 33 31 28 26Student performance assessment............................................................ 20 16 18 17Classroom management, including student discipline............................ 28 18 17 16Addressing the needs of students with disabilities ................................. 18 13 15 13Addressing the needs of students with limited English proficiency or
from diverse cultural backgrounds ..................................................... 18 17 17 18
SOURCE: U.S. Department of Education, National Center for Education Statistics, Fast Response Survey System, Teacher Survey onProfessional Development and Training, 1998.
teaching moderately (44 percent) or somewhat(26 percent).
Teachers’ perceptions about how muchparticipation in various professional developmentprograms improved their teaching were examinedagainst years of teaching experience. For most ofthe 1998 content areas, teaching experience wasnot related to teachers’ perception thatparticipation in that content area improved theirteaching “a lot.” The one area in which teachingexperience clearly was related was classroommanagement. Newer teachers were more likelythan more experienced teachers to report thatprofessional development in classroommanagement improved their teaching “a lot”(tables 14 and B-10).
A criticism of short-term professionaldevelopment programs is that they fail to bringabout more long-term change in teachers’competencies for classroom teaching. To furtherassess the impact of professional developmentprograms, the 1998 data were explored toexamine whether the amount of time spent inprofessional development activities made adifference to perceived teaching improvement.
The number of hours teachers participated inprofessional development programs was relatedto how much they believed it improved theirclassroom teaching (table 15). For every contentarea, teachers who participated for more than 8hours believed it improved their teaching morethan teachers who participated for 8 hours or less.
For example, teachers who spent more than 8hours in professional development on newmethods of teaching in the classroom were morelikely than those who spent 1 to 8 hours to reportthat participation in the program improved theirteaching “a lot” (39 versus 12 percent). Thesepatterns suggest that increased time spent inprofessional development is associated with theperception of significant improvements inteaching.
Collaboration withOther Teachers
Collaboration with other teachers is the secondfeature of teachers’ continued learning addressedin this report. Unlike traditional professionaldevelopment activities, peer collaboration hasbeen heralded by teachers, researchers, andpolicymakers as essential to teachers’ continuouslearning. Initiatives to improve the quality andefficacy of continued learning emphasize thedevelopment of learning communities within andacross schools and highlight the importance ofthese mechanisms to foster teacher learning.
Opportunities for collaboration include those thatare provided within the school and those thatoccur within professional networks across schoolsand other institutional structures. Teacherparticipation in school-based activities is likely toproduce positive and long-lasting change becausesuch activities provide the basis for

—29—
Table 15.—Percent of full-time public school teachers indicating the extent to which participationin professional development activities in various content areas improved theirclassroom teaching, by the number of hours spent in professional development in thatcontent area in the last 12 months: 1998
Improved my teachingContent area
A lot Moderately Somewhat Not at all
State or district curriculum and performance standards1 to 8 hours............................................................................................ 7 34 44 15More than 8 hours ................................................................................. 20 39 31 10
Integration of educational technology in the grade or subject you teach1 to 8 hours............................................................................................ 12 36 44 8More than 8 hours ................................................................................. 38 43 17 2
New methods of teaching (e.g., cooperative learning)1 to 8 hours............................................................................................ 12 43 40 6More than 8 hours ................................................................................. 39 41 18 2
In-depth study in the subject area of your main teaching assignment1 to 8 hours............................................................................................ 12 47 38 3More than 8 hours ................................................................................. 41 41 17 1
Student performance assessment1 to 8 hours............................................................................................ 10 37 45 7More than 8 hours ................................................................................. 35 41 20 3
Classroom management, including student discipline1 to 8 hours............................................................................................ 13 39 40 8More than 8 hours ................................................................................. 40 41 14 5
Addressing the needs of students with disabilities1 to 8 hours............................................................................................ 8 37 49 7More than 8 hours ................................................................................. 42 32 23 3
Addressing the needs of students with limited English proficiency orfrom diverse cultural backgrounds
1 to 8 hours............................................................................................ 9 34 47 10More than 8 hours ................................................................................. 38 34 23 5
NOTE: Percents are computed across each row, but may not sum to 100 because of rounding.
SOURCE: U.S. Department of Education, National Center for Education Statistics, Fast Response Survey System, Teacher Survey onProfessional Development and Training, 1998.
transformative learning. Such collaborationrevolves around joint work and teacher networks.Joint work such as team teaching, mentoring, andformally planned meetings are importantmechanisms for productive exchange of ideas andreflection about practice. For instance, the focuson specific subject matter and teaching strategieshelps teachers to improve their contentknowledge and pedagogical skills. Mentoring isan effective mechanism for one-to-oneprofessional guidance and for cultivating ateaching culture in which expert teachers serve asan essential resource for new teachers. All ofthese teaching-related activities are consistentwith the view of professional development as alifelong, inquiry-based collegial process rooted inthe development of schools as collaborativeworkplaces.
Collaborative relationships may extend beyondclassrooms and school buildings to school-university collaborations or partnerships, teacher-to-teacher and school-to-school networks, andparticipation in district, regional, or national taskforces. These communities can be organizedacross subject matter, pedagogical issues, andsignificant school reforms. These networks canbe powerful learning tools to engageprofessionals in collective work and allowteachers to go beyond their own classrooms andschools to engage in professional discourse abouttheir own experiences and the experiences ofothers.

—30—
Figure 9.—Percent of full-time public school teachers who participated in various activities relatedto teaching in the last 12 months: 1998
81
62 6153
2619
0
20
40
60
80
100
Regularlyscheduled
collaborationwith otherteachers
Commonplanning period
for teamteachers
Networkingwith teachersoutside your
school
Individual orcollaborative
research
Mentoringanother teacher
in a formalrelationship
Being mentored by anotherteacher in a
formalrelationship
Percent
SOURCE: U.S. Department of Education, National Center for Education Statistics, Fast Response Survey System, Teacher Survey onProfessional Development and Training, 1998.
Participation in Collaborative Activities
To provide a national profile of teachers’ peercollaboration, the 1993-94 survey asked teachersabout their participation in the last 12 months invarious mentoring and collaborating activitiesrelated to teaching, and the extent to which theyfelt each of these activities improved theirteaching. These activities were:
n A common planning period for teamteachers;
n Regularly scheduled collaboration withother teachers, excluding meetings held foradministrative purposes;
n Being mentored by another teacher in aformal relationship;
n Mentoring another teacher in a formalrelationship;
n Networking with teachers outside yourschool; and
n Individual or collaborative research on atopic of interest to you professionally.
Almost all (95 percent) of the teachers hadparticipated in at least one of the listed activitiesin the last 12 months (not shown in tables).Regularly scheduled collaboration with otherteachers was the activity in which teachers weremost likely to have participated, with four out offive teachers reporting such collaborations in thelast 12 months (figure 9). About 60 percent ofthe teachers had participated in common planningperiods for team teachers and networking withteachers outside the school, and about halfreported involvement in individual orcollaborative research.15
Mentoring can be an important way for teachersto share information and experiences aboutteaching in a one-on-one relationship. Suchrelationships may be particularly useful to newteachers as they seek to develop effectiveteaching practices. The study found that about aquarter of the teachers indicated that they hadmentored another teacher in a formal relationshipin the last 12 months, and 19 percent said thatthey had been mentored by another teacher in
15
While this section deals with teacher collaboration, individual orcollaborative research is discussed here because the item wasincluded in the set of questions that asked about collaborativeactivities.

—31—
Figure 10.—Percent of full-time public school teachers who participated in mentoring activities inthe last 12 months, by teaching experience: 1998
58
12
2125
12
32
9
27
0
20
40
60
80
100
Being mentored by another teacher in a formal relationship
Mentoring another teacher in a formal relationship
Percent
3 or fewer years
4 to 9 years
10 to 19 years
20 or more years
SOURCE: U.S. Department of Education, National Center for Education Statistics, Fast Response Survey System, Teacher Survey onProfessional Development and Training, 1998.
such a relationship (figure 9). The relatively lowlevels of teacher participation in mentoring reflecta pattern in which newer teachers were morelikely than more experienced teachers to bementored. The likelihood of mentoring and ofbeing mentored by another teacher variedsubstantially by years of teaching experience(figure 10). Teachers with 3 or fewer years ofteaching experience were the most likely to havebeen mentored by another teacher in the last 12months and the least likely to have acted in therole of mentor to another teacher. In fact, almostthree out of five new teachers had been mentoredby another teacher in the last year, suggesting thatschools and/or teachers recognize the importanceof such relationships early in a teacher’s career.
Frequency of Participation
Teachers were also asked how frequently theyhad participated in the activities, within a range ofat least once a week to a few times a year; surveyresults showed considerable variation on thisdimension (table 16). Among teachers whoreported engaging in a particular activity, theyparticipated the most frequently in commonplanning periods for team teachers, with 60percent participating at least once a week. This
was followed by mentoring another teacher in aformal relationship (42 percent) and engaging inregularly scheduled collaboration with otherteachers (34 percent). While many teachers(61 percent) indicated that they had participatedin networking with other teachers outside theschool (figure 9), the frequency of this kind ofactivity was low; 60 percent of these teachersreported such interactions only a few times ayear.
Perceived Effect of Participation
Teachers who reported participating in an activitywere also asked to indicate the extent to whichthey believed the activity improved theirclassroom teaching. In general, participation inmost activities was perceived to improveclassroom teaching moderately or somewhat; fewteachers believed that participation in a particularactivity did not help their teaching at all (tables17 and B-12). Moreover, 40 percent of teacherswho had a common planning period for teamteachers believed that this opportunity improvedtheir classroom teaching a lot, while one-thirdreported experiencing similar benefits fromindividual or collaborative research, or frombeing mentored by another teacher.

—32—
Table 16.—Percent of full-time public school teachers who participated in activities related toteaching in the last 12 months, by frequency of participation: 1998
Frequency of participation*
Activity A few times
a year
Once a
month
2 to 3 times
a month
At least
once a week
Regularly scheduled collaboration with other teachers .......................... 23 21 22 34
Common planning period for team teachers........................................... 15 11 14 60
Networking with teachers outside your school....................................... 60 18 12 10
Individual or collaborative research on a topic of interest
professionally ..................................................................................... 48 16 18 19
Mentoring another teacher in a formal relationship................................ 29 12 17 42
Being mentored by another teacher in a formal relationship .................. 46 14 17 24
*Percents are based on those who participated in a particular activity related to teaching.
NOTE: Percents are computed across each row, but may not sum to 100 because of rounding.
SOURCE: U.S. Department of Education, National Center for Education Statistics, Fast Response Survey System, Teacher Survey onProfessional Development and Training, 1998.
Table 17.—Percent of full-time public school teachers who participated in various activities relatedto teaching in the last 12 months indicating the extent to which they believe the activityimproved their teaching: 1998
Improved classroom teachingActivity
A lot Moderately Somewhat Not at all
Regularly scheduled collaboration with other teachers .......................... 29 35 31 5
Common planning period for team teachers........................................... 40 33 23 4
Networking with teachers outside your school....................................... 23 33 41 4
Individual or collaborative research on a topic of interest
professionally ..................................................................................... 34 35 29 2
Mentoring another teacher in a formal relationship................................ 19 30 39 11
Being mentored by another teacher in a formal relationship .................. 34 27 32 7
NOTE: Percents are computed across each row, but may not sum to 100 because of rounding.
SOURCE: U.S. Department of Education, National Center for Education Statistics, Fast Response Survey System, Teacher Survey onProfessional Development and Training, 1998.
Being mentored by another teacher was not only amore frequent occurrence for beginning teachers,but it was generally perceived to be of morebenefit to their teaching as well. Among teacherswho had been mentored in the last 12 months, 45percent with 3 or fewer years of experiencebelieved it improved their teaching “a lot,”compared with 18 percent of teachers with 20 ormore years of teaching experience (figure 11 andtable B-12). This again suggests the importanceof such relationships early in a teacher’s career.In addition, more experienced teachers may bementored for different reasons and therefore maynot have the same experience with beingmentored.
Frequency of participation in a collaborativeactivity was generally positively related toteachers’ beliefs about the extent to which theactivity improved their classroom teaching (table18). For example, the extent to whichparticipation in a common planning period forteam teachers was perceived to improve teaching“a lot” ranged from 13 percent for those whoparticipated a few times a year to 52 percent forthose who were involved in the activity at leastonce a week. Thus, frequent participation in amentoring or collaborating activity was morelikely to lead to the perception of improvedclassroom teaching.

—33—
Figure 11.—Percent of full-time public school teachers indicating the extent to which beingmentored improved their classroom teaching, by teaching experience: 1998
45
26 25
5
3126
36
8
3228
35
5
18
27
39
15
0
20
40
60
80
100
A lot Moderately Somewhat Not at all
Improved classroom teaching
Percent
3 or fewer years
4 to 9 years
10 to 19 years
20 or more years
SOURCE: U.S. Department of Education, National Center for Education Statistics, Fast Response Survey System, Teacher Survey onProfessional Development and Training, 1998.
Summary
This chapter began with the premise that high-quality teachers are lifelong learners. Thisassumption is based on the recognition thatteaching is a complex profession with changingand growing demands. In order to meet thedemands they face in their classrooms, teachersmust be willing and capable to learn and relearntheir trade. Opportunities for continued learningaddressed in this chapter—formal professionaldevelopment and collaboration with otherteachers—are two key features of teacherlearning.
Results of the 1998 survey indicate that teacherparticipation in formal professional developmentis high; almost all teachers had recent training inat least one of the listed content areas. Moreover,teachers were more likely to have had recenttraining in programs that seem consistent with thechallenge to do things differently and better; theseprograms focused on topics such as theimplementation of state and district curricula, theintegration of technology into classroom
instruction, and the implementation of newteaching methods. However, in spite ofincreasing classroom diversity in our schools,teachers were least likely to have had recentprofessional development that addressed theneeds of limited English proficient or culturallydiverse students.
The data suggest that although continued learningis equally relevant for new and experiencedteachers, the specific needs for training in somecontent areas may vary by years of teachingexperience. For example, newer teachers weremore likely than very experienced teachers toparticipate in professional development thatfocused on classroom management and teachingmethods, reflecting a strong need for training onthese topics during the early years of teaching.
Teacher participation in professional developmentprograms was typically short, lasting for theequivalent of one day or less of training.Moreover, a key finding was that increased timespent in professional development was associatedwith the perception of significant improvementsin teaching. For every content area, teachers who

—34—
Table 18.—Percent of full-time public school teachers indicating the extent to which participationin activities related to teaching improved their classroom teaching, by the frequencywith which they participated in that activity in the last 12 months: 1998
Improved my teachingActivity
A lot Moderately Somewhat Not at all
Regularly scheduled collaboration with other teachers, excludingmeetings held for administrative purposes
A few times a year.............................................................................. 15 22 54 9Once a month ..................................................................................... 16 41 38 62 to 3 times a month ........................................................................... 26 46 25 3At least once a week........................................................................... 49 33 15 2
Common planning period for team teachersA few times a year.............................................................................. 13 29 47 11Once a month ..................................................................................... 26 38 29 72 to 3 times a month ........................................................................... 31 42 23 4At least once a week........................................................................... 52 31 16 2
Networking with teachers outside your schoolA few times a year.............................................................................. 15 29 51 5Once a month ..................................................................................... 24 39 34 22 to 3 times a month ........................................................................... 36 43 20 1At least once a week........................................................................... 49 31 18 3
Individual or collaborative research on a topic of interest to youprofessionally
A few times a year.............................................................................. 22 38 38 2Once a month ..................................................................................... 26 46 26 22 to 3 times a month ........................................................................... 46 31 21 2At least once a week........................................................................... 62 23 15 *
Mentoring another teacher in a formal relationshipA few times a year.............................................................................. 9 32 47 12Once a month ..................................................................................... 20 22 41 162 to 3 times a month ........................................................................... 15 34 40 11At least once a week........................................................................... 28 30 33 8
Being mentored by another teacher in a formal relationshipA few times a year.............................................................................. 11 25 50 13Once a month ..................................................................................... 31 39 23 72 to 3 times a month ........................................................................... 50 31 19 0At least once a week........................................................................... 70 18 11 1
*Less than 0.5 percent.
NOTE: Percents are computed across each row, but may not sum to 100 because of rounding.
SOURCE: U.S. Department of Education, National Center for Education Statistics, Fast Response Survey System, Teacher Survey onProfessional Development and Training, 1998.
participated for more than 8 hours were far morelikely than those who participated for fewer hoursto report that the activity improved their teaching.
Participation in collaborative activities was alsoperceived to yield positive outcomes forclassroom teaching. Most teachers felt thatcollaborative activities helped improve theirteaching to some degree. Moreover, thefrequency of participation in a collaborativeactivity was generally positively related toteachers’ beliefs about the extent to which theactivity improved their classroom teaching. For
example, 70 percent of teachers who werementored at least once a week reported that itimproved their teaching “a lot.”
Formal professional development andcollaboration with other teachers are importantfeatures of teacher learning. However, theseexperiences are most beneficial when coupledwith a supportive work environment. Teachers’work environment is the focus of the nextchapter.

—35—
4. SUPPORTIVE WORK ENVIRONMENT
Teachers’ work environment is the final aspect ofteacher quality addressed in this report. Themodel for thinking about teacher quality(presented in the introduction chapter) began withdifferent types of teacher learning and ended withthe support teachers receive to pursue continuedlearning. This model suggests that in addition toteacher learning (both preservice and continued),one key factor to understanding teacher quality isfocusing on what happens to teachers once theyenter the work force, including if they receivesupport from the schools and communities inwhich they work (e.g., induction programs fornew teachers and the number of students forwhom teachers are responsible) and from theparents of the children they teach.
Three features of teachers’ work environmentwere measured in the 1998 survey: (1) inductionprograms; (2) class size; and (3) teachers’perceptions of parent and school support.
Induction Programs
Formal induction programs, particularly for newteachers, are the first feature of teachers’ workenvironment investigated here. Inductionprograms are typically designed to both improveteaching skills of beginning teachers and reduceattrition. Providing support for beginningteachers in U.S. schools has been the focus ofincreasing attention since the mid-1980s, mainlybecause attrition rates among new teachers areoften much higher than among experiencedteachers. This suggests that the transition intoteaching is difficult for beginning teachers(Asian-Pacific Economic Cooperation, 1997).Often, new teachers are hired at the last minute,isolated in their classrooms, and provided littleassistance with their often overwhelming duties(Asian-Pacific Economic Cooperation, 1997).From a policy standpoint, induction may increasethe efficacy and retention of quality teachersbecause it has the potential to help new teacherscope with classroom realities and adjust to schoolenvironments. By providing continuity andsupport to beginning teachers’ transition into
teaching, induction programs may address acritical stage of the career-long continuum ofteacher professional development.
Comprehensive induction programs are often tiedto certification. In general, these programsemphasize instructional support in the form ofskills, knowledge, and strategies for effectiveclassroom teaching, and psychological support inthe form of encouraging confidence building(Gold, 1996). These initial experiences exert apowerful influence in anchoring new teachers’feelings and perceptions about their capabilitiesand future careers. Teacher participation in aninduction program is, therefore, a useful indicatorof the extent to which elementary and secondarypublic schools are addressing the issue of trainingand retaining quality teachers.
The 1998 survey asked teachers to indicate if,when they first began teaching, they participatedin a formal induction program (e.g., a program tohelp beginning teachers by assigning them tomaster or mentor teachers). Thirty-four percentof full-time public school teachers in the 1998study indicated that they had participated in sucha program (table B-13). The 1993-94 surveyasked a similar question and found that 28 percentof full-time public school teachers hadparticipated in an induction program during theirfirst year (table C-10). Participation in aninduction program varied considerably byteaching experience (figure 12 and table B-13).Newer teachers were more likely to haveparticipated in an induction program than weremore experienced teachers, ranging from 65percent of teachers with 3 or fewer years ofexperience to 14 percent of teachers with 20 ormore years of experience. The 1993-94 datashowed similar findings, with less experiencedteachers being more likely to have had a formalinduction into teaching than teachers with moreexperience (figure 13). Teachers with 3 or feweryears of experience were more likely to haveparticipated in an induction program in 1998 thanin 1993-94 (65 percent compared with 59percent), suggesting that there may be moreemphasis on induction programs in recent years.

—36—
Figure 12.—Percent of full-time public school teachers who participated in a formal inductionprogram when they first began teaching, by teaching experience: 1998
65
55
28
14
0
20
40
60
80
100
3 or fewer years 4 to 9 years 10 to 19 years 20 or more years
Teaching experience
Percent
SOURCE: U.S. Department of Education, National Center for Education Statistics, Fast Response Survey System, Teacher Survey onProfessional Development and Training, 1998.
Figure 13.—Percent of full-time public school teachers who participated in a formal inductionprogram during their first year of teaching, by teaching experience: 1993-94
59
47
17 16
0
20
40
60
80
100
3 or fewer years 4 to 9 years 10 to 19 years 20 or more years
Teaching experience
Percent
SOURCE: U.S. Department of Education, National Center for Education Statistics, 1993-94 Schools and Staffing Survey, unpublishedtabulations, 1998.

—37—
Figure 14.—Percent of full-time public school teachers indicating the length of the formal inductionprogram in which they participated when they first began teaching: 1998
12 10
66
12
0
20
40
60
80
100
3 months or less More than 3 monthsto 8 months
9 months to 1 year More than 1 year
Percent
SOURCE: U.S. Department of Education, National Center for Education Statistics, Fast Response Survey System, Teacher Survey onProfessional Development and Training, 1998.
Teachers in the 1998 study who participated in aninduction program were asked to write in thelength of that program. Two-thirds of theteachers indicated that they participated ininduction programs that lasted from 9 months to ayear (figure 14). Some of the induction programsin which teachers participated lasted more than ayear (12 percent of the teachers), while somewere quite short, lasting 3 months or less (also 12percent of the teachers). The remaining 10percent of the teachers participated in inductionprograms that were more than 3 months through 8months in length. Unfortunately, it is not possibleto determine the intensity or usefulness of theinduction program from its length. In fact,comments written in on the questionnaire bysome teachers indicated that some programs thatlasted for a year actually involved relatively littleinteraction with the master or mentor teacher towhom they were assigned, such as a few meetingsbetween the teachers over the course of the year.
Class Size
The second feature of the work environmentexamined in this report is class size. Reducingclass size is among President Clinton’s prioritiesas outlined in his Education and TrainingPriorities for the Fall (August 1998). Therelevance of class size to student outcomes is a
hotly debated issue that has come to the forefrontof current policy initiatives. Common-senseappeal and considerable research evidencesuggest that smaller classes contribute toimproved student performance, especially forelementary school students and students who areat risk. Others contend that the lack of consistentresearch evidence makes it difficult to justify thecost of implementing across-the-board reductionsin class size. However, there is some agreementthat class size matters when certain sizes arecompared (very large and very small classes) andwhen some populations are considered (studentsdisadvantaged by poverty and disabilities).Moreover, research shows that teachers prefersmaller classes (U.S. Department of Education,1997). Although the academic debate continuesand despite the substantial costs involved, manystates and the federal government have takeninitiatives to reduce class size.
Both the 1998 and 1993-94 surveys askedteachers about the number of students taught.From this information, average class size wascalculated. In 1998, the average class size forfull-time public school teachers in generalelementary classrooms16 was 23 students; it was
16
The category labeled general elementary classrooms for the 1998FRSS study includes all teachers of self-contained classrooms,regardless of instructional level. Almost all (95 percent) of theself-contained classrooms were at the elementary school level.

—38—
Table 19.—Average class size for full-time public school teachers in general elementary classroomsand departmentalized settings, by selected school characteristics: 1998
Teaching assignment
School characteristic General elementaryclassrooms1
Departmentalizedsettings
All targeted public school teachers2 ............................................................ 23 24
LocaleCentral city ...................................................................................................... 23 25Urban fringe/large town .................................................................................. 23 25Rural/small town ............................................................................................. 21 22
RegionNortheast ......................................................................................................... 23 23Midwest........................................................................................................... 22 23South ............................................................................................................... 22 23West ................................................................................................................ 23 28
Percent minority enrollment in school5 percent or less............................................................................................... 22 236 to 20 percent................................................................................................. 23 2421 to 50 percent............................................................................................... 23 24More than 50 percent....................................................................................... 23 25
Percent of students in school eligible for free or reduced-price school lunchLess than 15 percent........................................................................................ 23 2415 to 32 percent............................................................................................... 22 2433 to 59 percent............................................................................................... 22 2460 percent or more........................................................................................... 23 24
1The category labeled general elementary classrooms includes all teachers of self-contained classrooms in the 1998 FRSS study, regardless ofinstructional level. Almost all (95 percent) of the self-contained classrooms were at the elementary school level.2Targeted public school teachers were full-time public school teachers in grades 1 through 12 whose main teaching assignment was inEnglish/language arts, social studies/social sciences, foreign languages, mathematics, or science, or who taught a self-contained classroom.
SOURCE: U.S. Department of Education, National Center for Education Statistics, Fast Response Survey System, Teacher Survey onProfessional Development and Training, 1998.
24 students for teachers in departmentalizedsettings (tables 19 and B-14). In 1993-94, theaverage class size for full-time public schoolteachers was 24 students for both generalelementary classrooms17 and departmentalizedsettings18 (tables 20 and C-11). Thus, averageclass size was larger for teachers in 1993-94 thanin 1998 for teachers in general elementaryclassrooms, but not for teachers indepartmentalized settings. This difference inclass size for general elementary classrooms mayrepresent an actual decrease in class size overtime, due to factors such as increased emphasison smaller classes in recent years. Alternatively,
17
The category labeled general elementary classrooms for the 1993-94 SASS study includes the teachers who indicated that their mainteaching assignment was general elementary.
18 The category labeled departmentalized settings for the 1993-94SASS study includes the teachers who indicated that their mainteaching assignment was in English/language arts, socialstudies/social sciences, foreign language, mathematics, or science.
this difference may be due to methodologicaldifferences between the studies, such as thedifferent ways in which the class size informationwas collected on the questionnaires, ordifferences in data collection procedures.19 Bothstudies did, however, show some of the samegeneral patterns of differences by schoolcharacteristics.
Average class size was found to differ by schoollocale. The 1998 data indicate that for bothgeneral elementary and departmentalizedteachers, teachers in rural areas and small townshad smaller classes, on average, than did teachersin central cities or in urban fringe areas or largetowns (tables 19 and B-14). Teachers in 1993-94also showed differences by locale (tables 20 andC-11), with both general elementary anddepartmentalized classrooms in rural areas and
19
See appendix A for a discussion of comparisons between the twosurveys.

—39—
Table 20.—Average class size for full-time public school teachers in general elementary classroomsand departmentalized settings, by selected school characteristics: 1993-94
Teaching assignment
School characteristic General elementaryclassrooms1
Departmentalizedsettings2
All targeted public school teachers3 ............................................................ 24 24
LocaleCentral city ...................................................................................................... 25 25Urban fringe/large town .................................................................................. 25 24Rural/small town ............................................................................................. 23 22
RegionNortheast ......................................................................................................... 24 22Midwest........................................................................................................... 23 23South ............................................................................................................... 23 24West ................................................................................................................ 27 26
Percent minority enrollment in school5 percent or less............................................................................................... 23 236 to 20 percent................................................................................................. 24 2321 to 50 percent............................................................................................... 24 24More than 50 percent....................................................................................... 24 25
Percent of students in school eligible for free or reduced-price school lunchLess than 15 percent........................................................................................ 24 2415 to 32 percent............................................................................................... 24 2333 to 59 percent............................................................................................... 24 2460 percent or more........................................................................................... 24 24
1The category labeled general elementary classrooms includes teachers in the 1993-94 SASS study who indicated that their main teachingassignment was general elementary.2The category labeled departmentalized settings includes teachers in the 1993-94 SASS study who indicated that their main teaching assignmentwas in English/language arts, social studies/social sciences, foreign language, mathematics, or science.3Targeted public school teachers were full-time public school teachers in grades 1 through 12 whose main teaching assignment was inEnglish/language arts, social studies/social sciences, foreign languages, mathematics, science, or general elementary.
NOTE: Approximately 5 percent of the teachers were excluded from the SASS class size analyses, either because they taught “pull-out” classes,where they provided instruction to students who were released from their regular classes (2 percent), or because of reporting problems in theirclass size information (3 percent).
SOURCE: U.S. Department of Education, National Center for Education Statistics, 1993-94 Schools and Staffing Survey, unpublishedtabulations, 1998.
small towns smaller on average than those locatedin central cities or in urban fringe areas or largetowns.
Average class size also varied by region. In1998, departmentalized teachers in the Westtaught an average of 28 students in a class,compared with an average of 23 students in theother regions. In 1993-94, average class size alsodiffered by region, although the pattern wassomewhat different for general elementary anddepartmentalized teachers. For generalelementary teachers, teachers in the West had thelargest class sizes. For departmentalized teachers,average class size differed for each region,ranging from 22 to 26 students. Teachers in theWest had the largest classes, followed by teachers
in the South, then teachers in the Midwest, andthen teachers in the Northeast.
In addition, average class size varied by minorityenrollment in the school. In 1998, depart-mentalized teachers in schools with very lowminority enrollment (5 percent or less) hadsmaller classes, on average, than did teachers atschools with minority enrollments of 6 to 20percent and 21 to 50 percent, who in turn taughtsmaller classes than did teachers at schools withmore than 50 percent minority enrollment.Average class size also showed differences byminority enrollment for teachers in 1993-94. Fordepartmentalized teachers, teachers in schoolswith minority enrollments of 5 percent or lesstaught smaller classes, on average, than didteachers in schools with minority enrollments of
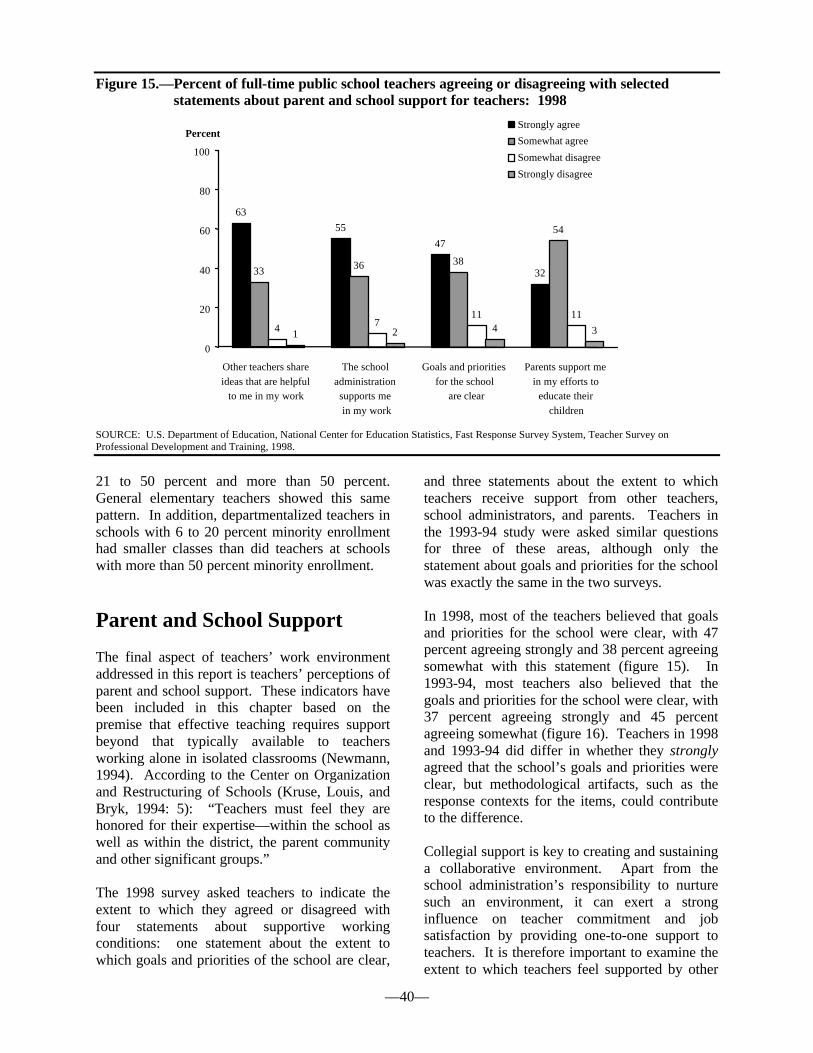
—40—
Figure 15.—Percent of full-time public school teachers agreeing or disagreeing with selectedstatements about parent and school support for teachers: 1998
63
55
47
3233 36 38
54
4 711 11
1 2 4 3
0
20
40
60
80
100
Other teachers shareideas that are helpful
to me in my work
The school administration supports me in my work
Goals and priorities for the school
are clear
Parents support mein my efforts to
educate theirchildren
PercentStrongly agree
Somewhat agree
Somewhat disagree
Strongly disagree
SOURCE: U.S. Department of Education, National Center for Education Statistics, Fast Response Survey System, Teacher Survey onProfessional Development and Training, 1998.
21 to 50 percent and more than 50 percent.General elementary teachers showed this samepattern. In addition, departmentalized teachers inschools with 6 to 20 percent minority enrollmenthad smaller classes than did teachers at schoolswith more than 50 percent minority enrollment.
Parent and School Support
The final aspect of teachers’ work environmentaddressed in this report is teachers’ perceptions ofparent and school support. These indicators havebeen included in this chapter based on thepremise that effective teaching requires supportbeyond that typically available to teachersworking alone in isolated classrooms (Newmann,1994). According to the Center on Organizationand Restructuring of Schools (Kruse, Louis, andBryk, 1994: 5): “Teachers must feel they arehonored for their expertise—within the school aswell as within the district, the parent communityand other significant groups.”
The 1998 survey asked teachers to indicate theextent to which they agreed or disagreed withfour statements about supportive workingconditions: one statement about the extent towhich goals and priorities of the school are clear,
and three statements about the extent to whichteachers receive support from other teachers,school administrators, and parents. Teachers inthe 1993-94 study were asked similar questionsfor three of these areas, although only thestatement about goals and priorities for the schoolwas exactly the same in the two surveys.
In 1998, most of the teachers believed that goalsand priorities for the school were clear, with 47percent agreeing strongly and 38 percent agreeingsomewhat with this statement (figure 15). In1993-94, most teachers also believed that thegoals and priorities for the school were clear, with37 percent agreeing strongly and 45 percentagreeing somewhat (figure 16). Teachers in 1998and 1993-94 did differ in whether they stronglyagreed that the school’s goals and priorities wereclear, but methodological artifacts, such as theresponse contexts for the items, could contributeto the difference.
Collegial support is key to creating and sustaininga collaborative environment. Apart from theschool administration’s responsibility to nurturesuch an environment, it can exert a stronginfluence on teacher commitment and jobsatisfaction by providing one-to-one support toteachers. It is therefore important to examine theextent to which teachers feel supported by other

—41—
Figure 16.—Percent of full-time public school teachers agreeing or disagreeing with selectedstatements about parent and school support for teachers: 1993-94
4137
11
3845 42
14 14
30
7 4
17
0
20
40
60
80
100
The school administration'sbehavior toward thestaff is supportiveand encouraging
Goals and priorities for the school
are clear
I receive a great deal of support from parents for
the work I do
PercentStrongly agree
Somewhat agree
Somewhat disagree
Strongly disagree
SOURCE: U.S. Department of Education, National Center for Education Statistics, 1993-94 Schools and Staffing Survey, unpublishedtabulations, 1998.
teachers and the school administration. Inresponse to the statement about collegial support,most teachers in 1998 felt that other teachersshared ideas with them that were helpful in theirteaching; 63 percent of teachers strongly agreedwith this statement, and 33 percent somewhatagreed with it (figure 15 and table B-15).
In 1998, most teachers felt supported by theschool administration, with 55 percent of teachersagreeing strongly and 36 percent agreeingsomewhat that the school administrationsupported them in their work (figure 15 and tableB-15). Most teachers in 1993-94 also felt that theschool administration was supportive; 41 percentof teachers agreed strongly and 38 percent agreedsomewhat that the school administration’sbehavior toward them was supportive andencouraging (figure 16 and table C-12).
Support from parents provides a necessary linkbetween home and school, laying the foundationfor a partnership that serves to engage student,parent, and teacher commitment. The 1998 and1993-94 data showed that teachers perceivedsomewhat less support from parents than fromother teachers (1998) and the schooladministration (both studies). For example, in
1998, 32 percent of teachers in 1998 agreedstrongly and 54 percent agreed somewhat thatparents supported them in their efforts to educatetheir children (figure 15 and table B-15). The1993-94 study asked a somewhat differentlyworded question about parental support: teacherswere asked to indicate the extent to which theyagreed or disagreed with the statement that theyreceive “a great deal of support” from parents forthe work they do (as compared with “parentssupport me in my efforts to educate theirchildren” in 1998). For teachers in 1993-94, 11percent agreed strongly and 42 percent agreedsomewhat with this statement, and 30 percentdisagreed somewhat and 17 percent disagreedstrongly that they received a great deal of supportfrom parents (figure 16 and table C-12).
In 1998, teachers’ perceptions of collegial andschool support varied by the instructional level ofthe school, with elementary school teachersperceiving stronger collegial and school supportthan high school teachers (figure 17 and table B-15). For example, 69 percent of elementaryschool teachers compared with 53 percent of highschool teachers strongly agreed that otherteachers shared ideas that were helpful to theirteaching. The 1993-94 data also showed some

—42—
Figure 17.—Percent of full-time public school teachers who strongly agreed with selectedstatements about parent and school support for teachers, by school instructional level:1998
69
5652
36
60 59
48
30
5349
37
24
49 48
3225
0
20
40
60
80
100
Other teachers shareideas that are helpful
to me in my work
The school administration supports me in my work
Goals and priorities for the school
are clear
Parents support mein my efforts to
educate theirchildren
PercentElementary school
Middle school
High school
Combined
SOURCE: U.S. Department of Education, National Center for Education Statistics, Fast Response Survey System, Teacher Survey onProfessional Development and Training, 1998.
variation in perceived school support by theinstructional level of the school (figure 18 andtable C-12), with elementary school teachersperceiving more support than high schoolteachers. For example, 44 percent of elementaryschool teachers compared with 33 percent of highschool teachers strongly agreed that the schooladministration’s behavior toward the staff wassupportive and encouraging.
Teachers’ perceptions of parental support alsovaried by the instructional level of the school.For example, 36 percent of 1998 elementaryschool teachers compared with 24 percent of highschool teachers strongly agreed that parentssupport them in their efforts to educate theirchildren (figure 17 and table B-15). For 1993-94,teachers’ perceived support from parents, whilelow overall, also showed this pattern of variationby instructional level, with 15 percent ofelementary school teachers compared with 6percent of high school teachers strongly agreeingthat they received a great deal of support fromparents for the work that they do (figure 18 andtable C-12).
In 1998, teachers’ perceptions of parent andschool support also showed some variation byyears of teaching experience. Less experiencedteachers perceived more support from otherteachers and the school administration, and lesssupport from parents, than did more experiencedteachers. For example, 67 percent of teacherswith 3 or fewer years of experience comparedwith 60 percent of teachers with 20 or more yearsof experience strongly agreed that other teachersshared ideas that were helpful to their teaching;26 percent of the least experienced teacherscompared with 33 percent of the mostexperienced teachers strongly agreed that parentssupported them in their efforts to educate theirchildren (figure 19 and table B-15). Teachers in1993-94 also varied by years of teachingexperience in their views of support from theschool administration. For example, 48 percentof the least experienced teachers compared with38 percent of the most experienced teachersstrongly agreed that the school administration’sbehavior toward the staff was supportive andencouraging (figure 20 and table C-12).

—43—
Figure 18.—Percent of full-time public school teachers who strongly agreed with selectedstatements about parent and school support for teachers, by school instructional level:1993-94
44 44
15
4135
8
33
25
6
36
27
7
0
20
40
60
80
100
The school administration'sbehavior toward thestaff is supportiveand encouraging
Goals and priorities for the school
are clear
I receive a greatdeal of support
from parents forthe work I do
PercentElementary school
Middle school
High school
Combined
SOURCE: U.S. Department of Education, National Center for Education Statistics, 1993-94 Schools and Staffing Survey, unpublishedtabulations, 1998.
Figure 19.—Percent of full-time public school teachers who strongly agreed with selectedstatements about parent and school support for teachers, by teaching experience: 1998
6760
46
26
66
56
46
32
62
5348
32
6052
48
33
0
20
40
60
80
100
Other teachers shareideas that are helpful
to me in my work
The school administration supports me in my work
Goals and priorities for the school
are clear
Parents support mein my efforts to
educate theirchildren
Percent3 or fewer years
4 to 9 years
10 to 19 years
20 or more years
SOURCE: U.S. Department of Education, National Center for Education Statistics, Fast Response Survey System, Teacher Survey onProfessional Development and Training, 1998.
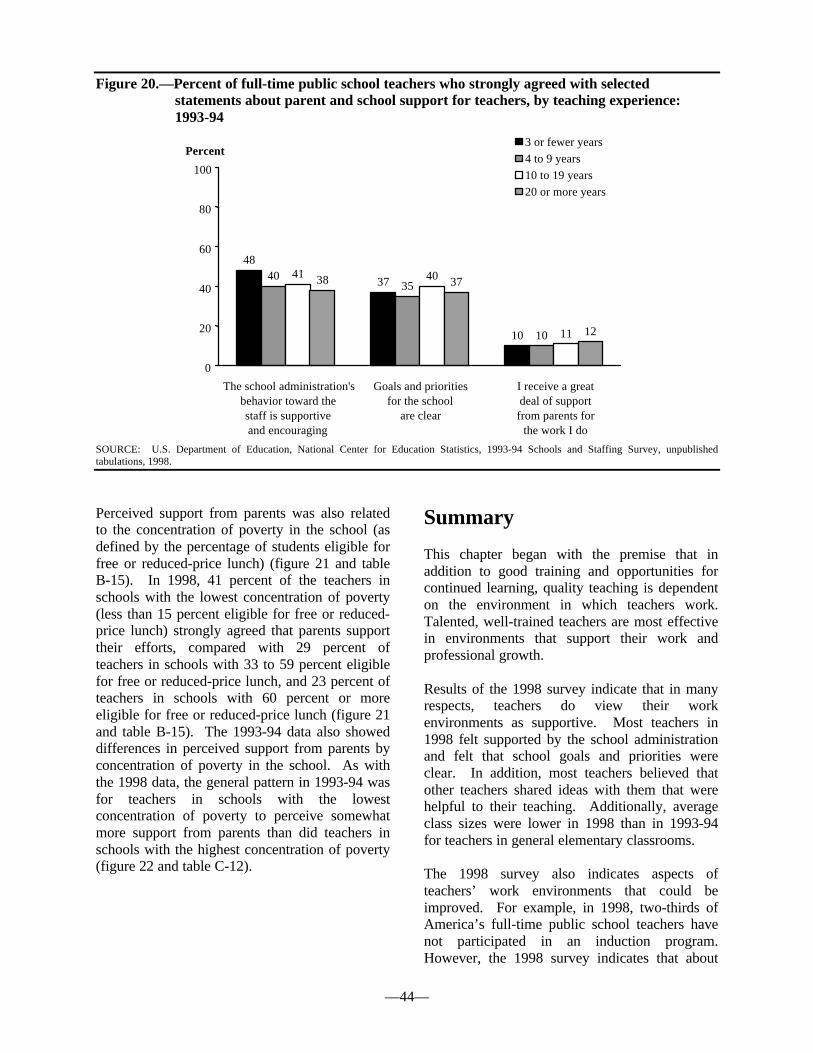
—44—
Figure 20.—Percent of full-time public school teachers who strongly agreed with selectedstatements about parent and school support for teachers, by teaching experience:1993-94
48
37
10
4035
10
41 40
11
38 37
12
0
20
40
60
80
100
The school administration'sbehavior toward thestaff is supportiveand encouraging
Goals and priorities for the school
are clear
I receive a greatdeal of supportfrom parents for
the work I do
Percent3 or fewer years
4 to 9 years
10 to 19 years
20 or more years
SOURCE: U.S. Department of Education, National Center for Education Statistics, 1993-94 Schools and Staffing Survey, unpublishedtabulations, 1998.
Perceived support from parents was also relatedto the concentration of poverty in the school (asdefined by the percentage of students eligible forfree or reduced-price lunch) (figure 21 and tableB-15). In 1998, 41 percent of the teachers inschools with the lowest concentration of poverty(less than 15 percent eligible for free or reduced-price lunch) strongly agreed that parents supporttheir efforts, compared with 29 percent ofteachers in schools with 33 to 59 percent eligiblefor free or reduced-price lunch, and 23 percent ofteachers in schools with 60 percent or moreeligible for free or reduced-price lunch (figure 21and table B-15). The 1993-94 data also showeddifferences in perceived support from parents byconcentration of poverty in the school. As withthe 1998 data, the general pattern in 1993-94 wasfor teachers in schools with the lowestconcentration of poverty to perceive somewhatmore support from parents than did teachers inschools with the highest concentration of poverty(figure 22 and table C-12).
Summary
This chapter began with the premise that inaddition to good training and opportunities forcontinued learning, quality teaching is dependenton the environment in which teachers work.Talented, well-trained teachers are most effectivein environments that support their work andprofessional growth.
Results of the 1998 survey indicate that in manyrespects, teachers do view their workenvironments as supportive. Most teachers in1998 felt supported by the school administrationand felt that school goals and priorities wereclear. In addition, most teachers believed thatother teachers shared ideas with them that werehelpful to their teaching. Additionally, averageclass sizes were lower in 1998 than in 1993-94for teachers in general elementary classrooms.
The 1998 survey also indicates aspects ofteachers’ work environments that could beimproved. For example, in 1998, two-thirds ofAmerica’s full-time public school teachers havenot participated in an induction program.However, the 1998 survey indicates that about
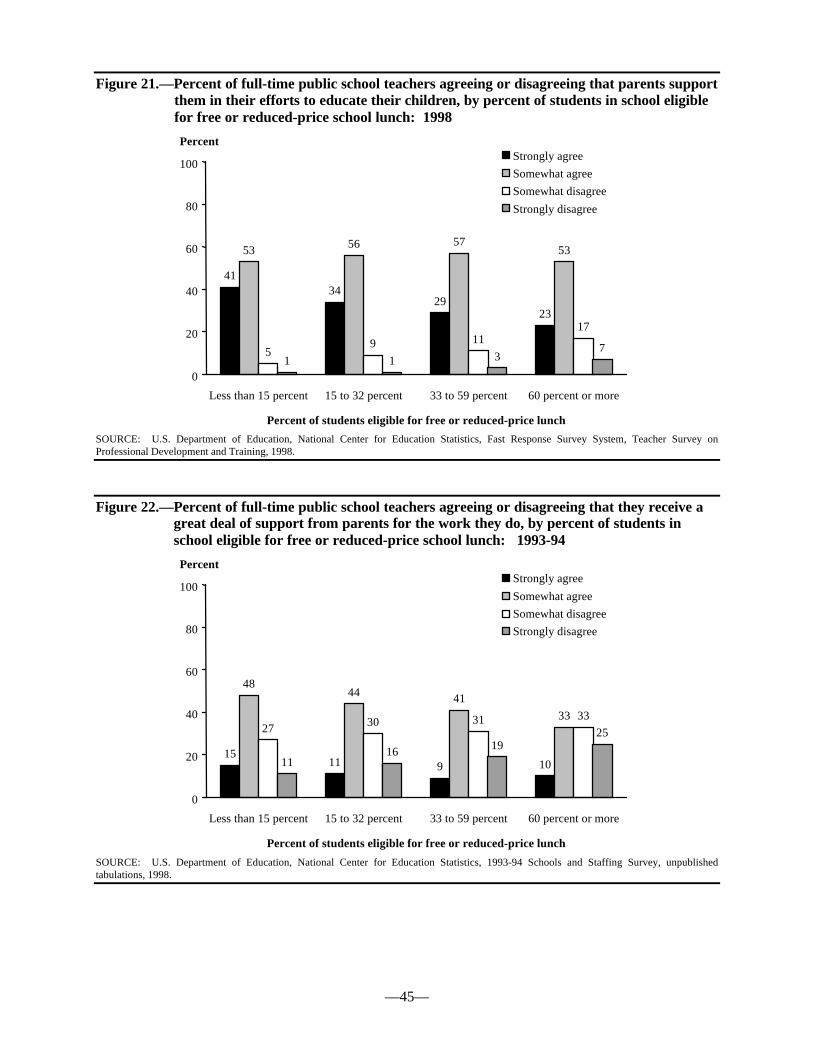
—45—
Figure 21.—Percent of full-time public school teachers agreeing or disagreeing that parents supportthem in their efforts to educate their children, by percent of students in school eligiblefor free or reduced-price school lunch: 1998
4134
2923
53 56 5753
59 11
17
1 1 37
0
20
40
60
80
100
Less than 15 percent 15 to 32 percent 33 to 59 percent 60 percent or more
Percent of students eligible for free or reduced-price lunch
PercentStrongly agree
Somewhat agree
Somewhat disagree
Strongly disagree
SOURCE: U.S. Department of Education, National Center for Education Statistics, Fast Response Survey System, Teacher Survey onProfessional Development and Training, 1998.
Figure 22.—Percent of full-time public school teachers agreeing or disagreeing that they receive agreat deal of support from parents for the work they do, by percent of students inschool eligible for free or reduced-price school lunch: 1993-94
1511 9 10
4844 41
3327 30 31 33
1116 19
25
0
20
40
60
80
100
Less than 15 percent 15 to 32 percent 33 to 59 percent 60 percent or more
Percent of students eligible for free or reduced-price lunch
PercentStrongly agree
Somewhat agree
Somewhat disagree
Strongly disagree
SOURCE: U.S. Department of Education, National Center for Education Statistics, 1993-94 Schools and Staffing Survey, unpublishedtabulations, 1998.

—46—
two-thirds of new teachers (those with 3 or feweryears of experience) did participate in suchprograms. In addition, teachers with 3 or feweryears of experience were more likely to haveparticipated in an induction program in 1998 thanin 1993-94 (65 percent compared with 59percent), suggesting that there may be moreemphasis on induction programs in recent years.One-third of teachers in 1998 agreed strongly thatparents support their efforts to educate the
parents’ children, with elementary school teachersperceiving greater support from parents than highschool teachers. There was also variation inperceived support by the poverty concentration inthe school. The general pattern in both the 1998and 1993-94 studies was for teachers in schoolswith the lowest concentration of poverty toperceive somewhat more support from parentsthan did teachers in schools with the highestconcentration of poverty.
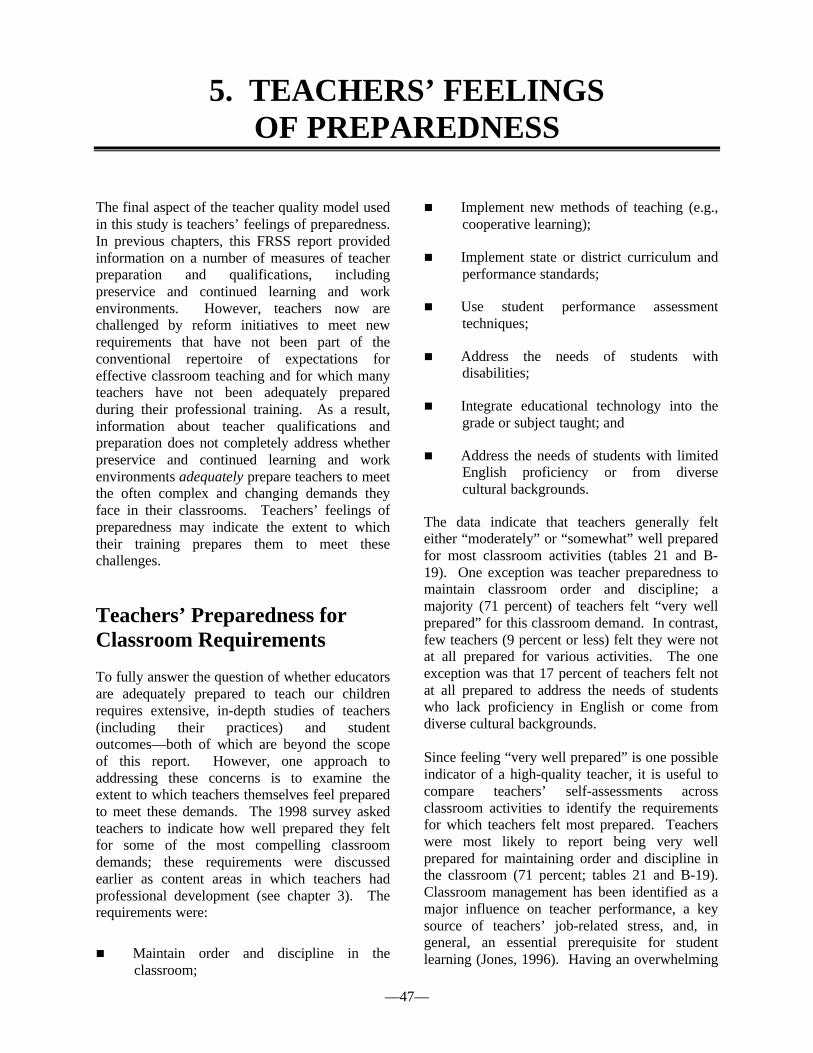
—47—
5. TEACHERS’ FEELINGSOF PREPAREDNESS
The final aspect of the teacher quality model usedin this study is teachers’ feelings of preparedness.In previous chapters, this FRSS report providedinformation on a number of measures of teacherpreparation and qualifications, includingpreservice and continued learning and workenvironments. However, teachers now arechallenged by reform initiatives to meet newrequirements that have not been part of theconventional repertoire of expectations foreffective classroom teaching and for which manyteachers have not been adequately preparedduring their professional training. As a result,information about teacher qualifications andpreparation does not completely address whetherpreservice and continued learning and workenvironments adequately prepare teachers to meetthe often complex and changing demands theyface in their classrooms. Teachers’ feelings ofpreparedness may indicate the extent to whichtheir training prepares them to meet thesechallenges.
Teachers’ Preparedness forClassroom Requirements
To fully answer the question of whether educatorsare adequately prepared to teach our childrenrequires extensive, in-depth studies of teachers(including their practices) and studentoutcomes—both of which are beyond the scopeof this report. However, one approach toaddressing these concerns is to examine theextent to which teachers themselves feel preparedto meet these demands. The 1998 survey askedteachers to indicate how well prepared they feltfor some of the most compelling classroomdemands; these requirements were discussedearlier as content areas in which teachers hadprofessional development (see chapter 3). Therequirements were:
n Maintain order and discipline in theclassroom;
n Implement new methods of teaching (e.g.,cooperative learning);
n Implement state or district curriculum andperformance standards;
n Use student performance assessmenttechniques;
n Address the needs of students withdisabilities;
n Integrate educational technology into thegrade or subject taught; and
n Address the needs of students with limitedEnglish proficiency or from diversecultural backgrounds.
The data indicate that teachers generally felteither “moderately” or “somewhat” well preparedfor most classroom activities (tables 21 and B-19). One exception was teacher preparedness tomaintain classroom order and discipline; amajority (71 percent) of teachers felt “very wellprepared” for this classroom demand. In contrast,few teachers (9 percent or less) felt they were notat all prepared for various activities. The oneexception was that 17 percent of teachers felt notat all prepared to address the needs of studentswho lack proficiency in English or come fromdiverse cultural backgrounds.
Since feeling “very well prepared” is one possibleindicator of a high-quality teacher, it is useful tocompare teachers’ self-assessments acrossclassroom activities to identify the requirementsfor which teachers felt most prepared. Teacherswere most likely to report being very wellprepared for maintaining order and discipline inthe classroom (71 percent; tables 21 and B-19).Classroom management has been identified as amajor influence on teacher performance, a keysource of teachers’ job-related stress, and, ingeneral, an essential prerequisite for studentlearning (Jones, 1996). Having an overwhelming

—48—
Table 21.—Percent of full-time public school teachers indicating how well prepared they feel to dovarious activities in the classroom: 1998
How well prepared teachers feel
Activity Very well
prepared
Moderately
well
prepared
Somewhat
well
prepared
Not at all
prepared
Maintain order and discipline in the classroom...................................... 71 24 4 1
Implement new methods of teaching (e.g., cooperative learning) .......... 41 41 16 2
Implement state or district curriculum and performance standards........ 36 41 20 3
Use student performance assessment techniques ................................... 28 41 26 4
Address the needs of students with disabilities* .................................... 21 41 30 7
Integrate educational technology in the grade or subject you teach ....... 20 37 34 9
Address the needs of students with limited English proficiency or
from diverse cultural backgrounds* ................................................... 20 33 30 17
*Percents are based on teachers who teach students with these characteristics.
NOTE: Percents are computed across each row, but may not sum to 100 because of rounding.
SOURCE: U.S. Department of Education, National Center for Education Statistics, Fast Response Survey System, Teacher Survey onProfessional Development and Training, 1998.
majority of teachers who felt very well preparedto meet this core classroom requirement is animportant indicator. Fewer teachers felt very wellprepared to meet other typical classroomrequirements for which teachers receive bothinitial and on-the-job training (tables 21 and B-19). For instance, fewer teachers believed theywere very well prepared to implement newteaching methods (41 percent), implement state ordistrict curriculum and performance standards (36percent), and use student performance assessmenttechniques (28 percent).
Teachers were least likely to report being verywell prepared for activities that have morerecently become an essential part of expectationsfor classroom teaching: integrating educationaltechnology into the grade or subject taught,addressing the needs of limited English proficientor culturally diverse students, and addressing theneeds of students with disabilities (tables 21 andB-19). While many educators and policy analystsconsider educational technology a vehicle fortransforming education, relatively few teachersfelt very well equipped to integrate technologyinto classroom instruction (20 percent).
Increased classroom diversity has brought equityissues to the forefront of the education reformagenda, but past studies have shown that manyteachers were not trained to meet the demands of
diverse student populations.20 The 1998 surveyfound that 54 percent of the teachers taughtlimited English proficient or culturally diversestudents, while 71 percent taught students withdisabilities (not shown in tables). However, at atime when classrooms are becoming increasinglydiverse, relatively few teachers reported beingvery well prepared to address the needs of limitedEnglish proficient or culturally diverse students(20 percent) or students with disabilities (21percent, tables 21 and B-19).
The likelihood of being very or moderately wellprepared to address the needs of limited Englishproficient or culturally diverse students variedwith the percent minority enrollment in the school(figure 23 and table B-19). Thus, among teacherswho taught limited English proficient orculturally diverse students, 27 percent of teachersfrom schools with more than 50 percent minorityenrollment believed they were very well preparedto meet the needs of these students, comparedwith 10 percent feeling very well prepared atschools with minority enrollments of 5 percent orless.
20
For instance, an earlier report on the 1993-94 SASS data showedthat while 39 percent of all teachers taught students with limitedEnglish proficiency, just over one-quarter of teachers with thesestudents had any training to meet this student need (U.S.Department of Education, 1997) .

—49—
Figure 23.—Percent of full-time public school teachers indicating they feel very well or moderatelywell prepared to address the needs of students with limited English proficiency or fromdiverse cultural backgrounds, by percent minority enrollment in the school: 1998
1015
20
2725
33 3437
0
20
40
60
80
100
5 percent or less 6 to 20 percent 21 to 50 percent More than 50 percent
Percent minority enrollment in the school
PercentVery well prepared
Moderately well prepared
SOURCE: U.S. Department of Education, National Center for Education Statistics, Fast Response Survey System, Teacher Survey onProfessional Development and Training, 1998.
Teacher Preparedness andTeaching Experience
Beginning teachers are rarely totally prepared tomeet core classroom requirements, includingclassroom management. Yet, in the context ofeducation reform, experience may not necessarilytranslate into better teacher preparedness forcertain classroom activities, unless experiencedteachers have had continued training to upgradetheir skills and knowledge in those areas.Integrating technology into classroom instructionand employing new teaching strategies are twosuch areas. It is therefore useful to examinewhether teaching experience makes a differencein the extent to which teachers felt prepared forvarious classroom requirements.
Teachers’ self-perceived preparedness for variousclassroom activities did not always vary byteaching experience (tables 22 and B-19). Forinstance, teachers’ perceptions of being very wellprepared to implement new methods of teaching
did not vary significantly by teaching experience.Similarly, newer teachers did not differ frommore experienced teachers in feeling very wellprepared to address the needs of students withlimited English proficiency or from diversecultural backgrounds.
Teaching experience might be expected to make adifference in being prepared to manageclassrooms because this area of expertise may beparticularly problematic for beginning teachers(Jones 1996). The 1998 data supported thisexpectation (tables 22 and B-19). Teachers with3 or fewer years of teaching experience were lesslikely than more experienced teachers to reportbeing very well prepared to maintain order anddiscipline in the classroom. The extent to whichteachers felt prepared to implement state ordistrict curriculum also varied by teachingexperience, with newer teachers less likely thanmore experienced teachers to report being verywell prepared for this classroom requirement(tables 22 and B-19).

—50—
Table 22.—Percent of full-time public school teachers indicating they feel very well prepared to dovarious activities in the classroom, by teaching experience: 1998
Teaching experience
Content area 3 or fewer
years
4 to 9
years
10 to 19
years
20 or more
years
Maintain order and discipline in the classroom...................................... 54 70 72 76
Implement new methods of teaching (e.g., cooperative learning) .......... 37 44 41 40
Implement state or district curriculum and performance standards........ 28 36 37 39
Use student performance assessment techniques ................................... 23 27 29 30
Address the needs of students with disabilities* .................................... 15 21 25 21
Integrate educational technology in the grade or subject you teach ....... 24 23 19 19
Address the needs of students with limited English proficiency or
from diverse cultural backgrounds* ................................................... 18 21 22 18
*Percents are based on teachers who teach students with these characteristics.
SOURCE: U.S. Department of Education, National Center for Education Statistics, Fast Response Survey System, Teacher Survey onProfessional Development and Training, 1998.
Teacher Preparednessand Participation inProfessional Development
As a subjective measure of teacher quality,teacher preparedness incorporates what theteacher brings to the classroom from preservicelearning and on-the-job learning. To the extentthat professional development is geared toprovide on-the-job-learning in key areas ofclassroom teaching, recent participation inprofessional development programs shouldcontribute to teachers being better prepared forthe requirements of classroom teaching. It istherefore important to examine the degree ofcorrespondence between the level of teacherparticipation in professional development invarious content areas in the past 12 months andthe extent to which teachers felt prepared forclassroom responsibilities in these areas.
High levels of recent teacher participation inprofessional development in various content areasgenerally did not match overall levels of self-perceived teacher preparedness for a classroomactivity (table 23). In every classroom activityexcept one, the proportion of teachers who hadrecently participated in professional developmenton a relevant topic was considerably higher thanthe proportion of teachers who felt very wellprepared for that classroom requirement. The oneexception to this pattern was classroommanagement. While about half of the teachers had
recent professional development in this contentarea, a much higher proportion of teachers feltvery well prepared for the classroom requirement(71 percent).
Differences between the proportion of teacherswho had recent professional development versusthe proportion of teachers who felt very wellprepared for classroom demands provide a roughassessment of the degree of correspondencebetween opportunities for on-the-job learning andoverall needs for ongoing teacher preparation.These differences point to disparities betweenrecent teacher participation in professionaldevelopment and self-perceived teacherpreparedness for classroom demands, but they donot directly address the impact of recentprofessional development on teacherpreparedness. It is not easy, however, to assessthis impact, since recent exposure to professionaldevelopment is only one of several influences onteacher preparedness for core classroomrequirements.21
In every content area except classroommanagement, less than half of the teachers whohad recent professional development felt verywell prepared to meet classroom requirements inthese areas (table 23). For example, of theteachers who recently participated in professional
21
Other influences include initial teacher preparation, teachingexperience, and other opportunities for teacher learning.

—51—
Table 23.—Comparison of recent teacher participation in professional development in variouscontent areas and perceived teacher preparedness for classroom requirements in thosecontent areas: 1998
Activity
Percent of teachersindicating theyparticipated inprofessional
development activities
Percent of all teachersindicating they felt very
well prepared for theclassroom activity
Of the teachers whoparticipated inprofessional
development, percentindicating they felt very
well prepared for theclassroom activity
Maintain order and discipline in the classroom .......... 49 71 68
Implement new teaching methods .............................. 77 41 43
Implement state or district curriculum and
performance standards ........................................... 81 36 38
Use student performance assessment techniques ........ 67 28 33
Address the needs of students with disabilities........... 48 21 25
Integrate educational technology into the grade or
subject taught ......................................................... 78 20 23
Address the needs of students with limited English
proficiency or from diverse cultural
backgrounds ........................................................... 31 20 28
SOURCE: U.S. Department of Education, National Center for Education Statistics, Fast Response Survey System, Teacher Survey onProfessional Development and Training, 1998.
development in implementing new teachingmethods, 43 percent felt very well prepared forthis classroom activity. Similarly, 38 percent ofteachers who had professional development inimplementing state or district curriculum andperformance standards felt very well prepared forthe classroom activity.
Another way to assess the impact of professionaldevelopment is to examine differences inpreparedness between the proportion of teacherswho had recently participated in professionaldevelopment in each content area versus thosewho did not participate (figure 24). In general,teachers who had participated in professionaldevelopment in a content area were more likelythan their peers to indicate that they felt very wellprepared in that area. For example, those whohad professional development in implementingnew teaching methods were more likely thanthose who did not participate to believe they werevery well prepared to implement new teachingmethods in the classroom (43 versus 34 percent).
Maintaining classroom order and discipline wasthe only activity in which teacher preparednessdid not vary according to the general pattern, butthis finding may be clouded by the associationbetween teaching experience and participation inprofessional development in classroom
management. Newer teachers were more likely tohave had recent professional development in thiscontent area, but they also felt least prepared tomaintain order and discipline in the classroom.These data might suggest that attendingworkshops and seminars may not be the mosteffective way of developing this importantclassroom expertise, since managing studentsmay be more easily learned in the classroomenvironment and with teaching experience.
Teacher Preparednessand Intensity of ProfessionalDevelopment
Professional development is more likely to bringabout long-term change in teacher performance ifit is intense. One measure of intensity is the timespent in the programs. The frequency ofparticipation in various professional developmentprograms was examined against the extent towhich teachers felt prepared to do variousactivities in the classroom (tables 24 and B-20).The extent to which teachers felt very wellprepared to engage in most activities increasedwith the time spent in recent professionaldevelopment in that activity. For example,

—52—
Figure 24.—Percent of full-time public school teachers indicating they feel very well prepared to dovarious classroom activities, by whether they participated in professional developmentactivities in the last 12 months that focused on these content areas: 1998
68
4338
33
25 2328
74
34
20 2017
1114
0
20
40
60
80
100
Maintain orderand discipline inthe classroom
Implement new methods of teaching (e.g., coop-
erative learning)
Implement stateor district
curriculum andperformance
standards
Use studentperformanceassessmenttechniques
Address theneeds of
students withdisabilities
Integrateeducational
technology intothe grade or
subject taught
Address theneeds of
students withlimited Englishproficiency orfrom diverse
culturalbackgrounds
Percent
Participated
Did not participate
SOURCE: U.S. Department of Education, National Center for Education Statistics, Fast Response Survey System, Teacher Survey onProfessional Development and Training, 1998.
teachers who spent over 8 hours in programs inthe last 12 months that focused on the integrationof technology in classrooms were more likelythan those who spent 1 to 8 hours or those whodid not participate at all to indicate that they feltvery well prepared to meet this classroomrequirement.
The data suggest that for professionaldevelopment to achieve its goal of improvingteacher preparedness for classroom requirements,teachers need to spend more than a day oftraining in a relevant content area. The extent towhich teachers felt very well prepared forclassroom requirements did not always vary bywhether teachers spent 1 to 8 hours or did notparticipate at all in relevant professionaldevelopment during the past 12 months (tables 24and B-20). For instance, teachers who spent 1 to8 hours in professional development programsthat focused on implementing state or district
curriculum and performance standards, did notdiffer from those who had no relevantprofessional development to report they felt verywell prepared to meet this classroom requirement(33 versus 30 percent).
Teacher Preparedness andCollaborative Activities
Teacher collaboration was identified as a secondmajor mechanism of on-the-job learning. To theextent that collaborative activities provideteachers with opportunities for on-goingdevelopment, participation in these activitiesshould better prepare teachers for classroomdemands. The 1998 survey data partiallysupported this expectation (table 25).

—53—
Table 24.—Percent of full-time public school teachers indicating how well prepared they feel to dovarious activities in the classroom, by the number of hours spent in professionaldevelopment in the content area of the activity in the last 12 months: 1998
Content areaVery wellprepared
Moderatelywell
prepared
Somewhatwell
prepared
Not at allprepared
State or district curriculum and performance standards0 hours ............................................................................................... 30 41 22 61 to 8 hours ........................................................................................ 33 43 20 3More than 8 hours .............................................................................. 44 37 17 1
Integration of educational technology into the grade or subject taught0 hours ............................................................................................... 11 25 40 231 to 8 hours ........................................................................................ 17 39 37 6More than 8 hours .............................................................................. 33 42 23 2
New methods of teaching (e.g., cooperative learning)0 hours ............................................................................................... 34 41 20 51 to 8 hours ........................................................................................ 38 43 17 1More than 8 hours .............................................................................. 51 38 11 *
Student performance assessment0 hours ............................................................................................... 20 39 32 91 to 8 hours ........................................................................................ 27 44 27 2More than 8 hours .............................................................................. 45 40 14 2
Classroom management, including student discipline0 hours ............................................................................................... 74 21 4 11 to 8 hours ........................................................................................ 68 27 4 1More than 8 hours .............................................................................. 68 27 5 *
Addressing the needs of students with disabilities1
0 hours ............................................................................................... 17 37 35 111 to 8 hours ........................................................................................ 20 46 29 5More than 8 hours .............................................................................. 41 38 18 2
Addressing the needs of students with limited English proficiency orfrom diverse cultural backgrounds1
0 hours ............................................................................................... 14 26 34 261 to 8 hours ........................................................................................ 21 41 30 8More than 8 hours .............................................................................. 41 43 15 1
*Less than 0.5 percent.1Percents are based on teachers who teach students with these characteristics.
NOTE: Percents are computed across each row, but may not sum to 100 because of rounding.
SOURCE: U.S. Department of Education, National Center for Education Statistics, Fast Response Survey System, Teacher Survey onProfessional Development and Training, 1998.
Common planning periods for team teaching andregularly scheduled collaboration with otherteachers explicitly emphasize teacher exchange ofpedagogical and subject matter knowledge.Teacher preparedness varied by recentparticipation in both of these collaborativeactivities (table 25). Teachers who engaged incommon planning periods for team teaching weremore likely than those who did not participate inthe activity to report that they felt very wellprepared to implement new teaching methods,implement state and district curriculum andperformance standards, use student performance
assessment techniques, maintain order anddiscipline, and address the needs of students withdisabilities. Similarly, teachers who participatedin regularly scheduled collaboration with otherteachers felt better prepared than their peers toimplement new teaching methods, implementstate or district curriculum and performancestandards, use student performance techniques,and address the needs of students withdisabilities.
Networking with teachers outside the school wasrelated to teacher preparedness for most

—54—
Table 25.—Percent of full-time public school teachers indicating they feel very well prepared to dovarious classroom activities, by whether they participated in various teaching-relatedactivities in the last 12 months: 1998
Feel very well prepared to:
Whether teacherparticipated in the
activity
Maintainorder and
discipline inthe
classroom
Implementnew
methods ofteaching
Implementstate ordistrict
curriculumand
performancestandards
Use studentperformanceassessmenttechniques
Address theneeds ofstudents
withdisabilities1
Integrateeducationaltechnology
into thegrade orsubjecttaught
Address theneeds ofstudents
with limitedEnglish
proficiencyor fromdiverseculturalback-
grounds1
Common planningperiod for team teachers
Yes ............................ 73 45 38 31 23 20 20No ............................. 68 34 33 24 19 21 20
Regularly scheduledcollaboration with otherteachers, excludingmeetings held foradministrative purposes
Yes ............................ 71 43 37 30 22 21 20No ............................. 68 33 33 33 17 18 19
Being mentored byanother teacher in aformal relationship
Yes ............................ 61 41 39 33 19 23 23No ............................. 73 41 36 27 22 20 19
Mentoring anotherteacher in a formalrelationship
Yes ............................ 80 50 45 37 27 24 23No ............................. 68 38 33 25 19 19 19
Networking withteachers outside yourschool
Yes ............................ 72 45 39 31 22 23 20No ............................. 68 34 32 24 19 16 20
Individual orcollaborative researchon a topic of interest toyou professionally
Yes ............................ 73 47 40 34 23 24 22No ............................. 68 33 32 22 19 17 17
1Percents are based on teachers who teach students with these characteristics.
SOURCE: U.S. Department of Education, National Center for Education Statistics, Fast Response Survey System, Teacher Survey onProfessional Development and Training, 1998.

—55—
classroom requirements, with those who recentlyparticipated in collaborative activities more likelyto report feeling very well prepared for theclassroom demand (table 25). For example,teachers who recently engaged in networkingwith teachers outside the school were more likelythan those who did not participate to report thatthey felt very well prepared to implement newteaching methods (45 versus 34 percent) andintegrate educational technology into the grade orsubject taught (23 versus 16 percent). Similarly,teachers who engaged in individual andcollaborative research felt better prepared thantheir peers to meet most of the classroomrequirements considered in the survey.
Mentoring relationships may yield benefits forboth mentor teachers and those who arementored. The survey found mixed patterns onthe relation between being mentored and teacherpreparedness for various classroom demands(table 25). Teacher preparedness for a fewclassroom requirements differed by whetherteachers were mentored. Teachers who werementored felt better prepared than their peers touse student performance techniques (33 versus 27percent) and address the needs of limited Englishproficient or culturally diverse students (23 versus19 percent) but less likely to report feeling verywell prepared to maintain order and discipline inthe classroom (61 versus 73 percent). Moreover,being mentored was not related to teacherpreparedness for the other four classroomrequirements examined in the survey. Onepossible interpretation of these findings is beingmentored may not necessarily contribute toteachers feeling better prepared for classroomdemands. However, the findings may also beclouded by the influence of teaching experienceon whether or not teachers were mentored. Asdiscussed earlier, for example, newer teacherswere far more likely than more experiencedteachers to be mentored, but they also felt lessprepared for classroom management.
In contrast to teachers who were mentored, thosewho served as mentors were more likely thantheir peers to report that they felt very wellprepared for six of seven classroom requirementsexamined in the survey (table 25). Again, thesepatterns may be clouded by the influence ofteaching experience, since experienced teachers
were more likely than newer teachers to serve asmentors.
Summary
Teachers’ feelings of preparedness are oneimportant indicator of the extent to which they areprepared to meet the challenges that characterizetheir profession. Results presented in this reportindicate that a majority of teachers felt either“moderately” or “somewhat” well prepared formost classroom requirements; relatively fewteachers felt “very well prepared” for many of theactivities. Although a majority of the teachersfelt very well prepared to manage classrooms and41 percent felt very well prepared to implementnew teaching methods, less than a third felt verywell prepared to integrate educational technologyor to address the needs of students with limitedEnglish proficiency or from culturally diversebackgrounds, or with disabilities.
Teachers’ feelings of preparedness may alsoprovide insight into the extent to whichopportunities for continued learning prepare themto teach. For example, do teachers who recentlyparticipated in formal professional developmentactivities or in collaborative activities actuallyfeel more prepared for various classroomrequirements than their peers? Results presentedin this section suggest that participation in theactivities yielded some positive outcomes forteacher preparedness.
In general, teachers who recently participated informal professional development felt betterprepared than their peers for most classroomdemands. Moreover, teachers’ feeling ofpreparedness increased significantly with thenumber of hours spent in professionaldevelopment activities. However, preparednessfor classroom demands did not always vary bywhether teachers spent less than 8 hours or didnot participate at all in formal professionaldevelopment, suggesting that the duration ofexposure to opportunities for learning may be animportant consideration.
Teachers who recently engaged in variouscollaborative activities also felt better preparedthan their peers to meet most classroom demands.For example, those who had common planning

—56—
periods for team teaching felt better equippedthan their peers to address many of the classroomdemands examined in the survey. In contrast,being mentored did not always yield similarbenefits; for example, teachers who werementored felt less prepared than their peers to
maintain order and discipline in the classroom.However, this finding may be clouded by the factthat newer teachers were far more likely to bementored than more experienced teachers, butthey also felt less prepared to manage classrooms.

—57—
6. CONCLUSIONS
This report began with the statement that anational profile of teacher quality is a necessarytool for tracking our progress toward the goal ofproviding every child with a high-quality teacher.As suggested, however, providing a nationalprofile of teacher quality is not an easy task.Teacher quality is a complex phenomenon,defined and measured in a variety of ways. Anoverview of this complexity was provided in thefirst chapter of this report.
In this study, teacher quality was defined asteachers’ preparation and qualifications, as wellas the environments in which they work. Teacherquality was measured using a large-scale surveyadministered to a nationally representative sampleof full-time public school teachers. Theframework for organizing this report began with adescription of different types of full-time publicschool teacher learning, continued with aconsideration of the support teachers receive intheir schools and communities, and ended with adiscussion of teachers’ feelings of preparedness.This was based on the assumption that thepreparation of high-quality teachers begins priorto entering their own classrooms (e.g., theirformal postsecondary training) and continuesonce they are on the job (e.g., their participationin professional development activities). Inaddition, teacher learning and preparation areenhanced in environments that support theirlearning and work. Finally, teachers’ feelings ofpreparedness were included because they are oneimportant indicator of the extent to whichteachers’ training has prepared them to meet thechallenges that characterize their profession.
Results of the 1998 survey address some of themajor concerns regarding teacher quality. Thedata on preservice learning indicate that full-timepublic school teachers possess many of the basicprerequisites for teaching—advanced degrees andthe appropriate certification and education. Forexample, virtually all the teachers had abachelor’s degree and about half had a master’sdegree. Two-thirds of high school teachers and44 percent of middle school teachers majored inan academic field. Moreover, most of the
teachers were fully certified in the field of theirmain teaching assignment.
Despite the fact that the measure of out-of-fieldteaching used in this report is conservative—itonly includes teachers’ main teachingassignments in core fields—the results indicatethat a number of educators were teaching out offield. For example, the percent of teachers ingrades 9 through 12 who reported having anundergraduate or graduate major or minor in theirmain teaching assignment field was 90 percentfor mathematics teachers, 94 percent for scienceteachers, and 96 percent for teachers inEnglish/language arts, social studies/socialscience, and foreign language. This means that10 percent of mathematics teachers, 6 percent ofscience teachers, and 4 percent of English/language arts, foreign language, and socialstudies/social science teachers in grades 9 through12 were teaching out of field. The percent ofteachers who reported having an undergraduate orgraduate major or minor in their main teachingassignment field was significantly lower forteachers of grades 7 through 12 than for teachersof grades 9 through 12 for mathematics (82percent), science (88 percent), English/languagearts (86 percent), and social studies/socialsciences (89 percent), indicating that teachers ingrades 7 and 8 are less likely to be teaching infield than are teachers in grades 9 through 12.
The data suggest that most teachers participate inactivities that provide opportunities for continuedlearning: almost all teachers had recentlyparticipated in at least one formal professionaldevelopment activity and one teacher-collaboration activity. Teachers were more likelyto have had professional development on topicsthat emphasize curricula and pedagogical shifts ineducation, including the implementation of stateor district curricula, the integration of technologyinto classroom instruction, and the implementa-tion of new teaching methods. Typically,participation in professional developmentactivities lasted 1 to 8 hours. Moreover,increased time spent in an activity wasconsistently associated with the perception of

—58—
significant improvements in teaching. Similarly,teachers who participated more frequently incollaborative activities were more likely thanthose who participated less frequently, or did notparticipate at all, to report that the experienceimproved their teaching “a lot.”
Results of the 1998 survey suggest that in manyrespects, teachers work in supportiveenvironments. For example, most teachersreported feelings of support from other teachersand the school administration, and most of themfelt that school goals and priorities were clear.However, the data also indicate aspects ofteachers’ work environments that can beimproved. On the issue of providing formalsupport for teachers during their early years ofteaching, the survey found that two-thirds ofAmerica’s teachers had not participated in aninduction program, although participation washigher for new teachers than for moreexperienced teachers. Moreover, teachersperceived less parental than collegial and schoolsupport. For example, one-third of teachersagreed strongly that parents support their work,although higher levels of parental support wereperceived by elementary school teachers thanhigh school teachers, and by teachers in schoolswith the lowest concentration of povertycompared to those with the highest concentrationof poverty.
Finally, results presented in this report indicatethat although a majority of teachers felt “very
well prepared” to manage classrooms, and 41percent felt very well prepared to implement newteaching methods, relatively few teachers feltvery well prepared for other core classroomrequirements. In particular, about 20 percent ofthe teachers felt very well prepared for classroomrequirements that have most recently become partof the repertoire of expectations for effectiveteaching: integrating educational technology, oraddressing the needs of students with limitedEnglish proficiency or from culturally diversebackgrounds, or those with disabilities.
This national profile of teacher quality providesimportant information regarding the preparationand qualifications of American teachers—theirpreservice learning, teaching assignment, oppor-tunities for continued learning, work environ-ment, and feelings of preparedness. However,this study does not address concerns raised byindividuals such as Mandel (1996, p. 3-31); thatis, that the indicators presented in this report“provide only the most modest threshold ofconfidence regarding the quality of practice in thenation’s schools.” In conjunction with theEducation Statistics Services Institute (ESSI) anda team of nationally regarded experts, theNational Center for Education Statistics iscurrently involved in developing measures ofteaching practices. Future plans may includecombining efforts to provide a profile of teacherquality that includes both teacher preparation andqualifications and teaching practices.

—59—
References
Achilles, C.M. (1996). Students achieve more in smaller classes. Educational Leadership, 53(3), 76-77.
Address Before the Congress on the State of the Union. (1997, February 4). White House ElectronicPublications. [online]. http//:www.pub.whitehouse.gov/uri-es/I2R?urn:pdi://oma.eop.gov.us/1997/2/5/6.text1.
Annual Back to School Address to the National Press Club. (1998, September). Remarks as prepared fordelivery by the U.S. Secretary of Education Richard W. Riley. [online].http://www.ed.gov/Speeches/980915.html.
Asian-Pacific Economic Cooperation. (1997). Overview of teacher induction policy and practice:Results of the exploratory survey. (Issue brief No. 97-HR-01.1). Washington, DC: Asian-PacificEconomic Cooperation.
Ball, D.L. (1990). Reflections and deflections of policy: The case of Carol Turner. EducationalEvaluation and Policy Analysis, 12(3), 263-275.
Ball, D.L. (1996). Teacher learning and the mathematics reforms: What we think we know and what weneed to learn. Phi Delta Kappan, (March), 500-508.
Ball, D.L., and Wilson, S.M. (1996). Integrity in teaching: Recognizing the fusion of the moral andintellectual. American Educational Research Journal, 33(1), 155-192.
Ballou, D., and Podgursky, M. (1997). Reforming teacher training and recruitment. Government UnionReview, 17(4), 1-47.
Ballou, D., and Podgursky, M. (1998). The case against teacher certification. Public Interest, 132, 17-29.
Carnegie Forum on Education and the Economy. (1986). Task Force on Teaching as a profession. Anation prepared: Teachers for the 21st century. New York: Carnegie Corporation.
Cohen, D.K. (1990). A revolution in one classroom: The case of Mrs. Oublier. Educational Evaluationand Policy Analysis, 12(3), 327-345.
Council of Chief State School Officers. (1998). Key state education policies on K-12 education.Washington, DC: CCSSO.
Darling-Hammond, L. (1998). Teachers and teaching: Testing policy hypotheses from a nationalcommission report. Educational Researcher, 27(1), 5-15.
Darling-Hammond, L., and McLaughlin, M.V. (1996). Policies that support professional development inan era of reform. In Teacher learning: New policies and practices, edited by M.V. McLaughlin andI. Oberman. New York: Teachers College Press.
Directive on Info Sharing: Promoting Excellence and Accountability in Teaching. (1996, September 12).White House Electronic Publications. [online]. http://www.pub.whitehouse.gov/uri-res/I2R?urn:pdi://oma.eop.gov.us/1996/9/12/1.text.1.

—60—
Education and Training Priorities for the Fall. (1998, August 31). [online]. http://www.ed.gov/PressReleases/08-1998.wh-0831.html.
Ferguson, R.F. (1990). Racial patterns in how school and teacher quality affect achievement andearnings. Dallas: Meadows Foundation.
Finn, J., and Achilles, C.M. (1990). Answers and questions about class size: a statewide experiment.American Educational Research Journal, 27(2), 557-577.
Fullan, M., with Stiegelbauer, S. (1991). The new meaning of educational change. New York:Teacher’s College Press.
Galvez-Hjornevik, C. (1986). Mentoring among teachers: A review of literature. (Report No.SP026700). Austin, TX: Journal of Teacher Education. (ERIC No. ED 262 032).
Gold, Y. (1996). Beginning teacher support: Attrition, mentoring, and induction. In Handbook ofresearch on teacher education, edited by J.P Sikula, T.J. Buttery, and E. Guyton. New York:Simon & Schuster Macmillan.
Holmes Group. (1986). Tomorrow’s teachers. East Lansing, MI: The Holmes Group, Inc.
Ingersoll, R. (June 1998). The problem of out-of-field teaching. [online].http://www.pdkintl.org/kappan/king9806.htm.
Interstate New Teacher Assessment and Support Consortium (1995). INTASC Core Standards. [online].http://develop.ccsso.cybercentral.com/intascst.htm.
Jones, V. (1996). Classroom management. In Handbook of research on teacher education, edited by J.PSikula, T.J. Buttery, and E. Guyton. New York: Simon & Schuster Macmillan.
King, S.H., and Bey, T.M. The need for urban teacher mentors. Education and Urban Society, 28, (1), 3-10.
Kruse, S.M., Lewis, K., and Bryk, A. (1994). Building professional community in schools. (Issue reportNo. 6). Madison, WI: University of Wisconsin-Madison, Center on Organization andRestructuring of Schools.
Leinhardt, G. (1989). Math lessons: A contrast of novice and expert competence. Journal for Research inMathematics Education, 20(1), 52-75.
Mandel, D.R. (1996). Teacher education, training, and staff development: Implications for nationalsurveys. In Conference proceedings. From data to information: New directions for the NationalCenter for Education Statistics, edited by G. Hoachlander, J.E. Griffith, and J.H. Ralph. NCES 96-901. Washington, DC: U.S. Department of Education.
McLaughlin, M.W., and Oberman, I. (1996). (Eds). Teacher learning: New policies and practices. NewYork: Teachers College Press.
National Association of Secondary School Principals. (1996). Breaking ranks: Changing an Americaninstitution. Reston, VA: NASSP.
National Board for Professional Teaching Standards. (1998). What teachers should know and be able todo. [online]. http://www.nbpts.org/nbpts/standards/intro.html.

—61—
National Commission on Teaching and America’s Future. (1996). What matters most: Teaching forAmerica’s future. New York: NCTAF.
National Commission on Teaching and America’s Future. (1997). Doing what matters most: Investing inquality teaching. New York: NCTAF.
Newmann. F.M. (1994). School-wide professional community. (Issue Report No. 6). Madison, WI:University of Wisconsin-Madison, Center on Organization and Restructuring of Schools.
Odden, A. (1990). Class size and student achievement: Research-based policy alternatives. EducationalEvaluation and Policy Analysis, 12(2), 213-227.
Peterson, P.L. (1990). Doing more in the same amount of time: Cathy Swift. Educational Evaluation andPolicy Analysis, 12(3), 277-296.
Ravitch, D. Lesson plan for teachers. The Washington Post, 10 August 1998, p. A17.
Sizer, T.R. (1992). Horace’s compromise: The dilemma of the American high school. Boston, MA:Houghton Mifflin Co.
Sprinthall, N.A., Reiman, A.J., and Theis-Sprinthall, L. (1996). Teacher professional development. InHandbook of research on teacher education, edited by J.P Sikula, T.J. Buttery, and E. Guyton.New York: Simon & Schuster Macmillan.
Stodolsky, S.S. (1984). Teacher evaluation: The limits of looking. Educational Researcher, 13(9), 11-18.
Stodolsky, S.S. (1996). Should SASS measure instructional processes and teacher effectiveness? In TheSchools and Staffing Survey: Recommendations for the future, edited by J. Mullins and D.Kasprzyk. NCES 97-597. Washington, DC: U.S. Department of Education.
Stodolsky, S.S., and Grossman, P.L. (1995). The impact of subject matter on curricular activity: Ananalysis of five academic subjects. American Educational Research Journal, 32(2), 227-249.
Sykes, G. (1990). Organizing policy into practice: Reactions to the cases. Educational Evaluation andPolicy Analysis, 12(3), 243-247.
Talbert, J.E., and McLaughlin, M.W. (1993). Understanding teaching in context. In Teaching forunderstanding: Challenges for policy and practice, edited by D.K. Cohen, M.W. McLaughlin, andJ.E. Talbert, pp. 1-10. San Francisco: Jossey-Bass Publishers.
U.S. Department of Education. (1988). Class size and public policy: Politics and panaceas,by T. Tomlinson. Washington, DC: U.S. Government Printing Office.
U.S. Department of Education. (1994a). Strong families, strong schools. Washington, DC: U.S.Government Printing Office.
U.S. Department of Education. National Center for Education Statistics. (1994b). Qualifications of thepublic school teacher workforce: 1988 and 1991. Statistical Analysis Report No. 95-665, by S.A.Bobbitt and M.M. McMillen. Washington, DC: U.S. Government Printing Office.
U.S. Department of Education. National Center for Education Statistics. (1996a). National assessments ofteacher quality. Working Paper No. 96-24, by Richard M. Ingersoll. Washington, DC: U.S.Government Printing Office.

—62—
U.S. Department of Education. National Center for Education Statistics. (1996b). Out-of-field teachingand educational equality. Statistical Analysis Report No. 96-040, by Richard M. Ingersoll.Washington, DC: U.S. Government Printing Office.
U.S. Department of Education. National Center for Education Statistics. (1996c). Are high schoolteachers teaching core subjects without college majors or minors in those subjects? Issue BriefIB-1-96, NCES 96-839, by Richard M. Ingersoll. Washington, DC: U.S. Department ofEducation.
U.S. Department of Education. National Center for Education Statistics. (1997). America’s teachers:Profile of a profession, 1993-94. NCES 97-460, by R.R. Henke, S.P. Choy, X. Chen, S. Geis,M.N. Alt, and S.P. Brougham. Washington, DC: U.S. Government Printing Office.
U.S. Department of Education. National Center for Education Statistics. (1998a). The TIMSS videotapeclassroom study: Methods and findings from an exploratory research project on eighth-grademathematics instruction in Germany, Japan, and the United States. Research and DevelopmentReport No. 98-047, by James W. Stigler, Patrick Gonzales, Takako Kawanaka, Steffen Knoll, andAna Serrano. Washington, DC: U.S. Government Printing Office.
U.S. Department of Education. National Center for Education Statistics. (1998b). School policies andpractices affecting instruction in mathematics. NCES 98-495, by E.F. Hawkins, F. Stancavage,and J.A. Dossey. Washington, DC: U.S. Government Printing Office.
U.S. Department of Education. National Center for Education Statistics. (1998c). Toward betterteaching professional development in 1993-94. Statistical Analysis Report No. 98-230, by S.Choy, X. Chen, and M. Ross. Washington, DC: U.S. Government Printing Office.
U.S. Department of Education. National Center for Education Statistics. (forthcoming). What happensin classrooms? Elementary and secondary school instruction, 1994-95, by R.R. Henke, X. Chen,and G. Golman. Washington, DC: U.S. Government Printing Office.
Westerman, D.A. (1991). Expert and novice teacher decision making. Journal of Teacher Education,42(4), 292-305.
Wise, A.E., Darling-Hammond, L., McLaughlin, M.W., and Bernstein, H.T. (1984). Teacher evaluation:A study of effective practices. (Report No. R-3139-NIE). Santa Monica, CA: The RandCorporation.
Word, E., Achilles, C., Bain, H.P., Folger, J., Johnston, J., and Lintz, M.N. (1990). The state ofTennessee's student/teacher ratio (STAR) project: Technical report. Nashville, TN: TennesseeDepartment of Education.
—63—
Suggested Readings
Achilles, C.M. (1996) Students achieve more in smaller classes. Educational Leadership, 53(3), 76-77.
This article reviews Tennessee’s Student/Teacher Ratio Project research, which found significanteducational benefits for children enrolled in smaller classes. The author cites many of the specificbenefits of smaller classes, such as increased attention for students, friendlier classes, and fewerdiscipline problems.
Address Before the Congress on the State of the Union. ( 1997, February 4). White House ElectronicPublications. [online]. http//:www.pub.whitehouse.gov/uri-es/I2R?urn:pdi://oma.eop.gov.us/1997/2/5/6.text.1.
In his 1997 State of the Union Address, President Clinton issued a “Call to Action,” stressing newcommitment to reshaping and refocusing American schools. The speech reflects the growingconcern over the shortage of quality teachers.
Annual Back to School Address to the National Press Club. (1998, September). Remarks as prepared fordelivery by the U.S. Secretary of Education Richard W. Riley. [online].http://www.ed.gov/Speeches/980915.html.
Riley’s speech discusses the current problems and future trends that face schools. The mostpressing is described as the “baby-boom echo,” which has led to record numbers in nationalenrollment and reinforces the need for more quality teachers.
Asian-Pacific Economic Cooperation. (1997). Overview of teacher induction policy and practice: resultsof the exploratory survey. (Issue brief No. 97-HR-01.1). Washington, DC: Asian-PacificEconomic Cooperation.
Authors Jay Moskowitz and Maria Stephens report on the state of policy and practice in teacherinduction programs among Asian-Pacific Economic Cooperation members.
Ball, D.L. (1990). Reflections and deflections of policy: The case of Carol Turner. EducationalEvaluation and Policy Analysis, 12(3), 263-275.
The article examines the teaching practices of one educator, showing how her approach bothadheres to and circumvents the curriculum framework established by the state.
Ball, D.L. (1996). Teacher learning and the mathematics reforms: What we think we know and what weneed to learn. Phi Delta Kappan, (March), 500-508.
Using classroom observations, this paper highlights the importance of two important aspects ofteaching. The authors argue that effective teaching must address both moral concerns andpedagogical content knowledge.

—64—
Ball, D.L., and Wilson, S.M. (1996). Integrity in teaching: Recognizing the fusion of the moral andintellectual. American Educational Research Journal, 33(1), 155-192.
The article focuses on teachers' learning process. It argues that school reform will not be fullyenacted until reformers have a better understanding of how teachers learn. Only then can newstandards and reforms be successfully implemented.
Ballou, D., and Podgursky, M. (1997). Reforming teacher training and recruitment. Government UnionReview, 17(4), 1-47.
Ballou, D., and Podgursky, M. (1998). The case against teacher certification. Public Interest, 132, 17-29.
The authors provide critical look at the recommendations for changes in the teacher trainingprocess put forth by the National Commission on Teaching and America’s Future (NCTAF) in a1996 report. The authors argue that more extensive training will not lead to an increase in thequality of teachers.
Carnegie Forum on Education and the Economy. (1986). Task Force on teaching as a profession. Anation prepared: Teachers for the 21st century. New York: Carnegie Corporation.
The Carnegie Forum on Education and the Economy calls for sweeping changes in educationpolicy in an effort to redefine the essential standards of American education. Ideas such asrestructuring schools, the development of a professional curriculum for teacher preparationprograms, and new requirements for the teacher certification are described.
Center for Education Reform. (1998). Fifteen years after A Nation at Risk. [online].http://edreform.com/pubs/manifest.htm.
This document compares and discusses data gathered on characteristics of the education systemand discussed in the 1983 report by the National Commission on Excellence in Education, ANation at Risk, to data collected in the same areas in 1998. The report ends with ten recommendedchanges in education for the next century.
Cohen, D.K. (1990). A revolution in one classroom: The case of Mrs. Oublier. Educational Evaluationand Policy Analysis, 12(3), 327-345.
This paper investigates the teaching practices of one elementary school teacher, who claims to havealtered her instruction methods in response to a new state policy. The article explores whichaspects of the policy the teacher has adopted and which she has rejected.
Council of Chief State School Officers. (1998). Key state education policies on K-12 education.Washington, DC: CCSSO.
This report is part of a continuing series by the CCSSO created to inform policymakers andeducators on the current status of key policies in education that shape and define education inAmerican public schools.

—65—
Darling-Hammond, L. (1998). Teachers and teaching: testing policy hypotheses from a nationalcommission report. Educational Researcher, 27(1), 5-15.
Darling-Hammond analyzes the NCTAF’s 1996 report on problems present in current teachertraining programs.
Darling-Hammond, L., and McLaughlin, M.V. (1996). Policies that support professional development inan era of reform. In Teacher learning: New policies and practices, edited by M.V. McLaughlin andI. Oberman. New York: Teachers College Press.
Darling-Hammond and McLaughlin explore the practice and policy of staff development in termsof recent developments in teacher learning.
Directive on Info Sharing: Promoting Excellence and Accountability in Teaching. (1996, September 12).White House Electronic Publications. [online]. http://www.pub.whitehouse.gov/uri-res/I2R?urn:pdi://oma.eop.gov.us/1996/9/12/1.text.1.
In this memorandum to the Secretary of Education, the President focuses on the need for high-quality teachers in national schools. A reward system for good teachers, tougher licensing andcertification measures, and removal of incompetent teachers are some of the standardsrecommended in this effort.
Education and Training Priorities for the Fall. (1998, August 31). [online].http://www.ed.gov/PressReleases/08-1998/wh-0831.html.
In a press release, the education and training priorities for the year’s remaining congressionalsession are presented and outlined. The President’s commitment to reducing class sizes byproviding more well-prepared teachers in the early grades is highlighted.
Feiman-Nemser, S. (1996). Teacher mentoring: A critical review. Washington, DC: ERIC Digest.(ERIC ED 397060).
This article discusses the growth of mentoring, the obstacles to realizing the potential of mentoringas a method of reform, needed research, and selected issues of policy and practice.
Feistritzer, C.E. ( 1996). Profiles of teachers in the U.S. Washington, DC: National Center forEducation Information.
The report presents the findings of an ongoing survey conducted by the National Center forEducation Information in an effort to gain better understanding of teachers and the teachingprofession.
Ferguson, R.F. (1990). Racial patterns in how school and teacher quality affect achievement andearnings. Dallas: Meadows Foundation.
Ferguson examines findings of the Texas examination of administrators and teachers. Fergusonfinds that student performance is improved by teachers with strong language skill, classrooms with18 or fewer students, teachers with more experience, and teachers with master’s degrees.

—66—
Finn, J., and Achilles, C.M. (1990). Answers and questions about class size: a statewide experiment.American Educational Research Journal, 27(3), 557-577.
Finn and Achilles discuss the results of an experiment involving kindergarten students. Studentsand teachers were randomly assigned to small and large classes within participating schools.Students remained in these classes for 2 years, with testing done at the end of each year in mathand reading. Longitudinal analysis of a portion of the sample indicated that students in smallerclasses outperformed those in regular size kindergarten classes.
Fox, J. (1995). Teacher incubation time cut back in California. Education Daily, 5 October, 1-2.
Fox explains the change in California law in response to the state’s teacher shortage that allowscolleges to develop 4-year interdisciplinary majors combining liberal arts instruction witheducation training. Previously, the state prohibited universities from offering extensive teacherpreparation, mandating that such training be part of a fifth year of study.
Fullan, M., with Stiegelbauer, S. (1991). The new meaning of educational change. New York:Teacher’s College Press.
Fullan and Steigelbauer argue that teacher education should be viewed as a career-long propositionin the effort to move toward effective education reform.
Galvez-Hjornevik, C. (1986). Mentoring among teachers: A review of literature. (Report No.SP026700). Austin, TX: Journal of Teacher Education. (ERIC No. ED 262 032).
The author reviews prior studies of mentoring relationships and identifies the characteristics ofsuccessful mentor-protégé interaction.
Gold, Y. (1996). Beginning teacher support: Attrition, mentoring, and induction. In Handbook ofresearch on teacher education, edited by J.P Sikula, T.J. Buttery, and E. Guyton. New York:Simon & Schuster Macmillan.
Gold discusses the importance of early and continuous support to beginning teachers in preventingattrition and burnout and promoting retention and career satisfaction.
Holmes Group. (1986). Tomorrow’s teachers. East Lansing, MI: The Holmes Group, Inc.
The Holmes Group report outlines the organization’s goals for the reform of teacher education.The group states that their first goal, “to make the education of teachers intellectually more solid,”is a critical step in reforming the education system.
Ingersoll, R. (June 1998). The problem of out-of-field teaching. [online]http://www.pdkintl.org/kappan/king9806.htm.
Ingersoll presents the consideration of out-of-field teaching as a critical issue in the Americaneducation system.

—67—
Interstate New Teacher Assessment and Support Consortium (1995). INTASC Core Standards. [online].http://develop.ccsso.cybercentral.com/intascst.htm.
This document lists the INTASC core standards for granting licenses to new teachers and serves asa framework for the reform of teacher preparation and professional development. These principlesrepresent characteristics that the group feels should be present in all teaching regardless of thesubject or grade level taught.
Jones, V. (1996). Classroom management. In Handbook of research on teacher education, edited by J.PSikula, T.J. Buttery, and E. Guyton. New York: Simon & Schuster Macmillan.
Jones examines the role of classroom management in teacher effectiveness. The author calls forstudies to explore various approaches in educating teachers in this area.
King, S.H., and Bey, T.M. (1995). The need for urban teacher mentors. Education and Urban Society,28, (1), 3-10.
The authors focus on the potential for urban teachers to improve their teaching through mentoringsupport.
Kruse, S.M., Lewis, K., and Bryk, A. (1994). Building professional community in schools. (Issue reportNo. 6). Madison, WI: University of Wisconsin-Madison, Center on Organization andRestructuring of Schools.
The authors call for an attention shift in education reform toward the creation of a professionalcommunity founded on encouragement and support for teachers.
Leinhardt, G. (1986). The cognitive skill of teaching. Journal of Educational Psychology, 78(2), 75-95.
This article characterizes teaching as a complex cognitive skill that can be analyzed in a mannersimilar to other skills described by cognitive psychology. Elementary mathematics instruction byboth expert and novice teachers is examined based on the theory that teaching skill is built on twofundamental knowledge systems: lesson structure and subject matter.
Leinhardt, G. (1989). Math lessons: A contrast of novice and expert competence. Journal for Research inMathematics Education, 20(1), 52-75.
Leinhardt compares the teaching practices exhibited by expert teachers to those of novice teachers.The results of this comparison highlight the nature of the competencies that expert teachers possessand suggest some areas of instruction for future teachers.
Little, J.W. (1993). Teachers’ professional development in a climate of educational reform. (Report No.SP035393). New York: NCREST. (ERIC No. ED 373 049).
Little argues that professional development focused primarily on expanding an individual'srepertoire of classroom skills is not adequate achieve reform in education.

—68—
Mandel, D.R. (1996). Teacher education, training, and staff development: Implications for nationalsurveys. In Conference proceedings. From data to information: New directions for the NationalCenter for Education Statistics, edited by G. Hoachlander, J.E. Griffith, and J.H. Ralph. NCES 96-901. Washington, DC: U.S. Department of Education.
This document summarizes discussion intended to aid planning for NCES future activitiesspecifically in areas of substance, technology, and methodology of data collection, analysis, anddissemination. Mandel believes that consensus about what teachers should know and be able to doin the classroom is necessary for effective reform.
McLaughlin, M.W., and Oberman, I. (1996). (Eds). Teacher learning: New policies and practices. NewYork: Teachers College Press.
McLaughlin and Oberman focus on the practice and policy of staff development in terms of recentdevelopments in teacher learning.
National Association of Secondary School Principals. (1996). Breaking ranks: Changing an Americaninstitution. Reston, VA: NASSP.
The report focuses on revitalizing education for all students and points to what is needed for the21st century high school. Eighty recommendations are presented in the effort to ensure that everystudent receives a complete, student-centered, and high quality education.
National Board for Professional Teaching Standards. (1998). What teachers should know and be able todo. [online]. http://www.nbpts.org/nbpts/standards/intro.html.
This publication details the National Board’s vision of excellence in teaching. High and rigorousstandards for what teachers should know and be able to do are incorporated into a voluntarycertification system created by the organization.
National Commission on Teaching and America’s Future. (1996). What matters most: Teaching forAmerica’s future. New York: NCTAF.
The NCTAF attempts to provide “a blueprint for recruiting, preparing, and supporting excellentteachers in all of America’s schools” in this report.
National Commission on Teaching and America’s Future. (1997). Doing what matters most: Investingin quality teaching. New York: NCTAF.
A followup to the Commission’s What Matters Most: Teaching for America’s Future, this reportrevisits previous recommendations, offers new data about how investments in teaching improvestudent achievement, and gives an overview of the nation’s progress toward quality teaching.
National Council for Accreditation of Teacher Education. (1997). Introduction to draft accreditationstandards for candidates in elementary teacher programs. [online].http://www.ncate.org/projects/npt/PSDPstds.html.
This Council draft supports the group’s commitment to developing performance-basedexpectations for teacher preparation aligned with other organizations focusing on reforming teacherquality.
—69—
Nelson, B.S., and Hammerman, J.K. (1996). Reconceptualizing teaching: Moving toward the creation ofintellectual communities of students, teachers and teacher educators. In Teacher learning: Newpolicies and practices, edited by M.W. McLaughlin and I. Oberman. New York: Teachers CollegePress.
Nelson and Hammerman call for a movement toward conceiving teaching as an intellectual, ratherthan technical, endeavor. Innovative professional development programs are identified as thecatalysts to this movement.
Newmann, F.M. (1992) Student engagement and achievement in American secondary schools. NewYork: Teachers College Press.
Newmann presents findings from research from five projects conducted by the National Center onEffective Secondary Schools.
Newmann, F.M. (1994). School-wide professional community. (Issue Report No. 6). Madison, WI:University of Wisconsin-Madison, Center on Organization and Restructuring of Schools.
In this article, the author considers the issue of collaboration among school staff. He summarizesthe barriers to collaboration, offers a vision of the effective school community, and providesexamples of schools that have restructured to develop their professional communities.
Newmann, F.M., Marks, H.M., and Gamoran, A. (1995). Authentic pedagogy and student performance.Paper presented to the annual meeting of the American Educational Research Association, April,San Francisco, CA.
The authors argue that although important distinctions may be made between progressive, student-centered, and constructivist teaching, they all are grounded in emphasis on active learning.
Newmann, F.M., Secada, W.G., and Wehlage, G.G. (1995). A guide to authentic instruction andassessment: Vision, standards, and scoring. Madison. WI: Wisconsin Center for EducationResearch.
The authors attempt to develop standards for judging the intellectual quality of schoolwork,regardless of the form of teaching and assessment techniques used. Researchers observed over 700lessons in 24 schools in this effort.
Newmann, F.M., and Wehlage, G.G. (1993). Five standards of authentic instruction. EducationalLeadership, 50(7), 8-12.
Newmann and Wehlage argue that innovations alone will not lead to improved achievement.Authentic instruction is divided into five standard categories: higher order thinking, depth ofknowledge, connectedness of the work, substantive conversation, and social support for studentachievement.
—70—
Odden, A. (1990). Class size and student achievement: Research-based policy alternatives. EducationalEvaluation and Policy Analysis, 12(2), 213-227.
Odden reviews literature on the relation between class size and student achievement and suggestspolicy alternatives. Class size reduction strategies are proposed for primary and secondaryinstruction.
Peterson, P.L. (1990). Doing more in the same amount of time: Cathy Swift. Educational Evaluation andPolicy Analysis, 12(3), 277-296.
Peterson examines the perspectives and practices of an elementary mathematics teacher in relationto the educator’s knowledge and beliefs, tangled layers of policy, and multiple uncertainties andconflicts.
Promising Practices: New ways to improve teacher quality. (1998). [online].http://www.ed.gov/PromPractice.
This publication by the Department of Education considers several ideas for improving the qualityteachers in American schools. Recruitment, preparation, new licensing and certification standards,and improved professional development are major areas explored.
Ravitch, D. Lesson plan for teachers. The Washington Post, 10 August, 1998, p. A17.
In an editorial, the author suggests that improvements in the education of teachers must be made.Future teachers should have an academic major in the subject that they intend to teach.
Schwartz, J., and Warren, P. (1997). Class size reduction. [online].http://www.lao.ca.gov/class_size_297.html.
In a report prepared for the California Legislative Analyst’s Office, results on findings from a studyon the state’s class size reduction program are presented.
Sizer, T.R. (1992). Horace’s compromise: The dilemma of the American high school. Boston, MA:Houghton Mifflin Co.
This book urges renewed public attention to the importance of teaching in high schools and to thecomplexity and subtlety of being an educator. Sizer supports the belief that the abilities andmethods of the teachers in a school are of great importance.
Sprinthall, N.A., Reiman, A.J., and Theis-Sprinthall, L. (1996). Teacher professional development. InHandbook of research on teacher education, edited by J.P Sikula, T.J. Buttery, and E. Guyton.New York: Simon & Schuster Macmillan.
Sprinthall, Reiman, and Theis-Sprinthall focus on the emergence of teacher development as apressing issue in education and review existing research on the subject.

—71—
Stodolsky, S.S. (1984). Teacher evaluation: The limits of looking. Educational Researcher, 13(9), 11-18.
Stodolsky reviews current practices in teacher evaluation with particular focus on observation. Theauthor maintains that limitations in the use of observation must be acknowledged and addressed inteacher evaluation settings.
Stodolsky, S.S. (1996). Should SASS measure instructional processes and teacher effectiveness? In Theschools and staffing survey: Recommendations for the future. NCES Report 97-596, by JohnMullens and Daniel Kasprzyk. Washington, DC: U.S. Department of Education, National Centerfor Education Statistics.
The author addresses data collection on instructional practices and teacher effectiveness. Stodolskyalso examines how teacher effectiveness is conceptualized.
Stodolsky, S.S., and Grossman, P.L. (1995). The impact of subject matter on curricular activity: Ananalysis of five academic subjects. American Educational Research Journal, 32(2), 227-249.
This article tests the framework connecting subject matter with curricular activities among highschool teachers of five academic subjects. The concepts of subject matter and curricular activitiesof English, social studies, science, math, and foreign language teachers in 16 high schools arecompared.
Sweeney, B.W. (1994). A new teacher mentoring knowledge base. [online].http://www.mentors.net/Library Files/Knowlbase.html.
Sweeney shares his ideas on mentoring as a professional development activity. Roles and tasks ofmentors, expectations and matching of mentors and proteges, selection of mentors, and other topicsare discussed.
Sykes, G. (1990). Licensure and certification of teachers: An appraisal. In The new handbook of teacherevaluation assessing elementary and secondary school teachers, edited by J. Millman and L.Darling-Hammond, pp. 62-75. Newbury Park, CA: Corwin Press.
Sykes considers the controversy surrounding agreement on the minimum qualifications associatedwith the issuance of teaching credentials.
Talbert, J.E., and McLaughlin, M.W. (1993). Understanding teaching in context. In Teaching forunderstanding: Challenges for policy and practice, edited by D.K. Cohen, M. W. McLaughlin, andJ. E. Talbert, pp. 1-10. San Francisco: Jossey-Bass Publishers.
Using the “teaching for understanding concept” as an example, the authors discuss the challengesthat reform efforts face inside and outside of schools.
U.S. Department of Education. (1988). Class size and public policy: Politics and panaceas,by T. Tomlinson. Washington, DC: U.S. Government Printing Office.
Tomlinson reviews the issue of class size reduction. Data from research on the subject areanalyzed in search of a relationship between class size and educational improvement. The authorcites findings supporting the view that the costs of class size reduction outweigh the benefits.

—72—
U.S. Department of Education. (1994). Strong families, strong schools. Washington, DC: U.S.Government Printing Office.
This document examines the role of families play in the education of children. The results ofprevious research and possible aspects of modern life that prevent and limit family involvement arediscussed.
U.S. Department of Education. National Center for Education Statistics. (1994). Qualifications of thepublic school teacher workforce: 1988 and 1991. Statistical Analysis Report No. 95-665, by S.A.Bobbitt and M.M. McMillen. Washington, DC: U.S. Government Printing Office.
This report examines the qualifications of public school teachers based on their field ofcertification and college major or minor, with particular emphasis on the extent of out-of-fieldteaching.
U.S. Department of Education. National Center for Education Statistics. (1995). Teacher supply in theUnited States: Sources of newly hired teachers in public and private schools, 1988-1991.Statistical Analysis Report No. 95-348, by M.R. Rollefson and S.P. Broughman. Washington, DC:National Center for Education Statistics.
This report provides analysis of data from the 1991 SASS on newly hired teachers. The changes inrates of entry, qualifications, and characteristics of new entrants are compared with 1988 SASSdata.
U.S. Department of Education. National Center for Education Statistics. (1996). National assessments ofteacher quality. Working Paper No. 96-24, by R.M. Ingersoll. Washington, DC: U.S. GovernmentPrinting Office.
This NCES paper addresses the subject of teacher quality. An outline of issues and questions inthis area, a review of the predominant approaches to assessing teacher quality, and an alternativeto current assessment methods are provided.
U.S. Department of Education. National Center for Education Statistics. (1996). Out-of-field teaching andeducational equality. Statistical Analysis Report No. 96-040, by Richard M. Ingersoll.Washington, DC: U.S. Government Printing Office.
This report presents national data on the extent to which students in the nation's public secondaryschools are taught by teachers without basic qualifications in their assigned teaching fields. It seeksto address the question of whether inequalities exist in the distribution of adequately qualifiedteachers across and within different schools in the United States.
U.S. Department of Education. National Center for Education Statistics. (1996). Are high schoolteachers teaching core subjects without college majors or minors in those subjects? Issue BriefIB-1-96, NCES 96-839, by Richard M. Ingersoll. Washington, DC: U.S. Department ofEducation.
In this NCES Issue Brief, Ingersoll reports the percent of public and private high school teachersteaching at least one core curriculum subject without a college major or minor in the subject.

—73—
U.S. Department of Education. National Center for Education Statistics. (1997). America’s teachers:Profile of a profession, 1993-94. NCES 97-460, by R.R. Henke, S.P. Choy, X. Chen, S. Geis,M.N. Alt, and S.P. Brougham. Washington, DC: U.S. Government Printing Office.
This report addresses a wide range of topics related to teachers and teaching in the United States.Topics include teachers' demographic characteristics and various characteristics of their schoolsand students; teachers' preparation and professional development experiences, their workloads,teaching practices, compensation, satisfaction with and opinions regarding their workingconditions, and the supply and demand of teachers.
U.S. Department of Education. National Center for Education Statistics. (1997). Characteristics ofstayers, movers, and leavers: results from the teacher follow-up survey: 1994-95. Report No. 97-450, by S.D. Whitener, K.J. Gruber, H. Lynch, K. Tingoes, M. Perona, and S. Fondelier.Washington, DC: U.S. Government Printing Office.
This report presents national data on the extent to which students in the nations’ public secondaryschools are taught by teachers without basic qualifications in their assigned teaching fields. It seeksto address the question of whether inequalities exist in the distribution of adequately qualifiedteachers across and within different schools in the United States.
U.S. Department of Education. National Center for Education Statistics. (1997). Projections of educationstatistics to 2007. Report No. 97-382, by D.E. Gerald and W.J. Hussar. Washington, DC: NCES.
This report provides projections for key education statistics on enrollment, graduates, classroomteachers, and expenditures in elementary and secondary schools.
U.S. Department of Education. National Center for Education Statistics. (1998). Parent involvement inchildren’s education: Efforts by public elementary schools. Statistical Analysis Report No. 98-032,by N. Carey, L. Lewis, and E. Farris. Washington, DC: NCES.
This report presents data from a study designed to provide information on the ways that schoolsengage parents in their children’s education. The ways in which parents respond to availableopportunities for involvement is also explored.
U.S. Department of Education. National Center for Education Statistics. (1998). School policies andpractices affecting instruction in mathematics. NCES 98-495, by E.F. Hawkins, F. Stancavage,and J.A. Dossey. Washington, DC: U.S. Government Printing Office.
This report describes the educational policies and practices affecting instruction in mathematics,with particular attention to the relationship between these policies and practices and studentperformance on the NAEP mathematics assessment.

—74—
U.S. Department of Education. National Center for Education Statistics. (1998). The TIMSS videotapeclassroom study: Methods and findings from an exploratory research project on eighth-grademathematics instruction in Germany, Japan, and the United States. Research and DevelopmentReport No. 98-047, by James W. Stigler, Patrick Gonzales, Takako Kawanaka, Steffen Knoll, andAna Serrano. Washington, DC: U.S. Government Printing Office.
This report discusses the data from the TIMSS attempt to collect videotaped records of classroominstruction from national representative samples of teachers. The project centers on betterunderstanding of how the processes of classroom instruction in different cultures will contribute toefforts to improve student learning in school.
U.S. Department of Education. National Center for Education Statistics. (1998). Toward better teachingprofessional development in 1993-94. Statistical Analysis Report No. 98-230, by S. Choy, X.Chen, and M. Ross. Washington, DC: U.S. Government Printing Office.
This report examines who determines the content, duration, and format of professionaldevelopment programs for teachers. Focus is also placed on whether the opportunity for qualityassessment of professional development programs are given to teachers.
U.S. Department of Education. National Center for Education Statistics. (forthcoming). What happensin classrooms? Elementary and secondary school instruction, 1994-95, by R.R. Henke, X. Chen,and G. Golman. Washington, DC: U.S. Government Printing Office.
This publication reports on the teaching practices of elementary and secondary school teachers.Using data compiled in a national survey of teachers, the report assesses the variation in instructionstrategies among teachers. The report also presents data on the roles teachers play, teachers' use ofinstructional materials, the types of learning tasks employed by teachers, and teachers' assessmentof student learning.
Westerman, D.A. (1991). Expert and novice teacher decision making. Journal of Teacher Education,42(4), 292-305.
Westerman provides indepth comparisons of the teaching practices exhibited by novice and expertteachers in lesson planning and presentation.
Wise, A.E., Darling-Hammond, L., McLaughlin, M.W., and Bernstein, H.T. (1984). Teacher Evaluation:A Study of Effective Practices. (Report No. R-3139-NIE). Santa Monica, CA: The RandCorporation.
The authors identify teacher evaluation systems as capable of defining the nature of teaching andeducation in schools by either reinforcing the teaching as a profession, or furtherdeprofessionalizing the field.
Word, E., Achilles, C., Bain, H.P., Folger, J., Johnston, J., and Lintz, M.N. (1990). The state ofTennessee's student/teacher ratio (STAR) project: Technical report. Nashville, TN: TennesseeDepartment of Education.
This report presents results of Tennessee's 4-year longitudinal class size project, Student TeacherAchievement Ratio (STAR). The study analyzes student achievement and development in threeclass types: small classes with 13-17 students per teacher, regular classes with 22-25 students perteacher, and regular classes with 22-25 students per teacher assisted by a full-time teacher’s aide.
A-1
Appendix A
Sample Methodology and Data Reliability

A-2

A-3
Table of Contents
Page
Sample Selection ................................................................................................................... A-5Respondent and Response Rates ............................................................................................ A-6Sampling and Nonsampling Errors ........................................................................................ A-6Variances .............................................................................................................................. A-8Definitions of Analysis Variables .......................................................................................... A-8Comparisons to the 1993-94 Schools and Staffing Survey...................................................... A-10Calculations of Major Field of Study for a Bachelor’s or Graduate Degree............................. A-11Calculations of In-Field Teaching.......................................................................................... A-13Background Information........................................................................................................ A-14
List of Appendix Tables
Table
A-1 Number and percent of responding full-time public school teachers in the studysample and estimated number and percent of full-time public school teachers thesample represents, by selected school and teacher characteristics: 1998 ..................... A-7
A-2 Percent of full-time public school teachers with any undergraduate or graduate majorin various fields of study, by selected school and teacher characteristics: 1998.......... A-12
A-3 Percent of full-time public school teachers with any undergraduate or graduate majorin various fields of study, by selected school and teacher characteristics: 1993-94 .... A-12
List of Appendix Exhibits
Exhibit
A-1 Match of main teaching assignment field with major and minor fields of study:FRSS 1998................................................................................................................. A-13
A-2 Match of main teaching assignment field with major and minor fields of study:SASS 1993-94 ........................................................................................................... A-14

A-4
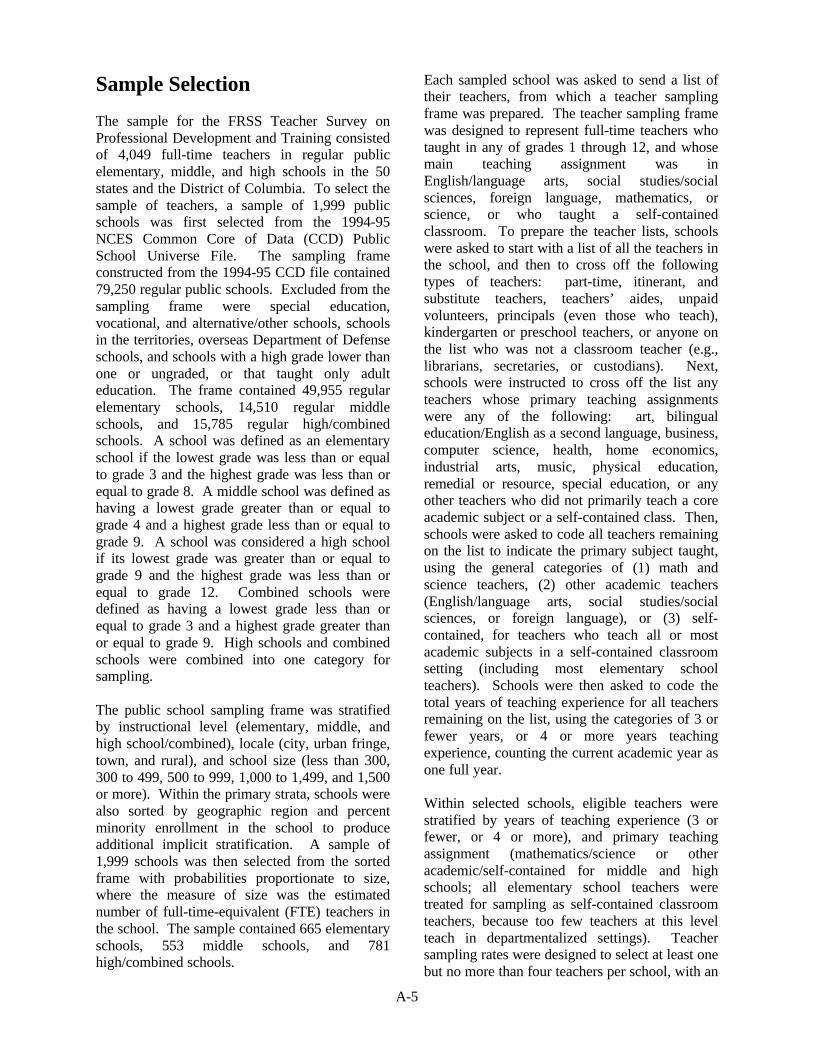
A-5
Sample Selection
The sample for the FRSS Teacher Survey onProfessional Development and Training consistedof 4,049 full-time teachers in regular publicelementary, middle, and high schools in the 50states and the District of Columbia. To select thesample of teachers, a sample of 1,999 publicschools was first selected from the 1994-95NCES Common Core of Data (CCD) PublicSchool Universe File. The sampling frameconstructed from the 1994-95 CCD file contained79,250 regular public schools. Excluded from thesampling frame were special education,vocational, and alternative/other schools, schoolsin the territories, overseas Department of Defenseschools, and schools with a high grade lower thanone or ungraded, or that taught only adulteducation. The frame contained 49,955 regularelementary schools, 14,510 regular middleschools, and 15,785 regular high/combinedschools. A school was defined as an elementaryschool if the lowest grade was less than or equalto grade 3 and the highest grade was less than orequal to grade 8. A middle school was defined ashaving a lowest grade greater than or equal tograde 4 and a highest grade less than or equal tograde 9. A school was considered a high schoolif its lowest grade was greater than or equal tograde 9 and the highest grade was less than orequal to grade 12. Combined schools weredefined as having a lowest grade less than orequal to grade 3 and a highest grade greater thanor equal to grade 9. High schools and combinedschools were combined into one category forsampling.
The public school sampling frame was stratifiedby instructional level (elementary, middle, andhigh school/combined), locale (city, urban fringe,town, and rural), and school size (less than 300,300 to 499, 500 to 999, 1,000 to 1,499, and 1,500or more). Within the primary strata, schools werealso sorted by geographic region and percentminority enrollment in the school to produceadditional implicit stratification. A sample of1,999 schools was then selected from the sortedframe with probabilities proportionate to size,where the measure of size was the estimatednumber of full-time-equivalent (FTE) teachers inthe school. The sample contained 665 elementaryschools, 553 middle schools, and 781high/combined schools.
Each sampled school was asked to send a list oftheir teachers, from which a teacher samplingframe was prepared. The teacher sampling framewas designed to represent full-time teachers whotaught in any of grades 1 through 12, and whosemain teaching assignment was inEnglish/language arts, social studies/socialsciences, foreign language, mathematics, orscience, or who taught a self-containedclassroom. To prepare the teacher lists, schoolswere asked to start with a list of all the teachers inthe school, and then to cross off the followingtypes of teachers: part-time, itinerant, andsubstitute teachers, teachers’ aides, unpaidvolunteers, principals (even those who teach),kindergarten or preschool teachers, or anyone onthe list who was not a classroom teacher (e.g.,librarians, secretaries, or custodians). Next,schools were instructed to cross off the list anyteachers whose primary teaching assignmentswere any of the following: art, bilingualeducation/English as a second language, business,computer science, health, home economics,industrial arts, music, physical education,remedial or resource, special education, or anyother teachers who did not primarily teach a coreacademic subject or a self-contained class. Then,schools were asked to code all teachers remainingon the list to indicate the primary subject taught,using the general categories of (1) math andscience teachers, (2) other academic teachers(English/language arts, social studies/socialsciences, or foreign language), or (3) self-contained, for teachers who teach all or mostacademic subjects in a self-contained classroomsetting (including most elementary schoolteachers). Schools were then asked to code thetotal years of teaching experience for all teachersremaining on the list, using the categories of 3 orfewer years, or 4 or more years teachingexperience, counting the current academic year asone full year.
Within selected schools, eligible teachers werestratified by years of teaching experience (3 orfewer, or 4 or more), and primary teachingassignment (mathematics/science or otheracademic/self-contained for middle and highschools; all elementary school teachers weretreated for sampling as self-contained classroomteachers, because too few teachers at this levelteach in departmentalized settings). Teachersampling rates were designed to select at least onebut no more than four teachers per school, with an

A-6
average of about two, and were designed to beself-weighting (equal probability) samples withinstrata. A total of 4,049 teachers were selected.The sample contained 1,350 elementary school,1,130 middle school, and 1,569 highschool/combined teachers.
Respondent and Response Rates
A letter and instruction sheet for preparing the listof teachers was sent to the principal of eachsampled school in September 1997. The letterintroduced the study, requested the principal’scooperation to sample teachers, and asked theprincipal to prepare a list of teachers that includedonly full-time teachers of self-contained classesor core academic subjects. Telephone followupwas conducted from October 1997 through March1998 with principals who did not respond to theinitial request for teacher lists. Of the 1,999schools in the sample, 14 were found to be out ofthe scope of the survey (no longer in existence),for a total of 1,985 eligible schools. Teacher listswere provided by 1,818 schools, or 92 percent ofthe eligible schools. The weighted response rate1
to the teacher list collection was 93 percent.
Questionnaires were mailed to the teachers in twophases, so that data collection on the teacherquestionnaire would not be delayed while the listcollection phase was being completed. The firstphase of questionnaires was mailed in mid-February 1998, and the second in mid-March1998. Telephone followup was conducted fromMarch through June 1998 with teachers who didnot respond the initial questionnaire mailing. Inaddition, a postcard prompt was sent tononresponding teachers in April 1998. Of the4,049 teachers selected for the sample, 183 werefound to be out of the scope of the survey, usuallybecause they were not a regular full-timeclassroom teacher, or because their main teachingassignment was not in a core academic subject oras a self-contained classroom teacher. This left atotal of 3,866 eligible teachers in the sample.Completed questionnaires were received from3,560 teachers, or 92 percent of the eligibleteachers. The weighted teacher response rate wasalso 92 percent. The unweighted overall responserate was 84 percent (91.6 percent for the list
1 All weighted response rates were calculated using the base weight.
collection multiplied by 92.1 percent for theteacher questionnaire). The weighted overallresponse rate was 86 percent (93.1 percent for thelist collection multiplied by 92.1 percent for theteacher questionnaire). Weighted itemnonresponse rates ranged from 0 percent to 1.9percent. Because the item nonresponse was solow, imputation for item nonresponse was notimplemented.
Sampling andNonsampling Errors
The responses were weighted to produce nationalestimates (see table A-1). The weights weredesigned to adjust for the variable probabilities ofselection and differential nonresponse. Thefindings in this report are estimates based on thesample selected and, consequently, are subject tosampling variability.
The survey estimates are also subject tononsampling errors that can arise because ofnonobservation (nonresponse or noncoverage)errors, errors of reporting, and errors made in datacollection. These errors can sometimes bias thedata. Nonsampling errors may include suchproblems as misrecording of responses; incorrectediting, coding, and data entry; differences relatedto the particular time the survey was conducted;or errors in data preparation. While generalsampling theory can be used in part to determinehow to estimate the sampling variability of astatistic, nonsampling errors are not easy tomeasure and, for measurement purposes, usuallyrequire that an experiment be conducted as part ofthe data collection procedures or that dataexternal to the study be used.
To minimize the potential for nonsampling errors,the questionnaire was pretested with respondentslike those who completed the survey. During thedesign of the survey and the survey pretest, aneffort was made to check for consistency ofinterpretation of questions and to eliminateambiguous items. The questionnaire andinstructions were extensively reviewed by theNational Center for Education Statistics and theOffice of the Secretary, U.S. Department ofEducation. Manual and machine editing of the

A-7
Table A-1.—Number and percent of responding full-time public school teachers in the studysample and estimated number and percent of full-time public school teachers thesample represents, by selected school and teacher characteristics: 1998
Respondent sample National estimateSchool and teacher characteristic
Number Percent Number Percent
All targeted public school teachers1 ............................................ 3,560 100 1,460,261 100
School instructional levelElementary school............................................................................. 1,211 34 766,212 52Middle school.................................................................................... 983 28 284,776 20High school........................................................................................ 1,128 32 338,406 23Combined .......................................................................................... 238 7 70,867 5
School enrollment sizeLess than 300..................................................................................... 362 10 157,481 11300 to 499.......................................................................................... 677 19 329,779 23500 to 999.......................................................................................... 1,517 43 652,949 451,000 or more .................................................................................... 1,004 28 320,053 22
LocaleCentral city ........................................................................................ 1,048 29 453,094 31Urban fringe/large town.................................................................... 1,335 38 554,043 38Rural/small town ............................................................................... 1,177 33 453,124 31
RegionNortheast............................................................................................ 636 18 259,653 18Midwest ............................................................................................. 877 25 357,746 24South .................................................................................................. 1,386 39 563,111 39West ................................................................................................... 661 19 279,751 19
Percent minority enrollment in school5 percent or less................................................................................. 926 26 376,307 266 to 20 percent................................................................................... 888 25 371,809 2621 to 50 percent................................................................................. 856 24 349,323 24More than 50 percent ........................................................................ 875 25 356,971 25
Percent of public school students in school eligible for free orreduced-price school lunch
Less than 15 percent ......................................................................... 957 27 368,984 2515 to 32 percent................................................................................. 888 25 348,641 2433 to 59 percent................................................................................. 872 25 367,132 2560 percent or more ............................................................................ 833 24 372,331 26
Main teaching assignmentGeneral elementary2.......................................................................... 1,210 34 733,651 50Math/science...................................................................................... 1,041 29 307,840 21Other targeted academic subject ...................................................... 1,309 37 418,771 29
Teaching experience3 or fewer years................................................................................. 845 24 202,204 144 to 9 years ........................................................................................ 808 23 324,219 2210 to 19 years .................................................................................... 745 21 369,393 2520 or more years................................................................................ 1,161 33 564,107 39
Teacher race/ethnicityWhite, non-Hispanic ......................................................................... 3,069 87 1,259,063 87Black, non-Hispanic.......................................................................... 243 7 103,552 7Other .................................................................................................. 227 6 90,082 6
SexMale ................................................................................................... 1,093 31 367,638 25Female................................................................................................ 2,467 69 1,092,623 75
1Targeted public school teachers were full-time public school teachers in grades 1 through 12 whose main teaching assignment was inEnglish/language arts, social studies/social sciences, foreign languages, mathematics, or science, or who taught a self-contained classroom.2The category labeled general elementary includes all teachers of self-contained classrooms in the 1998 FRSS study, regardless of instructionallevel. Almost all (95 percent) of the self-contained classrooms were at the elementary school level.
NOTE: Details may not sum to totals because of rounding or missing data. There were very small amounts of missing data for the followingvariables: percent minority enrollment in school (0.4 percent), percent of students in school eligible for free or reduced-price lunch (0.2 percent),and teacher race/ethnicity (0.5 percent). Percents are computed within each classification variable, but may not sum to 100 because of rounding.
SOURCE: U.S. Department of Education, National Center for Education Statistics, Fast Response Survey System, Teacher Survey onProfessional Development and Training, 1998.

A-8
questionnaire responses were conducted to checkthe data for accuracy and consistency. Cases withmissing or inconsistent items were recontacted bytelephone. Data were keyed with 100 percentverification.
Variances
The standard error is a measure of the variabilityof estimates due to sampling. It indicates thevariability of a sample estimate that would beobtained from all possible samples of a givendesign and size. Standard errors are used as ameasure of the precision expected from aparticular sample. If all possible samples weresurveyed under similar conditions, intervals of1.96 standard errors below to 1.96 standard errorsabove a particular statistic would include the truepopulation parameter being estimated in about 95percent of the samples. This is a 95 percentconfidence interval. For example, the estimatedpercentage of teachers who have a master’sdegree is 45.3 percent, and the estimated standarderror is 1.1 percent. The 95 percent confidenceinterval for the statistic extends from [45.3 – (1.1times 1.96)] to [45.3 + (1.1 times 1.96)], or from43.1 to 47.5 percent. Tables of standard errors foreach table and figure in the report are provided inthe appendices.
Estimates of standard errors were computed usinga technique known as jackknife replication. Aswith any replication method, jackknife replicationinvolves constructing a number of subsamples(replicates) from the full sample and computingthe statistic of interest for each replicate. Themean square error of the replicate estimatesaround the full sample estimate provides anestimate of the variances of the statistics. Toconstruct the replications, 50 stratifiedsubsamples of the full sample were created andthen dropped one at a time to define 50 jackknifereplicates. A computer program (WesVarPC)was used to calculate the estimates of standarderrors. WesVarPC is a stand-alone Windowsapplication that computes sampling errors for awide variety of statistics (totals, percents, ratios,log-odds ratios, general functions of estimates intables, linear regression parameters, and logisticregression parameters).
The test statistics used in the analysis werecalculated using the jackknife variances and thusappropriately reflected the complex nature of thesample design. In particular, an adjusted chi-square test using Satterthwaite’s approximation tothe design effect was used in the analysis of thetwo-way tables. Finally, Bonferroni adjustmentswere made to control for multiple comparisonswhere appropriate. For example, for an“experiment-wise” comparison involving gpairwise comparisons, each difference was testedat the 0.05/g significance level to control for thefact that g differences were simultaneously tested.
Definitions ofAnalysis Variables
School instructional level – Schools wereclassified according to their grade span in theCommon Core of Data (CCD).
Elementary school - lowest grade lessthan or equal to grade 3 and highestgrade less than or equal to grade 8.
Middle school – lowest grade greaterthan or equal to grade 4 and highestgrade less than or equal to grade 9.
High school – lowest grade greater thanor equal to grade 9 and highest gradeless than or equal to grade 12.
Combined school – lowest grade lessthan or equal to grade 3 and highestgrade greater than or equal to grade 9.
School enrollment size – total number of studentenrolled as defined by the Common Core of Data(CCD).
Less than 300 students
300 to 499 students
500 to 999 students
1,000 or more students
Locale – as defined in the Common Core of Data(CCD).
Central city – a large or mid-sizecentral city of a Metropolitan StatisticalArea (MSA).

A-9
Urban fringe/large town – urban fringeis a place within an MSA of a centralcity, but not primarily its central city;large town is an incorporated place notwithin an MSA, with a populationgreater than or equal to 25,000.
Small town/rural – small town is anincorporated place not within an MSA,with a population less than 25,000 andgreater than or equal to 2,500; rural is aplace with a population less than 2,500and/or a population density of less than1,000 per square mile, and defined asrural by the U.S. Bureau of the Census.
Geographic region –
Northeast - Maine, New Hampshire,Vermont, Massachusetts, Rhode Island,Connecticut, New York, New Jersey,Pennsylvania
Midwest - Ohio, Indiana, Illinois,Michigan, Wisconsin, Minnesota, Iowa,Missouri, North Dakota, South Dakota,Nebraska, Kansas
South - Delaware, Maryland, District ofColumbia, Virginia, West Virginia,North Carolina, South Carolina,Georgia, Florida, Kentucky, Tennessee,Alabama, Mississippi, Arkansas,Louisiana, Oklahoma, Texas
West - Montana, Idaho, Wyoming,Colorado, New Mexico, Arizona, Utah,Nevada, Washington, Oregon,California, Alaska, Hawaii
Percent minority enrollment in the school –The percent of students enrolled in the schoolwhose race or ethnicity is classified as one of thefollowing: American Indian or Alaskan Native,Asian or Pacific Islander, black, or Hispanic,based on data in the 1995-96 CCD file. Data onthis variable were missing for 0.4 percent of theteachers. The break points used for analysis werebased on empirically developed quartiles from theweighted survey data.
5 percent or less
6 to 20 percent
21 to 50 percent
More than 50 percent
Percent of students at the school eligible forfree or reduced-price lunch – This was based oninformation collected from the school during theteacher list collection phase; if it was missingfrom the list collection, it was obtained from theCCD file, if possible. Data on this variable weremissing for 0.2 percent of the teachers. This itemserved as the measurement of the concentration ofpoverty at the school. The break points used foranalysis were based on empirically developedquartiles from the weighted survey data.
Less than 15 percent
15 to 32 percent
33 to 59 percent
60 percent or more
Main teaching assignment – based on responsesto the survey questionnaire.
Self-contained classroom – The teacherteaches all or most academic subjects tothe same group of students all or most ofthe day (Q1=1).
Math/science – The teacher teachesmathematics or science in adepartmentalized setting, teaching thesubject to several classes of differentstudents all or most of the day (Q1=2and Q4A1=43 or 44).
Other targeted academic subject –The teacher teaches English/languagearts, social studies/social science, orforeign language in a departmentalizedsetting, teaching the subject to severalclasses of different students all or mostof the day (Q1=2 and Q4A1=41 or 42 or45).
Teaching experience – total years of teachingexperience, based on responses to question 14 onthe survey questionnaire.
3 or fewer years
4 to 9 years
10 to 19 years
20 or more years
Teacher race/ethnicity – based on responses toquestions 12 (Hispanic or Latino origin) and 13(race) on the survey questionnaire. Question 13specified that teachers should circle one or moreracial categories to describe themselves. Data on

A-10
this variable were missing for 0.5 percent of theteachers.
White, non-Hispanic – white only, andnot Hispanic.
Black, non-Hispanic – black or AfricanAmerican only, and not Hispanic.
Other – Hispanic or Latino, AmericanIndian or Alaska Native, Asian, NativeHawaiian or other Pacific Islander, andmulti-racial (i.e., anyone who selectedmore than one race to identifythemselves).
Sex – The sex of the teacher, based on question11 on the survey questionnaire.
Male
Female
It is important to note that many of the school andteacher characteristics used for independentanalyses may also be related to each other. Forexample, enrollment size and instructional levelof schools are related, with middle and highschools typically being larger than elementaryschools. Similarly, poverty concentration andminority enrollment are related, with schools witha high minority enrollment also more likely tohave a high concentration of poverty. Otherrelationships between analysis variables mayexist. Because of the relatively small sample sizeused in this study, it is difficult to separate theindependent effects of these variables. Theirexistence, however, should be considered in theinterpretation of the data presented in this report.
Comparisons to the 1993-94Schools and Staffing Survey
Data from the 1993-94 Schools and StaffingSurvey (SASS) teacher questionnaire werereanalyzed for questionnaire items that are thesame or similar to items on the FRSSquestionnaire. The questionnaire items from theSASS teacher survey are shown in appendix F,and the detailed tables from the analyses areshown in appendix C. As a first step in thereanalysis process, a subset of teachers andschools was selected from SASS that wasapproximately the same as the teachers and
schools sampled for FRSS. Regular full-timeteachers who taught in grades 1 through 12 inregular public schools (i.e., excluding specialeducation, vocational, and alternative/otherschools) in the 50 states and the District ofColumbia defined the overall eligible group ofteachers. Within that group, teachers wereselected for inclusion in the subset for theseanalyses if their main teaching assignment waseither general elementary or a core academicsubject area (defined here as English/languagearts, social studies/social science, foreignlanguage, mathematics, or science), based onquestion 21 in the SASS teacher questionnaire.For comparability to the FRSS survey, a teacherwas considered to be a self-contained classroomteacher if the main teaching assignment wasspecified as general elementary (code 03).2 Ateacher was considered to be a math/scienceteacher if the main assignment was specified asmathematics (33), or one of the sciences (57through 61 and 09). A teacher was considered tobe a teacher of one of the other targeted academicsubjects if the main teaching assignment wasspecified as English/language arts (21),journalism (16), reading (43), social studies/socialscience (47), or one of the foreign languages (51through 56).
Teachers were classified for instructional level ofthe school based on the categorization used forthe FRSS survey (see above). In addition, thecategory splits for the percent minorityenrollment in the school and the percent ofstudents eligible for free or reduced-price lunchwere based on the empirically developed quartilesfrom the weighted FRSS survey data.Information about the race of the teacher wascollected in a slightly different way on the SASSquestionnaire. Teachers were only allowed toselect one racial category to describe themselves,and the categories were American Indian orAlaska Native, Asian or Pacific Islander, black,and white. The weighted distributions of theSASS teachers by the various classificationvariables are shown in table C-1. Teachers wereassigned as departmentalized or generalelementary for the average class size calculationsbased on their main teaching assignment, withmath/science and other targeted academic 2 For clarity, these teachers are referred to throughout the report asgeneral elementary teachers for both the 1998 FRSS and 1993-94SASS studies.
A-11
teachers considered departmentalized.Approximately 5 percent of the teachers wereexcluded from the SASS class size analyses,either because they taught “pull-out” classes,where they provided instruction to students whowere released from their regular classes (2percent), or because of reporting problems in theirclass size information (3 percent).
When there are differences between the FRSSand SASS data, there are a number of possiblereasons for such differences that should beconsidered. One possible reason, of course, isthat the differences show actual change between1993-94 and 1998. However, it is also importantto consider other possibilities. While the subsetof schools and teachers from SASS was selectedto be as comparable as possible to the FRSSsample of schools and teachers, there may still besome differences in the samples for the twosurveys. In addition, the questionnaires that theteachers completed were very different. TheFRSS questionnaire was very short, consisting ofthree pages of questions and one page of codes.Information was collected in a very compactformat, and at a fairly aggregated level. Forexample, teachers in departmentalized settingswere asked about their main and secondaryteaching assignments, rather than about all thecourses they taught, and were asked about theirteaching assignments and about major and minorfields of study for degrees held at an aggregatedlevel (i.e., whether they taught courses or haddegrees in science, rather than in chemistry orphysics). The SASS questionnaire, on the otherhand, was 35 pages long and asked teachers forvery detailed information about courses taughtand degrees held, as well as a lot of otherinformation about the teacher and his or her job.Thus, the questionnaires provided very differentresponse contexts for the teachers.
It is also important to be aware that some of thequestions asked on the two questionnaires appearmore similar at first glance than they actually are.For example, the FRSS questionnaire askedteachers whether they had participated inprofessional development activities in the last 12months that focused on “new methods of teaching(e.g., cooperative learning).” The SASSquestionnaire asked teachers whether they hadparticipated in professional developmentprograms since the end of the last school year thatfocused on “methods of teaching your subject
field,” and “cooperative learning in theclassroom” as two separate questions. Anotherexample is the item on parent support forteachers. The FRSS survey asked whetherteachers agreed or disagreed with the statement,“parents support me in my efforts to educate theirchildren.” The SASS questionnaire askedwhether teachers agreed or disagreed with thestatement, “I receive a great deal of support fromparents for the work I do.” In addition, the FRSSsurvey had four statements about parent andschool support, compared with 25 statementsabout school climate in the SASS survey, againcreating a very different response context for theteachers. Thus, while differences between theFRSS and SASS data may reflect actual change,measurement issues must also be considered aspossible explanations.
Calculations of Major Fieldof Study for a Bachelor’sor Graduate Degree
A variable was constructed that combinedinformation about all the major fields of study forthe bachelor’s, master’s, and doctorate degreesinto the categories of academic field, subject areaeducation (i.e., the teaching of an academic field,such as mathematics education), generaleducation, and other education fields (e.g., specialeducation, curriculum and instruction, oreducational administration). For the analysespresented in the text (see tables 1 and 2), eachteacher was counted only once, even if he or shehad more than one major or more than onedegree. Major fields of study were selected in theorder of academic field, subject area education,other education, and general education. Forexample, if a teacher had a bachelor’s degree ingeneral education and a master’s degree inEnglish, he or she was considered for theseanalyses to have majored in an academic field.Similarly, if a teacher had a bachelor’s degree inmathematics and a master’s degree in curriculumand instruction, he or she was also considered forthese analyses to have majored in an academicfield. Tables A-2 and A-3 provide informationabout duplicated degree counts. In these tables,teachers with more than one major or more thanone degree are counted for each field of study inwhich they have a major or degree. Thus, a

A-12
Table A-2.—Percent of full-time public school teachers with any undergraduate or graduate majorin various fields of study, by selected school and teacher characteristics: 1998
School characteristic Academicfield
Subject areaeducation1
Generaleducation
Othereducation2
All targeted public school teachers3 ................................................... 38 24 62 15
School instructional levelElementary school.............................................................................. 22 11 85 14Middle school..................................................................................... 44 31 52 16High school ........................................................................................ 66 44 24 15Combined........................................................................................... 55 48 28 14
Teaching experience3 or fewer years.................................................................................. 50 16 53 54 to 9 years ......................................................................................... 41 21 59 1010 to 19 years ..................................................................................... 32 26 66 1920 or more years................................................................................. 36 28 63 18
1Subject area education is the teaching of an academic field, such as mathematics education.2Examples of other education fields are special education, curriculum and instruction, and educational administration.3Targeted public school teachers were full-time public school teachers in grades 1 through 12 whose main teaching assignment was inEnglish/language arts, social studies/social sciences, foreign languages, mathematics, or science, or who taught a self-contained classroom.
NOTE: Percents are duplicated. That is, teachers with more than one major or more than one degree are counted for each field of study in whichthey have a major or degree.
SOURCE: U.S. Department of Education, National Center for Education Statistics, Fast Response Survey System, Teacher Survey onProfessional Development and Training, 1998.
Table A-3.—Percent of full-time public school teachers with any undergraduate or graduate majorin various fields of study, by selected school and teacher characteristics: 1993-94
School characteristic Academicfield
Subject areaeducation1
Generaleducation
Othereducation2
All targeted public school teachers3 ................................................... 39 29 61 15
School instructional levelElementary school.............................................................................. 24 16 84 15Middle school..................................................................................... 44 36 51 15High school ........................................................................................ 67 50 19 14Combined........................................................................................... 55 47 31 12
Teaching experience3 or fewer years.................................................................................. 46 22 52 54 to 9 years ......................................................................................... 38 25 60 1110 to 19 years ..................................................................................... 35 30 64 1720 or more years................................................................................. 40 33 61 17
1Subject area education is the teaching of an academic field, such as mathematics education.2Examples of other education fields are special education, curriculum and instruction, and educational administration.3Targeted public school teachers were full-time public school teachers in grades 1 through 12 whose main teaching assignment was inEnglish/language arts, social studies/social sciences, foreign languages, mathematics, science, or general elementary.
NOTE: Percents are duplicated. That is, teachers with more than one major or more than one degree are counted for each field of study in whichthey have a major.
SOURCE: U.S. Department of Education, National Center for Education Statistics, 1993-94 Schools and Staffing Survey, unpublishedtabulations, 1998.

A-13
teacher with a bachelor’s degree in generaleducation and a master’s degree in English wouldbe counted once under academic field and onceunder general education in table A-2 or A-3.However, a teacher with a bachelor’s degree inEnglish and a master’s degree in history would becounted only once in table A-2 or A-3, since bothdegrees were in an academic field.
Calculations ofIn-Field Teaching
A measure of in-field teaching was constructedthat compared the fields in which teachers hadundergraduate or graduate majors or minors withthe fields in which they had their main teachingassignments (i.e., the field in which they reportedthat they taught the most courses). A major orminor was considered in field if it was in eitherthe academic field (e.g., mathematics) or subjectarea education (e.g., mathematics education) thatmatched the main teaching assignment. Thismeasure was constructed for any teacher whotaught English/language arts, foreign language,social studies/social science, mathematics, orscience in a departmentalized setting in any ofgrades 7 through 12. Teachers were defined asteaching in field if they had an undergraduate orgraduate major or minor in the field of their mainteaching assignment. Details of how this measurewas constructed are provided below.
The in-field teaching analyses were based onteacher level (grades taught) rather than on theinstructional level of the school. Any teacherwho provided departmentalized instruction andwho taught in grade 7 or above (for the first set ofanalyses) or grade 9 or above (for the second set
of analyses) was included, regardless of whetherhe or she also taught any lower grades. Teachersof self-contained classrooms at all levels wereexcluded, as were teachers who taught only ingrade 6 or below, even if they provideddepartmentalized instruction. The in-fieldteaching measure was constructed only for themain teaching assignment, because there were toofew teachers in the FRSS sample with asecondary teaching assignment to providemeaningful estimates for in-field teaching in thesecondary assignment.
In-field teaching was defined as having a major orminor at the bachelor’s, master’s, or doctoratelevel in the field of the main teaching assignment.The in-field teaching measure was constructed atthe aggregate level of English/language arts,social studies/social science, foreign language,math, and science. The measure was constructedthis way because the FRSS questionnairecollected information about degrees and teachingassignments at this aggregated level, rather thanat a lower level of aggregation (e.g., whether ateacher had degrees or taught courses inchemistry or physics) because of space limitationson the FRSS questionnaire. The main teachingassignment field was matched against the majorand minor fields of study for the FRSS data asshown in exhibit A-1, using the categorizationapproach from SASS. The numbers inparentheses indicate the code numbers on theFRSS questionnaire.
The main teaching assignment field was matchedagainst the major and minor fields of study for theSASS data as shown in exhibit A-2. The numbersin parentheses indicate the code numbers on theSASS questionnaire.
Exhibit A-1.—Match of main teaching assignment field with major and minor fields of study:FRSS 1998
Teaching assignment Major and minor fields of studyEnglish/language arts (41) English/reading education (54), English (72)Foreign languages (42) Foreign languages education (55), foreign languages (73)Mathematics (43) Mathematics education (56), engineering (71),
mathematics (74)Science (44) Science education (57), science (75)Social studies/social science (45) Social studies/social sciences education (58),
social sciences (76)

A-14
Exhibit A-2.—Match of main teaching assignment field with major and minor fields of study:SASS 1993-94
Teaching assignment Major and minor fields of studyEnglish/language arts (21), English education (22), reading education (43), journalism (16), reading (43) English (21), communications and journalism (16)Foreign languages (51-56) Foreign languages education (24),
foreign languages (51-56)Mathematics (33) Mathematics education (34), engineering (20),
mathematics (33)Science (57-61, 09) Science education (46), science (57-61)Social studies/social science (47) Social studies/social sciences education (48),
social sciences (62-66), psychology (41), public affairs and services (42), other area and ethnic studies (87)
Background Information
The survey was performed under contract withWestat, using the Fast Response Survey System(FRSS). Westat’s Project Director was ElizabethFarris, and the Survey Manager was LaurieLewis. Bernie Greene was the NCES ProjectOfficer. The data were requested by TerryDozier, Office of the Secretary, U.S. Departmentof Education.
This report was reviewed by the followingindividuals:
Outside NCES
n Susan Choy, MPR Associates
n Richard Ingersoll, University of Georgia
n David Mandel, MPR Center for Curriculumand Professional Development
n Judith Thompson, Connecticut StateDepartment of Education
Inside NCES
n Shelley Burns, Early Childhood,International, and Crosscutting StudiesDivision
n Mary Frase, Early Childhood, International,and Crosscutting Studies Division
n Kerry Gruber, Elementary/Secondary andLibraries Studies Division
n Marilyn McMillen, Chief Statistician
n Martin Orland, Associate Commissioner,Early Childhood, International, andCrosscutting Studies Division
n John Ralph, Early Childhood, International,and Crosscutting Studies Division
For more information about the Fast ResponseSurvey System (FRSS), contact Bernie Greene,Early Childhood, International, and CrosscuttingStudies Division, National Center for EducationStatistics, Office of Educational Research andImprovement, U.S. Department of Education, 555New Jersey Avenue, NW, Washington, DC20208-5651, e-mail: [email protected],telephone (202) 219-1366. For more informationabout the Teacher Survey on ProfessionalDevelopment and Training, contact EdithMcArthur, Early Childhood, International, andCrosscutting Studies Division, National Centerfor Education Statistics, Office of EducationalResearch and Improvement, U.S. Department ofEducation, 555 New Jersey Avenue, NW,Washington, DC 20208-5651, e-mail:[email protected], telephone (202) 219-1442.

B-1
Appendix B
Detailed Tables of Estimatesand
Tables of Standard Errorsfor the
1998 FRSS Survey

B-2

B-3
Table of Contents
Detailed Tables of Estimates and Tables of Standard Errorsfor the 1998 FRSS Survey
Table Page
B-1 Number and percent of full-time public school teachers, by selected school andteacher characteristics: 1998................................................................................... 7
B-1a Standard errors of the number and percent of full-time public school teachers,by selected school and teacher characteristics: 1998 ............................................... 8
B-2 Percent of full-time public school teachers who hold bachelor’s, master’s,doctorates, other degrees, and/or other certificates, by selected school and teachercharacteristics: 1998............................................................................................... 9
B-2a Standard errors of the percent of full-time public school teachers who holdbachelor’s, master’s, doctorates, other degrees, and/or other certificates,by selected school and teacher characteristics: 1998 ............................................... 10
B-3 Average number of total years as a teacher and as a teacher in the current schoolfor full-time public school teachers, by selected school and teachercharacteristics: 1998............................................................................................... 11
B-3a Standard errors of the average number of total years as a teacher and as a teacherin the current school for full-time public school teachers, by selected school andteacher characteristics: 1998................................................................................... 12
B-4 Percent of full-time public school teachers in general elementary classrooms withvarious types of teaching certificates in their state, by selected school and teachercharacteristics: 1998............................................................................................... 13
B-4a Standard errors of the percent of full-time public school teachers in generalelementary classrooms with various types of teaching certificates in their state,by selected school and teacher characteristics: 1998 ............................................... 14
B-5 Percent of full-time public school teachers in departmentalized settings withvarious types of teaching certificates in their state in their main teachingassignment field, by selected school and teacher characteristics: 1998 .................... 15
B-5a Standard errors of the percent of full-time public school teachers indepartmentalized settings with various types of teaching certificates in their statein their main teaching assignment field, by selected school and teachercharacteristics: 1998............................................................................................... 16
B-6 Percent of full-time public school teachers in departmentalized settings withvarious types of teaching certificates in their state in their secondary teachingassignment field, by selected school and teacher characteristics: 1998 .................... 17
B-6a Standard errors of the percent of full-time public school teachers indepartmentalized settings with various types of teaching certificates in their statein their secondary teaching assignment field, by selected school and teachercharacteristics: 1998............................................................................................... 18
B-7 Percent of full-time public school teachers in grades 7 through 12 who reportedhaving an undergraduate or graduate major or minor in their main teachingassignment field, by selected school and teacher characteristics: 1998 .................... 19
B-7a Standard errors of the percent of full-time public school teachers in grades 7through 12 who reported having an undergraduate or graduate major or minor intheir main teaching assignment field, by selected school and teachercharacteristics: 1998............................................................................................... 20

B-4
Table of Contents (continued)
Detailed Tables of Estimates and Tables of Standard Errorsfor the 1998 FRSS Survey (continued)
Table Page
B-8 Percent of full-time public school teachers in grades 9 through 12 who reportedhaving an undergraduate or graduate major or minor in their main teachingassignment field, by selected school and teacher characteristics: 1998 .................... 21
B-8a Standard errors of the percent of full-time public school teachers in grades 9through 12 who reported having an undergraduate or graduate major or minor intheir main teaching assignment field, by selected school and teachercharacteristics: 1998............................................................................................... 22
B-9 Percent of full-time public school teachers who participated in professionaldevelopment activities of various lengths in the last 12 months that focused onvarious topics, by selected school and teacher characteristics: 1998 ........................ 23
B-9a Standard errors of the percent of full-time public school teachers whoparticipated in professional development activities of various lengths in the last12 months that focused on various topics, by selected school and teachercharacteristics: 1998............................................................................................... 27
B-10 Percent of full-time public school teachers who participated in professionaldevelopment activities in the last 12 months indicating the extent to which theybelieve the activity improved their classroom teaching, by selected school andteacher characteristics: 1998................................................................................... 31
B-10a Standard errors of the percent of full-time public school teachers whoparticipated in professional development activities in the last 12 monthsindicating the extent to which they believe the activity improved their classroomteaching, by selected school and teacher characteristics: 1998 ................................ 35
B-11 Percent of full-time public school teachers who participated with variousfrequency in the last 12 months in various activities related to teaching, byselected school and teacher characteristics: 1998 .................................................... 39
B-11a Standard errors of the percent of full-time public school teachers whoparticipated with various frequency in the last 12 months in various activitiesrelated to teaching, by selected school and teacher characteristics: 1998 ................. 42
B-12 Percent of full-time public school teachers who participated in various activitiesrelated to teaching in the last 12 months indicating the extent to which theybelieve the activity improved their classroom teaching, by selected school andteacher characteristics: 1998................................................................................... 45
B-12a Standard errors of the percent of full-time public school teachers whoparticipated in various activities related to teaching in the last 12 monthsindicating the extent to which they believe the activity improved their classroomteaching, by selected school and teacher characteristics: 1998 ................................ 48
B-13 Percent of full-time public school teachers who participated in a formal inductionprogram when they first began teaching, by selected school and teachercharacteristics: 1998............................................................................................... 51
B-13a Standard errors of the percent of full-time public school teachers whoparticipated in a formal induction program when they first began teaching, byselected school and teacher characteristics: 1998 .................................................... 52

B-5
Table of Contents (continued)
Detailed Tables of Estimates and Tables of Standard Errorsfor the 1998 FRSS Survey (continued)
Table Page
B-14 Average class size for full-time public school teachers in general elementaryclassrooms and departmentalized settings, by selected school and teachercharacteristics: 1998............................................................................................... 53
B-14a Standard errors of the average class size for full-time public school teachers ingeneral elementary classrooms and departmentalized settings, by selected schooland teacher characteristics: 1998 ............................................................................ 54
B-15 Percent of full-time public school teachers agreeing or disagreeing with selectedstatements about parent and school support for teachers, by selected school andteacher characteristics: 1998................................................................................... 55
B-15a Standard errors of the percent of full-time public school teachers agreeing ordisagreeing with selected statements about parent and school support forteachers, by selected school and teacher characteristics: 1998................................. 57
B-16 Percent of full-time public school teachers indicating how well prepared they feelto do various activities in the classroom, by selected school and teachercharacteristics: 1998............................................................................................... 59
B-16a Standard errors of the percent of full-time public school teachers indicating howwell prepared they feel to do various activities in the classroom, by selectedschool and teacher characteristics: 1998 ................................................................. 63

B-6

B-7
Table B-1.—Number and percent of full-time public school teachers, by selected school and teachercharacteristics: 1998
School and teacher characteristic Number Percent
All targeted public school teachers1 .............................................................................. 1,460,261 100
School instructional levelElementary school............................................................................................................... 766,212 52Middle school...................................................................................................................... 284,776 20High school.......................................................................................................................... 338,406 23Combined ............................................................................................................................ 70,867 5
School enrollment sizeLess than 300....................................................................................................................... 157,481 11300 to 499............................................................................................................................ 329,779 23500 to 999............................................................................................................................ 652,949 451,000 or more ...................................................................................................................... 320,053 22
LocaleCentral city .......................................................................................................................... 453,094 31Urban fringe/large town...................................................................................................... 554,043 38Rural/small town ................................................................................................................. 453,124 31
RegionNortheast.............................................................................................................................. 259,653 18Midwest ............................................................................................................................... 357,746 24South .................................................................................................................................... 563,111 39West ..................................................................................................................................... 279,751 19
Percent minority enrollment in school5 percent or less................................................................................................................... 376,307 266 to 20 percent..................................................................................................................... 371,809 2621 to 50 percent................................................................................................................... 349,323 24More than 50 percent .......................................................................................................... 356,971 25
Percent of students in school eligible for free or reduced-price school lunchLess than 15 percent ........................................................................................................... 368,984 2515 to 32 percent................................................................................................................... 348,641 2433 to 59 percent................................................................................................................... 367,132 2560 percent or more .............................................................................................................. 372,331 26
Main teaching assignment
General elementary2............................................................................................................ 733,651 50Math/science........................................................................................................................ 307,840 21Other targeted academic subject ........................................................................................ 418,771 29
Teaching experience3 or fewer years................................................................................................................... 202,204 144 to 9 years .......................................................................................................................... 324,219 2210 to 19 years ...................................................................................................................... 369,393 2520 or more years.................................................................................................................. 564,107 39
Teacher race/ethnicityWhite, non-Hispanic ........................................................................................................... 1,259,063 87Black, non-Hispanic............................................................................................................ 103,552 7Other .................................................................................................................................... 90,082 6
SexMale ..................................................................................................................................... 367,638 25Female.................................................................................................................................. 1,092,623 75
1Targeted public school teachers were full-time public school teachers in grades 1 through 12 whose main teaching assignment was inEnglish/language arts, social studies/social sciences, foreign language, mathematics, or science, or who taught a self-contained classroom.2The category labeled general elementary includes all teachers of self-contained classrooms in the 1998 FRSS study, regardless of instructionallevel. Almost all (95 percent) of the self-contained classrooms were at the elementary school level.
NOTE: Details may not sum to totals because of rounding. Percents are computed within each classification variable, but may not sum to 100because of rounding.
SOURCE: U.S. Department of Education, National Center for Education Statistics, Fast Response Survey System, Teacher Survey onProfessional Development and Training, 1998.

B-8
Table B-1a.—Standard errors of the number and percent of full-time public school teachers, byselected school and teacher characteristics: 1998
School and teacher characteristic Number Percent
All targeted public school teachers1 .............................................................................. 14,464 *
School instructional levelElementary school............................................................................................................... 12,938 0.5Middle school...................................................................................................................... 5,164 0.4High school.......................................................................................................................... 7,501 0.5Combined ............................................................................................................................ 6,150 0.4
School enrollment sizeLess than 300....................................................................................................................... 11,563 0.8300 to 499............................................................................................................................ 11,799 0.7500 to 999............................................................................................................................ 14,712 1.01,000 or more ...................................................................................................................... 6,621 0.5
LocaleCentral city .......................................................................................................................... 9,014 0.6Urban fringe/large town...................................................................................................... 13,868 0.8Rural/small town ................................................................................................................. 11,505 0.7
RegionNortheast.............................................................................................................................. 13,780 0.9Midwest ............................................................................................................................... 15,707 1.0South .................................................................................................................................... 17,723 1.3West ..................................................................................................................................... 19,201 1.3
Percent minority enrollment in school5 percent or less................................................................................................................... 15,614 1.06 to 20 percent..................................................................................................................... 16,000 1.121 to 50 percent................................................................................................................... 13,527 0.9More than 50 percent .......................................................................................................... 14,233 0.9
Percent of students in school eligible for free or reduced-price school lunchLess than 15 percent ........................................................................................................... 16,508 1.115 to 32 percent................................................................................................................... 20,308 1.333 to 59 percent................................................................................................................... 17,868 1.360 percent or more .............................................................................................................. 14,312 0.9
Main teaching assignment
General elementary2............................................................................................................ 14,149 0.6Math/science........................................................................................................................ 7,695 0.5Other targeted academic subject ........................................................................................ 8,295 0.6
Teaching experience3 or fewer years................................................................................................................... 7,235 0.54 to 9 years .......................................................................................................................... 13,765 0.910 to 19 years ...................................................................................................................... 12,308 0.820 or more years.................................................................................................................. 15,615 1.0
Teacher race/ethnicityWhite, non-Hispanic ........................................................................................................... 15,090 0.8Black, non-Hispanic............................................................................................................ 8,973 0.6Other .................................................................................................................................... 6,644 0.5
SexMale ..................................................................................................................................... 11,995 0.8Female.................................................................................................................................. 17,909 0.8
*Estimate of standard error is not derived because it is based on a statistic estimated at 0 or 100 percent.1Targeted public school teachers were full-time public school teachers in grades 1 through 12 whose main teaching assignment was inEnglish/language arts, social studies/social sciences, foreign language, mathematics, or science, or who taught a self-contained classroom.2The category labeled general elementary includes all teachers of self-contained classrooms in the 1998 FRSS study, regardless of instructionallevel. Almost all (95 percent) of the self-contained classrooms were at the elementary school level.
SOURCE: U.S. Department of Education, National Center for Education Statistics, Fast Response Survey System, Teacher Survey onProfessional Development and Training, 1998.
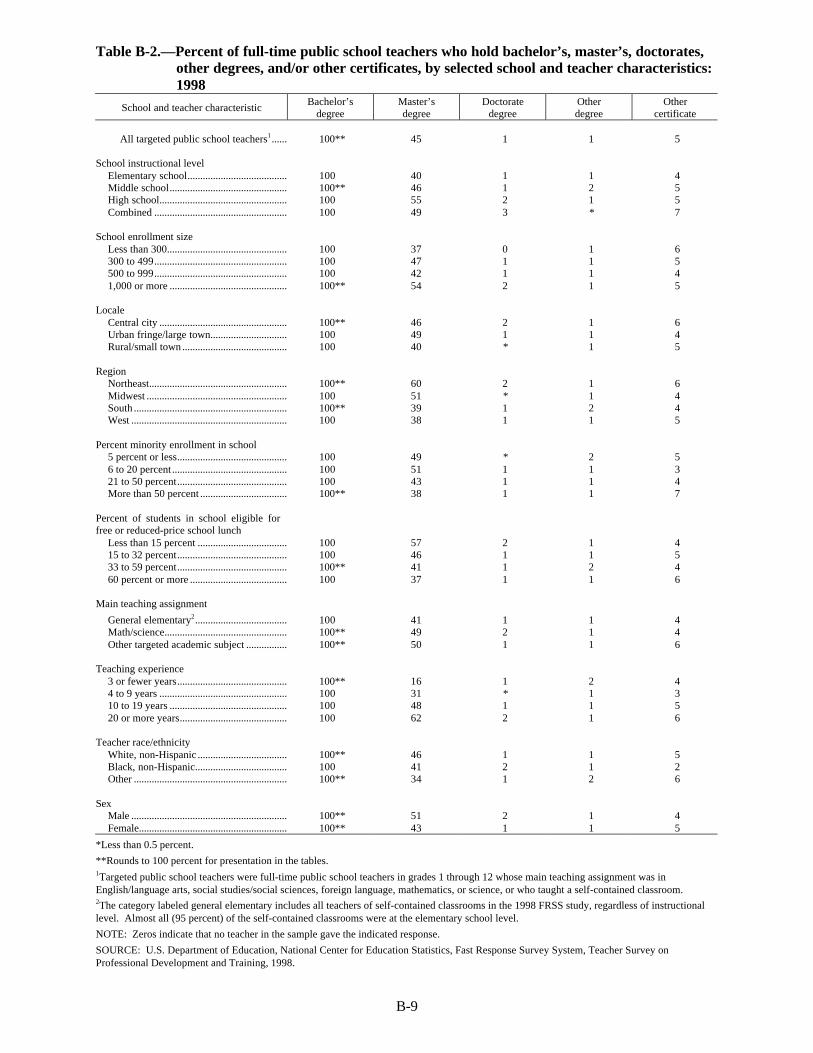
B-9
Table B-2.—Percent of full-time public school teachers who hold bachelor’s, master’s, doctorates,other degrees, and/or other certificates, by selected school and teacher characteristics:1998
School and teacher characteristicBachelor’s
degreeMaster’sdegree
Doctoratedegree
Otherdegree
Othercertificate
All targeted public school teachers1 ...... 100** 45 1 1 5
School instructional levelElementary school....................................... 100 40 1 1 4Middle school.............................................. 100** 46 1 2 5High school.................................................. 100 55 2 1 5Combined .................................................... 100 49 3 * 7
School enrollment sizeLess than 300............................................... 100 37 0 1 6300 to 499.................................................... 100 47 1 1 5500 to 999.................................................... 100 42 1 1 41,000 or more .............................................. 100** 54 2 1 5
LocaleCentral city .................................................. 100** 46 2 1 6Urban fringe/large town.............................. 100 49 1 1 4Rural/small town ......................................... 100 40 * 1 5
RegionNortheast...................................................... 100** 60 2 1 6Midwest ....................................................... 100 51 * 1 4South ............................................................ 100** 39 1 2 4West ............................................................. 100 38 1 1 5
Percent minority enrollment in school5 percent or less........................................... 100 49 * 2 56 to 20 percent............................................. 100 51 1 1 321 to 50 percent........................................... 100 43 1 1 4More than 50 percent .................................. 100** 38 1 1 7
Percent of students in school eligible forfree or reduced-price school lunch
Less than 15 percent ................................... 100 57 2 1 415 to 32 percent........................................... 100 46 1 1 533 to 59 percent........................................... 100** 41 1 2 460 percent or more ...................................... 100 37 1 1 6
Main teaching assignment
General elementary2.................................... 100 41 1 1 4Math/science................................................ 100** 49 2 1 4Other targeted academic subject ................ 100** 50 1 1 6
Teaching experience3 or fewer years........................................... 100** 16 1 2 44 to 9 years .................................................. 100 31 * 1 310 to 19 years .............................................. 100 48 1 1 520 or more years.......................................... 100 62 2 1 6
Teacher race/ethnicityWhite, non-Hispanic ................................... 100** 46 1 1 5Black, non-Hispanic.................................... 100 41 2 1 2Other ............................................................ 100** 34 1 2 6
SexMale ............................................................. 100** 51 2 1 4Female.......................................................... 100** 43 1 1 5
*Less than 0.5 percent.
**Rounds to 100 percent for presentation in the tables.1Targeted public school teachers were full-time public school teachers in grades 1 through 12 whose main teaching assignment was inEnglish/language arts, social studies/social sciences, foreign language, mathematics, or science, or who taught a self-contained classroom.2The category labeled general elementary includes all teachers of self-contained classrooms in the 1998 FRSS study, regardless of instructionallevel. Almost all (95 percent) of the self-contained classrooms were at the elementary school level.
NOTE: Zeros indicate that no teacher in the sample gave the indicated response.
SOURCE: U.S. Department of Education, National Center for Education Statistics, Fast Response Survey System, Teacher Survey onProfessional Development and Training, 1998.

B-10
Table B-2a.—Standard errors of the percent of full-time public school teachers who holdbachelor’s, master’s, doctorates, other degrees, and/or other certificates, by selectedschool and teacher characteristics: 1998
School and teacher characteristicBachelor’s
degreeMaster’sdegree
Doctoratedegree
Otherdegree
Othercertificate
All targeted public school teachers1 ...... 0.02 1.1 0.2 0.2 0.3
School instructional levelElementary school....................................... * 1.8 0.2 0.3 0.6Middle school.............................................. 0.1 1.9 0.2 0.5 0.7High school.................................................. * 1.5 0.5 0.3 0.7Combined .................................................... * 3.7 1.6 0.2 1.8
School enrollment sizeLess than 300............................................... * 2.6 * 0.5 1.8300 to 499.................................................... * 2.1 0.5 0.3 1.0500 to 999.................................................... * 1.9 0.3 0.3 0.61,000 or more .............................................. 0.1 1.7 0.4 0.3 0.7
LocaleCentral city .................................................. 0.1 2.1 0.4 0.3 0.8Urban fringe/large town.............................. * 1.6 0.3 0.3 0.5Rural/small town ......................................... * 1.5 0.2 0.4 0.7
RegionNortheast...................................................... 0.1 2.8 0.8 0.3 1.2Midwest ....................................................... * 2.0 0.2 0.4 0.7South ............................................................ 0.03 1.6 0.3 0.3 0.7West ............................................................. * 2.0 0.3 0.3 0.9
Percent minority enrollment in school5 percent or less........................................... * 1.9 0.2 0.6 0.86 to 20 percent............................................. * 2.1 0.5 0.3 0.721 to 50 percent........................................... * 2.1 0.4 0.4 0.7More than 50 percent .................................. 0.1 2.2 0.3 0.4 0.9
Percent of students in school eligible forfree or reduced-price school lunch
Less than 15 percent ................................... * 1.8 0.6 0.3 0.715 to 32 percent........................................... * 2.0 0.3 0.3 0.833 to 59 percent........................................... 0.1 2.4 0.3 0.4 0.660 percent or more ...................................... * 2.3 0.2 0.4 1.1
Main teaching assignment
General elementary2.................................... * 1.8 0.3 0.3 0.6Math/science................................................ 0.05 1.8 0.4 0.4 0.8Other targeted academic subject ................ 0.05 1.5 0.3 0.3 0.6
Teaching experience3 or fewer years........................................... 0.1 1.6 0.3 0.5 0.84 to 9 years .................................................. * 2.3 0.1 0.4 0.610 to 19 years .............................................. * 1.8 0.3 0.3 0.920 or more years.......................................... * 1.5 0.4 0.3 0.7
Teacher race/ethnicityWhite, non-Hispanic ................................... 0.02 1.1 0.2 0.2 0.4Black, non-Hispanic.................................... * 4.2 0.8 0.4 1.1Other ............................................................ 0.2 4.1 0.9 1.0 1.8
SexMale ............................................................. 0.1 1.8 0.6 0.3 0.6Female.......................................................... 0.01 1.4 0.2 0.2 0.4
*Estimate of standard error is not derived because it is based on a statistic estimated at 0 or 100 percent.1Targeted public school teachers were full-time public school teachers in grades 1 through 12 whose main teaching assignment was inEnglish/language arts, social studies/social sciences, foreign language, mathematics, or science, or who taught a self-contained classroom2The category labeled general elementary includes all teachers of self-contained classrooms in the 1998 FRSS study, regardless of instructionallevel. Almost all (95 percent) of the self-contained classrooms were at the elementary school level.
SOURCE: U.S. Department of Education, National Center for Education Statistics, Fast Response Survey System, Teacher Survey onProfessional Development and Training, 1998.

B-11
Table B-3.—Average number of total years as a teacher and as a teacher in the current school forfull-time public school teachers, by selected school and teacher characteristics: 1998
School and teacher characteristic Total years as a teacher Years as a teacher in thecurrent school
All targeted public school teachers1 .............................................................................. 15 10
School instructional levelElementary school............................................................................................................... 15 10Middle school...................................................................................................................... 15 9High school.......................................................................................................................... 17 11Combined ............................................................................................................................ 16 11
School enrollment sizeLess than 300....................................................................................................................... 16 11300 to 499............................................................................................................................ 16 10500 to 999............................................................................................................................ 15 101,000 or more ...................................................................................................................... 16 10
LocaleCentral city .......................................................................................................................... 15 8Urban fringe/large town...................................................................................................... 16 10Rural/small town ................................................................................................................. 16 11
RegionNortheast.............................................................................................................................. 18 12Midwest ............................................................................................................................... 17 12South .................................................................................................................................... 14 9West ..................................................................................................................................... 14 8
Percent minority enrollment in school5 percent or less................................................................................................................... 17 136 to 20 percent..................................................................................................................... 16 1021 to 50 percent................................................................................................................... 15 9More than 50 percent .......................................................................................................... 13 8
Percent of students in school eligible for free or reduced-price school lunchLess than 15 percent ........................................................................................................... 16 1115 to 32 percent................................................................................................................... 17 1133 to 59 percent................................................................................................................... 16 1060 percent or more .............................................................................................................. 13 8
Main teaching assignment
General elementary2............................................................................................................ 15 10Math/science........................................................................................................................ 15 10Other targeted academic subject ........................................................................................ 16 11
Teaching experience3 or fewer years................................................................................................................... 2 24 to 9 years .......................................................................................................................... 6 410 to 19 years ...................................................................................................................... 14 920 or more years.................................................................................................................. 26 17
Teacher race/ethnicityWhite, non-Hispanic ........................................................................................................... 16 10Black, non-Hispanic............................................................................................................ 15 9Other .................................................................................................................................... 13 8
SexMale ..................................................................................................................................... 16 11Female.................................................................................................................................. 15 10
1Targeted public school teachers were full-time public school teachers in grades 1 through 12 whose main teaching assignment was inEnglish/language arts, social studies/social sciences, foreign language, mathematics, or science, or who taught a self-contained classroom.2The category labeled general elementary includes all teachers of self-contained classrooms in the 1998 FRSS study, regardless of instructionallevel. Almost all (95 percent) of the self-contained classrooms were at the elementary school level.
SOURCE: U.S. Department of Education, National Center for Education Statistics, Fast Response Survey System, Teacher Survey onProfessional Development and Training, 1998.

B-12
Table B-3a.—Standard errors of the average number of total years as a teacher and as a teacher inthe current school for full-time public school teachers, by selected school and teachercharacteristics: 1998
School and teacher characteristic Total years as a teacher Years as a teacher in thecurrent school
All targeted public school teachers1 .............................................................................. 0.2 0.2
School instructional levelElementary school............................................................................................................... 0.3 0.3Middle school...................................................................................................................... 0.4 0.3High school.......................................................................................................................... 0.3 0.3Combined ............................................................................................................................ 0.8 0.8
School enrollment sizeLess than 300....................................................................................................................... 0.6 0.6300 to 499............................................................................................................................ 0.3 0.3500 to 999............................................................................................................................ 0.3 0.31,000 or more ...................................................................................................................... 0.3 0.3
LocaleCentral city .......................................................................................................................... 0.3 0.3Urban fringe/large town...................................................................................................... 0.3 0.3Rural/small town ................................................................................................................. 0.3 0.3
RegionNortheast.............................................................................................................................. 0.4 0.4Midwest ............................................................................................................................... 0.3 0.3South .................................................................................................................................... 0.2 0.2West ..................................................................................................................................... 0.5 0.4
Percent minority enrollment in school5 percent or less................................................................................................................... 0.4 0.46 to 20 percent..................................................................................................................... 0.4 0.321 to 50 percent................................................................................................................... 0.4 0.3More than 50 percent .......................................................................................................... 0.5 0.3
Percent of students in school eligible for free or reduced-price school lunchLess than 15 percent ........................................................................................................... 0.3 0.315 to 32 percent................................................................................................................... 0.4 0.433 to 59 percent................................................................................................................... 0.4 0.460 percent or more .............................................................................................................. 0.4 0.3
Main teaching assignment
General elementary2............................................................................................................ 0.3 0.3Math/science........................................................................................................................ 0.3 0.3Other targeted academic subject ........................................................................................ 0.3 0.2
Teaching experience3 or fewer years................................................................................................................... 0.03 0.034 to 9 years .......................................................................................................................... 0.1 0.110 to 19 years ...................................................................................................................... 0.1 0.220 or more years.................................................................................................................. 0.1 0.3
Teacher race/ethnicityWhite, non-Hispanic ........................................................................................................... 0.2 0.2Black, non-Hispanic............................................................................................................ 0.7 0.6Other .................................................................................................................................... 0.7 0.6
SexMale ..................................................................................................................................... 0.3 0.3Female.................................................................................................................................. 0.2 0.2
1Targeted public school teachers were full-time public school teachers in grades 1 through 12 whose main teaching assignment was inEnglish/language arts, social studies/social sciences, foreign language, mathematics, or science, or who taught a self-contained classroom.2The category labeled general elementary includes all teachers of self-contained classrooms in the 1998 FRSS study, regardless of instructionallevel. Almost all (95 percent) of the self-contained classrooms were at the elementary school level.
SOURCE: U.S. Department of Education, National Center for Education Statistics, Fast Response Survey System, Teacher Survey onProfessional Development and Training, 1998.

B-13
Table B-4.—Percent of full-time public school teachers in general elementary classrooms withvarious types of teaching certificates in their state, by selected school and teachercharacteristics: 1998
School and teachercharacteristic
Regular orstandard statecertificate, or
advancedprofessionalcertificate
Provisional orother type of
certificategiven while
participating inan “alternative
certificationprogram”
Probationarycertificate
Temporarycertificate
Emergencycertificate or
waiverNo certificate
All targeted public schoolteachers1 ........................... 93 3 2 1 1 0
School instructional level2
Elementary school..................... 93 3 2 1 1 0
School enrollment sizeLess than 300............................. 96 1 1 1 * 0300 to 499.................................. 94 3 1 1 * 0500 to 999.................................. 92 4 2 2 1 01,000 or more ............................ 85 3 7 4 2 0
LocaleCentral city ................................ 91 3 2 2 1 0Urban fringe/large town............ 92 4 2 2 * 0Rural/small town ....................... 96 2 1 * * 0
RegionNortheast.................................... 91 5 1 3 0 0Midwest ..................................... 96 3 * 1 0 0South .......................................... 94 3 2 1 * 0West ........................................... 90 3 3 2 2 0
Percent minority enrollment inschool
5 percent or less......................... 96 2 1 2 0 06 to 20 percent........................... 95 3 1 1 * 021 to 50 percent......................... 93 3 2 1 * 0More than 50 percent ................ 88 5 3 2 2 0
Percent of students in schooleligible for free or reduced-price school lunch
Less than 15 percent ................. 94 3 1 2 * 015 to 32 percent......................... 95 3 1 1 0 033 to 59 percent......................... 95 2 1 1 1 060 percent or more .................... 90 4 3 2 1 0
Teaching experience3 or fewer years......................... 65 11 11 8 4 04 to 9 years ................................ 92 5 1 2 * 010 to 19 years ............................ 99 1 * * 0 020 or more years........................ 99 1 0 0 0 0
Teacher race/ethnicityWhite, non-Hispanic ................. 94 3 2 1 * 0Black, non-Hispanic.................. 88 7 1 4 1 0Other .......................................... 88 5 3 1 4 0
SexMale ........................................... 91 3 2 3 1 0Female........................................ 93 3 2 1 1 0
*Less than 0.5 percent.1Targeted public school teachers were full-time public school teachers in grades 1 through 12 whose main teaching assignment was inEnglish/language arts, social studies/social sciences, foreign language, mathematics, or science, or who taught a self-contained classroom.2Data for general elementary classrooms are reported for elementary schools only. Data for all school levels are included in the totals and inanalyses by other school and teacher characteristics.
NOTE: Teachers referred to here as teachers in general elementary classrooms include all teachers of self-contained classrooms in the 1998FRSS study, regardless of instructional level. Almost all (95 percent) of the self-contained classrooms were at the elementary school level.Percents are computed across each row, but may not sum to 100 because of rounding. Zeros indicate that no teacher in the sample gave theindicated response.
SOURCE: U.S. Department of Education, National Center for Education Statistics, Fast Response Survey System, Teacher Survey onProfessional Development and Training, 1998.

B-14
Table B-4a.—Standard errors of the percent of full-time public school teachers in generalelementary classrooms with various types of teaching certificates in their state, byselected school and teacher characteristics: 1998
School and teachercharacteristic
Regular orstandard statecertificate, or
advancedprofessionalcertificate
Provisional orother type of
certificategiven while
participating inan “alternative
certificationprogram”
Probationarycertificate
Temporarycertificate
Emergencycertificate or
waiverNo certificate
All targeted public schoolteachers1 ........................... 0.7 0.4 0.3 0.3 0.2 *
School instructional level2
Elementary school..................... 0.7 0.4 0.3 0.3 0.2 *
School enrollment sizeLess than 300............................. 1.1 0.6 0.5 0.6 0.2 *300 to 499.................................. 1.1 0.9 0.4 0.5 0.2 *500 to 999.................................. 1.0 0.6 0.6 0.5 0.4 *1,000 or more ............................ 2.9 1.5 2.3 1.9 1.3 *
LocaleCentral city ................................ 1.3 0.8 0.5 0.6 0.6 *Urban fringe/large town............ 1.0 0.7 0.6 0.6 0.2 *Rural/small town ....................... 0.9 0.8 0.5 0.3 0.2 *
RegionNortheast.................................... 1.8 1.7 0.6 0.8 * *Midwest ..................................... 1.1 1.1 0.3 0.4 * *South .......................................... 1.0 0.7 0.6 0.5 0.3 *West ........................................... 1.4 0.8 0.8 0.7 0.8 *
Percent minority enrollment inschool
5 percent or less......................... 0.8 0.7 0.4 0.5 * *6 to 20 percent........................... 1.1 0.7 0.5 0.5 0.1 *21 to 50 percent......................... 1.6 1.0 0.8 0.5 0.4 *More than 50 percent ................ 1.7 1.1 0.7 0.7 0.8 *
Percent of students in schooleligible for free or reduced-price school lunch
Less than 15 percent ................. 1.3 1.0 0.6 0.8 0.3 *15 to 32 percent......................... 1.5 1.1 0.5 0.6 * *33 to 59 percent......................... 0.9 0.7 0.5 0.3 0.3 *60 percent or more .................... 1.3 0.9 0.7 0.5 0.7 *
Teaching experience3 or fewer years......................... 3.1 2.1 2.1 1.9 1.5 *4 to 9 years ................................ 1.6 1.4 0.4 0.7 0.3 *10 to 19 years ............................ 0.6 0.6 0.2 0.2 * *20 or more years........................ 0.5 0.5 * * * *
Teacher race/ethnicityWhite, non-Hispanic ................. 0.6 0.4 0.4 0.4 0.2 *Black, non-Hispanic.................. 3.5 2.7 0.6 1.7 0.8 *Other .......................................... 3.2 2.0 1.3 0.6 1.6 *
SexMale ........................................... 2.0 1.1 0.9 1.1 0.8 *Female........................................ 0.7 0.5 0.3 0.3 0.2 *
*Estimate of standard error is not derived because it is based on a statistic estimated at 0 or 100 percent.1Targeted public school teachers were full-time public school teachers in grades 1 through 12 whose main teaching assignment was inEnglish/language arts, social studies/social sciences, foreign language, mathematics, or science, or who taught a self-contained classroom.2Data for general elementary classrooms are reported for elementary schools only. Data for all school levels are included in the totals and inanalyses by other school and teacher characteristics.
NOTE: Teachers referred to here as teachers in general elementary classrooms include all teachers of self-contained classrooms in the 1998FRSS study, regardless of instructional level. Almost all (95 percent) of the self-contained classrooms were at the elementary school level.
SOURCE: U.S. Department of Education, National Center for Education Statistics, Fast Response Survey System, Teacher Survey onProfessional Development and Training, 1998.

B-15
Table B-5.—Percent of full-time public school teachers in departmentalized settings with various typesof teaching certificates in their state in their main teaching assignment field, by selectedschool and teacher characteristics: 1998
School and teacher characteristic
Regular orstandard statecertificate, or
advancedprofessionalcertificate
Provisional orother type of
certificategiven while
participating inan “alternative
certificationprogram”
Probationarycertificate
Temporarycertificate
Emergencycertificate or
waiverNo certificate
All targeted public schoolteachers1 ..................................... 92 4 2 1 1 *
School instructional level2
Middle school ..................................... 93 3 2 1 1 *High school......................................... 91 4 3 1 1 *Combined............................................ 87 4 5 3 * 1
School enrollment sizeLess than 300...................................... 95 2 2 0 1 *300 to 499 ........................................... 89 5 4 1 1 1500 to 999 ........................................... 93 4 2 1 1 *1,000 or more...................................... 91 3 3 2 1 0
LocaleCentral city.......................................... 90 3 3 2 1 *Urban fringe/large town..................... 92 3 2 1 1 *Rural/small town ................................ 92 5 2 1 1 *
RegionNortheast ............................................. 90 5 4 1 0 *Midwest............................................... 93 4 2 1 0 *South ................................................... 92 3 2 1 1 *West..................................................... 90 1 3 2 3 0
Percent minority enrollment inschool
5 percent or less .................................. 92 3 3 1 * *6 to 20 percent .................................... 94 3 2 1 * *21 to 50 percent .................................. 93 3 2 1 1 *More than 50 percent ......................... 87 5 3 2 3 *
Percent of students in school eligiblefor free or reduced-price schoollunch
Less than 15 percent........................... 92 3 3 1 * 115 to 32 percent .................................. 93 3 2 2 1 *33 to 59 percent .................................. 94 3 2 1 * 060 percent or more.............................. 87 5 3 2 3 1
Main teaching assignmentMath/science....................................... 91 4 3 1 1 *Other targeted academic subject........ 92 4 2 1 1 *
Teaching experience3 or fewer years .................................. 64 13 12 5 6 *4 to 9 years.......................................... 89 5 3 1 * *10 to 19 years...................................... 97 1 * * * 120 or more years ................................. 99 1 * 0 0 0
Teacher race/ethnicityWhite, non-Hispanic .......................... 93 3 3 1 * *Black, non-Hispanic........................... 82 7 3 3 4 1Other.................................................... 85 5 2 2 5 1
SexMale..................................................... 90 4 3 1 1 1Female................................................. 92 4 2 1 1 *
*Less than 0.5 percent.1Targeted public school teachers were full-time public school teachers in grades 1 through 12 whose main teaching assignment was inEnglish/language arts, social studies/social sciences, foreign language, mathematics, or science, or who taught a self-contained classroom.2Data for departmentalized settings are not reported for elementary schools. Data for all school levels are included in the totals and in analyses by otherschool and teacher characteristics.
NOTE: Percents are computed across each row, but may not sum to 100 because of rounding. Zeros indicate that no teacher in the sample gave theindicated response.
SOURCE: U.S. Department of Education, National Center for Education Statistics, Fast Response Survey System, Teacher Survey on ProfessionalDevelopment and Training, 1998.

B-16
Table B-5a.—Standard errors of the percent of full-time public school teachers in departmentalizedsettings with various types of teaching certificates in their state in their main teachingassignment field, by selected school and teacher characteristics: 1998
School and teachercharacteristic
Regular orstandard statecertificate, or
advancedprofessionalcertificate
Provisional orother type of
certificategiven while
participating inan “alternative
certificationprogram”
Probationarycertificate
Temporarycertificate
Emergencycertificate or
waiverNo certificate
All targeted public schoolteachers1 ........................... 0.5 0.3 0.3 0.2 0.2 0.1
School instructional level2
Middle school............................ 0.6 0.4 0.3 0.3 0.3 0.2High school................................ 0.9 0.6 0.5 0.3 0.2 0.1Combined .................................. 2.9 1.3 2.0 0.8 0.2 0.5
School enrollment sizeLess than 300............................. 1.7 1.1 0.8 * 0.5 0.3300 to 499.................................. 2.2 1.4 1.5 0.5 0.5 0.5500 to 999.................................. 0.7 0.5 0.3 0.2 0.4 0.21,000 or more ............................ 0.9 0.6 0.5 0.5 0.3 *
LocaleCentral city ................................ 0.8 0.5 0.6 0.5 0.4 0.3Urban fringe/large town............ 0.8 0.5 0.5 0.3 0.4 0.2Rural/small town ....................... 1.1 0.8 0.7 0.3 0.2 0.1
RegionNortheast.................................... 1.0 0.9 0.7 0.5 * 0.3Midwest ..................................... 1.5 0.8 0.8 0.3 * 0.3South .......................................... 0.7 0.6 0.4 0.3 0.3 0.2West ........................................... 1.4 0.4 0.8 0.7 1.1 *
Percent minority enrollment inschool
5 percent or less......................... 1.4 0.7 0.8 0.3 0.1 0.36 to 20 percent........................... 0.9 0.6 0.5 0.3 0.2 0.121 to 50 percent......................... 1.0 0.7 0.6 0.4 0.3 0.2More than 50 percent ................ 1.2 0.8 0.6 0.7 0.8 0.3
Percent of students in schooleligible for free or reduced-price school lunch
Less than 15 percent ................. 1.2 0.6 0.7 0.4 0.2 0.315 to 32 percent......................... 1.0 0.6 0.5 0.5 0.2 0.133 to 59 percent......................... 1.0 0.7 0.4 0.3 0.2 *60 percent or more .................... 1.5 0.9 0.7 0.6 1.1 0.4
Main teaching assignmentMath/science.............................. 0.7 0.5 0.5 0.3 0.3 0.2Other targeted academic
subject ................................... 0.6 0.5 0.4 0.3 0.3 0.2
Teaching experience3 or fewer years......................... 2.3 1.5 1.5 1.2 1.4 0.34 to 9 years ................................ 1.5 1.0 0.8 0.6 0.3 0.310 to 19 years ............................ 0.7 0.5 0.2 0.2 0.2 0.320 or more years........................ 0.4 0.4 0.1 * * *
Teacher race/ethnicityWhite, non-Hispanic ................. 0.5 0.3 0.3 0.2 0.1 0.1Black, non-Hispanic.................. 3.0 1.7 1.4 1.1 1.5 1.0Other .......................................... 3.0 1.5 0.9 1.3 2.7 0.8
SexMale ........................................... 0.9 0.5 0.5 0.3 0.3 0.3Female........................................ 0.6 0.5 0.3 0.3 0.3 0.1
*Estimate of standard error is not derived because it is based on a statistic estimated at 0 or 100 percent.1Targeted public school teachers were full-time public school teachers in grades 1 through 12 whose main teaching assignment was inEnglish/language arts, social studies/social sciences, foreign language, mathematics, or science, or who taught a self-contained classroom.2Data for departmentalized settings are not reported for elementary schools. Data for all school levels are included in the totals and in analyses byother school and teacher characteristics.
SOURCE: U.S. Department of Education, National Center for Education Statistics, Fast Response Survey System, Teacher Survey onProfessional Development and Training, 1998.

B-17
Table B-6.—Percent of full-time public school teachers in departmentalized settings with various typesof teaching certificates in their state in their secondary teaching assignment field, byselected school and teacher characteristics: 1998
School and teacher characteristic
Regular orstandard statecertificate, or
advancedprofessionalcertificate
Provisional orother type of
certificategiven while
participating inan “alternative
certificationprogram”
Probationarycertificate
Temporarycertificate
Emergencycertificate or
waiverNo certificate
All targeted public school teachers1 .... 85 3 1 2 1 8
School instructional level2
Middle school............................................ 86 2 0 1 1 9High school................................................ 82 3 2 3 * 9Combined................................................... 78 8 * 0 0 13
School enrollment sizeLess than 300............................................. 88 3 0 0 0 9300 to 499.................................................. 81 5 3 2 * 9500 to 999.................................................. 87 3 1 1 2 71,000 or more ............................................ 81 2 1 3 3 10
LocaleCentral city ................................................ 81 4 1 3 1 10Urban fringe/large town............................ 85 2 2 2 2 7Rural/small town ....................................... 88 3 1 * 1 7
RegionNortheast.................................................... 84 4 2 1 0 10Midwest ..................................................... 87 6 1 0 0 6South .......................................................... 88 2 1 2 1 7West ........................................................... 77 2 2 3 6 12
Percent minority enrollment in school5 percent or less......................................... 84 4 2 * 0 96 to 20 percent ........................................... 93 2 1 1 0 321 to 50 percent ......................................... 87 1 * 2 * 9More than 50 percent ................................ 75 4 1 3 6 11
Percent of students in school eligible forfree or reduced-price school lunch
Less than 15 percent.................................. 81 4 3 1 0 1015 to 32 percent ......................................... 88 3 1 1 0 733 to 59 percent......................................... 87 2 0 2 * 960 percent or more .................................... 82 2 1 2 6 7
Main teaching assignmentMath/science.............................................. 86 3 1 1 1 8Other targeted academic subject .............. 84 3 2 2 2 8
Teaching experience3 or fewer years......................................... 68 6 7 4 6 94 to 9 years................................................. 74 7 0 4 1 1410 to 19 years ............................................ 92 0 1 * 1 620 or more years........................................ 94 1 0 0 0 5
Teacher race/ethnicityWhite, non-Hispanic ................................. 86 3 1 2 * 8Black, non-Hispanic.................................. # # # # # #Other .......................................................... 76 4 0 1 7 11
SexMale ........................................................... 81 3 2 2 1 11Female........................................................ 87 3 1 1 2 7
*Less than 0.5 percent.
#Too few cases for a reliable estimate.1Targeted public school teachers were full-time public school teachers in grades 1 through 12 whose main teaching assignment was in English/languagearts, social studies/social sciences, foreign language, mathematics, or science, or who taught a self-contained classroom.2Data for departmentalized settings are not reported for elementary schools. Data for all school levels are included in the totals and in analyses by otherschool and teacher characteristics.
NOTE: Percents are computed across each row, but may not sum to 100 because of rounding. Zeros indicate that no teacher in the sample gave theindicated response.
SOURCE: U.S. Department of Education, National Center for Education Statistics, Fast Response Survey System, Teacher Survey on ProfessionalDevelopment and Training, 1998.
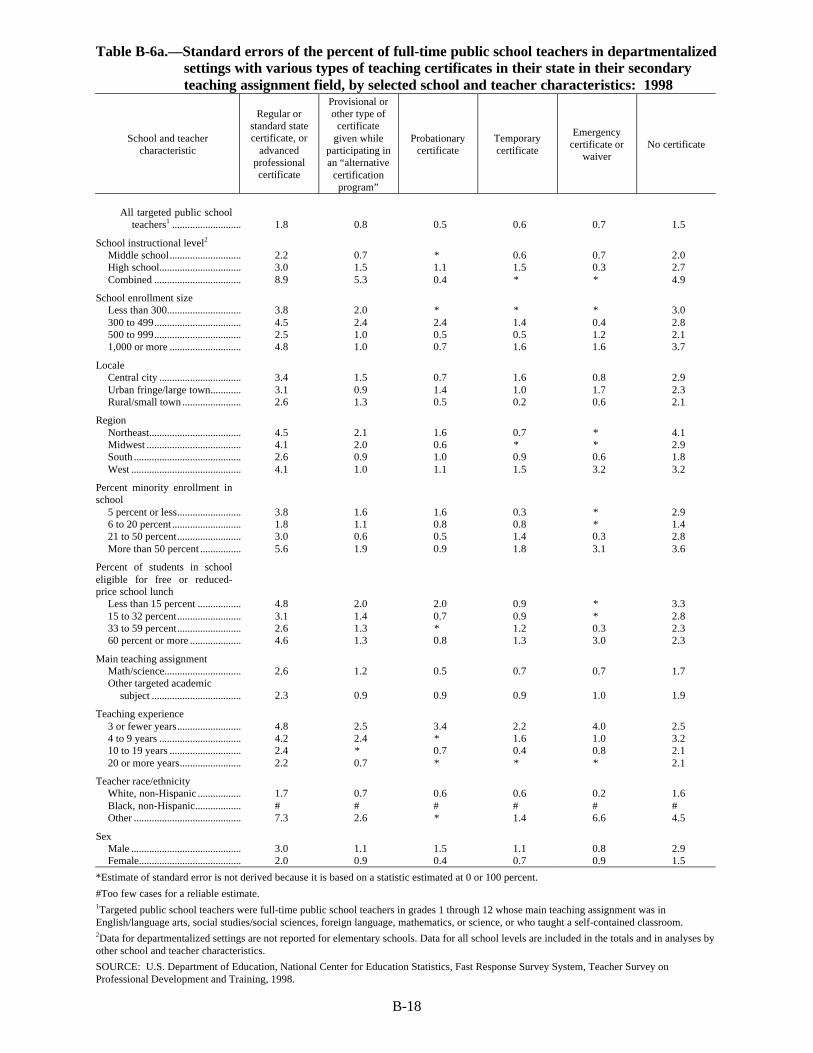
B-18
Table B-6a.—Standard errors of the percent of full-time public school teachers in departmentalizedsettings with various types of teaching certificates in their state in their secondaryteaching assignment field, by selected school and teacher characteristics: 1998
School and teachercharacteristic
Regular orstandard statecertificate, or
advancedprofessionalcertificate
Provisional orother type of
certificategiven while
participating inan “alternative
certificationprogram”
Probationarycertificate
Temporarycertificate
Emergencycertificate or
waiverNo certificate
All targeted public schoolteachers1 ........................... 1.8 0.8 0.5 0.6 0.7 1.5
School instructional level2
Middle school............................ 2.2 0.7 * 0.6 0.7 2.0High school................................ 3.0 1.5 1.1 1.5 0.3 2.7Combined .................................. 8.9 5.3 0.4 * * 4.9
School enrollment sizeLess than 300............................. 3.8 2.0 * * * 3.0300 to 499.................................. 4.5 2.4 2.4 1.4 0.4 2.8500 to 999.................................. 2.5 1.0 0.5 0.5 1.2 2.11,000 or more ............................ 4.8 1.0 0.7 1.6 1.6 3.7
LocaleCentral city ................................ 3.4 1.5 0.7 1.6 0.8 2.9Urban fringe/large town............ 3.1 0.9 1.4 1.0 1.7 2.3Rural/small town ....................... 2.6 1.3 0.5 0.2 0.6 2.1
RegionNortheast.................................... 4.5 2.1 1.6 0.7 * 4.1Midwest ..................................... 4.1 2.0 0.6 * * 2.9South .......................................... 2.6 0.9 1.0 0.9 0.6 1.8West ........................................... 4.1 1.0 1.1 1.5 3.2 3.2
Percent minority enrollment inschool
5 percent or less......................... 3.8 1.6 1.6 0.3 * 2.96 to 20 percent........................... 1.8 1.1 0.8 0.8 * 1.421 to 50 percent......................... 3.0 0.6 0.5 1.4 0.3 2.8More than 50 percent ................ 5.6 1.9 0.9 1.8 3.1 3.6
Percent of students in schooleligible for free or reduced-price school lunch
Less than 15 percent ................. 4.8 2.0 2.0 0.9 * 3.315 to 32 percent......................... 3.1 1.4 0.7 0.9 * 2.833 to 59 percent......................... 2.6 1.3 * 1.2 0.3 2.360 percent or more .................... 4.6 1.3 0.8 1.3 3.0 2.3
Main teaching assignmentMath/science.............................. 2.6 1.2 0.5 0.7 0.7 1.7Other targeted academic
subject ................................... 2.3 0.9 0.9 0.9 1.0 1.9
Teaching experience3 or fewer years......................... 4.8 2.5 3.4 2.2 4.0 2.54 to 9 years ................................ 4.2 2.4 * 1.6 1.0 3.210 to 19 years ............................ 2.4 * 0.7 0.4 0.8 2.120 or more years........................ 2.2 0.7 * * * 2.1
Teacher race/ethnicityWhite, non-Hispanic ................. 1.7 0.7 0.6 0.6 0.2 1.6Black, non-Hispanic.................. # # # # # #Other .......................................... 7.3 2.6 * 1.4 6.6 4.5
SexMale ........................................... 3.0 1.1 1.5 1.1 0.8 2.9Female........................................ 2.0 0.9 0.4 0.7 0.9 1.5
*Estimate of standard error is not derived because it is based on a statistic estimated at 0 or 100 percent.
#Too few cases for a reliable estimate.1Targeted public school teachers were full-time public school teachers in grades 1 through 12 whose main teaching assignment was inEnglish/language arts, social studies/social sciences, foreign language, mathematics, or science, or who taught a self-contained classroom.2Data for departmentalized settings are not reported for elementary schools. Data for all school levels are included in the totals and in analyses byother school and teacher characteristics.
SOURCE: U.S. Department of Education, National Center for Education Statistics, Fast Response Survey System, Teacher Survey onProfessional Development and Training, 1998.

B-19
Table B-7.—Percent of full-time public school teachers in grades 7 through 12 who reported havingan undergraduate or graduate major or minor in their main teaching assignmentfield, by selected school and teacher characteristics: 1998
School and teacher characteristicEnglish/
language artsForeignlanguage
Social studies/social science
Mathematics Science
All targeted public school teachers1 ...... 86 96 89 82 88
School enrollment sizeLess than 300............................................... 85 # # 82 88300 to 499.................................................... 79 # 91 87 86500 to 999.................................................... 83 94 87 78 871,000 or more .............................................. 92 99 91 85 91
LocaleCentral city .................................................. 82 99 85 81 79Urban fringe/large town.............................. 91 97 90 83 94Rural/small town ......................................... 85 94 91 82 89
RegionNortheast...................................................... 85 99 87 87 89Midwest ....................................................... 89 97 82 86 93South ............................................................ 87 90 92 80 88West ............................................................. 84 # 92 78 80
Percent minority enrollment in school5 percent or less........................................... 87 94 88 85 936 to 20 percent............................................. 89 95 88 81 8921 to 50 percent........................................... 86 100 93 87 88More than 50 percent .................................. 83 # 86 76 81
Percent of students in school eligible forfree or reduced-price school lunch
Less than 15 percent ................................... 90 96 91 87 9315 to 32 percent........................................... 89 99 87 89 9233 to 59 percent........................................... 86 # 89 81 8160 percent or more ...................................... 76 # 86 69 83
Teaching experience3 or fewer years........................................... 85 # 89 79 824 to 9 years .................................................. 79 95 87 86 8310 to 19 years .............................................. 85 96 86 77 8820 or more years.......................................... 90 100 91 85 96
Teacher race/ethnicityWhite, non-Hispanic ................................... 87 96 88 81 88Black, non-Hispanic.................................... 70 # 96 90 #Other ............................................................ # # # 87 93
SexMale ............................................................. 91 95 93 87 92Female.......................................................... 85 97 81 79 84
#Too few cases for a reliable estimate.1Targeted public school teachers were full-time public school teachers in grades 1 through 12 whose main teaching assignment was inEnglish/language arts, social studies/social sciences, foreign language, mathematics, or science, or who taught a self-contained classroom.
SOURCE: U.S. Department of Education, National Center for Education Statistics, Fast Response Survey System, Teacher Survey onProfessional Development and Training, 1998.
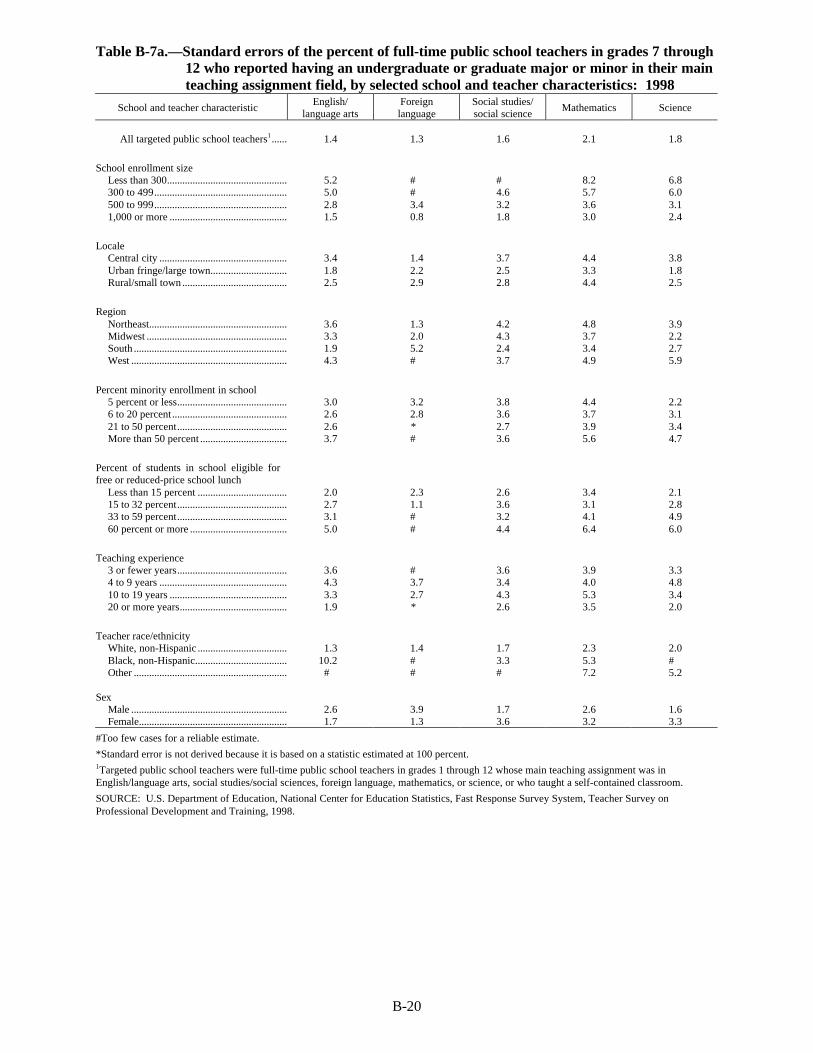
B-20
Table B-7a.—Standard errors of the percent of full-time public school teachers in grades 7 through12 who reported having an undergraduate or graduate major or minor in their mainteaching assignment field, by selected school and teacher characteristics: 1998
School and teacher characteristicEnglish/
language artsForeignlanguage
Social studies/social science
Mathematics Science
All targeted public school teachers1 ...... 1.4 1.3 1.6 2.1 1.8
School enrollment sizeLess than 300............................................... 5.2 # # 8.2 6.8300 to 499.................................................... 5.0 # 4.6 5.7 6.0500 to 999.................................................... 2.8 3.4 3.2 3.6 3.11,000 or more .............................................. 1.5 0.8 1.8 3.0 2.4
LocaleCentral city .................................................. 3.4 1.4 3.7 4.4 3.8Urban fringe/large town.............................. 1.8 2.2 2.5 3.3 1.8Rural/small town ......................................... 2.5 2.9 2.8 4.4 2.5
RegionNortheast...................................................... 3.6 1.3 4.2 4.8 3.9Midwest ....................................................... 3.3 2.0 4.3 3.7 2.2South ............................................................ 1.9 5.2 2.4 3.4 2.7West ............................................................. 4.3 # 3.7 4.9 5.9
Percent minority enrollment in school5 percent or less........................................... 3.0 3.2 3.8 4.4 2.26 to 20 percent............................................. 2.6 2.8 3.6 3.7 3.121 to 50 percent........................................... 2.6 * 2.7 3.9 3.4More than 50 percent .................................. 3.7 # 3.6 5.6 4.7
Percent of students in school eligible forfree or reduced-price school lunch
Less than 15 percent ................................... 2.0 2.3 2.6 3.4 2.115 to 32 percent........................................... 2.7 1.1 3.6 3.1 2.833 to 59 percent........................................... 3.1 # 3.2 4.1 4.960 percent or more ...................................... 5.0 # 4.4 6.4 6.0
Teaching experience3 or fewer years........................................... 3.6 # 3.6 3.9 3.34 to 9 years .................................................. 4.3 3.7 3.4 4.0 4.810 to 19 years .............................................. 3.3 2.7 4.3 5.3 3.420 or more years.......................................... 1.9 * 2.6 3.5 2.0
Teacher race/ethnicityWhite, non-Hispanic ................................... 1.3 1.4 1.7 2.3 2.0Black, non-Hispanic.................................... 10.2 # 3.3 5.3 #Other ............................................................ # # # 7.2 5.2
SexMale ............................................................. 2.6 3.9 1.7 2.6 1.6Female.......................................................... 1.7 1.3 3.6 3.2 3.3
#Too few cases for a reliable estimate.
*Standard error is not derived because it is based on a statistic estimated at 100 percent.1Targeted public school teachers were full-time public school teachers in grades 1 through 12 whose main teaching assignment was inEnglish/language arts, social studies/social sciences, foreign language, mathematics, or science, or who taught a self-contained classroom.
SOURCE: U.S. Department of Education, National Center for Education Statistics, Fast Response Survey System, Teacher Survey onProfessional Development and Training, 1998.

B-21
Table B-8.—Percent of full-time public school teachers in grades 9 through 12 who reported havingan undergraduate or graduate major or minor in their main teaching assignment field,by selected school and teacher characteristics: 1998
School and teacher characteristicEnglish/
language artsForeignlanguage
Social studies/social science
Mathematics Science
All targeted public school teachers1 ...... 96 96 96 90 94
School enrollment sizeLess than 300............................................... # # # # #300 to 499.................................................... 97 # # 91 #500 to 999.................................................... 97 # 95 94 961,000 or more .............................................. 95 99 96 88 94
LocaleCentral city .................................................. 94 100 96 88 90Urban fringe/large town.............................. 97 96 95 90 98Rural/small town ......................................... 97 93 97 90 93
RegionNortheast...................................................... 98 98 92 89 90Midwest ....................................................... 94 97 94 93 97South ............................................................ 97 # 97 90 94West ............................................................. 96 # 100 84 94
Percent minority enrollment in school5 percent or less........................................... 96 93 95 90 956 to 20 percent............................................. 99 95 93 91 9421 to 50 percent........................................... 95 # 98 94 95More than 50 percent .................................. 94 # 97 82 92
Percent of students in school eligible forfree or reduced-price school lunch
Less than 15 percent ................................... 97 96 97 90 9415 to 32 percent........................................... 96 99 94 92 9633 to 59 percent........................................... 96 # 97 91 9060 percent or more ...................................... 93 # # 81 #
Teaching experience3 or fewer years........................................... 92 # 93 88 914 to 9 years .................................................. 97 # 98 85 9410 to 19 years .............................................. 97 96 98 79 9120 or more years.......................................... 96 100 95 98 98
Teacher race/ethnicityWhite, non-Hispanic ................................... 97 96 95 89 94Black, non-Hispanic.................................... # # # # #Other ............................................................ # # # # #
SexMale ............................................................. 95 # 96 89 95Female.......................................................... 96 96 96 90 93
#Too few cases for a reliable estimate.1Targeted public school teachers were full-time public school teachers in grades 1 through 12 whose main teaching assignment was inEnglish/language arts, social studies/social sciences, foreign language, mathematics, or science, or who taught a self-contained classroom.
SOURCE: U.S. Department of Education, National Center for Education Statistics, Fast Response Survey System, Teacher Survey onProfessional Development and Training, 1998.

B-22
Table B-8a.—Standard errors of the percent of full-time public school teachers in grades 9 through12 who reported having an undergraduate or graduate major or minor in their mainteaching assignment field, by selected school and teacher characteristics: 1998
School and teacher characteristicEnglish/
language artsForeignlanguage
Social studies/social science
Mathematics Science
All targeted public school teachers1 ...... 1.0 1.5 1.2 2.0 1.4
School enrollment sizeLess than 300............................................... # # # # #300 to 499.................................................... 3.3 # # 5.7 #500 to 999.................................................... 1.5 # 2.9 3.7 2.11,000 or more .............................................. 1.4 0.8 1.6 3.1 1.9
LocaleCentral city .................................................. 2.3 * 2.2 4.6 4.5Urban fringe/large town.............................. 1.6 2.9 2.3 3.5 1.3Rural/small town ......................................... 1.6 3.3 1.9 2.6 2.3
RegionNortheast...................................................... 1.9 1.7 3.9 5.2 4.4Midwest ....................................................... 2.6 2.2 3.3 2.8 1.9South ............................................................ 1.5 # 1.6 2.8 2.1West ............................................................. 2.3 # * 4.9 4.0
Percent minority enrollment in school5 percent or less........................................... 1.9 3.8 2.7 4.0 2.46 to 20 percent............................................. 1.4 3.3 3.2 2.8 3.021 to 50 percent........................................... 2.7 # 1.9 2.6 2.5More than 50 percent .................................. 2.6 # 2.3 6.3 3.7
Percent of students in school eligible forfree or reduced-price school lunch
Less than 15 percent ................................... 1.5 2.7 1.8 3.9 2.415 to 32 percent........................................... 1.8 1.3 2.7 2.5 3.033 to 59 percent........................................... 2.3 # 2.1 3.5 4.260 percent or more ...................................... 3.9 # # 8.8 #
Teaching experience3 or fewer years........................................... 3.2 # 3.9 4.5 3.24 to 9 years .................................................. 2.4 # 2.4 5.4 4.610 to 19 years .............................................. 2.0 3.2 2.5 5.3 3.620 or more years.......................................... 1.5 * 2.0 1.3 1.7
Teacher race/ethnicityWhite, non-Hispanic ................................... 1.1 1.7 1.4 2.1 1.5Black, non-Hispanic.................................... # # # # #Other ............................................................ # # # # #
SexMale ............................................................. 2.1 # 1.4 2.7 1.5Female.......................................................... 1.2 1.6 2.5 2.6 2.6
#Too few cases for a reliable estimate.
*Standard error is not derived because it is based on a statistic estimated at 100 percent.1Targeted public school teachers were full-time public school teachers in grades 1 through 12 whose main teaching assignment was inEnglish/language arts, social studies/social sciences, foreign language, mathematics, or science, or who taught a self-contained classroom.
SOURCE: U.S. Department of Education, National Center for Education Statistics, Fast Response Survey System, Teacher Survey onProfessional Development and Training, 1998.

B-23
Table B-9.—Percent of full-time public school teachers who participated in professionaldevelopment activities of various lengths in the last 12 months that focused on varioustopics, by selected school and teacher characteristics: 1998
In-depth study in the subject area ofyour main teaching assignment
New methods of teaching(e.g., cooperative learning)
Total hours spent Total hours spentSchool and teacher characteristic
0 1 to 8 9 to 32More
than 320 1 to 8 9 to 32
Morethan 32
All targeted public schoolteachers1 .................................. 27 32 24 17 23 47 21 8
School instructional levelElementary school............................ 25 32 26 17 22 48 20 9Middle school................................... 27 33 23 16 23 45 24 8High school....................................... 33 31 19 17 24 47 22 6Combined ......................................... 29 30 23 19 22 47 20 11
School enrollment sizeLess than 300.................................... 28 34 22 16 25 46 19 11300 to 499......................................... 28 33 22 17 25 48 20 8500 to 999......................................... 26 32 26 17 23 47 22 91,000 or more ................................... 30 30 21 18 21 49 23 8
LocaleCentral city ....................................... 24 32 26 18 22 48 22 9Urban fringe/large town................... 28 31 23 18 23 47 22 9Rural/small town .............................. 30 34 21 15 25 47 20 8
RegionNortheast........................................... 29 31 23 18 23 46 22 9Midwest ............................................ 31 35 19 14 25 47 20 8South ................................................. 26 32 25 16 22 50 21 7West .................................................. 24 28 26 22 22 44 23 11
Percent minority enrollment inschool
5 percent or less................................ 31 36 20 14 25 48 20 76 to 20 percent.................................. 24 34 25 17 25 49 20 721 to 50 percent................................ 29 29 25 16 23 45 22 10More than 50 percent ....................... 25 29 25 21 19 48 23 11
Percent of students in schooleligible for free or reduced-priceschool lunch
Less than 15 percent ........................ 28 33 21 18 23 49 21 715 to 32 percent................................ 30 30 23 16 25 45 22 733 to 59 percent................................ 27 34 25 14 22 49 20 960 percent or more ........................... 25 30 25 20 22 46 22 10
Main teaching assignment
General elementary2......................... 25 32 26 17 22 48 20 10Math/science..................................... 28 31 22 19 27 46 20 7Other targeted academic subject ..... 31 33 20 15 22 47 24 7
Teaching experience3 or fewer years................................ 23 33 27 16 18 47 26 94 to 9 years ....................................... 22 32 28 18 21 48 23 810 to 19 years ................................... 26 32 25 17 22 49 20 1020 or more years............................... 33 32 19 16 27 46 19 8
Teacher race/ethnicityWhite, non-Hispanic ........................ 28 32 23 16 24 47 21 8Black, non-Hispanic......................... 19 33 28 21 17 44 26 12Other ................................................. 24 29 24 24 15 49 22 14
SexMale .................................................. 30 32 21 17 24 46 23 7Female............................................... 27 32 24 17 23 48 21 9

B-24
Table B-9.—Percent of full-time public school teachers who participated in professionaldevelopment activities of various lengths in the last 12 months that focused on varioustopics, by selected school and teacher characteristics: 1998 (continued)
State or district curriculum andperformance standards
Integration of educational technologyin the grade or subject you teach
Total hours spent Total hours spentSchool and teacher characteristic
0 1 to 8 9 to 32More
than 320 1 to 8 9 to 32
Morethan 32
All targeted public schoolteachers1 .................................. 19 50 25 7 22 49 22 7
School instructional levelElementary school............................ 17 50 25 7 21 49 23 7Middle school................................... 19 48 27 6 20 50 23 7High school....................................... 21 50 22 7 25 48 19 8Combined ......................................... 18 53 17 11 22 47 24 6
School enrollment sizeLess than 300.................................... 18 48 29 5 23 50 21 6300 to 499......................................... 16 52 26 7 18 51 24 7500 to 999......................................... 18 50 25 8 22 47 23 71,000 or more ................................... 23 49 21 7 24 49 20 8
LocaleCentral city ....................................... 20 51 22 7 22 51 19 8Urban fringe/large town................... 18 51 25 7 22 47 24 7Rural/small town .............................. 18 48 27 7 22 49 22 7
RegionNortheast........................................... 17 50 26 7 23 48 22 7Midwest ............................................ 20 50 23 7 20 49 23 8South ................................................. 19 53 22 6 21 51 22 6West .................................................. 18 44 29 9 25 45 23 8
Percent minority enrollment inschool
5 percent or less................................ 18 50 25 7 22 46 25 76 to 20 percent.................................. 15 49 28 8 21 51 22 621 to 50 percent................................ 21 49 23 7 22 47 23 8More than 50 percent ....................... 21 52 21 6 23 52 18 7
Percent of students in schooleligible for free or reduced-priceschool lunch
Less than 15 percent ........................ 18 50 24 8 19 47 27 715 to 32 percent................................ 17 51 26 6 23 48 23 633 to 59 percent................................ 20 48 25 7 22 51 19 860 percent or more ........................... 19 51 23 6 23 49 20 7
Main teaching assignment
General elementary2......................... 17 50 26 7 20 50 23 7Math/science..................................... 20 53 21 7 23 49 19 9Other targeted academic subject ..... 21 49 24 7 24 47 23 6
Teaching experience3 or fewer years................................ 22 55 19 4 28 49 18 54 to 9 years ....................................... 16 51 25 8 21 46 23 1010 to 19 years ................................... 16 48 28 8 21 48 23 720 or more years............................... 20 49 24 7 21 51 22 6
Teacher race/ethnicityWhite, non-Hispanic ........................ 19 50 25 7 22 48 23 7Black, non-Hispanic......................... 20 51 21 8 16 56 20 8Other ................................................. 16 50 24 10 22 52 18 8
SexMale .................................................. 23 47 24 5 23 48 21 8Female............................................... 17 51 25 7 22 49 22 7

B-25
Table B-9.—Percent of full-time public school teachers who participated in professionaldevelopment activities of various lengths in the last 12 months that focused on varioustopics, by selected school and teacher characteristics: 1998 (continued)
Student performance assessmentClassroom management,
including student discipline
Total hours spent Total hours spentSchool and teacher characteristic
0 1 to 8 9 to 32More
than 320 1 to 8 9 to 32
Morethan 32
All targeted public schoolteachers1 .................................. 33 47 15 5 51 38 8 3
School instructional levelElementary school............................ 28 49 17 6 46 43 8 3Middle school................................... 35 48 13 3 53 36 8 3High school....................................... 39 45 11 4 60 31 6 2Combined ......................................... 39 40 16 5 55 34 9 3
School enrollment sizeLess than 300.................................... 34 47 13 6 52 40 8 1300 to 499......................................... 31 48 16 4 48 41 8 3500 to 999......................................... 32 47 15 6 50 39 8 31,000 or more ................................... 35 46 13 5 56 34 7 3
LocaleCentral city ....................................... 31 48 16 5 47 40 9 3Urban fringe/large town................... 31 49 15 5 53 37 7 3Rural/small town .............................. 36 45 13 5 53 38 7 2
RegionNortheast........................................... 35 46 15 5 54 36 6 4Midwest ............................................ 37 48 12 4 56 36 7 1South ................................................. 32 49 15 4 46 42 9 3West .................................................. 28 45 19 8 54 36 7 3
Percent minority enrollment inschool
5 percent or less................................ 37 47 11 5 58 35 5 26 to 20 percent.................................. 31 50 15 4 57 34 6 321 to 50 percent................................ 35 44 15 6 48 42 8 2More than 50 percent ....................... 28 49 18 6 41 43 12 4
Percent of students in schooleligible for free or reduced-priceschool lunch
Less than 15 percent ........................ 34 47 14 4 60 31 6 315 to 32 percent................................ 36 46 13 4 56 36 7 133 to 59 percent................................ 32 48 14 6 51 38 8 360 percent or more ........................... 29 48 18 6 39 47 10 4
Main teaching assignment
General elementary2......................... 28 49 17 6 47 43 8 3Math/science..................................... 41 44 12 3 60 31 6 2Other targeted academic subject ..... 35 46 14 5 53 35 8 4
Teaching experience3 or fewer years................................ 34 48 15 3 35 46 14 44 to 9 years ....................................... 28 48 18 6 47 42 7 410 to 19 years ................................... 31 48 16 4 54 36 7 220 or more years............................... 36 46 12 5 57 35 6 2
Teacher race/ethnicityWhite, non-Hispanic ........................ 34 48 14 4 54 37 7 3Black, non-Hispanic......................... 24 47 20 9 33 48 13 6Other ................................................. 27 42 23 8 37 46 12 5
SexMale .................................................. 39 45 12 4 55 36 6 3Female............................................... 31 48 16 5 50 39 8 3
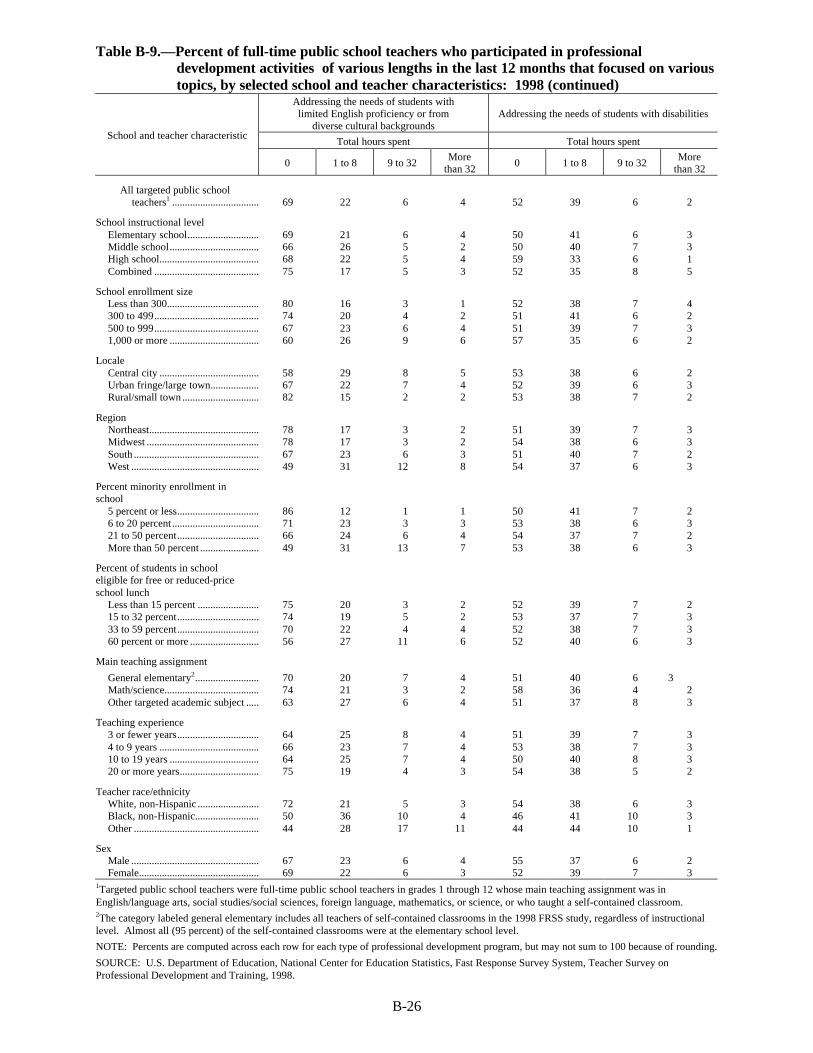
B-26
Table B-9.—Percent of full-time public school teachers who participated in professionaldevelopment activities of various lengths in the last 12 months that focused on varioustopics, by selected school and teacher characteristics: 1998 (continued)
Addressing the needs of students withlimited English proficiency or from
diverse cultural backgroundsAddressing the needs of students with disabilities
Total hours spent Total hours spentSchool and teacher characteristic
0 1 to 8 9 to 32More
than 320 1 to 8 9 to 32
Morethan 32
All targeted public schoolteachers1 .................................. 69 22 6 4 52 39 6 2
School instructional levelElementary school............................ 69 21 6 4 50 41 6 3Middle school................................... 66 26 5 2 50 40 7 3High school....................................... 68 22 5 4 59 33 6 1Combined ......................................... 75 17 5 3 52 35 8 5
School enrollment sizeLess than 300.................................... 80 16 3 1 52 38 7 4300 to 499......................................... 74 20 4 2 51 41 6 2500 to 999......................................... 67 23 6 4 51 39 7 31,000 or more ................................... 60 26 9 6 57 35 6 2
LocaleCentral city ....................................... 58 29 8 5 53 38 6 2Urban fringe/large town................... 67 22 7 4 52 39 6 3Rural/small town .............................. 82 15 2 2 53 38 7 2
RegionNortheast........................................... 78 17 3 2 51 39 7 3Midwest ............................................ 78 17 3 2 54 38 6 3South ................................................. 67 23 6 3 51 40 7 2West .................................................. 49 31 12 8 54 37 6 3
Percent minority enrollment inschool
5 percent or less................................ 86 12 1 1 50 41 7 26 to 20 percent.................................. 71 23 3 3 53 38 6 321 to 50 percent................................ 66 24 6 4 54 37 7 2More than 50 percent ....................... 49 31 13 7 53 38 6 3
Percent of students in schooleligible for free or reduced-priceschool lunch
Less than 15 percent ........................ 75 20 3 2 52 39 7 215 to 32 percent................................ 74 19 5 2 53 37 7 333 to 59 percent................................ 70 22 4 4 52 38 7 360 percent or more ........................... 56 27 11 6 52 40 6 3
Main teaching assignment
General elementary2......................... 70 20 7 4 51 40 6 3Math/science..................................... 74 21 3 2 58 36 4 2Other targeted academic subject ..... 63 27 6 4 51 37 8 3
Teaching experience3 or fewer years................................ 64 25 8 4 51 39 7 34 to 9 years ....................................... 66 23 7 4 53 38 7 310 to 19 years ................................... 64 25 7 4 50 40 8 320 or more years............................... 75 19 4 3 54 38 5 2
Teacher race/ethnicityWhite, non-Hispanic ........................ 72 21 5 3 54 38 6 3Black, non-Hispanic......................... 50 36 10 4 46 41 10 3Other ................................................. 44 28 17 11 44 44 10 1
SexMale .................................................. 67 23 6 4 55 37 6 2Female............................................... 69 22 6 3 52 39 7 3
1Targeted public school teachers were full-time public school teachers in grades 1 through 12 whose main teaching assignment was inEnglish/language arts, social studies/social sciences, foreign language, mathematics, or science, or who taught a self-contained classroom.2The category labeled general elementary includes all teachers of self-contained classrooms in the 1998 FRSS study, regardless of instructionallevel. Almost all (95 percent) of the self-contained classrooms were at the elementary school level.
NOTE: Percents are computed across each row for each type of professional development program, but may not sum to 100 because of rounding.
SOURCE: U.S. Department of Education, National Center for Education Statistics, Fast Response Survey System, Teacher Survey onProfessional Development and Training, 1998.
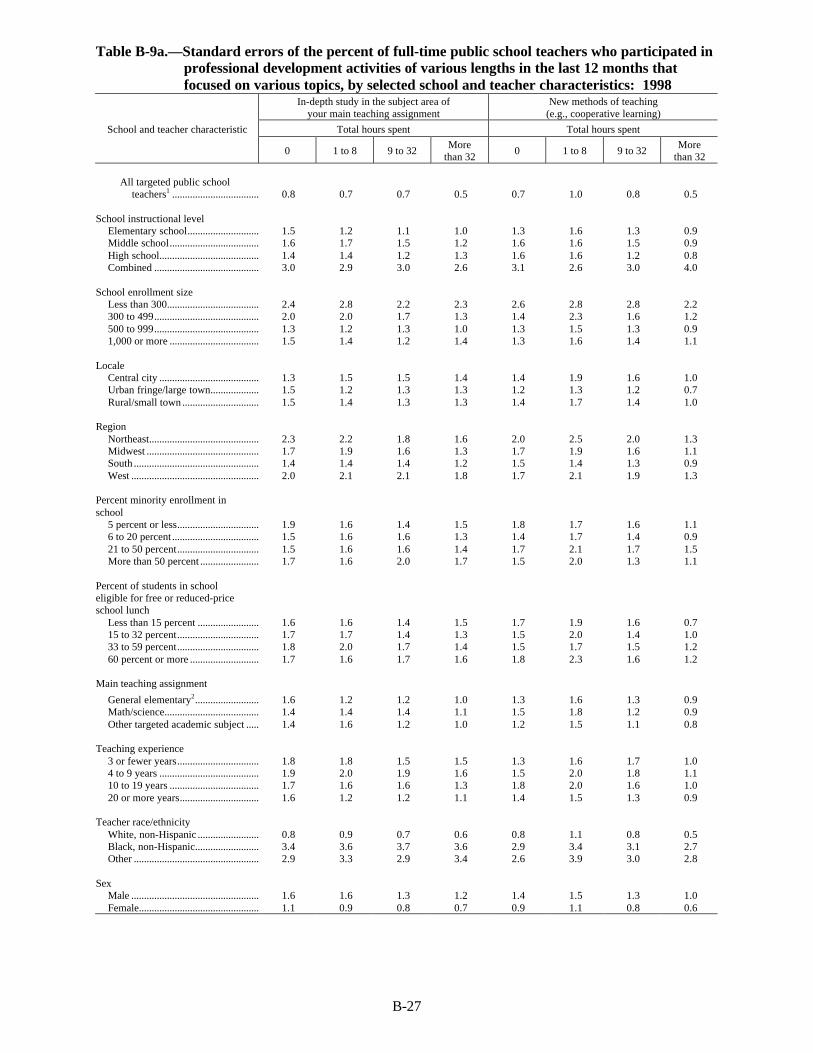
B-27
Table B-9a.—Standard errors of the percent of full-time public school teachers who participated inprofessional development activities of various lengths in the last 12 months thatfocused on various topics, by selected school and teacher characteristics: 1998
In-depth study in the subject area ofyour main teaching assignment
New methods of teaching(e.g., cooperative learning)
Total hours spent Total hours spentSchool and teacher characteristic
0 1 to 8 9 to 32More
than 320 1 to 8 9 to 32
Morethan 32
All targeted public schoolteachers1 .................................. 0.8 0.7 0.7 0.5 0.7 1.0 0.8 0.5
School instructional levelElementary school............................ 1.5 1.2 1.1 1.0 1.3 1.6 1.3 0.9Middle school................................... 1.6 1.7 1.5 1.2 1.6 1.6 1.5 0.9High school....................................... 1.4 1.4 1.2 1.3 1.6 1.6 1.2 0.8Combined ......................................... 3.0 2.9 3.0 2.6 3.1 2.6 3.0 4.0
School enrollment sizeLess than 300.................................... 2.4 2.8 2.2 2.3 2.6 2.8 2.8 2.2300 to 499......................................... 2.0 2.0 1.7 1.3 1.4 2.3 1.6 1.2500 to 999......................................... 1.3 1.2 1.3 1.0 1.3 1.5 1.3 0.91,000 or more ................................... 1.5 1.4 1.2 1.4 1.3 1.6 1.4 1.1
LocaleCentral city ....................................... 1.3 1.5 1.5 1.4 1.4 1.9 1.6 1.0Urban fringe/large town................... 1.5 1.2 1.3 1.3 1.2 1.3 1.2 0.7Rural/small town .............................. 1.5 1.4 1.3 1.3 1.4 1.7 1.4 1.0
RegionNortheast........................................... 2.3 2.2 1.8 1.6 2.0 2.5 2.0 1.3Midwest ............................................ 1.7 1.9 1.6 1.3 1.7 1.9 1.6 1.1South ................................................. 1.4 1.4 1.4 1.2 1.5 1.4 1.3 0.9West .................................................. 2.0 2.1 2.1 1.8 1.7 2.1 1.9 1.3
Percent minority enrollment inschool
5 percent or less................................ 1.9 1.6 1.4 1.5 1.8 1.7 1.6 1.16 to 20 percent.................................. 1.5 1.6 1.6 1.3 1.4 1.7 1.4 0.921 to 50 percent................................ 1.5 1.6 1.6 1.4 1.7 2.1 1.7 1.5More than 50 percent ....................... 1.7 1.6 2.0 1.7 1.5 2.0 1.3 1.1
Percent of students in schooleligible for free or reduced-priceschool lunch
Less than 15 percent ........................ 1.6 1.6 1.4 1.5 1.7 1.9 1.6 0.715 to 32 percent................................ 1.7 1.7 1.4 1.3 1.5 2.0 1.4 1.033 to 59 percent................................ 1.8 2.0 1.7 1.4 1.5 1.7 1.5 1.260 percent or more ........................... 1.7 1.6 1.7 1.6 1.8 2.3 1.6 1.2
Main teaching assignment
General elementary2......................... 1.6 1.2 1.2 1.0 1.3 1.6 1.3 0.9Math/science..................................... 1.4 1.4 1.4 1.1 1.5 1.8 1.2 0.9Other targeted academic subject ..... 1.4 1.6 1.2 1.0 1.2 1.5 1.1 0.8
Teaching experience3 or fewer years................................ 1.8 1.8 1.5 1.5 1.3 1.6 1.7 1.04 to 9 years ....................................... 1.9 2.0 1.9 1.6 1.5 2.0 1.8 1.110 to 19 years ................................... 1.7 1.6 1.6 1.3 1.8 2.0 1.6 1.020 or more years............................... 1.6 1.2 1.2 1.1 1.4 1.5 1.3 0.9
Teacher race/ethnicityWhite, non-Hispanic ........................ 0.8 0.9 0.7 0.6 0.8 1.1 0.8 0.5Black, non-Hispanic......................... 3.4 3.6 3.7 3.6 2.9 3.4 3.1 2.7Other ................................................. 2.9 3.3 2.9 3.4 2.6 3.9 3.0 2.8
SexMale .................................................. 1.6 1.6 1.3 1.2 1.4 1.5 1.3 1.0Female............................................... 1.1 0.9 0.8 0.7 0.9 1.1 0.8 0.6

B-28
Table B-9a.—Standard errors of the percent of full-time public school teachers who participated inprofessional development activities of various lengths in the last 12 months thatfocused on various topics, by selected school and teacher characteristics: 1998(continued)
State or district curriculum andperformance standards
Integration of educational technologyin the grade or subject you teach
Total hours spent Total hours spentSchool and teacher characteristic
0 1 to 8 9 to 32More
than 320 1 to 8 9 to 32
Morethan 32
All targeted public schoolteachers1 .................................. 0.8 1.1 0.8 0.4 0.8 1.0 0.8 0.5
School instructional levelElementary school............................ 1.2 1.9 1.4 0.7 1.4 1.6 1.2 0.7Middle school................................... 1.4 1.8 1.8 0.9 1.5 1.8 1.2 0.9High school....................................... 1.5 1.4 1.2 0.8 1.5 1.7 1.3 0.9Combined ......................................... 3.4 3.5 2.5 2.6 3.1 3.5 2.6 2.1
School enrollment sizeLess than 300.................................... 2.6 3.7 3.0 1.4 2.9 3.3 2.3 1.5300 to 499......................................... 1.3 2.1 2.0 1.0 1.7 2.0 1.6 1.1500 to 999......................................... 1.2 1.6 1.2 0.7 1.3 1.6 1.3 0.71,000 or more ................................... 1.5 1.7 1.2 1.0 1.5 1.8 1.3 1.0
LocaleCentral city ....................................... 1.5 2.0 1.8 0.9 1.6 2.1 1.3 0.9Urban fringe/large town................... 1.5 1.6 1.3 0.7 1.5 1.5 1.4 0.8Rural/small town .............................. 1.3 1.5 1.6 0.9 1.3 1.5 1.4 0.9
RegionNortheast........................................... 2.0 2.4 1.9 1.2 2.1 2.5 1.7 1.3Midwest ............................................ 1.7 1.9 1.5 0.8 1.7 1.9 1.5 1.0South ................................................. 1.3 1.6 1.3 0.7 1.4 1.5 1.4 0.6West .................................................. 1.8 2.4 2.2 1.4 2.2 2.5 2.1 1.2
Percent minority enrollment inschool
5 percent or less................................ 1.6 1.8 1.7 1.0 1.7 1.9 1.5 1.06 to 20 percent.................................. 1.5 1.9 1.6 1.0 1.6 1.7 1.3 0.821 to 50 percent................................ 1.7 2.2 1.5 1.1 1.7 2.2 1.8 1.1More than 50 percent ....................... 1.7 2.2 1.9 0.9 1.9 2.2 1.4 0.9
Percent of students in schooleligible for free or reduced-priceschool lunch
Less than 15 percent ........................ 1.5 1.6 1.4 1.0 1.6 1.5 1.7 1.115 to 32 percent................................ 1.4 1.8 1.4 0.9 1.9 2.0 1.5 1.033 to 59 percent................................ 1.4 2.0 1.8 1.0 1.6 1.9 1.2 0.960 percent or more ........................... 1.5 2.3 1.9 0.8 1.9 2.1 1.8 0.9
Main teaching assignment
General elementary2......................... 1.4 2.0 1.4 0.7 1.4 1.7 1.1 0.7Math/science..................................... 1.1 1.5 1.2 0.9 1.3 1.7 1.3 1.2Other targeted academic subject ..... 1.3 1.2 1.2 0.7 1.3 1.4 1.2 0.8
Teaching experience3 or fewer years................................ 1.5 2.1 1.7 0.8 1.8 2.5 1.8 1.04 to 9 years ....................................... 1.5 2.2 1.7 1.3 1.9 1.9 1.6 1.210 to 19 years ................................... 1.3 2.2 2.0 1.1 1.5 2.0 1.7 1.020 or more years............................... 1.4 1.4 1.6 0.7 1.3 1.4 1.5 0.7
Teacher race/ethnicityWhite, non-Hispanic ........................ 0.8 1.2 0.9 0.5 0.9 1.0 0.8 0.5Black, non-Hispanic......................... 3.3 5.0 3.8 1.9 2.5 3.9 3.5 1.7Other ................................................. 3.0 4.5 3.2 2.4 2.9 3.6 3.1 1.9
SexMale .................................................. 1.5 1.6 1.4 0.7 1.6 1.6 1.2 1.1Female............................................... 1.0 1.4 1.1 0.5 1.0 1.1 0.9 0.5

B-29
Table B-9a.—Standard errors of the percent of full-time public school teachers who participated inprofessional development activities of various lengths in the last 12 months thatfocused on various topics, by selected school and teacher characteristics: 1998(continued)
Student performance assessmentClassroom management,
including student discipline
Total hours spent Total hours spentSchool and teacher characteristic
0 1 to 8 9 to 32More
than 320 1 to 8 9 to 32
Morethan 32
All targeted public schoolteachers1 .................................. 0.9 1.0 0.7 0.4 0.9 0.9 0.4 0.4
School instructional levelElementary school............................ 1.5 1.6 1.3 0.7 1.6 1.7 0.8 0.6Middle school................................... 1.7 1.7 1.1 0.7 1.7 1.6 0.9 0.6High school....................................... 1.7 1.5 1.1 0.6 1.5 1.2 0.7 0.5Combined ......................................... 3.6 3.2 2.2 1.6 3.7 2.7 1.8 1.2
School enrollment sizeLess than 300.................................... 3.1 3.2 1.8 1.3 3.3 3.0 1.8 0.5300 to 499......................................... 2.2 2.3 1.7 0.9 2.0 2.3 1.0 0.8500 to 999......................................... 1.5 1.4 1.1 0.7 1.4 1.4 0.7 0.61,000 or more ................................... 1.7 1.7 1.3 0.7 1.6 1.6 0.7 0.7
LocaleCentral city ....................................... 1.6 1.8 1.4 0.8 2.1 2.2 1.0 0.6Urban fringe/large town................... 1.5 1.4 1.2 0.7 1.5 1.3 0.8 0.5Rural/small town .............................. 1.5 1.3 1.1 0.8 1.6 1.7 0.9 0.5
RegionNortheast........................................... 2.2 2.1 1.6 1.2 2.0 1.9 1.0 0.9Midwest ............................................ 1.8 1.8 1.1 0.7 2.0 2.1 0.9 0.4South ................................................. 1.6 1.7 1.2 0.7 1.8 1.7 0.8 0.7West .................................................. 2.5 2.3 2.0 1.4 2.1 2.3 1.0 0.7
Percent minority enrollment inschool
5 percent or less................................ 2.0 1.8 1.3 0.8 2.0 1.7 0.7 0.56 to 20 percent.................................. 1.7 2.0 1.4 0.8 1.5 1.6 0.9 0.821 to 50 percent................................ 2.1 1.8 1.4 1.2 1.9 2.1 1.1 0.6More than 50 percent ....................... 1.7 1.8 1.5 0.9 2.2 2.5 1.2 0.8
Percent of students in schooleligible for free or reduced-priceschool lunch
Less than 15 percent ........................ 1.8 1.8 1.4 0.7 1.8 1.4 0.8 0.615 to 32 percent................................ 1.8 1.6 1.3 0.7 1.6 1.5 0.8 0.433 to 59 percent................................ 2.2 2.2 1.6 0.9 2.1 1.9 1.0 0.760 percent or more ........................... 1.8 1.5 1.5 0.9 2.2 2.3 1.2 0.8
Main teaching assignment
General elementary2......................... 1.5 1.5 1.3 0.7 1.5 1.7 0.8 0.5Math/science..................................... 1.6 1.8 1.2 0.6 1.6 1.7 0.8 0.4Other targeted academic subject ..... 1.4 1.4 0.9 0.7 1.4 1.1 0.8 0.6
Teaching experience3 or fewer years................................ 1.5 1.7 1.6 0.8 1.8 1.8 1.5 0.94 to 9 years ....................................... 1.8 2.2 1.7 1.1 1.9 1.8 1.0 0.810 to 19 years ................................... 1.7 2.2 1.2 0.9 1.9 1.8 1.0 0.620 or more years............................... 1.6 1.5 1.0 0.8 1.3 1.3 0.8 0.6
Teacher race/ethnicityWhite, non-Hispanic ........................ 1.0 1.1 0.8 0.5 0.9 0.9 0.4 0.4Black, non-Hispanic......................... 3.5 3.9 3.1 2.1 4.0 4.3 2.6 1.9Other ................................................. 4.1 3.7 3.6 2.1 3.7 4.2 2.3 1.7
SexMale .................................................. 1.6 1.7 1.1 0.7 1.8 1.9 0.7 0.6Female............................................... 1.2 1.2 0.9 0.5 1.1 1.2 0.5 0.4

B-30
Table B-9a.—Standard errors of the percent of full-time public school teachers who participated inprofessional development activities of various lengths in the last 12 months thatfocused on various topics, by selected school and teacher characteristics: 1998(continued)
Addressing the needs of students withlimited English proficiency or from
diverse cultural backgroundsAddressing the needs of students with disabilities
Total hours spent Total hours spentSchool and teacher characteristic
0 1 to 8 9 to 32More
than 320 1 to 8 9 to 32
Morethan 32
All targeted public schoolteachers1 .................................. 1.1 0.8 0.4 0.4 1.1 0.9 0.4 0.3
School instructional levelElementary school............................ 1.7 1.3 0.7 0.7 1.7 1.5 0.7 0.5Middle school................................... 1.7 1.5 0.7 0.5 1.7 1.5 0.8 0.6High school....................................... 1.7 1.4 0.8 0.6 1.9 1.7 0.7 0.3Combined ......................................... 3.7 3.2 1.6 1.4 2.6 3.3 1.9 1.6
School enrollment sizeLess than 300.................................... 3.1 2.3 1.1 0.8 3.3 3.0 1.5 1.1300 to 499......................................... 2.1 1.7 0.8 0.7 2.3 2.3 1.0 0.6500 to 999......................................... 1.8 1.3 0.6 0.8 1.7 1.6 0.7 0.51,000 or more ................................... 1.7 1.7 1.1 0.7 1.5 1.5 0.7 0.4
LocaleCentral city ....................................... 2.0 1.7 1.0 0.9 1.9 1.6 0.9 0.5Urban fringe/large town................... 1.5 1.2 0.8 0.7 1.8 1.6 0.7 0.5Rural/small town .............................. 1.5 1.3 0.4 0.4 1.7 1.5 0.6 0.4
RegionNortheast........................................... 2.2 1.7 0.7 0.6 2.7 2.7 1.0 0.9Midwest ............................................ 1.9 1.6 0.6 0.6 1.7 2.0 0.7 0.6South ................................................. 1.7 1.5 0.8 0.6 1.9 1.7 0.8 0.4West .................................................. 2.4 1.9 1.3 1.4 2.0 1.9 1.1 0.7
Percent minority enrollment inschool
5 percent or less................................ 1.5 1.3 0.3 0.3 1.9 2.0 0.8 0.56 to 20 percent.................................. 1.9 1.7 0.6 0.5 2.2 2.1 0.8 0.621 to 50 percent................................ 2.0 1.7 1.0 0.9 2.4 2.4 1.0 0.5More than 50 percent ....................... 2.5 2.0 1.1 1.1 2.1 1.7 1.0 0.6
Percent of students in schooleligible for free or reduced-priceschool lunch
Less than 15 percent ........................ 1.7 1.5 0.6 0.3 2.4 2.1 0.9 0.515 to 32 percent................................ 1.8 1.6 0.9 0.6 1.9 1.8 0.8 0.733 to 59 percent................................ 1.9 1.4 0.7 0.8 1.7 1.7 0.9 0.660 percent or more ........................... 2.3 1.9 1.1 1.1 2.4 2.1 0.9 0.6
Main teaching assignment
General elementary2......................... 1.7 1.3 0.7 0.7 1.8 1.6 0.7 0.5Math/science..................................... 1.6 1.4 0.7 0.5 1.6 1.6 0.6 0.4Other targeted academic subject ..... 1.6 1.5 0.8 0.4 1.8 1.5 0.9 0.5
Teaching experience3 or fewer years................................ 2.2 1.8 1.0 0.8 1.7 1.6 1.0 0.74 to 9 years ....................................... 2.2 1.9 1.0 0.8 2.6 2.4 0.8 0.610 to 19 years ................................... 2.1 1.7 1.0 0.8 2.1 1.7 1.0 0.620 or more years............................... 1.4 1.1 0.5 0.6 1.6 1.5 0.7 0.5
Teacher race/ethnicityWhite, non-Hispanic ........................ 1.1 0.9 0.4 0.4 1.2 1.2 0.4 0.3Black, non-Hispanic......................... 3.5 3.6 2.5 1.9 3.5 3.9 2.5 1.2Other ................................................. 4.0 3.8 2.9 2.6 3.1 3.1 2.3 0.9
SexMale .................................................. 1.6 1.5 0.7 0.6 1.9 1.8 0.7 0.6Female............................................... 1.4 0.9 0.5 0.6 1.2 1.2 0.6 0.3
1Targeted public school teachers were full-time public school teachers in grades 1 through 12 whose main teaching assignment was inEnglish/language arts, social studies/social sciences, foreign language, mathematics, or science, or who taught a self-contained classroom.2The category labeled general elementary includes all teachers of self-contained classrooms in the 1998 FRSS study, regardless of instructionallevel. Almost all (95 percent) of the self-contained classrooms were at the elementary school level.
SOURCE: U.S. Department of Education, National Center for Education Statistics, Fast Response Survey System, Teacher Survey onProfessional Development and Training, 1998.

B-31
Table B-10.—Percent of full-time public school teachers who participated in professionaldevelopment activities in the last 12 months indicating the extent to which theybelieve the activity improved their classroom teaching, by selected school and teachercharacteristics: 1998
In-depth study in the subject area ofyour main teaching assignment
New methods of teaching(e.g., cooperative learning)
Improved my teaching Improved my teachingSchool and teacher characteristic
Alot
Moder-ately
Some-what
Notat all
Alot
Moder-ately
Some-what
Notat all
All targeted public schoolteachers1 .................................. 28 44 26 2 22 42 31 4
School instructional levelElementary school............................ 30 44 25 1 27 43 27 3Middle school................................... 25 46 27 2 18 43 35 5High school....................................... 29 41 27 3 18 40 37 5Combined ......................................... 27 44 27 2 13 36 44 7
School enrollment sizeLess than 300.................................... 30 36 30 4 23 36 38 3300 to 499......................................... 33 40 26 1 25 43 28 3500 to 999......................................... 26 48 24 2 23 43 30 41,000 or more ................................... 28 41 28 3 19 41 34 6
LocaleCentral city ....................................... 28 43 26 3 25 42 29 4Urban fringe/large town................... 30 44 25 1 24 42 30 5Rural/small town .............................. 27 44 27 2 19 42 35 4
RegionNortheast........................................... 29 44 25 2 22 43 32 3Midwest ............................................ 25 45 28 2 22 41 34 4South ................................................. 27 45 26 2 22 42 31 5West .................................................. 36 38 25 1 25 44 28 4
Percent minority enrollment inschool
5 percent or less................................ 24 46 26 3 19 43 35 46 to 20 percent.................................. 27 44 28 1 20 42 33 621 to 50 percent................................ 31 43 24 1 24 42 30 3More than 50 percent ....................... 31 41 25 3 27 41 28 4
Percent of students in schooleligible for free or reduced-priceschool lunch
Less than 15 percent ........................ 29 44 26 2 20 41 32 615 to 32 percent................................ 28 45 25 1 18 46 32 433 to 59 percent................................ 26 44 27 3 24 39 33 560 percent or more ........................... 31 42 26 1 28 42 28 2
Main teaching assignment
General elementary2......................... 30 44 25 1 27 43 26 3Math/science..................................... 26 40 31 3 16 39 40 5Other targeted academic subject ..... 27 45 24 3 19 42 34 5
Teaching experience3 or fewer years................................ 33 42 23 2 24 48 25 34 to 9 years ....................................... 31 42 26 1 24 40 33 310 to 19 years ................................... 28 43 27 2 23 42 31 420 or more years............................... 26 46 26 2 21 41 34 5
Teacher race/ethnicityWhite, non-Hispanic ........................ 27 45 26 2 20 43 33 4Black, non-Hispanic......................... 36 34 28 2 41 33 24 1Other ................................................. 38 43 17 2 32 45 17 7
SexMale .................................................. 23 43 32 3 16 38 37 8Female............................................... 30 44 24 2 24 43 29 3

B-32
Table B-10.—Percent of full-time public school teachers who participated in professionaldevelopment activities in the last 12 months indicating the extent to which theybelieve the activity improved their classroom teaching, by selected school and teachercharacteristics: 1998 (continued)
State or district curriculum andperformance standards
Integration of educational technologyin the grade or subject you teach
Improved my teaching Improved my teachingSchool and teacher characteristic
Alot
Moder-ately
Some-what
Notat all
Alot
Moder-ately
Some-what
Notat all
All targeted public schoolteachers1 .................................. 12 36 39 13 21 38 34 6
School instructional levelElementary school............................ 14 40 38 8 23 40 33 4Middle school................................... 13 33 41 13 18 36 39 6High school....................................... 7 28 40 24 21 36 34 10Combined ......................................... 8 35 39 18 18 43 31 8
School enrollment sizeLess than 300.................................... 12 35 43 10 20 41 34 5300 to 499......................................... 12 35 42 11 21 41 33 5500 to 999......................................... 13 39 37 12 22 39 34 51,000 or more ................................... 10 32 39 20 22 34 34 9
LocaleCentral city ....................................... 14 37 36 12 24 36 34 7Urban fringe/large town................... 11 37 39 13 21 38 35 5Rural/small town .............................. 12 33 41 14 20 41 33 6
RegionNortheast........................................... 13 35 39 13 20 39 35 6Midwest ............................................ 12 34 38 16 21 37 35 6South ................................................. 11 38 41 11 22 39 33 6West .................................................. 13 37 36 14 21 38 34 7
Percent minority enrollment inschool
5 percent or less................................ 12 30 42 16 21 39 36 46 to 20 percent.................................. 11 37 39 14 19 40 33 721 to 50 percent................................ 12 37 39 12 23 37 34 5More than 50 percent ....................... 14 40 36 10 22 37 33 8
Percent of students in schooleligible for free or reduced-priceschool lunch
Less than 15 percent ........................ 11 32 40 17 23 37 33 715 to 32 percent................................ 10 38 39 14 18 42 34 633 to 59 percent................................ 12 36 40 12 22 35 37 660 percent or more ........................... 15 39 37 9 23 39 32 5
Main teaching assignment
General elementary2......................... 14 40 38 8 22 40 33 5Math/science..................................... 10 32 39 19 22 36 34 8Other targeted academic subject ..... 10 32 40 18 20 38 35 7
Teaching experience3 or fewer years................................ 12 39 39 10 19 38 37 64 to 9 years ....................................... 12 38 40 10 23 37 34 610 to 19 years ................................... 14 33 39 14 23 39 32 620 or more years............................... 11 35 39 16 21 39 34 6
Teacher race/ethnicityWhite, non-Hispanic ........................ 11 35 40 14 20 39 34 6Black, non-Hispanic......................... 22 44 30 3 33 34 30 2Other ................................................. 17 34 34 14 25 33 34 8
SexMale .................................................. 8 30 43 18 20 37 35 8Female............................................... 13 38 38 12 22 39 34 6
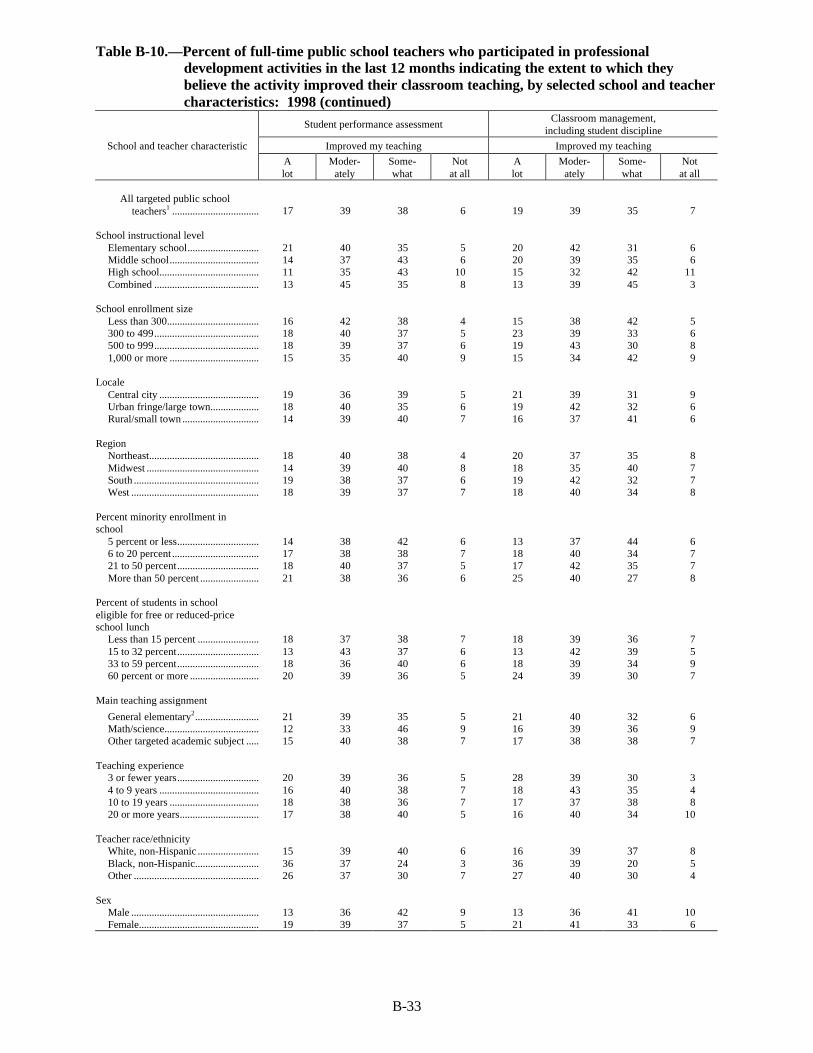
B-33
Table B-10.—Percent of full-time public school teachers who participated in professionaldevelopment activities in the last 12 months indicating the extent to which theybelieve the activity improved their classroom teaching, by selected school and teachercharacteristics: 1998 (continued)
Student performance assessmentClassroom management,
including student discipline
Improved my teaching Improved my teachingSchool and teacher characteristic
Alot
Moder-ately
Some-what
Notat all
Alot
Moder-ately
Some-what
Notat all
All targeted public schoolteachers1 .................................. 17 39 38 6 19 39 35 7
School instructional levelElementary school............................ 21 40 35 5 20 42 31 6Middle school................................... 14 37 43 6 20 39 35 6High school....................................... 11 35 43 10 15 32 42 11Combined ......................................... 13 45 35 8 13 39 45 3
School enrollment sizeLess than 300.................................... 16 42 38 4 15 38 42 5300 to 499......................................... 18 40 37 5 23 39 33 6500 to 999......................................... 18 39 37 6 19 43 30 81,000 or more ................................... 15 35 40 9 15 34 42 9
LocaleCentral city ....................................... 19 36 39 5 21 39 31 9Urban fringe/large town................... 18 40 35 6 19 42 32 6Rural/small town .............................. 14 39 40 7 16 37 41 6
RegionNortheast........................................... 18 40 38 4 20 37 35 8Midwest ............................................ 14 39 40 8 18 35 40 7South ................................................. 19 38 37 6 19 42 32 7West .................................................. 18 39 37 7 18 40 34 8
Percent minority enrollment inschool
5 percent or less................................ 14 38 42 6 13 37 44 66 to 20 percent.................................. 17 38 38 7 18 40 34 721 to 50 percent................................ 18 40 37 5 17 42 35 7More than 50 percent ....................... 21 38 36 6 25 40 27 8
Percent of students in schooleligible for free or reduced-priceschool lunch
Less than 15 percent ........................ 18 37 38 7 18 39 36 715 to 32 percent................................ 13 43 37 6 13 42 39 533 to 59 percent................................ 18 36 40 6 18 39 34 960 percent or more ........................... 20 39 36 5 24 39 30 7
Main teaching assignment
General elementary2......................... 21 39 35 5 21 40 32 6Math/science..................................... 12 33 46 9 16 39 36 9Other targeted academic subject ..... 15 40 38 7 17 38 38 7
Teaching experience3 or fewer years................................ 20 39 36 5 28 39 30 34 to 9 years ....................................... 16 40 38 7 18 43 35 410 to 19 years ................................... 18 38 36 7 17 37 38 820 or more years............................... 17 38 40 5 16 40 34 10
Teacher race/ethnicityWhite, non-Hispanic ........................ 15 39 40 6 16 39 37 8Black, non-Hispanic......................... 36 37 24 3 36 39 20 5Other ................................................. 26 37 30 7 27 40 30 4
SexMale .................................................. 13 36 42 9 13 36 41 10Female............................................... 19 39 37 5 21 41 33 6

B-34
Table B-10.—Percent of full-time public school teachers who participated in professionaldevelopment activities in the last 12 months indicating the extent to which theybelieve the activity improved their classroom teaching, by selected school and teachercharacteristics: 1998 (continued)
Addressing the needs of students withlimited English proficiency or from
diverse cultural backgroundsAddressing the needs of students with disabilities
Improved my teaching Improved my teachingSchool and teacher characteristic
Alot
Moder-ately
Some-what
Notat all
Alot
Moder-ately
Some-what
Notat all
All targeted public schoolteachers1 .................................. 18 34 40 9 14 36 44 6
School instructional levelElementary school............................ 20 33 38 8 15 37 43 5Middle school................................... 14 36 40 10 16 35 44 5High school....................................... 18 32 42 8 11 36 46 8Combined ......................................... 11 35 43 11 9 30 50 12
School enrollment sizeLess than 300.................................... 17 25 48 10 15 33 47 5300 to 499......................................... 21 31 39 8 16 32 47 5500 to 999......................................... 17 35 38 9 13 40 40 71,000 or more ................................... 16 34 41 8 14 31 47 7
LocaleCentral city ....................................... 17 33 39 11 13 36 44 6Urban fringe/large town................... 19 34 41 7 17 36 42 5Rural/small town .............................. 17 36 40 7 12 35 46 7
RegionNortheast........................................... 16 37 38 8 17 30 44 8Midwest ............................................ 17 28 45 10 14 35 46 6South ................................................. 17 36 38 9 15 38 42 6West .................................................. 20 32 40 8 11 38 46 6
Percent minority enrollment inschool
5 percent or less................................ 18 26 42 13 14 35 43 76 to 20 percent.................................. 15 34 44 8 16 35 44 521 to 50 percent................................ 15 36 42 7 13 39 44 4More than 50 percent ....................... 21 35 35 9 14 34 44 8
Percent of students in schooleligible for free or reduced-priceschool lunch
Less than 15 percent ........................ 17 31 44 8 18 35 40 615 to 32 percent................................ 14 33 44 9 14 34 47 633 to 59 percent................................ 12 34 43 11 13 37 45 560 percent or more ........................... 24 36 33 8 13 37 44 7
Main teaching assignment
General elementary2......................... 21 33 38 9 15 35 44 5Math/science..................................... 10 35 45 10 9 34 51 5Other targeted academic subject ..... 17 35 40 8 16 37 39 8
Teaching experience3 or fewer years................................ 18 36 38 8 18 34 42 64 to 9 years ....................................... 17 33 40 10 13 37 43 710 to 19 years ................................... 17 35 37 10 15 37 42 620 or more years............................... 18 31 43 7 13 35 47 6
Teacher race/ethnicityWhite, non-Hispanic ........................ 15 34 43 9 14 36 45 5Black, non-Hispanic......................... 28 29 33 10 26 28 36 10Other ................................................. 28 38 28 6 8 41 41 9
SexMale .................................................. 16 29 44 11 10 33 48 8Female............................................... 18 35 38 8 15 37 43 5
1Targeted public school teachers were full-time public school teachers in grades 1 through 12 whose main teaching assignment was inEnglish/language arts, social studies/social sciences, foreign language, mathematics, or science, or who taught a self-contained classroom.2The category labeled general elementary includes all teachers of self-contained classrooms in the 1998 FRSS study, regardless of instructionallevel. Almost all (95 percent) of the self-contained classrooms were at the elementary school level.
NOTE: Percents are computed across each row for each type of professional development program, but may not sum to 100 because of rounding.
SOURCE: U.S. Department of Education, National Center for Education Statistics, Fast Response Survey System, Teacher Survey onProfessional Development and Training, 1998.

B-35
Table B-10a.—Standard errors of the percent of full-time public school teachers who participatedin professional development activities in the last 12 months indicating the extent towhich they believe the activity improved their classroom teaching, by selectedschool and teacher characteristics: 1998
In-depth study in the subject area ofyour main teaching assignment
New methods of teaching(e.g., cooperative learning)
Improved my teaching Improved my teachingSchool and teacher characteristic
Alot
Moder-ately
Some-what
Notat all
Alot
Moder-ately
Some-what
Notat all
All targeted public schoolteachers1 .................................. 1.2 1.0 1.0 0.3 0.8 1.1 1.0 0.4
School instructional levelElementary school............................ 1.6 1.8 1.4 0.4 1.5 1.7 1.7 0.6Middle school................................... 2.2 2.2 1.9 0.6 1.6 1.8 2.2 0.8High school....................................... 1.5 1.8 1.2 0.5 1.3 1.8 1.8 0.8Combined ......................................... 3.8 3.8 3.9 1.5 2.9 4.9 4.1 2.0
School enrollment sizeLess than 300.................................... 3.8 3.3 2.8 1.4 3.4 3.7 3.8 1.1300 to 499......................................... 2.9 2.7 2.3 0.3 2.5 2.7 3.0 0.9500 to 999......................................... 1.7 1.9 1.6 0.4 1.4 1.6 1.5 0.61,000 or more ................................... 2.3 2.2 1.7 0.6 1.6 2.0 1.9 1.0
LocaleCentral city ....................................... 1.7 1.7 1.6 0.6 1.8 1.7 1.4 0.7Urban fringe/large town................... 2.0 2.2 1.6 0.3 1.5 1.9 1.5 0.6Rural/small town .............................. 1.7 1.9 1.8 0.6 1.4 2.1 1.7 0.8
RegionNortheast........................................... 2.8 2.3 2.5 0.7 2.0 2.1 2.2 0.7Midwest ............................................ 2.2 2.2 1.8 0.7 1.8 2.2 2.1 1.0South ................................................. 1.8 1.5 1.7 0.5 1.4 1.9 1.6 0.7West .................................................. 2.3 2.5 1.5 0.4 2.2 2.6 2.0 0.9
Percent minority enrollment inschool
5 percent or less................................ 1.9 2.2 1.9 0.8 1.8 2.3 2.1 0.86 to 20 percent.................................. 2.5 2.1 2.0 0.4 1.6 1.7 1.7 1.021 to 50 percent................................ 2.3 2.4 2.1 0.4 2.2 2.1 2.0 0.8More than 50 percent ....................... 2.0 1.6 1.9 0.6 2.1 2.4 1.9 0.8
Percent of students in schooleligible for free or reduced-priceschool lunch
Less than 15 percent ........................ 2.3 2.5 2.0 0.6 1.6 2.1 1.8 1.015 to 32 percent................................ 2.1 2.1 1.8 0.3 1.6 2.2 1.9 0.733 to 59 percent................................ 1.8 2.0 1.9 0.8 2.0 1.7 1.8 0.960 percent or more ........................... 2.1 2.1 2.0 0.4 1.9 2.3 2.0 0.5
Main teaching assignment
General elementary2......................... 1.6 1.9 1.5 0.4 1.4 1.7 1.7 0.6Math/science..................................... 2.2 2.1 2.0 0.6 2.1 2.1 2.1 1.1Other targeted academic subject ..... 1.4 1.4 1.3 0.6 1.2 1.8 1.7 0.8
Teaching experience3 or fewer years................................ 1.9 2.3 2.0 0.5 1.7 2.2 1.8 0.74 to 9 years ....................................... 2.5 2.5 2.0 0.4 1.7 2.3 2.1 0.810 to 19 years ................................... 2.1 2.3 2.3 0.6 2.1 2.3 2.2 0.720 or more years............................... 2.0 1.9 1.5 0.6 1.5 1.5 1.8 0.7
Teacher race/ethnicityWhite, non-Hispanic ........................ 1.3 1.2 1.0 0.3 0.9 1.2 1.1 0.5Black, non-Hispanic......................... 4.1 3.3 3.9 0.8 4.7 3.6 3.4 0.7Other ................................................. 4.5 4.2 3.6 1.3 4.4 4.3 2.9 1.9
SexMale .................................................. 1.7 2.2 1.9 0.7 1.4 1.8 1.9 1.1Female............................................... 1.4 1.4 1.3 0.4 1.0 1.1 1.1 0.4

B-36
Table B-10a.—Standard errors of the percent of full-time public school teachers who participatedin professional development activities in the last 12 months indicating the extent towhich they believe the activity improved their classroom teaching, by selectedschool and teacher characteristics: 1998 (continued)
State or district curriculum andperformance standards
Integration of educational technologyin the grade or subject you teach
Improved my teaching Improved my teachingSchool and teacher characteristic
Alot
Moder-ately
Some-what
Notat all
Alot
Moder-ately
Some-what
Notat all
All targeted public schoolteachers1 .................................. 0.6 1.1 1.1 0.7 1.0 1.0 1.0 0.5
School instructional levelElementary school............................ 0.9 1.9 1.7 1.1 1.6 1.7 1.6 0.8Middle school................................... 1.2 2.0 1.9 1.4 1.8 1.8 1.9 0.9High school....................................... 0.9 1.6 1.7 1.4 1.4 2.0 1.9 1.0Combined ......................................... 2.3 4.0 4.1 2.6 3.5 3.5 3.3 1.9
School enrollment sizeLess than 300.................................... 2.1 3.7 3.5 1.8 3.1 3.4 2.8 1.3300 to 499......................................... 1.7 2.3 2.2 1.2 2.1 2.3 2.1 0.9500 to 999......................................... 1.2 1.7 1.6 1.1 1.5 1.4 1.4 0.71,000 or more ................................... 1.5 1.7 1.9 1.4 1.6 1.9 2.1 1.3
LocaleCentral city ....................................... 1.3 2.0 1.8 1.2 1.8 1.6 2.0 1.1Urban fringe/large town................... 0.9 1.7 1.7 1.3 1.5 1.5 1.3 0.7Rural/small town .............................. 1.1 1.8 1.9 1.3 1.7 2.1 1.8 0.9
RegionNortheast........................................... 1.8 2.3 2.0 1.6 2.0 2.6 2.4 1.2Midwest ............................................ 1.4 1.9 2.3 1.4 1.7 1.7 1.5 1.1South ................................................. 0.9 1.8 1.7 1.1 1.5 1.5 1.7 0.8West .................................................. 1.6 2.4 2.2 1.8 2.1 2.3 2.4 1.2
Percent minority enrollment inschool
5 percent or less................................ 1.5 2.0 2.2 1.5 1.9 2.0 2.0 0.76 to 20 percent.................................. 1.3 1.8 1.7 1.5 1.9 2.3 2.2 1.321 to 50 percent................................ 1.4 2.2 2.1 1.4 2.2 2.1 1.8 1.1More than 50 percent ....................... 1.4 2.4 1.8 1.3 2.2 1.9 2.1 1.3
Percent of students in schooleligible for free or reduced-priceschool lunch
Less than 15 percent ........................ 1.3 2.0 2.2 1.5 1.6 2.0 1.8 0.815 to 32 percent................................ 1.3 2.0 2.4 1.1 1.7 2.0 2.0 1.133 to 59 percent................................ 1.5 1.7 1.7 1.3 2.0 2.0 2.3 1.060 percent or more ........................... 1.6 2.7 2.2 1.3 1.9 1.8 2.0 1.1
Main teaching assignment
General elementary2......................... 1.0 1.9 1.8 1.2 1.6 1.7 1.7 0.8Math/science..................................... 1.5 2.0 1.9 1.3 1.5 1.7 1.8 1.2Other targeted academic subject ..... 0.9 1.6 1.5 1.3 1.4 1.7 1.6 0.9
Teaching experience3 or fewer years................................ 1.3 2.0 2.3 1.2 1.8 2.0 2.1 1.04 to 9 years ....................................... 1.6 2.7 2.1 1.3 1.9 2.3 2.2 1.210 to 19 years ................................... 1.5 1.7 2.4 1.5 1.6 2.4 2.1 1.020 or more years............................... 1.2 1.8 1.8 1.2 1.8 1.7 2.0 0.8
Teacher race/ethnicityWhite, non-Hispanic ........................ 0.7 1.2 1.1 0.8 1.0 1.1 1.1 0.6Black, non-Hispanic......................... 2.9 4.3 4.4 1.0 4.2 4.2 3.5 1.1Other ................................................. 3.7 3.5 3.9 2.9 3.6 3.6 4.2 2.2
SexMale .................................................. 1.1 2.1 2.1 1.6 1.8 1.6 1.4 1.0Female............................................... 0.7 1.2 1.3 0.9 1.1 1.3 1.2 0.6

B-37
Table B-10a.—Standard errors of the percent of full-time public school teachers who participatedin professional development activities in the last 12 months indicating the extent towhich they believe the activity improved their classroom teaching, by selectedschool and teacher characteristics: 1998 (continued)
Student performance assessmentClassroom management,
including student discipline
Improved my teaching Improved my teachingSchool and teacher characteristic
Alot
Moder-ately
Some-what
Notat all
Alot
Moder-ately
Some-what
Notat all
All targeted public schoolteachers1 .................................. 0.9 1.2 1.0 0.6 1.1 1.2 1.3 0.8
School instructional levelElementary school............................ 1.5 1.9 1.9 0.9 1.6 1.5 1.8 1.1Middle school................................... 1.5 2.5 2.2 1.0 1.9 2.1 2.0 1.3High school....................................... 1.3 2.2 1.8 1.2 1.5 2.2 2.3 1.4Combined ......................................... 2.9 5.4 4.7 2.4 3.2 5.0 5.5 1.6
School enrollment sizeLess than 300.................................... 3.1 4.2 4.5 1.5 3.7 4.5 4.2 2.0300 to 499......................................... 2.2 2.5 2.4 1.1 3.0 2.6 2.6 1.4500 to 999......................................... 1.1 2.0 1.8 0.9 1.7 1.7 2.0 1.21,000 or more ................................... 1.5 2.2 2.2 1.1 1.9 2.4 2.7 1.5
LocaleCentral city ....................................... 1.6 2.0 2.3 0.8 2.1 2.6 2.2 1.1Urban fringe/large town................... 1.5 2.1 1.4 0.8 1.9 2.1 2.0 1.2Rural/small town .............................. 1.5 2.4 2.2 1.2 1.8 1.9 2.6 1.2
RegionNortheast........................................... 2.5 3.1 3.0 1.0 2.6 2.4 2.6 1.9Midwest ............................................ 1.8 2.4 2.4 1.4 2.4 2.6 2.9 1.7South ................................................. 1.4 1.8 1.9 0.8 1.9 1.9 2.3 1.0West .................................................. 2.0 2.8 2.6 1.2 2.5 3.1 3.1 1.8
Percent minority enrollment inschool
5 percent or less................................ 1.7 2.5 2.4 1.4 2.0 2.8 3.1 1.86 to 20 percent.................................. 1.7 2.1 2.0 1.2 2.1 2.3 2.6 1.721 to 50 percent................................ 1.7 2.2 2.3 0.9 2.0 2.6 2.5 1.6More than 50 percent ....................... 2.0 2.5 2.3 0.9 2.2 2.7 2.3 1.4
Percent of students in schooleligible for free or reduced-priceschool lunch
Less than 15 percent ........................ 2.2 2.7 2.3 1.2 2.2 2.7 2.8 2.115 to 32 percent................................ 1.7 2.1 2.4 1.0 2.0 2.6 2.8 1.433 to 59 percent................................ 1.8 2.2 2.3 1.3 1.6 2.4 2.4 1.560 percent or more ........................... 1.8 2.6 2.5 0.8 2.2 2.5 2.5 1.3
Main teaching assignment
General elementary2......................... 1.5 1.8 1.8 0.9 1.6 1.6 1.9 1.1Math/science..................................... 1.8 1.7 2.1 1.3 1.9 2.8 2.5 1.5Other targeted academic subject ..... 1.1 2.0 1.7 0.8 1.5 2.2 1.9 1.1
Teaching experience3 or fewer years................................ 2.0 2.3 2.4 0.9 2.3 2.3 2.0 0.84 to 9 years ....................................... 1.9 2.5 2.4 1.2 2.3 2.8 3.1 1.110 to 19 years ................................... 1.9 2.4 2.3 1.3 2.4 2.9 3.6 1.620 or more years............................... 1.6 1.7 1.8 0.8 2.2 2.3 2.4 1.7
Teacher race/ethnicityWhite, non-Hispanic ........................ 1.0 1.3 1.2 0.7 1.1 1.2 1.4 0.9Black, non-Hispanic......................... 4.2 4.6 3.9 1.3 5.2 5.2 3.5 1.8Other ................................................. 4.2 4.8 4.5 2.1 4.8 4.9 4.9 2.2
SexMale .................................................. 1.7 2.2 2.1 1.1 1.9 2.6 2.6 1.4Female............................................... 1.0 1.4 1.4 0.7 1.3 1.2 1.5 0.8

B-38
Table B-10a.—Standard errors of the percent of full-time public school teachers who participatedin professional development activities in the last 12 months indicating the extent towhich they believe the activity improved their classroom teaching, by selectedschool and teacher characteristics: 1998 (continued)
Addressing the needs of students withlimited English proficiency or from
diverse cultural backgroundsAddressing the needs of students with disabilities
Improved my teaching Improved my teachingSchool and teacher characteristic
Alot
Moder-ately
Some-what
Notat all
Alot
Moder-ately
Some-what
Notat all
All targeted public schoolteachers1 .................................. 1.4 1.6 1.6 0.9 0.9 1.6 1.6 0.6
School instructional levelElementary school............................ 2.4 2.6 2.6 1.4 1.5 2.5 2.3 1.0Middle school................................... 1.9 2.9 3.5 1.9 1.7 2.2 2.4 1.1High school....................................... 1.9 2.4 2.5 1.4 1.4 2.3 2.5 1.4Combined ......................................... 4.3 6.4 6.8 3.9 3.4 4.6 4.4 3.5
School enrollment sizeLess than 300.................................... 6.4 5.7 5.9 3.8 2.9 3.9 4.2 1.6300 to 499......................................... 3.3 3.8 3.8 2.1 2.7 3.4 3.2 1.2500 to 999......................................... 1.9 2.4 2.4 1.4 1.4 2.1 1.9 1.11,000 or more ................................... 2.1 2.3 2.1 1.3 1.9 2.3 2.5 1.6
LocaleCentral city ....................................... 2.1 2.6 2.9 1.7 1.7 2.4 2.6 1.3Urban fringe/large town................... 2.3 2.6 2.8 1.1 1.4 2.4 2.3 1.1Rural/small town .............................. 2.6 3.4 3.5 1.9 1.6 2.5 2.2 1.3
RegionNortheast........................................... 3.1 4.5 4.1 2.7 3.0 2.8 3.7 1.8Midwest ............................................ 2.6 4.1 4.1 2.1 2.0 2.8 2.5 1.1South ................................................. 2.3 2.2 2.6 1.5 1.2 2.0 2.1 1.0West .................................................. 3.0 3.0 2.9 1.4 2.1 3.2 3.3 1.7
Percent minority enrollment inschool
5 percent or less................................ 3.9 3.7 4.7 3.7 2.0 2.3 2.4 1.26 to 20 percent.................................. 3.0 4.2 3.9 1.7 2.2 3.4 3.4 1.121 to 50 percent................................ 2.8 3.2 3.5 1.5 1.6 2.4 2.3 1.1More than 50 percent ....................... 2.4 3.0 2.5 1.7 1.9 2.4 2.9 1.5
Percent of students in schooleligible for free or reduced-priceschool lunch
Less than 15 percent ........................ 2.6 3.4 3.9 1.8 2.1 3.3 3.2 1.315 to 32 percent................................ 2.7 3.1 3.6 2.1 1.6 2.3 2.8 1.333 to 59 percent................................ 2.2 3.5 3.4 1.8 2.1 2.8 3.3 1.160 percent or more ........................... 2.8 2.8 2.6 1.7 1.9 3.0 3.2 1.4
Main teaching assignment
General elementary2......................... 2.4 2.6 2.6 1.3 1.5 2.6 2.3 1.0Math/science..................................... 1.9 3.4 3.3 1.5 1.9 2.3 3.1 1.1Other targeted academic subject ..... 1.8 2.1 2.4 1.4 1.5 2.5 2.5 1.2
Teaching experience3 or fewer years................................ 2.3 3.6 3.4 1.7 2.2 3.1 3.2 1.64 to 9 years ....................................... 3.1 3.2 3.8 2.0 1.8 2.5 3.0 1.610 to 19 years ................................... 2.5 3.6 3.1 1.9 2.3 2.6 2.7 1.520 or more years............................... 2.5 2.9 3.2 1.6 1.8 2.4 2.6 1.0
Teacher race/ethnicityWhite, non-Hispanic ........................ 1.6 1.9 1.9 0.9 1.1 1.8 1.8 0.6Black, non-Hispanic......................... 5.2 5.0 4.9 3.5 5.0 3.6 5.5 3.4Other ................................................. 5.4 5.0 5.3 2.4 2.5 5.1 4.5 3.1
SexMale .................................................. 2.5 2.6 2.5 1.9 1.3 2.5 2.7 1.5Female............................................... 1.6 1.9 2.1 1.0 1.1 2.0 1.7 0.7
1Targeted public school teachers were full-time public school teachers in grades 1 through 12 whose main teaching assignment was inEnglish/language arts, social studies/social sciences, foreign language, mathematics, or science, or who taught a self-contained classroom.2The category labeled general elementary includes all teachers of self-contained classrooms in the 1998 FRSS study, regardless of instructionallevel. Almost all (95 percent) of the self-contained classrooms were at the elementary school level.
SOURCE: U.S. Department of Education, National Center for Education Statistics, Fast Response Survey System, Teacher Survey onProfessional Development and Training, 1998.

B-39
Table B-11.—Percent of full-time public school teachers who participated with various frequency in the last 12months in various activities related to teaching, by selected school and teacher characteristics: 1998
Common planning period for team teachers Regularly scheduled collaboration with other teachers,excluding meetings held for administrative purposes
Frequency of activity Frequency of activitySchool and teachercharacteristic
NeverA fewtimes a
year
Once amonth
2 to 3times amonth
At leastonce aweek
NeverA fewtimes a
year
Once amonth
2 to 3times amonth
At leastonce aweek
All targeted public schoolteachers1 ........................... 38 9 7 9 38 19 19 17 18 27
School instructional levelElementary school..................... 27 11 9 12 40 15 18 18 20 29Middle school............................ 21 4 3 8 64 13 15 18 18 36High school ............................... 69 8 4 5 15 29 23 16 13 19Combined .................................. 65 10 4 4 16 30 27 14 11 18
School enrollment sizeLess than 300 ............................ 44 6 6 10 34 28 20 13 15 24300 to 499.................................. 32 10 7 9 41 16 21 18 16 29500 to 999.................................. 31 10 7 10 42 16 17 17 20 291,000 or more ............................ 54 7 6 6 27 24 19 19 15 24
LocaleCentral city ................................ 34 9 8 9 40 16 17 18 21 28Urban fringe/large town ........... 35 10 6 9 39 19 18 18 17 28Rural/small town....................... 44 8 5 8 34 22 22 15 15 26
RegionNortheast ................................... 39 8 4 11 39 21 18 15 16 31Midwest ..................................... 42 9 5 8 35 20 23 17 16 23South.......................................... 35 9 6 8 42 18 17 17 18 30West ........................................... 35 10 12 12 31 18 19 21 19 24
Percent minority enrollment inschool
5 percent or less......................... 45 8 4 9 34 21 24 15 15 266 to 20 percent........................... 35 9 7 9 40 18 20 18 19 2621 to 50 percent......................... 37 9 7 9 38 19 17 16 18 30More than 50 percent ................ 33 10 8 10 38 17 15 20 19 28
Percent of students in schooleligible for free or reduced-price school lunch
Less than 15 percent ................. 42 7 6 8 37 19 21 18 16 2615 to 32 percent......................... 39 10 7 9 36 21 21 16 17 2633 to 59 percent......................... 40 8 6 9 37 17 20 16 19 2760 percent or more .................... 29 11 8 10 41 19 14 19 18 30
Main teaching assignment
General elementary2.................. 28 11 10 12 39 15 18 17 20 30Math/science ............................. 48 6 3 6 37 23 19 18 15 24Other targeted academic
subject ................................... 47 8 4 5 36 22 21 17 15 26
Teaching experience3 or fewer years......................... 39 7 7 9 38 19 14 16 19 324 to 9 years ................................ 35 8 8 8 40 18 18 18 18 2810 to 19 years ............................ 36 10 6 8 39 18 22 18 15 2820 or more years........................ 40 10 6 10 35 20 20 17 18 25
Teacher race/ethnicityWhite, non-Hispanic................. 39 9 6 9 37 19 20 17 17 27Black, non-Hispanic ................. 35 9 7 9 41 14 11 18 23 34Other .......................................... 26 12 10 12 40 17 20 17 22 24
SexMale ........................................... 49 9 5 7 30 22 20 18 15 25Female ....................................... 34 9 7 10 40 18 18 17 18 28

B-40
Table B-11.—Percent of full-time public school teachers who participated with various frequency in the last 12months in various activities related to teaching, by selected school and teacher characteristics: 1998(continued)
Being mentored by another teacher in a formal relationship Mentoring another teacher in a formal relationship
Frequency of activity Frequency of activitySchool and teachercharacteristic
NeverA fewtimes a
year
Once amonth
2 to 3times amonth
At leastonce aweek
NeverA fewtimes a
year
Once amonth
2 to 3times amonth
At leastonce aweek
All targeted public schoolteachers1 ........................... 81 9 3 3 5 74 7 3 4 11
School instructional levelElementary school..................... 81 9 2 4 4 74 8 3 4 11Middle school............................ 80 8 4 3 5 73 7 3 5 12High school ............................... 82 9 2 3 4 76 7 4 4 10Combined .................................. 80 10 3 3 5 75 8 4 7 7
School enrollment sizeLess than 300 ............................ 84 9 2 2 4 78 8 1 3 10300 to 499.................................. 82 8 2 2 5 78 5 3 4 11500 to 999.................................. 80 9 3 4 4 72 9 3 5 111,000 or more ............................ 80 9 3 3 4 74 7 4 5 10
LocaleCentral city ................................ 78 9 3 4 5 71 8 4 5 13Urban fringe/large town ........... 82 8 2 3 5 74 8 3 4 11Rural/small town....................... 82 9 2 2 4 78 7 3 4 8
RegionNortheast ................................... 86 7 2 2 4 76 5 2 4 12Midwest ..................................... 87 5 2 2 3 78 6 2 3 10South.......................................... 77 10 3 4 6 71 9 4 5 11West ........................................... 76 12 3 5 4 74 8 4 4 10
Percent minority enrollment inschool
5 percent or less......................... 85 8 2 2 4 79 6 3 4 86 to 20 percent........................... 85 6 2 2 4 77 6 3 4 1121 to 50 percent......................... 80 10 2 3 5 71 8 3 5 12More than 50 percent ................ 73 12 4 6 6 69 10 4 5 12
Percent of students in schooleligible for free or reduced-price school lunch
Less than 15 percent ................. 84 7 2 3 4 75 7 3 4 1215 to 32 percent......................... 84 8 2 2 4 76 7 3 5 1033 to 59 percent......................... 82 8 2 4 4 74 8 4 3 1160 percent or more .................... 74 11 4 4 6 72 9 3 5 11
Main teaching assignment
General elementary2.................. 81 9 3 3 4 74 8 3 4 11Math/science ............................. 81 9 3 3 4 76 7 4 4 9Other targeted academic
subject ................................... 81 8 3 3 5 74 8 3 5 11
Teaching experience3 or fewer years......................... 42 18 8 14 18 88 5 2 2 24 to 9 years ................................ 79 11 3 4 4 75 7 3 5 1010 to 19 years ............................ 88 7 1 1 2 68 9 4 5 1420 or more years........................ 91 5 1 1 2 73 8 3 4 12
Teacher race/ethnicityWhite, non-Hispanic................. 83 8 2 3 4 75 7 3 4 10Black, non-Hispanic ................. 64 11 4 7 14 61 9 8 6 16Other .......................................... 72 12 3 5 8 75 7 4 3 10
SexMale ........................................... 79 10 3 4 5 79 7 3 4 7Female ....................................... 81 8 3 3 4 73 8 3 5 12

B-41
Table B-11.—Percent of full-time public school teachers who participated with various frequency in the last 12months in various activities related to teaching, by selected school and teacher characteristics: 1998(continued)
Networking with teachers outside your schoolIndividual or collaborative research on a
topic of interest to you professionallyFrequency of activity Frequency of activitySchool and teacher
characteristic
NeverA fewtimes a
year
Once amonth
2 to 3times amonth
At leastonce aweek
NeverA fewtimes a
year
Once amonth
2 to 3times amonth
At leastonce aweek
All targeted public schoolteachers1 ........................... 39 37 11 7 6 47 25 8 9 10
School instructional levelElementary school..................... 38 37 11 7 7 47 26 8 9 10Middle school............................ 37 37 11 9 6 43 28 7 10 11High school ............................... 41 35 11 7 6 50 23 8 9 11Combined .................................. 39 39 10 5 7 46 20 11 9 14
School enrollment sizeLess than 300 ............................ 44 37 7 7 5 50 23 8 10 9300 to 499.................................. 39 39 10 5 7 46 26 9 9 10500 to 999.................................. 38 36 12 8 6 46 26 8 9 101,000 or more ............................ 37 35 12 9 7 47 24 8 10 11
LocaleCentral city ................................ 34 37 12 8 9 46 25 9 10 11Urban fringe/large town ........... 36 38 12 8 5 46 26 9 9 10Rural/small town....................... 46 35 8 5 5 49 24 8 9 9
RegionNortheast ................................... 39 38 9 8 7 42 27 7 13 12Midwest ..................................... 41 35 10 8 6 49 25 7 8 10South.......................................... 42 36 11 6 5 49 25 8 8 9West ........................................... 30 39 14 8 9 43 24 11 11 12
Percent minority enrollment inschool
5 percent or less......................... 45 37 8 5 5 49 25 7 9 106 to 20 percent........................... 36 40 12 7 5 46 26 9 8 1121 to 50 percent......................... 39 35 11 9 7 47 24 8 10 10More than 50 percent ................ 35 35 12 9 9 46 26 9 10 10
Percent of students in schooleligible for free or reduced-price school lunch
Less than 15 percent .................15 to 32 percent......................... 35 39 12 8 6 44 27 8 9 1233 to 59 percent......................... 41 36 11 6 6 48 24 9 10 1060 percent or more .................... 41 36 9 7 7 50 24 7 10 10
39 36 11 8 7 46 26 10 9 9Main teaching assignment
General elementary2.................. 38 36 11 8 7 46 26 9 9 9Math/science ............................. 39 37 12 7 6 54 22 6 8 11Other targeted academic
subject ................................... 40 37 10 7 6 43 26 9 11 11
Teaching experience3 or fewer years......................... 34 32 14 9 10 45 23 12 9 124 to 9 years ................................ 32 38 16 8 6 40 30 8 10 1110 to 19 years ............................ 37 40 10 8 6 48 23 8 10 1120 or more years........................ 46 35 8 6 6 51 25 7 9 8
Teacher race/ethnicityWhite, non-Hispanic................. 39 37 11 7 6 47 25 8 10 10Black, non-Hispanic ................. 33 34 13 12 8 43 28 14 7 9Other .......................................... 39 32 13 9 8 43 24 10 9 14
SexMale ........................................... 44 31 10 7 8 50 20 8 9 13Female ....................................... 37 39 11 7 6 46 27 8 10 9
1Targeted public school teachers were full-time public school teachers in grades 1 through 12 whose main teaching assignment was in English/language arts, socialstudies/social sciences, foreign language, mathematics, or science, or who taught a self-contained classroom.2The category labeled general elementary includes all teachers of self-contained classrooms in the 1998 FRSS study, regardless of instructional level.Almost all (95 percent) of the self-contained classrooms were at the elementary school level.
NOTE: Percents are computed across each row for each type of professional development program, but may not sum to 100 because of rounding.
SOURCE: U.S. Department of Education, National Center for Education Statistics, Fast Response Survey System, Teacher Survey on Professional Development andTraining, 1998.

B-42
Table B-11a.—Standard errors of the percent of full-time public school teachers who participated with variousfrequency in the last 12 months in various activities related to teaching, by selected school andteacher characteristics: 1998
Common planning period for team teachers Regularly scheduled collaboration with other teachers,excluding meetings held for administrative purposes
Frequency of activity Frequency of activitySchool and teachercharacteristic
NeverA fewtimes a
year
Once amonth
2 to 3times amonth
At leastonce aweek
NeverA fewtimes a
year
Once amonth
2 to 3times amonth
At leastonce aweek
All targeted public schoolteachers1 ........................... 0.9 0.6 0.5 0.6 0.9 0.9 0.9 0.8 0.7 0.9
School instructional levelElementary school..................... 1.3 1.2 0.9 1.0 1.6 1.2 1.4 1.4 1.0 1.4Middle school............................ 1.6 0.8 0.7 1.0 1.7 1.2 1.5 1.2 1.2 1.9High school ............................... 1.6 0.8 0.5 0.7 1.2 1.4 1.2 1.2 1.1 1.3Combined .................................. 4.3 2.3 1.7 1.3 3.3 3.5 3.3 2.0 2.6 4.0
School enrollment sizeLess than 300 ............................ 3.1 1.3 1.5 2.3 3.1 2.7 3.1 2.0 2.4 2.8300 to 499.................................. 1.9 1.6 1.2 1.4 2.5 1.6 2.1 1.5 1.6 1.9500 to 999.................................. 1.5 1.1 0.8 1.0 1.6 1.1 1.1 1.3 1.3 1.31,000 or more ............................ 1.5 1.0 1.0 0.8 1.4 1.6 1.4 1.3 1.4 1.5
LocaleCentral city ................................ 1.3 1.1 1.1 1.0 1.7 1.1 1.2 1.4 1.4 1.4Urban fringe/large town ........... 1.7 1.2 0.9 1.1 1.7 1.4 1.4 1.3 1.2 1.4Rural/small town....................... 1.9 0.9 0.8 1.2 1.5 1.5 1.5 1.5 1.2 1.5
RegionNortheast ................................... 2.3 1.2 1.1 1.7 2.6 1.9 1.7 1.9 2.0 2.2Midwest ..................................... 1.7 1.1 0.9 1.0 2.0 1.6 1.9 1.6 1.4 1.8South.......................................... 1.6 0.9 0.9 0.9 1.6 1.3 1.1 1.4 1.2 1.7West ........................................... 2.5 2.0 1.4 1.5 2.3 1.4 1.6 1.7 1.9 1.7
Percent minority enrollment inschool
5 percent or less......................... 2.2 0.9 0.7 1.2 1.8 1.7 1.8 1.4 1.4 1.56 to 20 percent........................... 2.2 1.5 1.2 1.3 2.3 1.7 1.7 1.4 1.8 1.821 to 50 percent......................... 1.6 1.1 1.1 1.1 2.2 1.6 1.6 1.7 1.6 1.6More than 50 percent ................ 2.2 1.4 1.2 1.4 2.2 1.2 1.4 1.9 1.5 1.6
Percent of students in schooleligible for free or reduced-price school lunch
Less than 15 percent ................. 1.9 1.0 1.2 1.1 2.1 1.5 1.6 1.5 1.5 1.715 to 32 percent......................... 2.2 1.7 1.2 1.3 2.0 1.5 1.8 1.3 1.3 1.633 to 59 percent......................... 1.8 1.2 1.2 1.2 1.7 1.4 1.8 1.8 1.5 1.660 percent or more .................... 1.6 1.3 1.2 1.3 2.1 1.5 1.4 1.6 1.2 1.8
Main teaching assignment
General elementary2.................. 1.3 1.2 1.0 1.1 1.6 1.3 1.4 1.4 1.1 1.5Math/science ............................. 1.4 0.9 0.7 0.9 1.4 1.6 1.6 1.3 1.5 1.4Other targeted academic
subject ................................... 1.4 0.8 0.5 0.7 1.2 1.2 1.2 1.1 1.1 1.3
Teaching experience3 or fewer years......................... 2.0 1.2 1.2 1.2 2.0 1.8 1.4 1.0 1.5 1.74 to 9 years ................................ 2.1 1.3 1.4 1.2 2.5 1.5 1.7 1.7 1.4 1.310 to 19 years ............................ 1.6 1.4 1.1 1.2 2.3 1.6 1.6 1.7 1.5 1.920 or more years........................ 1.7 1.2 0.8 1.0 1.5 1.3 1.3 1.1 1.2 1.5
Teacher race/ethnicityWhite, non-Hispanic................. 0.9 0.7 0.6 0.7 1.0 1.0 1.0 0.9 0.7 1.0Black, non-Hispanic ................. 3.8 2.4 2.0 2.4 4.4 2.6 2.2 3.1 2.9 3.8Other .......................................... 2.8 2.6 2.4 2.9 3.8 2.5 3.7 2.9 3.5 3.1
SexMale ........................................... 1.7 1.0 0.7 1.0 1.7 1.5 1.3 1.3 1.2 1.5Female ....................................... 1.0 0.9 0.7 0.8 1.1 0.9 1.1 1.1 0.9 1.1

B-43
Table B-11a.—Standard errors of the percent of full-time public school teachers who participated with variousfrequency in the last 12 months in various activities related to teaching, by selected school andteacher characteristics: 1998 (continued)
Being mentored by another teacher in a formal relationship Mentoring another teacher in a formal relationship
Frequency of activity Frequency of activitySchool and teachercharacteristic
NeverA fewtimes a
year
Once amonth
2 to 3times amonth
At leastonce aweek
NeverA fewtimes a
year
Once amonth
2 to 3times amonth
At leastonce aweek
All targeted public schoolteachers1 ........................... 0.6 0.5 0.2 0.3 0.4 0.8 0.5 0.3 0.5 0.6
School instructional levelElementary school..................... 1.1 0.8 0.4 0.5 0.6 1.3 0.9 0.5 0.7 1.0Middle school............................ 1.6 0.9 0.7 0.5 0.8 1.6 0.9 0.6 0.8 1.1High school ............................... 1.1 0.8 0.3 0.5 0.6 1.2 0.8 0.5 0.5 0.8Combined .................................. 3.0 2.2 1.3 1.0 1.6 3.6 1.9 1.6 2.0 1.9
School enrollment sizeLess than 300 ............................ 1.9 1.6 0.7 0.7 1.4 2.8 2.3 0.4 1.1 1.7300 to 499.................................. 1.5 1.0 0.4 0.6 0.9 1.9 1.1 0.7 0.8 1.4500 to 999.................................. 1.1 0.8 0.4 0.5 0.5 1.4 0.9 0.6 0.7 1.01,000 or more ............................ 1.1 1.0 0.5 0.5 0.6 1.5 0.9 0.7 0.7 1.1
LocaleCentral city ................................ 1.4 1.0 0.5 0.6 0.7 1.6 0.9 0.7 0.7 1.2Urban fringe/large town ........... 1.1 1.1 0.3 0.5 0.6 1.4 1.0 0.6 0.8 1.1Rural/small town....................... 1.1 0.9 0.5 0.4 0.7 1.6 1.0 0.5 0.7 1.2
RegionNortheast ................................... 1.3 1.0 0.5 0.5 0.6 2.2 1.0 0.7 1.0 1.4Midwest ..................................... 1.0 0.9 0.4 0.5 0.5 1.6 0.9 0.6 0.6 1.3South.......................................... 1.3 1.0 0.4 0.7 0.8 1.4 1.1 0.5 0.7 1.0West ........................................... 1.8 1.4 0.6 0.8 0.9 1.8 1.1 0.8 1.0 1.5
Percent minority enrollment inschool
5 percent or less......................... 1.3 1.1 0.4 0.4 0.7 1.4 0.8 0.6 0.7 1.16 to 20 percent........................... 1.2 0.9 0.5 0.5 0.6 1.6 0.9 0.6 0.8 1.221 to 50 percent......................... 1.4 1.1 0.5 0.6 0.7 1.6 1.1 0.7 0.8 1.1More than 50 percent ................ 1.7 1.5 0.6 1.1 0.9 2.1 1.5 0.7 0.9 1.6
Percent of students in schooleligible for free or reduced-price school lunch
Less than 15 percent ................. 1.2 0.9 0.5 0.4 0.6 1.4 0.9 0.7 0.8 1.215 to 32 percent......................... 1.2 1.0 0.4 0.4 0.7 1.5 1.0 0.6 0.9 1.233 to 59 percent......................... 1.7 1.0 0.5 0.8 0.8 1.9 1.0 0.8 0.8 1.560 percent or more .................... 1.7 1.4 0.6 0.9 0.9 2.0 1.7 0.6 0.8 1.5
Main teaching assignment
General elementary2.................. 1.0 0.8 0.4 0.5 0.5 1.3 0.8 0.5 0.7 1.0Math/science ............................. 1.4 0.9 0.4 0.5 0.5 1.3 0.9 0.7 0.7 1.0Other targeted academic
subject ................................... 0.9 0.9 0.4 0.5 0.7 1.2 0.7 0.5 0.6 0.8
Teaching experience3 or fewer years......................... 1.8 1.7 0.9 1.4 1.5 1.3 0.7 0.5 0.7 0.54 to 9 years ................................ 1.7 1.2 0.6 0.7 0.7 2.0 1.6 0.6 1.0 1.510 to 19 years ............................ 1.4 1.1 0.5 0.4 0.7 1.8 1.1 0.8 1.0 1.420 or more years........................ 0.8 0.7 0.3 0.2 0.4 1.2 0.9 0.5 0.7 1.0
Teacher race/ethnicityWhite, non-Hispanic................. 0.7 0.6 0.3 0.3 0.3 0.9 0.6 0.3 0.5 0.7Black, non-Hispanic ................. 4.1 2.3 1.2 1.9 2.9 4.1 2.4 2.2 1.6 4.2Other .......................................... 3.1 2.1 1.1 1.5 2.0 3.4 1.9 1.7 1.6 2.1
SexMale ........................................... 1.4 1.0 0.5 0.6 0.6 1.0 0.8 0.5 0.5 0.8Female ....................................... 0.9 0.7 0.3 0.4 0.4 1.0 0.7 0.4 0.5 0.7
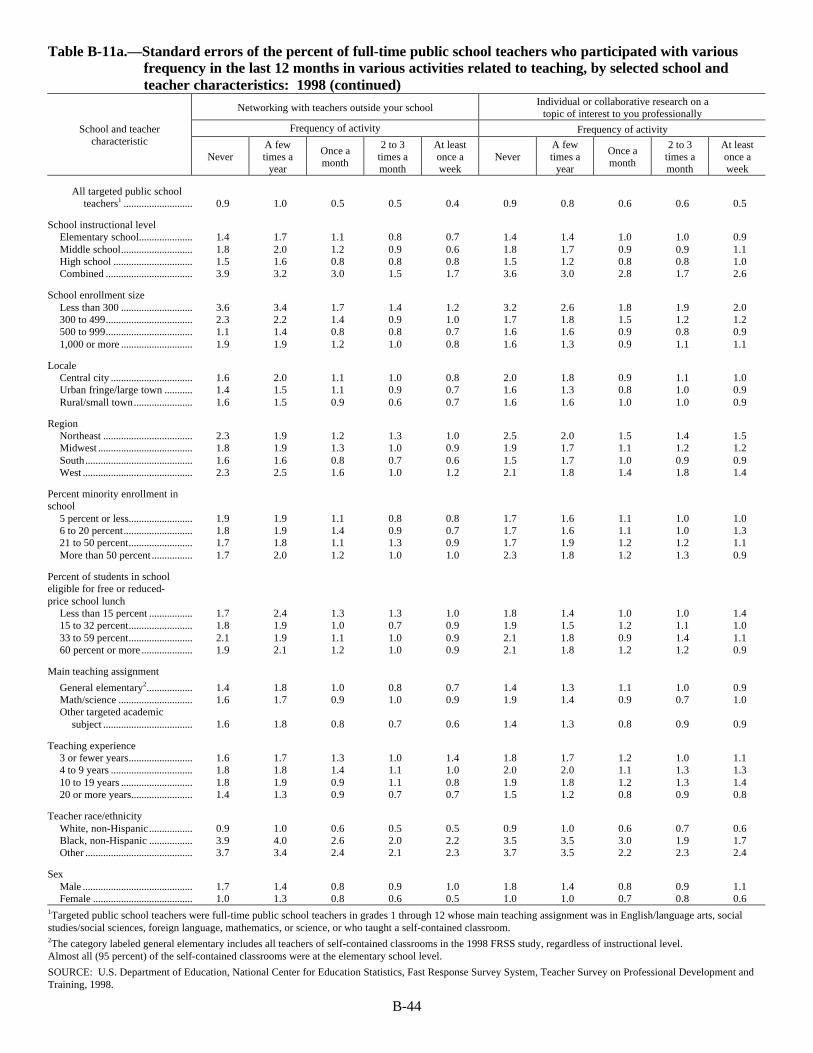
B-44
Table B-11a.—Standard errors of the percent of full-time public school teachers who participated with variousfrequency in the last 12 months in various activities related to teaching, by selected school andteacher characteristics: 1998 (continued)
Networking with teachers outside your schoolIndividual or collaborative research on a
topic of interest to you professionallyFrequency of activity Frequency of activitySchool and teacher
characteristic
NeverA fewtimes a
year
Once amonth
2 to 3times amonth
At leastonce aweek
NeverA fewtimes a
year
Once amonth
2 to 3times amonth
At leastonce aweek
All targeted public schoolteachers1 ........................... 0.9 1.0 0.5 0.5 0.4 0.9 0.8 0.6 0.6 0.5
School instructional levelElementary school..................... 1.4 1.7 1.1 0.8 0.7 1.4 1.4 1.0 1.0 0.9Middle school............................ 1.8 2.0 1.2 0.9 0.6 1.8 1.7 0.9 0.9 1.1High school ............................... 1.5 1.6 0.8 0.8 0.8 1.5 1.2 0.8 0.8 1.0Combined .................................. 3.9 3.2 3.0 1.5 1.7 3.6 3.0 2.8 1.7 2.6
School enrollment sizeLess than 300 ............................ 3.6 3.4 1.7 1.4 1.2 3.2 2.6 1.8 1.9 2.0300 to 499.................................. 2.3 2.2 1.4 0.9 1.0 1.7 1.8 1.5 1.2 1.2500 to 999.................................. 1.1 1.4 0.8 0.8 0.7 1.6 1.6 0.9 0.8 0.91,000 or more ............................ 1.9 1.9 1.2 1.0 0.8 1.6 1.3 0.9 1.1 1.1
LocaleCentral city ................................ 1.6 2.0 1.1 1.0 0.8 2.0 1.8 0.9 1.1 1.0Urban fringe/large town ........... 1.4 1.5 1.1 0.9 0.7 1.6 1.3 0.8 1.0 0.9Rural/small town....................... 1.6 1.5 0.9 0.6 0.7 1.6 1.6 1.0 1.0 0.9
RegionNortheast ................................... 2.3 1.9 1.2 1.3 1.0 2.5 2.0 1.5 1.4 1.5Midwest ..................................... 1.8 1.9 1.3 1.0 0.9 1.9 1.7 1.1 1.2 1.2South.......................................... 1.6 1.6 0.8 0.7 0.6 1.5 1.7 1.0 0.9 0.9West ........................................... 2.3 2.5 1.6 1.0 1.2 2.1 1.8 1.4 1.8 1.4
Percent minority enrollment inschool
5 percent or less......................... 1.9 1.9 1.1 0.8 0.8 1.7 1.6 1.1 1.0 1.06 to 20 percent........................... 1.8 1.9 1.4 0.9 0.7 1.7 1.6 1.1 1.0 1.321 to 50 percent......................... 1.7 1.8 1.1 1.3 0.9 1.7 1.9 1.2 1.2 1.1More than 50 percent ................ 1.7 2.0 1.2 1.0 1.0 2.3 1.8 1.2 1.3 0.9
Percent of students in schooleligible for free or reduced-price school lunch
Less than 15 percent ................. 1.7 2.4 1.3 1.3 1.0 1.8 1.4 1.0 1.0 1.415 to 32 percent......................... 1.8 1.9 1.0 0.7 0.9 1.9 1.5 1.2 1.1 1.033 to 59 percent......................... 2.1 1.9 1.1 1.0 0.9 2.1 1.8 0.9 1.4 1.160 percent or more .................... 1.9 2.1 1.2 1.0 0.9 2.1 1.8 1.2 1.2 0.9
Main teaching assignment
General elementary2.................. 1.4 1.8 1.0 0.8 0.7 1.4 1.3 1.1 1.0 0.9Math/science ............................. 1.6 1.7 0.9 1.0 0.9 1.9 1.4 0.9 0.7 1.0Other targeted academic
subject ................................... 1.6 1.8 0.8 0.7 0.6 1.4 1.3 0.8 0.9 0.9
Teaching experience3 or fewer years......................... 1.6 1.7 1.3 1.0 1.4 1.8 1.7 1.2 1.0 1.14 to 9 years ................................ 1.8 1.8 1.4 1.1 1.0 2.0 2.0 1.1 1.3 1.310 to 19 years ............................ 1.8 1.9 0.9 1.1 0.8 1.9 1.8 1.2 1.3 1.420 or more years........................ 1.4 1.3 0.9 0.7 0.7 1.5 1.2 0.8 0.9 0.8
Teacher race/ethnicityWhite, non-Hispanic................. 0.9 1.0 0.6 0.5 0.5 0.9 1.0 0.6 0.7 0.6Black, non-Hispanic ................. 3.9 4.0 2.6 2.0 2.2 3.5 3.5 3.0 1.9 1.7Other .......................................... 3.7 3.4 2.4 2.1 2.3 3.7 3.5 2.2 2.3 2.4
SexMale ........................................... 1.7 1.4 0.8 0.9 1.0 1.8 1.4 0.8 0.9 1.1Female ....................................... 1.0 1.3 0.8 0.6 0.5 1.0 1.0 0.7 0.8 0.6
1Targeted public school teachers were full-time public school teachers in grades 1 through 12 whose main teaching assignment was in English/language arts, socialstudies/social sciences, foreign language, mathematics, or science, or who taught a self-contained classroom.2The category labeled general elementary includes all teachers of self-contained classrooms in the 1998 FRSS study, regardless of instructional level.Almost all (95 percent) of the self-contained classrooms were at the elementary school level.
SOURCE: U.S. Department of Education, National Center for Education Statistics, Fast Response Survey System, Teacher Survey on Professional Development andTraining, 1998.
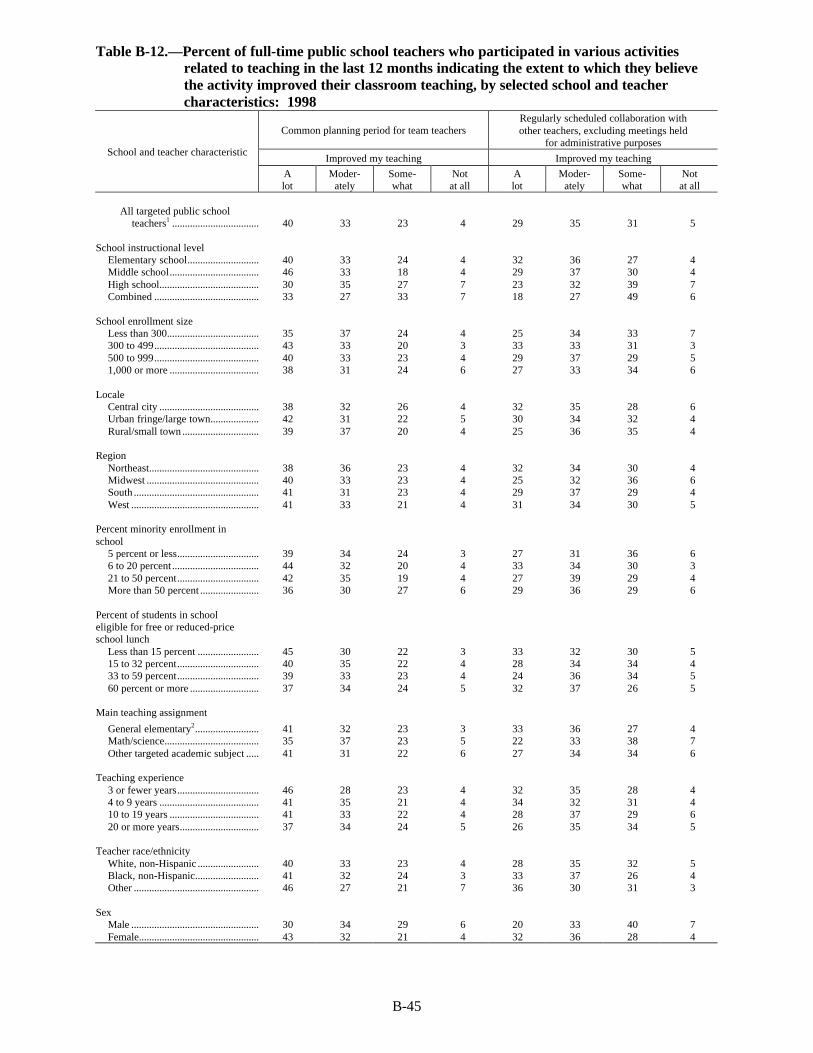
B-45
Table B-12.—Percent of full-time public school teachers who participated in various activitiesrelated to teaching in the last 12 months indicating the extent to which they believethe activity improved their classroom teaching, by selected school and teachercharacteristics: 1998
Common planning period for team teachersRegularly scheduled collaboration withother teachers, excluding meetings held
for administrative purposes
Improved my teaching Improved my teachingSchool and teacher characteristic
Alot
Moder-ately
Some-what
Notat all
Alot
Moder-ately
Some-what
Notat all
All targeted public schoolteachers1 .................................. 40 33 23 4 29 35 31 5
School instructional levelElementary school............................ 40 33 24 4 32 36 27 4Middle school................................... 46 33 18 4 29 37 30 4High school....................................... 30 35 27 7 23 32 39 7Combined ......................................... 33 27 33 7 18 27 49 6
School enrollment sizeLess than 300.................................... 35 37 24 4 25 34 33 7300 to 499......................................... 43 33 20 3 33 33 31 3500 to 999......................................... 40 33 23 4 29 37 29 51,000 or more ................................... 38 31 24 6 27 33 34 6
LocaleCentral city ....................................... 38 32 26 4 32 35 28 6Urban fringe/large town................... 42 31 22 5 30 34 32 4Rural/small town .............................. 39 37 20 4 25 36 35 4
RegionNortheast........................................... 38 36 23 4 32 34 30 4Midwest ............................................ 40 33 23 4 25 32 36 6South ................................................. 41 31 23 4 29 37 29 4West .................................................. 41 33 21 4 31 34 30 5
Percent minority enrollment inschool
5 percent or less................................ 39 34 24 3 27 31 36 66 to 20 percent.................................. 44 32 20 4 33 34 30 321 to 50 percent................................ 42 35 19 4 27 39 29 4More than 50 percent ....................... 36 30 27 6 29 36 29 6
Percent of students in schooleligible for free or reduced-priceschool lunch
Less than 15 percent ........................ 45 30 22 3 33 32 30 515 to 32 percent................................ 40 35 22 4 28 34 34 433 to 59 percent................................ 39 33 23 4 24 36 34 560 percent or more ........................... 37 34 24 5 32 37 26 5
Main teaching assignment
General elementary2......................... 41 32 23 3 33 36 27 4Math/science..................................... 35 37 23 5 22 33 38 7Other targeted academic subject ..... 41 31 22 6 27 34 34 6
Teaching experience3 or fewer years................................ 46 28 23 4 32 35 28 44 to 9 years ....................................... 41 35 21 4 34 32 31 410 to 19 years ................................... 41 33 22 4 28 37 29 620 or more years............................... 37 34 24 5 26 35 34 5
Teacher race/ethnicityWhite, non-Hispanic ........................ 40 33 23 4 28 35 32 5Black, non-Hispanic......................... 41 32 24 3 33 37 26 4Other ................................................. 46 27 21 7 36 30 31 3
SexMale .................................................. 30 34 29 6 20 33 40 7Female............................................... 43 32 21 4 32 36 28 4

B-46
Table B-12.—Percent of full-time public school teachers who participated in various activitiesrelated to teaching in the last 12 months indicating the extent to which they believethe activity improved their classroom teaching, by selected school and teachercharacteristics: 1998 (continued)
Being mentored by another teacherin a formal relationship
Mentoring another teacher in a formal relationship
Improved my teaching Improved my teachingSchool and teacher characteristic
Alot
Moder-ately
Some-what
Notat all
Alot
Moder-ately
Some-what
Notat all
All targeted public schoolteachers1 .................................. 34 27 32 7 19 30 39 11
School instructional levelElementary school............................ 37 24 32 7 23 31 37 9Middle school................................... 32 28 33 6 18 30 42 10High school....................................... 31 32 29 8 14 31 38 16Combined ......................................... 27 28 36 8 11 25 52 12
School enrollment sizeLess than 300.................................... 31 30 36 3 12 25 55 8300 to 499......................................... 42 21 29 7 26 30 35 9500 to 999......................................... 31 28 34 7 20 30 39 111,000 or more ................................... 36 27 28 9 15 33 38 15
LocaleCentral city ....................................... 36 28 30 7 20 36 32 12Urban fringe/large town................... 37 23 30 9 19 31 40 10Rural/small town .............................. 29 29 35 6 20 22 47 11
RegionNortheast........................................... 31 39 22 8 19 32 39 9Midwest ............................................ 33 24 38 4 21 30 41 8South ................................................. 35 26 33 6 17 31 38 14West .................................................. 35 23 32 11 22 29 40 9
Percent minority enrollment inschool
5 percent or less................................ 30 31 36 3 17 27 43 136 to 20 percent.................................. 44 22 27 7 25 32 34 821 to 50 percent................................ 28 31 32 8 19 28 40 13More than 50 percent ....................... 37 23 31 9 16 34 39 11
Percent of students in schooleligible for free or reduced-priceschool lunch
Less than 15 percent ........................ 38 27 30 5 23 25 41 1115 to 32 percent................................ 29 30 37 4 19 33 36 1233 to 59 percent................................ 30 28 33 9 17 31 42 1160 percent or more ........................... 38 24 29 9 19 32 38 11
Main teaching assignment
General elementary2......................... 36 25 31 8 23 31 37 9Math/science..................................... 30 29 38 4 15 27 46 13Other targeted academic subject ..... 35 28 28 9 16 31 40 14
Teaching experience3 or fewer years................................ 45 26 25 5 19 35 41 64 to 9 years ....................................... 31 26 36 8 18 29 42 1110 to 19 years ................................... 32 28 35 5 18 35 33 1420 or more years............................... 18 27 39 15 21 27 42 10
Teacher race/ethnicityWhite, non-Hispanic ........................ 31 27 35 7 17 31 40 11Black, non-Hispanic......................... 50 23 21 6 31 24 35 10Other ................................................. 41 24 24 11 25 28 36 12
SexMale .................................................. 29 31 31 9 18 29 42 10Female............................................... 37 25 32 7 20 31 39 11

B-47
Table B-12.—Percent of full-time public school teachers who participated in various activitiesrelated to teaching in the last 12 months indicating the extent to which they believethe activity improved their classroom teaching, by selected school and teachercharacteristics: 1998 (continued)
Networking with teachers outside your schoolIndividual or collaborative research on a topic
of interest to you professionally
Improved my teaching Improved my teachingSchool and teacher characteristic
Alot
Moder-ately
Some-what
Notat all
Alot
Moder-ately
Some-what
Notat all
All targeted public schoolteachers1 .................................. 23 33 41 4 34 35 29 2
School instructional levelElementary school............................ 25 32 40 3 35 35 29 1Middle school................................... 22 32 43 3 34 33 31 2High school....................................... 19 35 42 5 34 37 27 2Combined ......................................... 20 38 37 5 29 47 22 2
School enrollment sizeLess than 300.................................... 26 27 46 2 30 43 26 1300 to 499......................................... 24 32 39 5 40 34 25 1500 to 999......................................... 23 33 41 3 32 34 32 11,000 or more ................................... 21 35 39 5 35 35 27 2
LocaleCentral city ....................................... 25 32 38 4 36 34 28 2Urban fringe/large town................... 20 35 41 4 35 35 29 1Rural/small town .............................. 24 31 43 2 32 37 29 2
RegionNortheast........................................... 22 36 40 2 37 36 26 1Midwest ............................................ 26 32 39 4 32 40 27 *South ................................................. 21 32 42 4 34 32 32 2West .................................................. 23 32 40 5 36 34 28 2
Percent minority enrollment inschool
5 percent or less................................ 25 29 42 4 31 42 27 16 to 20 percent.................................. 20 34 43 3 36 33 31 121 to 50 percent................................ 21 31 44 4 35 34 28 2More than 50 percent ....................... 26 35 34 4 37 32 29 2
Percent of students in schooleligible for free or reduced-priceschool lunch
Less than 15 percent ........................ 22 30 42 5 38 34 27 115 to 32 percent................................ 21 36 40 3 32 39 27 133 to 59 percent................................ 22 33 43 2 33 37 29 160 percent or more ........................... 25 33 38 4 35 31 32 2
Main teaching assignment
General elementary2......................... 25 32 39 4 35 35 29 1Math/science..................................... 21 32 45 3 31 35 33 *Other targeted academic subject ..... 20 35 41 4 36 36 26 3
Teaching experience3 or fewer years................................ 27 37 33 3 32 34 31 24 to 9 years ....................................... 25 32 41 2 31 36 31 110 to 19 years ................................... 21 32 42 4 40 32 26 220 or more years............................... 21 32 43 5 34 37 28 1
Teacher race/ethnicityWhite, non-Hispanic ........................ 22 33 42 3 33 36 29 2Black, non-Hispanic......................... 33 27 37 4 46 24 29 1Other ................................................. 29 34 31 7 37 35 27 *
SexMale .................................................. 22 31 42 5 31 36 32 2Female............................................... 23 33 40 3 36 35 28 2
*Less than 0.5 percent.1Targeted public school teachers were full-time public school teachers in grades 1 through 12 whose main teaching assignment was inEnglish/language arts, social studies/social sciences, foreign language, mathematics, or science, or who taught a self-contained classroom.2The category labeled general elementary includes all teachers of self-contained classrooms in the 1998 FRSS study, regardless of instructionallevel. Almost all (95 percent) of the self-contained classrooms were at the elementary school level.
NOTE: Percents are computed across each row for each type of professional development program, but may not sum to 100 because of rounding.
SOURCE: U.S. Department of Education, National Center for Education Statistics, Fast Response Survey System, Teacher Survey onProfessional Development and Training, 1998.

B-48
Table B-12a.—Standard errors of the percent of full-time public school teachers who participatedin various activities related to teaching in the last 12 months indicating the extent towhich they believe the activity improved their classroom teaching, by selected schooland teacher characteristics: 1998
Common planning period for team teachersRegularly scheduled collaboration withother teachers, excluding meetings held
for administrative purposes
Improved my teaching Improved my teachingSchool and teacher characteristic
Alot
Moder-ately
Some-what
Notat all
Alot
Moder-ately
Some-what
Notat all
All targeted public schoolteachers1 .................................. 1.5 1.1 1.1 0.5 0.9 1.0 0.8 0.5
School instructional levelElementary school............................ 2.2 1.6 1.5 0.7 1.6 1.5 1.1 0.7Middle school................................... 1.9 1.9 1.5 0.7 1.8 1.6 1.7 0.9High school....................................... 2.3 2.3 2.2 1.4 1.6 1.7 1.8 1.0Combined ......................................... 10.4 6.0 7.4 3.3 3.2 3.1 4.4 2.1
School enrollment sizeLess than 300.................................... 4.2 4.7 3.9 1.5 3.3 3.6 3.2 2.1300 to 499......................................... 2.9 2.6 2.5 0.9 2.7 2.6 1.9 0.7500 to 999......................................... 2.1 1.7 1.6 0.7 1.5 1.6 1.4 0.71,000 or more ................................... 2.6 2.2 2.2 1.4 1.8 1.7 1.8 1.0
LocaleCentral city ....................................... 2.1 1.6 1.7 0.9 1.8 1.7 1.5 0.9Urban fringe/large town................... 2.4 1.9 1.8 0.7 1.7 1.7 1.6 0.7Rural/small town .............................. 2.1 2.1 1.6 0.9 1.8 1.8 1.7 1.0
RegionNortheast........................................... 3.0 3.2 2.5 1.0 2.4 2.5 2.3 0.9Midwest ............................................ 2.8 2.3 2.2 0.8 1.9 1.8 2.1 1.1South ................................................. 1.7 1.5 1.5 1.0 1.5 1.6 1.4 0.8West .................................................. 3.3 3.2 2.2 1.3 2.4 2.2 1.6 1.0
Percent minority enrollment inschool
5 percent or less................................ 2.5 2.4 2.1 0.7 1.7 2.1 2.2 1.16 to 20 percent.................................. 3.2 2.4 2.0 1.0 2.1 1.9 1.6 0.721 to 50 percent................................ 2.7 2.6 2.0 1.0 2.0 2.1 1.7 0.9More than 50 percent ....................... 2.3 2.1 1.9 1.3 1.9 2.0 1.9 1.1
Percent of students in schooleligible for free or reduced-priceschool lunch
Less than 15 percent ........................ 2.4 2.3 1.7 0.7 2.0 2.0 1.6 0.915 to 32 percent................................ 3.1 2.3 2.3 0.8 1.9 1.8 1.7 0.733 to 59 percent................................ 3.0 2.7 2.0 1.1 1.5 1.7 1.6 1.060 percent or more ........................... 2.2 2.3 2.0 1.1 2.1 2.0 1.7 1.0
Main teaching assignment
General elementary2......................... 2.3 1.9 1.5 0.7 1.6 1.4 1.3 0.6Math/science..................................... 2.2 2.4 2.0 0.9 1.7 1.8 2.0 1.0Other targeted academic subject ..... 1.8 2.1 1.4 0.9 1.7 1.8 1.5 0.8
Teaching experience3 or fewer years................................ 2.8 2.7 2.5 1.1 2.2 1.9 2.1 0.84 to 9 years ....................................... 2.5 2.3 2.0 1.2 2.2 2.1 2.3 1.110 to 19 years ................................... 3.3 2.2 2.4 0.9 2.1 1.8 1.7 1.220 or more years............................... 2.3 2.0 1.5 0.8 1.8 2.1 1.5 0.7
Teacher race/ethnicityWhite, non-Hispanic ........................ 1.6 1.2 1.2 0.5 1.0 1.0 0.8 0.6Black, non-Hispanic......................... 4.6 4.3 4.0 1.3 4.5 3.3 3.4 1.7Other ................................................. 4.5 3.9 4.1 2.6 5.0 4.0 3.8 1.7
SexMale .................................................. 2.2 2.3 2.3 1.2 1.5 1.9 1.8 1.0Female............................................... 1.8 1.2 1.2 0.6 1.2 1.1 0.8 0.6

B-49
Table B-12a.—Standard errors of the percent of full-time public school teachers who participatedin various activities related to teaching in the last 12 months indicating the extent towhich they believe the activity improved their classroom teaching, by selected schooland teacher characteristics: 1998 (continued)
Being mentored by another teacherin a formal relationship
Mentoring another teacher in a formal relationship
Improved my teaching Improved my teachingSchool and teacher characteristic
Alot
Moder-ately
Some-what
Notat all
Alot
Moder-ately
Some-what
Notat all
All targeted public schoolteachers1 .................................. 1.8 1.7 2.0 1.1 1.6 2.1 1.9 1.1
School instructional levelElementary school............................ 2.7 2.4 3.0 1.8 2.6 3.3 3.1 1.8Middle school................................... 3.4 3.5 3.2 1.5 2.7 3.4 3.3 2.5High school....................................... 2.5 3.2 3.0 1.7 2.1 2.7 3.5 1.9Combined ......................................... 6.6 8.8 8.5 4.4 4.9 6.1 5.5 4.5
School enrollment sizeLess than 300.................................... 6.5 6.5 7.6 2.8 4.5 6.3 7.6 3.8300 to 499......................................... 4.4 4.1 4.4 2.4 4.3 5.5 4.7 2.8500 to 999......................................... 2.7 2.5 2.8 1.5 1.9 2.9 2.7 1.61,000 or more ................................... 2.7 2.9 3.0 2.0 2.4 3.1 3.7 2.1
LocaleCentral city ....................................... 3.0 2.3 2.8 1.7 2.9 3.7 3.2 2.0Urban fringe/large town................... 3.6 2.5 3.8 2.4 2.2 3.5 3.4 1.5Rural/small town .............................. 3.4 3.3 3.7 2.2 3.6 2.7 3.4 1.9
RegionNortheast........................................... 4.3 5.4 5.1 2.5 3.6 5.0 4.7 2.9Midwest ............................................ 5.8 5.2 5.1 1.5 4.0 4.7 4.5 2.1South ................................................. 2.8 2.3 2.6 1.5 2.1 2.9 2.5 2.0West .................................................. 4.1 4.2 3.9 3.1 4.1 4.8 5.0 2.1
Percent minority enrollment inschool
5 percent or less................................ 3.6 3.6 4.0 1.5 2.9 3.8 3.6 3.26 to 20 percent.................................. 3.7 3.9 3.9 2.3 3.3 3.9 4.3 2.021 to 50 percent................................ 3.2 3.3 4.5 2.4 2.8 3.4 3.0 2.5More than 50 percent ....................... 3.7 3.0 3.4 2.2 3.1 4.3 3.6 2.2
Percent of students in schooleligible for free or reduced-priceschool lunch
Less than 15 percent ........................ 4.1 3.9 4.3 1.9 2.6 4.0 3.5 2.015 to 32 percent................................ 4.1 4.1 3.9 1.2 3.4 3.8 4.0 1.933 to 59 percent................................ 3.3 3.7 3.7 2.7 2.9 3.9 3.3 2.260 percent or more ........................... 3.7 3.0 3.3 2.3 3.3 3.7 3.7 2.2
Main teaching assignment
General elementary2......................... 2.5 2.5 2.8 1.8 2.6 3.3 3.0 1.8Math/science..................................... 3.7 3.6 3.8 1.2 2.2 3.2 3.1 2.2Other targeted academic subject ..... 2.9 2.7 3.4 1.7 1.9 2.9 3.2 1.7
Teaching experience3 or fewer years................................ 2.4 1.9 2.2 1.0 4.0 5.8 5.4 2.64 to 9 years ....................................... 4.4 3.6 4.6 1.8 3.6 3.7 3.6 2.410 to 19 years ................................... 4.5 4.8 5.0 2.8 2.8 3.6 3.2 2.420 or more years............................... 4.3 5.2 5.1 4.3 2.1 3.3 3.4 1.6
Teacher race/ethnicityWhite, non-Hispanic ........................ 1.7 1.8 2.2 1.1 1.7 2.3 2.1 1.2Black, non-Hispanic......................... 6.1 5.2 4.3 2.9 5.1 5.5 6.0 3.9Other ................................................. 6.0 5.2 6.2 5.5 6.9 6.9 7.5 3.8
SexMale .................................................. 2.7 2.6 3.2 1.5 3.1 3.4 3.5 2.1Female............................................... 2.2 1.9 2.3 1.5 2.0 2.6 2.0 1.3

B-50
Table B-12a.—Standard errors of the percent of full-time public school teachers who participatedin various activities related to teaching in the last 12 months indicating the extent towhich they believe the activity improved their classroom teaching, by selected schooland teacher characteristics: 1998 (continued)
Networking with teachers outside your schoolIndividual or collaborative research on a topic
of interest to you professionally
Improved my teaching Improved my teachingSchool and teacher characteristic
Alot
Moder-ately
Some-what
Notat all
Alot
Moder-ately
Some-what
Notat all
All targeted public schoolteachers1 .................................. 1.2 1.0 1.2 0.4 1.2 1.1 1.2 0.3
School instructional levelElementary school............................ 1.7 1.7 2.0 0.7 1.9 1.7 2.0 0.4Middle school................................... 1.7 1.7 1.9 0.7 2.3 2.2 2.5 0.6High school....................................... 1.6 2.0 2.5 0.8 2.2 2.2 2.1 0.5Combined ......................................... 4.3 4.4 4.5 2.3 6.0 5.2 4.0 1.3
School enrollment sizeLess than 300.................................... 3.7 4.1 4.9 1.0 3.7 4.2 3.3 1.1300 to 499......................................... 2.4 2.3 2.8 1.2 2.9 2.4 3.2 0.6500 to 999......................................... 1.7 1.7 1.9 0.6 1.8 1.8 1.7 0.41,000 or more ................................... 1.6 1.9 2.1 0.8 2.3 2.3 2.3 0.6
LocaleCentral city ....................................... 1.9 2.2 2.1 0.9 2.3 1.9 2.2 0.5Urban fringe/large town................... 1.6 1.8 2.0 0.8 1.7 1.8 2.0 0.3Rural/small town .............................. 2.2 2.1 2.3 0.6 2.2 2.3 2.2 0.6
RegionNortheast........................................... 1.9 2.4 2.5 0.6 2.4 2.7 2.1 0.3Midwest ............................................ 2.7 2.4 2.6 0.9 2.2 2.8 2.4 0.3South ................................................. 1.9 2.0 2.1 0.8 1.9 1.9 2.0 0.6West .................................................. 2.3 2.6 3.0 1.1 2.9 2.5 2.9 0.7
Percent minority enrollment inschool
5 percent or less................................ 2.2 2.1 2.6 0.9 2.2 2.5 2.3 0.36 to 20 percent.................................. 2.1 2.2 2.5 0.8 2.8 2.4 2.3 0.421 to 50 percent................................ 2.1 2.1 2.2 0.9 2.5 2.6 2.2 0.8More than 50 percent ....................... 2.3 2.2 2.4 0.9 2.7 2.6 2.6 0.7
Percent of students in schooleligible for free or reduced-priceschool lunch
Less than 15 percent ........................ 2.0 2.2 2.2 1.2 2.2 2.4 2.2 0.415 to 32 percent................................ 1.9 2.1 2.4 0.9 2.5 2.6 2.3 0.433 to 59 percent................................ 2.5 2.1 2.2 0.8 2.3 2.3 2.3 0.760 percent or more ........................... 2.4 2.1 2.2 0.9 2.5 2.1 2.5 0.7
Main teaching assignment
General elementary2......................... 1.7 1.8 2.1 0.7 2.1 1.7 2.0 0.4Math/science..................................... 2.0 1.8 2.1 0.8 2.4 2.7 2.7 0.3Other targeted academic subject ..... 1.5 1.5 2.1 0.8 1.9 1.8 1.8 0.5
Teaching experience3 or fewer years................................ 2.3 2.4 2.5 0.9 2.7 2.5 2.5 0.74 to 9 years ....................................... 2.5 2.3 2.6 0.6 2.3 2.5 2.2 0.610 to 19 years ................................... 2.4 2.3 2.6 1.0 2.5 2.7 2.5 0.720 or more years............................... 1.7 1.9 2.4 1.0 2.3 2.2 1.8 0.5
Teacher race/ethnicityWhite, non-Hispanic ........................ 1.1 1.1 1.2 0.5 1.2 1.2 1.3 0.3Black, non-Hispanic......................... 5.2 3.9 5.2 1.6 5.6 4.1 4.3 0.9Other ................................................. 3.7 4.3 4.2 2.6 4.6 5.1 4.6 0.4
SexMale .................................................. 2.1 2.1 2.4 1.1 2.1 2.1 2.1 0.5Female............................................... 1.4 1.2 1.5 0.5 1.4 1.3 1.4 0.3
1Targeted public school teachers were full-time public school teachers in grades 1 through 12 whose main teaching assignment was inEnglish/language arts, social studies/social sciences, foreign language, mathematics, or science, or who taught a self-contained classroom.2The category labeled general elementary includes all teachers of self-contained classrooms in the 1998 FRSS study, regardless of instructionallevel. Almost all (95 percent) of the self-contained classrooms were at the elementary school level.
SOURCE: U.S. Department of Education, National Center for Education Statistics, Fast Response Survey System, Teacher Survey onProfessional Development and Training, 1998.

B-51
Table B-13.—Percent of full-time public school teachers who participated in a formal inductionprogram when they first began teaching, by selected school and teachercharacteristics: 1998
School and teacher characteristic Participated in induction program
All targeted public school teachers1 .............................................................................. 34
School instructional levelElementary school............................................................................................................... 33Middle school...................................................................................................................... 36High school.......................................................................................................................... 34Combined ............................................................................................................................ 32
School enrollment sizeLess than 300....................................................................................................................... 27300 to 499............................................................................................................................ 31500 to 999............................................................................................................................ 351,000 or more ...................................................................................................................... 39
LocaleCentral city .......................................................................................................................... 37Urban fringe/large town...................................................................................................... 37Rural/small town ................................................................................................................. 27
RegionNortheast.............................................................................................................................. 29Midwest ............................................................................................................................... 26South .................................................................................................................................... 38West ..................................................................................................................................... 39
Percent minority enrollment in school5 percent or less................................................................................................................... 256 to 20 percent..................................................................................................................... 3421 to 50 percent................................................................................................................... 37More than 50 percent .......................................................................................................... 39
Percent of students in school eligible for free or reduced-price school lunchLess than 15 percent ........................................................................................................... 3515 to 32 percent................................................................................................................... 3233 to 59 percent................................................................................................................... 3260 percent or more .............................................................................................................. 37
Main teaching assignment
General elementary2............................................................................................................ 33Math/science........................................................................................................................ 35Other targeted academic subject ........................................................................................ 35
Teaching experience3 or fewer years................................................................................................................... 654 to 9 years .......................................................................................................................... 5510 to 19 years ...................................................................................................................... 2820 or more years.................................................................................................................. 14
Teacher race/ethnicityWhite, non-Hispanic ........................................................................................................... 32Black, non-Hispanic............................................................................................................ 48Other .................................................................................................................................... 45
SexMale ..................................................................................................................................... 39Female.................................................................................................................................. 32
1Targeted public school teachers were full-time public school teachers in grades 1 through 12 whose main teaching assignment was inEnglish/language arts, social studies/social sciences, foreign language, mathematics, or science, or who taught a self-contained classroom.2The category labeled general elementary includes all teachers of self-contained classrooms in the 1998 FRSS study, regardless of instructionallevel. Almost all (95 percent) of the self-contained classrooms were at the elementary school level.
SOURCE: U.S. Department of Education, National Center for Education Statistics, Fast Response Survey System, Teacher Survey onProfessional Development and Training, 1998.

B-52
Table B-13a.—Standard errors of the percent of full-time public school teachers who participatedin a formal induction program when they first began teaching, by selected schooland teacher characteristics: 1998
School and teacher characteristic Participated in induction program
All targeted public school teachers`1 ............................................................................. 0.8
School instructional levelElementary school............................................................................................................... 1.4Middle school...................................................................................................................... 1.8High school.......................................................................................................................... 1.5Combined ............................................................................................................................ 3.5
School enrollment sizeLess than 300....................................................................................................................... 2.7300 to 499............................................................................................................................ 2.0500 to 999............................................................................................................................ 1.51,000 or more ...................................................................................................................... 2.0
LocaleCentral city .......................................................................................................................... 1.6Urban fringe/large town...................................................................................................... 1.6Rural/small town ................................................................................................................. 1.4
RegionNortheast.............................................................................................................................. 2.1Midwest ............................................................................................................................... 1.4South .................................................................................................................................... 1.3West ..................................................................................................................................... 2.5
Percent minority enrollment in school5 percent or less................................................................................................................... 1.26 to 20 percent..................................................................................................................... 2.021 to 50 percent................................................................................................................... 2.0More than 50 percent .......................................................................................................... 1.9
Percent of students in school eligible for free or reduced-price school lunchLess than 15 percent ........................................................................................................... 1.815 to 32 percent................................................................................................................... 1.933 to 59 percent................................................................................................................... 1.860 percent or more .............................................................................................................. 1.6
Main teaching assignment
General elementary2............................................................................................................ 1.3Math/science........................................................................................................................ 1.6Other targeted academic subject ........................................................................................ 1.3
Teaching experience3 or fewer years................................................................................................................... 1.94 to 9 years .......................................................................................................................... 2.110 to 19 years ...................................................................................................................... 1.720 or more years.................................................................................................................. 1.1
Teacher race/ethnicityWhite, non-Hispanic ........................................................................................................... 0.9Black, non-Hispanic............................................................................................................ 3.4Other .................................................................................................................................... 3.9
SexMale ..................................................................................................................................... 1.6Female.................................................................................................................................. 0.9
1Targeted public school teachers were full-time public school teachers in grades 1 through 12 whose main teaching assignment was inEnglish/language arts, social studies/social sciences, foreign language, mathematics, or science, or who taught a self-contained classroom.2The category labeled general elementary includes all teachers of self-contained classrooms in the 1998 FRSS study, regardless of instructionallevel. Almost all (95 percent) of the self-contained classrooms were at the elementary school level.
SOURCE: U.S. Department of Education, National Center for Education Statistics, Fast Response Survey System, Teacher Survey onProfessional Development and Training, 1998.

B-53
Table B-14.—Average class size for full-time public school teachers in general elementaryclassrooms and departmentalized settings, by selected school and teachercharacteristics: 1998
Teaching assignment
Departmentalized settingsSchool and teacher characteristic Generalelementaryclassroom1 Total2 Main Secondary
All targeted public school teachers3 ......................... 23 24 24 24
School instructional levelElementary school.......................................................... 23 # # #Middle school................................................................. # 25 25 25High school..................................................................... # 24 24 23Combined ....................................................................... # 22 22 21
School enrollment sizeLess than 300.................................................................. 20 19 19 18300 to 499....................................................................... 22 22 22 22500 to 999....................................................................... 23 24 24 241,000 or more ................................................................. 26 26 26 27
LocaleCentral city ..................................................................... 23 25 25 24Urban fringe/large town................................................. 23 25 25 25Rural/small town ............................................................ 21 22 22 22
RegionNortheast......................................................................... 23 23 23 23Midwest .......................................................................... 22 23 23 23South ............................................................................... 22 23 23 23West ................................................................................ 23 28 28 26
Percent minority enrollment in school5 percent or less.............................................................. 22 23 23 236 to 20 percent................................................................ 23 24 24 2621 to 50 percent.............................................................. 23 24 24 23More than 50 percent ..................................................... 23 25 25 23
Percent of students in school eligible for free orreduced-price school lunch
Less than 15 percent ...................................................... 23 24 24 2415 to 32 percent.............................................................. 22 24 24 2533 to 59 percent.............................................................. 22 24 24 2360 percent or more ......................................................... 23 24 24 22
Teaching experience3 or fewer years.............................................................. 22 24 24 234 to 9 years ..................................................................... 23 24 24 2510 to 19 years ................................................................. 23 24 24 2320 or more years............................................................. 23 24 24 23
Teacher race/ethnicityWhite, non-Hispanic ...................................................... 23 24 24 24Black, non-Hispanic....................................................... 23 25 25 *Other ............................................................................... 23 24 25 22
SexMale ................................................................................ 24 25 24 25Female............................................................................. 22 23 24 23
#Data for general elementary classrooms are reported for elementary schools only; data for departmentalized settings are not reported forelementary schools. Data for all school levels are included in the totals and in analyses by other school and teacher characteristics.
*Too few cases for a reliable estimate.1The category labeled general elementary classrooms includes all teachers of self-contained classrooms in the 1998 FRSS study, regardless ofinstructional level. Almost all (95 percent) of the self-contained classrooms were at the elementary school level.2Total includes class size information for main, secondary, and other teacher assignments. Data for other teaching assignments are not shownseparately because few teachers in this study reported other teaching assignments.3Targeted public school teachers were full-time public school teachers in grades 1 through 12 whose main teaching assignment was inEnglish/language arts, social studies/social sciences, foreign language, mathematics, or science, or who taught a self-contained classroom.
SOURCE: U.S. Department of Education, National Center for Education Statistics, Fast Response Survey System, Teacher Survey onProfessional Development and Training, 1998.

B-54
Table B-14a.—Standard errors of the average class size for full-time public school teachers ingeneral elementary classrooms and departmentalized settings, by selected schooland teacher characteristics: 1998
Teaching assignment
Departmentalized settingsSchool and teacher characteristic Generalelementaryclassrooms1 Total2 Main Secondary
All targeted public school teachers3 ......................... 0.2 0.1 0.1 0.4
School instructional levelElementary school.......................................................... 0.1 # # #Middle school................................................................. # 0.2 0.2 0.5High school..................................................................... # 0.2 0.2 1.1Combined ....................................................................... # 0.6 0.6 1.9
School enrollment sizeLess than 300.................................................................. 0.5 0.5 0.5 1.0300 to 499....................................................................... 0.2 0.5 0.5 1.0500 to 999....................................................................... 0.2 0.2 0.2 0.51,000 or more ................................................................. 0.9 0.2 0.2 0.9
LocaleCentral city ..................................................................... 0.2 0.3 0.3 0.9Urban fringe/large town................................................. 0.3 0.2 0.2 0.9Rural/small town ............................................................ 0.3 0.2 0.2 0.6
RegionNortheast......................................................................... 0.4 0.3 0.3 1.2Midwest .......................................................................... 0.3 0.3 0.3 0.6South ............................................................................... 0.2 0.2 0.2 0.7West ................................................................................ 0.3 0.4 0.4 1.2
Percent minority enrollment in school5 percent or less.............................................................. 0.4 0.2 0.2 0.76 to 20 percent................................................................ 0.3 0.2 0.2 0.721 to 50 percent.............................................................. 0.3 0.3 0.3 1.0More than 50 percent ..................................................... 0.3 0.3 0.3 0.9
Percent of students in school eligible for free orreduced-price school lunch
Less than 15 percent ...................................................... 0.3 0.3 0.3 0.815 to 32 percent.............................................................. 0.4 0.3 0.3 1.033 to 59 percent.............................................................. 0.2 0.3 0.3 0.760 percent or more ......................................................... 0.3 0.4 0.4 1.0
Teaching experience3 or fewer years.............................................................. 0.4 0.3 0.3 0.94 to 9 years ..................................................................... 0.3 0.3 0.3 0.910 to 19 years ................................................................. 0.3 0.3 0.3 1.020 or more years............................................................. 0.2 0.2 0.2 0.7
Teacher race/ethnicityWhite, non-Hispanic ...................................................... 0.2 0.1 0.1 0.5Black, non-Hispanic....................................................... 0.5 0.6 0.6 *Other ............................................................................... 0.6 0.7 0.7 1.9
SexMale ................................................................................ 0.4 0.2 0.2 1.0Female............................................................................. 0.2 0.2 0.2 0.5
#Data for general elementary classrooms are reported for elementary schools only; data for departmentalized settings are not reported forelementary schools. Data for all school levels are included in the totals and in analyses by other school and teacher characteristics.
*Too few cases for a reliable estimate.1The category labeled general elementary classrooms includes all teachers of self-contained classrooms in the 1998 FRSS study, regardless ofinstructional level. Almost all (95 percent) of the self-contained classrooms were at the elementary school level.2Total includes class size information for main, secondary, and other teacher assignments. Data for other teaching assignments are not shownseparately because few teachers in this study reported other teaching assignments.3Targeted public school teachers were full-time public school teachers in grades 1 through 12 whose main teaching assignment was inEnglish/language arts, social studies/social sciences, foreign language, mathematics, or science, or who taught a self-contained classroom.
SOURCE: U.S. Department of Education, National Center for Education Statistics, Fast Response Survey System, Teacher Survey onProfessional Development and Training, 1998.

B-55
Table B-15.—Percent of full-time public school teachers agreeing or disagreeing with selectedstatements about parent and school support for teachers, by selected school andteacher characteristics: 1998
Parents support me in my effortsto educate their children
The school administrationsupports me in my work
School and teacher characteristicStrongly
agree
Some-whatagree
Some-what
disagree
Stronglydisagree
Stronglyagree
Some-whatagree
Some-what
disagree
Stronglydisagree
All targeted public schoolteachers1 .................................. 32 54 11 3 55 36 7 2
School instructional levelElementary school............................ 36 52 9 3 56 36 6 2Middle school................................... 30 56 11 2 59 33 7 1High school....................................... 24 58 14 4 49 39 9 3Combined ......................................... 25 59 13 2 48 42 6 4
School enrollment sizeLess than 300.................................... 36 54 9 1 57 37 5 1300 to 499......................................... 34 56 8 2 54 38 6 3500 to 999......................................... 32 53 11 3 57 35 7 21,000 or more ................................... 26 56 13 4 50 37 9 3
LocaleCentral city ....................................... 31 50 14 6 53 36 8 4Urban fringe/large town................... 33 55 9 2 55 36 8 2Rural/small town .............................. 30 58 10 2 56 37 6 1
RegionNortheast........................................... 34 55 8 3 46 43 9 2Midwest ............................................ 34 54 10 1 52 39 7 2South ................................................. 28 56 12 5 60 32 6 2West .................................................. 34 52 12 2 55 34 8 3
Percent minority enrollment inschool
5 percent or less................................ 33 58 8 1 50 42 7 16 to 20 percent.................................. 39 53 7 1 57 33 8 221 to 50 percent................................ 31 55 11 3 61 32 6 2More than 50 percent ....................... 24 51 18 8 51 37 8 4
Percent of students in schooleligible for free or reduced-priceschool lunch
Less than 15 percent ........................ 41 53 5 1 56 34 8 215 to 32 percent................................ 34 56 9 1 53 38 8 133 to 59 percent................................ 29 57 11 3 55 36 6 360 percent or more ........................... 23 53 17 7 54 36 7 3
Main teaching assignment
General elementary2......................... 37 51 9 3 56 35 7 2Math/science..................................... 28 57 12 4 53 39 6 2Other targeted academic subject ..... 25 58 14 3 54 35 8 3
Teaching experience3 or fewer years................................ 26 55 14 5 60 32 7 24 to 9 years ....................................... 32 55 11 2 56 34 7 210 to 19 years ................................... 32 54 10 3 53 38 6 320 or more years............................... 33 54 10 3 52 38 8 2
Teacher race/ethnicityWhite, non-Hispanic ........................ 31 56 11 3 54 36 7 2Black, non-Hispanic......................... 36 47 13 4 58 35 4 2Other ................................................. 42 43 12 3 59 33 7 1
SexMale .................................................. 31 52 13 4 51 38 8 3Female............................................... 32 55 10 3 56 35 7 2

B-56
Table B-15.—Percent of full-time public school teachers agreeing or disagreeing with selectedstatements about parent and school support for teachers, by selected school andteacher characteristics: 1998 (continued)
Other teachers share ideas thatare helpful to me in my teaching
Goals and priorities for the school are clear
School and teacher characteristicStrongly
agree
Some-whatagree
Some-what
disagree
Stronglydisagree
Stronglyagree
Some-whatagree
Some-what
disagree
Stronglydisagree
All targeted public schoolteachers1 .................................. 63 33 4 1 47 38 11 4
School instructional levelElementary school............................ 69 28 2 1 52 36 9 3Middle school................................... 60 36 3 1 48 39 11 3High school....................................... 53 40 7 1 37 42 16 5Combined ......................................... 49 43 5 3 32 41 17 9
School enrollment sizeLess than 300.................................... 61 35 2 2 45 40 9 6300 to 499......................................... 65 31 4 1 48 37 12 3500 to 999......................................... 65 32 3 1 49 37 10 41,000 or more ................................... 58 36 6 1 42 40 14 4
LocaleCentral city ....................................... 64 31 4 1 48 37 10 5Urban fringe/large town................... 64 32 4 1 47 37 12 4Rural/small town .............................. 60 36 3 1 46 40 11 3
RegionNortheast........................................... 61 36 2 1 42 40 14 5Midwest ............................................ 61 34 4 1 39 43 13 4South ................................................. 62 33 4 1 56 34 7 3West .................................................. 68 27 5 1 44 38 13 5
Percent minority enrollment inschool
5 percent or less................................ 59 37 3 1 40 44 12 46 to 20 percent.................................. 66 29 4 1 48 37 12 321 to 50 percent................................ 64 31 4 1 54 36 8 3More than 50 percent ....................... 61 34 4 1 46 36 12 6
Percent of students in schooleligible for free or reduced-priceschool lunch
Less than 15 percent ........................ 63 33 3 1 44 39 12 415 to 32 percent................................ 62 34 3 1 47 39 11 433 to 59 percent................................ 62 32 5 1 48 39 11 260 percent or more ........................... 63 33 3 1 50 35 11 5
Main teaching assignment
General elementary2......................... 70 27 2 1 52 36 9 3Math/science..................................... 55 40 4 1 41 41 14 4Other targeted academic subject ..... 56 38 5 1 43 39 13 5
Teaching experience3 or fewer years................................ 67 28 4 1 46 39 10 54 to 9 years ....................................... 66 29 5 1 46 39 11 410 to 19 years ................................... 62 33 4 1 48 37 11 420 or more years............................... 60 36 3 1 48 38 11 3
Teacher race/ethnicityWhite, non-Hispanic ........................ 62 33 4 1 45 39 11 4Black, non-Hispanic......................... 63 34 2 1 61 29 7 2Other ................................................. 67 30 3 1 52 32 11 4
SexMale .................................................. 52 41 5 2 37 43 15 5Female............................................... 66 30 3 1 50 36 10 4
1Targeted public school teachers were full-time public school teachers in grades 1 through 12 whose main teaching assignment was inEnglish/language arts, social studies/social sciences, foreign language, mathematics, or science, or who taught a self-contained classroom.2The category labeled general elementary includes all teachers of self-contained classrooms in the 1998 FRSS study, regardless of instructionallevel. Almost all (95 percent) of the self-contained classrooms were at the elementary school level.
NOTE: Percents are computed across each row for each statement, but may not sum to 100 because of rounding.
SOURCE: U.S. Department of Education, National Center for Education Statistics, Fast Response Survey System, Teacher Survey onProfessional Development and Training, 1998.
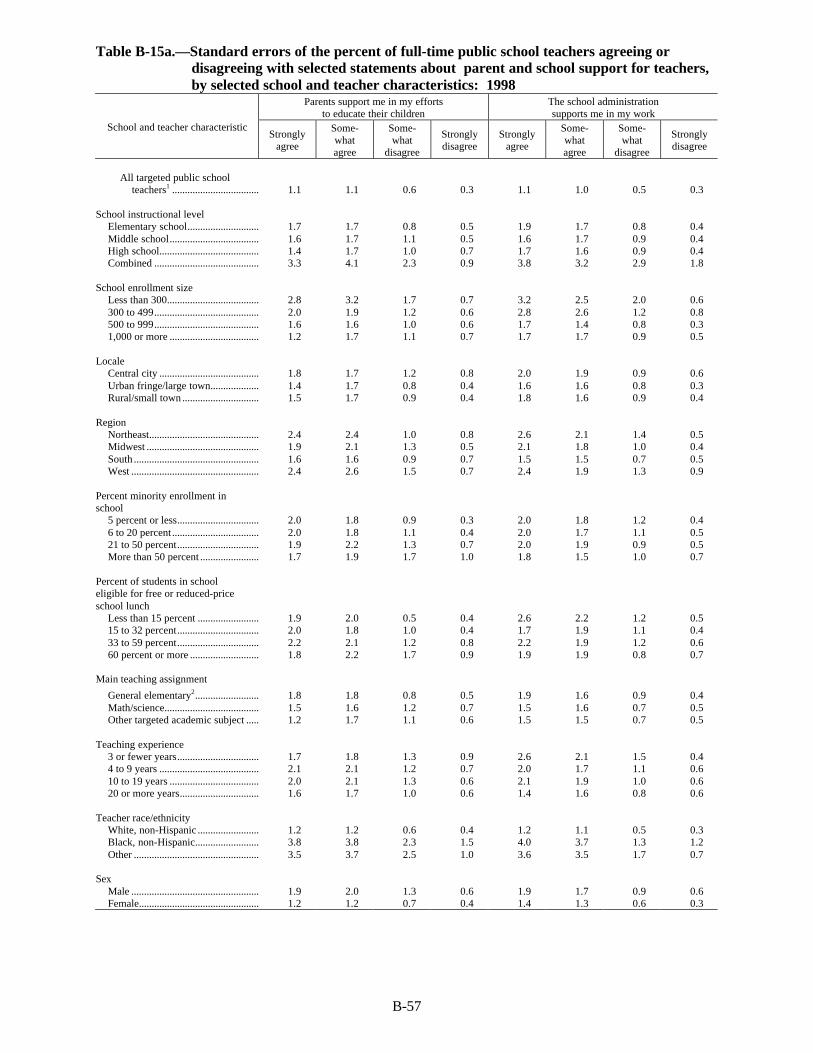
B-57
Table B-15a.—Standard errors of the percent of full-time public school teachers agreeing ordisagreeing with selected statements about parent and school support for teachers,by selected school and teacher characteristics: 1998
Parents support me in my effortsto educate their children
The school administrationsupports me in my work
School and teacher characteristicStrongly
agree
Some-whatagree
Some-what
disagree
Stronglydisagree
Stronglyagree
Some-whatagree
Some-what
disagree
Stronglydisagree
All targeted public schoolteachers1 .................................. 1.1 1.1 0.6 0.3 1.1 1.0 0.5 0.3
School instructional levelElementary school............................ 1.7 1.7 0.8 0.5 1.9 1.7 0.8 0.4Middle school................................... 1.6 1.7 1.1 0.5 1.6 1.7 0.9 0.4High school....................................... 1.4 1.7 1.0 0.7 1.7 1.6 0.9 0.4Combined ......................................... 3.3 4.1 2.3 0.9 3.8 3.2 2.9 1.8
School enrollment sizeLess than 300.................................... 2.8 3.2 1.7 0.7 3.2 2.5 2.0 0.6300 to 499......................................... 2.0 1.9 1.2 0.6 2.8 2.6 1.2 0.8500 to 999......................................... 1.6 1.6 1.0 0.6 1.7 1.4 0.8 0.31,000 or more ................................... 1.2 1.7 1.1 0.7 1.7 1.7 0.9 0.5
LocaleCentral city ....................................... 1.8 1.7 1.2 0.8 2.0 1.9 0.9 0.6Urban fringe/large town................... 1.4 1.7 0.8 0.4 1.6 1.6 0.8 0.3Rural/small town .............................. 1.5 1.7 0.9 0.4 1.8 1.6 0.9 0.4
RegionNortheast........................................... 2.4 2.4 1.0 0.8 2.6 2.1 1.4 0.5Midwest ............................................ 1.9 2.1 1.3 0.5 2.1 1.8 1.0 0.4South ................................................. 1.6 1.6 0.9 0.7 1.5 1.5 0.7 0.5West .................................................. 2.4 2.6 1.5 0.7 2.4 1.9 1.3 0.9
Percent minority enrollment inschool
5 percent or less................................ 2.0 1.8 0.9 0.3 2.0 1.8 1.2 0.46 to 20 percent.................................. 2.0 1.8 1.1 0.4 2.0 1.7 1.1 0.521 to 50 percent................................ 1.9 2.2 1.3 0.7 2.0 1.9 0.9 0.5More than 50 percent ....................... 1.7 1.9 1.7 1.0 1.8 1.5 1.0 0.7
Percent of students in schooleligible for free or reduced-priceschool lunch
Less than 15 percent ........................ 1.9 2.0 0.5 0.4 2.6 2.2 1.2 0.515 to 32 percent................................ 2.0 1.8 1.0 0.4 1.7 1.9 1.1 0.433 to 59 percent................................ 2.2 2.1 1.2 0.8 2.2 1.9 1.2 0.660 percent or more ........................... 1.8 2.2 1.7 0.9 1.9 1.9 0.8 0.7
Main teaching assignment
General elementary2......................... 1.8 1.8 0.8 0.5 1.9 1.6 0.9 0.4Math/science..................................... 1.5 1.6 1.2 0.7 1.5 1.6 0.7 0.5Other targeted academic subject ..... 1.2 1.7 1.1 0.6 1.5 1.5 0.7 0.5
Teaching experience3 or fewer years................................ 1.7 1.8 1.3 0.9 2.6 2.1 1.5 0.44 to 9 years ....................................... 2.1 2.1 1.2 0.7 2.0 1.7 1.1 0.610 to 19 years ................................... 2.0 2.1 1.3 0.6 2.1 1.9 1.0 0.620 or more years............................... 1.6 1.7 1.0 0.6 1.4 1.6 0.8 0.6
Teacher race/ethnicityWhite, non-Hispanic ........................ 1.2 1.2 0.6 0.4 1.2 1.1 0.5 0.3Black, non-Hispanic......................... 3.8 3.8 2.3 1.5 4.0 3.7 1.3 1.2Other ................................................. 3.5 3.7 2.5 1.0 3.6 3.5 1.7 0.7
SexMale .................................................. 1.9 2.0 1.3 0.6 1.9 1.7 0.9 0.6Female............................................... 1.2 1.2 0.7 0.4 1.4 1.3 0.6 0.3

B-58
Table B-15a.—Standard errors of the percent of full-time public school teachers agreeing ordisagreeing with selected statements about parent and school support for teachers,by selected school and teacher characteristics: 1998 (continued)
Other teachers share ideas thatare helpful to me in my teaching
Goals and priorities for the school are clear
School and teacher characteristicStrongly
agree
Some-whatagree
Some-what
disagree
Stronglydisagree
Stronglyagree
Some-whatagree
Some-what
disagree
Stronglydisagree
All targeted public schoolteachers1 .................................. 0.9 0.9 0.3 0.1 1.1 1.0 0.6 0.4
School instructional levelElementary school............................ 1.5 1.5 0.4 0.2 1.7 1.7 1.0 0.7Middle school................................... 1.8 1.7 0.6 0.3 1.5 1.5 1.1 0.6High school....................................... 1.5 1.4 0.7 0.3 1.6 1.5 1.3 0.7Combined ......................................... 3.8 3.1 1.5 1.2 3.6 3.6 2.8 2.6
School enrollment sizeLess than 300.................................... 2.9 2.9 0.8 0.7 3.3 2.7 1.5 1.5300 to 499......................................... 2.2 2.3 0.7 0.3 2.7 2.2 1.6 0.8500 to 999......................................... 1.2 1.3 0.4 0.2 1.4 1.4 0.8 0.61,000 or more ................................... 1.5 1.5 0.7 0.3 1.7 1.7 1.1 0.6
LocaleCentral city ....................................... 1.8 1.6 0.6 0.3 2.0 2.0 1.0 0.7Urban fringe/large town................... 1.4 1.4 0.4 0.3 1.5 1.4 1.1 0.6Rural/small town .............................. 1.9 1.9 0.4 0.2 1.7 1.6 1.2 0.6
RegionNortheast........................................... 2.0 1.9 0.6 0.5 2.9 2.7 1.6 1.1Midwest ............................................ 2.2 2.1 0.6 0.3 2.2 2.1 1.5 1.0South ................................................. 1.5 1.4 0.6 0.3 1.2 1.4 0.8 0.5West .................................................. 2.4 2.1 0.7 0.3 3.0 2.3 1.6 0.9
Percent minority enrollment inschool
5 percent or less................................ 2.1 2.2 0.5 0.4 2.0 1.9 1.3 0.96 to 20 percent.................................. 1.7 1.7 0.6 0.3 2.1 1.7 1.3 0.821 to 50 percent................................ 1.7 1.8 0.6 0.3 1.9 1.8 0.9 0.6More than 50 percent ....................... 1.8 1.6 0.7 0.3 2.2 1.8 1.1 0.8
Percent of students in schooleligible for free or reduced-priceschool lunch
Less than 15 percent ........................ 2.0 1.9 0.5 0.3 2.2 1.8 1.3 0.815 to 32 percent................................ 1.6 1.7 0.5 0.4 1.6 1.9 1.1 0.933 to 59 percent................................ 1.8 1.8 0.6 0.4 2.2 2.1 1.2 0.660 percent or more ........................... 2.0 1.9 0.6 0.2 2.2 1.9 1.1 0.7
Main teaching assignment
General elementary2......................... 1.4 1.5 0.4 0.2 1.7 1.6 0.9 0.6Math/science..................................... 1.6 1.5 0.7 0.3 1.9 2.0 0.9 0.6Other targeted academic subject ..... 1.3 1.3 0.5 0.3 1.6 1.6 1.1 0.6
Teaching experience3 or fewer years................................ 1.6 1.5 0.7 0.4 2.8 2.0 1.2 1.04 to 9 years ....................................... 1.6 1.7 0.8 0.4 2.0 2.1 1.4 0.910 to 19 years ................................... 1.9 1.9 0.7 0.3 2.0 2.0 1.2 0.720 or more years............................... 1.4 1.5 0.4 0.3 1.6 1.6 1.1 0.7
Teacher race/ethnicityWhite, non-Hispanic ........................ 1.0 1.0 0.3 0.2 1.1 1.1 0.7 0.5Black, non-Hispanic......................... 3.7 3.7 0.7 0.5 4.2 3.9 1.7 0.8Other ................................................. 3.5 3.4 1.1 0.5 4.0 3.3 2.1 1.5
SexMale .................................................. 1.4 1.5 0.6 0.4 1.5 1.5 1.3 0.7Female............................................... 1.1 1.1 0.4 0.2 1.2 1.1 0.7 0.5
1Targeted public school teachers were full-time public school teachers in grades 1 through 12 whose main teaching assignment was inEnglish/language arts, social studies/social sciences, foreign language, mathematics, or science, or who taught a self-contained classroom.2The category labeled general elementary includes all teachers of self-contained classrooms in the 1998 FRSS study, regardless of instructionallevel. Almost all (95 percent) of the self-contained classrooms were at the elementary school level.
SOURCE: U.S. Department of Education, National Center for Education Statistics, Fast Response Survey System, Teacher Survey onProfessional Development and Training, 1998.

B-59
Table B-16.—Percent of full-time public school teachers indicating how well prepared they feel todo various activities in the classroom, by selected school and teacher characteristics:1998
Implement new methods of teaching(e.g., cooperative learning)
Implement state or district curriculumand performance standards
School and teacher characteristicVery wellprepared
Moder-ately wellprepared
Some-what wellprepared
Notat all
prepared
Very wellprepared
Moder-ately wellprepared
Some-what wellprepared
Notat all
prepared
All targeted public schoolteachers2 .................................. 41 41 16 2 36 41 20 3
School instructional levelElementary school............................ 42 42 15 1 35 42 21 3Middle school................................... 45 40 14 2 41 41 16 2High school....................................... 38 40 19 3 38 37 20 5Combined ......................................... 26 47 21 6 27 45 25 3
School enrollment sizeLess than 300.................................... 36 41 21 2 32 39 26 3300 to 499......................................... 39 42 17 2 31 47 20 2500 to 999......................................... 42 41 15 2 38 40 19 31,000 or more ................................... 42 41 15 2 40 38 19 4
LocaleCentral city ....................................... 44 41 14 1 38 40 18 4Urban fringe/large town................... 43 40 15 2 38 41 19 2Rural/small town .............................. 35 43 20 2 32 42 22 3
RegionNortheast........................................... 44 38 15 2 32 42 22 5Midwest ............................................ 39 41 18 2 30 41 25 4South ................................................. 40 43 16 1 43 40 15 2West .................................................. 43 42 13 1 35 41 21 3
Percent minority enrollment inschool
5 percent or less................................ 35 43 19 3 30 42 24 46 to 20 percent.................................. 44 37 16 2 38 39 20 321 to 50 percent................................ 41 44 14 1 40 43 15 2More than 50 percent ....................... 43 40 15 1 37 39 21 3
Percent of students in schooleligible for free or reduced-priceschool lunch
Less than 15 percent ........................ 45 38 14 2 38 39 19 415 to 32 percent................................ 40 41 16 3 37 41 19 433 to 59 percent................................ 39 43 17 1 35 43 19 260 percent or more ........................... 39 42 17 1 35 40 22 3
Main teaching assignment
General elementary3......................... 42 42 15 1 35 42 21 3Math/science..................................... 34 43 21 2 35 42 20 3Other targeted academic subject ..... 44 39 15 2 40 39 17 4
Teaching experience3 or fewer years................................ 37 45 16 1 28 47 22 34 to 9 years ....................................... 44 42 13 1 36 41 20 310 to 19 years ................................... 41 41 15 2 37 41 19 320 or more years............................... 40 39 18 3 39 39 19 3
Teacher race/ethnicityWhite, non-Hispanic ........................ 40 41 17 2 35 41 20 3Black, non-Hispanic......................... 46 42 11 1 43 40 16 2Other ................................................. 43 42 13 2 44 36 17 3
SexMale .................................................. 34 40 22 3 34 41 21 4Female............................................... 43 41 14 1 37 41 19 3

B-60
Table B-16.—Percent of full-time public school teachers indicating how well prepared they feel todo various activities in the classroom, by selected school and teacher characteristics:1998 (continued)
Integrate educational technologyinto the grade or subject taught
Use student performance assessment techniques
School and teacher characteristicVery wellprepared
Moder-ately wellprepared
Some-what wellprepared
Notat all
prepared
Very wellprepared
Moder-ately wellprepared
Some-what wellprepared
Notat all
prepared
All targeted public schoolteachers2 .................................. 20 37 34 9 28 41 26 4
School instructional levelElementary school............................ 18 37 36 9 28 43 25 3Middle school................................... 23 38 31 8 30 42 23 5High school....................................... 24 36 31 10 29 36 29 6Combined ......................................... 23 38 31 8 20 44 30 5
School enrollment sizeLess than 300.................................... 20 34 35 11 27 38 29 6300 to 499......................................... 18 37 37 8 26 44 27 3500 to 999......................................... 19 39 34 9 27 44 25 41,000 or more ................................... 26 35 29 9 34 35 25 6
LocaleCentral city ....................................... 22 37 32 9 32 41 23 4Urban fringe/large town................... 20 39 32 9 29 42 25 4Rural/small town .............................. 18 36 38 8 24 41 30 5
RegionNortheast........................................... 22 36 35 8 29 37 29 5Midwest ............................................ 17 38 35 10 23 43 29 5South ................................................. 22 38 31 8 33 41 22 4West .................................................. 20 35 35 9 26 43 27 4
Percent minority enrollment inschool
5 percent or less................................ 17 36 37 9 24 42 30 46 to 20 percent.................................. 20 38 34 9 28 41 26 621 to 50 percent................................ 23 39 31 8 29 42 25 4More than 50 percent ....................... 22 36 33 9 33 40 22 4
Percent of students in schooleligible for free or reduced-priceschool lunch
Less than 15 percent ........................ 23 38 31 8 28 39 27 515 to 32 percent................................ 20 36 36 8 26 42 27 433 to 59 percent................................ 18 38 34 10 28 44 25 460 percent or more ........................... 20 37 33 9 32 40 24 3
Main teaching assignment
General elementary3......................... 18 37 36 9 29 44 25 3Math/science..................................... 25 38 30 8 24 41 30 6Other targeted academic subject ..... 21 37 33 9 31 38 25 5
Teaching experience3 or fewer years................................ 24 38 32 7 23 44 29 44 to 9 years ....................................... 23 41 30 7 27 44 26 310 to 19 years ................................... 19 36 35 10 29 40 26 520 or more years............................... 19 36 36 10 30 40 25 5
Teacher race/ethnicityWhite, non-Hispanic ........................ 19 37 34 9 27 42 27 4Black, non-Hispanic......................... 30 38 27 4 46 38 16 *Other ................................................. 23 33 31 13 33 40 20 7
SexMale .................................................. 24 37 30 8 23 40 31 6Female............................................... 19 37 35 9 30 42 24 4

B-61
Table B-16.—Percent of full-time public school teachers indicating how well prepared they feel todo various activities in the classroom, by selected school and teacher characteristics:1998 (continued)
Maintain order and discipline in the classroomAddress the needs of students with limited
English proficiency or from diverse culturalbackgrounds1
School and teacher characteristicVery wellprepared
Moder-ately wellprepared
Some-what wellprepared
Notat all
prepared
Very wellprepared
Moder-ately wellprepared
Some-what wellprepared
Notat all
prepared
All targeted public schoolteachers2 .................................. 71 24 4 1 20 33 30 17
School instructional levelElementary school............................ 71 24 3 1 21 35 28 16Middle school................................... 73 22 4 1 18 36 29 17High school....................................... 69 24 6 1 19 28 35 18Combined ......................................... 62 29 7 2 21 35 26 18
School enrollment sizeLess than 300.................................... 66 27 6 1 13 24 43 20300 to 499......................................... 68 27 5 1 18 28 32 21500 to 999......................................... 73 23 3 1 19 37 27 171,000 or more ................................... 72 22 4 1 24 33 30 13
LocaleCentral city ....................................... 71 23 5 1 24 36 29 11Urban fringe/large town................... 73 22 4 1 18 34 30 18Rural/small town .............................. 67 27 4 1 15 28 32 25
RegionNortheast........................................... 73 22 5 * 18 35 28 19Midwest ............................................ 70 23 5 2 15 27 32 26South ................................................. 69 27 4 1 19 32 32 17West .................................................. 73 23 3 * 26 39 27 9
Percent minority enrollment inschool
5 percent or less................................ 69 26 4 2 10 25 34 316 to 20 percent.................................. 74 22 3 * 15 33 33 1921 to 50 percent................................ 73 22 4 1 20 34 31 15More than 50 percent ....................... 68 26 6 1 27 37 25 11
Percent of students in schooleligible for free or reduced-priceschool lunch
Less than 15 percent ........................ 74 22 3 1 17 32 32 2015 to 32 percent................................ 72 23 4 1 17 31 34 1833 to 59 percent................................ 69 26 4 1 16 34 32 1760 percent or more ........................... 68 26 5 1 27 35 24 13
Main teaching assignment
General elementary3......................... 71 25 4 1 22 35 28 16Math/science..................................... 68 26 5 1 13 28 37 21Other targeted academic subject ..... 73 22 5 1 22 35 28 15
Teaching experience3 or fewer years................................ 54 36 9 1 18 35 34 134 to 9 years ....................................... 70 25 3 1 21 32 30 1710 to 19 years ................................... 72 24 3 1 22 37 28 1320 or more years............................... 76 20 3 1 18 31 30 21
Teacher race/ethnicityWhite, non-Hispanic ........................ 71 24 4 1 17 33 31 19Black, non-Hispanic......................... 69 25 5 1 26 33 35 7Other ................................................. 72 21 6 * 43 31 19 7
SexMale .................................................. 68 24 5 2 17 29 36 18Female............................................... 72 24 4 1 21 35 28 16

B-62
Table B-16.—Percent of full-time public school teachers indicating how well prepared they feel todo various activities in the classroom, by selected school and teacher characteristics:1998 (continued)
Address the needs of students with disabilities1
School and teacher characteristic Very wellprepared
Moderatelywell prepared
Somewhatwell prepared
Not at allprepared
All targeted public school teachers2 .......... 21 41 30 7
School instructional levelElementary school........................................... 22 42 30 7Middle school.................................................. 23 44 27 6High school...................................................... 19 36 35 10Combined ........................................................ 17 45 31 7
School enrollment sizeLess than 300................................................... 25 42 30 4300 to 499........................................................ 21 41 31 7500 to 999........................................................ 21 43 29 71,000 or more .................................................. 21 37 32 10
LocaleCentral city ...................................................... 21 37 33 9Urban fringe/large town.................................. 21 42 30 8Rural/small town ............................................. 22 44 29 5
RegionNortheast.......................................................... 22 38 32 9Midwest ........................................................... 19 44 30 6South ................................................................ 23 40 31 7West ................................................................. 19 43 30 8
Percent minority enrollment in school5 percent or less............................................... 20 45 29 56 to 20 percent................................................. 23 43 27 721 to 50 percent............................................... 23 38 32 7More than 50 percent ...................................... 18 37 34 11
Percent of students in school eligible for freeor reduced-price school lunch
Less than 15 percent ....................................... 22 43 28 615 to 32 percent............................................... 20 42 31 733 to 59 percent............................................... 22 41 31 660 percent or more .......................................... 20 37 33 10
Main teaching assignment
General elementary3........................................ 21 43 30 6Math/science.................................................... 19 40 31 10Other targeted academic subject .................... 22 40 31 8
Teaching experience3 or fewer years............................................... 15 41 34 94 to 9 years ...................................................... 21 39 33 810 to 19 years .................................................. 25 44 25 620 or more years.............................................. 21 40 32 7
Teacher race/ethnicityWhite, non-Hispanic ....................................... 21 41 31 7Black, non-Hispanic........................................ 24 37 31 8Other ................................................................ 21 40 30 9
SexMale ................................................................. 17 37 37 9Female.............................................................. 22 43 28 7
*Less than 0.5 percent.1Percents are based on teachers who teach students with these characteristics.2Targeted public school teachers were full-time public school teachers in grades 1 through 12 whose main teaching assignment was inEnglish/language arts, social studies/social sciences, foreign language, mathematics, or science, or who taught a self-contained classroom.3The category labeled general elementary includes all teachers of self-contained classrooms in the 1998 FRSS study, regardless of instructionallevel. Almost all (95 percent) of the self-contained classrooms were at the elementary school level.
NOTE: Percents are computed across each row for each type of professional development program, but may not sum to 100 because of rounding.
SOURCE: U.S. Department of Education, National Center for Education Statistics, Fast Response Survey System, Teacher Survey onProfessional Development and Training, 1998.

B-63
Table B-16a.—Standard errors of the percent of full-time public school teachers indicating howwell prepared they feel to do various activities in the classroom, by selected schooland teacher characteristics: 1998
Implement new methods of teaching(e.g., cooperative learning)
Implement state or district curriculumand performance standards
School and teacher characteristicVery wellprepared
Moder-ately wellprepared
Some-what wellprepared
Notat all
prepared
Very wellprepared
Moder-ately wellprepared
Some-what wellprepared
Notat all
prepared
All targeted public schoolteachers2 .................................. 0.8 0.8 0.7 0.3 0.9 1.1 1.0 0.3
School instructional levelElementary school............................ 1.3 1.2 1.1 0.4 1.4 1.7 1.4 0.6Middle school................................... 1.4 1.7 1.1 0.4 1.8 1.8 1.1 0.5High school....................................... 1.5 1.7 1.4 0.5 1.2 1.5 1.4 0.7Combined ......................................... 2.7 3.8 3.0 1.9 3.4 4.3 3.3 1.0
School enrollment sizeLess than 300.................................... 2.1 2.6 2.2 1.1 2.6 2.8 3.2 1.1300 to 499......................................... 1.8 2.0 1.7 0.5 2.0 2.4 2.0 0.6500 to 999......................................... 1.6 1.5 1.0 0.3 1.5 1.8 1.2 0.51,000 or more ................................... 1.5 1.7 1.3 0.5 1.5 1.4 1.4 0.6
LocaleCentral city ....................................... 1.6 1.6 1.2 0.3 1.5 2.0 1.3 0.6Urban fringe/large town................... 1.7 1.7 1.1 0.4 1.6 1.6 1.4 0.4Rural/small town .............................. 1.6 1.7 1.2 0.5 1.7 1.5 1.6 0.6
RegionNortheast........................................... 2.3 2.1 1.8 0.8 2.1 1.9 1.8 0.9Midwest ............................................ 1.5 1.9 1.6 0.5 1.7 2.3 2.0 0.9South ................................................. 1.6 1.6 1.2 0.4 1.4 1.7 1.5 0.4West .................................................. 2.3 2.6 1.8 0.4 1.7 1.9 1.7 0.6
Percent minority enrollment inschool
5 percent or less................................ 2.0 2.0 1.6 0.6 1.7 2.1 2.1 0.76 to 20 percent.................................. 2.1 1.7 1.4 0.5 1.9 2.0 1.5 0.621 to 50 percent................................ 1.8 1.8 1.3 0.3 1.9 2.1 1.5 0.6More than 50 percent ....................... 2.2 2.1 1.4 0.3 2.0 2.1 2.2 0.6
Percent of students in schooleligible for free or reduced-priceschool lunch
Less than 15 percent ........................ 2.2 1.7 1.3 0.8 1.9 1.6 1.7 0.815 to 32 percent................................ 1.9 2.3 1.4 0.6 1.6 1.8 1.5 0.633 to 59 percent................................ 1.8 2.1 1.4 0.4 1.8 2.5 2.0 0.560 percent or more ........................... 2.0 1.7 1.4 0.4 1.8 2.2 2.1 0.7
Main teaching assignmentGeneral elementary3......................... 1.3 1.4 1.1 0.4 1.3 1.7 1.5 0.6Math/science..................................... 1.6 1.6 1.2 0.5 1.5 1.5 1.5 0.6Other targeted academic subject ..... 1.4 1.4 1.0 0.4 1.2 1.6 1.1 0.6
Teaching experience3 or fewer years................................ 2.0 1.9 1.3 0.4 1.9 2.2 2.1 0.74 to 9 years ....................................... 1.8 2.0 1.2 0.3 1.7 1.9 2.2 0.710 to 19 years ................................... 1.9 1.9 1.4 0.5 2.0 2.0 1.8 0.620 or more years............................... 1.8 1.8 1.3 0.5 1.3 1.7 1.5 0.6
Teacher race/ethnicityWhite, non-Hispanic ........................ 1.0 1.0 0.7 0.3 0.9 1.0 1.1 0.4Black, non-Hispanic......................... 4.4 3.8 2.6 0.8 3.5 3.6 2.9 1.1Other ................................................. 3.7 3.4 2.5 0.9 3.5 3.5 2.5 1.2
SexMale .................................................. 1.7 1.5 1.3 0.6 1.5 1.7 1.6 0.6Female............................................... 1.0 1.1 0.8 0.3 1.1 1.3 1.1 0.4

B-64
Table B-16a.—Standard errors of the percent of full-time public school teachers indicating howwell prepared they feel to do various activities in the classroom, by selected schooland teacher characteristics: 1998 (continued)
Integrate educational technologyinto the grade or subject taught
Use student performance assessment techniques
School and teacher characteristicVery wellprepared
Moder-ately wellprepared
Some-what wellprepared
Notat all
prepared
Very wellprepared
Moder-ately wellprepared
Some-what wellprepared
Notat all
prepared
All targeted public schoolteachers2 .................................. 0.8 1.0 1.0 0.5 1.0 0.9 0.8 0.4
School instructional levelElementary school............................ 1.1 1.6 1.5 0.9 1.6 1.6 1.4 0.7Middle school................................... 1.5 1.8 1.6 1.1 1.7 1.8 1.8 0.7High school....................................... 1.2 1.1 1.3 0.7 1.6 1.6 1.2 0.7Combined ......................................... 3.2 3.9 3.1 1.9 3.0 4.4 3.0 1.6
School enrollment sizeLess than 300.................................... 2.4 3.3 3.5 2.6 2.4 2.9 3.0 1.7300 to 499......................................... 1.9 2.2 2.1 1.0 2.1 2.1 2.0 0.6500 to 999......................................... 1.2 1.5 1.3 0.8 1.5 1.6 1.3 0.61,000 or more ................................... 1.5 1.6 1.7 0.9 1.9 1.8 1.1 0.8
LocaleCentral city ....................................... 1.6 2.0 1.5 1.0 1.8 1.8 1.4 0.7Urban fringe/large town................... 1.4 1.4 1.8 0.9 1.5 1.5 1.4 0.8Rural/small town .............................. 1.2 1.6 1.6 1.2 1.3 1.7 1.7 0.7
RegionNortheast........................................... 1.8 2.0 1.7 1.1 2.1 2.2 1.5 1.1Midwest ............................................ 1.6 1.9 2.2 1.3 1.3 1.7 1.6 0.9South ................................................. 1.3 1.7 1.5 1.1 1.6 1.5 1.5 0.6West .................................................. 1.9 1.7 2.0 1.4 2.3 2.5 1.7 0.9
Percent minority enrollment inschool
5 percent or less................................ 1.5 1.7 1.7 1.3 1.6 2.0 1.5 0.76 to 20 percent.................................. 1.5 1.5 1.8 1.2 2.2 1.8 1.5 0.921 to 50 percent................................ 1.7 1.9 1.8 1.1 1.7 1.8 1.5 0.7More than 50 percent ....................... 1.6 2.1 1.8 1.0 2.2 2.1 1.8 0.8
Percent of students in schooleligible for free or reduced-priceschool lunch
Less than 15 percent ........................ 1.4 1.3 1.7 0.8 2.2 1.9 1.4 1.015 to 32 percent................................ 1.6 1.8 1.8 1.2 1.5 1.7 1.3 0.833 to 59 percent................................ 1.6 1.7 1.9 1.2 1.9 2.1 2.0 0.760 percent or more ........................... 1.4 1.9 1.6 1.0 1.9 2.1 2.0 0.7
Main teaching assignmentGeneral elementary3......................... 1.1 1.5 1.5 1.0 1.5 1.6 1.4 0.7Math/science..................................... 1.6 1.7 1.4 1.2 1.4 1.6 1.5 0.8Other targeted academic subject ..... 1.3 1.5 1.4 0.8 1.3 1.3 1.2 0.7
Teaching experience3 or fewer years................................ 1.7 1.9 2.2 1.0 1.7 2.3 2.1 0.74 to 9 years ....................................... 1.8 1.8 1.4 1.0 1.5 1.8 1.5 0.610 to 19 years ................................... 1.9 2.0 2.2 1.2 1.7 1.8 1.9 1.020 or more years............................... 1.4 1.6 1.7 0.9 1.5 1.4 1.2 0.7
Teacher race/ethnicityWhite, non-Hispanic ........................ 0.8 1.0 1.0 0.6 1.0 0.9 0.8 0.5Black, non-Hispanic......................... 3.1 3.5 3.6 1.2 3.8 3.4 2.5 0.2Other ................................................. 2.6 3.4 3.4 2.2 3.2 3.4 2.7 2.4
SexMale .................................................. 1.5 1.8 1.7 1.0 1.6 1.5 1.4 0.8Female............................................... 0.8 1.2 1.2 0.6 1.2 1.3 1.0 0.5

B-65
Table B-16a.—Standard errors of the percent of full-time public school teachers indicating howwell prepared they feel to do various activities in the classroom, by selected schooland teacher characteristics: 1998 (continued)
Maintain order and discipline in the classroomAddress the needs of students with limited
English proficiency or from diverse culturalbackgrounds1
School and teacher characteristicVery wellprepared
Moder-ately wellprepared
Some-what wellprepared
Notat all
prepared
Very wellprepared
Moder-ately wellprepared
Some-what wellprepared
Notat all
prepared
All targeted public schoolteachers2 .................................. 0.7 0.7 0.3 0.2 1.1 1.4 1.0 0.9
School instructional levelElementary school............................ 1.2 1.1 0.5 0.3 1.9 2.2 1.9 1.6Middle school................................... 1.3 1.3 0.7 0.4 1.6 2.0 2.6 1.8High school....................................... 1.3 1.4 0.8 0.3 1.7 1.8 2.0 1.6Combined ......................................... 4.1 3.7 1.8 0.9 6.0 5.4 4.4 4.0
School enrollment sizeLess than 300.................................... 2.9 2.5 1.4 0.8 3.1 3.6 4.2 3.9300 to 499......................................... 1.7 1.7 1.0 0.4 2.7 2.7 3.2 2.8500 to 999......................................... 1.4 1.2 0.5 0.3 1.5 2.2 2.0 1.41,000 or more ................................... 1.4 1.4 0.7 0.3 1.8 1.9 1.5 1.4
LocaleCentral city ....................................... 1.6 1.5 0.7 0.3 1.8 2.7 1.9 1.4Urban fringe/large town................... 1.2 1.1 0.5 0.3 1.6 1.9 2.0 1.5Rural/small town .............................. 1.7 1.5 0.7 0.3 2.2 2.7 2.2 2.3
RegionNortheast........................................... 1.7 1.7 0.9 0.2 2.4 2.9 2.7 2.0Midwest ............................................ 1.9 1.7 0.7 0.5 2.1 2.5 2.6 2.8South ................................................. 1.1 1.1 0.5 0.3 1.6 1.9 1.8 1.5West .................................................. 1.9 1.8 0.6 0.2 2.5 2.8 2.7 1.5
Percent minority enrollment inschool
5 percent or less................................ 1.6 1.3 0.7 0.4 2.0 2.9 3.2 3.26 to 20 percent.................................. 1.4 1.5 0.6 0.3 1.9 2.6 2.1 1.921 to 50 percent................................ 1.7 1.7 0.6 0.4 1.9 2.5 2.3 1.7More than 50 percent ....................... 1.6 1.6 0.8 0.3 2.4 2.4 1.9 1.3
Percent of students in schooleligible for free or reduced-priceschool lunch
Less than 15 percent ........................ 1.5 1.4 0.6 0.3 1.8 2.1 1.9 2.015 to 32 percent................................ 1.5 1.5 0.7 0.4 1.8 2.6 2.3 2.133 to 59 percent................................ 2.0 1.6 0.7 0.4 2.0 2.7 2.4 1.860 percent or more ........................... 1.4 1.4 0.9 0.3 2.4 2.2 2.1 1.6
Main teaching assignmentGeneral elementary3......................... 1.2 1.1 0.5 0.3 1.9 2.3 2.0 1.7Math/science..................................... 1.4 1.5 0.6 0.4 1.4 2.0 2.4 2.0Other targeted academic subject ..... 1.2 1.2 0.6 0.3 1.4 1.9 1.7 1.5
Teaching experience3 or fewer years................................ 2.0 1.8 1.3 0.5 1.9 2.7 2.7 1.64 to 9 years ....................................... 1.7 1.8 0.7 0.4 2.2 2.5 2.8 1.910 to 19 years ................................... 1.7 1.4 0.7 0.4 2.0 2.4 2.3 1.820 or more years............................... 1.2 1.2 0.6 0.2 1.8 2.1 1.8 1.7
Teacher race/ethnicityWhite, non-Hispanic ........................ 0.8 0.8 0.4 0.2 1.0 1.6 1.1 1.1Black, non-Hispanic......................... 3.6 3.5 1.4 0.8 4.2 5.2 4.7 2.4Other ................................................. 3.0 2.8 1.7 0.3 5.1 4.7 3.5 2.2
SexMale .................................................. 1.5 1.4 0.6 0.4 1.5 2.1 2.0 1.8Female............................................... 0.9 0.9 0.4 0.2 1.3 1.7 1.3 1.0

B-66
Table B-16a.—Standard errors of the percent of full-time public school teachers indicating howwell prepared they feel to do various activities in the classroom, by selected schooland teacher characteristics: 1998 (continued)
Address the needs of students with disabilities1
School and teacher characteristic Very wellprepared
Moderatelywell prepared
Somewhatwell prepared
Not at allprepared
All targeted public school teachers2 .......... 0.8 1.1 1.0 0.6
School instructional levelElementary school........................................... 1.5 1.9 1.6 1.0Middle school.................................................. 1.7 2.4 2.1 0.9High school...................................................... 1.4 1.9 1.7 1.1Combined ........................................................ 3.3 3.9 4.0 1.9
School enrollment sizeLess than 300................................................... 2.9 3.7 4.3 1.0300 to 499........................................................ 2.2 2.8 2.3 1.4500 to 999........................................................ 1.5 1.8 1.4 0.91,000 or more .................................................. 1.6 2.0 1.9 1.1
LocaleCentral city ...................................................... 1.7 2.2 2.1 1.3Urban fringe/large town.................................. 1.4 1.9 1.5 1.0Rural/small town ............................................. 1.5 2.3 1.9 0.8
RegionNortheast.......................................................... 2.1 2.7 2.7 1.4Midwest ........................................................... 1.5 2.2 2.2 1.1South ................................................................ 1.4 1.9 1.6 0.9West ................................................................. 2.2 2.4 2.3 1.5
Percent minority enrollment in school5 percent or less............................................... 1.9 2.1 2.0 0.86 to 20 percent................................................. 1.9 2.5 2.1 1.121 to 50 percent............................................... 2.0 2.3 2.2 1.2More than 50 percent ...................................... 1.9 2.4 2.4 1.4
Percent of students in school eligible for freeor reduced-price school lunch
Less than 15 percent ....................................... 1.7 2.4 2.1 0.915 to 32 percent............................................... 1.6 2.1 2.1 1.033 to 59 percent............................................... 1.8 2.2 2.6 1.060 percent or more .......................................... 1.6 2.1 2.1 1.5
Main teaching assignmentGeneral elementary3........................................ 1.6 1.9 1.6 0.9Math/science.................................................... 1.9 2.4 2.2 1.1Other targeted academic subject .................... 1.4 1.7 1.7 0.8
Teaching experience3 or fewer years............................................... 1.9 2.3 2.2 1.44 to 9 years ...................................................... 1.6 2.6 2.4 1.110 to 19 years .................................................. 2.1 2.5 2.1 1.120 or more years.............................................. 1.6 1.9 1.7 1.2
Teacher race/ethnicityWhite, non-Hispanic ....................................... 0.9 1.2 1.0 0.7Black, non-Hispanic........................................ 4.0 4.8 5.2 2.5Other ................................................................ 3.6 4.8 4.1 2.5
SexMale ................................................................. 1.5 2.4 2.1 1.2Female.............................................................. 1.1 1.3 1.2 0.7
1Estimates are based on teachers who teach students with these characteristics.2Targeted public school teachers were full-time public school teachers in grades 1 through 12 whose main teaching assignment was inEnglish/language arts, social studies/social sciences, foreign language, mathematics, or science, or who taught a self-contained classroom.3The category labeled general elementary includes all teachers of self-contained classrooms in the 1998 FRSS study, regardless of instructionallevel. Almost all (95 percent) of the self-contained classrooms were at the elementary school level.
SOURCE: U.S. Department of Education, National Center for Education Statistics, Fast Response Survey System, Teacher Survey onProfessional Development and Training, 1998.

C-1
Appendix C
Detailed Tables of Estimatesand
Tables of Standard Errorsfor the
1993-94 SASS Study

C-2

C-3
Table of Contents
Detailed Tables of Estimates and Tables of Standard Errorsfor the 1993-94 SASS Study
Table Page
C-1 Number and percent of full-time public school teachers, by selected school andteacher characteristics: 1993-94.............................................................................. 5
C-1a Standard errors of the number and percent of full-time public school teachers,by selected school and teacher characteristics: 1993-94 .......................................... 6
C-2 Average number of total years as a teacher and as a teacher in the current schoolfor full-time public school teachers, by selected school and teachercharacteristics: 1993-94.......................................................................................... 7
C-2a Standard errors of the average number of total years as a teacher and as a teacherin the current school for full-time public school teachers, by selected school andteacher characteristics: 1993-94.............................................................................. 8
C-3 Percent of full-time public school teachers who hold bachelor’s, master’s, anddoctorates, by selected school and teacher characteristics: 1993-94......................... 9
C-3a Standard errors of the percent of full-time public school teachers who holdbachelor’s, master’s, and doctorates, by selected school and teachercharacteristics: 1993-94.......................................................................................... 10
C-4 Percent of full-time public school teachers in general elementary classrooms withvarious types of teaching certificates in their state, by selected school and teachercharacteristics: 1993-94.......................................................................................... 11
C-4a Standard errors of the percent of full-time public school teachers in generalelementary classrooms with various types of teaching certificates in their state,by selected school and teacher characteristics: 1993-94 .......................................... 12
C-5 Percent of full-time public school teachers in departmentalized settings withvarious types of teaching certificates in their state in their main teachingassignment field, by selected school and teacher characteristics: 1993-94 ............... 13
C-5a Standard errors of the percent of full-time public school teachers indepartmentalized settings with various types of teaching certificates in their statein their main teaching assignment field, by selected school and teachercharacteristics: 1993-94.......................................................................................... 14
C-6 Percent of full-time public school teachers in departmentalized settings withvarious types of teaching certificates in their state in their secondary teachingassignment field, by selected school and teacher characteristics: 1993-94 ............... 15
C-6a Standard errors of the percent of full-time public school teachers indepartmentalized settings with various types of teaching certificates in their statein their secondary teaching assignment field, by selected school and teachercharacteristics: 1993-94.......................................................................................... 16

C-4
Table of Contents (continued)
Detailed Tables of Estimates and Tables of Standard Errorsfor the 1993-94 SASS Study (continued)
Table Page
C-7 Percent of full-time public school teachers in grades 7 through 12 who reportedhaving an undergraduate or graduate major or minor in their main teachingassignment field, by selected school and teacher characteristics: 1993-94 ............... 17
C-7a Standard errors of the percent of full-time public school teachers in grades 7through 12 who reported having an undergraduate or graduate major or minor intheir main teaching assignment field, by selected school and teachercharacteristics: 1993-94.......................................................................................... 18
C-8 Percent of full-time public school teachers in grades 9 through 12 who reportedhaving an undergraduate or graduate major or minor in their main teachingassignment field, by selected school and teacher characteristics: 1993-94 ............... 19
C-8a Standard errors of the percent of full-time public school teachers in grades 9through 12 who reported having an undergraduate or graduate major or minor intheir main teaching assignment field, by selected school and teachercharacteristics: 1993-94.......................................................................................... 20
C-9 Percent of full-time public school teachers who participated in in-service orprofessional development activities of various lengths that focused on varioustopics, by selected school and teacher characteristics: 1993-94 .............................. 21
C-9a Standard errors of the percent of full-time public school teachers whoparticipated in in-service or professional development activities of variouslengths that focused on various topics, by selected school and teachercharacteristics: 1993-94 ......................................................................................... 24
C-10 Percent of full-time public school teachers who participated in a formal inductionprogram during their first year of teaching and percent of full-time public schoolteachers who are currently a master or mentor teacher in a formal teacherinduction program, by selected school and teacher characteristics: 1993-94............ 27
C-10a Standard errors of the percent of full-time public school teachers whoparticipated in a formal induction program during their first year of teaching andpercent of full-time public school teachers who are currently a master or mentorteacher in a formal teacher induction program, by selected school and teachercharacteristics: 1993-94.......................................................................................... 28
C-11 Average class size for full-time public school teachers in general elementaryclassrooms and departmentalized settings, by selected school and teachercharacteristics: 1993-94.......................................................................................... 29
C-11a Standard errors of the average class size for full-time public school teachers ingeneral elementary classrooms and departmentalized settings, by selected schooland teacher characteristics: 1993-94 ....................................................................... 30
C-12 Percent of full-time public school teachers agreeing or disagreeing with selectedstatements about parent and school support for teachers, by selected school andteacher characteristics: 1993-94 ............................................................................. 31
C-12a Standard errors of the percent of full-time public school teachers agreeing ordisagreeing with selected statements about parent and school support forteachers, by selected school and teacher characteristics: 1993-94............................ 33

C-5
Table C-1.—Number and percent of full-time public school teachers, by selected school and teachercharacteristics: 1993-94
School and teacher characteristic Number Percent
All targeted public school teachers1 .............................................................................. 1,427,637 100
School instructional levelElementary school............................................................................................................... 751,896 53Middle school...................................................................................................................... 249,962 18High school.......................................................................................................................... 312,903 22Combined ............................................................................................................................ 112,875 8
School enrollment sizeLess than 300....................................................................................................................... 154,837 11300 to 499............................................................................................................................ 333,264 23500 to 999............................................................................................................................ 640,920 451,000 or more ...................................................................................................................... 298,617 21
LocaleCentral city .......................................................................................................................... 377,354 26Urban fringe/large town...................................................................................................... 454,223 32Rural/small town ................................................................................................................. 596,061 42
RegionNortheast.............................................................................................................................. 280,182 20Midwest ............................................................................................................................... 340,980 24South .................................................................................................................................... 539,154 38West ..................................................................................................................................... 267,322 19
Percent minority enrollment in school5 percent or less................................................................................................................... 496,511 356 to 20 percent..................................................................................................................... 333,358 2321 to 50 percent................................................................................................................... 296,121 21More than 50 percent .......................................................................................................... 301,648 21
Percent of students in school eligible for free or reduced-price school lunchLess than 15 percent ........................................................................................................... 374,373 2715 to 32 percent................................................................................................................... 368,534 2633 to 59 percent................................................................................................................... 358,508 2560 percent or more .............................................................................................................. 305,214 22
Main teaching assignmentGeneral elementary2............................................................................................................ 717,116 50Math/science........................................................................................................................ 300,811 21Other targeted academic subject ........................................................................................ 409,711 29
Teaching experience3 or fewer years................................................................................................................... 168,917 124 to 9 years .......................................................................................................................... 284,902 2010 to 19 years ...................................................................................................................... 420,281 2920 or more years.................................................................................................................. 553,537 39
Teacher race/ethnicityWhite, non-Hispanic ........................................................................................................... 1,246,618 87Black, non-Hispanic............................................................................................................ 101,743 7Other .................................................................................................................................... 79,276 6
SexMale ..................................................................................................................................... 352,900 25Female.................................................................................................................................. 1,074,737 75
1Targeted public school teachers were full-time public school teachers in grades 1 through 12 whose main teaching assignment was inEnglish/language arts, social studies/social sciences, foreign language, mathematics, science, or general elementary.2The category labeled general elementary includes teachers in the 1993-94 SASS study who indicated that their main teaching assignment wasgeneral elementary.
NOTE: Details may not sum to totals because of rounding. Percents are computed within each classification variable, but may not sum to 100because of rounding.
SOURCE: U.S. Department of Education, National Center for Education Statistics, 1993-94 Schools and Staffing Survey, unpublishedtabulations, 1998.

C-6
Table C-1a.—Standard errors of the number and percent of full-time public school teachers, byselected school and teacher characteristics: 1993-94
School and teacher characteristic Number Percent
All targeted public school teachers1 .............................................................................. 16,613 *
School instructional levelElementary school............................................................................................................... 14,474 0.7Middle school...................................................................................................................... 10,464 0.7High school.......................................................................................................................... 5,997 0.3Combined ............................................................................................................................ 3,197 0.2
School enrollment sizeLess than 300....................................................................................................................... 4,067 0.4300 to 499............................................................................................................................ 7,365 0.5500 to 999............................................................................................................................ 13,994 0.71,000 or more ...................................................................................................................... 9,285 0.5
LocaleCentral city .......................................................................................................................... 9,720 0.5Urban fringe/large town...................................................................................................... 11,275 0.6Rural/small town ................................................................................................................. 8,452 0.6
RegionNortheast.............................................................................................................................. 7,119 0.4Midwest ............................................................................................................................... 6,328 0.3South .................................................................................................................................... 7,700 0.5West ..................................................................................................................................... 6,332 0.4
Percent minority enrollment in school5 percent or less................................................................................................................... 9,543 0.66 to 20 percent..................................................................................................................... 9,533 0.721 to 50 percent................................................................................................................... 9,251 0.6More than 50 percent .......................................................................................................... 11,830 0.7
Percent of students in school eligible for free or reduced-price school lunchLess than 15 percent ........................................................................................................... 11,061 0.715 to 32 percent................................................................................................................... 11,657 0.833 to 59 percent................................................................................................................... 10,207 0.760 percent or more .............................................................................................................. 11,271 0.7
Main teaching assignmentGeneral elementary2............................................................................................................ 12,428 0.6Math/science........................................................................................................................ 5,492 0.3Other targeted academic subject ........................................................................................ 8,305 0.5
Teaching experience3 or fewer years...................................................................................................................4 to 9 years .......................................................................................................................... 4,742 0.310 to 19 years ...................................................................................................................... 5,661 0.320 or more years.................................................................................................................. 7,282 0.5
10,098 0.4Teacher race/ethnicity
White, non-Hispanic ........................................................................................................... 16,522 0.4Black, non-Hispanic............................................................................................................ 3,892 0.3Other .................................................................................................................................... 4,277 0.3
SexMale ..................................................................................................................................... 7,485 0.4Female.................................................................................................................................. 14,266 0.4
*Estimate of standard error is not derived because it is based on a statistic estimated at 0 or 100 percent.1Targeted public school teachers were full-time public school teachers in grades 1 through 12 whose main teaching assignment was inEnglish/language arts, social studies/social sciences, foreign language, mathematics, science, or general elementary.2The category labeled general elementary includes teachers in the 1993-94 SASS study who indicated that their main teaching assignment wasgeneral elementary.
SOURCE: U.S. Department of Education, National Center for Education Statistics, 1993-94 Schools and Staffing Survey, unpublishedtabulations, 1998.

C-7
Table C-2.—Average number of total years as a teacher and as a teacher in the current school forfull-time public school teachers, by selected school and teacher characteristics:1993-94
School and teacher characteristic Total years as a teacher Years as a teacher in thecurrent school
All targeted public school teachers1 .............................................................................. 16 10
School instructional levelElementary school............................................................................................................... 15 10Middle school...................................................................................................................... 15 9High school.......................................................................................................................... 17 12Combined ............................................................................................................................ 16 11
School enrollment sizeLess than 300....................................................................................................................... 16 11300 to 499............................................................................................................................ 16 11500 to 999............................................................................................................................ 15 101,000 or more ...................................................................................................................... 16 10
LocaleCentral city .......................................................................................................................... 15 9Urban fringe/large town...................................................................................................... 16 10Rural/small town ................................................................................................................. 15 11
RegionNortheast.............................................................................................................................. 18 13Midwest ............................................................................................................................... 17 12South .................................................................................................................................... 14 9West ..................................................................................................................................... 15 9
Percent minority enrollment in school5 percent or less................................................................................................................... 16 126 to 20 percent..................................................................................................................... 16 1021 to 50 percent................................................................................................................... 16 9More than 50 percent .......................................................................................................... 14 9
Percent of students in school eligible for free or reduced-price school lunchLess than 15 percent ........................................................................................................... 17 1115 to 32 percent................................................................................................................... 16 1033 to 59 percent................................................................................................................... 15 1060 percent or more .............................................................................................................. 14 9
Main teaching assignmentGeneral elementary2............................................................................................................ 15 10Math/science........................................................................................................................ 16 11Other targeted academic subject ........................................................................................ 16 11
Teaching experience3 or fewer years................................................................................................................... 2 24 to 9 years .......................................................................................................................... 6 510 to 19 years ...................................................................................................................... 15 920 or more years.................................................................................................................. 26 17
Teacher race/ethnicityWhite, non-Hispanic ........................................................................................................... 16 10Black, non-Hispanic............................................................................................................ 17 10Other .................................................................................................................................... 13 8
SexMale ..................................................................................................................................... 17 12Female.................................................................................................................................. 15 10
1Targeted public school teachers were full-time public school teachers in grades 1 through 12 whose main teaching assignment was inEnglish/language arts, social studies/social sciences, foreign language, mathematics, science, or general elementary.2The category labeled general elementary includes teachers in the 1993-94 SASS study who indicated that their main teaching assignment wasgeneral elementary.
NOTE: Details may not sum to totals because of rounding. Percents are computed within each classification variable, but may not sum to 100because of rounding.
SOURCE: U.S. Department of Education, National Center for Education Statistics, 1993-94 Schools and Staffing Survey, unpublishedtabulations, 1998.
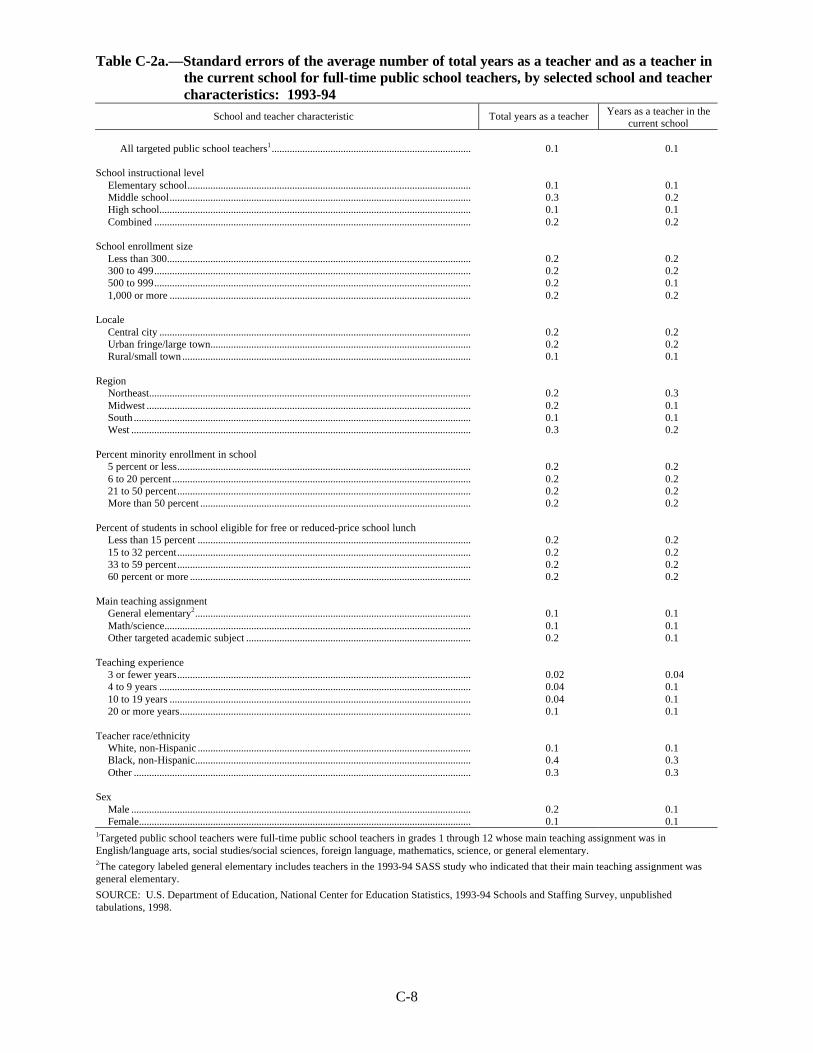
C-8
Table C-2a.—Standard errors of the average number of total years as a teacher and as a teacher inthe current school for full-time public school teachers, by selected school and teachercharacteristics: 1993-94
School and teacher characteristic Total years as a teacher Years as a teacher in thecurrent school
All targeted public school teachers1 .............................................................................. 0.1 0.1
School instructional levelElementary school............................................................................................................... 0.1 0.1Middle school...................................................................................................................... 0.3 0.2High school.......................................................................................................................... 0.1 0.1Combined ............................................................................................................................ 0.2 0.2
School enrollment sizeLess than 300....................................................................................................................... 0.2 0.2300 to 499............................................................................................................................ 0.2 0.2500 to 999............................................................................................................................ 0.2 0.11,000 or more ...................................................................................................................... 0.2 0.2
LocaleCentral city .......................................................................................................................... 0.2 0.2Urban fringe/large town...................................................................................................... 0.2 0.2Rural/small town ................................................................................................................. 0.1 0.1
RegionNortheast.............................................................................................................................. 0.2 0.3Midwest ............................................................................................................................... 0.2 0.1South .................................................................................................................................... 0.1 0.1West ..................................................................................................................................... 0.3 0.2
Percent minority enrollment in school5 percent or less................................................................................................................... 0.2 0.26 to 20 percent..................................................................................................................... 0.2 0.221 to 50 percent................................................................................................................... 0.2 0.2More than 50 percent .......................................................................................................... 0.2 0.2
Percent of students in school eligible for free or reduced-price school lunchLess than 15 percent ........................................................................................................... 0.2 0.215 to 32 percent................................................................................................................... 0.2 0.233 to 59 percent................................................................................................................... 0.2 0.260 percent or more .............................................................................................................. 0.2 0.2
Main teaching assignmentGeneral elementary2............................................................................................................ 0.1 0.1Math/science........................................................................................................................ 0.1 0.1Other targeted academic subject ........................................................................................ 0.2 0.1
Teaching experience3 or fewer years................................................................................................................... 0.02 0.044 to 9 years .......................................................................................................................... 0.04 0.110 to 19 years ...................................................................................................................... 0.04 0.120 or more years.................................................................................................................. 0.1 0.1
Teacher race/ethnicityWhite, non-Hispanic ........................................................................................................... 0.1 0.1Black, non-Hispanic............................................................................................................ 0.4 0.3Other .................................................................................................................................... 0.3 0.3
SexMale ..................................................................................................................................... 0.2 0.1Female.................................................................................................................................. 0.1 0.1
1Targeted public school teachers were full-time public school teachers in grades 1 through 12 whose main teaching assignment was inEnglish/language arts, social studies/social sciences, foreign language, mathematics, science, or general elementary.2The category labeled general elementary includes teachers in the 1993-94 SASS study who indicated that their main teaching assignment wasgeneral elementary.
SOURCE: U.S. Department of Education, National Center for Education Statistics, 1993-94 Schools and Staffing Survey, unpublishedtabulations, 1998.

C-9
Table C-3.—Percent of full-time public school teachers who hold bachelor’s, master’s, anddoctorates, by selected school and teacher characteristics: 1993-94
School and teacher characteristic Bachelor’s degree Master’s degree Doctorate degree
All targeted public school teachers1 ............................................................... 100** 46 1
School instructional levelElementary school................................................................................................ 99 42 *Middle school....................................................................................................... 99 46 1High school........................................................................................................... 100** 55 1Combined ............................................................................................................. 100** 47 1
School enrollment sizeLess than 300........................................................................................................ 99 36 1300 to 499............................................................................................................. 100** 45 *500 to 999............................................................................................................. 99 45 *1,000 or more ....................................................................................................... 100** 54 1
LocaleCentral city ........................................................................................................... 100** 49 1Urban fringe/large town....................................................................................... 99 49 1Rural/small town .................................................................................................. 100** 41 *
RegionNortheast............................................................................................................... 100** 60 1Midwest ................................................................................................................ 100** 47 *South ..................................................................................................................... 99 42 1West ...................................................................................................................... 99 37 1
Percent minority enrollment in school5 percent or less.................................................................................................... 100** 47 *6 to 20 percent...................................................................................................... 99 48 121 to 50 percent.................................................................................................... 100** 44 1More than 50 percent ........................................................................................... 99 43 1
Percent of students in school eligible for free or reduced-price school lunchLess than 15 percent ............................................................................................ 100** 53 115 to 32 percent.................................................................................................... 100** 46 *33 to 59 percent.................................................................................................... 99 41 160 percent or more ............................................................................................... 99 41 1
Main teaching assignmentGeneral elementary2............................................................................................. 99 41 *Math/science......................................................................................................... 100** 50 1Other targeted academic subject ......................................................................... 100** 51 1
Teaching experience3 or fewer years.................................................................................................... 99 15 14 to 9 years ........................................................................................................... 100** 30 *10 to 19 years ....................................................................................................... 99 49 120 or more years................................................................................................... 99 61 1
Teacher race/ethnicityWhite, non-Hispanic ............................................................................................ 100** 46 1Black, non-Hispanic............................................................................................. 99 52 1Other ..................................................................................................................... 100** 36 2
SexMale ...................................................................................................................... 100** 53 1Female................................................................................................................... 99 43 *
*Less than 0.5 percent.
**Rounds to 100 percent for presentation in the tables.1Targeted public school teachers were full-time public school teachers in grades 1 through 12 whose main teaching assignment was inEnglish/language arts, social studies/social sciences, foreign language, mathematics, science, or general elementary.2The category labeled general elementary includes teachers in the 1993-94 SASS study who indicated that their main teaching assignment wasgeneral elementary.
SOURCE: U.S. Department of Education, National Center for Education Statistics, 1993-94 Schools and Staffing Survey, unpublishedtabulations, 1998.

C-10
Table C-3a.—Standard errors of the percent of full-time public school teachers who holdbachelor’s, master’s, and doctorates, by selected school and teacher characteristics:1993-94
School and teacher characteristic Bachelor’s degree Master’s degree Doctorate degree
All targeted public school teachers1 ............................................................... 0.1 0.5 0.1
School instructional levelElementary school................................................................................................ 0.1 0.7 0.1Middle school....................................................................................................... 0.2 1.4 0.2High school........................................................................................................... 0.1 0.7 0.1Combined ............................................................................................................. 0.1 0.8 0.2
School enrollment sizeLess than 300........................................................................................................ 0.2 1.3 0.3300 to 499............................................................................................................. 0.1 1.1 0.2500 to 999............................................................................................................. 0.2 0.8 0.11,000 or more ....................................................................................................... 0.1 0.9 0.1
LocaleCentral city ........................................................................................................... 0.1 1.2 0.2Urban fringe/large town....................................................................................... 0.2 0.9 0.1Rural/small town .................................................................................................. 0.1 0.7 0.1
RegionNortheast............................................................................................................... 0.1 1.1 0.2Midwest ................................................................................................................ 0.1 1.2 0.04South ..................................................................................................................... 0.1 0.7 0.2West ...................................................................................................................... 0.3 1.2 0.1
Percent minority enrollment in school5 percent or less.................................................................................................... 0.1 1.0 0.16 to 20 percent...................................................................................................... 0.2 1.1 0.121 to 50 percent.................................................................................................... 0.1 1.0 0.2More than 50 percent ........................................................................................... 0.1 1.3 0.2
Percent of students in school eligible for free or reduced-price school lunchLess than 15 percent ............................................................................................ 0.1 1.0 0.115 to 32 percent.................................................................................................... 0.1 0.9 0.133 to 59 percent.................................................................................................... 0.1 1.0 0.160 percent or more ............................................................................................... 0.2 1.2 0.2
Main teaching assignmentGeneral elementary2............................................................................................. 0.1 0.7 0.1Math/science......................................................................................................... 0.1 0.8 0.1Other targeted academic subject ......................................................................... 0.1 0.9 0.2
Teaching experience3 or fewer years.................................................................................................... 0.3 1.0 0.34 to 9 years ........................................................................................................... 0.1 1.1 0.210 to 19 years ....................................................................................................... 0.1 1.1 0.120 or more years................................................................................................... 0.1 0.9 0.1
Teacher race/ethnicityWhite, non-Hispanic ............................................................................................ 0.1 0.6 0.1Black, non-Hispanic............................................................................................. 0.3 1.8 0.2Other ..................................................................................................................... 0.2 1.7 0.5
SexMale ...................................................................................................................... 0.1 0.9 0.2Female................................................................................................................... 0.1 0.6 0.1
1Targeted public school teachers were full-time public school teachers in grades 1 through 12 whose main teaching assignment was inEnglish/language arts, social studies/social sciences, foreign language, mathematics, science, or general elementary.2The category labeled general elementary includes teachers in the 1993-94 SASS study who indicated that their main teaching assignment wasgeneral elementary.
SOURCE: U.S. Department of Education, National Center for Education Statistics, 1993-94 Schools and Staffing Survey, unpublishedtabulations, 1998.

C-11
Table C-4.—Percent of full-time public school teachers in general elementary classrooms withvarious types of teaching certificates in their state, by selected school and teachercharacteristics: 1993-94
School and teachercharacteristic
Regular orstandard statecertificate, or
advancedprofessionalcertificate
Provisional orother type of
certificategiven while
participating inan “alternative
certificationprogram”
Probationarycertificate
Temporarycertificate
Emergencycertificate or
waiverNo certificate
All targeted public schoolteachers1 ........................... 94 2 2 1 * 1
School instructional level2
Elementary school..................... 94 2 2 1 * 1
School enrollment sizeLess than 300............................. 97 1 1 1 * 1300 to 499.................................. 94 2 2 * * 1500 to 999.................................. 93 1 2 1 * 11,000 or more ............................ 86 1 3 5 1 4
LocaleCentral city ................................ 90 2 2 2 * 2Urban fringe/large town............ 96 1 2 1 * 1Rural/small town ....................... 95 2 1 1 * 1
RegionNortheast.................................... 91 2 3 1 * 2Midwest ..................................... 95 3 1 * 0 1South .......................................... 95 1 2 1 * 1West ........................................... 92 * 2 2 1 2
Percent minority enrollment inschool
5 percent or less......................... 95 1 1 1 * 16 to 20 percent........................... 95 2 2 1 0 *21 to 50 percent......................... 94 1 2 1 * 1More than 50 percent ................ 90 2 2 1 1 2
Percent of students in schooleligible for free or reduced-price school lunch
Less than 15 percent ................. 96 1 1 1 0 *15 to 32 percent......................... 96 1 1 * * 133 to 59 percent......................... 93 2 2 1 * 160 percent or more .................... 91 2 2 1 1 2
Teaching experience3 or fewer years......................... 73 5 9 5 2 34 to 9 years ................................ 92 2 2 1 * 110 to 19 years ............................ 97 1 * * 0 120 or more years........................ 99 * * * * 1
Teacher race/ethnicityWhite, non-Hispanic ................. 95 1 2 1 * 1Black, non-Hispanic.................. 87 4 0 1 1 4Other .......................................... 89 2 4 1 1 3
SexMale ........................................... 91 2 3 1 * 3Female........................................ 94 2 1 1 * 1
*Less than 0.5 percent.1Targeted public school teachers were full-time public school teachers in grades 1 through 12 whose main teaching assignment was inEnglish/language arts, social studies/social sciences, foreign language, mathematics, science, or general elementary.2Data for general elementary classrooms are reported for elementary schools only. Data for all school levels are included in the totals and inanalyses by other school and teacher characteristics.
NOTE: Teachers referred to here as teachers in general elementary classrooms include teachers in the 1993-94 SASS study who indicated thattheir main teaching assignment was general elementary. Percents are computed across each row, but may not sum to 100 because of rounding.Zeros indicate that no teacher in the sample gave the indicated response.
SOURCE: U.S. Department of Education, National Center for Education Statistics, 1993-94 Schools and Staffing Survey, unpublishedtabulations, 1998.
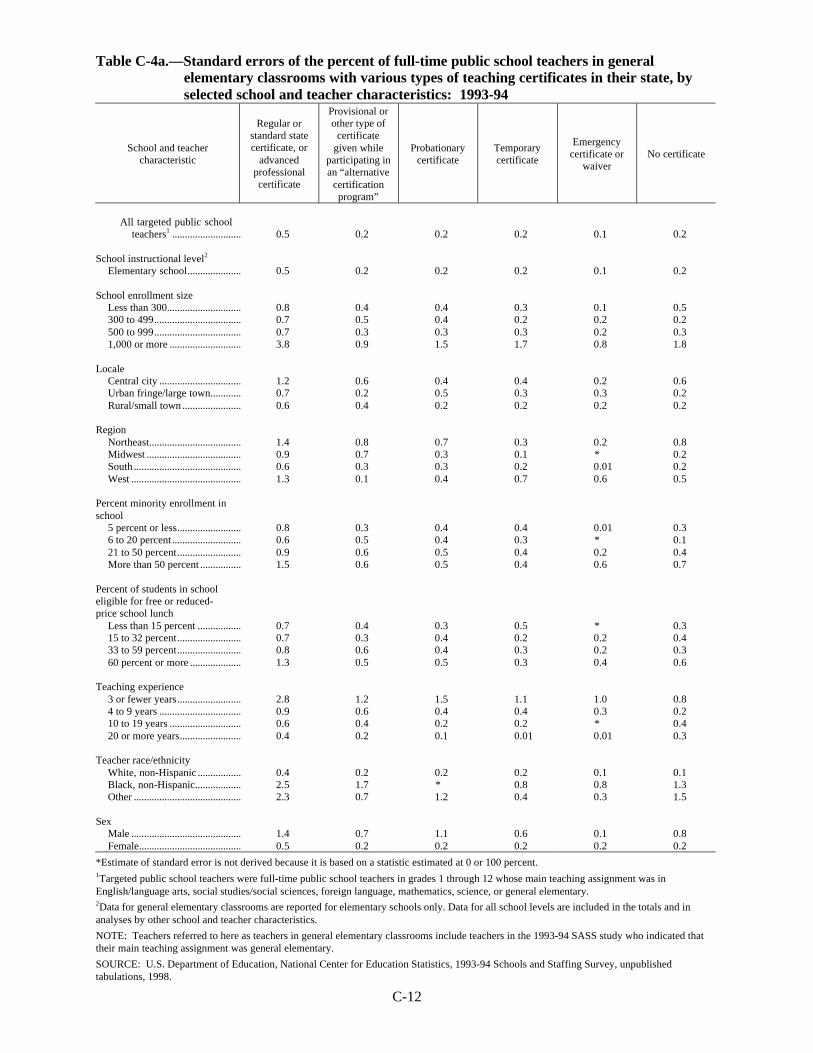
C-12
Table C-4a.—Standard errors of the percent of full-time public school teachers in generalelementary classrooms with various types of teaching certificates in their state, byselected school and teacher characteristics: 1993-94
School and teachercharacteristic
Regular orstandard statecertificate, or
advancedprofessionalcertificate
Provisional orother type of
certificategiven while
participating inan “alternative
certificationprogram”
Probationarycertificate
Temporarycertificate
Emergencycertificate or
waiverNo certificate
All targeted public schoolteachers1 ........................... 0.5 0.2 0.2 0.2 0.1 0.2
School instructional level2
Elementary school..................... 0.5 0.2 0.2 0.2 0.1 0.2
School enrollment sizeLess than 300............................. 0.8 0.4 0.4 0.3 0.1 0.5300 to 499.................................. 0.7 0.5 0.4 0.2 0.2 0.2500 to 999.................................. 0.7 0.3 0.3 0.3 0.2 0.31,000 or more ............................ 3.8 0.9 1.5 1.7 0.8 1.8
LocaleCentral city ................................ 1.2 0.6 0.4 0.4 0.2 0.6Urban fringe/large town............ 0.7 0.2 0.5 0.3 0.3 0.2Rural/small town ....................... 0.6 0.4 0.2 0.2 0.2 0.2
RegionNortheast.................................... 1.4 0.8 0.7 0.3 0.2 0.8Midwest ..................................... 0.9 0.7 0.3 0.1 * 0.2South .......................................... 0.6 0.3 0.3 0.2 0.01 0.2West ........................................... 1.3 0.1 0.4 0.7 0.6 0.5
Percent minority enrollment inschool
5 percent or less......................... 0.8 0.3 0.4 0.4 0.01 0.36 to 20 percent........................... 0.6 0.5 0.4 0.3 * 0.121 to 50 percent......................... 0.9 0.6 0.5 0.4 0.2 0.4More than 50 percent ................ 1.5 0.6 0.5 0.4 0.6 0.7
Percent of students in schooleligible for free or reduced-price school lunch
Less than 15 percent ................. 0.7 0.4 0.3 0.5 * 0.315 to 32 percent......................... 0.7 0.3 0.4 0.2 0.2 0.433 to 59 percent......................... 0.8 0.6 0.4 0.3 0.2 0.360 percent or more .................... 1.3 0.5 0.5 0.3 0.4 0.6
Teaching experience3 or fewer years......................... 2.8 1.2 1.5 1.1 1.0 0.84 to 9 years ................................ 0.9 0.6 0.4 0.4 0.3 0.210 to 19 years ............................ 0.6 0.4 0.2 0.2 * 0.420 or more years........................ 0.4 0.2 0.1 0.01 0.01 0.3
Teacher race/ethnicityWhite, non-Hispanic ................. 0.4 0.2 0.2 0.2 0.1 0.1Black, non-Hispanic.................. 2.5 1.7 * 0.8 0.8 1.3Other .......................................... 2.3 0.7 1.2 0.4 0.3 1.5
SexMale ........................................... 1.4 0.7 1.1 0.6 0.1 0.8Female........................................ 0.5 0.2 0.2 0.2 0.2 0.2
*Estimate of standard error is not derived because it is based on a statistic estimated at 0 or 100 percent.1Targeted public school teachers were full-time public school teachers in grades 1 through 12 whose main teaching assignment was inEnglish/language arts, social studies/social sciences, foreign language, mathematics, science, or general elementary.2Data for general elementary classrooms are reported for elementary schools only. Data for all school levels are included in the totals and inanalyses by other school and teacher characteristics.
NOTE: Teachers referred to here as teachers in general elementary classrooms include teachers in the 1993-94 SASS study who indicated thattheir main teaching assignment was general elementary.
SOURCE: U.S. Department of Education, National Center for Education Statistics, 1993-94 Schools and Staffing Survey, unpublishedtabulations, 1998.

C-13
Table C-5.—Percent of full-time public school teachers in departmentalized settings with various types ofteaching certificates in their state in their main teaching assignment field, by selected schooland teacher characteristics: 1993-94
School and teacher characteristic
Regular orstandard statecertificate, or
advancedprofessionalcertificate
Provisional orother type of
certificategiven while
participating inan “alternative
certificationprogram”
Probationarycertificate
Temporarycertificate
Emergencycertificate or
waiverNo certificate
All targeted public school teachers1 ...... 90 2 2 1 * 4
School instructional level2
Middle school.............................................. 87 2 2 1 * 7High school.................................................. 93 2 2 1 * 2Combined .................................................... 92 2 2 1 * 3
School enrollment sizeLess than 300............................................... 91 2 2 1 * 4300 to 499.................................................... 88 3 2 1 * 6500 to 999.................................................... 89 2 1 1 * 51,000 or more .............................................. 91 2 2 1 1 3
LocaleCentral city .................................................. 88 2 1 1 1 6Urban fringe/large town.............................. 91 2 2 1 * 4Rural/small town ......................................... 90 2 2 1 * 4
RegionNortheast...................................................... 89 3 2 2 * 4Midwest ....................................................... 92 3 1 1 * 3South ............................................................ 90 2 2 1 * 5West ............................................................. 88 1 2 2 1 5
Percent minority enrollment in school5 percent or less........................................... 91 2 2 1 * 46 to 20 percent............................................. 90 2 2 1 * 421 to 50 percent........................................... 91 1 1 1 * 4More than 50 percent .................................. 87 3 1 1 1 7
Percent of students in school eligible forfree or reduced-price school lunch
Less than 15 percent ................................... 91 2 2 1 * 315 to 32 percent........................................... 91 1 2 1 * 333 to 59 percent........................................... 89 2 2 1 1 660 percent or more ...................................... 86 3 1 1 * 8
Main teaching assignmentMath/science................................................ 88 2 1 1 1 5Other targeted academic subject ................ 91 2 2 1 * 4
Teaching experience3 or fewer years........................................... 66 8 11 4 2 94 to 9 years .................................................. 86 3 1 2 * 510 to 19 years .............................................. 94 1 * * * 420 or more years.......................................... 96 * 0 * 0 3
Teacher race/ethnicityWhite, non-Hispanic ................................... 91 2 2 1 * 4Black, non-Hispanic.................................... 82 5 * 3 1 8Other ............................................................ 83 2 2 2 1 7
SexMale ............................................................. 92 2 1 1 1 3Female.......................................................... 89 2 2 1 * 6
*Less than 0.5 percent.1Targeted public school teachers were full-time public school teachers in grades 1 through 12 whose main teaching assignment was in English/language arts,social studies/social sciences, foreign language, mathematics, science, or general elementary.2Data for departmentalized settings are not reported for elementary schools. Data for all school levels are included in the totals and in analyses by otherschool and teacher characteristics.
NOTE: Teachers referred to here as teachers in departmentalized settings include teachers in the 1993-94 SASS study who indicated that their mainteaching assignment was in English/language arts, social studies/social sciences, foreign language, mathematics, or science. Percents are computed acrosseach row, but may not sum to 100 because of rounding. Zeros indicate that no teacher in the sample gave the indicated response.
SOURCE: U.S. Department of Education, National Center for Education Statistics, 1993-94 Schools and Staffing Survey, unpublished tabulations, 1998.
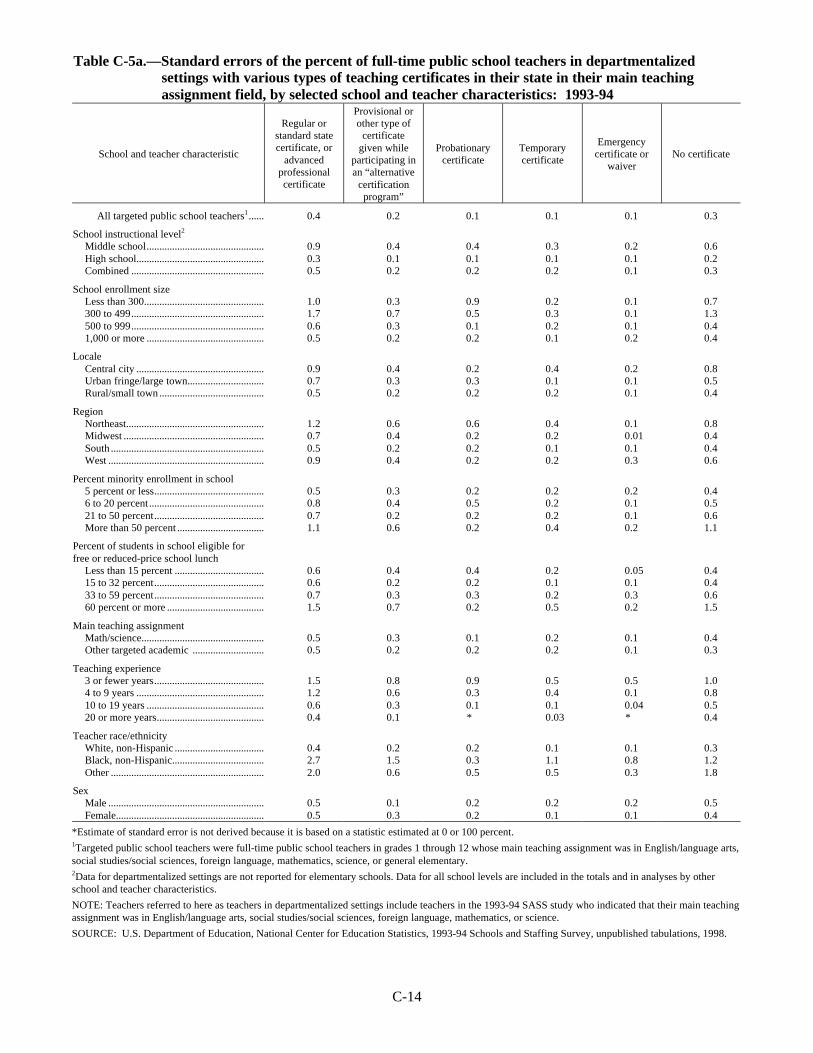
C-14
Table C-5a.—Standard errors of the percent of full-time public school teachers in departmentalizedsettings with various types of teaching certificates in their state in their main teachingassignment field, by selected school and teacher characteristics: 1993-94
School and teacher characteristic
Regular orstandard statecertificate, or
advancedprofessionalcertificate
Provisional orother type of
certificategiven while
participating inan “alternative
certificationprogram”
Probationarycertificate
Temporarycertificate
Emergencycertificate or
waiverNo certificate
All targeted public school teachers1 ...... 0.4 0.2 0.1 0.1 0.1 0.3
School instructional level2
Middle school.............................................. 0.9 0.4 0.4 0.3 0.2 0.6High school.................................................. 0.3 0.1 0.1 0.1 0.1 0.2Combined .................................................... 0.5 0.2 0.2 0.2 0.1 0.3
School enrollment sizeLess than 300............................................... 1.0 0.3 0.9 0.2 0.1 0.7300 to 499.................................................... 1.7 0.7 0.5 0.3 0.1 1.3500 to 999.................................................... 0.6 0.3 0.1 0.2 0.1 0.41,000 or more .............................................. 0.5 0.2 0.2 0.1 0.2 0.4
LocaleCentral city .................................................. 0.9 0.4 0.2 0.4 0.2 0.8Urban fringe/large town.............................. 0.7 0.3 0.3 0.1 0.1 0.5Rural/small town ......................................... 0.5 0.2 0.2 0.2 0.1 0.4
RegionNortheast...................................................... 1.2 0.6 0.6 0.4 0.1 0.8Midwest ....................................................... 0.7 0.4 0.2 0.2 0.01 0.4South ............................................................ 0.5 0.2 0.2 0.1 0.1 0.4West ............................................................. 0.9 0.4 0.2 0.2 0.3 0.6
Percent minority enrollment in school5 percent or less........................................... 0.5 0.3 0.2 0.2 0.2 0.46 to 20 percent............................................. 0.8 0.4 0.5 0.2 0.1 0.521 to 50 percent........................................... 0.7 0.2 0.2 0.2 0.1 0.6More than 50 percent .................................. 1.1 0.6 0.2 0.4 0.2 1.1
Percent of students in school eligible forfree or reduced-price school lunch
Less than 15 percent ................................... 0.6 0.4 0.4 0.2 0.05 0.415 to 32 percent........................................... 0.6 0.2 0.2 0.1 0.1 0.433 to 59 percent........................................... 0.7 0.3 0.3 0.2 0.3 0.660 percent or more ...................................... 1.5 0.7 0.2 0.5 0.2 1.5
Main teaching assignmentMath/science................................................ 0.5 0.3 0.1 0.2 0.1 0.4Other targeted academic ............................ 0.5 0.2 0.2 0.2 0.1 0.3
Teaching experience3 or fewer years........................................... 1.5 0.8 0.9 0.5 0.5 1.04 to 9 years .................................................. 1.2 0.6 0.3 0.4 0.1 0.810 to 19 years .............................................. 0.6 0.3 0.1 0.1 0.04 0.520 or more years.......................................... 0.4 0.1 * 0.03 * 0.4
Teacher race/ethnicityWhite, non-Hispanic ................................... 0.4 0.2 0.2 0.1 0.1 0.3Black, non-Hispanic.................................... 2.7 1.5 0.3 1.1 0.8 1.2Other ............................................................ 2.0 0.6 0.5 0.5 0.3 1.8
SexMale ............................................................. 0.5 0.1 0.2 0.2 0.2 0.5Female.......................................................... 0.5 0.3 0.2 0.1 0.1 0.4
*Estimate of standard error is not derived because it is based on a statistic estimated at 0 or 100 percent.1Targeted public school teachers were full-time public school teachers in grades 1 through 12 whose main teaching assignment was in English/language arts,social studies/social sciences, foreign language, mathematics, science, or general elementary.2Data for departmentalized settings are not reported for elementary schools. Data for all school levels are included in the totals and in analyses by otherschool and teacher characteristics.
NOTE: Teachers referred to here as teachers in departmentalized settings include teachers in the 1993-94 SASS study who indicated that their main teachingassignment was in English/language arts, social studies/social sciences, foreign language, mathematics, or science.
SOURCE: U.S. Department of Education, National Center for Education Statistics, 1993-94 Schools and Staffing Survey, unpublished tabulations, 1998.
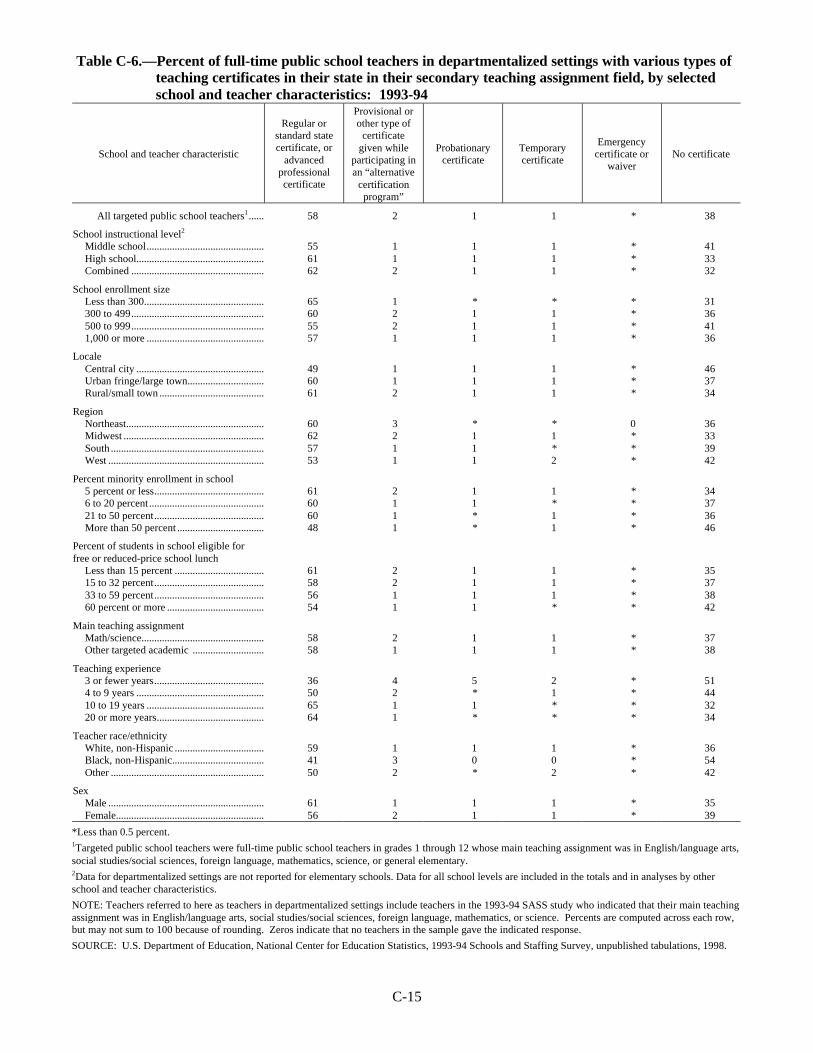
C-15
Table C-6.—Percent of full-time public school teachers in departmentalized settings with various types ofteaching certificates in their state in their secondary teaching assignment field, by selectedschool and teacher characteristics: 1993-94
School and teacher characteristic
Regular orstandard statecertificate, or
advancedprofessionalcertificate
Provisional orother type of
certificategiven while
participating inan “alternative
certificationprogram”
Probationarycertificate
Temporarycertificate
Emergencycertificate or
waiverNo certificate
All targeted public school teachers1 ...... 58 2 1 1 * 38
School instructional level2
Middle school.............................................. 55 1 1 1 * 41High school.................................................. 61 1 1 1 * 33Combined .................................................... 62 2 1 1 * 32
School enrollment sizeLess than 300............................................... 65 1 * * * 31300 to 499.................................................... 60 2 1 1 * 36500 to 999.................................................... 55 2 1 1 * 411,000 or more .............................................. 57 1 1 1 * 36
LocaleCentral city .................................................. 49 1 1 1 * 46Urban fringe/large town.............................. 60 1 1 1 * 37Rural/small town ......................................... 61 2 1 1 * 34
RegionNortheast...................................................... 60 3 * * 0 36Midwest ....................................................... 62 2 1 1 * 33South ............................................................ 57 1 1 * * 39West ............................................................. 53 1 1 2 * 42
Percent minority enrollment in school5 percent or less........................................... 61 2 1 1 * 346 to 20 percent............................................. 60 1 1 * * 3721 to 50 percent........................................... 60 1 * 1 * 36More than 50 percent .................................. 48 1 * 1 * 46
Percent of students in school eligible forfree or reduced-price school lunch
Less than 15 percent ................................... 61 2 1 1 * 3515 to 32 percent........................................... 58 2 1 1 * 3733 to 59 percent........................................... 56 1 1 1 * 3860 percent or more ...................................... 54 1 1 * * 42
Main teaching assignmentMath/science................................................ 58 2 1 1 * 37Other targeted academic ............................ 58 1 1 1 * 38
Teaching experience3 or fewer years........................................... 36 4 5 2 * 514 to 9 years .................................................. 50 2 * 1 * 4410 to 19 years .............................................. 65 1 1 * * 3220 or more years.......................................... 64 1 * * * 34
Teacher race/ethnicityWhite, non-Hispanic ................................... 59 1 1 1 * 36Black, non-Hispanic.................................... 41 3 0 0 * 54Other ............................................................ 50 2 * 2 * 42
SexMale ............................................................. 61 1 1 1 * 35Female.......................................................... 56 2 1 1 * 39
*Less than 0.5 percent.1Targeted public school teachers were full-time public school teachers in grades 1 through 12 whose main teaching assignment was in English/language arts,social studies/social sciences, foreign language, mathematics, science, or general elementary.2Data for departmentalized settings are not reported for elementary schools. Data for all school levels are included in the totals and in analyses by otherschool and teacher characteristics.
NOTE: Teachers referred to here as teachers in departmentalized settings include teachers in the 1993-94 SASS study who indicated that their main teachingassignment was in English/language arts, social studies/social sciences, foreign language, mathematics, or science. Percents are computed across each row,but may not sum to 100 because of rounding. Zeros indicate that no teachers in the sample gave the indicated response.
SOURCE: U.S. Department of Education, National Center for Education Statistics, 1993-94 Schools and Staffing Survey, unpublished tabulations, 1998.

C-16
Table C-6a.—Standard errors of the percent of full-time public school teachers in departmentalizedsettings with various types of teaching certificates in their state in their secondary teachingassignment field, by selected school and teacher characteristics: 1993-94
School and teacher characteristic
Regular orstandard statecertificate, or
advancedprofessionalcertificate
Provisional orother type of
certificategiven while
participating inan “alternative
certificationprogram”
Probationarycertificate
Temporarycertificate
Emergencycertificate or
waiverNo certificate
All targeted public school teachers1 ...... 0.9 0.2 0.2 0.1 0.05 0.9
School instructional level2
Middle school.............................................. 2.0 0.3 0.5 0.1 0.1 2.0High school.................................................. 1.1 0.3 0.2 0.2 0.1 1.0Combined .................................................... 1.4 0.3 0.3 0.2 0.1 1.2
School enrollment sizeLess than 300............................................... 2.2 0.3 0.3 0.1 0.1 2.4300 to 499.................................................... 2.1 0.7 0.5 0.3 0.1 2.1500 to 999.................................................... 1.7 0.5 0.3 0.3 0.03 1.71,000 or more .............................................. 1.5 0.3 0.3 0.2 0.2 1.3
LocaleCentral city .................................................. 2.2 0.3 0.4 0.4 0.1 2.0Urban fringe/large town.............................. 1.6 0.1 0.2 0.2 0.1 1.5Rural/small town ......................................... 1.3 0.5 0.3 0.1 0.03 1.4
RegionNortheast...................................................... 2.1 1.0 0.2 0.1 * 2.1Midwest ....................................................... 1.7 0.5 0.5 0.4 0.05 1.5South ............................................................ 1.5 0.2 0.3 0.2 0.04 1.6West ............................................................. 2.2 0.3 0.2 0.3 0.2 2.2
Percent minority enrollment in school5 percent or less........................................... 1.6 0.4 0.4 0.1 0.1 1.66 to 20 percent............................................. 1.9 0.7 0.4 0.1 0.01 2.021 to 50 percent........................................... 2.2 0.2 0.1 0.6 0.1 2.2More than 50 percent .................................. 2.4 0.4 0.2 0.3 0.2 2.4
Percent of students in school eligible forfree or reduced-price school lunch
Less than 15 percent ................................... 1.7 0.6 0.3 0.2 0.1 1.615 to 32 percent........................................... 1.3 0.5 0.5 0.2 0.1 1.333 to 59 percent........................................... 2.7 0.4 0.3 0.5 0.1 2.660 percent or more ...................................... 2.1 0.3 0.3 0.1 0.02 2.1
Main teaching assignmentMath/science................................................ 1.2 0.4 0.1 0.1 0.3 1.3Other targeted academic subject ................ 1.3 0.3 0.4 0.2 0.1 1.3
Teaching experience3 or fewer years........................................... 2.6 0.9 1.4 0.5 0.1 3.24 to 9 years .................................................. 2.2 0.8 0.2 0.5 0.1 2.210 to 19 years .............................................. 1.8 0.2 0.3 0.2 0.1 1.320 or more years.......................................... 1.2 0.3 0.02 0.1 0.1 1.3
Teacher race/ethnicityWhite, non-Hispanic ................................... 0.9 0.3 0.2 0.2 0.05 0.9Black, non-Hispanic.................................... 4.4 1.3 * * 0.2 4.8Other ............................................................ 5.3 1.0 0.1 0.8 0.1 5.3
SexMale ............................................................. 1.3 0.2 0.2 0.2 0.1 1.4Female.......................................................... 1.3 0.4 0.3 0.2 0.02 1.2
*Estimate of standard error is not derived because it is based on a statistic estimated at 0 or 100 percent.1Targeted public school teachers were full-time public school teachers in grades 1 through 12 whose main teaching assignment was in English/language arts,social studies/social sciences, foreign language, mathematics, science, or general elementary.2Data for departmentalized settings are not reported for elementary schools. Data for all school levels are included in the totals and in analyses by otherschool and teacher characteristics.
NOTE: Teachers referred to here as teachers in departmentalized settings include teachers in the 1993-94 SASS study who indicated that their main teachingassignment was in English/language arts, social studies/social sciences, foreign language, mathematics, or science.
SOURCE: U.S. Department of Education, National Center for Education Statistics, 1993-94 Schools and Staffing Survey, unpublished tabulations, 1998.

C-17
Table C-7.—Percent of full-time public school teachers in grades 7 through 12 who reported havingan undergraduate or graduate major or minor in their main teaching assignment field,by selected school and teacher characteristics: 1993-94
School and teacher characteristicEnglish/
language artsForeignlanguage
Social studies/social science
Mathematics Science
All targeted public school teachers1 .......... 78 93 87 77 82
School enrollment sizeLess than 300................................................... 72 92 81 70 83300 to 499........................................................ 77 90 86 73 75500 to 999........................................................ 73 93 83 71 801,000 or more .................................................. 84 94 92 85 86
LocaleCentral city ...................................................... 78 96 89 76 83Urban fringe/large town.................................. 79 93 89 77 79Rural/small town ............................................. 77 92 85 78 84
RegionNortheast.......................................................... 80 97 88 82 86Midwest ........................................................... 78 95 88 80 85South ................................................................ 77 92 86 78 78West ................................................................. 76 87 87 64 84
Percent minority enrollment in school5 percent or less............................................... 78 93 88 79 826 to 20 percent................................................. 78 94 87 79 8921 to 50 percent............................................... 81 90 85 77 79More than 50 percent ...................................... 74 96 88 71 77
Percent of students in school eligible for freeor reduced-price school lunch
Less than 15 percent ....................................... 84 94 89 81 8615 to 32 percent............................................... 78 92 89 79 8433 to 59 percent............................................... 73 92 84 70 7660 percent or more .......................................... 70 95 81 70 75
Teaching experience3 or fewer years............................................... 81 87 91 80 784 to 9 years ...................................................... 76 92 82 72 8110 to 19 years .................................................. 73 96 86 76 8120 or more years.............................................. 82 94 88 80 85
Teacher race/ethnicityWhite, non-Hispanic ....................................... 79 94 87 78 83Black, non-Hispanic........................................ 69 # 85 77 73Other ................................................................ 69 88 88 63 83
SexMale ................................................................. 82 89 90 79 87Female.............................................................. 77 94 81 75 76
#Too few cases for a reliable estimate.1Targeted public school teachers were full-time public school teachers in grades 1 through 12 whose main teaching assignment was inEnglish/language arts, social studies/social sciences, foreign language, mathematics, science, or general elementary.
SOURCE: U.S. Department of Education, National Center for Education Statistics, 1993-94 Schools and Staffing Survey, unpublishedtabulations, 1998.

C-18
Table C-7a.—Standard errors of the percent of full-time public school teachers in grades 7 through12 who reported having an undergraduate or graduate major or minor in their mainteaching assignment field, by selected school and teacher characteristics: 1993-94
School and teacher characteristicEnglish/
language artsForeignlanguage
Social studies/social science
Mathematics Science
All targeted public school teachers1 .......... 1.0 0.8 0.9 0.9 1.1
School enrollment sizeLess than 300................................................... 3.2 2.7 2.9 3.2 2.6300 to 499........................................................ 2.4 3.6 2.1 3.3 3.1500 to 999........................................................ 1.8 1.1 1.8 1.8 2.21,000 or more .................................................. 1.2 1.0 0.9 1.1 1.4
LocaleCentral city ...................................................... 2.1 1.2 1.4 2.2 1.9Urban fringe/large town.................................. 1.9 1.2 1.5 2.2 2.3Rural/small town ............................................. 1.4 1.3 1.5 1.6 1.4
RegionNortheast.......................................................... 2.2 0.6 2.5 2.3 2.2Midwest ........................................................... 1.7 1.0 1.2 2.3 1.7South ................................................................ 1.6 1.5 1.7 1.7 2.0West ................................................................. 2.6 2.5 1.6 2.3 2.1
Percent minority enrollment in school5 percent or less............................................... 1.6 1.1 1.3 1.6 1.86 to 20 percent................................................. 1.6 1.2 1.9 2.7 1.421 to 50 percent............................................... 1.6 2.4 2.3 2.6 2.2More than 50 percent ...................................... 2.6 1.4 1.8 2.8 2.8
Percent of students in school eligible for freeor reduced-price school lunch
Less than 15 percent ....................................... 1.3 0.9 1.4 1.9 1.415 to 32 percent............................................... 1.6 1.7 1.5 2.2 1.233 to 59 percent............................................... 2.1 2.7 2.6 2.6 2.660 percent or more .......................................... 2.9 1.9 3.2 3.8 3.9
Teaching experience3 or fewer years............................................... 3.3 3.3 1.3 2.5 3.44 to 9 years ...................................................... 2.6 1.5 2.4 2.7 2.210 to 19 years .................................................. 2.1 0.9 1.7 2.1 1.920 or more years.............................................. 1.2 1.0 1.4 1.6 1.6
Teacher race/ethnicityWhite, non-Hispanic ....................................... 1.0 0.9 1.0 1.0 1.2Black, non-Hispanic........................................ 4.5 # 2.6 3.7 4.7Other ................................................................ 6.1 2.3 2.5 6.5 3.7
SexMale ................................................................. 1.5 2.1 1.0 1.4 0.9Female.............................................................. 1.2 0.8 1.6 1.5 2.0
#Too few cases for a reliable estimate.1Targeted public school teachers were full-time public school teachers in grades 1 through 12 whose main teaching assignment was inEnglish/language arts, social studies/social sciences, foreign language, mathematics, science, or general elementary.
SOURCE: U.S. Department of Education, National Center for Education Statistics, 1993-94 Schools and Staffing Survey, unpublishedtabulations, 1998.
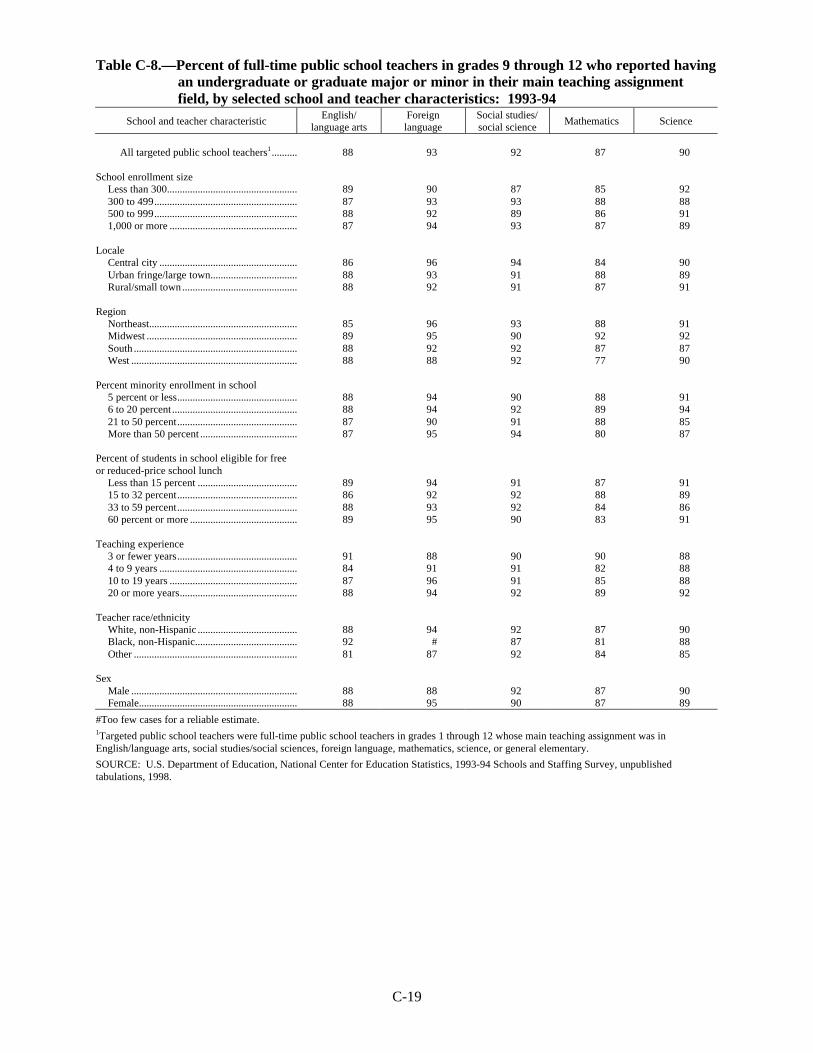
C-19
Table C-8.—Percent of full-time public school teachers in grades 9 through 12 who reported havingan undergraduate or graduate major or minor in their main teaching assignmentfield, by selected school and teacher characteristics: 1993-94
School and teacher characteristicEnglish/
language artsForeignlanguage
Social studies/social science
Mathematics Science
All targeted public school teachers1 .......... 88 93 92 87 90
School enrollment sizeLess than 300................................................... 89 90 87 85 92300 to 499........................................................ 87 93 93 88 88500 to 999........................................................ 88 92 89 86 911,000 or more .................................................. 87 94 93 87 89
LocaleCentral city ...................................................... 86 96 94 84 90Urban fringe/large town.................................. 88 93 91 88 89Rural/small town ............................................. 88 92 91 87 91
RegionNortheast.......................................................... 85 96 93 88 91Midwest ........................................................... 89 95 90 92 92South ................................................................ 88 92 92 87 87West ................................................................. 88 88 92 77 90
Percent minority enrollment in school5 percent or less............................................... 88 94 90 88 916 to 20 percent................................................. 88 94 92 89 9421 to 50 percent............................................... 87 90 91 88 85More than 50 percent ...................................... 87 95 94 80 87
Percent of students in school eligible for freeor reduced-price school lunch
Less than 15 percent ....................................... 89 94 91 87 9115 to 32 percent............................................... 86 92 92 88 8933 to 59 percent............................................... 88 93 92 84 8660 percent or more .......................................... 89 95 90 83 91
Teaching experience3 or fewer years............................................... 91 88 90 90 884 to 9 years ...................................................... 84 91 91 82 8810 to 19 years .................................................. 87 96 91 85 8820 or more years.............................................. 88 94 92 89 92
Teacher race/ethnicityWhite, non-Hispanic ....................................... 88 94 92 87 90Black, non-Hispanic........................................ 92 # 87 81 88Other ................................................................ 81 87 92 84 85
SexMale ................................................................. 88 88 92 87 90Female.............................................................. 88 95 90 87 89
#Too few cases for a reliable estimate.1Targeted public school teachers were full-time public school teachers in grades 1 through 12 whose main teaching assignment was inEnglish/language arts, social studies/social sciences, foreign language, mathematics, science, or general elementary.
SOURCE: U.S. Department of Education, National Center for Education Statistics, 1993-94 Schools and Staffing Survey, unpublishedtabulations, 1998.

C-20
Table C-8a.—Standard errors of the percent of full-time public school teachers in grades 9 through12 who reported having an undergraduate or graduate major or minor in their mainteaching assignment field, by selected school and teacher characteristics: 1993-94
School and teacher characteristicEnglish/
language artsForeignlanguage
Social studies/social science
Mathematics Science
All targeted public school teachers1 .......... 0.7 0.7 0.7 0.7 0.6
School enrollment sizeLess than 300................................................... 2.1 2.9 2.2 2.2 1.7300 to 499........................................................ 1.9 2.9 1.1 2.3 1.9500 to 999........................................................ 1.2 1.4 1.3 1.3 1.21,000 or more .................................................. 0.9 1.0 0.7 1.0 0.9
LocaleCentral city ...................................................... 1.9 1.4 1.1 1.7 1.4Urban fringe/large town.................................. 1.2 1.3 1.0 1.2 1.4Rural/small town ............................................. 1.1 1.2 1.0 0.9 0.8
RegionNortheast.......................................................... 1.7 0.7 1.5 1.5 1.5Midwest ........................................................... 1.2 1.2 1.2 1.0 1.0South ................................................................ 0.8 1.6 1.2 1.2 1.2West ................................................................. 1.7 2.5 1.4 1.9 1.2
Percent minority enrollment in school5 percent or less............................................... 1.2 1.0 1.0 1.0 1.06 to 20 percent................................................. 1.6 1.2 1.4 1.5 0.921 to 50 percent............................................... 1.1 2.6 1.4 1.6 1.9More than 50 percent ...................................... 1.9 1.7 0.9 2.2 1.7
Percent of students in school eligible for freeor reduced-price school lunch
Less than 15 percent ....................................... 0.9 0.9 1.0 1.2 1.015 to 32 percent............................................... 1.2 1.9 1.0 1.1 1.233 to 59 percent............................................... 1.4 1.8 1.5 2.4 1.860 percent or more .......................................... 1.9 1.5 1.6 1.8 1.5
Teaching experience3 or fewer years............................................... 1.7 2.8 1.7 1.8 1.64 to 9 years ...................................................... 2.1 1.6 1.8 1.9 1.510 to 19 years .................................................. 1.2 1.0 1.3 1.4 1.420 or more years.............................................. 1.1 1.1 0.8 1.1 1.0
Teacher race/ethnicityWhite, non-Hispanic ....................................... 0.7 0.8 0.7 0.8 0.7Black, non-Hispanic........................................ 1.7 # 3.3 3.6 2.9Other ................................................................ 3.8 2.3 3.0 2.5 4.7
SexMale ................................................................. 1.1 2.2 0.8 0.9 0.8Female.............................................................. 0.8 0.7 1.0 1.2 1.0
#Too few cases for a reliable estimate.1Targeted public school teachers were full-time public school teachers in grades 1 through 12 whose main teaching assignment was inEnglish/language arts, social studies/social sciences, foreign language, mathematics, science, or general elementary.
SOURCE: U.S. Department of Education, National Center for Education Statistics, 1993-94 Schools and Staffing Survey, unpublishedtabulations, 1998.

C-21
Table C-9.—Percent of full-time public school teachers who participated in in-service orprofessional development activities of various lengths that focused on various topics,by selected school and teacher characteristics: 1993-94
Uses of educational technology for instruction Methods of teaching your subject field
Total hours spent Total hours spentSchool and teacher characteristic
0 1 to 8 9 to 32More
than 320 1 to 8 9 to 32
Morethan 32
All targeted public schoolteachers1 .................................. 49 36 12 3 33 38 20 8
School instructional levelElementary school............................ 49 35 13 3 26 41 24 9Middle school................................... 49 37 11 3 38 36 19 7High school....................................... 48 37 12 3 44 34 15 6Combined ......................................... 52 35 10 3 44 36 13 7
School enrollment sizeLess than 300.................................... 53 35 10 2 37 38 19 7300 to 499......................................... 50 35 12 3 32 37 22 9500 to 999......................................... 48 37 12 3 31 39 22 81,000 or more ................................... 48 36 12 4 40 36 17 8
LocaleCentral city ....................................... 48 36 13 3 28 40 23 10Urban fringe/large town................... 47 38 12 3 33 38 20 8Rural/small town .............................. 51 35 11 3 37 37 19 7
RegionNortheast........................................... 57 30 11 2 37 37 18 7Midwest ............................................ 52 36 9 3 39 38 17 6South ................................................. 45 38 14 4 30 40 22 8West .................................................. 46 37 13 4 30 35 24 12
Percent minority enrollment inschool
5 percent or less................................ 51 35 11 3 37 37 19 76 to 20 percent.................................. 45 39 13 3 35 37 20 821 to 50 percent................................ 48 36 12 4 32 40 20 8More than 50 percent ....................... 51 34 12 3 28 39 24 9
Percent of students in schooleligible for free or reduced-priceschool lunch
Less than 15 percent ........................ 46 38 13 3 36 37 19 715 to 32 percent................................ 47 38 11 3 36 38 18 833 to 59 percent................................ 51 34 12 3 31 38 22 860 percent or more ........................... 52 32 13 3 30 40 23 8
Main teaching assignmentGeneral elementary2......................... 50 36 12 3 26 41 24 9Math/science..................................... 43 39 14 4 42 33 17 8Other targeted academic subject ..... 53 34 11 3 40 37 17 7
Teaching experience3 or fewer years................................ 54 32 11 2 32 36 22 104 to 9 years ....................................... 47 37 13 3 27 40 22 1110 to 19 years ................................... 47 37 12 4 31 38 22 820 or more years............................... 49 36 12 3 38 37 18 6
Teacher race/ethnicityWhite, non-Hispanic ........................ 50 36 12 3 34 38 20 8Black, non-Hispanic......................... 44 38 13 4 27 43 23 7Other ................................................. 47 34 14 4 28 35 23 13
SexMale .................................................. 48 37 12 3 45 35 15 6Female............................................... 49 35 12 3 30 39 22 9

C-22
Table C-9.—Percent of full-time public school teachers who participated in in-service orprofessional development activities of various lengths that focused on various topics,by selected school and teacher characteristics: 1993-94 (continued)
In-depth study in your subject field Student assessment
Total hours spent Total hours spentSchool and teacher characteristic
0 1 to 8 9 to 32More
than 320 1 to 8 9 to 32
Morethan 32
All targeted public schoolteachers1 .................................. 71 14 9 6 45 43 10 3
School instructional levelElementary school............................ 68 16 10 6 40 47 10 3Middle school................................... 73 14 8 6 46 41 9 3High school....................................... 74 12 8 7 53 36 8 2Combined ......................................... 79 11 6 5 54 36 8 2
School enrollment sizeLess than 300.................................... 73 12 10 5 47 41 10 3300 to 499......................................... 71 15 9 5 43 45 9 2500 to 999......................................... 71 15 9 6 43 44 10 31,000 or more ................................... 72 13 8 7 51 37 9 3
LocaleCentral city ....................................... 66 17 10 7 43 43 10 3Urban fringe/large town................... 71 13 9 6 43 44 10 3Rural/small town .............................. 74 13 8 5 48 41 9 2
RegionNortheast........................................... 73 13 8 5 47 42 9 3Midwest ............................................ 75 13 7 5 50 40 8 3South ................................................. 70 16 9 5 45 43 9 2West .................................................. 67 13 11 9 38 45 13 4
Percent minority enrollment inschool
5 percent or less................................ 74 13 8 5 47 41 9 36 to 20 percent.................................. 72 14 10 5 45 43 10 321 to 50 percent................................ 70 14 9 6 46 43 9 2More than 50 percent ....................... 67 16 10 7 42 45 10 3
Percent of students in schooleligible for free or reduced-priceschool lunch
Less than 15 percent ........................ 72 13 9 6 47 42 9 215 to 32 percent................................ 73 13 8 6 47 42 9 233 to 59 percent................................ 72 14 9 5 43 43 10 460 percent or more ........................... 69 15 9 7 43 44 10 2
Main teaching assignmentGeneral elementary2......................... 69 16 10 5 40 47 10 3Math/science..................................... 74 12 8 6 51 38 8 3Other targeted academic subject ..... 72 13 8 6 49 38 10 3
Teaching experience3 or fewer years................................ 73 13 8 6 44 43 11 24 to 9 years ....................................... 70 13 11 7 43 42 11 310 to 19 years ................................... 70 15 9 6 45 43 10 320 or more years............................... 73 15 8 5 47 42 8 2
Teacher race/ethnicityWhite, non-Hispanic ........................ 72 14 9 6 46 42 9 3Black, non-Hispanic......................... 66 21 9 5 37 47 13 3Other ................................................. 65 15 10 10 43 42 12 3
SexMale .................................................. 75 13 7 5 52 38 8 2Female............................................... 70 15 10 6 43 44 10 3
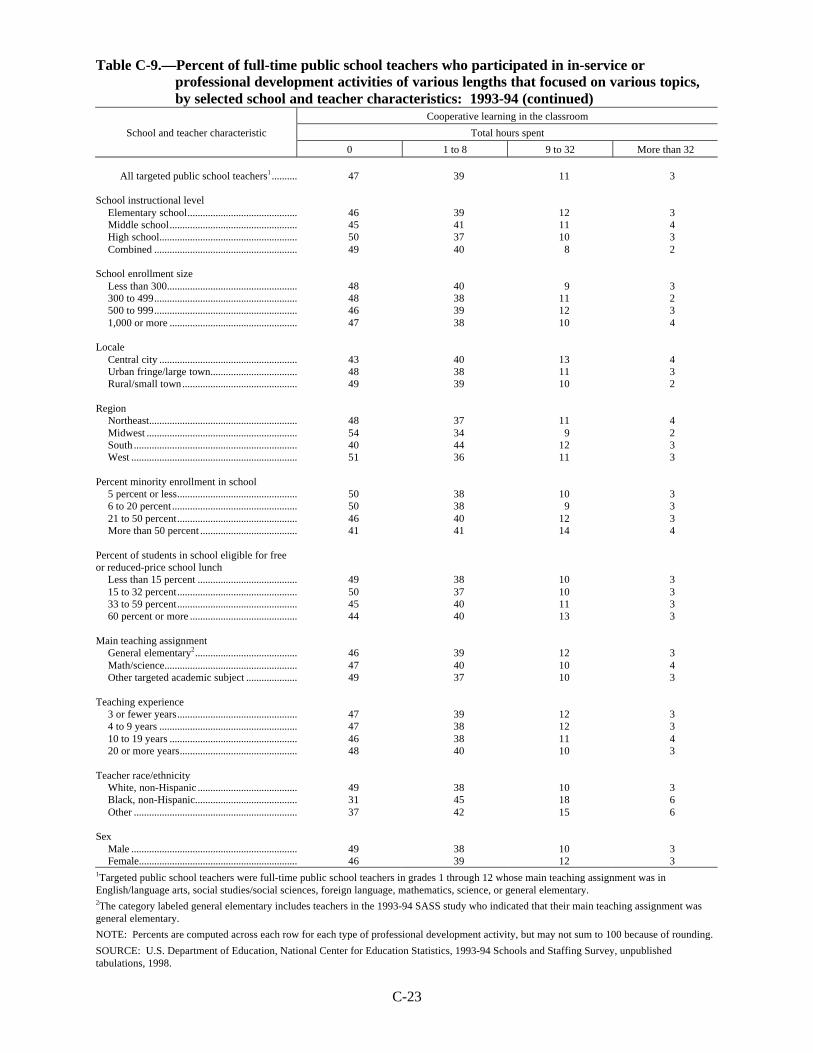
C-23
Table C-9.—Percent of full-time public school teachers who participated in in-service orprofessional development activities of various lengths that focused on various topics,by selected school and teacher characteristics: 1993-94 (continued)
Cooperative learning in the classroom
Total hours spentSchool and teacher characteristic
0 1 to 8 9 to 32 More than 32
All targeted public school teachers1 .......... 47 39 11 3
School instructional levelElementary school........................................... 46 39 12 3Middle school.................................................. 45 41 11 4High school...................................................... 50 37 10 3Combined ........................................................ 49 40 8 2
School enrollment sizeLess than 300................................................... 48 40 9 3300 to 499........................................................ 48 38 11 2500 to 999........................................................ 46 39 12 31,000 or more .................................................. 47 38 10 4
LocaleCentral city ...................................................... 43 40 13 4Urban fringe/large town.................................. 48 38 11 3Rural/small town............................................. 49 39 10 2
RegionNortheast.......................................................... 48 37 11 4Midwest ........................................................... 54 34 9 2South ................................................................ 40 44 12 3West ................................................................. 51 36 11 3
Percent minority enrollment in school5 percent or less............................................... 50 38 10 36 to 20 percent................................................. 50 38 9 321 to 50 percent............................................... 46 40 12 3More than 50 percent ...................................... 41 41 14 4
Percent of students in school eligible for freeor reduced-price school lunch
Less than 15 percent ....................................... 49 38 10 315 to 32 percent............................................... 50 37 10 333 to 59 percent............................................... 45 40 11 360 percent or more .......................................... 44 40 13 3
Main teaching assignmentGeneral elementary2........................................ 46 39 12 3Math/science.................................................... 47 40 10 4Other targeted academic subject .................... 49 37 10 3
Teaching experience3 or fewer years............................................... 47 39 12 34 to 9 years ...................................................... 47 38 12 310 to 19 years .................................................. 46 38 11 420 or more years.............................................. 48 40 10 3
Teacher race/ethnicityWhite, non-Hispanic ....................................... 49 38 10 3Black, non-Hispanic........................................ 31 45 18 6Other ................................................................ 37 42 15 6
SexMale ................................................................. 49 38 10 3Female.............................................................. 46 39 12 3
1Targeted public school teachers were full-time public school teachers in grades 1 through 12 whose main teaching assignment was inEnglish/language arts, social studies/social sciences, foreign language, mathematics, science, or general elementary.2The category labeled general elementary includes teachers in the 1993-94 SASS study who indicated that their main teaching assignment wasgeneral elementary.
NOTE: Percents are computed across each row for each type of professional development activity, but may not sum to 100 because of rounding.
SOURCE: U.S. Department of Education, National Center for Education Statistics, 1993-94 Schools and Staffing Survey, unpublishedtabulations, 1998.

C-24
Table C-9a.—Standard errors of the percent of full-time public school teachers who participated inin-service or professional development activities of various lengths that focused onvarious topics, by selected school and teacher characteristics: 1993-94
Uses of educational technology for instruction Methods of teaching your subject field
Total hours spent Total hours spentSchool and teacher characteristic
0 1 to 8 9 to 32More
than 320 1 to 8 9 to 32
Morethan 32
All targeted public schoolteachers1 .................................. 0.6 0.5 0.3 0.2 0.4 0.5 0.3 0.3
School instructional levelElementary school............................ 0.9 0.8 0.5 0.2 0.7 0.9 0.5 0.5Middle school................................... 1.5 1.3 1.0 0.5 1.1 1.0 1.0 0.7High school....................................... 0.7 0.5 0.4 0.3 0.7 0.5 0.4 0.3Combined ......................................... 0.8 0.9 0.5 0.2 1.0 0.8 0.6 0.5
School enrollment sizeLess than 300.................................... 1.2 1.1 0.8 0.3 1.2 1.2 0.9 0.7300 to 499......................................... 1.1 1.1 0.7 0.3 0.9 1.1 0.7 0.6500 to 999......................................... 0.9 0.8 0.7 0.3 0.8 0.9 0.6 0.51,000 or more ................................... 1.1 0.8 0.5 0.3 0.8 0.8 0.7 0.6
LocaleCentral city ....................................... 1.3 1.1 0.6 0.4 0.8 0.7 0.8 0.7Urban fringe/large town................... 1.1 1.1 0.6 0.3 1.0 1.0 0.7 0.6Rural/small town .............................. 0.8 0.6 0.5 0.2 0.7 0.6 0.4 0.4
RegionNortheast........................................... 1.5 1.2 1.0 0.3 1.1 1.3 1.1 0.7Midwest ............................................ 1.0 0.9 0.6 0.3 0.9 1.0 0.8 0.5South ................................................. 0.8 0.7 0.5 0.3 0.7 0.7 0.7 0.4West .................................................. 1.4 1.3 0.8 0.4 1.0 0.9 0.9 0.9
Percent minority enrollment inschool
5 percent or less................................ 0.9 0.8 0.6 0.3 0.7 0.9 0.6 0.56 to 20 percent.................................. 1.1 1.0 0.9 0.3 1.1 1.0 0.8 0.621 to 50 percent................................ 1.2 1.2 0.9 0.4 1.0 1.2 0.9 0.7More than 50 percent ....................... 1.5 1.4 0.8 0.4 1.2 1.3 1.0 0.7
Percent of students in schooleligible for free or reduced-priceschool lunch
Less than 15 percent ........................ 0.9 0.8 0.7 0.4 1.0 0.9 0.7 0.615 to 32 percent................................ 1.1 1.1 0.6 0.4 0.8 0.9 0.6 0.533 to 59 percent................................ 1.3 1.2 0.8 0.3 0.7 0.9 0.8 0.860 percent or more ........................... 1.1 1.3 0.7 0.4 1.2 1.3 1.0 0.7
Main teaching assignmentGeneral elementary2......................... 0.8 0.8 0.5 0.2 0.7 0.8 0.6 0.5Math/science..................................... 1.1 0.8 0.6 0.3 1.0 0.8 0.6 0.5Other targeted academic subject ..... 0.8 0.8 0.6 0.3 0.7 0.6 0.5 0.4
Teaching experience3 or fewer years................................ 1.5 1.2 1.0 0.5 1.2 1.5 1.5 1.54 to 9 years ....................................... 1.2 1.1 0.9 0.4 0.9 1.0 0.8 0.810 to 19 years ................................... 0.9 0.9 0.5 0.3 0.9 0.7 0.7 0.520 or more years............................... 0.9 0.8 0.5 0.3 0.7 0.7 0.5 0.3
Teacher race/ethnicityWhite, non-Hispanic ........................ 0.6 0.5 0.4 0.2 0.5 0.5 0.4 0.3Black, non-Hispanic......................... 1.9 1.9 1.2 0.7 1.4 1.7 1.6 1.1Other ................................................. 2.1 1.7 1.8 0.8 1.7 2.2 1.5 1.9
SexMale .................................................. 0.9 0.8 0.7 0.3 0.8 0.7 0.5 0.5Female............................................... 0.7 0.6 0.4 0.2 0.5 0.6 0.4 0.4
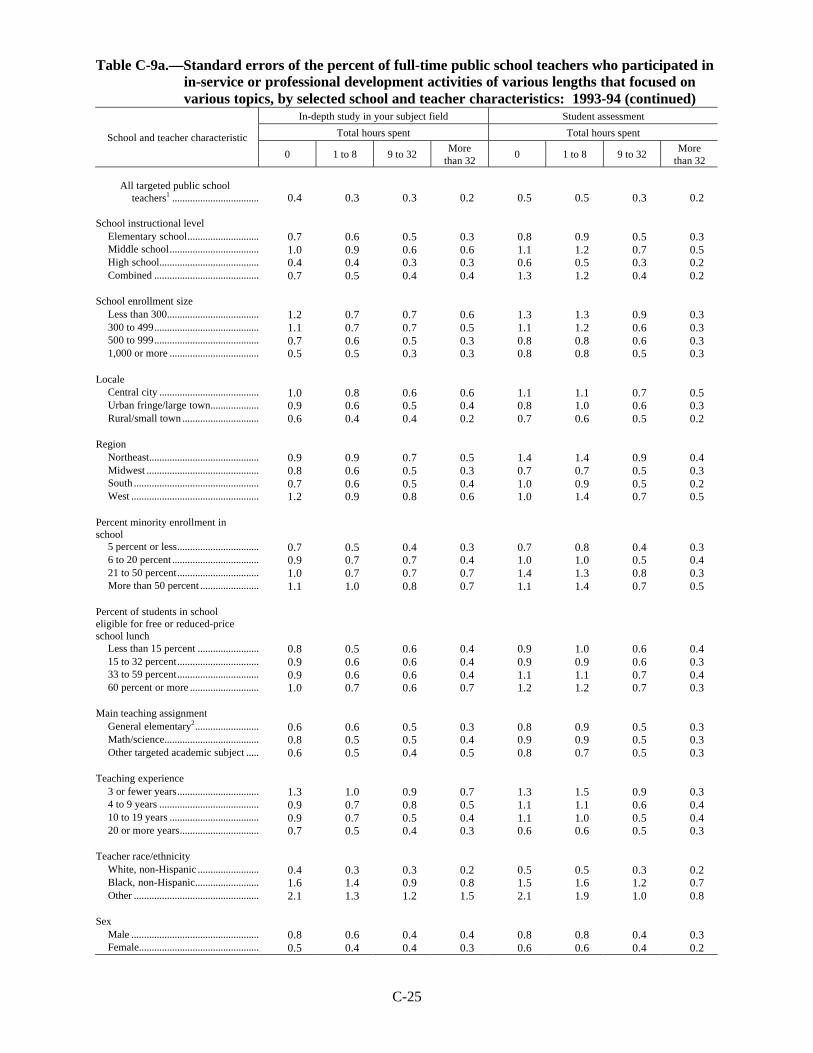
C-25
Table C-9a.—Standard errors of the percent of full-time public school teachers who participated inin-service or professional development activities of various lengths that focused onvarious topics, by selected school and teacher characteristics: 1993-94 (continued)
In-depth study in your subject field Student assessment
Total hours spent Total hours spentSchool and teacher characteristic
0 1 to 8 9 to 32More
than 320 1 to 8 9 to 32
Morethan 32
All targeted public schoolteachers1 .................................. 0.4 0.3 0.3 0.2 0.5 0.5 0.3 0.2
School instructional levelElementary school............................ 0.7 0.6 0.5 0.3 0.8 0.9 0.5 0.3Middle school................................... 1.0 0.9 0.6 0.6 1.1 1.2 0.7 0.5High school....................................... 0.4 0.4 0.3 0.3 0.6 0.5 0.3 0.2Combined ......................................... 0.7 0.5 0.4 0.4 1.3 1.2 0.4 0.2
School enrollment sizeLess than 300.................................... 1.2 0.7 0.7 0.6 1.3 1.3 0.9 0.3300 to 499......................................... 1.1 0.7 0.7 0.5 1.1 1.2 0.6 0.3500 to 999......................................... 0.7 0.6 0.5 0.3 0.8 0.8 0.6 0.31,000 or more ................................... 0.5 0.5 0.3 0.3 0.8 0.8 0.5 0.3
LocaleCentral city ....................................... 1.0 0.8 0.6 0.6 1.1 1.1 0.7 0.5Urban fringe/large town................... 0.9 0.6 0.5 0.4 0.8 1.0 0.6 0.3Rural/small town .............................. 0.6 0.4 0.4 0.2 0.7 0.6 0.5 0.2
RegionNortheast........................................... 0.9 0.9 0.7 0.5 1.4 1.4 0.9 0.4Midwest ............................................ 0.8 0.6 0.5 0.3 0.7 0.7 0.5 0.3South ................................................. 0.7 0.6 0.5 0.4 1.0 0.9 0.5 0.2West .................................................. 1.2 0.9 0.8 0.6 1.0 1.4 0.7 0.5
Percent minority enrollment inschool
5 percent or less................................ 0.7 0.5 0.4 0.3 0.7 0.8 0.4 0.36 to 20 percent.................................. 0.9 0.7 0.7 0.4 1.0 1.0 0.5 0.421 to 50 percent................................ 1.0 0.7 0.7 0.7 1.4 1.3 0.8 0.3More than 50 percent ....................... 1.1 1.0 0.8 0.7 1.1 1.4 0.7 0.5
Percent of students in schooleligible for free or reduced-priceschool lunch
Less than 15 percent ........................ 0.8 0.5 0.6 0.4 0.9 1.0 0.6 0.415 to 32 percent................................ 0.9 0.6 0.6 0.4 0.9 0.9 0.6 0.333 to 59 percent................................ 0.9 0.6 0.6 0.4 1.1 1.1 0.7 0.460 percent or more ........................... 1.0 0.7 0.6 0.7 1.2 1.2 0.7 0.3
Main teaching assignmentGeneral elementary2......................... 0.6 0.6 0.5 0.3 0.8 0.9 0.5 0.3Math/science..................................... 0.8 0.5 0.5 0.4 0.9 0.9 0.5 0.3Other targeted academic subject ..... 0.6 0.5 0.4 0.5 0.8 0.7 0.5 0.3
Teaching experience3 or fewer years................................ 1.3 1.0 0.9 0.7 1.3 1.5 0.9 0.34 to 9 years ....................................... 0.9 0.7 0.8 0.5 1.1 1.1 0.6 0.410 to 19 years ................................... 0.9 0.7 0.5 0.4 1.1 1.0 0.5 0.420 or more years............................... 0.7 0.5 0.4 0.3 0.6 0.6 0.5 0.3
Teacher race/ethnicityWhite, non-Hispanic ........................ 0.4 0.3 0.3 0.2 0.5 0.5 0.3 0.2Black, non-Hispanic......................... 1.6 1.4 0.9 0.8 1.5 1.6 1.2 0.7Other ................................................. 2.1 1.3 1.2 1.5 2.1 1.9 1.0 0.8
SexMale .................................................. 0.8 0.6 0.4 0.4 0.8 0.8 0.4 0.3Female............................................... 0.5 0.4 0.4 0.3 0.6 0.6 0.4 0.2

C-26
Table C-9a.—Standard errors of the percent of full-time public school teachers who participated inin-service or professional development activities of various lengths that focused onvarious topics, by selected school and teacher characteristics: 1993-94 (continued)
Cooperative learning in the classroom
Total hours spentSchool and teacher characteristic
0 1 to 8 9 to 32 More than 32
All targeted public school teachers1 .......... 0.5 0.5 0.3 0.2
School instructional levelElementary school........................................... 0.7 0.9 0.6 0.3Middle school.................................................. 1.4 1.3 0.8 0.5High school...................................................... 0.7 0.6 0.4 0.2Combined ........................................................ 1.2 1.0 0.5 0.2
School enrollment sizeLess than 300................................................... 1.3 1.3 0.7 0.4300 to 499........................................................ 1.0 0.8 0.7 0.3500 to 999........................................................ 0.9 0.9 0.6 0.31,000 or more .................................................. 0.8 0.8 0.5 0.4
LocaleCentral city ...................................................... 1.1 1.2 0.7 0.5Urban fringe/large town.................................. 1.1 1.0 0.7 0.3Rural/small town ............................................. 0.6 0.6 0.4 0.2
RegionNortheast.......................................................... 1.5 1.3 0.8 0.5Midwest ........................................................... 0.8 0.8 0.5 0.3South ................................................................ 0.7 0.8 0.5 0.3West ................................................................. 1.3 1.2 0.7 0.4
Percent minority enrollment in school5 percent or less............................................... 0.8 0.8 0.5 0.36 to 20 percent................................................. 1.1 1.0 0.6 0.321 to 50 percent............................................... 1.2 1.2 0.6 0.5More than 50 percent ...................................... 1.2 1.2 1.0 0.5
Percent of students in school eligible for freeor reduced-price school lunch
Less than 15 percent .......................................15 to 32 percent............................................... 1.0 0.9 0.5 0.333 to 59 percent............................................... 0.9 1.0 0.5 0.360 percent or more .......................................... 1.1 1.0 0.7 0.4
1.1 1.0 1.0 0.5Main teaching assignment
General elementary2........................................Math/science.................................................... 0.8 0.9 0.6 0.3Other targeted academic subject .................... 0.8 0.7 0.4 0.4
0.8 0.7 0.4 0.3Teaching experience
3 or fewer years...............................................4 to 9 years ...................................................... 1.3 1.3 0.8 0.510 to 19 years .................................................. 1.1 1.0 0.6 0.320 or more years.............................................. 0.8 0.9 0.6 0.3
0.9 0.9 0.5 0.3Teacher race/ethnicity
White, non-Hispanic ....................................... 0.5 0.5 0.3 0.2Black, non-Hispanic........................................ 1.5 2.0 1.5 1.0Other ................................................................ 2.1 2.5 1.6 1.2
SexMale ................................................................. 0.9 0.7 0.5 0.3Female.............................................................. 0.5 0.6 0.4 0.2
1Targeted public school teachers were full-time public school teachers in grades 1 through 12 whose main teaching assignment was inEnglish/language arts, social studies/social sciences, foreign language, mathematics, science, or general elementary.2The category labeled general elementary includes teachers in the 1993-94 SASS study who indicated that their main teaching assignment wasgeneral elementary.
SOURCE: U.S. Department of Education, National Center for Education Statistics, 1993-94 Schools and Staffing Survey, unpublishedtabulations, 1998.

C-27
Table C-10.—Percent of full-time public school teachers who participated in a formal inductionprogram during their first year of teaching and percent of full-time public schoolteachers who are currently a master or mentor teacher in a formal teacher inductionprogram, by selected school and teacher characteristics: 1993-94
School and teacher characteristicParticipated in
induction programduring first year
Currently a master ormentor teacher
All targeted public school teachers1 .............................................................................. 28 12
School instructional levelElementary school............................................................................................................... 29 12Middle school...................................................................................................................... 29 13High school.......................................................................................................................... 26 13Combined ............................................................................................................................ 24 10
School enrollment sizeLess than 300....................................................................................................................... 20 10300 to 499............................................................................................................................ 25 11500 to 999............................................................................................................................ 30 121,000 or more ...................................................................................................................... 30 13
LocaleCentral city .......................................................................................................................... 33 14Urban fringe/large town...................................................................................................... 29 12Rural/small town ................................................................................................................. 23 11
RegionNortheast.............................................................................................................................. 26 9Midwest ............................................................................................................................... 21 10South .................................................................................................................................... 31 15West ..................................................................................................................................... 31 11
Percent minority enrollment in school5 percent or less................................................................................................................... 22 116 to 20 percent..................................................................................................................... 26 1121 to 50 percent................................................................................................................... 30 13More than 50 percent .......................................................................................................... 36 14
Percent of students in school eligible for free or reduced-price school lunchLess than 15 percent ........................................................................................................... 24 1215 to 32 percent................................................................................................................... 25 1233 to 59 percent................................................................................................................... 29 1360 percent or more .............................................................................................................. 33 12
Main teaching assignmentGeneral elementary2............................................................................................................ 29 11Math/science........................................................................................................................ 27 12Other targeted academic subject ........................................................................................ 26 13
Teaching experience3 or fewer years................................................................................................................... 59 34 to 9 years .......................................................................................................................... 47 1010 to 19 years ...................................................................................................................... 17 1420 or more years.................................................................................................................. 16 14
Teacher race/ethnicityWhite, non-Hispanic ........................................................................................................... 26 11Black, non-Hispanic............................................................................................................ 39 19Other .................................................................................................................................... 37 12
SexMale ..................................................................................................................................... 27 11Female.................................................................................................................................. 28 12
1Targeted public school teachers were full-time public school teachers in grades 1 through 12 whose main teaching assignment was inEnglish/language arts, social studies/social sciences, foreign language, mathematics, science, or general elementary.2The category labeled general elementary includes teachers in the 1993-94 SASS study who indicated that their main teaching assignment wasgeneral elementary.
SOURCE: U.S. Department of Education, National Center for Education Statistics, 1993-94 Schools and Staffing Survey, unpublishedtabulations, 1998.

C-28
Table C-10a.—Standard errors of the percent of full-time public school teachers who participatedin a formal induction program during their first year of teaching and percent offull-time public school teachers who are currently a master or mentor teacher in aformal teacher induction program, by selected school and teacher characteristics:1993-94
School and teacher characteristicParticipated in
induction programduring first year
Currently a master ormentor teacher
All targeted public school teachers1 .............................................................................. 0.6 0.4
School instructional levelElementary school............................................................................................................... 0.9 0.5Middle school...................................................................................................................... 1.2 1.0High school.......................................................................................................................... 0.4 0.4Combined ............................................................................................................................ 0.9 0.6
School enrollment sizeLess than 300....................................................................................................................... 1.2 1.0300 to 499............................................................................................................................ 1.0 0.6500 to 999............................................................................................................................ 0.9 0.51,000 or more ...................................................................................................................... 0.9 0.6
LocaleCentral city .......................................................................................................................... 1.2 0.8Urban fringe/large town...................................................................................................... 1.0 0.6Rural/small town ................................................................................................................. 0.7 0.5
RegionNortheast.............................................................................................................................. 1.4 0.9Midwest ............................................................................................................................... 0.9 0.5South .................................................................................................................................... 0.8 0.6West ..................................................................................................................................... 1.3 0.8
Percent minority enrollment in school5 percent or less................................................................................................................... 0.8 0.56 to 20 percent..................................................................................................................... 1.0 0.821 to 50 percent................................................................................................................... 1.0 0.8More than 50 percent .......................................................................................................... 1.3 1.0
Percent of students in school eligible for free or reduced-price school lunchLess than 15 percent ........................................................................................................... 0.8 0.615 to 32 percent................................................................................................................... 1.0 0.533 to 59 percent................................................................................................................... 1.1 0.760 percent or more .............................................................................................................. 1.3 0.9
Main teaching assignmentGeneral elementary2............................................................................................................ 0.9 0.6Math/science........................................................................................................................ 0.8 0.7Other targeted academic subject ........................................................................................ 0.7 0.6
Teaching experience3 or fewer years................................................................................................................... 1.5 0.54 to 9 years .......................................................................................................................... 1.4 0.810 to 19 years ...................................................................................................................... 0.7 0.720 or more years.................................................................................................................. 0.6 0.5
Teacher race/ethnicityWhite, non-Hispanic ........................................................................................................... 0.6 0.4Black, non-Hispanic............................................................................................................ 2.1 1.5Other .................................................................................................................................... 2.2 1.3
SexMale ..................................................................................................................................... 0.8 0.5Female.................................................................................................................................. 0.7 0.4
1Targeted public school teachers were full-time public school teachers in grades 1 through 12 whose main teaching assignment was inEnglish/language arts, social studies/social sciences, foreign language, mathematics, science, or general elementary.2The category labeled general elementary includes teachers in the 1993-94 SASS study who indicated that their main teaching assignment wasgeneral elementary.
SOURCE: U.S. Department of Education, National Center for Education Statistics, 1993-94 Schools and Staffing Survey, unpublishedtabulations, 1998.

C-29
Table C-11.—Average class size for full-time public school teachers in general elementaryclassrooms and departmentalized settings, by selected school and teachercharacteristics: 1993-94
Teaching assignmentSchool and teacher characteristic General elementary
classrooms1Departmentalized
settings2
All targeted public school teachers3 .............................................................................. 24 24
School instructional levelElementary school............................................................................................................... 24 #Middle school...................................................................................................................... # 25High school.......................................................................................................................... # 23Combined ............................................................................................................................ # 23
School enrollment sizeLess than 300....................................................................................................................... 21 19300 to 499............................................................................................................................ 23 22500 to 999............................................................................................................................ 25 241,000 or more ...................................................................................................................... 26 25
LocaleCentral city .......................................................................................................................... 25 25Urban fringe/large town...................................................................................................... 25 24Rural/small town ................................................................................................................. 23 22
RegionNortheast.............................................................................................................................. 24 22Midwest ............................................................................................................................... 23 23South .................................................................................................................................... 23 24West ..................................................................................................................................... 27 26
Percent minority enrollment in school5 percent or less................................................................................................................... 23 236 to 20 percent..................................................................................................................... 24 2321 to 50 percent................................................................................................................... 24 24More than 50 percent .......................................................................................................... 24 25
Percent of students in school eligible for free or reduced-price school lunchLess than 15 percent ........................................................................................................... 24 2415 to 32 percent................................................................................................................... 24 2333 to 59 percent................................................................................................................... 24 2460 percent or more .............................................................................................................. 24 24
Teaching experience3 or fewer years................................................................................................................... 24 244 to 9 years .......................................................................................................................... 24 2410 to 19 years ...................................................................................................................... 24 2320 or more years.................................................................................................................. 24 24
Teacher race/ethnicityWhite, non-Hispanic ........................................................................................................... 24 24Black, non-Hispanic............................................................................................................ 24 25Other .................................................................................................................................... 25 24
SexMale ..................................................................................................................................... 25 24Female.................................................................................................................................. 24 23
#Data for general elementary classrooms are reported for elementary schools only; data for departmentalized settings are not reported forelementary schools. Data for all school levels are included in the totals and in analyses by other school and teacher characteristics.1The category labeled general elementary classrooms includes teachers in the 1993-94 SASS study who indicated that their main teachingassignment was general elementary.2The category labeled departmentalized settings includes teachers in the 1993-94 SASS study who indicated that their main teaching assignmentwas in English/language arts, social studies/social sciences, foreign language, mathematics, or science.3Targeted public school teachers were full-time public school teachers in grades 1 through 12 whose main teaching assignment was inEnglish/language arts, social studies/social sciences, foreign language, mathematics, science, or general elementary.
NOTE: Approximately 5 percent of the teachers were excluded from these SASS class size analyses, either because they taught “pull-out”classes, where they provided instruction to students who were released from their regular classes (2 percent), or because of reporting problems intheir class size information (3 percent).
SOURCE: U.S. Department of Education, National Center for Education Statistics, 1993-94 Schools and Staffing Survey, unpublishedtabulations, 1998.

C-30
Table C-11a.—Standard errors of the average class size for full-time public school teachers ingeneral elementary classrooms and departmentalized settings, by selected schooland teacher characteristics: 1993-94
Teaching assignmentSchool and teacher characteristic General elementary
classrooms1Departmentalized
settings2
All targeted public school teachers3 .............................................................................. 0.1 0.1
School instructional levelElementary school............................................................................................................... 0.1 #Middle school...................................................................................................................... # 0.2High school.......................................................................................................................... # 0.1Combined ............................................................................................................................ # 0.2
School enrollment sizeLess than 300....................................................................................................................... 0.3 0.3300 to 499............................................................................................................................ 0.2 0.2500 to 999............................................................................................................................ 0.1 0.11,000 or more ...................................................................................................................... 0.5 0.2
LocaleCentral city .......................................................................................................................... 0.2 0.2Urban fringe/large town...................................................................................................... 0.2 0.1Rural/small town ................................................................................................................. 0.1 0.1
RegionNortheast.............................................................................................................................. 0.3 0.2Midwest ............................................................................................................................... 0.2 0.1South .................................................................................................................................... 0.1 0.1West ..................................................................................................................................... 0.2 0.2
Percent minority enrollment in school5 percent or less................................................................................................................... 0.2 0.16 to 20 percent..................................................................................................................... 0.2 0.121 to 50 percent................................................................................................................... 0.2 0.2More than 50 percent .......................................................................................................... 0.3 0.3
Percent of students in school eligible for free or reduced-price school lunchLess than 15 percent ........................................................................................................... 0.2 0.115 to 32 percent................................................................................................................... 0.2 0.133 to 59 percent................................................................................................................... 0.2 0.260 percent or more .............................................................................................................. 0.2 0.3
Teaching experience3 or fewer years................................................................................................................... 0.3 0.24 to 9 years .......................................................................................................................... 0.2 0.210 to 19 years ...................................................................................................................... 0.1 0.220 or more years.................................................................................................................. 0.1 0.1
Teacher race/ethnicityWhite, non-Hispanic ........................................................................................................... 0.1 0.1Black, non-Hispanic............................................................................................................ 0.4 2.4Other .................................................................................................................................... 0.4 1.5
SexMale ..................................................................................................................................... 0.3 0.1Female.................................................................................................................................. 0.1 0.1
#Data for general elementary classrooms are reported for elementary schools only; data for departmentalized settings are not reported forelementary schools. Data for all school levels are included in the totals and in analyses by other school and teacher characteristics.1The category labeled general elementary classrooms includes teachers in the 1993-94 SASS study who indicated that their main teachingassignment was general elementary.2The category labeled departmentalized settings includes teachers in the 1993-94 SASS study who indicated that their main teaching assignmentwas in English/language arts, social studies/social sciences, foreign language, mathematics, or science.3Targeted public school teachers were full-time public school teachers in grades 1 through 12 whose main teaching assignment was inEnglish/language arts, social studies/social sciences, foreign language, mathematics, science, or general elementary.
NOTE: Approximately 5 percent of the teachers were excluded from these SASS class size analyses, either because they taught “pull-out”classes, where they provided instruction to students who were released from their regular classes (2 percent), or because of reporting problems intheir class size information (3 percent).
SOURCE: U.S. Department of Education, National Center for Education Statistics, 1993-94 Schools and Staffing Survey, unpublishedtabulations, 1998.

C-31
Table C-12.—Percent of full-time public school teachers agreeing or disagreeing with selectedstatements about parent and school support for teachers, by selected school andteacher characteristics: 1993-94
The school administration’s behavior toward thestaff is supportive and encouraging
I receive a great deal of support fromparents for the work I do
School and teacher characteristicStrongly
agree
Some-whatagree
Some-what
disagree
Stronglydisagree
Stronglyagree
Some-whatagree
Some-what
disagree
Stronglydisagree
All targeted public schoolteachers1 .................................. 41 38 14 7 11 42 30 17
School instructional levelElementary school............................ 44 36 12 7 15 46 26 13Middle school................................... 41 37 14 8 8 37 34 21High school....................................... 33 42 17 8 6 36 36 23Combined ......................................... 36 39 16 8 7 38 34 21
School enrollment sizeLess than 300.................................... 40 39 14 7 13 43 30 13300 to 499......................................... 42 38 14 7 12 44 28 16500 to 999......................................... 43 37 13 7 12 42 30 161,000 or more ................................... 36 40 15 9 7 37 33 23
LocaleCentral city ....................................... 42 35 14 9 11 37 31 21Urban fringe/large town................... 41 38 14 7 13 44 28 15Rural/small town .............................. 40 40 14 7 10 42 31 16
RegionNortheast........................................... 33 39 18 10 13 43 27 17Midwest ............................................ 37 38 15 9 10 46 30 14South ................................................. 45 38 11 6 10 38 32 20West .................................................. 45 37 13 6 12 43 28 17
Percent minority enrollment inschool
5 percent or less................................ 38 39 15 8 11 46 29 146 to 20 percent.................................. 42 39 13 6 15 48 26 1121 to 50 percent................................ 44 37 13 6 9 40 32 19More than 50 percent ....................... 40 37 14 9 9 30 34 27
Percent of students in schooleligible for free or reduced-priceschool lunch
Less than 15 percent ........................ 38 40 15 8 15 48 27 1115 to 32 percent................................ 42 38 14 7 11 44 30 1633 to 59 percent................................ 43 38 12 7 9 41 31 1960 percent or more ........................... 41 37 13 9 10 33 33 25
Main teaching assignmentGeneral elementary2......................... 44 37 12 7 15 47 25 13Math/science..................................... 36 40 16 8 7 36 35 22Other targeted academic subject ..... 37 39 15 9 7 37 34 22
Teaching experience3 or fewer years................................ 48 37 10 5 10 38 34 194 to 9 years ....................................... 40 38 14 8 10 38 31 2010 to 19 years ................................... 41 38 14 8 11 42 30 1720 or more years............................... 38 39 15 8 12 44 28 15
Teacher race/ethnicityWhite, non-Hispanic ........................ 40 38 14 7 11 42 30 17Black, non-Hispanic......................... 47 33 10 9 18 36 27 19Other ................................................. 39 41 12 8 12 42 30 17
SexMale .................................................. 36 41 15 8 8 38 34 20Female............................................... 42 37 13 7 12 43 29 16

C-32
Table C-12.—Percent of full-time public school teachers agreeing or disagreeing with selectedstatements about parent and school support for teachers, by selected school andteacher characteristics: 1993-94 (continued)
Goals and priorities for the school are clearSchool and teacher characteristic
Strongly agree Somewhat agree Somewhat disagree Strongly disagree
All targeted public school teachers1 .......... 37 45 14 4
School instructional levelElementary school........................................... 44 43 10 3Middle school.................................................. 35 44 17 4High school...................................................... 27 49 19 5Combined ........................................................ 27 49 19 5
School enrollment sizeLess than 300................................................... 38 45 13 4300 to 499........................................................ 42 43 11 4500 to 999........................................................ 38 45 13 31,000 or more .................................................. 30 47 18 5
LocaleCentral city ...................................................... 39 44 12 5Urban fringe/large town.................................. 38 45 13 3Rural/small town ............................................. 35 46 15 4
RegionNortheast.......................................................... 34 44 17 5Midwest ........................................................... 33 49 15 4South ................................................................ 44 43 11 3West ................................................................. 33 48 16 4
Percent minority enrollment in school5 percent or less............................................... 34 47 15 46 to 20 percent................................................. 40 44 13 321 to 50 percent............................................... 40 45 12 3More than 50 percent ...................................... 38 43 14 5
Percent of students in school eligible for freeor reduced-price school lunch
Less than 15 percent ....................................... 35 47 14 315 to 32 percent............................................... 36 46 14 433 to 59 percent............................................... 40 44 12 360 percent or more .......................................... 39 43 13 5
Main teaching assignmentGeneral elementary2........................................ 44 44 10 3Math/science.................................................... 29 49 18 5Other targeted academic subject .................... 32 46 17 5
Teaching experience3 or fewer years............................................... 37 48 13 24 to 9 years ...................................................... 35 46 15 410 to 19 years .................................................. 40 43 13 420 or more years.............................................. 37 46 14 4
Teacher race/ethnicityWhite, non-Hispanic ....................................... 35 47 14 4Black, non-Hispanic........................................ 57 30 9 4Other ................................................................ 41 43 12 4
SexMale ................................................................. 27 50 18 5Female.............................................................. 41 43 12 3
1Targeted public school teachers were full-time public school teachers in grades 1 through 12 whose main teaching assignment was inEnglish/language arts, social studies/social sciences, foreign language, mathematics, science, or general elementary.2The category labeled general elementary includes teachers in the 1993-94 SASS study who indicated that their main teaching assignment wasgeneral elementary.
NOTE: Percents are computed across each row for each statement, but may not sum to 100 because of rounding.
SOURCE: U.S. Department of Education, National Center for Education Statistics, 1993-94 Schools and Staffing Survey, unpublishedtabulations, 1998.

C-33
Table C-12a.—Standard errors of the percent of full-time public school teachers agreeing ordisagreeing with selected statements about parent and school support for teachers,by selected school and teacher characteristics: 1993-94
The school administration’s behavior toward thestaff is supportive and encouraging
I receive a great deal of support fromparents for the work I do
School and teacher characteristicStrongly
agree
Some-whatagree
Some-what
disagree
Stronglydisagree
Stronglyagree
Some-whatagree
Some-what
disagree
Stronglydisagree
All targeted public schoolteachers1 .................................. 0.5 0.5 0.3 0.3 0.3 0.5 0.4 0.4
School instructional levelElementary school............................ 0.8 0.7 0.5 0.5 0.6 0.8 0.6 0.5Middle school................................... 1.3 1.2 0.9 0.7 0.7 1.1 1.2 1.0High school....................................... 0.6 0.6 0.5 0.3 0.3 0.7 0.5 0.6Combined ......................................... 0.9 1.0 0.7 0.6 0.4 0.8 0.9 0.8
School enrollment sizeLess than 300.................................... 1.4 1.7 1.0 0.6 1.0 1.3 1.4 0.9300 to 499......................................... 1.1 0.9 0.8 0.7 0.7 1.0 0.9 0.8500 to 999......................................... 0.8 0.7 0.5 0.5 0.5 0.8 0.8 0.61,000 or more ................................... 1.0 0.8 0.6 0.5 0.5 1.0 0.9 0.8
LocaleCentral city ....................................... 1.3 1.2 0.7 0.6 0.6 1.0 1.0 0.8Urban fringe/large town................... 1.0 0.9 0.7 0.4 0.6 1.1 0.8 0.7Rural/small town .............................. 0.8 0.7 0.5 0.4 0.5 0.7 0.6 0.5
RegionNortheast........................................... 1.4 1.5 1.2 1.0 1.1 1.2 1.2 1.1Midwest ............................................ 1.0 1.0 0.6 0.5 0.6 1.0 0.8 0.8South ................................................. 0.9 0.8 0.4 0.4 0.5 0.6 0.6 0.5West .................................................. 1.2 1.3 0.8 0.6 0.8 1.3 1.1 1.0
Percent minority enrollment inschool
5 percent or less................................ 0.7 0.8 0.6 0.5 0.5 0.7 0.7 0.56 to 20 percent.................................. 1.1 1.1 0.7 0.6 0.9 1.2 1.0 0.721 to 50 percent................................ 1.0 0.9 0.6 0.4 0.8 1.2 1.1 0.8More than 50 percent ....................... 1.3 1.0 0.9 0.8 0.7 1.1 1.0 1.0
Percent of students in schooleligible for free or reduced-priceschool lunch
Less than 15 percent ........................ 1.0 0.8 0.7 0.5 0.7 0.9 0.9 0.615 to 32 percent................................ 0.8 0.7 0.6 0.5 0.6 0.9 0.7 0.733 to 59 percent................................ 1.2 1.3 0.7 0.6 0.7 1.1 1.0 0.860 percent or more ........................... 1.3 1.2 0.8 0.7 0.6 1.2 1.0 1.1
Main teaching assignmentGeneral elementary2......................... 0.8 0.7 0.5 0.6 0.6 0.9 0.6 0.5Math/science..................................... 0.8 0.8 0.6 0.5 0.6 0.9 0.8 0.8Other targeted academic subject ..... 0.8 0.9 0.5 0.4 0.4 0.7 0.7 0.5
Teaching experience3 or fewer years................................ 1.5 1.4 0.8 0.7 1.0 1.3 1.4 1.04 to 9 years ....................................... 1.0 1.1 0.6 0.8 0.7 0.9 0.9 0.910 to 19 years ................................... 0.8 0.8 0.6 0.4 0.7 0.7 0.6 0.620 or more years............................... 0.9 0.9 0.6 0.4 0.5 0.8 0.6 0.6
Teacher race/ethnicityWhite, non-Hispanic ........................ 0.5 0.6 0.3 0.3 0.3 0.5 0.4 0.4Black, non-Hispanic......................... 1.7 1.6 1.3 1.6 1.3 1.9 1.6 1.4Other ................................................. 2.1 1.8 1.1 1.0 1.4 1.8 2.2 1.5
SexMale .................................................. 0.8 0.9 0.5 0.6 0.5 0.8 0.7 0.7Female............................................... 0.6 0.6 0.4 0.4 0.4 0.6 0.4 0.4

C-34
Table C-12a.—Standard errors of the percent of full-time public school teachers agreeing ordisagreeing with selected statements about parent and school support for teachers,by selected school and teacher characteristics: 1993-94 (continued)
Goals and priorities for the school are clearSchool and teacher characteristic
Strongly agree Somewhat agree Somewhat disagree Strongly disagree
All targeted public school teachers1 .......... 0.5 0.4 0.4 0.2
School instructional levelElementary school........................................... 0.7 0.7 0.4 0.3Middle school.................................................. 1.3 1.3 1.0 0.5High school...................................................... 0.6 0.5 0.5 0.2Combined ........................................................ 1.0 1.0 0.8 0.4
School enrollment sizeLess than 300................................................... 1.2 1.3 0.8 0.5300 to 499........................................................ 1.1 0.8 0.7 0.3500 to 999........................................................ 0.7 0.8 0.6 0.41,000 or more .................................................. 0.9 0.9 0.7 0.3
LocaleCentral city ...................................................... 1.0 0.9 0.8 0.5Urban fringe/large town.................................. 1.1 1.0 0.6 0.3Rural/small town ............................................. 0.8 0.6 0.5 0.3
RegionNortheast.......................................................... 1.1 1.5 0.9 0.6Midwest ........................................................... 0.8 0.7 0.7 0.4South ................................................................ 0.9 0.8 0.5 0.3West ................................................................. 1.1 1.1 0.7 0.4
Percent minority enrollment in school5 percent or less............................................... 0.6 0.8 0.5 0.36 to 20 percent................................................. 1.0 0.9 0.6 0.321 to 50 percent............................................... 1.1 1.0 0.6 0.3More than 50 percent ...................................... 1.2 0.9 0.9 0.7
Percent of students in school eligible for freeor reduced-price school lunch
Less than 15 percent ....................................... 0.7 0.7 0.6 0.315 to 32 percent............................................... 1.0 0.9 0.7 0.433 to 59 percent............................................... 1.1 1.0 0.7 0.360 percent or more .......................................... 1.1 1.0 0.8 0.7
Main teaching assignmentGeneral elementary2........................................ 0.8 0.8 0.4 0.3Math/science.................................................... 0.7 0.7 0.7 0.4Other targeted academic subject .................... 0.7 0.7 0.6 0.3
Teaching experience3 or fewer years............................................... 1.8 1.8 0.9 0.34 to 9 years ...................................................... 0.9 1.0 0.9 0.610 to 19 years .................................................. 0.9 0.9 0.6 0.420 or more years.............................................. 0.8 0.8 0.5 0.3
Teacher race/ethnicityWhite, non-Hispanic ....................................... 0.5 0.5 0.4 0.2Black, non-Hispanic........................................ 2.1 1.8 1.1 1.3Other ................................................................ 2.3 2.0 1.1 0.6
SexMale ................................................................. 0.8 0.8 0.6 0.4Female.............................................................. 0.5 0.5 0.4 0.2
1Targeted public school teachers were full-time public school teachers in grades 1 through 12 whose main teaching assignment was inEnglish/language arts, social studies/social sciences, foreign language, mathematics, science, or general elementary.2The category labeled general elementary includes teachers in the 1993-94 SASS study who indicated that their main teaching assignment wasgeneral elementary.
SOURCE: U.S. Department of Education, National Center for Education Statistics, 1993-94 Schools and Staffing Survey, unpublishedtabulations, 1998.
D-1
Appendix D
Standard Error Tablesfor
Text Tables and Figures

D-2

D-3
Table of Contents
Standard Error Tables for Text Tables and Figures
Table Page
D-1a Standard errors of the percent of public school teachers who majored in variousfields of study for a bachelor’s or graduate degree, by selected school and teachercharacteristics: 1998............................................................................................... 7
D-2a Standard errors of the percent of full-time public school teachers who majored invarious fields of study for a bachelor’s or graduate degree, by selected school andteacher characteristics: 1993-94............................................................................. 8
D-3a Standard errors of the percent of full-time public school teachers in generalelementary classrooms and departmentalized settings with various types of teachingcertificates in their state: 1998............................................................................... 9
D-4a Standard errors of the percent of full-time public school teachers in generalelementary classrooms and departmentalized settings with various types of teachingcertificates in their state: 1993-94.......................................................................... 10
D-5a Standard errors of the percent of full-time public school teachers in grades 7through 12 who reported having an undergraduate or graduate major or minor intheir main teaching assignment field, by selected school characteristics: 1998 ........ 11
D-6a Standard errors of the percent of full-time public school teachers in grades 7through 12 who reported having an undergraduate or graduate major or minor intheir main teaching assignment field, by selected school characteristics: 1993-94 .. 12
D-7a Standard errors of the percent of full-time public school teachers in grades 9through 12 who reported having an undergraduate or graduate major or minor intheir main teaching assignment field, by selected school characteristics: 1998 ........ 13
D-8a Standard errors of the percent of full-time public school teachers in grades 9through 12 who reported having an undergraduate or graduate major or minor intheir main teaching assignment field, by selected school characteristics: 1993-94 .. 14
D-9a Standard errors of the percent of full-time public school teachers who participatedin professional development activities in the last 12 months in various contentareas, by teaching experience: 1998........................................................................ 15
D-10a Standard errors of the percent of full-time public school teachers who participatedin professional development activities since the end of the school year in variouscontent areas, by teaching experience: 1993-94 ..................................................... 16
D-11a Standard errors of the percent of full-time public school teachers indicating thenumber of hours spent in professional development activities in the last 12 monthsin various content areas: 1998 ................................................................................ 17
D-12a Standard errors of the percent of full-time public school teachers indicating thenumber of hours spent in professional development activities since the end of thelast school year in various content areas: 1993-94.................................................. 18

D-4
Table of Contents (continued)
Standard Error Tables for Text Tables and Figures (continued)
Table Page
D-13a Standard errors of the percent of full-time public school teachers who participatedin professional development activities in the last 12 months indicating the extent towhich they believe the activity improved their teaching: 1998 ................................ 19
D-14a Standard errors of the percent of full-time public school teachers who participatedin professional development activities in the last 12 months indicating that theactivity improved their teaching a lot, by teaching experience: 1998....................... 20
D-15a Standard errors of the percent of full-time public school teachers indicating theextent to which participation in professional development activities in variouscontent areas improved their classroom teaching, by the number of hours spent inprofessional development in that content area in the last 12 months: 1998 .............. 21
D-16a Standard errors of the percent of full-time public school teachers who participatedin activities related to teaching in the last 12 months, by frequency of participation:1998 ....................................................................................................................... 22
D-17a Standard errors of the percent of full-time public school teachers who participatedin various activities related to teaching in the last 12 months indicating the extent towhich they believe the activity improved their teaching: 1998 ................................ 23
D-18a Standard errors of the percent of full-time public school teachers indicating theextent to which participation in activities related to teaching improved theirclassroom teaching, by the frequency with which they participated in that activity inthe last 12 months: 1998......................................................................................... 24
D-19a Standard errors of the average class size for full-time public school teachers ingeneral elementary classrooms and departmentalized settings, by selected schoolcharacteristics: 1998............................................................................................... 25
D-20a Standard errors of the average class size for full-time public school teachers ingeneral elementary classrooms and departmentalized settings, by selected schoolcharacteristics: 1993-94.......................................................................................... 26
D-21a Standard errors of the percent of full-time public school teachers indicating howwell prepared they feel to do various activities in the classroom: 1998.................... 27
D-22a Standard errors of the percent of full-time public school teachers indicating theyfeel very well prepared to do various activities in the classroom, by teachingexperience: 1998.................................................................................................... 28
D-23a Standard errors of the comparison of recent teacher participation in professionaldevelopment in various content areas and perceived teacher preparedness forclassroom requirements in those content areas: 1998 .............................................. 29
D-24a Standard errors of the percent of full-time public school teachers indicating howwell prepared they feel to do various activities in the classroom, by the number ofhours spent in professional development in the content area of the activity in thelast 12 months: 1998 .............................................................................................. 30
D-5
Table of Contents (continued)
Standard Error Tables for Text Tables and Figures (continued)
Table Page
D-25a Standard errors of the percent of full-time public school teachers indicating theyfeel very well prepared to do various classroom activities, by whether theyparticipated in various teaching-related activities in the last 12 months: 1998 .......... 31
D-26 Standard errors for the figures and for data not shown in tables: FRSS 1998 andSASS 1993-94 ........................................................................................................ 32
D-A-2a Standard errors of the percent of full-time public school teachers with anyundergraduate or graduate major in various fields of study, by selected school andteacher characteristics: 1998.................................................................................. 39
D-A-3a Standard errors of the percent of full-time public school teachers with anyundergraduate or graduate major in various fields of study, by selected school andteacher characteristics: 1993-94............................................................................ 40

D-6

D-7
Table D-1a.—Standard errors of the percent of public school teachers who majored in various fieldsof study for a bachelor’s or graduate degree, by selected school and teachercharacteristics: 1998
School characteristic Academicfield
Subject areaeducation1
Generaleducation
Othereducation2
All targeted public school teachers3 ................................................... 0.9 0.7 0.8 0.5
School instructional levelElementary school.............................................................................. 1.5 1.1 1.3 0.9Middle school..................................................................................... 2.2 1.5 1.7 0.8High school ........................................................................................ 1.2 1.3 0.7 0.2Combined........................................................................................... 3.4 3.3 1.9 1.5
Teaching experience3 or fewer years.................................................................................. 2.1 0.8 2.1 0.84 to 9 years ......................................................................................... 2.0 1.5 2.3 0.810 to 19 years ..................................................................................... 1.5 1.5 1.7 1.020 or more years................................................................................. 1.6 1.1 1.5 1.1
1Subject area education is the teaching of an academic field, such as mathematics education.2Examples of other education fields are special education, curriculum and instruction, and educational administration.3Targeted public school teachers were full-time public school teachers in grades 1 through 12 whose main teaching assignment was inEnglish/language arts, social studies/social sciences, foreign languages, mathematics, or science, or who taught a self-contained classroom.
SOURCE: U.S. Department of Education, National Center for Education Statistics, Fast Response Survey System, Teacher Survey on ProfessionalDevelopment and Training, 1998.
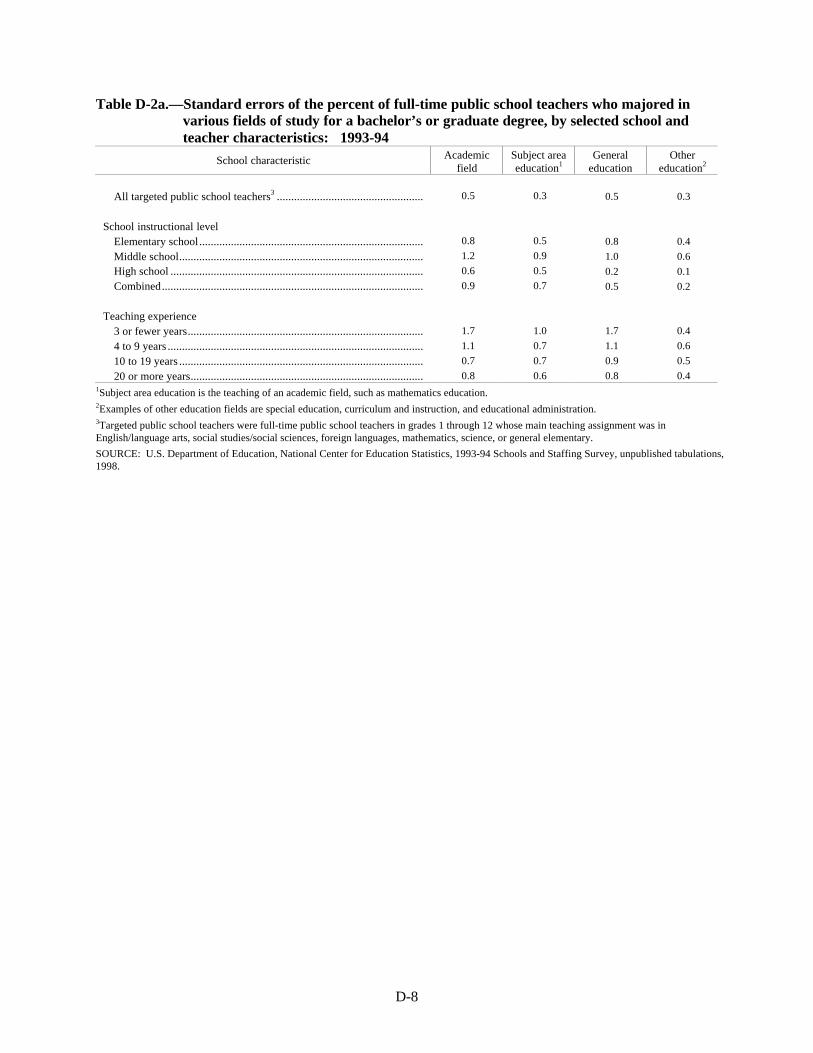
D-8
Table D-2a.—Standard errors of the percent of full-time public school teachers who majored invarious fields of study for a bachelor’s or graduate degree, by selected school andteacher characteristics: 1993-94
School characteristic Academicfield
Subject areaeducation1
Generaleducation
Othereducation2
All targeted public school teachers3 ................................................... 0.5 0.3 0.5 0.3
School instructional levelElementary school.............................................................................. 0.8 0.5 0.8 0.4
Middle school..................................................................................... 1.2 0.9 1.0 0.6
High school ........................................................................................ 0.6 0.5 0.2 0.1
Combined........................................................................................... 0.9 0.7 0.5 0.2
Teaching experience3 or fewer years.................................................................................. 1.7 1.0 1.7 0.4
4 to 9 years ......................................................................................... 1.1 0.7 1.1 0.6
10 to 19 years ..................................................................................... 0.7 0.7 0.9 0.5
20 or more years................................................................................. 0.8 0.6 0.8 0.41Subject area education is the teaching of an academic field, such as mathematics education.2Examples of other education fields are special education, curriculum and instruction, and educational administration.3Targeted public school teachers were full-time public school teachers in grades 1 through 12 whose main teaching assignment was inEnglish/language arts, social studies/social sciences, foreign languages, mathematics, science, or general elementary.
SOURCE: U.S. Department of Education, National Center for Education Statistics, 1993-94 Schools and Staffing Survey, unpublished tabulations,1998.

D-9
Table D-3a.—Standard errors of the percent of full-time public school teachers in general elementaryclassrooms and departmentalized settings with various types of teaching certificates intheir state: 1998
Teaching assignment
Type of teaching certificate General elementary
classrooms1
Departmentalized settings:
main teaching assignment
Regular or standard state certificate, or advanced professional certificate... 0.7 0.5
Provisional or other type of certificate given while participating in an
“alternative certification program”.......................................................... 0.4 0.3
Probationary certificate................................................................................ 0.3 0.3
Temporary certificate .................................................................................. 0.3 0.2
Emergency certificate or waiver .................................................................. 0.2 0.2
No certificate ............................................................................................... * 0.1
*Estimate of standard error is not derived because it is based on a statistic estimated at 0 or 100 percent.1The category labeled general elementary classrooms includes all teachers of self-contained classrooms in the 1998 FRSS study, regardless ofinstructional level. Almost all (95 percent) of the self-contained classrooms were at the elementary school level.
SOURCE: U.S. Department of Education, National Center for Education Statistics, Fast Response Survey System, Teacher Survey on ProfessionalDevelopment and Training, 1998.

D-10
Table D-4a.—Standard errors of the percent of full-time public school teachers in general elementaryclassrooms and departmentalized settings with various types of teaching certificates intheir state: 1993-94
Teaching assignment
Type of teaching certificate General elementary
classrooms1
Departmentalized settings:
main teaching assignment2
Regular or standard state certificate, or advanced professional certificate... 0.5 0.4
Provisional or other type of certificate given while participating in an
“alternative certification program”.......................................................... 0.2 0.2
Probationary certificate................................................................................ 0.2 0.1
Temporary certificate .................................................................................. 0.2 0.1
Emergency certificate or waiver .................................................................. 0.1 0.1
No certificate ............................................................................................... 0.2 0.31The category labeled general elementary classrooms includes teachers in the 1993-94 SASS study who indicated that their main teachingassignment was general elementary.2The category labeled departmentalized settings includes teachers in the 1993-94 SASS study who indicated that their main teaching assignment wasin English/language arts, social studies/social sciences, foreign language, mathematics, or science.
SOURCE: U.S. Department of Education, National Center for Education Statistics, Fast Response Survey System, Teacher Survey on ProfessionalDevelopment and Training, 1998.

D-11
Table D-5a.—Standard errors of the percent of full-time public school teachers in grades 7 through12 who reported having an undergraduate or graduate major or minor in their mainteaching assignment field, by selected school characteristics: 1998
School and teacher characteristicEnglish/
language artsForeign
language
Socialstudies/social
science
Mathematics Science
All targeted public school teachers1 ................... 1.4 1.3 1.6 2.1 1.8
LocaleCentral city ............................................................. 3.4 1.5 3.7 4.4 3.8Urban fringe/town/rural.......................................... 1.6 1.7 1.9 2.6 1.5
Percent minority enrollment in school50 percent or less.................................................... 1.5 1.4 2.0 2.2 1.7More than 50 percent.............................................. 3.7 3.0 3.7 5.6 4.8
Percent of students in school eligible for free orreduced-price school lunch
Less than 60 percent............................................... 1.3 1.3 1.9 2.1 1.860 percent or more.................................................. 5.0 # 4.4 6.4 6.0
#Too few cases for a reliable estimate.1Targeted public school teachers were full-time public school teachers in grades 1 through 12 whose main teaching assignment was inEnglish/language arts, social studies/social sciences, foreign languages, mathematics, or science, or who taught a self-contained classroom.
SOURCE: U.S. Department of Education, National Center for Education Statistics, Fast Response Survey System, Teacher Survey onProfessional Development and Training, 1998.

D-12
Table D-6a.—Standard errors of the percent of full-time public school teachers in grades 7 through12 who reported having an undergraduate or graduate major or minor in their mainteaching assignment field, by selected school characteristics: 1993-94
School and teacher characteristicEnglish/
language artsForeign
language
Socialstudies/social
science
Mathematics Science
All targeted public school teachers1 ................... 1.0 0.8 0.9 0.9 1.1
LocaleCentral city ............................................................. 2.1 1.2 1.4 2.2 1.9Urban fringe/town/rural.......................................... 1.1 1.0 1.0 1.3 1.3
Percent minority enrollment in school50 percent or less.................................................... 0.9 0.9 1.0 1.2 1.2More than 50 percent.............................................. 2.6 1.4 1.8 2.8 2.8
Percent of students in school eligible for free orreduced-price school lunch
Less than 60 percent............................................... 1.0 0.9 1.0 1.2 1.160 percent or more.................................................. 2.9 1.9 3.2 3.8 3.9
1Targeted public school teachers were full-time public school teachers in grades 1 through 12 whose main teaching assignment was inEnglish/language arts, social studies/social sciences, foreign languages, mathematics, science, or general elementary.
SOURCE: U.S. Department of Education, National Center for Education Statistics, 1993-94 Schools and Staffing Survey, unpublished tabulations,1998.

D-13
Table D-7a.—Standard errors of the percent of full-time public school teachers in grades 9 through12 who reported having an undergraduate or graduate major or minor in their mainteaching assignment field, by selected school characteristics: 1998
School and teacher characteristicEnglish/
language artsForeignlanguage
Social studies/social science
Mathematics Science
All targeted public school teachers1 ......................... 1.0 1.5 1.2 2.0 1.4
LocaleCentral city ..................................................................... 2.3 * 2.2 4.7 4.6Urban fringe/town/rural ................................................. 1.2 2.1 1.6 2.3 1.3
Percent minority enrollment in school50 percent or less............................................................ 1.1 1.7 1.5 2.0 1.4More than 50 percent ..................................................... 2.5 # 2.3 6.3 3.7
Percent of students in school eligible for free orreduced-price school lunch
Less than 60 percent ...................................................... 1.0 1.6 1.2 2.0 1.560 percent or more ......................................................... 4.0 # # 8.9 #
*Estimate of standard error is not derived because it is based on a statistic estimated at 0 or 100 percent.
#Too few cases for a reliable estimate.1Targeted public school teachers were full-time public school teachers in grades 1 through 12 whose main teaching assignment was inEnglish/language arts, social studies/social sciences, foreign languages, mathematics, or science, or who taught a self-contained classroom.
SOURCE: U.S. Department of Education, National Center for Education Statistics, Fast Response Survey System, Teacher Survey on ProfessionalDevelopment and Training, 1998.

D-14
Table D-8a.—Standard errors of the percent of full-time public school teachers in grades 9 through12 who reported having an undergraduate or graduate major or minor in their mainteaching assignment field, by selected school characteristics: 1993-94
School and teacher characteristicEnglish/
language artsForeign
language
Socialstudies/social
science
Mathematics Science
All targeted public school teachers1 ................... 0.7 0.7 0.7 0.7 0.6
LocaleCentral city ............................................................. 1.9 1.4 1.1 1.7 1.4Urban fringe/town/rural.......................................... 0.7 0.9 0.7 0.8 0.8
Percent minority enrollment in school50 percent or less.................................................... 0.8 0.9 0.8 0.7 0.7More than 50 percent.............................................. 1.9 1.7 0.9 2.2 1.7
Percent of students in school eligible for free orreduced-price school lunch
Less than 60 percent............................................... 0.7 0.8 0.7 0.8 0.760 percent or more.................................................. 1.9 1.5 1.6 1.8 1.5
1Targeted public school teachers were full-time public school teachers in grades 1 through 12 whose main teaching assignment was inEnglish/language arts, social studies/social sciences, foreign languages, mathematics, science, or general elementary.
SOURCE: U.S. Department of Education, National Center for Education Statistics, 1993-94 Schools and Staffing Survey, unpublished tabulations,1998.

D-15
Table D-9a.—Standard errors of the percent of full-time public school teachers who participated inprofessional development activities in the last 12 months in various content areas, byteaching experience: 1998
Teaching experienceContent area 3 or fewer
years4 to 9years
10 to 19years
20 or moreyears
State or district curriculum and performance standards .................................... 1.5 1.5 1.3 1.4Integration of educational technology in the grade or subject you teach........... 1.8 1.9 1.5 1.3New methods of teaching (e.g., cooperative learning) ...................................... 1.3 1.5 1.8 1.4In-depth study in the subject area of your main teaching assignment ............... 1.8 1.9 1.7 1.6Student performance assessment....................................................................... 1.5 1.8 1.7 1.6Classroom management, including student discipline....................................... 1.8 1.9 1.9 1.3Addressing the needs of students with disabilities ............................................ 1.7 2.6 2.2 1.6Addressing the needs of students with limited English proficiency or from
diverse cultural backgrounds......................................................................... 2.2 2.2 2.1 1.4
SOURCE: U.S. Department of Education, National Center for Education Statistics, Fast Response Survey System, Teacher Survey on ProfessionalDevelopment and Training, 1998.

D-16
Table D-10a.—Standard errors of the percent of full-time public school teachers who participated inprofessional development activities since the end of the school year in various contentareas, by teaching experience: 1993-94
Teaching experience
Content area 3 or fewer
years
4 to 9
years
10 to 19
years
20 or more
years
Methods of teaching your subject field................................................................ 1.2 0.9 0.9 0.7
Student assessment .............................................................................................. 1.3 1.1 1.1 0.6
Cooperative learning in the classroom................................................................. 1.3 1.1 0.8 0.9
Uses of educational technology for instruction.................................................... 1.5 1.2 0.9 0.9
In-depth study in your subject field ..................................................................... 1.3 0.9 0.9 0.7
SOURCE: U.S. Department of Education, National Center for Education Statistics, 1993-94 Schools and Staffing Survey, unpublished tabulations,1998.

D-17
Table D-11a.—Standard errors of the percent of full-time public school teachers indicating thenumber of hours spent in professional development activities in the last 12 months invarious content areas: 1998
Total hours spent*Content area
1 to 8 More than 8
State or district curriculum and performance standards ................................................................................... 1.1 1.1Integration of educational technology in the grade or subject you teach.......................................................... 1.0 1.0New methods of teaching (e.g., cooperative learning) ..................................................................................... 1.1 1.1In-depth study in the subject area of your main teaching assignment .............................................................. 0.8 0.8Student performance assessment...................................................................................................................... 1.2 1.2Classroom management, including student discipline...................................................................................... 1.2 1.2Addressing the needs of students with disabilities ........................................................................................... 0.8 0.8Addressing the needs of students with limited English proficiency or from diverse cultural backgrounds...... 1.5 1.5
*Estimates are based on those who participated in professional development activities in a particular content area.
SOURCE: U.S. Department of Education, National Center for Education Statistics, Fast Response Survey System, Teacher Survey on ProfessionalDevelopment and Training, 1998.

D-18
Table D-12a.—Standard errors of the percent of full-time public school teachers indicating thenumber of hours spent in professional development activities since the end of the lastschool year in various content areas: 1993-94
Total hours spent*Content area
1 to 8 More than 8
Methods of teaching your subject field............................................................................................................ 0.6 0.6
Student assessment .......................................................................................................................................... 0.7 0.7
Cooperative learning in the classroom............................................................................................................. 0.7 0.7
Uses of educational technology for instruction................................................................................................ 0.6 0.6
In-depth study in your subject field ................................................................................................................. 0.9 0.9
*Estimates are based on those who participated in professional development activities in a particular content area.
SOURCE: U.S. Department of Education, National Center for Education Statistics, 1993-94 Schools and Staffing Survey, unpublished tabulations,1998.

D-19
Table D-13a.—Standard errors of the percent of full-time public school teachers who participated inprofessional development activities in the last 12 months indicating the extent to whichthey believe the activity improved their teaching: 1998
Improved classroom teachingContent area
A lot Moderately Somewhat Not at all
State or district curriculum and performance standards ...................................... 0.6 1.1 1.1 0.7
Integration of educational technology in the grade or subject you teach............. 1.0 1.0 1.0 0.5
New methods of teaching (e.g., cooperative learning) ........................................ 0.8 1.1 1.0 0.4
In-depth study in the subject area of your main teaching assignment ................. 1.2 1.0 1.0 0.3
Student performance assessment......................................................................... 0.9 1.2 1.0 0.6
Classroom management, including student discipline......................................... 1.1 1.2 1.3 0.8
Addressing the needs of students with disabilities .............................................. 0.9 1.6 1.6 0.6
Addressing the needs of students with limited English proficiency or from
diverse cultural backgrounds........................................................................... 1.4 1.6 1.6 0.9
SOURCE: U.S. Department of Education, National Center for Education Statistics, Fast Response Survey System, Teacher Survey on ProfessionalDevelopment and Training, 1998.

D-20
Table D-14a.—Standard errors of the percent of full-time public school teachers who participated inprofessional development activities in the last 12 months indicating that the activityimproved their teaching a lot, by teaching experience: 1998
Teaching experienceContent area 3 or fewer
years4 to 9years
10 to 19years
20 or moreyears
State or district curriculum and performance standards .................................... 1.3 1.6 1.5 1.2Integration of educational technology in the grade or subject you teach........... 1.8 1.9 1.6 1.8New methods of teaching (e.g., cooperative learning) ...................................... 1.7 1.7 2.1 1.5In-depth study in the subject area of your main teaching assignment ............... 1.9 2.5 2.1 2.0Student performance assessment....................................................................... 2.0 1.9 1.9 1.6Classroom management, including student discipline....................................... 2.3 2.3 2.4 2.2Addressing the needs of students with disabilities ............................................ 2.2 1.8 2.3 1.8Addressing the needs of students with limited English proficiency or from
diverse cultural backgrounds......................................................................... 2.3 3.1 2.5 2.5
SOURCE: U.S. Department of Education, National Center for Education Statistics, Fast Response Survey System, Teacher Survey on ProfessionalDevelopment and Training, 1998.

D-21
Table D-15a.—Standard errors of the percent of full-time public school teachers indicating the extentto which participation in professional development activities in various content areasimproved their classroom teaching, by the number of hours spent in professionaldevelopment in that content area in the last 12 months: 1998
Improved my teachingContent area
A lot Moderately Somewhat Not at all
State or district curriculum and performance standards1 to 8 hours............................................................................................................ 0.6 1.2 1.3 0.8More than 8 hours ................................................................................................. 1.3 1.6 1.6 1.1
Integration of educational technology in the grade or subject you teach1 to 8 hours............................................................................................................ 0.8 1.1 1.1 0.8More than 8 hours ................................................................................................. 1.8 1.5 1.7 0.5
New methods of teaching (e.g., cooperative learning)1 to 8 hours............................................................................................................ 1.0 1.7 1.5 0.6More than 8 hours ................................................................................................. 1.6 1.7 1.4 0.5
In-depth study in the subject area of your main teaching assignment1 to 8 hours............................................................................................................ 1.2 1.5 1.6 0.6More than 8 hours ................................................................................................. 1.7 1.4 1.3 0.3
Student performance assessment1 to 8 hours............................................................................................................ 0.8 1.5 1.2 0.8More than 8 hours ................................................................................................. 1.8 1.9 2.0 0.7
Classroom management, including student discipline1 to 8 hours............................................................................................................ 1.2 1.3 1.7 0.9More than 8 hours ................................................................................................. 2.7 2.3 1.8 1.3
Addressing the needs of students with disabilities1 to 8 hours............................................................................................................ 0.9 2.0 1.8 0.7More than 8 hours ................................................................................................. 3.0 3.1 3.0 1.1
Addressing the needs of students with limited English proficiency or from diversecultural backgrounds
1 to 8 hours............................................................................................................ 1.0 1.9 2.2 1.2More than 8 hours ................................................................................................. 3.5 3.1 2.3 1.4
SOURCE: U.S. Department of Education, National Center for Education Statistics, Fast Response Survey System, Teacher Survey on ProfessionalDevelopment and Training, 1998.

D-22
Table D-16a.—Standard errors of the percent of full-time public school teachers who participated inactivities related to teaching in the last 12 months, by frequency of participation: 1998
Frequency of participation*
Activity A fewtimes a
year
Once amonth
2 to 3times amonth
At leastonce aweek
Regularly scheduled collaboration with other teachers ..................................................... 1.1 1.0 0.8 1.1Common planning period for team teachers...................................................................... 1.0 0.8 1.0 1.4Networking with teachers outside your school.................................................................. 1.2 0.8 0.8 0.7Individual or collaborative research on a topic of interest professionally ......................... 1.4 1.1 1.1 0.8Mentoring another teacher in a formal relationship........................................................... 2.0 1.2 1.7 1.9Being mentored by another teacher in a formal relationship ............................................. 2.3 1.2 1.6 1.8
*Estimates are based on those who participated in a particular activity related to teaching.
SOURCE: U.S. Department of Education, National Center for Education Statistics, Fast Response Survey System, Teacher Survey on ProfessionalDevelopment and Training, 1998.

D-23
Table D-17a.—Standard errors of the percent of full-time public school teachers who participated invarious activities related to teaching in the last 12 months indicating the extent towhich they believe the activity improved their teaching: 1998
Improved classroom teachingActivity
A lot Moderately Somewhat Not at all
Regularly scheduled collaboration with other teachers ..................................... 0.9 1.0 0.8 0.5
Common planning period for team teachers...................................................... 1.5 1.1 1.1 0.5
Networking with teachers outside your school.................................................. 1.2 1.0 1.2 0.4
Individual or collaborative research on a topic of interest professionally ......... 1.2 1.1 1.2 0.3
Mentoring another teacher in a formal relationship........................................... 1.6 2.1 1.9 1.1
Being mentored by another teacher in a formal relationship ............................. 1.8 1.7 2.0 1.1
SOURCE: U.S. Department of Education, National Center for Education Statistics, Fast Response Survey System, Teacher Survey on ProfessionalDevelopment and Training, 1998.

D-24
Table D-18a.—Standard errors of the percent of full-time public school teachers indicating the extentto which participation in activities related to teaching improved their classroomteaching, by the frequency with which they participated in that activity in the last 12months: 1998
Improved my teachingActivity
A lot Moderately Somewhat Not at all
Regularly scheduled collaboration with other teachers, excluding meetingsheld for administrative purposes
A few times a year......................................................................................... 1.8 1.7 2.1 1.4Once a month ................................................................................................ 1.9 2.2 2.3 1.12 to 3 times a month ...................................................................................... 2.1 2.5 2.5 0.9At least once a week...................................................................................... 1.8 2.0 1.2 0.6
Common planning period for team teachersA few times a year......................................................................................... 2.5 3.5 3.4 2.0Once a month ................................................................................................ 3.8 4.7 4.1 2.32 to 3 times a month ...................................................................................... 3.5 3.7 3.1 1.2At least once a week...................................................................................... 1.7 1.4 1.2 0.4
Networking with teachers outside your schoolA few times a year......................................................................................... 1.1 1.4 1.5 0.5Once a month ................................................................................................ 2.8 2.5 2.4 0.92 to 3 times a month ...................................................................................... 3.6 3.5 3.0 0.5At least once a week...................................................................................... 3.7 3.5 2.7 1.5
Individual or collaborative research on a topic of interest to youprofessionally
A few times a year......................................................................................... 1.7 1.7 2.2 0.4Once a month ................................................................................................ 3.3 3.3 3.3 0.62 to 3 times a month ...................................................................................... 2.4 3.1 2.5 1.0At least once a week...................................................................................... 2.6 2.0 2.1 0.3
Mentoring another teacher in a formal relationshipA few times a year......................................................................................... 2.1 3.3 3.7 2.3Once a month ................................................................................................ 4.6 4.5 5.1 4.32 to 3 times a month ...................................................................................... 3.5 5.3 4.6 3.0At least once a week...................................................................................... 2.6 3.0 2.8 2.0
Being mentored by another teacher in a formal relationshipA few times a year......................................................................................... 2.1 2.6 3.3 2.2Once a month ................................................................................................ 4.3 4.8 3.8 2.02 to 3 times a month ...................................................................................... 4.5 4.0 3.8 *At least once a week...................................................................................... 4.0 3.3 3.0 0.7
*Estimate of standard error is not derived because it is based on a statistic estimated at 0 or 100 percent.
SOURCE: U.S. Department of Education, National Center for Education Statistics, Fast Response Survey System, Teacher Survey on ProfessionalDevelopment and Training, 1998.

D-25
Table D-19a.—Standard errors of the average class size for full-time public school teachers in generalelementary classrooms and departmentalized settings, by selected schoolcharacteristics: 1998
Teaching assignment
School characteristic General elementaryclassrooms1
Departmentalizedsettings
All targeted public school teachers2 .............................................................. 0.2 0.1
LocaleCentral city ........................................................................................................ 0.2 0.3Urban fringe/large town .................................................................................... 0.3 0.2Rural/small town ............................................................................................... 0.3 0.2
RegionNortheast ........................................................................................................... 0.4 0.3Midwest............................................................................................................. 0.3 0.3South ................................................................................................................. 0.2 0.2West .................................................................................................................. 0.3 0.4
Percent minority enrollment in school5 percent or less................................................................................................. 0.4 0.26 to 20 percent................................................................................................... 0.3 0.221 to 50 percent................................................................................................. 0.3 0.3More than 50 percent......................................................................................... 0.3 0.3
Percent of students in school eligible for free or reduced-price school lunchLess than 15 percent.......................................................................................... 0.3 0.315 to 32 percent................................................................................................. 0.4 0.333 to 59 percent................................................................................................. 0.2 0.360 percent or more............................................................................................. 0.3 0.4
1The category labeled general elementary classrooms includes all teachers of self-contained classrooms in the 1998 FRSS study, regardless ofinstructional level. Almost all (95 percent) of the self-contained classrooms were at the elementary school level.2Targeted public school teachers were full-time public school teachers in grades 1 through 12 whose main teaching assignment was inEnglish/language arts, social studies/social sciences, foreign languages, mathematics, or science, or who taught a self-contained classroom.
SOURCE: U.S. Department of Education, National Center for Education Statistics, Fast Response Survey System, Teacher Survey on ProfessionalDevelopment and Training, 1998.
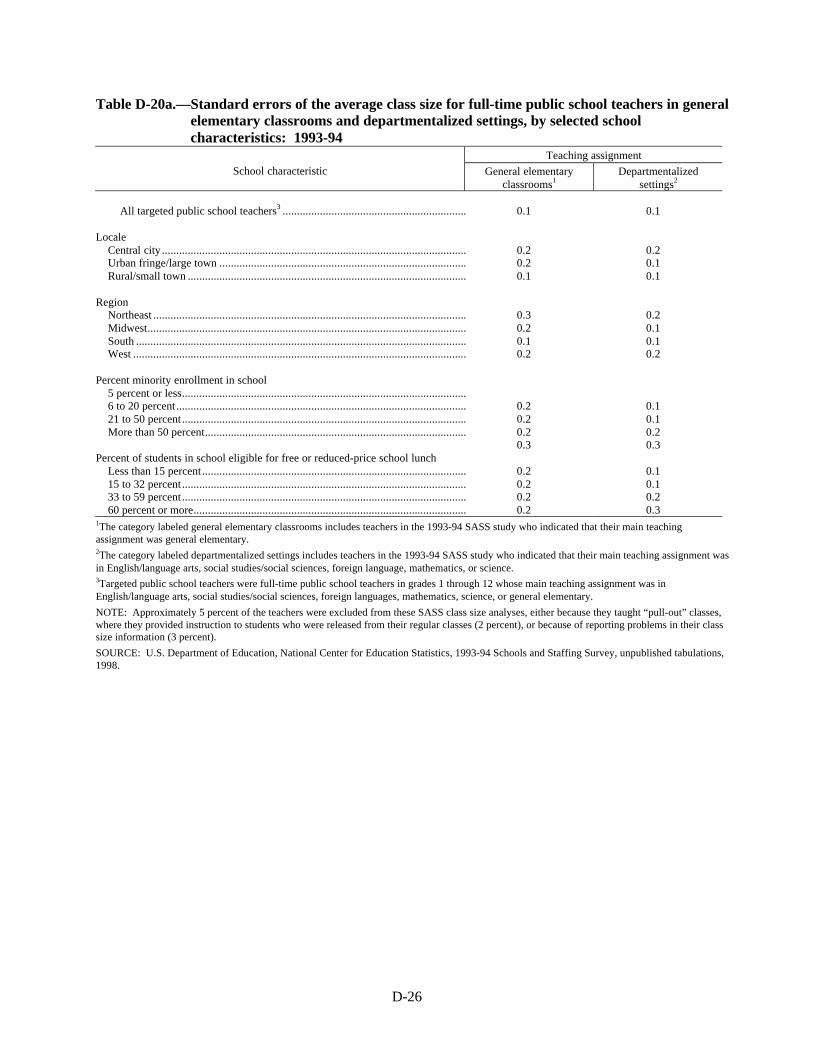
D-26
Table D-20a.—Standard errors of the average class size for full-time public school teachers in generalelementary classrooms and departmentalized settings, by selected schoolcharacteristics: 1993-94
Teaching assignment
School characteristic General elementaryclassrooms1
Departmentalizedsettings2
All targeted public school teachers3 ................................................................ 0.1 0.1
LocaleCentral city .......................................................................................................... 0.2 0.2Urban fringe/large town ...................................................................................... 0.2 0.1Rural/small town ................................................................................................. 0.1 0.1
RegionNortheast ............................................................................................................. 0.3 0.2Midwest............................................................................................................... 0.2 0.1South ................................................................................................................... 0.1 0.1West .................................................................................................................... 0.2 0.2
Percent minority enrollment in school5 percent or less...................................................................................................6 to 20 percent..................................................................................................... 0.2 0.121 to 50 percent................................................................................................... 0.2 0.1More than 50 percent........................................................................................... 0.2 0.2
0.3 0.3Percent of students in school eligible for free or reduced-price school lunch
Less than 15 percent............................................................................................ 0.2 0.115 to 32 percent................................................................................................... 0.2 0.133 to 59 percent................................................................................................... 0.2 0.260 percent or more............................................................................................... 0.2 0.3
1The category labeled general elementary classrooms includes teachers in the 1993-94 SASS study who indicated that their main teachingassignment was general elementary.2The category labeled departmentalized settings includes teachers in the 1993-94 SASS study who indicated that their main teaching assignment wasin English/language arts, social studies/social sciences, foreign language, mathematics, or science.3Targeted public school teachers were full-time public school teachers in grades 1 through 12 whose main teaching assignment was inEnglish/language arts, social studies/social sciences, foreign languages, mathematics, science, or general elementary.
NOTE: Approximately 5 percent of the teachers were excluded from these SASS class size analyses, either because they taught “pull-out” classes,where they provided instruction to students who were released from their regular classes (2 percent), or because of reporting problems in their classsize information (3 percent).
SOURCE: U.S. Department of Education, National Center for Education Statistics, 1993-94 Schools and Staffing Survey, unpublished tabulations,1998.
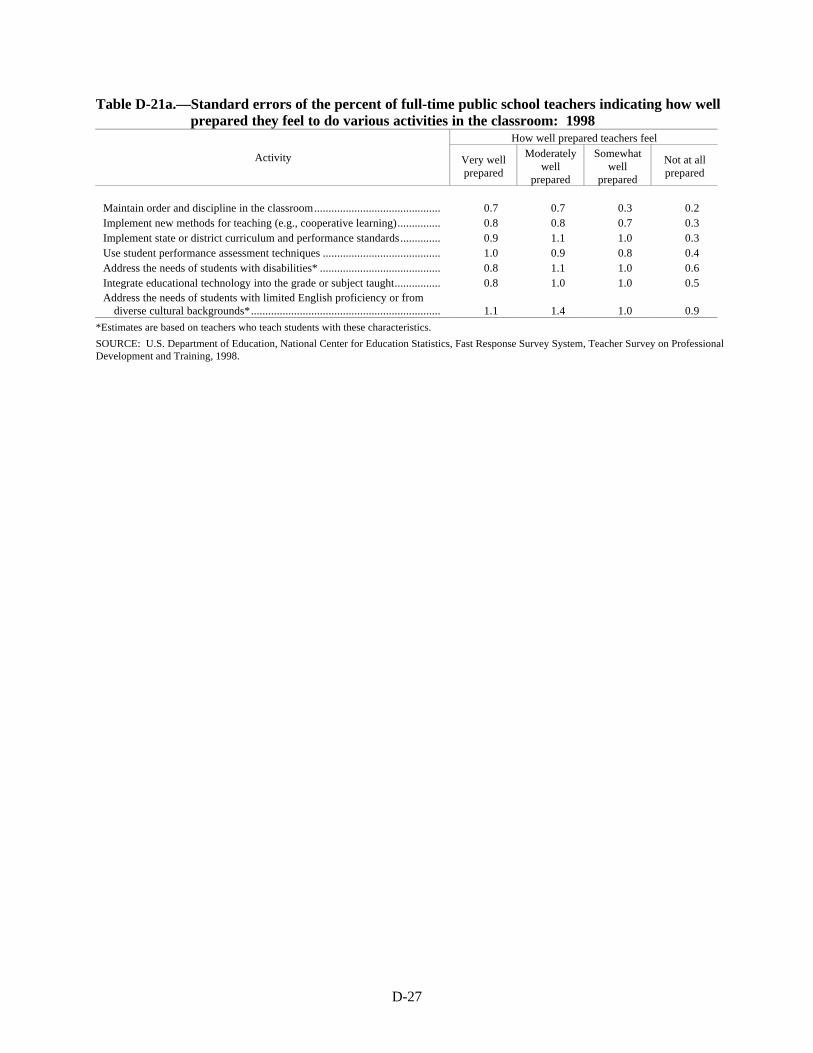
D-27
Table D-21a.—Standard errors of the percent of full-time public school teachers indicating how wellprepared they feel to do various activities in the classroom: 1998
How well prepared teachers feel
Activity Very wellprepared
Moderatelywell
prepared
Somewhatwell
prepared
Not at allprepared
Maintain order and discipline in the classroom............................................ 0.7 0.7 0.3 0.2Implement new methods for teaching (e.g., cooperative learning)............... 0.8 0.8 0.7 0.3Implement state or district curriculum and performance standards.............. 0.9 1.1 1.0 0.3Use student performance assessment techniques ......................................... 1.0 0.9 0.8 0.4Address the needs of students with disabilities* .......................................... 0.8 1.1 1.0 0.6Integrate educational technology into the grade or subject taught................ 0.8 1.0 1.0 0.5Address the needs of students with limited English proficiency or from
diverse cultural backgrounds*.................................................................. 1.1 1.4 1.0 0.9
*Estimates are based on teachers who teach students with these characteristics.
SOURCE: U.S. Department of Education, National Center for Education Statistics, Fast Response Survey System, Teacher Survey on ProfessionalDevelopment and Training, 1998.

D-28
Table D-22a.—Standard errors of the percent of full-time public school teachers indicating they feelvery well prepared to do various activities in the classroom, by teaching experience:1998
Teaching experienceContent area 3 or fewer
years4 to 9years
10 to 19years
20 or moreyears
Maintain order and discipline in the classroom............................................ 0.7 0.7 0.3 0.2Implement new methods of teaching (e.g., cooperative learning) ................ 2.0 1.8 1.9 1.8Implement state or district curriculum and performance standards.............. 1.9 1.7 2.0 1.7Use student performance assessment techniques ......................................... 1.7 1.5 1.7 1.5Address the needs of students with disabilities* .......................................... 0.8 1.1 1.0 0.6Integrate educational technology into the grade or subject taught................ 1.7 1.8 1.9 1.4Address the needs of students with limited English proficiency or from
diverse cultural backgrounds*.................................................................. 1.1 1.4 1.0 0.9
*Estimates are based on teachers who teach students with these characteristics.
SOURCE: U.S. Department of Education, National Center for Education Statistics, Fast Response Survey System, Teacher Survey on ProfessionalDevelopment and Training, 1998.

D-29
Table D-23a.—Standard errors of the comparison of recent teacher participation in professionaldevelopment in various content areas and perceived teacher preparedness forclassroom requirements in those content areas: 1998
Activity
Percent of teachersindicating theyparticipated inprofessional
development activities
Percent of all teachersindicating they felt very
well prepared for theclassroom activity
Of the teachers whoparticipated inprofessional
development, percentindicating they felt very
well prepared for theclassroom activity
Maintain order and discipline in the classroom .................. 0.9 0.7 1.3Implement new teaching methods ...................................... 0.7 0.8 1.0Implement state or district curriculum and performance
standards ........................................................................ 0.8 0.9 1.0Use student performance assessment techniques ................ 0.9 1.0 1.2Address the needs of students with disabilities................... 1.1 0.8 1.3Integrate educational technology into the grade or
subject taught ................................................................. 0.8 0.8 0.9Address the needs of students with limited English
proficiency or from diverse cultural backgrounds .......... 1.1 1.1 1.8
SOURCE: U.S. Department of Education, National Center for Education Statistics, Fast Response Survey System, Teacher Survey on ProfessionalDevelopment and Training, 1998.

D-30
Table D-24a.—Standard errors of the percent of full-time public school teachers indicating how wellprepared they feel to do various activities in the classroom, by the number of hoursspent in professional development in the content area of the activity in the last 12months: 1998
Content areaVery wellprepared
Moderatelywell
prepared
Somewhatwell
prepared
Not at allprepared
State or district curriculum and performance standards0 hours .............................................................................................................. 2.2 2.2 1.8 1.01 to 8 hours ....................................................................................................... 1.2 1.4 1.4 0.5More than 8 hours ............................................................................................. 1.9 1.9 1.5 0.3
Integration of educational technology into the grade or subject taught0 hours .............................................................................................................. 1.1 1.4 2.0 1.71 to 8 hours ....................................................................................................... 0.8 1.3 1.2 0.6More than 8 hours ............................................................................................. 1.9 1.9 1.6 0.5
New methods of teaching (e.g., cooperative learning)0 hours .............................................................................................................. 1.7 1.9 1.5 0.91 to 8 hours ....................................................................................................... 1.3 1.3 1.0 0.3More than 8 hours ............................................................................................. 1.7 1.6 0.9 0.1
Student performance assessment0 hours .............................................................................................................. 1.2 1.4 1.4 1.11 to 8 hours ....................................................................................................... 1.1 1.4 1.2 0.4More than 8 hours ............................................................................................. 2.3 1.9 1.3 0.6
Classroom management, including student discipline0 hours .............................................................................................................. 1.2 1.1 0.5 0.21 to 8 hours ....................................................................................................... 1.4 1.3 0.6 0.3More than 8 hours ............................................................................................. 2.8 2.5 1.0 0.3
Addressing the needs of students with disabilities1
0 hours .............................................................................................................. 1.0 1.8 1.4 1.11 to 8 hours ....................................................................................................... 1.4 1.7 1.3 0.8More than 8 hours ............................................................................................. 3.6 3.0 2.6 0.9
Addressing the needs of students with limited English proficiency or fromdiverse cultural backgrounds1
0 hours .............................................................................................................. 1.1 1.8 1.5 1.61 to 8 hours ....................................................................................................... 1.8 2.2 1.9 1.0More than 8 hours ............................................................................................. 3.5 3.1 2.4 0.6
1Estimates are based on teachers who teach students with these characteristics.
SOURCE: U.S. Department of Education, National Center for Education Statistics, Fast Response Survey System, Teacher Survey on ProfessionalDevelopment and Training, 1998.
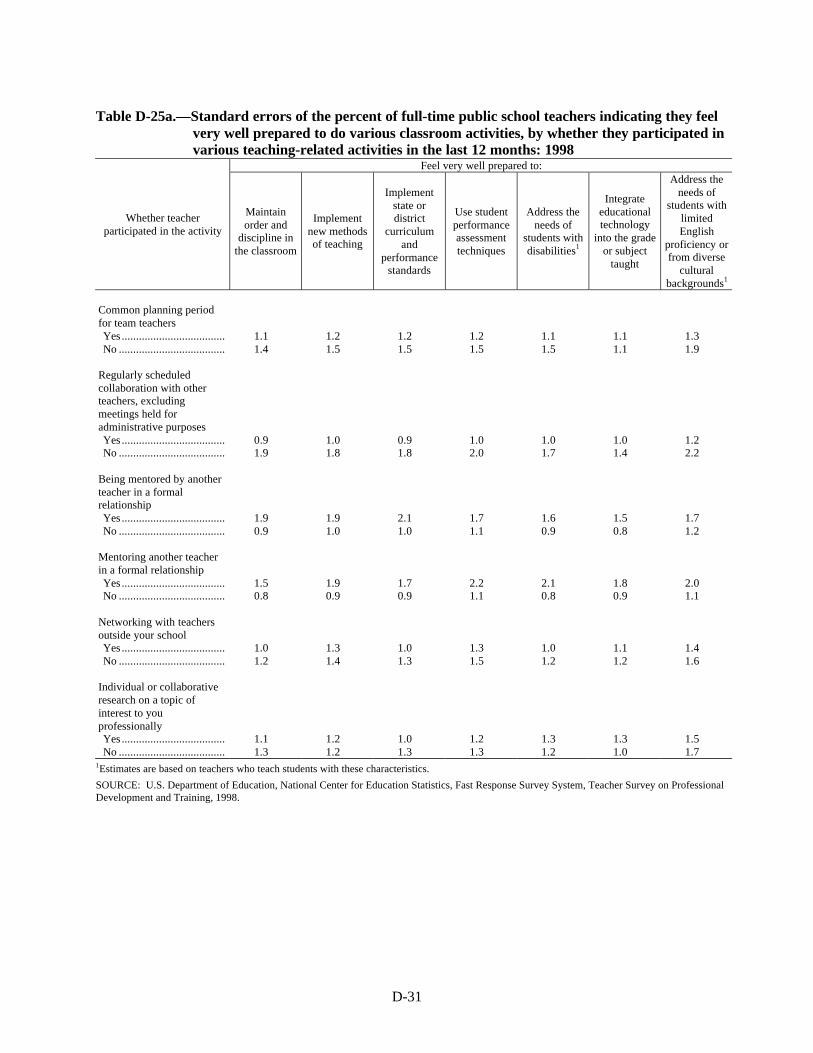
D-31
Table D-25a.—Standard errors of the percent of full-time public school teachers indicating they feelvery well prepared to do various classroom activities, by whether they participated invarious teaching-related activities in the last 12 months: 1998
Feel very well prepared to:
Whether teacherparticipated in the activity
Maintainorder and
discipline inthe classroom
Implementnew methodsof teaching
Implementstate ordistrict
curriculumand
performancestandards
Use studentperformanceassessmenttechniques
Address theneeds of
students withdisabilities1
Integrateeducationaltechnology
into the gradeor subject
taught
Address theneeds of
students withlimitedEnglish
proficiency orfrom diverse
culturalbackgrounds1
Common planning periodfor team teachersYes .................................... 1.1 1.2 1.2 1.2 1.1 1.1 1.3No ..................................... 1.4 1.5 1.5 1.5 1.5 1.1 1.9
Regularly scheduledcollaboration with otherteachers, excludingmeetings held foradministrative purposesYes .................................... 0.9 1.0 0.9 1.0 1.0 1.0 1.2No ..................................... 1.9 1.8 1.8 2.0 1.7 1.4 2.2
Being mentored by anotherteacher in a formalrelationshipYes .................................... 1.9 1.9 2.1 1.7 1.6 1.5 1.7No ..................................... 0.9 1.0 1.0 1.1 0.9 0.8 1.2
Mentoring another teacherin a formal relationshipYes .................................... 1.5 1.9 1.7 2.2 2.1 1.8 2.0No ..................................... 0.8 0.9 0.9 1.1 0.8 0.9 1.1
Networking with teachersoutside your schoolYes .................................... 1.0 1.3 1.0 1.3 1.0 1.1 1.4No ..................................... 1.2 1.4 1.3 1.5 1.2 1.2 1.6
Individual or collaborativeresearch on a topic ofinterest to youprofessionallyYes .................................... 1.1 1.2 1.0 1.2 1.3 1.3 1.5No ..................................... 1.3 1.2 1.3 1.3 1.2 1.0 1.7
1Estimates are based on teachers who teach students with these characteristics.
SOURCE: U.S. Department of Education, National Center for Education Statistics, Fast Response Survey System, Teacher Survey on ProfessionalDevelopment and Training, 1998.

D-32
Table D-26.—Standard errors for the figures and for data not shown in tables: FRSS 1998 and SASS1993-94
Item EstimateStandard
error
Figure 1: Percent of full-time public school teachers who hold master’s degree, by selectedschool and teacher characteristics
School level: elementary school ............................................................................................................. 40 1.8School level: middle school.................................................................................................................... 46 1.9School level: high school........................................................................................................................ 55 1.5School level: combined .......................................................................................................................... 49 3.7Teaching experience: less than 3 years................................................................................................... 16 1.6Teaching experience: 4 to 9 years........................................................................................................... 31 2.3Teaching experience: 10 to 19 years....................................................................................................... 48 1.8Teaching experience: 20 or more years .................................................................................................. 62 1.5Free or reduced-price lunch: less than 15 percent................................................................................... 57 1.8Free or reduced-price lunch: 15 to 32 percent ........................................................................................ 46 2.0Free or reduced-price lunch: 33 to 59 percent ........................................................................................ 41 2.4Free or reduced-price lunch: 60 percent or more .................................................................................... 37 2.3Region: Northeast................................................................................................................................... 60 2.8Region: Midwest .................................................................................................................................... 51 2.0Region: South ......................................................................................................................................... 39 1.6Region: West .......................................................................................................................................... 38 2.0
Figure 2: Percent of full-time public school teachers who hold master’s degree, by selectedschool and teacher characteristics: 1993-94
School level: elementary school ............................................................................................................. 42 0.7School level: middle school.................................................................................................................... 46 1.4School level: high school........................................................................................................................ 55 0.7School level: combined .......................................................................................................................... 47 0.8Teaching experience: less than 3 years................................................................................................... 15 1.0Teaching experience: 4 to 9 years........................................................................................................... 30 1.1Teaching experience: 10 to 19 years....................................................................................................... 49 1.1Teaching experience: 20 or more years .................................................................................................. 61 0.9Free or reduced-price lunch: less than 15 percent................................................................................... 53 1.0Free or reduced-price lunch: 15 to 32 percent ........................................................................................ 46 0.9Free or reduced-price lunch: 33 to 59 percent 41 1.0Free or reduced-price lunch: 60 percent or more 41 1.2Region: Northeast................................................................................................................................... 60 1.1Region: Midwest .................................................................................................................................... 47 1.2Region: South ......................................................................................................................................... 42 0.7Region: West .......................................................................................................................................... 37 1.2
Figure 3: Percent of full-time public school teachers in general elementary classrooms anddepartmentalized settings with a regular or standard state certificate or advanced professionalcertificate, by teaching experience
General elementary classrooms: 3 or fewer years................................................................................... 65 3.1General elementary classrooms: 4 to 9 years.......................................................................................... 92 1.6General elementary classrooms: 10 to 19 years ...................................................................................... 99 0.6General elementary classrooms: 20 or more years.................................................................................. 99 0.5Departmentalized setting: Main teaching assignment: 3 or fewer years ................................................ 64 2.3Departmentalized setting: Main teaching assignment: 4 to 9 years ....................................................... 89 1.5Departmentalized setting: Main teaching assignment: 10 to 19 years.................................................... 97 0.7Departmentalized setting: Main teaching assignment: 20 or more years ............................................... 99 0.4

D-33
Table D-26.—Standard errors for the figures and for data not shown in tables: FRSS 1998 and SASS1993-94 (continued)
Item EstimateStandard
error
Figure 4: Percent of full-time classroom and departmentalized teachers in public schools with aregular or standard state certificate or advanced professional certificate, by teachingexperience: 1993-94
General elementary classrooms: 3 or fewer years................................................................................... 73 2.8General elementary classrooms: 4 to 9 years.......................................................................................... 92 0.9General elementary classrooms: 10 to 19 years ...................................................................................... 97 0.6Self-contained: 20 or more years ............................................................................................................ 99 0.4Departmentalized setting: Main teaching assignment: 3 or fewer years ................................................ 66 1.5Departmentalized setting: Main teaching assignment: 4 to 9 years ....................................................... 86 1.2Departmentalized setting: Main teaching assignment: 10 to 19 years.................................................... 94 0.6Departmentalized setting: Main teaching assignment: 20 or more years ............................................... 96 0.4
Figure 5: Percent of full-time public school teachers who participated in professionaldevelopment activities in the last 12 months that focused on various topics: 1998
State or district curriculum and performance standards.......................................................................... 81 0.8Integration of educational technology in the grade or subject you teach ................................................ 78 0.8New methods of teaching (e.g., cooperative learning)............................................................................ 77 0.7In-depth study in the subject area of your main teaching assignment ..................................................... 73 0.8Student performance assessment ............................................................................................................ 67 0.9Classroom management, including student discipline ............................................................................ 49 0.9Addressing the needs of students with disabilities.................................................................................. 48 1.1Addressing the needs of students with limited English proficiency or from diverse cultural
backgrounds ....................................................................................................................................... 31 1.1
Figure 6: Percent of full-time public school teachers who participated in professionaldevelopment activities since the end of the last school year that focused on various topics:1993-94
Methods of teaching your subject field................................................................................................... 67 0.4Student assessment ................................................................................................................................. 55 0.5Cooperative learning in the classroom.................................................................................................... 53 0.5Uses of educational technology for instruction....................................................................................... 51 0.6In-depth study in your subject field ........................................................................................................ 29 0.4
Figure 7: Percent of full-time public school teachers who participated in professionaldevelopment activities in the last 12 months that addressed the needs of students with limitedEnglish proficiency or from diverse cultural backgrounds, by percent of minority enrollment inthe school: 1998
Percent minority enrollment: 5 percent or less........................................................................................ 14 1.5Percent minority enrollment: 6 to 20 percent.......................................................................................... 29 1.9Percent minority enrollment: 21 to 50 percent........................................................................................ 34 2.0Percent minority enrollment: more than 50 percent................................................................................ 51 2.5
Figure 8: Percent of full-time public school teachers who participated in professionaldevelopment activities in the last 12 months that addressed the needs of students with limitedEnglish proficiency or from diverse cultural backgrounds, by region: 1998
Northeast ................................................................................................................................................ 22 2.2Midwest.................................................................................................................................................. 22 1.9South ...................................................................................................................................................... 33 1.7West........................................................................................................................................................ 51 2.4
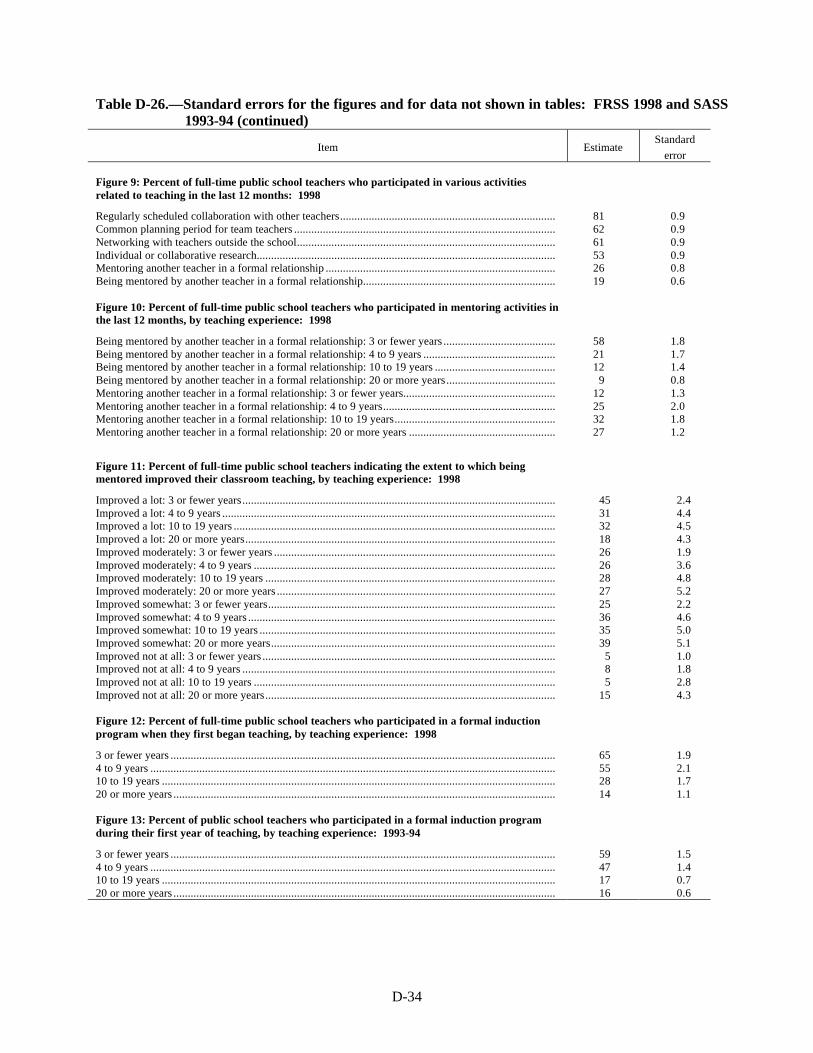
D-34
Table D-26.—Standard errors for the figures and for data not shown in tables: FRSS 1998 and SASS1993-94 (continued)
Item EstimateStandard
error
Figure 9: Percent of full-time public school teachers who participated in various activitiesrelated to teaching in the last 12 months: 1998
Regularly scheduled collaboration with other teachers........................................................................... 81 0.9Common planning period for team teachers ........................................................................................... 62 0.9Networking with teachers outside the school.......................................................................................... 61 0.9Individual or collaborative research........................................................................................................ 53 0.9Mentoring another teacher in a formal relationship ................................................................................ 26 0.8Being mentored by another teacher in a formal relationship................................................................... 19 0.6
Figure 10: Percent of full-time public school teachers who participated in mentoring activities inthe last 12 months, by teaching experience: 1998
Being mentored by another teacher in a formal relationship: 3 or fewer years ....................................... 58 1.8Being mentored by another teacher in a formal relationship: 4 to 9 years .............................................. 21 1.7Being mentored by another teacher in a formal relationship: 10 to 19 years .......................................... 12 1.4Being mentored by another teacher in a formal relationship: 20 or more years...................................... 9 0.8Mentoring another teacher in a formal relationship: 3 or fewer years..................................................... 12 1.3Mentoring another teacher in a formal relationship: 4 to 9 years............................................................ 25 2.0Mentoring another teacher in a formal relationship: 10 to 19 years........................................................ 32 1.8Mentoring another teacher in a formal relationship: 20 or more years ................................................... 27 1.2
Figure 11: Percent of full-time public school teachers indicating the extent to which beingmentored improved their classroom teaching, by teaching experience: 1998
Improved a lot: 3 or fewer years............................................................................................................. 45 2.4Improved a lot: 4 to 9 years .................................................................................................................... 31 4.4Improved a lot: 10 to 19 years ................................................................................................................ 32 4.5Improved a lot: 20 or more years............................................................................................................ 18 4.3Improved moderately: 3 or fewer years .................................................................................................. 26 1.9Improved moderately: 4 to 9 years ......................................................................................................... 26 3.6Improved moderately: 10 to 19 years ..................................................................................................... 28 4.8Improved moderately: 20 or more years ................................................................................................. 27 5.2Improved somewhat: 3 or fewer years.................................................................................................... 25 2.2Improved somewhat: 4 to 9 years ........................................................................................................... 36 4.6Improved somewhat: 10 to 19 years ....................................................................................................... 35 5.0Improved somewhat: 20 or more years................................................................................................... 39 5.1Improved not at all: 3 or fewer years ...................................................................................................... 5 1.0Improved not at all: 4 to 9 years ............................................................................................................. 8 1.8Improved not at all: 10 to 19 years ......................................................................................................... 5 2.8Improved not at all: 20 or more years..................................................................................................... 15 4.3
Figure 12: Percent of full-time public school teachers who participated in a formal inductionprogram when they first began teaching, by teaching experience: 1998
3 or fewer years ...................................................................................................................................... 65 1.94 to 9 years ............................................................................................................................................. 55 2.110 to 19 years ......................................................................................................................................... 28 1.720 or more years ..................................................................................................................................... 14 1.1
Figure 13: Percent of public school teachers who participated in a formal induction programduring their first year of teaching, by teaching experience: 1993-94
3 or fewer years ...................................................................................................................................... 59 1.54 to 9 years ............................................................................................................................................. 47 1.410 to 19 years ......................................................................................................................................... 17 0.720 or more years ..................................................................................................................................... 16 0.6

D-35
Table D-26.—Standard errors for the figures and for data not shown in tables: FRSS 1998 and SASS1993-94 (continued)
Item EstimateStandard
error
Figure 14: Percent of full-time public school teachers indicating the length of the formalinduction program in which they participated when they first began teaching: 1998
Length of program: 3 months or less ....................................................................................................... 12 1.0Length of program: more than 3 to 8 months .......................................................................................... 10 0.9Length of program: 9 months to 1 year.................................................................................................... 66 1.5Length of program: more than a year ...................................................................................................... 12 1.0
Figure 15: Percent of full-time public school teachers agreeing or disagreeing with selectedstatements about parent and school support for teachers: 1998
Other teachers share ideas that are helpful to me in my work: strongly agree ........................................ 63 0.9Other teachers share ideas that are helpful to me in my work: somewhat agree ..................................... 33 0.9Other teachers share ideas that are helpful to me in my work: somewhat disagree ............................... 4 0.3Other teachers share ideas that are helpful to me in my work: strongly disagree.................................... 1 0.1The school administration supports me in my work: strongly agree....................................................... 55 1.1The school administration supports me in my work: somewhat agree.................................................... 36 1.0The school administration supports me in my work: somewhat disagree ............................................... 7 0.5The school administration supports me in my work: strongly disagree .................................................. 2 0.3School goals and priorities are clear: strongly agree............................................................................... 47 1.1School goals and priorities are clear: somewhat agree............................................................................ 38 1.0School goals and priorities are clear: somewhat disagree ...................................................................... 11 0.6School goals and priorities are clear: strongly disagree .......................................................................... 4 0.4Parents support me in my efforts to educate their children: strongly agree............................................. 32 1.1Parents support me in my efforts to educate their children: somewhat agree.......................................... 54 1.1Parents support me in my efforts to educate their children: somewhat disagree ..................................... 11 0.6Parents support me in my efforts to educate their children: strongly disagree ........................................ 3 0.3
Figure 16: Percent of full-time public school teachers agreeing or disagreeing with selectedstatements about parent and school support for teachers: 1993-94
The school administration behavior toward the staff is supportive and encouraging: strongly agree ..... 41 0.5The school administration behavior toward the staff is supportive and encouraging: somewhat agree .. 38 0.5The school administration behavior toward the staff is supportive and encouraging: somewhat
disagree ............................................................................................................................................... 14 0.3The school administration behavior toward the staff is supportive and encouraging: strongly disagree. 7 0.3Goals and priorities for the school are clear: strongly agree ................................................................... 37 0.5Goals and priorities for the school are clear: somewhat agree ................................................................ 45 0.4Goals and priorities for the school are clear: somewhat disagree ........................................................... 14 0.4Goals and priorities for the school are clear: strongly disagree............................................................... 4 0.2I receive a great deal of support from parents for the work I do: strongly agree..................................... 11 0.3I receive a great deal of support from parents for the work I do: somewhat agree.................................. 42 0.5I receive a great deal of support from parents for the work I do: somewhat disagree ............................. 30 0.4I receive a great deal of support from parents for the work I do: strongly disagree ................................ 17 0.4

D-36
Table D-26.—Standard errors for the figures and for data not shown in tables: FRSS 1998 and SASS1993-94 (continued)
Item EstimateStandard
error
Figure 17: Percent of full-time public school teachers who strongly agreed with selectedstatements about parent and school support for teachers, by school instructional level: 1998
Other teachers share ideas that are helpful to me in my work: elementary school................................. 69 1.5Other teachers share ideas that are helpful to me in my work: middle school ........................................ 60 1.8Other teachers share ideas that are helpful to me in my work: high school ............................................ 53 1.5Other teachers share ideas that are helpful to me in my work: combined school.................................... 49 3.8The school administration supports me in my work: elementary school................................................. 56 1.9The school administration supports me in my work: middle school ....................................................... 59 1.6The school administration supports me in my work: high school ........................................................... 49 1.7The school administration supports me in my work: combined school .................................................. 48 3.8Goals and priorities for the school are clear: elementary school............................................................ 52 1.7Goals and priorities for the school are clear: middle school .................................................................. 48 1.5Goals and priorities for the school are clear: high school ...................................................................... 37 1.6Goals and priorities for the school are clear: combined ......................................................................... 32 3.6Parents support me in my efforts to educate their children: elementary school ..................................... 36 1.7Parents support me in my efforts to educate their children: middle school............................................ 30 1.6Parents support me in my efforts to educate their children: high school................................................ 24 1.4Parents support me in my efforts to educate their children: combined ................................................... 25 3.3
Figure 18: Percent of full-time public school teachers who strongly agreed with selectedstatements about parent and school support for teachers, by school instructional level: 1993-94
The school administrations’ behavior toward the staff is supportive and encouraging: elementaryschool ................................................................................................................................................. 44 0.8
The school administrations’ behavior toward the staff is supportive and encouraging: middle school... 41 1.3The school administrations’ behavior toward the staff is supportive and encouraging: high school....... 33 0.6The school administrations’ behavior toward the staff is supportive and encouraging: combined ......... 36 0.9Goals and priorities for the school are clear: elementary school............................................................. 44 0.7Goals and priorities for the school are clear: middle school ................................................................... 35 1.3Goals and priorities for the school are clear: high school ....................................................................... 27 0.6Goals and priorities for the school are clear: combined .......................................................................... 27 1.0I receive a great deal of support from parents for the work I do: elementary school .............................. 15 0.6I receive a great deal of support from parents for the work I do: middle school ..................................... 8 0.7I receive a great deal of support from parents for the work I do: high school......................................... 6 0.3I receive a great deal of support from parents for the work I do: combined............................................ 7 0.4
Figure 19: Percent of full-time public school teachers who strongly agreed with selectedstatements about parent and school support for teachers, by teaching experience: 1998
Other teachers share ideas that are helpful to me in my work: 3 or fewer years ..................................... 67 1.6Other teachers share ideas that are helpful to me in my work: 4 to 9 years ............................................. 66 1.6Other teachers share ideas that are helpful to me in my work: 10 to 19 years ......................................... 62 1.9Other teachers share ideas that are helpful to me in my work: 20 or more years ..................................... 60 1.4The school administration supports me in my work: 3 or fewer years.................................................... 60 2.6The school administration supports me in my work: 4 to 9 years............................................................ 56 2.0The school administration supports me in my work: 10 to 19 years ........................................................ 53 2.1The school administration supports me in my work: 20 or more years.................................................... 52 1.4Goals and priorities for the school are clear: 3 or fewer years ................................................................ 46 2.8Goals and priorities for the school are clear: 4 to 9 years ........................................................................ 46 2.0Goals and priorities for the school are clear: 10 to 19 years .................................................................... 48 2.0Goals and priorities for the school are clear: 20 or more years................................................................ 48 1.6Parents support me in my efforts to educate their children: 3 or fewer years .......................................... 26 1.7Parents support me in my efforts to educate their children: 4 to 9 years.................................................. 32 2.1Parents support me in my efforts to educate their children: 10 to 19 years.............................................. 32 2.0Parents support me in my efforts to educate their children: 20 or more years ......................................... 33 1.6

D-37
Table D-26.—Standard errors for the figures and for data not shown in tables: FRSS 1998 and SASS1993-94 (continued)
Item EstimateStandard
error
Figure 20: Percent of full-time public school teachers who strongly agreed with selectedstatements about parent and school support for teachers, by teaching experience: 1993-94
The school administrations’ behavior toward the staff is supportive and encouraging: 3 or fewer years 48 1.5The school administrations’ behavior toward the staff is supportive and encouraging: 4 to 9 years........ 40 1.0The school administrations’ behavior toward the staff is supportive and encouraging: 10 to 19 years... 41 0.8The school administrations’ behavior toward the staff is supportive and encouraging: 20 or more years 38 0.9Goals and priorities for the school are clear: 3 or fewer years ................................................................. 37 1.8Goals and priorities for the school are clear: 4 to 9 years ........................................................................ 35 0.9Goals and priorities for the school are clear: 10 to 19 years .................................................................... 40 0.9Goals and priorities for the school are clear: 20 or more years................................................................ 37 0.8I receive a great deal of support from parents for the work I do: 3 or fewer years................................... 10 1.0I receive a great deal of support from parents for the work I do: 4 to 9 years.......................................... 10 0.7I receive a great deal of support from parents for the work I do: 10 to 19 years...................................... 11 0.7I receive a great deal of support from parents for the work I do: 20 or more years.................................. 12 0.5
Figure 21: Percent of full-time public school teachers agreeing or disagreeing that parentssupport them in their efforts to educate their children, by percent of students in school eligiblefor free or reduced-price school lunch: 1998
Less than 15 percent: strongly agree....................................................................................................... 41 1.9Less than 15 percent: somewhat agree.................................................................................................... 53 2.0Less than 15 percent: somewhat disagree ............................................................................................... 5 0.5Less than 15 percent: strongly disagree .................................................................................................. 1 0.415 to 32 percent: strongly agree.............................................................................................................. 34 2.015 to 32 percent: somewhat agree........................................................................................................... 56 1.815 to 32 percent: somewhat disagree ...................................................................................................... 9 1.015 to 32 percent: strongly disagree ......................................................................................................... 1 0.433 to 59 percent: strongly agree.............................................................................................................. 29 2.233 to 59 percent: somewhat agree........................................................................................................... 57 2.133 to 59 percent: somewhat disagree ...................................................................................................... 11 1.233 to 59 percent: strongly disagree ......................................................................................................... 3 0.860 percent or more: strongly agree ......................................................................................................... 23 1.860 percent or more: somewhat agree ...................................................................................................... 53 2.260 percent or more: somewhat disagree.................................................................................................. 17 1.760 percent or more: strongly disagree..................................................................................................... 7 0.9
Figure 22: Percent of full-time public school teachers agreeing or disagreeing that they receive agreat deal of support from parents for the work they do, by percent of students in school eligiblefor free or reduced-price school lunch: 1993-94
Less than 15 percent: strongly agree....................................................................................................... 15 0.7Less than 15 percent: somewhat agree.................................................................................................... 48 0.9Less than 15 percent: somewhat disagree ............................................................................................... 27 0.9Less than 15 percent: strongly disagree .................................................................................................. 11 0.615 to 32 percent: strongly agree.............................................................................................................. 11 0.615 to 32 percent: somewhat agree........................................................................................................... 44 0.915 to 32 percent: somewhat disagree ...................................................................................................... 30 0.715 to 32 percent: strongly disagree ......................................................................................................... 16 0.733 to 59 percent: strongly agree.............................................................................................................. 9 0.733 to 59 percent: somewhat agree........................................................................................................... 41 1.133 to 59 percent: somewhat disagree ...................................................................................................... 31 1.033 to 59 percent: strongly disagree ......................................................................................................... 19 0.860 percent or more: strongly agree ......................................................................................................... 10 0.660 percent or more: somewhat agree ...................................................................................................... 33 1.260 percent or more: somewhat disagree.................................................................................................. 33 1.060 percent or more: strongly disagree..................................................................................................... 25 1.1

D-38
Table D-26.—Standard errors for the figures and for data not shown in tables: FRSS 1998 and SASS1993-94 (continued)
Item EstimateStandard
error
Figure 23: Percent of full-time public school teachers indicating they feel very well ormoderately well prepared to address the needs of students with limited English proficiency orfrom diverse cultural backgrounds, by percent minority enrollment in the school: 1998
5 percent or less: very well prepared ...................................................................................................... 10 2.05 percent or less: moderately well prepared............................................................................................ 25 2.96 to 20 percent: very well prepared......................................................................................................... 15 1.96 to 20 percent: moderately well prepared.............................................................................................. 33 2.621 to 50 percent: very well prepared....................................................................................................... 20 1.921 to 50 percent: moderately well prepared............................................................................................ 34 2.5More than 50 percent: very well prepared .............................................................................................. 27 2.4More than 50 percent: moderately well prepared.................................................................................... 37 2.4
Figure 24: Percent of full-time public school teachers indicating they feel very well prepared todo various classroom activities, by whether they participated in professional developmentactivities in the last 12 months that focused on these content areas: 1998
Maintain order/discipline in the classroom: participated ......................................................................... 68 1.3Maintain order/discipline in the classroom: did not participate ............................................................... 74 1.3New methods of teaching: participated.................................................................................................... 43 1.0New methods of teaching: did not participate.......................................................................................... 34 1.7State/district curriculum and performance standards: participated .......................................................... 38 1.0State/district curriculum and performance standards: did not participate ................................................ 20 2.3Student performance assessment: participated......................................................................................... 33 1.2Student performance assessment: did not participate............................................................................... 20 1.2Addressing the needs of students with disabilities: participated ............................................................. 25 1.3Addressing the needs of students with disabilities: did not participate .................................................... 17 1.0Integration of educational technology: participated................................................................................. 23 0.9Integration of educational technology: did not participate....................................................................... 11 1.1Addressing the needs of limited English students: participated ............................................................... 28 1.8Addressing the needs of limited English students: did not participate ..................................................... 14 1.1
Chapter 2, section on teacher certification
Percent of teachers in 1998 with 3 or fewer years of teaching experience that had emergency ortemporary certification ............................................................................................................................ 12 2.3Percent of teachers in 1998 with 10 or more years of teaching experience that had emergency ortemporary certification ............................................................................................................................ 0.1 0.1
Chapter 3, section on formal professional development
Percent of teachers in 1998 that had participated in professional development programs in at least oneof the listed content areas ........................................................................................................................ 99 0.2Percent of teachers in 1993-94 that had participated in professional development programs in at leastone of the listed content areas.................................................................................................................. 90 0.3
Chapter 3, section on participation in collaborative activities
Percent of teachers in 1998 that had participated in at least one of the listed collaborative activities...... 95 0.4
Chapter 5, section on teachers’ preparedness for classroom requirements
Percent of teachers in 1998 that taught limited English proficient or culturally diverse students ............ 54 1.3Percent of teachers in 1998 that taught students with disabilities ............................................................ 71 0.9

D-39
Table D-A-2a.—Standard errors of the percent of full-time public school teachers with any under-graduate or graduate major in various fields of study, by selected school andteacher characteristics: 1998
School characteristic Academicfield
Subject areaeducation1
Generaleducation
Othereducation2
All targeted public school teachers3 ................................................... 0.9 0.7 0.9 0.6
School instructional levelElementary school.............................................................................. 1.5 1.2 1.2 1.0Middle school..................................................................................... 2.2 1.6 2.3 1.1High school ........................................................................................ 1.3 1.5 1.2 1.1Combined........................................................................................... 3.4 3.0 3.8 2.4
Teaching experience3 or fewer years.................................................................................. 2.1 1.2 2.2 1.14 to 9 years ......................................................................................... 2.0 1.8 2.2 1.210 to 19 years ..................................................................................... 1.5 1.8 1.7 1.320 or more years................................................................................. 1.6 1.0 1.5 1.3
1Subject area education is the teaching of an academic field, such as mathematics education.2Examples of other education fields are special education, curriculum and instruction, and educational administration.3Targeted public school teachers were full-time public school teachers in grades 1 through 12 whose main teaching assignment was inEnglish/language arts, social studies/social sciences, foreign languages, mathematics, or science, or who taught a self-contained classroom.
NOTE: Estimates are duplicated. That is, teachers with more than one major or more than one degree are counted for each field of study in whichthey have a major or degree.
SOURCE: U.S. Department of Education, National Center for Education Statistics, Fast Response Survey System, Teacher Survey on ProfessionalDevelopment and Training, 1998.

D-40
Table D-A-3a.—Standard errors of the percent of full-time public school teachers with any under-graduate or graduate major in various fields of study, by selected school and teachercharacteristics: 1993-94
School characteristic Academicfield
Subject areaeducation1
Generaleducation
Othereducation2
All targeted public school teachers3 ................................................... 0.5 0.4 0.5 0.3
School instructional levelElementary school.............................................................................. 0.8 0.6 0.6 0.5Middle school..................................................................................... 1.2 1.1 1.4 1.0High school ........................................................................................ 0.6 0.5 0.5 0.4Combined........................................................................................... 0.9 0.7 0.6 0.6
Teaching experience3 or fewer years.................................................................................. 1.7 0.9 1.7 0.54 to 9 years ......................................................................................... 1.1 0.8 1.1 0.710 to 19 years ..................................................................................... 0.7 0.8 0.8 0.620 or more years................................................................................. 0.8 0.7 0.6 0.5
1Subject area education is the teaching of an academic field, such as mathematics education.2Examples of other education fields are special education, curriculum and instruction, and educational administration.3Targeted public school teachers were full-time public school teachers in grades 1 through 12 whose main teaching assignment was inEnglish/language arts, social studies/social sciences, foreign languages, mathematics, science, or general elementary.
NOTE: Estimates are duplicated. That is, teachers with more than one major or more than one degree are counted for each field of study in whichthey have a major or degree.
SOURCE: U.S. Department of Education, National Center for Education Statistics, 1993-94 Schools and Staffing Survey, unpublished tabulations,1998.

E-1
Appendix E
1998 Teacher Survey onProfessional Development and Training
Fast Response Survey System Questionnaire

E-2
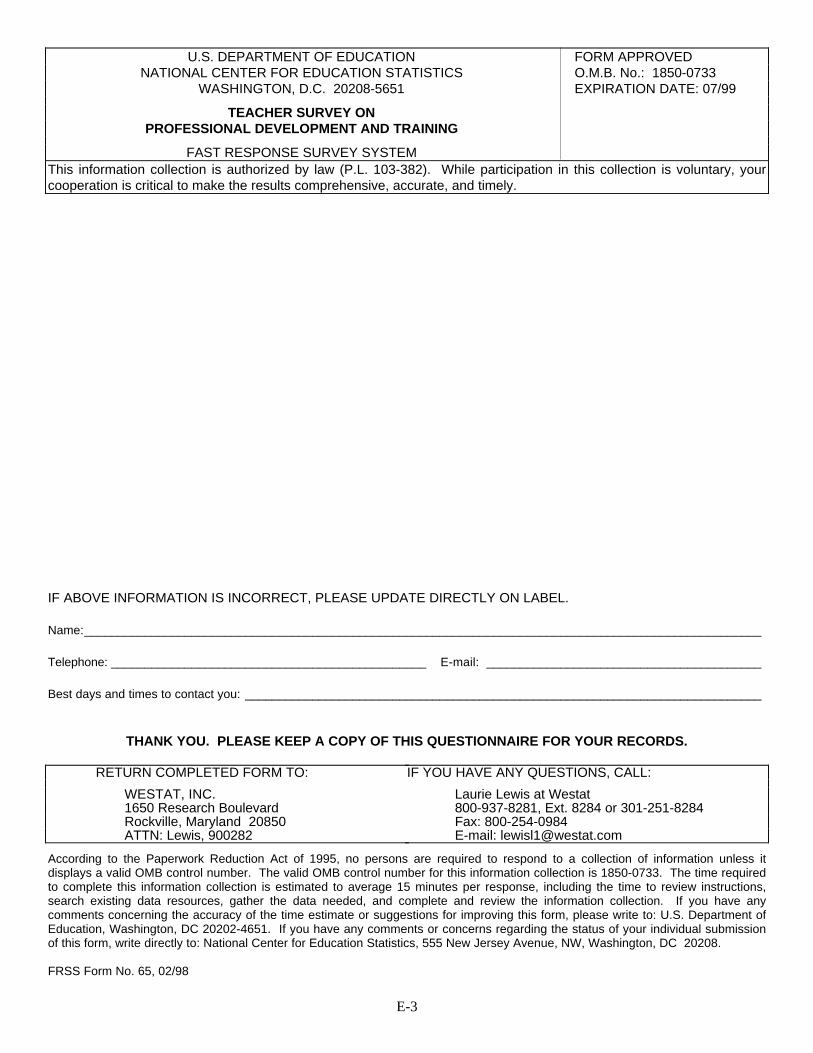
E-3
U.S. DEPARTMENT OF EDUCATION FORM APPROVEDNATIONAL CENTER FOR EDUCATION STATISTICS O.M.B. No.: 1850-0733
WASHINGTON, D.C. 20208-5651 EXPIRATION DATE: 07/99
TEACHER SURVEY ONPROFESSIONAL DEVELOPMENT AND TRAINING
FAST RESPONSE SURVEY SYSTEMThis information collection is authorized by law (P.L. 103-382). While participation in this collection is voluntary, yourcooperation is critical to make the results comprehensive, accurate, and timely.
IF ABOVE INFORMATION IS INCORRECT, PLEASE UPDATE DIRECTLY ON LABEL.
Name:_____________________________________________________________________________________________________
Telephone: _______________________________________________ E-mail: _________________________________________
Best days and times to contact you: _____________________________________________________________________________
THANK YOU. PLEASE KEEP A COPY OF THIS QUESTIONNAIRE FOR YOUR RECORDS.
RETURN COMPLETED FORM TO:
WESTAT, INC.1650 Research BoulevardRockville, Maryland 20850ATTN: Lewis, 900282
IF YOU HAVE ANY QUESTIONS, CALL:
Laurie Lewis at Westat800-937-8281, Ext. 8284 or 301-251-8284Fax: 800-254-0984E-mail: [email protected]
According to the Paperwork Reduction Act of 1995, no persons are required to respond to a collection of information unless itdisplays a valid OMB control number. The valid OMB control number for this information collection is 1850-0733. The time requiredto complete this information collection is estimated to average 15 minutes per response, including the time to review instructions,search existing data resources, gather the data needed, and complete and review the information collection. If you have anycomments concerning the accuracy of the time estimate or suggestions for improving this form, please write to: U.S. Department ofEducation, Washington, DC 20202-4651. If you have any comments or concerns regarding the status of your individual submissionof this form, write directly to: National Center for Education Statistics, 555 New Jersey Avenue, NW, Washington, DC 20208.
FRSS Form No. 65, 02/98
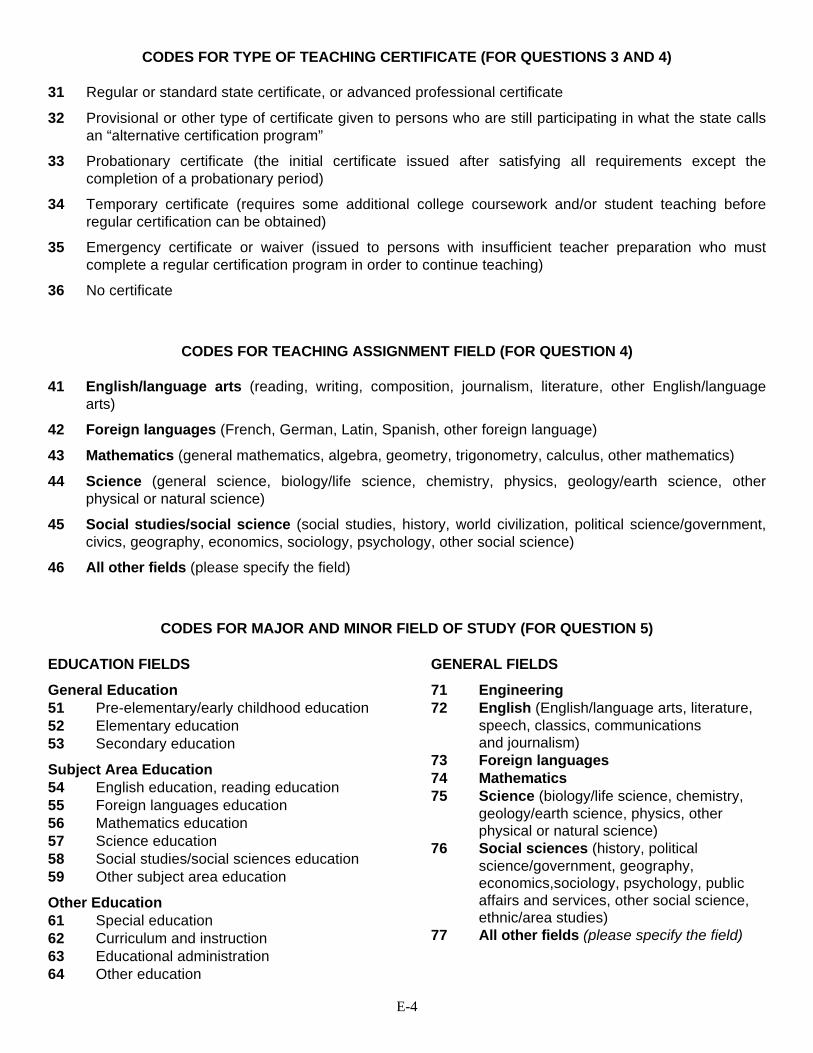
E-4
CODES FOR TYPE OF TEACHING CERTIFICATE (FOR QUESTIONS 3 AND 4)
31 Regular or standard state certificate, or advanced professional certificate
32 Provisional or other type of certificate given to persons who are still participating in what the state callsan “alternative certification program”
33 Probationary certificate (the initial certificate issued after satisfying all requirements except thecompletion of a probationary period)
34 Temporary certificate (requires some additional college coursework and/or student teaching beforeregular certification can be obtained)
35 Emergency certificate or waiver (issued to persons with insufficient teacher preparation who mustcomplete a regular certification program in order to continue teaching)
36 No certificate
CODES FOR TEACHING ASSIGNMENT FIELD (FOR QUESTION 4)
41 English/language arts (reading, writing, composition, journalism, literature, other English/languagearts)
42 Foreign languages (French, German, Latin, Spanish, other foreign language)
43 Mathematics (general mathematics, algebra, geometry, trigonometry, calculus, other mathematics)
44 Science (general science, biology/life science, chemistry, physics, geology/earth science, otherphysical or natural science)
45 Social studies/social science (social studies, history, world civilization, political science/government,civics, geography, economics, sociology, psychology, other social science)
46 All other fields (please specify the field)
CODES FOR MAJOR AND MINOR FIELD OF STUDY (FOR QUESTION 5)
EDUCATION FIELDS
General Education51 Pre-elementary/early childhood education52 Elementary education53 Secondary education
Subject Area Education54 English education, reading education55 Foreign languages education56 Mathematics education57 Science education58 Social studies/social sciences education59 Other subject area education
Other Education61 Special education62 Curriculum and instruction63 Educational administration64 Other education
GENERAL FIELDS
71 Engineering72 English (English/language arts, literature,
speech, classics, communicationsand journalism)
73 Foreign languages74 Mathematics75 Science (biology/life science, chemistry,
geology/earth science, physics, otherphysical or natural science)
76 Social sciences (history, political science/government, geography,economics,sociology, psychology, publicaffairs and services, other social science,ethnic/area studies)
77 All other fields (please specify the field)

E-5
1. Which one of the following best describes your main teaching assignment at this school? (Circle only onenumber.)
Teach a self-contained classroom (i.e., you teach all or most academicsubjects to the same group of students all or most of the day) .................................. 1 (Go to question 2.)
Teach math, science, English/language arts, social studies, or foreignlanguage in a departmentalized setting (i.e., you teach one of thesesubjects to several classes of different students all or most of the day) .................... 2 (Go to question 4.)
Other teaching assignment........................................................................................ 3 (Stop. Call Westat
at 800-937-8281, ext. 8284, for instructions.)
FOR TEACHERS OF SELF-CONTAINED CLASSROOMS: Answer questions 2 and 3, and then go to question 5.
2. How many students are enrolled in your self-contained class? __________
3. Do you have a general elementary or secondary education teaching certificate in this state? If yes, enter the codefor the type of teaching certificate, using the list provided with this questionnaire.
Yes ...... 1 (Enter code from list for type of teaching certificate: ) No........ 2
FOR TEACHERS IN DEPARTMENTALIZED SETTINGS
4. For each different field you are assigned to teach at this school, write in the code for the teaching assignment field,the number of classes or sections in that field you teach, and the number of students you teach in that field. Then,for each teaching assignment field, write in the code for the type of teaching certificate, if any, you have in thatfield in this state. See the lists provided with this questionnaire for the codes for teaching assignment field andtype of teaching certificate.
Write in information for your main teaching assignment field at this school first, that is, the field in which you teachthe most classes. Next write in information about your secondary teaching assignment field, that is, the field inwhich you teach the second most classes, followed by information for any other teaching assignments you mayhave at this school. If your teaching schedule is divided equally between two fields, record either field as your mainassignment.
Teaching assignment at thisschool
Code forteaching
assignmentfield
Number ofclasses or
sections taughtin field
Total number ofstudents taught
in field
Code for type ofteaching
certificate inthis field in this
state
Main (i.e., the field in which youteach the most classes)
Secondary (i.e., the field inwhich you teach the secondmost classes)
Other teaching assignments
5. Please check the box(es) next to the degrees you hold, and write in the codes for your major and minor fields ofstudy for each degree, using the list provided with this questionnaire. If you completed more than one degree at alevel or had a double major or minor, please provide information for all fields of study at that degree level.
Degree Code(s) for major(s) Code(s) for minor(s)
Bachelor’s degree(s)
Master’s degree(s)
Doctorate degree(s)
Other degree(s) (specify:)_______________
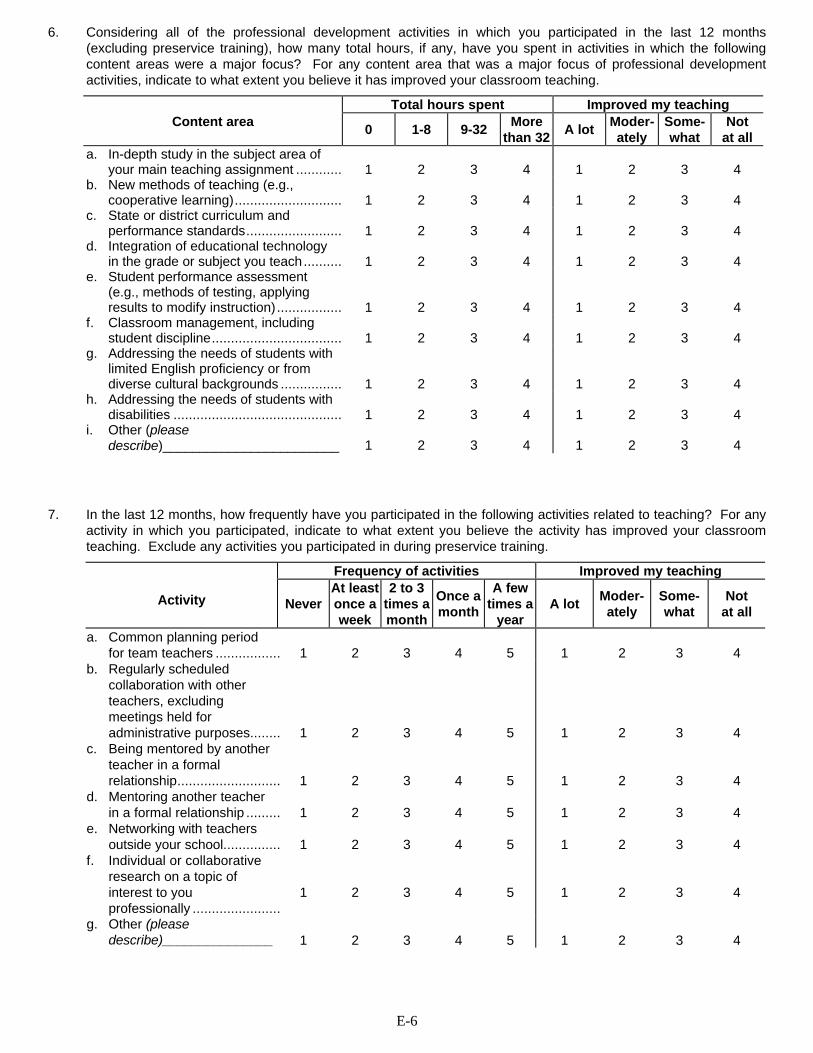
E-6
6. Considering all of the professional development activities in which you participated in the last 12 months(excluding preservice training), how many total hours, if any, have you spent in activities in which the followingcontent areas were a major focus? For any content area that was a major focus of professional developmentactivities, indicate to what extent you believe it has improved your classroom teaching.
Total hours spent Improved my teachingContent area
0 1-8 9-32More
than 32A lot
Moder-ately
Some-what
Notat all
a. In-depth study in the subject area ofyour main teaching assignment ............ 1 2 3 4 1 2 3 4
b. New methods of teaching (e.g.,cooperative learning)............................ 1 2 3 4 1 2 3 4
c. State or district curriculum andperformance standards......................... 1 2 3 4 1 2 3 4
d. Integration of educational technologyin the grade or subject you teach.......... 1 2 3 4 1 2 3 4
e. Student performance assessment(e.g., methods of testing, applyingresults to modify instruction)................. 1 2 3 4 1 2 3 4
f. Classroom management, includingstudent discipline.................................. 1 2 3 4 1 2 3 4
g. Addressing the needs of students withlimited English proficiency or fromdiverse cultural backgrounds ................ 1 2 3 4 1 2 3 4
h. Addressing the needs of students withdisabilities ............................................ 1 2 3 4 1 2 3 4
i. Other (pleasedescribe)________________________ 1 2 3 4 1 2 3 4
7. In the last 12 months, how frequently have you participated in the following activities related to teaching? For anyactivity in which you participated, indicate to what extent you believe the activity has improved your classroomteaching. Exclude any activities you participated in during preservice training.
Frequency of activities Improved my teaching
Activity NeverAt leastonce aweek
2 to 3times amonth
Once amonth
A fewtimes a
yearA lot
Moder-ately
Some-what
Notat all
a. Common planning periodfor team teachers ................. 1 2 3 4 5 1 2 3 4
b. Regularly scheduledcollaboration with otherteachers, excludingmeetings held foradministrative purposes........ 1 2 3 4 5 1 2 3 4
c. Being mentored by anotherteacher in a formalrelationship........................... 1 2 3 4 5 1 2 3 4
d. Mentoring another teacherin a formal relationship ......... 1 2 3 4 5 1 2 3 4
e. Networking with teachersoutside your school............... 1 2 3 4 5 1 2 3 4
f. Individual or collaborativeresearch on a topic ofinterest to youprofessionally .......................
1 2 3 4 5 1 2 3 4
g. Other (pleasedescribe)_______________ 1 2 3 4 5 1 2 3 4

E-7
8. How well prepared do you feel to do the following activities in your classroom? (Circle one number on each line.)
Very wellprepared
Moderatelywell
prepared
Somewhatwell
prepared
Not at allprepared
a. Implement new methods of teaching (e.g., cooperativelearning) ................................................................................ 1 2 3 4
b. Implement state or district curriculum and performancestandards ............................................................................... 1 2 3 4
c. Integrate educational technology into the grade or subjecttaught..................................................................................... 1 2 3 4
d. Use student performance assessment techniques (e.g.,methods of testing, applying results to modify instruction) ...... 1 2 3 4
e. Maintain order and discipline in the classroom........................ 1 2 3 4f. Address the needs of students with limited English
proficiency or from diverse cultural backgrounds (If youteach no students with these characteristics, check the boxand go to item g.) ............................................................. 1 2 3 4
g. Address the needs of students with disabilities (If you teachno students with disabilities, check the box and go toquestion 9.) ...................................................................... 1 2 3 4
9. When you first began teaching, did you participate in a formal teacher induction program (for example, a programto help beginning teachers by assigning them to master or mentor teachers)? Do not include student teaching.
Yes ........... 1 (Length of program:__________________________) No ............ 2
10. Do you agree or disagree with each of the following statements? (Circle one number on each line.)
Stronglyagree
Somewhatagree
Somewhatdisagree
Stronglydisagree
a. Parents support me in my efforts to educate their children.... 1 2 3 4b. The school administration supports me in my work ............... 1 2 3 4c. Other teachers share ideas that are helpful to me in my
teaching ............................................................................... 1 2 3 4d. Goals and priorities for the school are clear .......................... 1 2 3 4
11. What is your sex?
Male........... 1 Female......... 2
12. Are you of Hispanic or Latino origin?
Yes ............ 1 No ................ 2
13. What is your race? (Circle one or more to describe yourself.)
American Indian or Alaska Native ..................................... 1Asian................................................................................. 2Black or African American................................................. 3Native Hawaiian or Other Pacific Islander ......................... 4White ................................................................................ 5
14. Including this school year, how many years have you been employed as a teacher? _____ At this school? _____(Include years spent teaching both full and part time, and in both public and private schools.)
15. What grades do you currently teach at this school? (Circle all that apply.)
PK K 1 2 3 4 5 6 7 8 9 10 11 12

F-1
Appendix F
Selected Questionnaire Items from the 1993-94 Schools andStaffing Survey Teacher Questionnaire

F-2

F-3
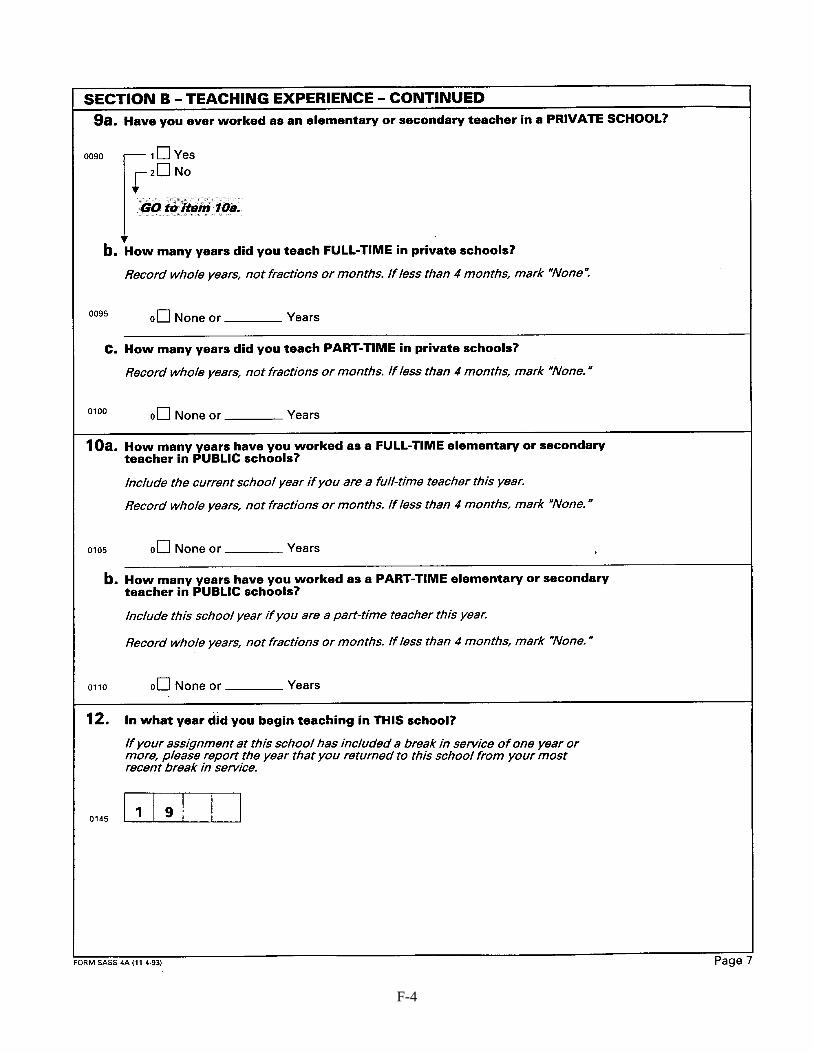
F-4

F-5

F-6

F-7

F-8

F-9

F-10

F-11
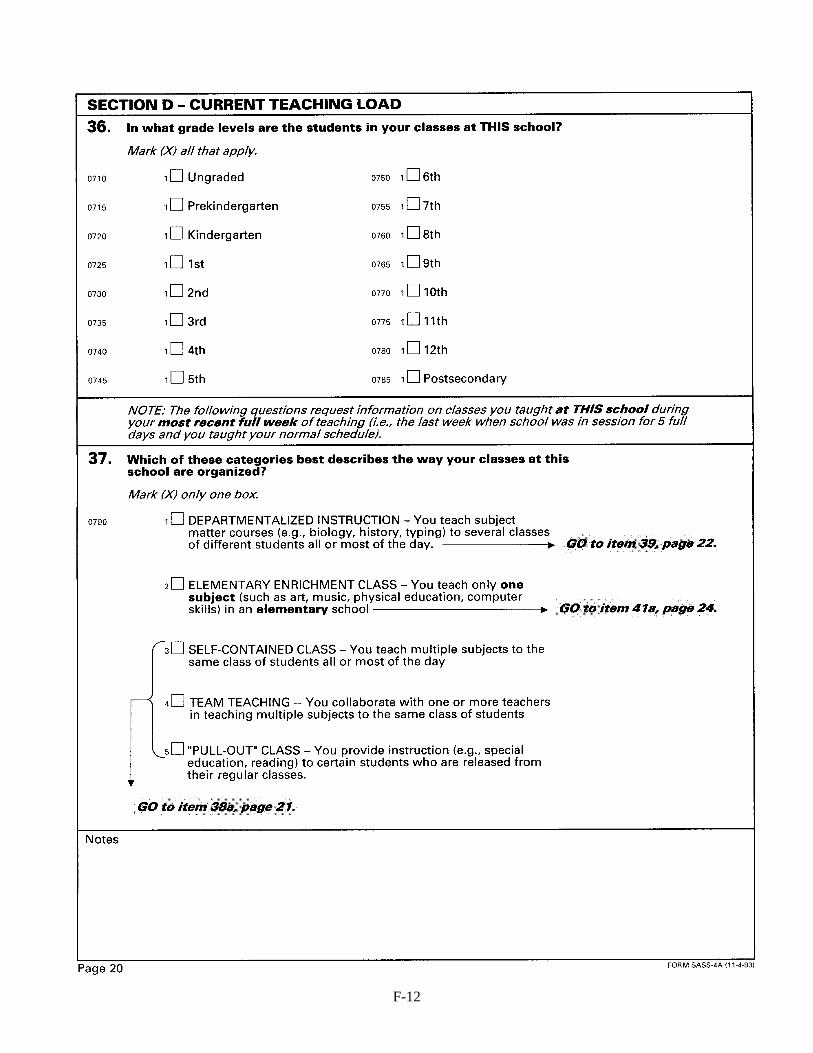
F-12

F-13

F-14

F-15

F-16

F-17