teacher notes - web adventures
TRANSCRIPT

64
teAcHer NoteS:fingerprints have been used for identification throughout history, but it was Sir William Herschel in Jungipoor, India, who first recognized their true potential. He was the first to espouse the theory that all fingerprints are unique to an individual and are permanent throughout a person’s lifetime. These principles were later scientifically investigated and promulgated by Sir fracis galton, a British anthropologist. a student of his, Juan Vucetich, made the first criminal fingerprint identification in 1892 when he used francis Rojas bloody fingerprint to convince a jury she had murdered her two sons. Today, we now accept as common fact that 1) all fingerprints are unique, and no two are exactly identical, 2) a fingerprint will remain unchanged during a person’s lifetime, and 3) fingerprints have distinct patterns that can be classified and used for comparison.
fingerprints can be divided into three main types: loops, whorls, and arches. Loops are the most common type of fingerprint; on average 65% of all fingerprints are loops. approximately 30% of all fingerprints are whorls, and arches only occur about 5% of the time. There are subcategories for each of these. Loops are subdivided into radial loops (the loop enters and exits the finger on the side closest to the thumb) and ulna loops (the loop enters and exits the finger on the side closest to the pinky finger). arches can be plain (the ridges are flat or only show a slight peak) or tented (sharp, well defined peak). Whorls can be plain, central pocket (elevated, usually smaller whorl pattern), double loop (whorl made of two distinct loop patterns), or accidental (combination of all of the above).
In order to conclusively match individual fingerprints, fingerprint examiners use ridge characteristics, also known as minutia. The most common types of ridge characteristics are bifurcations, ridge endings, and islands, though there are several different categories and subcategories for each of these. a single rolled fingerprint may have more than 100 different ridge characteristics. In the United States there in no minimum number of ridge characteristics that must be used to match up two fingerprints (though eight or more is considered “standard” and twelve is “sufficient”). However, the match must be made by one verified fingerprint examiner (usually trained by the International association for Identification (IaI)) and verified by second verified examiner.
mAterIAlS:
White latex balloons (at least one per student)• #2 pencils (one per student)•
clASSroom mANAgemeNt:
For the most part this activity is designed to be completed individually by each student, though the data from all students
will be pooled together during the first part. If desired, students can work together in pairs or small teams. There will be considerable interest in sharing and comparing the fingerprints on the various balloons, especially if certain rare or unique fingerprints are discovered (e.g. arches, double whorls, etc.). These balloons can also be used to discuss why certain fingerprints, which look very similar, are still different and unique. The ridge characteristics should be relatively easy to identify on the expanded balloons.
Problem:Three weeks ago a local bakery was robbed at gunpoint. The thief wore a mask, so even when the police found a suspect the bakery owner couldn’t make a positive ID. However, as the CSI processing the scene, you collected several fingerprints from various parts of the bakery. The police have identified a suspect, but he says he’s never been to that bakery. It’s your job to see if the suspect’s fingerprints match any of those recovered at the scene of the crime.
ActIvIty:
Students are first introduced to the three main types of fingerprints: loops,whorls,andarches. Using a balloon and a number two pencil, each student will determine the total numbers of loops, whorls, and arches on his or her ten fingers. The teacher can then add the individual totals to determine the
total numbers of loop, whorl, and arch fingerprints in the class as a whole. Students should record this information on their worksheets. The students are then shown a bar graph illustrating the percentage of loop, whorl, and arched fingerprints in the United States population. After answering several questions about his graph, they are prompted to construct a similar bar graph using their classroom percentages for each type of print. The students are then asked a series of questions designed to test their understanding of the activity. Lastly, students are presented with copies of the suspect’s fingerprints and those obtained from the crime scene. The students are instructed on how to identify various ridge characteristics (island, ridge ending, bifurcation, etc.). Using the ridge characteristics of the prints, the students should be able to identify which of the prints at the crime scene were left by the suspect—even to the point of which finger they came from. one of the crime scene prints (from the display case) will not match the suspect. This is to be expected in a public crime scene where several people (customers, owner, workers) have been present.

teAcHer ANSWer Key
StIcKy FINgerS
Part1:Aresomekindsoffingerprintsmorecommonthanothers?
1. fill in each of these squares using a #2 pencil. Make sure each square is dark and shiny.
2. Blow up a balloon to about the same size as a baseball and tie it loosely.
3. Press each finger into one of the boxes, then gently press it against the balloon. Use a different part of the balloon for each finger!
4. Blow up the balloon larger. Watch the fingerprints eXPaND.
5. Compare each fingerprint to the provided examples. Determine whether it is a loop,whorl,orarch.
6. Record your data below:
Thumb Index Middle Ring Pinky
Right Hand
Left Hand
thumb 1st Finger 3rd Finger2nd Finger Pinky
Page 1 of 7
looPThe most common type of print;
some ridges enter and exit on the same side of the finger.
WHorlThe ridges form a circular pattern
ArcHThe least common type of print; ridges run from one side of the
finger to the other.

teAcHer ANSWer Key
StIcKy FINgerS
Using the data from both your hands, count the total numbers of loops, whorls, and arches.
Total# Loops: _____________
Total# Whorls: _____________
Total# Arches: _____________
as a class, calculate the total number of loop, whorl, and arch fingerprints for the entire class. Record that data here:
Classroom Total# Loops: ______________________
Classroom Total# Whorls: ______________________
Classroom Total# Arches: ______________________
Classroom Total# All Fingerprints: ______________________
Next, calculate the percentage of each type of fingerprint in your classroom population. for example, the Percentage of Loops = (Total# Loops / Total# all fingerprints) x 100
Percentage Loops: ______________________
Percentage Whorls: ______________________
Percentage Arches: ______________________
Total Percentages: 100%
PAGE 2 OF 7

teAcHer ANSWer Key
StIcKy FINgerS
The chart below shows the how often each of these types of fingerprints occur in the national population. Use this chart to answer the following questions.
1. What percentage of fingerprints in the national population are loops?
65%
2. What percentage of fingerprints in the national populations are whorls?
30%
3. What percentage of fingerprints in the national population are arches?
5%
4. Which is greater: the number of loop fingerprints in the national population, or the number of whorl fingerprints plus the number of arch fingerprint?
The number of loop fingerprints(65% > (35%+5%))
5. In a random sampling of 1000 fingerprints from the national population, approximately how many arch fingerprints can you expect to find?
0.05 x 1000 = approximately 50 arch fingerprints
0
10
20
30
40
50
60
70
80
90
100
Loops Whorls Arches
Percenta
ge
NationalPopulation
Type of Fingerprint
National Fingerprint Percentages
PAGE 3 OF 7
teAcHer ANSWer Key
StIcKy FINgerS
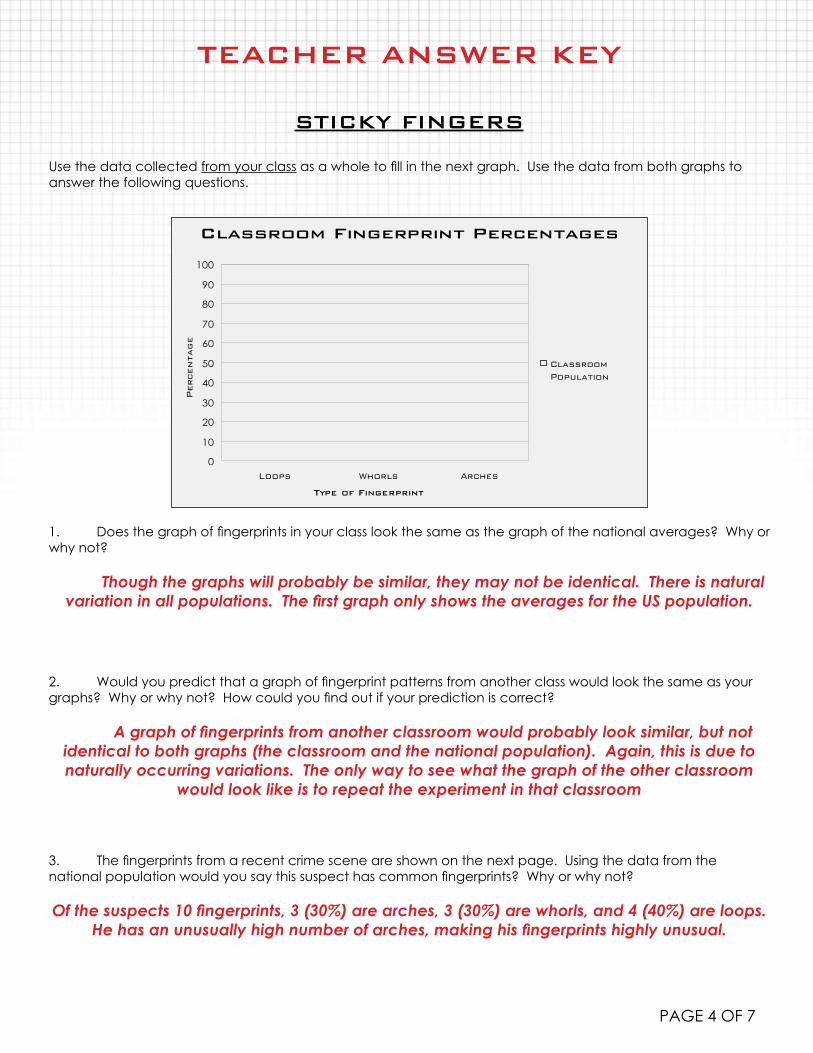
Use the data collected from your class as a whole to fill in the next graph. Use the data from both graphs to answer the following questions.
1. Does the graph of fingerprints in your class look the same as the graph of the national averages? Why or why not?
Though the graphs will probably be similar, they may not be identical. There is natural variation in all populations. The first graph only shows the averages for the US population.
2. Would you predict that a graph of fingerprint patterns from another class would look the same as your graphs? Why or why not? How could you find out if your prediction is correct?
A graph of fingerprints from another classroom would probably look similar, but not identical to both graphs (the classroom and the national population). Again, this is due to naturally occurring variations. The only way to see what the graph of the other classroom
would look like is to repeat the experiment in that classroom
3. The fingerprints from a recent crime scene are shown on the next page. Using the data from the national population would you say this suspect has common fingerprints? Why or why not?
Of the suspects 10 fingerprints, 3 (30%) are arches, 3 (30%) are whorls, and 4 (40%) are loops. He has an unusually high number of arches, making his fingerprints highly unusual.
0
10
20
30
40
50
60
70
80
90
100
Loops Whorls Arches
Percenta
ge
ClassroomPopulation
Type of Fingerprint
Classroom Fingerprint Percentages
PAGE 4 OF 7

teAcHer ANSWer Key
StIcKy FINgerS
evidence from case #4589241-b Fingerprints from Crime Scene
Suspect’s Fingerprintsright Hand
left Hand
From cash register
From cash register
thumb
thumb
Index
Index
middle
middle
ring
ring
Pinkie
Pinkie
From Display case
From Door From Door
PAGE 5 OF 7

teAcHer ANSWer Key
StIcKy FINgerSPart2:Dothesuspect’sfingerprintsmatchthoseatthecrimescene?
In the previous exercise, you should have noticed that everybody has similar fingerprints. for example, many students in your class may have fingerprints that are all loops, or nine loops and a whorl. If everyone’s fingerprints are so similar, how can forensic scientists link certain fingerprints to a specific individual? forensic scientists use ridge characteristics to identify an individuals’ fingerprints. These include:
lake (enclosure)
Hook (Spur)
Double bifurcation
opposed bifurcation
ridge ending
bifurcation
Dot
Island (short ridge)
PAGE 6 OF 7

teAcHer ANSWer Key
StIcKy FINgerS
Three weeks ago a local bakery was robbed at gunpoint. The thief wore a mask, so even when the police found a suspect the bakery owner couldn’t make a positive ID. However, as the CSI processing the scene, you collected several fingerprints from various parts of the bakery. The police have identified a suspect, but he says he’s never been to that bakery. It’s your job to see if the suspect’s fingerprints match any of those recovered at the scene of the crime.
1. Can you identify any ridge characteristics on the suspects prints? on the prints from the crime scene? Circle and label any ridge characteristics you find.
There are a variety of ridge characteristics. The most common will be ridge endings, lakes, and bifurcations, but there are also hooks, dots, and islands.
2. Do any of the crime scene fingerprints match the suspect’s fingerprints? Label any matching crime scene fingerprints with the hand and finger they come from.
From Cash Register (top row) = Left Thumb From Display Case = NO MATCH From Cash Register (bottom row) = Right Thumb From Door = Left Pinkie From Door = Left Ring
3. Do any of the crime scene prints NOT match the suspect’s prints? Who do you think could have contributed these prints?
The print from the display case does not match the suspect. This print could belong to the shop owner or a customer.
4. Do you think the suspect committed this crime? Why or why not?
Answers may vary, but students should point out that 1) the suspect has defiantly been to the bakery, which contradicts his earlier statement, and 2) one of his prints was found on the cash register. Even if he was in the bakery as a customer, why would his print be on the
cash register?
PAGE 7 OF 7

Name:_____________________________ Date:______________________________
StIcKy FINgerS
Part1:Aresomekindsoffingerprintsmorecommonthanothers?
1. fill in each of these squares using a #2 pencil. Make sure each square is dark and shiny.
2. Blow up a balloon to about the same size as a baseball and tie it loosely.
3. Press each finger into one of the boxes, then gently press it against the balloon. Use a different part of the balloon for each finger!
4. Blow up the balloon larger. Watch the fingerprints eXPaND.
5. Compare each fingerprint to the provided examples. Determine whether it is a loop,whorl,orarch.
6. Record your data below:
Thumb Index Middle Ring Pinky
Right Hand
Left Hand
thumb 1st Finger 3rd Finger2nd Finger Pinky
looPThe most common type of print;
some ridges enter and exit on the same side of the finger.
WHorlThe ridges form a circular pattern
ArcHThe least common type of print; ridges run from one side of the
finger to the other.
Page 1 of 7

Name:_____________________________ Date:______________________________
StIcKy FINgerS
Using the data from both your hands, count the total numbers of loops, whorls, and arches.
Total# Loops: _____________
Total# Whorls: _____________
Total# Arches: _____________
as a class, calculate the total number of loop, whorl, and arch fingerprints for the entire class. Record that data here:
Classroom Total# Loops: ______________________
Classroom Total# Whorls: ______________________
Classroom Total# Arches: ______________________
Classroom Total# All Fingerprints: ______________________
Next, calculate the percentage of each type of fingerprint in your classroom population. for example, the Percentage of Loops = (Total# Loops / Total# all fingerprints) x 100
Percentage Loops: ______________________
Percentage Whorls: ______________________
Percentage Arches: ______________________
Total Percentages: 100%
PAGE 2 OF 7

Name:_____________________________ Date:______________________________
StIcKy FINgerS
The chart below shows the how often each of these types of fingerprints occur in the national population. Use this chart to answer the following questions.
1. What percentage of fingerprints in the national population are loops?
2. What percentage of fingerprints in the national populations are whorls?
3. What percentage of fingerprints in the national population are arches?
4. Which is greater: the number of loop fingerprints in the national population, or the number of whorl fingerprints plus the number of arch fingerprint?
5. In a random sampling of 1000 fingerprints from the national population, approximately how many arch fingerprints can you expect to find?
0
10
20
30
40
50
60
70
80
90
100
Loops Whorls Arches
Percenta
ge
NationalPopulation
Type of Fingerprint
National Fingerprint Percentages
PAGE 3 OF 7

Name:_____________________________ Date:______________________________
StIcKy FINgerS
Use the data collected from your class as a whole to fill in the next graph. Use the data from both graphs to answer the following questions.
1. Does the graph of fingerprints in your class look the same as the graph of the national averages? Why or why not?
2. Would you predict that a graph of fingerprint patterns from another class would look the same as your graphs? Why or why not? How could you find out if your prediction is correct?
3. The fingerprints from a recent crime scene are shown on the next page. Using the data from the national population would you say this suspect has common fingerprints? Why or why not?
0
10
20
30
40
50
60
70
80
90
100
Loops Whorls Arches
Percenta
ge
ClassroomPopulation
Type of Fingerprint
Classroom Fingerprint Percentages
PAGE 4 OF 7

Name:_____________________________ Date:______________________________
StIcKy FINgerS
evidence from case #4589241-b Fingerprints from Crime Scene
Suspect’s Fingerprintsright Hand
left Hand
From cash register
From cash register
thumb
thumb
Index
Index
middle
middle
ring
ring
Pinkie
Pinkie
From Display case
From Door From Door
PAGE 5 OF 7

Name:_____________________________ Date:______________________________
StIcKy FINgerSPart2:Dothesuspect’sfingerprintsmatchthoseatthecrimescene?
In the previous exercise, you should have noticed that everybody has similar fingerprints. for example, many students in your class may have fingerprints that are all loops, or nine loops and a whorl. If everyone’s fingerprints are so similar, how can forensic scientists link certain fingerprints to a specific individual? forensic scientists use ridge characteristics to identify an individuals’ fingerprints. These include:
lake (enclosure)
Hook (Spur)
Double bifurcation
opposed bifurcation
ridge ending
bifurcation
Dot
Island (short ridge)
PAGE 6 OF 7

Name:_____________________________ Date:______________________________
StIcKy FINgerS
Three weeks ago a local bakery was robbed at gunpoint. The thief wore a mask, so even when the police found a suspect the bakery owner couldn’t make a positive ID. However, as the CSI processing the scene, you collected several fingerprints from various parts of the bakery. The police have identified a suspect, but he says he’s never been to that bakery. It’s your job to see if the suspect’s fingerprints match any of those recovered at the scene of the crime.
1. Can you identify any ridge characteristics on the suspects prints? on the prints from the crime scene? Circle and label any ridge characteristics you find.
2. Do any of the crime scene fingerprints match the suspect’s fingerprints? Label any matching crime scene fingerprints with the hand and finger they come from.
3. Do any of the crime scene prints NOT match the suspect’s prints? Who do you think could have contributed these prints?
4. Do you think the suspect committed this crime? Why or why not?
PAGE 7 OF 7