tdot design division - tn.gov · systems, including pavement drainage, gutter flows, catch basin...
TRANSCRIPT

TDOT DESIGN DIVISION
DRAINAGE MANUAL
CHAPTER VII STORM DRAINAGE
SYSTEMS

TDOT DESIGN DIVISION DRAINAGE MANUAL
August 1, 2012
i
CHAPTER 7 – STORM DRAINAGE SYSTEMS
SECTION 7.01 – INTRODUCTION 7.01 INTRODUCTION ...........................................................................................7-1
SECTION 7.02 – DOCUMENTATION PROCEDURES 7.02 DOCUMENTATION PROCEDURES .............................................................7-2
SECTION 7.03 – GUIDELINES AND CRITERIA 7.03 GUIDELINES AND CRITERIA .......................................................................7-4 7.03.1 ROADWAY CROSS SECTION AND PROFILE GRADE ................................7-5 7.03.1.1 Minimum Longitudinal Slopes......................................................................7-5 7.03.1.2 Transverse Slopes ......................................................................................7-6 7.03.2 CURBS AND GUTTERS ................................................................................7-6 7.03.3 STORM DRAIN INLETS ................................................................................7-7 7.03.3.1 Combination Inlets on Continuous Slopes ................................................. 7-10 7.03.3.1.1 Inlet Spacing on Continuous Slopes .......................................................... 7-11 7.03.3.2 Combination Inlets at Sag Points .............................................................. 7-12 7.03.3.3 Inlets for Median or Side Ditches ............................................................... 7-14 7.03.3.3.1 Use of Inlets with Structural Steel Grates .................................................. 7-14 7.03.3.4 Use of Longitudinal Drains ........................................................................ 7-15 7.03.3.5 Standard Inlet Types and Applications ...................................................... 7-17 7.03.3.6 Catch Basin Grate Stations and Elevations Shown on the Plans ............... 7-19 7.03.3.7 Design Storm Frequency and Spread for Inlet Spacing ............................. 7-21 7.03.4 STORM SEWER PIPES .............................................................................. 7-21 7.03.4.1 Pipe Type and Cover Criteria .................................................................... 7-21 7.03.4.2 Pipe Sizing Criteria .................................................................................... 7-22 7.03.4.3 Minimum and Maximum Velocity ............................................................... 7-23 7.03.5 CATCH BASINS AND MANHOLES ............................................................. 7-23 7.03.5.1 Catch Basins ............................................................................................. 7-23 7.03.5.1.1 Alternate Catch Basins .............................................................................. 7-25 7.03.5.1.2 Use of No. 6-72 Catch Basins ................................................................... 7-26 7.03.5.2 Manholes .................................................................................................. 7-27 7.03.5.3 Minimum and Maximum Depths for Catch Basins and Manholes .............. 7-27 7.03.5.4 Junction Boxes .......................................................................................... 7-28 7.03.5.5 Pipe Connections to Structures ................................................................. 7-28 7.03.5.6 Spacing Between Catch Basins and Manholes ......................................... 7-30 7.03.5.7 Manholes in the Pavement Area ............................................................... 7-30

TDOT DESIGN DIVISION DRAINAGE MANUAL
August 1, 2012
ii
7.03.6 BRIDGE END DRAINS ................................................................................ 7-30 7.03.7 DITCHES ..................................................................................................... 7-30 7.03.8 STORM SEWER OUTFALLS ....................................................................... 7-30 7.03.9 SHOWING STORM DRAINAGE FACILITIES ON PROJECT PLANS .......... 7-31 7.03.9.1 Storm Drain Information at Various Stages of Plan Development .............. 7-31 7.03.9.2 Storm Drain Information by Plan Sheet ..................................................... 7-31
SECTION 7.04 – DESIGN PROCEDURES 7.04 DESIGN PROCEDURES ............................................................................. 7-35 7.04.1 SYSTEM PLANNING ................................................................................... 7-35 7.04.1.1 Data Requirements ................................................................................... 7-35 7.04.1.2 Preliminary Layout .................................................................................... 7-36 7.04.2 HYDROLOGY .............................................................................................. 7-37 7.04.3 GUTTER FLOW COMPUTATIONS ............................................................. 7-38 7.04.3.1 Gutter N-values ......................................................................................... 7-39 7.04.3.2 Uniform Cross Slope Procedure ................................................................ 7-40 7.04.3.3 Compound Cross Slope Procedure ........................................................... 7-41 7.04.4 INLET COMPUTATIONS ............................................................................. 7-42 7.04.4.1 Gutter Inlet Interception on a Continuous Slope ........................................ 7-43 7.04.4.1.1 Determination of Inlet Splash-Over Velocity (VO) ...................................... 7-44 7.04.4.1.2 Determination of Inlet Frontal Flow ............................................................ 7-45 7.04.4.1.3 Gutter Inlet Interception Procedure............................................................ 7-47 7.04.4.2 Inlet Spacing on a Continuous Slope ......................................................... 7-49 7.04.4.3 Inlet Performance at Sag Points ................................................................ 7-51 7.04.5 PIPE CAPACITY COMPUTATIONS FOR GRAVITY FLOW ........................ 7-53 7.04.5.1 Manning’s n-Values for Pipe Materials ...................................................... 7-53 7.04.5.2 Discharge Computations for Pipe Sizing ................................................... 7-54 7.04.5.3 Pipe Sizing Computations for Gravity Flow ................................................ 7-55 7.04.6 ENERGY GRADE LINE AND HYDRAULIC GRADE LINE COMPUTATIONS ........................................................................................ 7-57 7.04.6.1 Evaluating Tailwater Conditions ................................................................ 7-59 7.04.6.1.1 Evaluating Tailwater EGL and HGL Elevations ......................................... 7-61 7.04.6.2 Hydraulic Analysis of the Pipe ................................................................... 7-61 7.04.6.2.1 Procedures for Inlet and Outlet Control ..................................................... 7-61 7.04.6.2.2 Procedure for Inlet Control ........................................................................ 7-62 7.04.6.2.3 Procedure for Outlet Control...................................................................... 7-63 7.04.6.3 Calculating Hydraulic Grade in the Upstream Structure ............................. 7-68 7.04.6.3.1 Initial Estimate of Energy in the Upstream Structure ................................. 7-69 7.04.6.3.2 Adjustments to the Initial Energy Estimate ................................................ 7-70

TDOT DESIGN DIVISION DRAINAGE MANUAL
August 1, 2012
iii
7.04.6.3.2.1 Adjustments for Benching ......................................................................... 7-70 7.04.6.3.2.2 Adjustments for Angled Inflows ................................................................. 7-73 7.04.6.3.2.3 Adjustments for Plunging Inflows .............................................................. 7-72 7.04.6.3.3 Final Computation of Energy in the Upstream Structure ............................ 7-75 7.04.7 Special Considerations for Flat Grades ..................................................... 7-76 7.04.7.1 Strategies for Flat Profile Grades .............................................................. 7-76 7.04.7.2 Long SAG Vertical Curves ........................................................................ 7-77 7.04.7.3 Superelevation Transitions ........................................................................ 7-78 7.04.7.4 Drainage Across Multiple Travel Lanes ..................................................... 7-81 7.04.7.5 Gore Areas ................................................................................................ 7-82 7.04.8 PIPE SEPARATION COMPUTATIONS FOR CIRCULAR STRUCTURES ... 7-82
SECTION 7.05 – ACCEPTABLE SOFTWARE 7.05 ACCEPTABLE SOFTWARE ........................................................................ 7-85 7.05.1 GEOPAK DRAINAGE .................................................................................. 7-85 7.05.2 VISUAL URBAN ........................................................................................... 7-85
SECTION 7.06 – APPENDIX 7.06 APPENDIX .................................................................................................. 7A-1 7.06.1 FIGURES AND TABLES ............................................................................. 7A-1 7.06.2 EXAMPLE PROBLEMS ............................................................................ 7A-25 7.06.2.1 Example Problem #1: Inlet Spacing on Continuous Grade ..................... 7A-25 7.06.2.2 Example Problem #2: Computations for Inlet at Sump Location ............. 7A-34 7.06.2.3 Example Problem #3: Storm Sewer System Analysis ............................. 7A-38 7.06.3 GLOSSARY .............................................................................................. 7A-50 7.06.4 REFERENCES ......................................................................................... 7A-56 7.06.5 ABBREVIATIONS ..................................................................................... 7A-57

TDOT DESIGN DIVISION DRAINAGE MANUAL September 10, 2013
7-1
SECTION 7.01 - INTRODUCTION
This chapter describes the criteria and procedures used in the design of roadway storm drainage systems for the Tennessee Department of Transportation (TDOT). To properly utilize this information, the designer should already be familiar with the hydraulic behavior of closed conduits and open-channels, and understand the basic concepts related to analyzing their hydraulic performance. While the guidance provided in this chapter is to be used for TDOT storm drainage design, it is not all-encompassing. There may be instances in which the designer may wish to consult an outside reference to address a particular design issue. In particular, the Federal Highway publications HEC-12, Drainage of Highway Pavements and HEC-22, Urban Drainage Design Manual may prove useful. A number of other useful references are listed in the Appendix.
Storm drainage systems for transportation facilities collect stormwater flowing within and along the highway right-of-way and convey it to a suitable discharge point. Proper highway drainage design will help to reduce many of the effects of an inadequate road drainage system, including:
• water flowing from the roadway onto adjacent properties • water ponding behind the roadway curbs • hazards and delay to traffic caused by excessive ponding in sag points or excessive
spread on the roadway • weakening of the base and subgrade caused by frequent long-duration ponding of
water
The general intention of any storm water design should be to make every reasonable effort to promote the safety of the traveling public by providing adequate drainage performance in the most cost-effective way. The design of a stormwater drainage system should address the needs of the traveling public as well as those of the local community through which the roadway passes. Thus, the design process can be complex.
This chapter discusses most of the elements required for the design of storm drainage
systems, including pavement drainage, gutter flows, catch basin inlet spacing, performance of storm sewer pipes, storm sewer outfalls, and structures such as catch basins and manholes. Although open ditches may often be considered a part of the overall roadway drainage system, the design of ditches along the road side or in the median is discussed in Chapter 5. This chapter also provides documentation criteria and a list of acceptable computer programs for design. The Appendix provides example problems, useful tables and charts, references and definitions.

TDOT DESIGN DIVISION DRAINAGE MANUAL September 10, 2013
7-2
SECTION 7.02 - DOCUMENTATION PROCEDURES
The designer will be responsible to document the computations and design decisions made for the design of each segment of the project roadway drainage system. In general, the documentation should be sufficient to answer any reasonable question that may be raised in the future regarding the proposed drainage system design.
The storm drainage system for a roadway project may be organized based upon outlet
points for each individual segment. Typically, each segment of the roadway drainage system will have an outlet to either a side ditch or a cross drain. Where a project includes multiple outlet points, the documentation for each segment of the system should be organized by the roadway station of each outlet point, from the beginning of the improvement to the end. For large or complex projects, it may be helpful to include a summary sheet which lists the beginning and ending stations for each segment of the drainage system as well as describing the location of its outlet point.
The documentation should be stored in a project folder and should include a discussion
of any unusual features or conditions within the project. Further, any assumptions and design decisions made to accommodate those special conditions should be clearly and concisely documented. Where the drainage facility is designed by other than normal or generally accepted engineering procedures, or if the design of the facility is governed by factors other than hydrologic or hydraulic factors, a narrative summary detailing the design basis should be included. Additionally, any environmental or other special considerations, which may have influenced the design, should be discussed.
The design of a storm drainage system can frequently require a large quantity of
computations, and it is not necessary that all of these computations be included in the project file. Rather, the items listed in the following paragraphs should be placed in the project documentation file. A record of other computations should be maintained in the designer’s files and should not be destroyed or removed until construction of the project has been completed. The intent of the following discussion is not to limit the information provided, but instead to provide a guide to the minimum documentation requirements consistent with the guidelines presented in this chapter.
As appropriate, the design documentation should include records of the following types
of computations:
• gutter flows and inlet interception • flow depths in open ditches draining to storm drainage inlets • depth of ponding at inlets in a sump condition • hydraulic capacity for pipe sizing • erosion protection at drainage system outfalls (see Chapter 9 and 10) If computations are performed by hand, it will usually only be necessary to provide
copies of the worksheets or nomographs for hand computations which are provided in the Appendix. If computerized solutions are employed, hard copies of the outputs should be included in the file. Each computation sheet or computer output should be clearly labeled with the project description, a description of the type of computation, project station, the date, and the initials of the designer. When computerized computations are employed, this information may be included with the data input to the program. Otherwise, it will necessary to label output

TDOT DESIGN DIVISION DRAINAGE MANUAL September 10, 2013
7-3
files by hand. When a spreadsheet program is used, a written description of any equations used in the computations should be provided.
In many cases, a proposed storm drainage system will intercept runoff from off-site
drainage areas. Normally, the drainage areas and time of concentration for these off-site areas would be listed in the inlet or other computations. Specific drainage area delineations or time of concentration computations should not be included in the project file unless the drainage area is very complicated or large.

TDOT DESIGN DIVISION DRAINAGE MANUAL September 10, 2013
7-4
SECTION 7.03 - GUIDELINES AND CRITERIA
The primary goal of storm drainage design is to limit the depth and spread of water flowing on the roadway and the ponding at sag points so that it will not interfere with the passage of traffic during the design frequency storm. In general, this is accomplished by:
• placing inlets at the locations and intervals necessary to control spread by intercepting flows
• providing storm drain pipes adequately sized to convey flows from the inlets to suitable outfall locations
• providing outfalls with adequate capacity to convey flows from the storm sewer system and which will not cause excessive backwater throughout the storm drain system
This section presents design criteria and general guidance for many aspects of the
roadway drainage system, including the storm sewer system layout, sizes and types of manholes and pipes, and other roadway features that provide for adequate disposal of stormwater. Specific design procedures are discussed in Section 7.04.
Each of the following sections contains a detailed discussion of an individual roadway
drainage component. The designer should be familiar with the information in all of these sections before undertaking a roadway drainage design. For quick reference, Table 7-1 contains a brief summary of the design guidelines pertaining to commonly applied design elements.
System Component Design Storm Frequency Criteria See Section
Gutter Flow 10-year1,2 Spread on Roadway 7.03.2 Inlet Spacing 10-year1,2 Spread on Roadway 7.03.3.7
Storm Sewer Pipes 10-year2,3,4 Gravity Flow 7.03.4.2 & 7.03.4.3 Storm Drain Outfalls 50-year Erosion Protection 7.03.8 Median/Side Ditches Depth of Flow 5.04
1 50-year at roadway sags for all facilities except local roads. 2 50-year at all points on freeways or multi-lane divided arterials. 3 50-year at cross drains and roadway sags. 4 An HGL check for the 50-year storm should be performed for all pipes designed for the 10-
year storm. See section 7.03.4.2.
Table 7-1
Summary of Design Criteria for Roadway Drainage Structures

TDOT DESIGN DIVISION DRAINAGE MANUAL September 10, 2013
7-5
7.03.1 ROADWAY CROSS SECTION AND PROFILE GRADE
Not only will water on the pavement slow traffic, but hydroplaning and the loss of visibility from splash or spray, are often contributing factors in traffic accidents. Thus, a chief objective in the design of a storm drain system is to remove water from the roadway as quickly and efficiently as possible. Where flows are concentrated, the design objective should be to minimize their depth and horizontal extent. This section discusses aspects of the geometric and pavement design which are related to efficient drainage. 7.03.1.1 MINIMUM LONGITUDINAL SLOPES
To facilitate the flow of water though the gutters of curbed pavements, the designer should attempt to maintain a minimum longitudinal slope of 0.5%. The minimum allowable slope should be no less than 0.4%. It may be difficult to provide these minimum grades in areas of extremely flat terrain. However, minimum grades may be maintained by the use of a rolling profile.
PVI PVI
PVI
PVTPVC
PVT
PVT
PVC
PVC
PROPOSED GRADE
EXISTING GROUND
BE
GIN
PR
OJE
CT
EN
D P
RO
JEC
TTANGENT SLOPEDesired Minimum = 0.5 %Allowable Minimum = 0.4 %
Figure 7-1 Rolling Profile to Maintain Minimum Longitudinal Slopes
A minimum longitudinal gradient is more important for a curbed pavement than for an
uncurbed pavement since the water is constrained by the curb. However, spread of water can be a problem on uncurbed pavements with flat gradients if vegetation is allowed to build up along the pavement edge.
Extremely long sag vertical curves in the curb and gutter profile tend to create relatively
long, flat grades at the sag. These flat slopes will tend to cause the water to spread across the roadway surface instead of allowing it to be concentrated within the area in and near the gutter. As described in the FHWA publication HEC-22, the minimum profile slope described above should be maintained within 50 feet of the low point of the vertical curve to provide adequate drainage in the sag. Based on a minimum slope of 0.4%, this is accomplished where the vertical curve constant (length of the vertical curve in feet divided by the algebraic difference between the grades in percent) as shown in Equation 7-1 is less than or equal to 125 or:
12512≤
−=
GGLK (7-1)
Where: K = vertical curve constant, (ft/percent) L = horizontal length of curve, (ft)

TDOT DESIGN DIVISION DRAINAGE MANUAL September 10, 2013
7-6
G2 = grade of roadway down-station from the low point, (percent) G1 = grade of roadway up-station from the low point, (percent)
It should be noted that TDOT design standards may require the value of K to be greater than 125 for certain facilities. For this situation, refer to Section 7.04.1.3.
Relatively long, flat profile slopes can occur along the edges of pavement where a
superelevation transition is placed on a flat profile grade. It is desirable to maintain a longitudinal profile grade slope of at least 1.5% where a superelevation transition is anticipated on a curbed cross section, as described in Section 7.04.1.3. Relatively long, flat profile slopes may also occur where a sag point coincides with a superelevation transition. The designer should make every effort to avoid this situation. 7.03.1.2 TRANSVERSE SLOPES
As shown in the Standard Roadway Drawings, the minimum cross slope for travel lanes on a tangent section should be 2.0%. Steeper cross slopes are frequently specified, particularly for multi-lane facilities. A cross slope of 2.0% represents a compromise between the need for adequate cross drainage and the need to maintain driver safety and comfort. Generally, this slope is flat enough to have little effect on driver effort or vehicle operation. However, transverse slopes flatter than 2.0% require a greater accumulation of water depth to overcome surface tension. Furthermore, a flat transverse slope increases the spread of gutter flow into the travel lane. Both of these characteristics greatly increase the risk of creating a situation where hydroplaning may occur. 7.03.2 CURBS AND GUTTERS
Curb and gutter serve to contain runoff from the pavement within the roadway, thereby protecting adjacent property from drainage problems or preventing erosion on fill slopes. Curb and gutter are normally required where storm sewers are used and they are normally placed at the outside edge of pavement. Curb and gutter are generally allowed for facilities with design speeds up to 40 mph although they may be allowed for speeds up to 50 mph in certain cases. Guidance on the use and placement of curbs may be found in the TDOT Standard Roadway Drawings and in the Design Guidelines.
Standard curbs are either vertical or sloping and have curb heights of either four or 6 inches (see Figure 7-2). Combined curb and gutter is usually 24 inches wide, and the transverse slope of the gutter is typically 8.3% to 8.5%, which is steeper than the adjacent shoulder or traffic lane cross-slope. The increased gutter slope forms what is termed a composite gutter section and serves to increase the hydraulic efficiency of the gutter.

TDOT DESIGN DIVISION DRAINAGE MANUAL September 10, 2013
7-7
Figure 7-2 Typical Vertical and Sloping Curbs
The hydraulic analysis of gutters is a part of the computations necessary to determine
the placement of inlets. Design storm frequencies used in the analysis of gutters are the same as those used to design inlets as presented in Section 7.03.3. The limiting factor in the analysis of gutter flow is normally the allowable spread of flow on the roadway.
Equations and methodologies for analyzing gutter flow are presented in Section 7.04.3.
7.03.3 STORM DRAIN INLETS
Storm drain inlets are used to collect runoff and discharge it into the storm sewer system. They are important to road drainage and storm sewer design because of their effect on the rate of removal of the water from the roadway as well as the degree of utilization of the storm sewer system. Inlets are typically located in gutter sections, paved medians, and roadside or median ditches and are set on top of a catch basin structure. Inlets can be divided into three general classes:

TDOT DESIGN DIVISION DRAINAGE MANUAL September 10, 2013
7-8
• Combination inlets are generally used in curb and gutter sections and usually consist of two parts. One part is the curb iron which is shaped to fit into the curb and provide an opening on the curb face. The other part is a cast iron grate and frame which is placed on the surface of the catch basin in the gutter flow line.
Figure 7-3 Combination Inlet
Reference: USDOT, FHWA, HEC-22 (1996)
• Median or side ditch inlets usually consist of one or more flat grates which are placed on a catch basin. These inlets serve to convey flow from a ditch into a storm sewer collection system. The grates may be constructed from either cast iron or structural steel.
Figure 7-4 Typical Median Ditch Inlet
Location: SR 111, Overton County, TN (2004)

TDOT DESIGN DIVISION DRAINAGE MANUAL September 10, 2013
7-9
• Longitudinal drains are used to intercept sheet flow or other types of flows which are broadly dispersed. With certain limitations, two types of longitudinal drains are available to the designer. The first is slotted drains which consist of a pipe having an opening cut along its longitudinal axis to accept a vertical metal slot that provides an opening to the surface. The second is a trench drain, which consists of a rectangular concrete channel with a built-in slope and cast iron grates which are bolted to a metal frame cast into the channel side walls (see Figure 7-6).
Figure 7-5 Slotted Drain Inlet
Reference: USDOT, FHWA, HEC-22 (1996) and TDOT Standard Roadway Drawings
Figure 7-6
Trench Drain Inlet Reference: Neenah Foundry Company Website
The following sections discuss the general uses of each type of inlet, provide specific
information on the application of each type of standard inlet, and set forth specific criteria for inlet design and spacing.

TDOT DESIGN DIVISION DRAINAGE MANUAL September 10, 2013
7-10
7.03.3.1 COMBINATION INLETS ON CONTINUOUS SLOPES
A combination inlet consists of a curb-iron inlet placed in the curb line above a grate inlet placed within the gutter. Because the majority of the water entering a combination inlet will be through the front and side of the grate, its interception capacity does not differ materially from that of a grate inlet alone. The principal advantage of this inlet configuration is that the curb iron will act as a “backup” and intercept water should the grate become clogged with debris. Because of its role as a “backup” opening, any interception of flow provided by the curb iron is not considered when evaluating the total interception of the inlet.
The hydraulic efficiency of a curved vane grate is achieved by the shape of its vanes,
which mimic the shape of the nappe of flow over a sharp-crested weir. As such, these inlets are directional. The designer should be aware that the efficiency of a curve vane inlet installed against the flow will be extremely low.
Grate inlets, as a class, perform satisfactorily over a wide range of gutter grades. The
interception capacity of a grate inlet depends on the amount of water flowing over the grate, the size and configuration of the grate and the velocity of flow in the gutter. To evaluate the interception efficiency of a grate, the flow is divided into two types, frontal and side flow as depicted in Figure 7-7. Frontal flow is water flowing in the gutter section directly in front and upstream of the grate. Side flow is the water that moves along side the grate.
Figure 7-7 Frontal and Side Flow
Reference: Adapted from Neenah Foundry “Inlet Grate Capacities”
At low velocities, all of the frontal flow is intercepted by the grate, as well as a small portion of the side flow. Water begins to skip completely across or splash over the grate at a velocity dependent on the grate configuration. This velocity is termed the splash-over velocity. Thus, at flow velocities greater than the splash-over velocity, interception efficiency is reduced and less than 100% of the frontal flow is intercepted. Generally, reticuline grates (which have rectangular vertical openings) have lower splash-over velocities than grates with curved vanes. Thus, a reticuline grate would be less efficient than a curved vane grate of the same size.
Side flow interception efficiencies are often quite low, even for relatively small flow
velocities. Side flow interception is affected not only by velocity, but also by the length of the grate and the pavement cross slope adjacent to the grate. Cross slope affects the depth of flow

TDOT DESIGN DIVISION DRAINAGE MANUAL September 10, 2013
7-11
adjacent to the grate and the spread. A flat cross slope will result in a lower depth at the side of the grate, which will reduce the tendency of the water to turn and fall into the grate. In addition, a flat cross slope will increase the spread width, effectively removing water from the area of the grate. 7.03.3.1.1 INLET SPACING ON CONTINUOUS SLOPES
As discussed in Section 7.04.1, there are a number of locations where inlets may be necessary due to geometric or other controls, regardless of the flow at that particular point. Once these locations have been identified, computations accounting for discharge, spread, inlet capacity, and bypass may be performed to locate any other needed inlets.
Allowable spread is the criterion used for locating storm drain inlets between those
required by geometric or other controls. As the flow rate in the gutter increases, the spread of flow into the roadway will become greater as well. The flow rate in the gutter is typically evaluated using the Rational Method (see Chapter 4 of this Manual) and the spread is determined by examining the uniform flow characteristics of the gutter cross section.
Figure 7-8 Inlet Spacing on a Continuous Slope
Reference: Adapted from Neenah Foundry “Inlet Grate Capacities”
In evaluating drainage area, the designer should be careful to identify sources of off-site runoff from areas draining towards the highway pavement. Often, off-site flow will be intercepted by roadside channels or inlets before it reaches the roadway. However, drainage from cut slopes may flow across the tops of curbs, and additional flow may be brought to the gutter by side streets which may act as drains for other areas along the pavement.
Beginning from the high point on a profile grade, the designer should evaluate flow rates
in the gutter to identify the point at which the spread of the flow is equal to the allowable spread. An inlet should be placed at this point, and the designer should compute the interception efficiency of this inlet for both frontal and side flow. Any flow not intercepted by the inlet is termed bypass. Bypass flows are added to the runoff from the roadway as flow rate computations continue downgrade. The next downgrade inlet is located at the point where the spread on the roadway again reaches the design spread. In this manner, the spacing of inlets on a continuous grade is a function of the amount of upstream bypass flow, the contributing drainage area, and the gutter geometry.

TDOT DESIGN DIVISION DRAINAGE MANUAL September 10, 2013
7-12
Design criteria for allowable spread are presented in Section 7.03.3.7 and specific design procedures for inlet locations are presented in Section 7.04.4. 7.03.3.2 COMBINATION INLETS AT SAG POINTS
A combination inlet is required at any low point or sag in the gutter profile. The inlets used at a sag point will normally include two curved vane grates with two curb irons. The curved vane grates should be oriented in opposite directions to more efficiently receive flows from either direction.
The grate portion of the inlet will operate as a weir under low head conditions and as an
orifice at greater depths. The depth at which orifice flow begins is dependent on the perimeter of the grate and the effective area of the openings in the inlet. At depths between those at which weir flow definitely prevails and those at which orifice flow prevails, flow is in a transition stage. At these depths, control is ill-defined and flow may fluctuate between weir and orifice control. For purposes of design, an average value is normally used within this range.
It is critical that inlets in sag locations be able to efficiently pass debris because all of the
runoff which enters the sag must be passed through the inlet. Total or partial clogging of inlets in these locations can result in hazardous ponding conditions. Thus, combination inlets are always used in these locations. As with inlets on a continuous slope, the curb iron acts as a “backup” should the grate inlet become clogged. Thus, the capacity of the curb iron to accept flow is not considered when evaluating the total performance of the inlet.
Traffic could be unduly disrupted if a sag inlet were to become clogged. Thus the
designer should place flanking inlets on each side of the sag inlet. The inlet spacing design at the sag is performed in two steps. First, the inlet spacing is determined without consideration of the flanking inlets. Because these inlets are considered a backup to the inlet at the actual sump point, the inlet spacing computations should proceed as if these inlets were not present. Second, the flanking inlet locations should be determined using the following criteria.
Flanking inlets should be located so that they will receive all of the flow when the primary
inlet at the bottom of the sag is clogged. They should do this without exceeding the allowable spread at the bottom of the sag. If the flanking inlets have the same dimensions as the primary inlet, this will be accomplished when they are located so that the depth of ponding at the flanking inlets is 63% of the allowable depth of ponding at the low point itself. Table 7-2 and Figure 7-9 may be used to determine the spacing between the sag point and the flanking inlets. Table 7-2 shows the spacing required for various allowable ponding depths and vertical curve constants as defined by Equation 7-1. This method may be applied, for example, where the sag and flanking inlets are both type 14 catch basins. An example of these computations is provided in the Appendix. In situations where a type 14 catch basin is flanked by type 12 catch basins, the flanking inlets should be placed at the locations where the depth is 82% of the depth at the sag. In other situations, it will be necessary to perform an analysis using the weir equation to determine the location of each flanking inlet.

TDOT DESIGN DIVISION DRAINAGE MANUAL September 10, 2013
7-13
Figure 7-9 Flanking Inlet Spacing Diagram
Note: d = Depth at allowable spread. Reference: USDOT, FHWA, HEC-22 (1996)

TDOT DESIGN DIVISION DRAINAGE MANUAL September 10, 2013
7-14
Depth at
Sump (feet)
Depth at Flanking
Inlet (feet)
K Values in Feet / %
20 30 40 50 70 85 100 115 125 150
0.1 0.06 12.2 14.9 17.2 19.2 22.8 25.1 27.2 29.2 30.4 33.3
0.2 0.13 17.2 21.1 24.3 27.2 32.2 35.5 38.5 41.3 43.0 47.1
0.3 0.19 21.1 25.8 29.8 33.3 39.4 43.4 47.1 50.5 52.7 57.7
0.4 0.25 24.3 29.8 34.4 38.5 45.5 50.2 54.4 58.3 60.8 66.6
0.5 0.32 27.2 33.3 38.5 43.0 50.9 56.1 60.8 65.2 68.0 74.5
Note: These distances are computed as [ ]( ) 50370200 .Kd. where d is the depth at the sump.
Table 7-2
Spacing Distances in Feet for Flanking Inlets Reference: Adapted from HEC-22
Design criteria for allowable spread are presented in Section 7.03.3.7 and specific design procedures for inlets at sag points are presented in Section 7.04.4.3. 7.03.3.3 INLETS FOR MEDIAN OR SIDE DITCHES
The TDOT Standard Roadway Drawings include a number of inlets which are intended for use in median or side ditches. These inlets are generally intended to intercept large amounts of flow and operate hydraulically in a manner similar to inlets at sag points, described in the previous section. These inlets can be constructed from either cast iron or structural steel and the following section discusses criteria for which type to use.
As with inlets at sag points, the depth of ponding at the inlet is the design criteria used to
select an inlet for a given site. The allowable depth of ponding at a ditch inlet should be determined by the criteria set forth in Section 5.04.6 of this Manual. A procedure for computing the performance of these inlets is provided in Section 7.04.4.3.
Where median drains discharge across the roadway to the outside slope, the end
treatment at the outfall should be selected according to the criteria provided in Section 6.04.3.1. 7.03.3.3.1 USE OF INLETS WITH STRUCTURAL STEEL GRATES
The various catch basins shown in the Standard Drawings which use structural steel grate units were designed for use in areas where neither pedestrian nor vehicular traffic are present. The spacing between the pipes in these grate units was designed to provide a great deal of hydraulic capacity and to allow the passage of debris. However, this spacing is too wide to be safely used in areas with pedestrian traffic. In these areas, the designer should use an appropriate cast iron grate unit designed for pedestrian traffic.
The structural steel grate units shown in the Standard Roadway Drawings are not designed for use in areas where vehicular traffic is present. Although these grate units are

TDOT DESIGN DIVISION DRAINAGE MANUAL September 10, 2013
7-15
traversable, they are not structurally capable of supporting vehicular traffic without experiencing structural damage. These grate units were designed for use in unpaved ditches adjacent to the roadway, either in the median area or along the side of the roadway.
TDOT policy calls for cast iron inlet grate units to be used in all paved areas. An
example of this would be the inside shoulders adjacent to median barrier walls. These areas would experience detour traffic during construction or maintenance operations. Cast iron grates should also be used in paved areas between entrance and exit ramps on freeways, especially if there is a possibility that heavy vehicles may traverse the grate units for any reason. 7.03.3.4 USE OF LONGITUDINAL DRAINS
Longitudinal drains may be either slotted drains or trench drains, as described in Section 7.03.3. The use of slotted drains should be avoided as much as possible on TDOT road projects and should be used only with the approval of the Design Manager. Trench drains may be used where long sections of flat profile grade are unavoidable or in other paved areas where standard catch basins cannot efficiently collect runoff. Both types of drains may create difficulties for future roadway resurfacing projects.
Slotted drains should not be used where they would be exposed to a high volume of
traffic. Furthermore, the use of slotted drains may reduce the life expectancy of the storm drainage system. Thus, the use of additional catch basins or trench drain is preferred to the use of slotted drains.
Occasionally, due to specialized surface conditions, the Design Manager responsible for
the project may feel that the use of slotted drains is the best solution for the drainage problem at a specific location. When this situation occurs, the designer should incorporate the slotted drains into the plans in the following manner. The designer should achieve both a vertical and horizontal clearance of 12 inches between the slotted drain pipe and the concrete trunk line carrying the storm drainage system. The TDOT Standard Roadway Drawings, Drainage – Catch Basins and Manholes specify a minimum wall distance between the top of the catch basin wall and the top of the cutout hole for a connecting pipe. This minimum distance applies to corrugated metal pipe the same as it does for concrete pipe. Because the pipe for a slotted drain is only a few inches below the surface, it will be too shallow to meet these criteria. Thus, a series of pipe elbows should be used to connect the drain to a catch basin as shown in the slotted drain standard drawings. In addition, it is important that slotted drains be provided with cleanouts as specified in the Standard Drawings.
Trench drains may be used in places where standard inlets can not effectively collect
runoff from the roadway. Often, they are applied in gore areas or in paved medians (with or without a median barrier). The use of trench drains should be avoided in areas where they will be exposed to a high volume of traffic or to high-speed traffic. Although the grates are bolted down, frequent impact loading, particularly from heavy or high-speed vehicles, may cause deterioration of the trench side walls.

TDOT DESIGN DIVISION DRAINAGE MANUAL September 10, 2013
7-16
Trench drains have a built-in slope and in general should be installed so that they slope in the same direction as the overall profile grade. However, there may be situations, such as at superelevation transitions, where it would be necessary to install a trench drain in the opposite direction from the gutter slope. Regardless of the situation, the slope of the trench drain should not be less than 0.5% so that the flow velocity in the drain will be sufficient to prevent sediment deposition. The designer should ensure that this slope can be achieved over the proposed length of the drain without causing the depth at the upstream end to be less than the minimum allowable depth of 6 inches.
The outlet of a trench drain should be connected to a catch basin by a short length of 12-
inch diameter PVC pipe with a minimum slope of 2%. This will allow the pipe to operate in inlet control for the range of design discharges. In order to maintain minimum cover on the pipe, the trench should be 36 inches deep at the downstream end to provide 1 foot of freeboard below the top of the trench drain casting for the maximum design outflow of 4.5 cfs.
Where trench drains are applied in a median with median barrier, it should be connected
to a catch basin located at the profile sag point. If a Type 31 catch basin is specified at that location, each run of trench drain may be individually connected to the catch basin. In other situations it would be possible to specify a Type 41 catch basin, with a pipe connecting underneath the median barrier from the side of the concrete trench to the catch basin. This arrangement may be utilized with Type 41LP, RB, S, SB and SC catch basins. Other versions of the Type 41 catch basin are too large to fit into this application. See Standard Drawing D-TD-1.
Because trench drains are most commonly applied at sags, flat grades, or on freeways,
they are usually designed for the 50-year event. The total required length of trench drain is normally determined based on site conditions. The length should then be checked by computing the spread at the upstream end of the proposed trench drain. If the spread is greater than allowable, the trench drain length may be increased or an additional catch basin can be placed at some point upstream. Since the use of trench drains may result in higher costs than the use of catch basins alone, the choice of extending the trench drain or adding a catch basin should be based on providing the most economical design.
Where the total discharge to a trench drain installation exceeds 4.5 cfs, the designer
should consider dividing the total length of trench drain into individual runs. The length of these individual runs should be determined based on:
• maintaining a minimum flow line slope of 0.5%, starting from the depth of 36 inches at the outlet,
• ensuring that the design discharge into the run of trench drain will be less than the maximum of 4.5 cfs recommended above, accounting for any flows bypassed by upstream catch basins,
• ease of construction, considering changes in the longitudinal slope.

TDOT DESIGN DIVISION DRAINAGE MANUAL September 10, 2013
7-17
Where deemed necessary, the depth of flow into the trench drain grating should be determined in order to ensure that the maximum spread will not be exceeded. This depth may be computed using the weir equation (see equation 7-35). In order to account for the fact that only 50% of the total trench drain grate length is actual open area, and to allow for a clogging factor of 20%, the length of the run of trench drain should be divided by 2.5 to compute an effective weir length for use in the equation.
If longitudinal drains are incorporated in the storm drainage system, the structure code
identification numbers assigned to the longitudinal drains should be consistent with the system used to assign numbers for the overall storm drainage system. The beginning and end of each segment of longitudinal drain should be identified by a structure code identification number. The grate and invert elevations should be identified at each of these locations, as well as the grade along the longitudinal drain. The designer should also show the inlet invert elevations of longitudinal drains where they enter other drainage structures. 7.03.3.5 STANDARD INLET TYPES AND APPLICATIONS
The TDOT Standard Drawings provide for several types of stormwater inlets. Each of these inlets may be combined with a number of different inlet structures to create a wide variety of catch basin configurations. Table 7-3 provides a summary of the various inlet types and should serve as a guide to their selection:

TDOT DESIGN DIVISION DRAINAGE MANUAL September 10, 2013
7-18
Inlet Type
Grate Type
# of Grates
Curb Iron Type
# of Curb Irons
Standard Drawing* Application
10 Curved Vane 1 None D-CBB-12A Gutter only
12 Curved Vane 1 6"-Vertical 1 D-CBB-12A Curb & Gutter, on slope
only
13 Curved Vane 1 6"-Vertical 1 D-CBB-13 Curb & Gutter, curved
roadway, on slope only 14, 16,
17 Curved Vane 2 6"-Vertical 2 D-CBB-12A Curb & Gutter, on slope
or sag
25 Curved Vane 1 6"- Sloping 1 D-CBB-12B Curb & Gutter, on slope
only
26, 27 Curved Vane 2 6"- Sloping 2 D-CBB-12B Curb & Gutter, on slope
or sag
28 Curved Vane 1 4"- Sloping 1 D-CBB-12C Curb & Gutter, on slope
only
29 Curved Vane 2 4"- Sloping 2 D-CBB-12C Curb & Gutter, on slope
or sag
31 Curved Vane 2 Barrier
Wall 2 D-CBB-31 Concrete Barrier Wall, both sides, on slope only
38 Structural Steel 1 N/A 1 D-CB-38 etc. Median Ditch
39 Structural Steel 1 N/A D-CB-39 etc. Median Ditch
40 Structural Steel 1 N/A D-CB-40S Median Ditch
41 Curved Vane 1 Barrier
Wall 1 D-CBB-31 Concrete Barrier Wall, one side, on slope only
42 Cast Iron 1 N/A D-CBB-42 Ditch Inlet
43 Cast Iron 2 N/A D-CBB-42 Ditch Inlet
44 Cast Iron 4 N/A D-CBB-42 Ditch Inlet
45 Curved Vane 2 Barrier
Wall 2 D-CBB-31 Concrete Barrier Wall, one side, on slope only
46 Curved Vane 4 Barrier
Wall 4 D-CBB-31 Concrete Barrier Wall, both sides, slope or sag
51 Curved Vane 1 Barrier
Wall 1 D-CBB-31 Concrete Retaining Wall
* See current Standard Drawings for any changes or additions
Table 7-3 Standard Inlet Types and Applications

TDOT DESIGN DIVISION DRAINAGE MANUAL September 10, 2013
7-19
7.03.3.6 CATCH BASIN GRATE STATIONS AND ELEVATIONS SHOWN ON THE PLANS
The station and elevation shown on the plans for a curb and gutter inlet with a single grate should be at the centerline of the grate at the gutter low point, usually adjacent to the curb face. Where there are multiple grates on a catch basin, the station and elevation would be determined at the centerline of the system of grates, again at the low point.
On median-type catch basins with a single grate, the station and elevation should be
determined at the center of the grate. Where the catch basin includes a system of grates, the station and elevation would be determined at the center of the system of grates.
Figure 7-10 illustrates where station and elevation are determined for various inlet grate
configurations.

TDOT DESIGN DIVISION DRAINAGE MANUAL September 10, 2013
7-20
Figure 7-10 Station and Elevation Location for Various Standard Inlets

TDOT DESIGN DIVISION DRAINAGE MANUAL September 10, 2013
7-21
7.03.3.7 DESIGN STORM FREQUENCY AND SPREAD FOR INLET SPACING
As discussed in Section 7.03.3.1, the spread of flow on the roadway is the criterion used to select the location of inlets on a continuous slope. As shown in Table 4-1 of this Manual, the storm frequency selected for the design of pavement drainage should be consistent with the storm frequency used to design the other elements of the storm drainage system. The allowable spread on roadway pavements, for both curb inlets and median barrier wall inlets, should be based on the following criteria:
• In general, the greatest allowable spread on any facility should be 8 feet, including the gutter width.
• The designer may choose to specify a smaller spread where the roadway cross section includes a bicycle lane. This would serve to limit the depth of flow in the bicycle lane.
• The curb height should also be considered in determining the allowable spread. On some roadway cross sections, a spread of 8 feet may result in a water depth greater than the curb height. In such cases, the allowable spread should be reduced.
• Where inlets are used along a freeway, the allowable spread should not exceed the shoulder width.
• The spacing between two adjacent catch basins should not be greater than 400 feet, as provided in Section 7.03.5.6.
7.03.4 STORM SEWER PIPES
A typical storm drainage system is made up of pipes, catch basins and manholes. Storm sewer pipes serve to convey storm water from the drainage system inlets to the ultimate outlet point of the drainage system. They should be provided with adequate capacity to accommodate the design flow and should be designed to minimize maintenance concerns. The size and grade of a storm sewer pipe are closely related to the type of structures connected to the upstream and downstream ends of the pipe. The design software GEOPAK Drainage (see Section 7.05.2) as implemented by TDOT, contains features which allow the designer to ensure that the proposed pipe design is compatible with the proposed structures on either end. This section discusses the various criteria that should apply to the selection and design of storm sewer pipes. The design of catch basins and manholes is discussed in Section 7.03.5. 7.03.4.1 PIPE TYPE AND COVER CRITERIA
Storm sewer pipes for all classifications of roadway, except local roads, should be reinforced concrete pipe. As shown on Table 6A-1, the use of alternate pipe types is permitted for local roads only. The selection of concrete pipe class is governed by the maximum depth of cover that will be placed on the pipe at any point along the pipe run. Typically, the maximum allowable cover will be determined by the maximum depths allowed for the catch basins or manholes to which the pipe will be connected.
The minimum allowable depth of cover for all pipes under design loads will be 12 inches,
measured from the bottom of the subgrade to the outside surface of the pipe. For construction loads, polyvinyl chloride or high-density polyethylene pipe should be provided with a minimum cover of 24 inches. The designer should insure that the minimum cover is maintained at all points where a pipe is beneath travel lanes or shoulders. In particular, this may become an issue when designing a pipe to connect to the catch basin at the sag point of a steep grade. The

TDOT DESIGN DIVISION DRAINAGE MANUAL September 10, 2013
7-22
pavement grades between the sag inlet and the next upstream curb inlet will be curved. However, the pipe connecting the two inlets will be straight. Thus, if the pipe is at or near minimum depth of cover at the catch basins, the depth of cover will be less than allowable at some point near the middle of the pipe run. In extreme cases, the top of the pipe might even “daylight.” An additional catch basin placed at the point of minimum cover will usually be sufficient to correct this problem. These criteria may be checked by ensuring that catch basins and manholes are plotted to the correct scale on the roadway profile drawings.
GEOPAK Drainage offers a number of features which may be used to manage pipe
cover. It allows pipes to be drawn in a profile view so that minimum cover and clearance from other utility structures can be visually verified. It also provides automated methods for ensuring that proposed pipes are placed at the least depth necessary to maintain minimum cover, which assists in minimizing the project cost. 7.03.4.2 PIPE SIZING CRITERIA
The minimum round pipe size at any point in a storm sewer system should be 18 inches or equivalent. This includes corrugated metal pipe used for slotted drains when allowed by the Design Manager responsible for the project. Pipe-arches or horizontal elliptical pipes should be no smaller than an equivalent 18-inch round pipe.
The size selection for each pipe in the storm sewer system will normally be based on its
hydraulic capacity. The capacity of a pipe is governed by its size, shape, slope, and flow resistance. The most widely used formula to compute hydraulic capacity is Manning's Equation. Manning’s Equation assumes a steady uniform flow rate in the storm sewer pipe.
Two different criteria will be applied in order to determine whether a given pipe size will
be adequate for the design flow rate. The first is that each pipe in the storm sewer system should have sufficient capacity to pass the design discharge as open channel or gravity flow. To maintain open channel or gravity flow, the depth of flow is usually less than the height of the pipe. In other words, the full-flow capacity of the pipe must be greater than the design flow rate. Detailed procedures for these computations are provided in Section 7.04.5.3.
The second pipe sizing criteria involves the evaluation of hydraulic grade line for the 50-
year flow rate. The hydraulic grade line (HGL) is a line coinciding with the level of flowing water at any point along the storm sewer system. When water is flowing through the pipe and there is a space of air between the top of the water and the inside of the pipe, the flow is considered as open channel flow and the HGL is at the water surface. When the pipe is flowing full under pressure flow, the HGL will be above the crown of the pipe. In this situation, the hydraulic grade line is the level to which water would rise in a vertical tube at any point along the pipe.
Where storm sewer pipes have been sized for the 10-year storm frequency, the
proposed storm sewer system should be checked to ensure that the HGL computed for the 50-year storm frequency will be below each of the castings in the storm sewer system. However, where the entire system has been designed for the 50-year storm frequency, the HGL check will not be needed. Criteria for selecting the design storm frequency are provided in Section 7.03.
A more detailed discussion of hydraulic grade line computations is provided in Section
7.04.6.

TDOT DESIGN DIVISION DRAINAGE MANUAL September 10, 2013
7-23
7.03.4.3 MINIMUM AND MAXIMUM VELOCITY
It is important that flow velocities in storm sewer pipes be sufficient to prevent sediment deposition and subsequent capacity loss. Thus, all storm sewer pipes should be designed such that the velocity at the design flow rate will be 3 feet per second or greater. For most design situations, the flow velocity at the actual design discharge will be approximately equal to the velocity at full flow. Thus, the full flow velocity may be used to check this criterion.
It is preferable to maintain a pipe slope of at least 0.5% at all points in the storm sewer
system. However, a slope of 0.4% should be considered the minimum constructible grade. The TDOT implementation of GEOPAK Drainage contains a check to ensure that this criteria is met.
Slopes that incur uniform flow velocities in excess of 12 feet per second should be
avoided due to the potential for abrasion. In steeper terrain, large elevation differences can be accommodated by the use of drop structures. A figure illustrating the use of drop structures and a discussion of their use for velocity control in culverts is provided in Section 6.04.1.1.1.5.
7.03.5 CATCH BASINS AND MANHOLES
Catch basins and manholes serve a number of purposes in the storm sewer system, including collecting inflow, providing access for maintenance, and allowing for changes in direction and grade of the trunk line. By definition, catch basins serve as inlet points for discharges along curbs or ditches. They may also be used to connect trunk line storm sewer pipes. Manholes are often used to connect trunk line storm sewer pipes.
Specific information on allowable depths, maximum pipe connection sizes and structural
details are provided in the TDOT Standard Drawings. In addition, this information has been entered into the TDOT implementation of GEOPAK Drainage, thus allowing the designer to ensure that the proposed pipe connections will be consistent with the current standard drawings. This section of the Manual discusses the types of catch basins and manhole available for design, as well as providing criteria for pipe connections to these structures. 7.03.5.1 CATCH BASINS
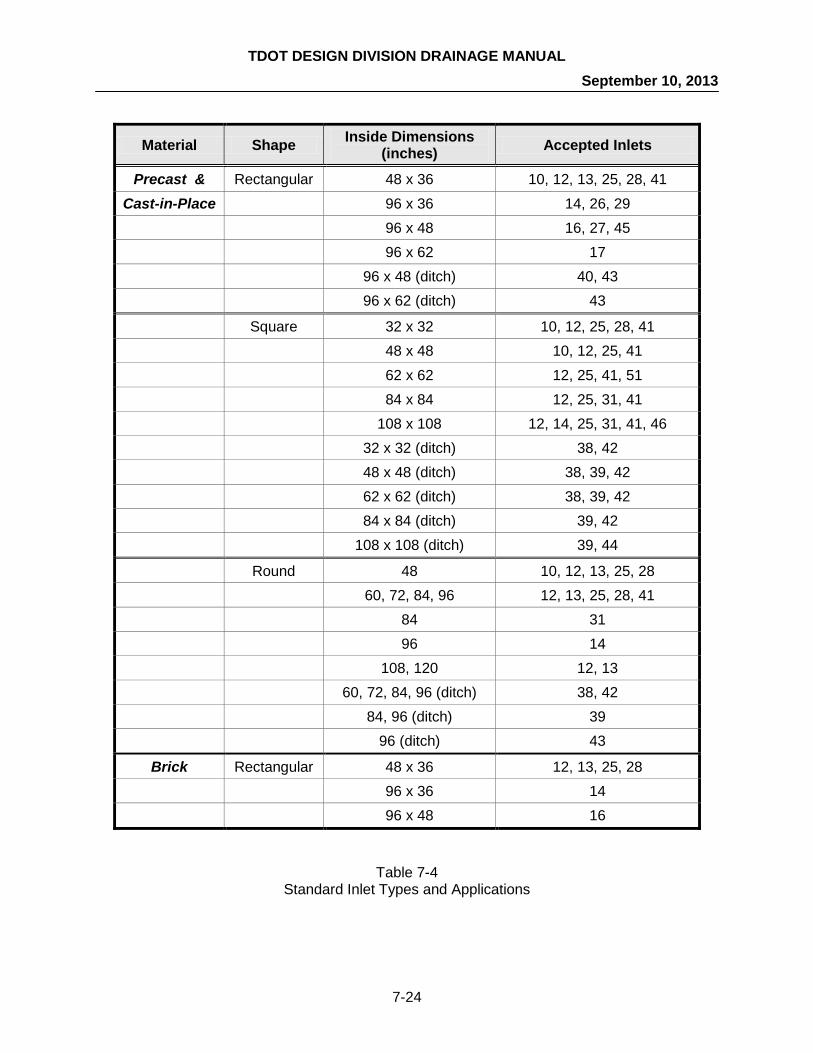
Catch basins consist of a metal inlet casting placed on an inlet structure. Information on the available inlet castings is provided in Section 7.03.3.5 and in the TDOT Standard Drawings. Inlet structures may be round, square or rectangular and may be constructed of precast concrete, cast-in-place concrete or brick. Table 7-4 summarizes the available types of standard inlet structures.
The designer should check the current TDOT Standard Drawings for any changes or
additions to this list. If required, catch basins of sizes other than those shown may be used.
TDOT DESIGN DIVISION DRAINAGE MANUAL September 10, 2013
7-24
Material Shape Inside Dimensions (inches) Accepted Inlets
Precast & Rectangular 48 x 36 10, 12, 13, 25, 28, 41 Cast-in-Place 96 x 36 14, 26, 29
96 x 48 16, 27, 45 96 x 62 17 96 x 48 (ditch) 40, 43 96 x 62 (ditch) 43
Square 32 x 32 10, 12, 25, 28, 41 48 x 48 10, 12, 25, 41 62 x 62 12, 25, 41, 51 84 x 84 12, 25, 31, 41 108 x 108 12, 14, 25, 31, 41, 46 32 x 32 (ditch) 38, 42 48 x 48 (ditch) 38, 39, 42 62 x 62 (ditch) 38, 39, 42 84 x 84 (ditch) 39, 42 108 x 108 (ditch) 39, 44
Round 48 10, 12, 13, 25, 28 60, 72, 84, 96 12, 13, 25, 28, 41 84 31 96 14 108, 120 12, 13 60, 72, 84, 96 (ditch) 38, 42 84, 96 (ditch) 39 96 (ditch) 43
Brick Rectangular 48 x 36 12, 13, 25, 28 96 x 36 14 96 x 48 16
Table 7-4 Standard Inlet Types and Applications

TDOT DESIGN DIVISION DRAINAGE MANUAL September 10, 2013
7-25
Code Catch Basin Type
LP 32 x 32 inch square SB 48 x 48 inch square SC 62 x 62 inch square SD 84 x 84 inch square SE 108 x 108 inch square RA 48 inch round RB 60, 72, 84, 96 inch round1, 3, 4 RC 84, 96, 108, 120 inch round2 B Brick P Precast S Cast-in-place or precast R Round
Notes: 1 For inlet types 12 and 13, “RB” refers only to 60 and 72-inch round catch basins. For all other
inlets, the “RB” designation includes structure sizes up to 96 inches in diameter. 2 The “RC” designation is used only for Type 12 and 13 inlets. 3 The only round catch basin size allowed for Type 31 inlets is 84 inches. This inlet is given an
“R” designation. 4 The only round catch basin size allowed for Type 39 inlets is 84 inches.
Table 7-5 Catch Basin Codes Used in the TDOT Standard Drawings
7.03.5.1.1 ALTERNATE CATCH BASINS
When catch basins are specified for a project, the designer should apply sound engineering judgment to determine applicable alternate catch basin types and provide a list of these structures on the construction index sheet. This list should consist of the Standard Drawing number for each alternate catch basin. This list should include the current TDOT Standard Drawing number and latest revision date for each alternate catch basin type. Catch basins that would currently fall under this criteria are numbers 12, 13, 14, 16, 25, 26, 28, 29, 31, 38, 39, 41, and 42. An example for the number 12 catch basin is shown in Table 7-6.

TDOT DESIGN DIVISION DRAINAGE MANUAL September 10, 2013
7-26
Alternate Drainage-Catch Basins and Manholes
Drawing Number
Revision Date Description
D-CB-12B 7-29-02 Rectangular Brick No. 12 Catch Basin
D-CB-12LP 5-27-01 Low Profile 32” x 32” Square Concrete No. 12 Catch Basin
D-CB-12P 7-29-02 Precast Rectangular Concrete No. 12 Catch Basin
D-CB-12RA 5-27-01 Precast 48” Circular No. 12 Catch Basin (for Use With 6” Sloping Curb)
D-CB-12RB 5-27-01 Precast 60” and 72” Circular No. 12 Catch Basin (for Use With 6” Vertical Curb)
D-CB-12RC 5-27-01 Precast 84” through 120” Circular No. 12 Catch Basin (for use with 6” Vertical Curb)
D-CB-12S 7-29-02 Rectangular Concrete No. 12 Catch Basin
D-CB-12SB 7-29-02 4’ X 4’ Square Concrete No. 12 Catch Basin
D-CB-12SC 9-11-02 5’ 2” X 5’ 2” Square Concrete No. 12 Catch Basin
D-CB-12SD 9-11-02 7’ X 7’ Square Concrete No. 12 Catch Basin
D-CB-12SE 9-11-02 9’ X 9’ Square Concrete No. 12 Catch Basin
Table 7-6 Example of Catch Basin Alternates List
7.03.5.1.2 USE OF NO. 6-72 CATCH BASINS
Standard No. 12 Catch Basins shall be used throughout the State of Tennessee. Do not use the No. 6-72 Catch Basin in State or Federally-funded projects in Shelby County.

TDOT DESIGN DIVISION DRAINAGE MANUAL September 10, 2013
7-27
7.03.5.2 MANHOLES
TDOT standard manholes may be either round or square and can be used for either storm or sanitary applications.
Round concrete storm manholes may range in diameter from 60 to 120 inches and may
be up to 40 feet deep. Where the manhole is sufficiently deep, it should be provided with a precast eccentric cone 4 feet high. For shallow manholes, a flat lid may be used in place of the eccentric cone.
Square concrete storm manholes may have widths of 62, 84 or 108 inches and a
maximum depth of 28 feet. These manholes will generally be provided with a flat lid. Round concrete sanitary manholes may have diameters ranging from 48 to 120 inches.
Although the maximum depth for a 48-inch sanitary manhole is 20 feet, larger diameter sanitary manholes may be as much as 40 feet deep.
Although manholes which exceed the criteria presented above may be used, such
structures would require an individual design. Manhole castings usually consist of a rim and a cover. Storm sewer manholes may be
provided with either a Type A cover, which is an open grate and allows the manhole to function as in inlet, or a Type C cover which is solid. Sanitary manholes are usually provided with a Type B cover, which is essentially the same as Type C covers, except that the Type B is embossed with the word “SEWER” while the Type C is labeled “DRAIN.” Any manhole that is provided with a flat lid will require a course of brick between the lid and the manhole rim as an adjustment to insure that the lid will match the surrounding grade. Flat manhole lids should not be used under flexible pavements; rather, such structures should be provided with eccentric cones. See Section 7.03.5.7 for additional information. 7.03.5.3 MINIMUM AND MAXIMUM DEPTHS FOR CATCH BASINS AND MANHOLES
In general, catch basins and manholes should be designed to minimize pipe depth. The minimum allowable depth for any given catch basin or manhole is usually specified for varying pipe sizes on the standard drawing for that structure type. Usually the depth is measured from the casting elevation (see Section 7.03.3.6 for information on catch basin casting elevations) to the flow line elevation of the structure outlet pipe. However, the depths specified in the Standard Drawings assume that the inlet and outlet pipes are of the same diameter. Where the outlet pipe is larger than the inlet pipe, the crown elevations of the pipes should match as described in Section 7.03.5.5. In this situation, the minimum depth of the structure should be increased by an amount equal to the difference in the pipe sizes. GEOPAK Drainage may be used to minimize structure depths while ensuring that the cover criteria provided in Section 7.03.4.1 are met.
The maximum allowable depth for a catch basin or manhole is usually specified on the
standard drawing for that structure. This data has been included in the TDOT implementation of GEOPAK Drainage in order to simplify the process of checking structure depth. A structure may exceed the maximum depth specified on the standard drawings; however, an individual structural design should be included in the plans.

TDOT DESIGN DIVISION DRAINAGE MANUAL September 10, 2013
7-28
7.03.5.4 JUNCTION BOXES AND SPRING DRAIN BOXES
Junction boxes and spring drain boxes are drainage structures to be used in special circumstances. Junction boxes serve as a location for multiple pipe culverts to intersect but provide no access or drainage inlet and their use should be restricted as stated in 7.03.5.4.1. Spring drain boxes are used to allow a natural spring or seep to continue to flow after being buried by project grading. 7.03.5.4.1 JUNCTION BOXES
Junction boxes consist of round or square concrete structures which serve as pipe junctions. They are covered by flat concrete lids which do not provide an opening for a rim and cover. See Table 7-7 for selection criteria for junction boxes. Designers should specify the most economical section (Bolded).
The use of junction boxes should be limited to areas where a catch basin or manhole
cannot effectively be used. Junction boxes should never be placed under a curb and gutter or in any location where a catch basin can be placed. Junction boxes should not be used under traffic lanes, because they do not allow the Maintenance Division access necessary for cleaning out clogged drainage pipes. The appropriate Design Manager must approve exceptions to this rule.
Junction Boxes shall be paid for under the following items numbers: Junction Box, Type 1 611-02.10 per each D-JBS-1 Junction Box, Type 2 611-02.11 per each D-JBS-2 Junction Box, Type 3 611-02.12 per each D-JBS-3 Junction Box, Type 4 611-02.13 per each D-JBS-4 Junction Box, Type 5 611-02.14 per each D-JBS-5 Round Junction Box 48” 611-02.41 per each D-CB-99RB Round Junction Box 60” 611-02.42 per each D-CB-99RB Round Junction Box 72” 611-02.43 per each D-CB-99RB Round Junction Box 84” 611-02.44 per each D-CB-99RB Round Junction Box 96” 611-02.45 per each D-CB-99RB Round Junction Box 108” 611-02.46 per each D-CB-99RB Round Junction Box 120” 611-02.47 per each D-CB-99RB

TDOT DESIGN DIVISION DRAINAGE MANUAL September 10, 2013
7-29
7.03.5.4.2 SPRING DRAIN BOXES
Spring drains are to be used when a natural spring or seep will be buried or otherwise affected by project grading. The spring box captures the flow of the spring through the opening in the bottom of the structure and pipes it to an outlet beyond the grading limits to a point in the natural flow path. See Table 7-7 for selection criteria for spring drain boxes. Designers should specify the most economical section (Bolded).
Spring Drain Boxes shall be paid for under the following items numbers: Spring Drain Box, Type 1 611-02.01 per each D-SDS-1 Spring Drain Box, Type 2A 611-02.02 per each D-SDS-2A Spring Drain Box, Type 2B 611-02.03 per each D-SDS-2B Spring Drain Box, Type 3A 611-02.04 per each D-SDS-3A Round Spring Drain Box 48” 611-02.31 per each D-CB-99RB Round Spring Drain Box 60” 611-02.32 per each D-CB-99RB
Junction Boxes
Entry and Exit Pipes at 180 degrees
Junction Boxes Entry and Exit Pipes at
90 degrees
Spring Drain Boxes
Largest Diameter of
Pipe
Square Round Square Round Square Round
18 NO 1 48” NO 1 48” NO 1 48” 24 NO 1 48” NO 1 60” NO 1 48” 30 NO 2 60” NO 2 72” NO 2 60” 36 NO 2 60” NO 2 84” NO 2 60” 42 NO 3 72” NO 3 96” X X 48 NO 3 72” NO 3 108” X X 54 NO 4 84” NO 4 120” X X 60 NO 4 84” NO 4 X X X 66 NO 4 96” NO 4 X X X 72 NO 5 108” NO 5 X X X 78 NO 5 120” NO 5 X X X
Table 7-7
Junction Box and Spring Drain Box Selection Criteria Notes:
1) The most economical structure is bolded. Designers should specify this structure on the plans.
2) For pipe orientations falling between the 180 and 90 degrees, the 90 degree tabulation provides a conservatively sized round structure, however designers may choose to size a round structure based on the minimum distance between pipes requirement shown on standard drawing D-CB-99R.
3) Designers shall footnote the junction box or spring drain box quantity: “AT THE ENGINEER’S DISCRETION, THE CONTRACTOR MAY SUBSTITUTE AN EQUIVALENT OR LARGER STRUCTURE PER TABLE 7-7 IN THE TDOT DRAINAGE MANUAL.”

TDOT DESIGN DIVISION DRAINAGE MANUAL September 10, 2013
7-30
7.03.5.5 PIPE CONNECTIONS TO STRUCTURES
The Standard Drawings provide details on the largest pipe that may be connected to a given catch basin, manhole or junction box as well as required cut-out sizes for pipes of a given diameter and material. The information has been included in the TDOT implementation of GEOPAK Drainage in order to ensure that the proposed pipe size will be compatible with the proposed structure.
In the case of a rectangular or square structure, the maximum sizes provided on the
Standard Drawings assume that the pipes will be connected perpendicular to the structure wall. When it is necessary to connect a pipe at an angle to the wall, the largest possible size will be smaller. The allowable pipe size should be determined based on the skewed width of the cut-out necessary for that pipe and the need to allow no less than 6 inches of interior wall space on either side of the cut-out. This extra wall space is necessary for the structural integrity of the concrete box.
For example, the largest concrete pipe allowed for a 62” by 62” catch basin is 48 inches
for a perpendicular connection. However, at a skew angle of 30°, the skewed width of the cutout for a 48-inch concrete pipe is approximately 70 inches, which is wider than the wall itself. The skewed width of the cut-out for a 36-inch pipe is approximately 54 inches, which is less than the 62-inch wall width. However, allowing an extra 6 inches on either side of the cut-out requires a total width of 66 inches. Thus, a 30-inch concrete pipe is the largest size which may be connected at a skew of 30°.
The maximum allowable skew for a pipe connection to a rectangular or square structure
is 45°. When designing pipe connections to a circular manhole or catch basin, the designer
should verify that the minimum separation distance between any two adjacent pipe cut-out holes is at least one half of the cut-out width for the smaller pipe, as illustrated in Figure 7-11. When possible, it is preferable to allow a separation width equal to one half of the cut-out hole of the larger pipe. This is necessary to insure the structural stability of the circular manhole.

TDOT DESIGN DIVISION DRAINAGE MANUAL September 10, 2013
7-31
When two pipes are connected to the structure at angles of 180° or 90°, the allowable sizes for these pipes should be as shown on the Standard Drawing for that particular structure. Where more than two pipes connect to a circular structure, or where the pipes are of different diameters, their connections should still be as shown in Figure 7-11. However, Tables 7A-6 through 7A-11 may be used in place of the standard drawings to verify whether the proposed connections will allow adequate separation distances.
The standard drawings and Tables 7A-6 through 7A-11 are based on the assumption
that the pipes connecting to a circular structure are all at roughly the same elevation. Where pipes enter the structure at differing elevations, their separation distances may be computed along a line connecting the centers of the cut-out holes. That is, the separation distances may be computed by accounting for both the vertical and the horizontal distances between the openings. A detailed procedure for this computation is provided in Section 7.04.7.
Figure 7-11 Multiple Pipe Connections to a Round Manhole

TDOT DESIGN DIVISION DRAINAGE MANUAL September 10, 2013
7-32
7.03.5.6 SPACING BETWEEN CATCH BASINS AND MANHOLES
The maximum allowable spacing between catch basins or manholes in a continuous storm sewer system is 400 feet. This represents the longest distance over which it is practical to provide cleanout or other maintenance to the storm sewer system. The TDOT implementation of GEOPAK Drainage contains a check to ensure that this criteria is not exceeded. 7.03.5.7 MANHOLES IN THE PAVEMENT AREA
Where a project requires the use of storm drain manholes, they should not be placed within any traffic lane. If it is necessary to place a manhole in a traffic lane, it should not be placed in the "wheel paths". Rather, it should be placed either at the mid-point of the traffic lane or on a line separating adjacent traffic lanes.
Utility manholes are not permitted in the shoulder or pavement areas according to the Department's Manual - Policies and Procedures for Accommodating Utilities Within Highway Rights-of-Way. If this is not practical, and a utility manhole must be placed in a traffic lane, it should not be placed in the "wheel paths" of that traffic lane. Instead, it should be placed either at the mid-point of the lane or on a line separating adjacent traffic lanes. 7.03.6 BRIDGE END DRAINS
The design and selection of bridge end drains is typically performed by the Structures Division. Thus, a detailed discussion of their hydraulic performance is not included in this chapter. The locations of all bridge end drains, pipes and outlets should be indicated on the proposed layout sheet before the submission of plans for Right-of-Way Plan Field Review. Flows intercepted by a bridge end drain are typically conveyed underground in an 18-inch corrugated metal, HDPE or PVC bridge drain pipe to the toe of the bridge embankment, where they are discharged onto a splash pad. The contractor may select either type of pipe for all bridge drains. Payment will be made under Item No. 610-07.03, 18-inch Pipe Drain (Bridge Drain) per linear foot. 7.03.7 DITCHES
Ditches are used along the roadside and in the median to convey runoff from the roadway to suitable receiving points. The cross section and permanent channel lining for a ditch should be designed according to the criteria presented in Section 5.04 of this Manual. 7.03.8 STORM SEWER OUTFALLS
All storm sewer systems should drain to an outlet with sufficient capacity to convey the design discharge. The outlet point may be a natural river or stream, an existing or proposed storm drainage system, or an existing or proposed drainage ditch or swale.
The criteria for the design of erosion protection for a storm sewer outfall are the same as
those presented in Section 6.04.3.3 for scour protection at culvert outfalls. The flow rate used to design the storm sewer system should also be used to design the outlet scour protection.

TDOT DESIGN DIVISION DRAINAGE MANUAL September 10, 2013
7-33
7.03.9 SHOWING STORM DRAINAGE FACILITIES ON PROJECT PLANS
As with other aspects of roadway design, the drainage design information shown on project plans should be sufficient for a contractor to both bid and build the project. The plans should show the horizontal alignments and elevations of all project drainage facilities as well as provide tabulations of quantities for these facilities. Drainage design is closely connected to many other aspects of the overall project design. Thus, the drainage design normally progresses in stages with the overall project design.
The purpose of this section is to describe how storm sewer facilities are to be shown on
the project plans. As such, this section is not a detailed guide for plan development and does not discuss information for other types of drainage facilities, such as culverts or side drains. Detailed plan development information can be found in the Design Guidelines. 7.03.9.1 STORM DRAIN INFORMATION AT VARIOUS STAGES OF PLAN DEVELOPMENT
The storm drainage information shown on the plans becomes progressively more complete as the design progresses through the various stages of plan development. The drainage information shown at each stage of plan development may be summarized as follows.
Preliminary Plans typically include little storm drainage design information. Cross drain
and special ditch locations are generally determined at this stage of plan development. This information is important to the subsequent design of the storm drainage system.
Right-of-Way Plans should provide a majority of the required storm drainage system
information, including the locations, sizes and elevations of the proposed pipes, catch basins and manholes. Right-of-way plans should additionally show the extent of longitudinal drains, curb and gutter sections, and any riprap which may be required at system outfalls. The designer should ensure that all components of the storm drainage system, including the catch basins and manholes, are plotted to scale in order to facilitate checking clearance between these structures and other features of the roadway project.
Construction Plans add quantity tabulations to the design information developed for the
right-of-way plans. Each catch basin, manhole and pipe outfall is assigned a code number which identifies it on the Proposed Layout Sheets and in the tables. 7.03.9.2 STORM DRAIN INFORMATION BY PLAN SHEET
Storm drain information is usually provided on a number of different sheets in the project plans. The main sheets on which this information should be included are described in this section.
The Index Sheets provide a table of all of the sheets in the plans along with a list of all
of the TDOT Standard Drawings which apply to structures shown in the plans. The list of standard drawings should include the drawing number, latest revision date and the title of each drawing and should be organized by category of standard drawing. One of the categories of drawings to be included is “Drainage – Catch Basins and Manholes.” The designer should ensure that the list includes both the standard structures as shown on the plans as well as any alternates for those standard structures (see Section 7.03.5.1 for more information).

TDOT DESIGN DIVISION DRAINAGE MANUAL September 10, 2013
7-34
The Estimated Roadway Quantities Sheet provides a tabulated summary of the total quantity of each type of material required for the project, organized by pay item. A number of items on this sheet pertain to the storm drainage system, including catch basins, manholes and materials such as concrete and structural steel for pipe endwalls. Storm sewer pipe may be itemized under pay item numbers for concrete pipe culvert.
The Tabulated Quantities Sheets provide specific details for several types of individual
structures in the project, including storm drainage pipes, catch basins, junction boxes, endwalls and manholes.
The storm drainage pipe quantities table should include:
• the sheet number on which the pipe is shown • code numbers for the structures at the upstream and downstream ends of the pipe • pipe invert elevations • length, size and shape of the pipe • percent grade of the pipe • quantity for pipe bedding material • quantity for any riprap which may be required at a pipe outfall
The tabulation should include a column for each type, shape and size of pipe shown on
the plans. In this way, the table would include a column for each pay item represented in the plans. The length of each individual pipe should be entered into the column which corresponds to its shape and size. The total of all pipe lengths entered into each column should be entered at the bottom of the tabulation providing a total quantity for each pipe pay item. Columns should also be provided for bedding and riprap so that quantities of these materials may be computed. It should be noted that when a cross drain is utilized as part of the storm sewer system, the quantity of pipe should be included on the storm sewer tabulation block.
The storm drainage catch basin quantities table should include:
• sheet number on which the structure is shown • code number of the structure • type and dimensions of the structure • location of the structure, expressed as line, station and offset • elevation of the structure casting or top and the depth of the structure • number of the applicable standard drawing
In addition to these items, the catch basin tabulation should include a number of
columns, each representing specific pay items for the structures shown on the plans. Examples would be “No. 12 catch basin, 3 to 6 feet,” “6 to 9 feet,” etc. For each structure in the tabulation, a 1 would be entered into the column corresponding to the pay item for that structure. The total of all the “1’s” entered in each column should then be shown at the bottom of the table to provide a total quantity for each catch basin pay item.
The storm drainage endwall and manhole quantities sheet should include:
• sheet number on which the structure is shown • code number of the structure

TDOT DESIGN DIVISION DRAINAGE MANUAL September 10, 2013
7-35
• location of the structure, expressed as line, station and offset • type of structure • number of the applicable standard drawing
If the structure is a manhole, the table should also include the casting or top elevation,
depth, and diameter of the structure. Individual columns should be provided for each manhole pay item represented in the plans, such as “3 to 6 feet,” etc. A “1” would be entered into the appropriate column for each individual manhole. If the structure is an endwall, columns should be provided for concrete, reinforcing steel and structural steel pay items. The quantities for each individual endwall would be entered into these columns. The total of the numbers entered into each pay item column should be provided at the bottom of the tabulation.
The Proposed Layout Sheets are usually divided into a plan view and a profile view of
the project. Storm drainage items shown in the plan view include:
• Catch basins and manholes: Each structure should be labeled with a structure code number, structure type, elevation of the casting or top, and the elevations of the pipe going into and out of the structure.
• Longitudinal drains: The upstream and downstream ends of each structure should be labeled with a structure code number. The drain should be labeled with structure type, flow line elevations, grate elevations (both ends), and an arrow showing the direction of flow. Slotted drains should be labeled with the pipe diameter and pipe outlet elevations.
• Storm drainage pipes: Each pipe should be labeled with its diameter or size and an arrow head showing the direction of flow. A pipe outfall should be labeled with a structure code number and the type of endwall to be used.
• Curb and gutter: This normally represented by two parallel lines labeled “curb & gutter.”
• Special ditches: Where special ditches are included, they should be labeled with the ditch shape and lining material, for example, “V Sod” or V Conc.”
• Riprap: Where riprap is placed at a pipe outfall, it should be represented as a hatched area and be labeled with the class of riprap required.
Storm drainage items shown in the profile view include:
• Catch basins and manholes: Each structure should be represented as a narrow
rectangle with its top and bottom at the elevations of the structure casting and invert, respectively. Each of these rectangles should be labeled with the structure number and type.
• Longitudinal drains: Trench drains and slope drains should be represented by a sloping line showing the flow line of the drain, along with vertical lines at the upstream and downstream ends of the drain. It should be labeled as trench drain. Both types of drain should be labeled with the grade of the flow line.
• Storm drainage pipes: Each pipe should be represented by showing lines for the flow line and crown elevations of the pipe, connected to the upstream and downstream catch basins. Between these two lines, the pipe should be labeled with its diameter. Where parallel runs of pipe are proposed on each side of the roadway, the profiles for each run may be plotted together.

TDOT DESIGN DIVISION DRAINAGE MANUAL September 10, 2013
7-36
• Special ditches: Where special ditches are included in a project, they should be shown as dashed lines at the proposed ditch flow line elevations. These lines should be labeled with the slope of the ditch in percent as well as with “LT” or “RT” to designate whether the ditch is on the left or right side of the roadway.
Examples of storm drainage structures represented on a typical Proposed Layout Sheet
and Profile Sheet are provided in Figures 7A-12, 7A-13 and 7A-14 of the Appendix. Figure 7A-12 shows a typical proposed layout sheet with the necessary information shown. Note that the pipe inverts shown at various structures reference the previous storm structure code [in brackets] from which the pipe originated. This is the preferred method for establishing which invert elevation is to be assigned to each pipe entering the structure. This method of identifying location and elevation of pipe inverts at a structure eliminates the need for designer or contractor to maintain correct spatial orientation. Figure 7A-13 shows the same storm sewer system with pipe invert locations at each structure identified by the compass direction (N, S, E, NE, etc…) of the pipe entering the structure. This method is an acceptable alternate to referencing the previous storm structure code.

TDOT DESIGN DIVISION DRAINAGE MANUAL September 10, 2013
7-37
SECTION 7.04 - DESIGN PROCEDURES
This section provides detailed procedures for the computations used in designing a stormwater drainage system. The design of a storm drainage system normally begins with some overall system planning to establish a generalized design framework. Once this has been accomplished, hydrologic computations may be performed and stormwater inlet locations determined. The design then proceeds to the sizing of the storm sewer pipes and the selection of manhole and catch basin types. The individual sections of this part of the Manual are arranged so that they follow this general progression. 7.04.1 SYSTEM PLANNING
The design of a storm drainage system is often a complex process which evolves as a project develops. The first step in this process is to gather the data necessary to support the design computations and to establish a project layout which will serve as a framework for the various detailed design components. System planning essentially bridges the gap between the initial problem definition and the detailed design of the system. 7.04.1.1 DATA REQUIREMENTS
The first step of designing a storm drainage system is to assemble background information and review the technical data required to perform the design. At a minimum, this should include the following information:
Project Survey Information: The designer should have access to the survey
information collected for the design of the proposed project. The project survey is an important source of reliable data for many of the items discussed in this section.
Off-Site Drainage Information: The designer should identify points at which runoff
from off-site areas will need to be accommodated by the proposed storm drainage system. Topographic mapping may serve in identifying watershed boundaries, existing drainage patterns, or other important drainage features. USGS quadrangle maps will normally be the principal source of this information. However, the designer should also check whether more detailed topographic mapping is available from local authorities.
Land use information will also be required for hydrologic analysis of off-site areas. TDOT
Aerial photography is often a useful resource for obtaining this information. The designer should also make a reasonable effort to account for expected future land uses as assessed in the Planning Stage of the project.
Soil types and their associated hydrologic soil groups are data components important to
the hydrologic analysis of off-site areas. This information may be obtained from the Geotechnical Engineering Section of the Materials and Test Division.
Existing Drainage Information: Information should be collected on any existing storm
drainage system in the project area. This should include size, shape, material, and invert information for all significant system components including pipes, drop inlets, catch basins, and manholes. When an existing storm drain will be utilized as the outlet for the proposed drainage system, the designer should secure sufficient information to determine how the existing downstream system will function under the new loading.

TDOT DESIGN DIVISION DRAINAGE MANUAL September 10, 2013
7-38
When the proposed system will drain to an open conveyance such as a ditch or stream, the designer should obtain information needed to determine the hydraulic performance of the conveyance. The characteristics of the outfall often have a significant influence on the design of the storm drainage system. Section 6.03.1 of this Manual contains detailed information on the type of data that may be collected.
Existing Utility Information: The possibility of conflicts with existing utilities is an
important issue to consider in the planning of the storm drainage system. Thus, as much information as possible, should be gathered on the horizontal and vertical locations of existing utilities in the project area. Utility information is normally obtained as a part of the survey for the roadway project.
Local Information: Local municipalities or county governments may have
comprehensive stormwater management plans for areas to be served by a proposed project. These stormwater management plans, as well as local floodplain or water quality ordinances, should be considered in the storm drainage design process. Although State agencies are usually not legally bound by local ordinances, voluntary compliance with these ordinances will help to insure that the proposed project will provide the greatest benefit to the community.
Federal and State Regulatory Requirements: The regulatory environment related to
drainage design is ever-changing and continues to grow in complexity. Although the designer should be familiar with the federal and state regulations which may impact the design of the proposed storm sewer system, specific guidance will usually be provided by the TDOT Environmental Planning Division.
Flood Elevations and Historical High Water Marks: Where a proposed storm sewer
system discharges to a large stream or river, the design of that system can be affected by high water events. Thus, flood elevations should be determined at each of the drainage outlet points for the project. Where available, this information may be obtained from the Hydraulics Section of the TDOT Structures Division. 7.04.1.2 PRELIMINARY LAYOUT
The preliminary layout should include all the basic components of the intended design, and provides the basic structure for the detailed design development. The general process for developing the preliminary layout is as follows:
Step 1: Locate Outlet Points: Outfall locations are a key component of the storm
drain system, and tend to define the layout more than any other component. While it may be possible to adjust the locations of other features of the system, outfalls are generally at fixed locations determined by the physical setting of the project. Important considerations in the identification of an appropriate system outfall include the following:
• hydraulic capacity of the downstream channel to convey flows from the outfall • flow characteristics of a receiving stream under flood conditions • soil types and erodibility in the area of the channel • possible impacts of flows from the drainage system on downstream land uses,
particularly where these flows must pass through a residential area • maintaining the existing drainage patterns and outfall locations as much as possible

TDOT DESIGN DIVISION DRAINAGE MANUAL September 10, 2013
7-39
Any outfall and its appurtenances must be maintained for the life of the system. Thus, it is important that all parts of the outfall be included within the right-of-way or on a drainage easement to allow access for maintenance purposes.
Step 2: Determine Flow Directions: Surface runoff flow directions will be determined
by the locations of the high and low points on the proposed profile grade and by the off-site topography. Flow directions for subsurface components of the system are more flexible. However, when trunk line flow directions must be established against surface grades, the designer should be careful to avoid the need for deep excavations.
Step 3: Accommodate Off-Site Drainage: The quantities of off-site flow and the
points at which they enter the project site are normally determined as a part of the data collection to support the design. The specific components of the system necessary to accommodate these flows should be determined at this point. In urban projects, small amounts of flow may be allowed to flow over the top of curbs onto the roadway; however, it is preferable to provide surface inlets outside of the curbs at points where these flows can concentrate. Flow may also be allowed to enter the project through side streets and driveways that slope toward the roadway. In rural areas, it may be possible to collect off-site flows in side ditches.
Step 4: Determine Trunk Line Locations: This step involves a general determination
of where drainage system trunk lines will be located. Primary consideration should be directed toward avoidance of utility conflicts and constructability, especially with regard to the maintenance of traffic plan. It may be helpful to consult with the appropriate TDOT regional construction and maintenance staff to determine the needs during construction. Some situations may require that separate twin trunk lines located behind the curbs on both sides of the roadway, with few cross laterals. Other instances may dictate a single trunk line which may or may not be located under pavement. Further, cross laterals on a large skew should be avoided, particularly near intersections.
Step 5: Determine Required Inlet Points: There are often a number of locations
where inlets will be necessary with little regard to contributing drainage area. These locations should be determined before computations to locate inlets on continuous grades take place. Inlets should be placed at the following locations:
• low points in the gutter grade • immediately upstream of median breaks, entrance/exit ramp gores, cross walks, and
street intersections • immediately upgrade of bridges to prevent pavement drainage from flowing onto
bridge decks (flows at the downstream ends of bridges will be accommodated by bridge end drains)
• immediately upstream of superelevation transitions • on side streets immediately up grade from intersections
7.04.2 HYDROLOGY
Chapter 4 of this Manual presents detailed guidelines and procedures for computing design flow rates. Although the procedures presented in that chapter are general in nature, they may be easily applied to determining discharges for roadway drainage design. This section discusses a few adjustments to these general methods which are specific to storm drainage design.

TDOT DESIGN DIVISION DRAINAGE MANUAL September 10, 2013
7-40
Flows from the roadway should be computed using the Rational Method because it is the most suitable method for the relatively small drainage areas involved. It also lends itself to the design computations for many drainage system components. Section 4.04.1 of this Manual describes this method and provides all of the background information and procedures needed to apply it. Rational Method example problems are included in Section 4.06.2.
When applying the Rational Method to roadway runoff, the following considerations will
apply:
• The time of concentration for flows to a specific inlet is also called the inlet time. • The minimum time of concentration for any runoff should be 5 minutes. Thus, the
greatest possible rainfall intensity will correspond to the 5-minute duration, even when the computed time of concentration is less.
• In the majority of situations, the flow time from the high point of the roadway to the first inlet on a continuous slope will be less than 5 minutes. Thus, the time of concentration should be computed only where it appears that flow time may be unusually long.
• The flow time used to determine the discharge at an inlet on a continuous slope should be the flow time from the next inlet upstream, not from the high point of the profile grade. The flow time between inlets will nearly always be less than 5 minutes. Thus, inlet location design will typically be based on the 5-minute rainfall intensity.
• Where it is necessary to compute the time of concentration, the designer should consider flow from the crown of the roadway to the gutter as sheet flow. Flows in the gutter may be computed based on channel flow. Section 7.04.3 presents detailed methods for analyzing flows in gutters.
Additionally, the Rational Method should be used to determine off-site discharge flowing
to the project site. When an inlet receives flow from two or more drainage areas with different times of concentration, the designer should use the longest computed time of concentration to determine the rainfall intensity. This rainfall intensity will then be applied to the sum of the drainage areas to determine the discharge. 7.04.3 GUTTER FLOW COMPUTATIONS
The analysis of flow in gutters is closely related to the computation of inlet interception. Detailed development of both the theory and computation of gutter flow are contained in the FHWA publication HEC-12. This section provides methods for applying the HEC-12 procedures to TDOT roadway projects.
The spread, depth and velocity of flows on the roadway cross section are all important
factors in the location of inlets on a continuous slope. These factors are determined through hydraulic analysis of gutter flows. The designer is usually concerned with one of two questions related to gutter flows. The first is to find the spread on the roadway given the discharge and the second is to find the discharge given the spread.
Gutter flow is a special condition of open channel flow and may be analyzed with
Manning’s Equation, which is described in Section 5.03.2.4 of this Manual. For the purposes of gutter flow analysis, it is convenient to write Manning’s Equation as:
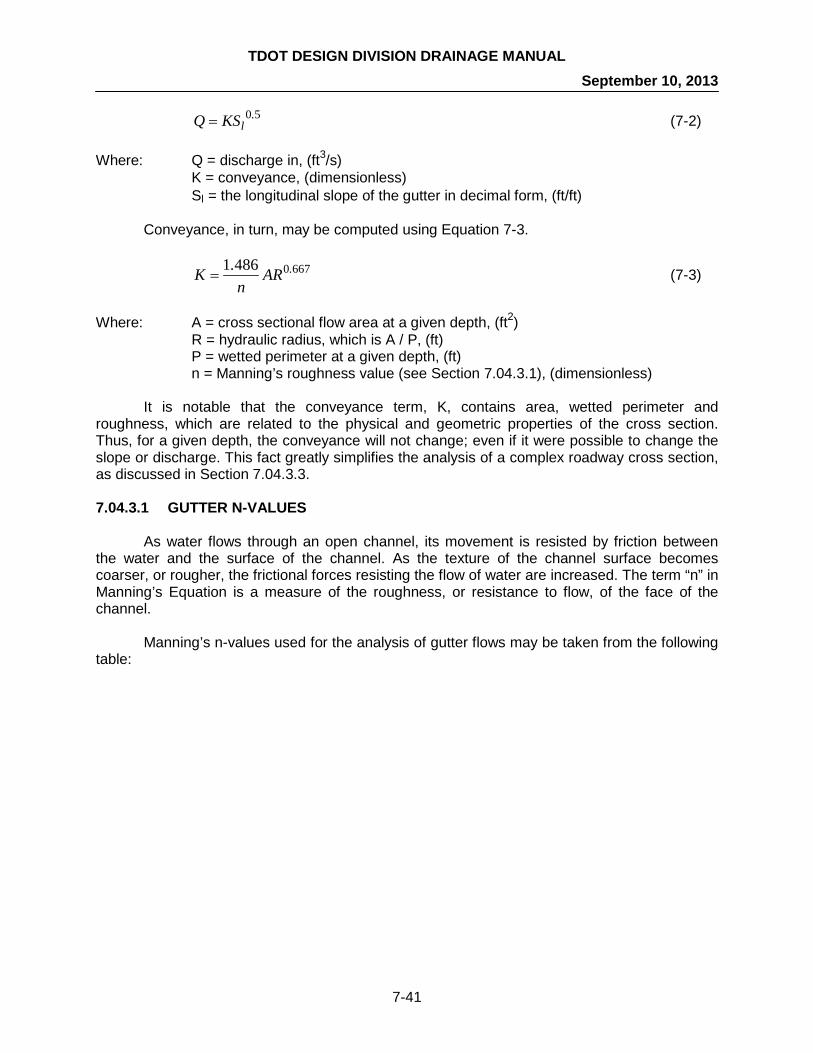
TDOT DESIGN DIVISION DRAINAGE MANUAL September 10, 2013
7-41
50.lKSQ = (7-2)
Where: Q = discharge in, (ft3/s)
K = conveyance, (dimensionless) Sl = the longitudinal slope of the gutter in decimal form, (ft/ft)
Conveyance, in turn, may be computed using Equation 7-3.
66704861 .ARn
.K = (7-3)
Where: A = cross sectional flow area at a given depth, (ft2)
R = hydraulic radius, which is A / P, (ft) P = wetted perimeter at a given depth, (ft) n = Manning’s roughness value (see Section 7.04.3.1), (dimensionless)
It is notable that the conveyance term, K, contains area, wetted perimeter and
roughness, which are related to the physical and geometric properties of the cross section. Thus, for a given depth, the conveyance will not change; even if it were possible to change the slope or discharge. This fact greatly simplifies the analysis of a complex roadway cross section, as discussed in Section 7.04.3.3. 7.04.3.1 GUTTER N-VALUES
As water flows through an open channel, its movement is resisted by friction between the water and the surface of the channel. As the texture of the channel surface becomes coarser, or rougher, the frictional forces resisting the flow of water are increased. The term “n” in Manning’s Equation is a measure of the roughness, or resistance to flow, of the face of the channel.
Manning’s n-values used for the analysis of gutter flows may be taken from the following
table:

TDOT DESIGN DIVISION DRAINAGE MANUAL September 10, 2013
7-42
Manning’s n-Values for Street and Gutter Pavements Pavement or Gutter Type Manning’s n
Concrete Gutter with Troweled Finish 0.012 Asphalt Pavement: Smooth Texture 0.013 Rough Texture 0.016 Concrete Gutter with Asphalt Pavement: Smooth Texture 0.013 Rough Texture 0.015 Concrete Pavement: Float Finish 0.014 Broom Finish 0.016
For gutters with small slope where sediment may accumulate, increase the above values of ‘n’ by 0.02
Table 7-8 Manning’s n-Values for Street and Gutter Pavements
Reference: USDOT, FHWA, HDS-3 (1961)
7.04.3.2 UNIFORM CROSS SLOPE PROCEDURE
The simplest case of gutter flow is where the gutter and the pavement have the same cross slope as may be the case with detached curbs or median barrier. Discharge or spread may be computed directly from a modified form of Manning’s Equation. This modification of Manning’s Equation is used because the hydraulic radius in the equation does not adequately describe the gutter cross section, particularly where the spread of the water surface may be more than 40 times the depth at the curb. To compute gutter flow, Manning’s Equation is integrated for an increment of width across the section. The resulting equation, in terms of cross slope and spread on the pavement is:
5066726671560 .l
..x STS
n.Q = (7-4)
Where: Q = flow rate, (ft3/s)
T = spread (or top width) of flow, (ft) Sx = cross slope in decimal form, (ft/ft) Sl = longitudinal slope in decimal form, (ft/ft)
This equation neglects the resistance of the curb face. This resistance is negligible from
a practical point of view if the cross slope is 10 percent or less. To solve for discharge, the designer would simply enter the value of spread into the
equation. If the flow rate is given, the equation may be rearranged to:

TDOT DESIGN DIVISION DRAINAGE MANUAL September 10, 2013
7-43
( )
( )375.0
5.0667.156.0
=
lx SSQnT (7-5)
Figure 7-12 Uniform Cross Slope
Reference: VDOT Drainage Manual (2002)
7.04.3.3 COMPOUND CROSS SLOPE PROCEDURE
A compound gutter is one in which the cross slope of the gutter varies from the cross slope of the adjacent pavement. Gutter sections depicted in the TDOT Standard Drawings have cross slopes of either 8.5% or 8.3% and a gutter width of 24 inches. Travel lanes adjacent to the gutter would have a cross slope of 2%, forming a two-part compound cross section. Many typical sections also include a shoulder with a cross slope of 4%, which presents the designer with a three-part compound section.
Tables 7A-1 through 7A-5 should serve to simplify the process of analyzing gutter flows.
These tables illustrate a number of compound gutter cross sections and provide a relationship between the conveyance of the cross section and the spread of flow for a number of standard gutter cross sections. (A gutter cross slope of 8.5% was used in the development of these tables. However, the error introduced by applying them to a gutter slope of 8.3% is negligible.) Since conveyance is a function only of the gutter shape and roughness, the designer needs only to know the longitudinal slope to solve for discharge. These tables have been developed by determining the flow area and wetted perimeter for increasing depths of flow and then computing the resulting conveyance. The conveyance values in these tables assume a Manning’s n-value of 0.013. The designer should adjust the values from the tables for cross sections which have a different roughness.
For a given spread, the discharge would be determined by the following procedure: Step 1: Select the table which corresponds to the cross section being analyzed and
pick the conveyance value which corresponds to the given spread. Data may be interpolated as necessary.

TDOT DESIGN DIVISION DRAINAGE MANUAL September 10, 2013
7-44
Step 2: Compute the actual conveyance for the cross section as:
act
t nKK 013.0
= (7-6)
Where: K = actual cross section conveyance, (dimensionless)
Kt = conveyance value as determined from the table, (dimensionless) nact = actual n-value for the gutter section, (dimensionless)
Step 3: Compute the discharge from Equation 7-2.
To determine the spread that would result from a given discharge, the process would be
reversed as follows: Step 1: Compute the cross sectional conveyance by rearranging Manning’s Equation
as:
50.lSQK = (7-7)
Where: Q = discharge, (ft3/s)
Sl = longitudinal slope of the gutter in decimal form, (ft/ft)
Step 2: Compute the corresponding table value of conveyance as:
0130.
nKK act
t = (7-8)
Where: K = actual cross section conveyance, (dimensionless)
Kt = conveyance value as determined from the table, (dimensionless) nact = actual n-value for the gutter section, (dimensionless)
Step 3: Select the table which corresponds to the cross section being analyzed and
pick the spread value which corresponds to the computed conveyance. Data may be interpolated as necessary.
When confronted with a roadway cross section that is not included in Tables 7A-1 through 7A-5, the designer may construct a similar table based upon the geometric properties of that cross section. 7.04.4 INLET COMPUTATIONS
The analysis of inlet performance covers three basic design problems:
• determining the interception of gutter inlets on a continuous slope • the spacing of gutter inlets on a slope to insure that the allowable spread requirement
is met

TDOT DESIGN DIVISION DRAINAGE MANUAL September 10, 2013
7-45
• the determination of the ponding depth which will occur at an inlet in a sag
This section is organized to discuss each of these procedures. A discussion of the hydraulics and design criteria for various inlet types is contained in
Section 7.03.3. The designer should be familiar with the information before undertaking any of the procedures outlined in this section. 7.04.4.1 GUTTER INLET INTERCEPTION ON A CONTINUOUS SLOPE
The computation of inlet interception for a gutter inlet involves three general steps: the analysis of the gutter flow at the inlet point, dividing the total discharge into frontal and side flow, and determining the portion of each of the two flows that will be intercepted by the grate. The analysis of gutter flow is discussed in Section 7.04.3 and the following two sections provide procedures for determining frontal flow and for computing the total flow intercepted by a grate.
The equations used in this process include a large number of variables. For the sake of
clarity, these variables are listed and defined here: Q = total discharge in the gutter section at the inlet, (ft3/s) Qf = frontal flow, the portion of the total flow in the gutter section directly in front of the
grate, (ft3/s) Qs = side flow, the portion of the total flow that passes along beside the grate, (ft3/s) Qi = total flow intercepted by the inlet, (ft3/s) Qfi = portion of the frontal flow that is intercepted by the inlet, (ft3/s) Rf = ratio of frontal flow intercepted to frontal flow, (Qfi / Qf ) Qsi = portion of the side flow that is intercepted by the inlet, (ft3/s) Rs = ratio of side flow intercepted to side flow, (Qsi / Qs) Qb = bypass flow, the portion of the total flow that is not intercepted by the inlet, (ft3/s) Vo = splash-over velocity, (ft/s) Vf = average velocity of frontal flow, (ft/s) Vs = average velocity of side flow, (ft/s)
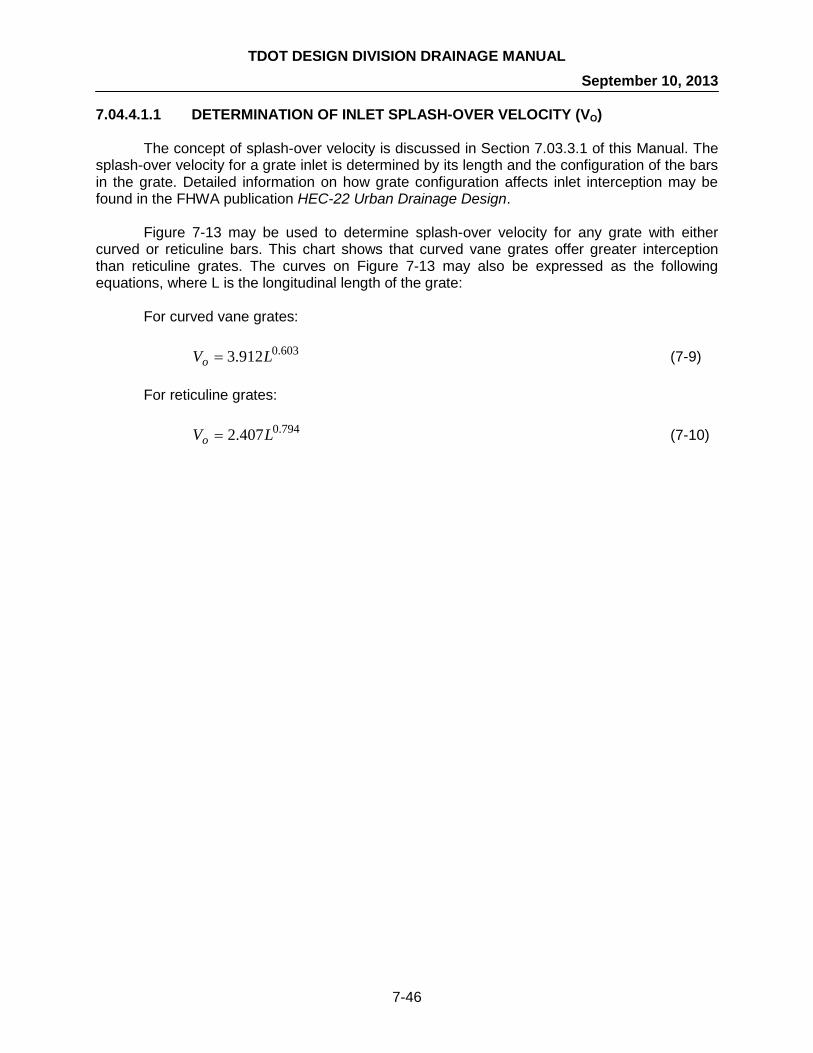
TDOT DESIGN DIVISION DRAINAGE MANUAL September 10, 2013
7-46
7.04.4.1.1 DETERMINATION OF INLET SPLASH-OVER VELOCITY (VO)
The concept of splash-over velocity is discussed in Section 7.03.3.1 of this Manual. The splash-over velocity for a grate inlet is determined by its length and the configuration of the bars in the grate. Detailed information on how grate configuration affects inlet interception may be found in the FHWA publication HEC-22 Urban Drainage Design.
Figure 7-13 may be used to determine splash-over velocity for any grate with either
curved or reticuline bars. This chart shows that curved vane grates offer greater interception than reticuline grates. The curves on Figure 7-13 may also be expressed as the following equations, where L is the longitudinal length of the grate:
For curved vane grates: 603.0912.3 LVo = (7-9)
For reticuline grates: 794.0407.2 LVo = (7-10)

TDOT DESIGN DIVISION DRAINAGE MANUAL September 10, 2013
7-47
Figure 7-13 Grate Inlet Splash-over Velocity
Reference: USDOT, FHWA, HEC-12 (1984)
Although these equations were developed for grates up to 4.5 feet long, they may be applied with some confidence to longer grates.
The TDOT Standard Drawings provide details on the grates to be specified at all gutter inlets. Catch basin types 10, 12, 13, 25 and 28 use a single grate which has a length of three feet. The splash over velocity for this grate is 7.6 fps. Catch basin Types 14, 16, 17, 26, 27, 29 and 31 use two grates and provide an effective grate length of 6 feet. When these catch basins are used on a continuous grade, they should offer a splash-over velocity of 11.5 fps. 7.04.4.1.2 DETERMINATION OF INLET FRONTAL FLOW
As stated above, one of the important problems in computing the interception of a gutter inlet is determining the frontal flow. The portion of the total flow contained in the area in front of the grate is affected by the width of the grate, configuration of the roadway cross section, and the spread. Clearly, the portion of flow that is frontal flow increases as the width of the grate increases.

TDOT DESIGN DIVISION DRAINAGE MANUAL September 10, 2013
7-48
The procedure for determining frontal flow is based on dividing the conveyance of the flow in front of the grate by the total conveyance of the gutter flow. Once the depth of flow in the gutter has been determined, it is a simple matter to compute a conveyance value for the area in front of the grate by determining the area and wetted perimeter of that subsection. However, this method is complicated by the fact that conveyance is a non-linear function because part of the computation is the hydraulic radius to the two-thirds power.
Because of this non-linearity in the computation of conveyance, it is necessary to apply
an adjustment to the conveyance computed for the section just in front of the inlet grate. Otherwise, the quantity of frontal flow would be over-estimated. The value of this adjustment factor is a function of the configuration of roadway cross section, and ranges from approximately 0.8 to 0.9. As a practical matter, the error introduced by applying an average adjustment of 0.85 to all roadway cross sections will be sufficiently small that it may be considered insignificant.
Thus, frontal flow, Qf, may be determined by the following procedure: Step 1: Determine the depth and conveyance of the total flow in the gutter cross section
using the procedures provided in Section 7.04.3.3. Step 2: Compute the area of the flow in front of the grate as:
2
2 gf
wSywA
−= (7-11)
Where: w = width of the grate, (ft)
y = depth at the curb, (ft) Sg = the cross slope of the gutter, (decimal)
Step 3: Compute the wetted perimeter in front of the grate as:
wyPf += (7-12)
Although this method does not account for the cross slope of the gutter section, the error introduced by using this equation is insignificant.
Step 4: Compute the conveyance of the subsection in front of the grate as:
n
PA
A
K f
ff
u
667.0
486.1
= (7-13)
Where: Ku = unadjusted conveyance of the section in front of the grate
n = Manning’s n-value
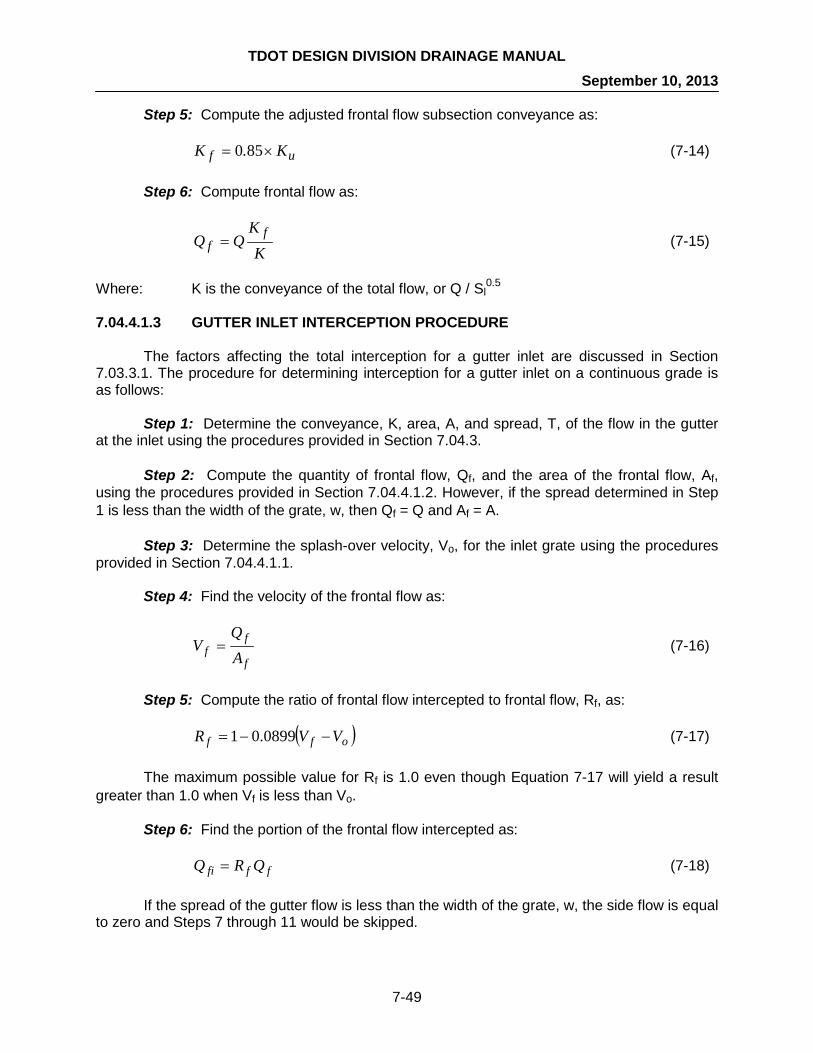
TDOT DESIGN DIVISION DRAINAGE MANUAL September 10, 2013
7-49
Step 5: Compute the adjusted frontal flow subsection conveyance as: uf K.K ×= 850 (7-14)
Step 6: Compute frontal flow as:
K
KQQ f
f = (7-15)
Where: K is the conveyance of the total flow, or Q / Sl
0.5 7.04.4.1.3 GUTTER INLET INTERCEPTION PROCEDURE
The factors affecting the total interception for a gutter inlet are discussed in Section 7.03.3.1. The procedure for determining interception for a gutter inlet on a continuous grade is as follows:
Step 1: Determine the conveyance, K, area, A, and spread, T, of the flow in the gutter
at the inlet using the procedures provided in Section 7.04.3. Step 2: Compute the quantity of frontal flow, Qf, and the area of the frontal flow, Af,
using the procedures provided in Section 7.04.4.1.2. However, if the spread determined in Step 1 is less than the width of the grate, w, then Qf = Q and Af = A.
Step 3: Determine the splash-over velocity, Vo, for the inlet grate using the procedures
provided in Section 7.04.4.1.1. Step 4: Find the velocity of the frontal flow as:
f
ff A
QV = (7-16)
Step 5: Compute the ratio of frontal flow intercepted to frontal flow, Rf, as:
( )off VVR −−= 0899.01 (7-17)
The maximum possible value for Rf is 1.0 even though Equation 7-17 will yield a result greater than 1.0 when Vf is less than Vo.
Step 6: Find the portion of the frontal flow intercepted as: fffi QRQ = (7-18)
If the spread of the gutter flow is less than the width of the grate, w, the side flow is equal to zero and Steps 7 through 11 would be skipped.

TDOT DESIGN DIVISION DRAINAGE MANUAL September 10, 2013
7-50
Step 7: Compute side flow, Qs, as:
fs QQQ −= (7-19)
Step 8: Compute the area of the side flow, As, as:
fs AAA −= (7-20)
Step 9: Compute the velocity of the side flow, Vs, as:
s
ss A
QV = (7-21)
Step 10: Compute the ratio of side flow intercepted to side flow, Rs, as:
3.2
5.115.01
1
LSV
R
x
ss
+
= (7-22)
Where: L = longitudinal length of the grate, (ft)
Sx = cross slope of the pavement next to the grate, decimal
When the width of the grate is significantly less than the width of the gutter, Sx will be equal to the cross slope of the gutter section. Otherwise, it will be equal to the cross slope of the adjacent shoulder or travel lane. Note that Rs will be equal to 1.0 only when Vs equals zero.
Step 11: The portion of side flow intercepted may be computed as: sssi QRQ = (7-23)
Step 12: The total interception by the grate, Qi, will be the sum of the portions of the frontal and side flows intercepted: sifii QQQ += (7-24)
Step 13: Finally, the bypass flow, Qb, is computed as: ib QQQ −= (7-25)

TDOT DESIGN DIVISION DRAINAGE MANUAL September 10, 2013
7-51
7.04.4.2 INLET SPACING ON A CONTINUOUS SLOPE
As described in Section 7.03.3.1.1, the process of determining locations for inlets on a continuous slope is based on the allowable spread (or top width) of the gutter flow, up to a maximum spacing of 400 feet. Before undertaking this procedure, the designer should identify all points where off-site flow may enter or leave the project. In addition, the plan and profile of the roadway should be clearly established. The preliminary drainage system layout should also be completed as described in Section 7.04.1.2.
As noted in Section 7.04.1.2, Step 5, there are often a number of locations on a project
where an inlet will be required regardless of the spread of water on the roadway. The procedure provided below does not specifically accommodate these required inlet locations. Thus, the designer should use sound engineering judgment when applying this procedure. For example, the computations based solely on spread may indicate that an inlet would be placed only a few feet from a required inlet location. The designer should consider adjusting the locations of the inlets upstream of the required inlet to provide a more evenly spaced system of inlets.
The following procedure begins at a high point in the profile grade and proceeds down
slope to the sag point. Note that finding the distance to the first inlet is different from finding the distance to the other inlets, in that flow to the first inlet does not include upstream bypass flow. The determination of the inlet location is an iterative process in which the proposed inlet location is adjusted until the spread of flow on the roadway is just less than the allowable spread.
A worksheet for inlet spacing computations is provided in the Appendix along with an example problem.
Step 1: Determine the maximum allowable spread of water on the roadway based on the criteria provided in Section 7.03.3.
Step 2: Select a trial location for the inlet and determine the drainage area, runoff coefficient and time of concentration for roadway runoff and for any off-site areas that may drain onto the site.
The roadway drainage area may be computed as:
560,43
xrr
WLA = (7-26)
Where: Ar = the roadway drainage area, (acres)
Lr = the longitudinal roadway length from the next upstream inlet, (ft) (where the inlet is the most upstream on the slope, Lr would be the distance from the high point of the profile)
Wx = the average width of roadway contributing runoff, usually measured from the crown to the edge of the curb, (ft)
The runoff coefficient to apply to the roadway may be determined based on the criteria in
Section 4.04.1.1. Normally, it will be sufficient to assume a time of concentration of 5 minutes for roadway runoff. However, where it appears that flow time may be greater than 5 minutes, the designer may compute the time of concentration using the criteria presented in Section 4.04.1.3.

TDOT DESIGN DIVISION DRAINAGE MANUAL September 10, 2013
7-52
Procedures for determining the data needed to compute off-site flow may also be found in Chapter 4 of this Manual.
Step 3: Compute the discharge at the inlet as: ( ) s/uoorr QiACACQ ++= (7-27) Where: Q = discharge at the inlet, (ft3/s)
Cr = runoff coefficient for the roadway, (dimensionless) Ar = roadway area draining to the inlet, (acres) Co = runoff coefficient for any off-site areas that may drain to the inlet,
(dimensionless) Ao = drainage area of any off-site areas that may drain to the inlet, (acres) i = rainfall intensity, (in/hr) Qu/s = discharge, (ft3/s), for any flows that may reach the inlet from on-site areas
outside of Ar. This will usually be flow that may bypass the previous upstream inlet.
Where off-site flows are present, times of concentration should be determined for both
the on-site and the off-site flows. The rainfall intensity, i, should then be based on the greater of the two times of concentration. For example, if the assumed time of concentration for the roadway is 5 minutes and the flow time for the off-site area is 7 minutes, the rainfall intensity would be based on a tc of 7 minutes. Note, however, that the longer flow time is not carried through to the next inlet on the slope. If no other off-site areas enter the system between the two inlets, the discharge at the next inlet would be computed using a rainfall intensity determined from the assumed roadway tc of 5 minutes. Although the bypass flow from the first inlet would be based on a different rainfall intensity than that used to locate the next inlet, the error introduced by this discrepancy should be sufficiently small that it may be ignored.
Step 4: Compute the spread of flow on the roadway at the inlet using the appropriate
procedure from either Section 7.04.3.2 or Section 7.04.3.3. If the computed spread is greater than the allowable spread, the proposed inlet location
should be moved an appropriate distance upstream. On the other hand, if the computed spread is significantly less than the allowable, the proposed inlet may be moved further downstream. Once a new trial inlet location has been determined, the process will return to Step 2. In this way, the proposed inlet location will be adjusted until the computed slope is equal to, or just less than the allowable spread.
Step 5: Compute inlet interception, Qi, and bypass, Qb, using the procedures provided
in Section 7.04.4.1.3. Step 6: Repeat Steps 2 through 5 for successive inlets until the bottom of the slope is
reached.

TDOT DESIGN DIVISION DRAINAGE MANUAL September 10, 2013
7-53
7.04.4.3 INLET PERFORMANCE AT SAG POINTS
Sag points in a storm drainage system can occur in curb and gutter profiles as well as in median or side ditch profiles. Although there are important differences between the two types of situations, they are similar in that water may approach the inlet from two or more sides and all of the flow that comes to a sag point must be collected by the inlet; that is, bypass flows do not occur. In addition, the same basic methods are used to compute the hydraulic performance of both types of grates.
As described in the TDOT Standard Drawings, the Type 14, 16, 17, 26 27, and 29 inlets
are recommended for use at gutter sag points. The performance of these inlets at a sag point differs from that of inlets on grade in that the spread of water on the roadway is determined by the depth of ponding at the inlet, rather than by the depth of flow in gutter. The hydraulics of gutter inlets under sump conditions is discussed in Section 7.03.3.2. When an inlet operates as a weir, water does not spread across the grate because of low head conditions. Thus, a gutter inlet will receive water from only the two ends and the outer faces of the grates. The portion of the grates adjacent to the curb should not be used in computing the effective weir length of the inlet. When the flow rate becomes sufficiently great that the inlet becomes covered with water, inflow will be governed by orifice flow, as determined by the area of the openings in the grate. The recommended clogging factor for these inlets is zero because the curb iron is expected to provide backup for the grate, should it become clogged.
Area drains include the Type 38, 39, 40, 42, 43, and 44 inlets. Because these inlets are
usually found in medians or side ditches, it is likely that water would be able to surround them, even for moderate flow rates. Thus, all four sides of each grate may be used in determining the effective length for weir computations. Because ditch flows commonly carry significant amounts of floating debris, the recommended clogging factor for these inlets is 50%. Figures 7A-6 and 7A-7 in the Appendix provide curves which may be used to evaluate the performance of area drains. Another procedure for evaluating the performance of these inlets is provided later in this section.
Table 7-8 provides effective weir lengths and opening areas that may be used in
computing the performance of both gutter inlets and area drains. Based on sound engineering judgment, the designer may adjust the clogging factors recommended in the table, depending on the actual conditions where an inlet will be applied.
The following procedure may be used for both gutter inlets and area drains in sump conditions:
Step 1: Determine the flow rate at the sag point based on bypass from any upstream
inlets, off-site flows entering the project, and roadway area not draining to other curb inlets.

TDOT DESIGN DIVISION DRAINAGE MANUAL September 10, 2013
7-54
Step 2: Determine the effective weir length, Leff, for the proposed catch basin as: ( )PFLLeff −= 1 (7-28) Where: Leff = weir length not blocked by debris, (ft)
L = effective perimeter length for the proposed catch basin as determined from Table 7-8, (ft)
PF = plugging factor, converted to decimal form
Catch Basin Type Effective Perimeter (feet) Opening Area (sf)
Recommended Clogging Factor
(%) 14, 16, 17, 26, 27, 29 8.7* 4.4 0
38 10.9 4.6 50 39 16.2 8.8 50 40 24.2 16.7 50 42 7.6 3.6 50 43 15.2 7.2 50 44 30.3 14.4 50
* Includes two sides and the front of the grate.
Table 7-9 Effective Perimeter Lengths and Opening Areas for Standard TDOT Inlets
Step 3: Determine the depth of ponding (or head) for weir flow, hw, as:
667.0
6.2
=
effw L
Qh (7-29)
Where: hw = depth of ponding at the inlet, (ft)
Q = total inflow at the inlet, (ft3/s)
Step 4: Determine the effective opening area, Aeff, for the proposed catch basin as: ( )PFAAeff −= 1 (7-30) Where: Aeff = opening area not blocked by debris, (ft2)
A = opening area for the proposed catch basin as determined from Table 7-8, (ft2)
PF = plugging factor, converted to decimal form
TDOT DESIGN DIVISION DRAINAGE MANUAL September 10, 2013
7-55
Step 5: Determine the depth of ponding (or head) for orifice flow, ho, as:
2
81.4
=
AQho (7-31)
Where: ho = depth of ponding at the inlet, (ft) Q = total inflow at the inlet, (ft3/s)
Step 6: The depth of ponding at the inlet, h, will be the greater of ho and hw. Step 7: For gutter inlets, the spread on the roadway must be determined. For any road
cross section covered by the Tables 7A-1 through 7A-5 in the Appendix, the designer may read the spread which corresponds to the computed depth of ponding, h, at the inlet. If the spread is greater than allowable, it may be necessary to place additional inlets on either side of the sag point, or make other adjustments to the inlet spacing.
Step 8: Finally, inlets flanking the sag point should be added to the system as specified
in Section 7.03.3. Because these inlets function to maintain the allowable spread when the primary sag inlet is clogged, they should not be included in the inlet spacing analysis. When carrying out Step 7 of this procedure, there may be a temptation to include the interception capacity of these flanking inlets to compensate for a greater than allowable spread at the sag. However, it is preferable to add additional inlets instead, to hold the function of the flanking inlets in reserve. As described in Section 7.04.1, the designer should consider the use of longitudinal trench drains in place of flanking inlets where the vertical curve constant, K, is greater than 125. 7.04.5 PIPE CAPACITY COMPUTATIONS FOR GRAVITY FLOW
As described in Section 7.03.4.2, storm sewer pipe sizes should have sufficient capacity to convey the 10-year discharge as gravity flow. Stated another way, the capacity of the proposed pipe at full flow must be greater than the design discharge. Thus, the computations for pipe capacity may be grouped into two general categories: 1) computations to determine the design discharge and, 2) computations to determine the capacity of the pipe. This section provides procedures for both sets of computations. 7.04.5.1 MANNING’S N-VALUES FOR PIPE MATERIALS
Pipe flow capacity will be computed by means of Manning’s Equation. As water flows through a given pipe, its movement is resisted by friction between the water and the inside face of the pipe. The term “n” in Manning’s Equation is a measure of the resistance to flow imposed by the pipe wall. The extent of this resistance is a function of texture of the wall surface, the inside shape of the wall, and turbulence at joints between sections of pipe.
In general, only reinforced concrete pipe will be used in storm drains for TDOT projects.
However, it is possible that other types of pipe may be used for local roads or in other specialized situations. The following table provides Manning’s n-values used for design of various possible pipe materials:
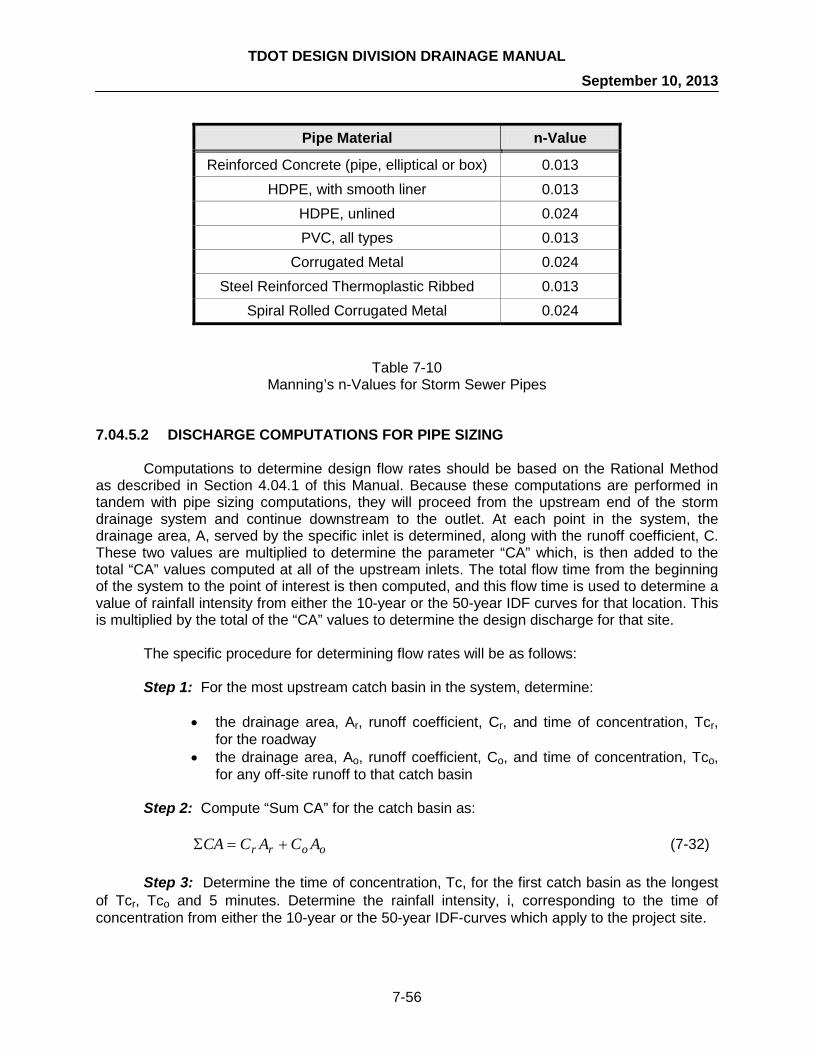
TDOT DESIGN DIVISION DRAINAGE MANUAL September 10, 2013
7-56
Pipe Material n-Value
Reinforced Concrete (pipe, elliptical or box) 0.013 HDPE, with smooth liner 0.013
HDPE, unlined 0.024 PVC, all types 0.013
Corrugated Metal 0.024 Steel Reinforced Thermoplastic Ribbed 0.013
Spiral Rolled Corrugated Metal 0.024
Table 7-10
Manning’s n-Values for Storm Sewer Pipes 7.04.5.2 DISCHARGE COMPUTATIONS FOR PIPE SIZING
Computations to determine design flow rates should be based on the Rational Method as described in Section 4.04.1 of this Manual. Because these computations are performed in tandem with pipe sizing computations, they will proceed from the upstream end of the storm drainage system and continue downstream to the outlet. At each point in the system, the drainage area, A, served by the specific inlet is determined, along with the runoff coefficient, C. These two values are multiplied to determine the parameter “CA” which, is then added to the total “CA” values computed at all of the upstream inlets. The total flow time from the beginning of the system to the point of interest is then computed, and this flow time is used to determine a value of rainfall intensity from either the 10-year or the 50-year IDF curves for that location. This is multiplied by the total of the “CA” values to determine the design discharge for that site.
The specific procedure for determining flow rates will be as follows: Step 1: For the most upstream catch basin in the system, determine:
• the drainage area, Ar, runoff coefficient, Cr, and time of concentration, Tcr,
for the roadway • the drainage area, Ao, runoff coefficient, Co, and time of concentration, Tco,
for any off-site runoff to that catch basin
Step 2: Compute “Sum CA” for the catch basin as: oorr ACACCA +=Σ (7-32)
Step 3: Determine the time of concentration, Tc, for the first catch basin as the longest
of Tcr, Tco and 5 minutes. Determine the rainfall intensity, i, corresponding to the time of concentration from either the 10-year or the 50-year IDF-curves which apply to the project site.

TDOT DESIGN DIVISION DRAINAGE MANUAL September 10, 2013
7-57
Step 4: Determine the design flow rate as: ( )iCAQ Σ= (7-33)
Step 5: For each subsequent catch basin, determine the drainage area, runoff coefficient and time of concentration for the roadway, and any additional off-site areas draining to that catch basin. Compute: ( ) oorr ACACCAUpstreamCA ++Σ=Σ (7-34) Where: Cr , Ar , Co and Ao are as defined in Step 1.
Step 6: The time of concentration for the system is not necessarily equal to the inlet time. Thus, determine the time of concentration, Tc, for the catch basin as the longest of:
• time of concentration for roadway flows to the inlet, Tcr • time of concentration for off-site flows to the inlet, Tco • [Upstream Tc] + upstream pipe travel time as determined from the pipe
capacity computations
Step 7: Determine the rainfall intensity, i, corresponding to the time of concentration from the IDF-curve which applies to the project site.
Step 8: Determine the design flow rate using Equation 7-33: ( )iCAQ Σ=
Step 9: Repeat Steps 5 through 8 for each catch basin, proceeding in the downstream direction to the system outfall. 7.04.5.3 PIPE SIZING COMPUTATIONS FOR GRAVITY FLOW
In general, computations for pipe sizing are a trial and error procedure. The overall goal is to meet the pipe sizing and connection criteria specified in Sections 7.03.4 and 7.03.5.5 at a minimum construction cost. Thus, the designer should exercise sound engineering judgment regarding pipe costs relative to excavation, trenching and maintenance of traffic costs.
At each catch basin or manhole in the drainage system, the design discharge should be
determined based on the procedures in the preceding section. The required pipe size may then be determined as follows:
Step 1: Select a trial size for the pipe. The pipe should not be smaller than any of the
upstream pipes connected to the catch basin or less than the minimum size of 18 inches. Step 2: Determine the upstream invert elevation of the pipe based on the catch basin
configuration and the criteria contained in Section 7.03.5.5. Step 3: Select a trial downstream invert elevation and compute the slope of the pipe as:

TDOT DESIGN DIVISION DRAINAGE MANUAL September 10, 2013
7-58
p
dsusp L
InvInvSl
−= (7-35)
Where: Slp = slope of the pipe, (decimal)
Invus = upstream invert of the pipe, (ft) Invds = downstream invert of the pipe, (ft) Lp = length of the pipe, (ft)
Step 4: Use Manning’s Equation to compute the full-flow capacity of the pipe:
5066724630 .p
.cap SlD
n.Q = (7-36)
Where: Qcap = full flow capacity of the pipe, (ft3/s)
n = Manning’s n-value D = diameter of the pipe, (ft) Slp = slope of the pipe, (decimal)
Step 5: If Qcap is less than or equal to the design discharge, select a lower downstream
invert and return to Step 3. Step 6: Compute:
full
capfull A
QV = (7-37)
Where: Vfull = full-flow velocity, (ft/s)
Afull = area at full flow, or ( )22DA full π= , where D is the inside diameter of the pipe, (ft)
Step 7: If Vfull is less than 3 feet per second, select a smaller pipe and return to Step 2. Step 8: If Vfull is sufficiently greater than 3 feet per second, consider whether using the
next larger pipe size may yield a higher downstream invert elevation. If it appears possible, repeat Steps 2 through 7 for the larger pipe size. The final pipe size will be determined by overall cost, as discussed above. However, note that the slope of the pipe should not be less than 0.4%.
Step 9: Insure that the pipe will have sufficient cover at all points. See Section 7.03.4.1
for additional information. Step 10: Compute the travel time in the pipe as:
full
pt V
LT
60= (7-38)
Where: Tt = pipe travel time, (minutes)

TDOT DESIGN DIVISION DRAINAGE MANUAL September 10, 2013
7-59
Lp = pipe length, (ft) Vfull = pipe full flow velocity, (ft/s)
This procedure is repeated for each pipe in the system until the outfall is reached. A
sample computation form and an example problem are included in the Appendix. 7.04.6 ENERGY GRADE LINE AND HYDRAULIC GRADE LINE COMPUTATIONS
As described in Section 7.03.4, hydraulic grade line computations should be performed to ensure that the HGL computed for the 50-year storm event will be below each of the castings in the storm sewer system. However, where the entire system has been designed for the 50-year storm event, the HGL check will not be needed. These computations can become quite complicated due to the variety of flow conditions that may be encountered in the storm sewer system. A number of the pipes in the system may be entirely under pressure flow, other may be entirely under gravity flow and still others may flow full for only a portion of their length. In order to account for these complexities, the energy equation (see Section 5.03.2) may be written as:
mfsdsd
sdsdsusu
susu hhg
VPdinvg
VPdinv +++++=+++22
2//
//
2//
// γγ (7-39)
Where: invu/s = upstream invert elevation of the pipe or structure, (ft) du/s = depth in the upstream structure, (ft) Pu/s = pressure in the upstream structure, (lb/ft2) γ = specific weight of water, (lb/ft3) Vu/s = flow velocity in the upstream structure, (ft/s) g = acceleration of gravity, (32.2 ft/s2) invd/s = upstream invert elevation of the pipe or structure, (ft) dd/s = depth in the upstream structure, (ft) Pd/s = pressure in the upstream structure, (lb/ft2) Vd/s = flow velocity in the downstream structure, (ft/s) hf = friction head loss, (ft) hm = summation of minor head losses at junctions, bends etc., (ft)
Major head losses result from friction within the pipe. Minor head losses are those resulting from turbulence at:
• catch basins • pipe outfalls • pipe inlets • bends in pipes • plunging flow • expansions or contractions
Minor losses at a specific point in a storm drain system are often insignificant. In a large
system, however, the combined effect of a large number of minor losses may be significant. Minor losses may be minimized to some extent by careful design. For example, most TDOT standard catch basins include some form of benching in order to provide for a smooth flow transition across the structure.

TDOT DESIGN DIVISION DRAINAGE MANUAL September 10, 2013
7-60
In order to simplify the application of the energy equation, it is helpful to define a number of concepts which are commonly used in hydraulic grade line calculations. These concepts will allow several of the terms in the energy equation to be collected into a single parameter:
The Energy Grade Line (EGL) is the summation of all of the energy terms at a given
point, including the structure invert elevation (potential energy), water depth and pressure (pressure energy) and the flow velocity (kinetic energy). The energy due to the flow velocity is also called velocity head, since the terms energy and head are essentially interchangeable. It is important to keep in mind that, at a given point, the EGL represents an elevation.
The Hydraulic Grade Line (HGL) includes all of the energy terms described above
except for the velocity head. As such, it represents the elevation to which the water surface would rise if the pressure were zero. Figure 7-14 shows the hydraulic grade line for a pipe flowing partially full. At the downstream end of the pipe, the flow is pressurized and the elevation of the water surface in the piezometer is a combination of the pipe invert elevation, water depth (equal to the diameter of the pipe) and the pressure inside the pipe. At the upstream end of the pipe, the flow is not under pressure and the hydraulic grade line is simply the elevation of the pipe invert plus the water depth in side the pipe. Note that, for the purposes of hydraulic grade line calculations, the pressure is zero for an open water surface (that is, atmospheric pressure is not considered). The HGL also represents an elevation.
Figure 7-14 Hydraulic Grade Line
Reference: Texas Hydraulic Design Manual
Specific Energy (E) is a summation of the water depth, pressure and velocity head. Specific energy is analogous to the flow depth (if the pressure is zero) with the velocity head added in. A more thorough discussion of specific energy is provided in Section 5.03.2. In contrast to EGL and HGL, specific energy is not an elevation.
Energy grade line and hydraulic grade line calculations proceed from the system outfall
upstream to each structure on the system. For each pipe in the system, the general procedure is to evaluate the tailwater condition, compute the head losses through the pipe and determine the minor losses at the upstream structure. The HGL determined in a structure is then used to determine the tailwater condition for the next pipe upstream. For each run of pipe, there are four locations where the EGL and HGL will be evaluated as shown in Figure 7-15:

TDOT DESIGN DIVISION DRAINAGE MANUAL September 10, 2013
7-61
• in the downstream structure (or system outfall), designated by the subscript “d/s” • just inside the downstream end of the pipe, designated by the subscript “id/s” • just inside the upstream end of the pipe, designated by the subscript “iu/s” • in the upstream structure, designated by the subscript “u/s”
Detailed procedures for these computations are presented in the following sections.
Figure 7-15 Calculation Points for EGL and HGL Evaluation
7.04.6.1 EVALUATING TAILWATER CONDITIONS
For each run of pipe the hydraulic grade line analysis must begin from a “known” tailwater elevation. For the first pipe in the closed drainage system, this elevation should be determined based on a hydraulic analysis of the ditch or other conveyance at the system outfall. Otherwise, the tailwater elevation will have been determined from the analysis of the downstream pipe.
At the system outfall, the tailwater conveyance will usually be some form of open
channel with a flow velocity which can be calculated using Manning’s Equation as described in Section 5.03. This will usually result in a measurable amount of velocity head. In these situations, the designer should calculate both the EGL and the HGL downstream of the pipe. Where the tailwater condition is determined by a catch basin or manhole in a surcharged condition (i.e. – the water surface is above the crown of the outlet pipe), the EGL and HGL may be assumed to be approximately equal since turbulence within the structure renders the velocity difficult to determine. However, where the depth in a structure is less than the crown of the
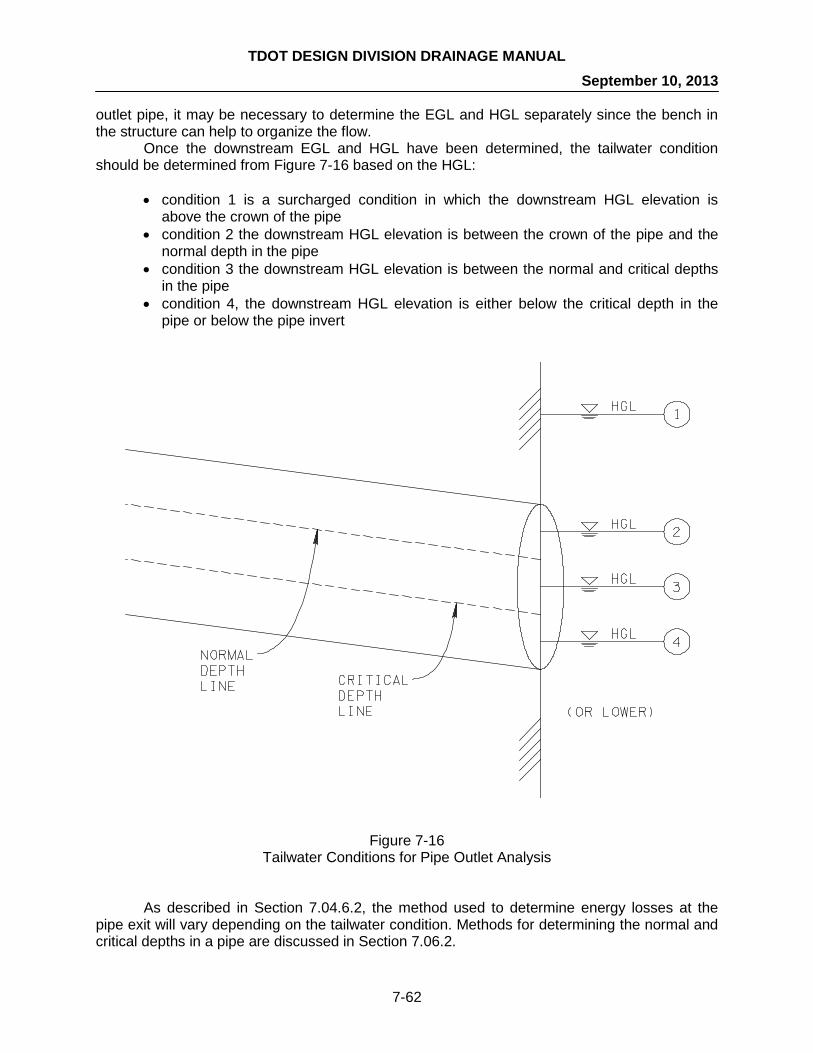
TDOT DESIGN DIVISION DRAINAGE MANUAL September 10, 2013
7-62
outlet pipe, it may be necessary to determine the EGL and HGL separately since the bench in the structure can help to organize the flow.
Once the downstream EGL and HGL have been determined, the tailwater condition should be determined from Figure 7-16 based on the HGL:
• condition 1 is a surcharged condition in which the downstream HGL elevation is above the crown of the pipe
• condition 2 the downstream HGL elevation is between the crown of the pipe and the normal depth in the pipe
• condition 3 the downstream HGL elevation is between the normal and critical depths in the pipe
• condition 4, the downstream HGL elevation is either below the critical depth in the pipe or below the pipe invert
Figure 7-16 Tailwater Conditions for Pipe Outlet Analysis
As described in Section 7.04.6.2, the method used to determine energy losses at the pipe exit will vary depending on the tailwater condition. Methods for determining the normal and critical depths in a pipe are discussed in Section 7.06.2.
TDOT DESIGN DIVISION DRAINAGE MANUAL September 10, 2013
7-63
7.04.6.1.1 EVALUATING TAILWATER EGL AND HGL ELEVATIONS
As described in the previous section, where a pipe outfalls to a ditch or structure with a measurable flow velocity, the EGL and HGL will be at different elevations, and the analysis of the upstream pipe will require that both be computed. The procedure for these computations should be as follows:
Step 1: Compute the flow depth using slope-conveyance method as described in
Section 5.06.1. Since the tailwater condition will normally be some type of open surface conveyance, the HGL will be equal to the computed water surface elevation.
Step 2: Compute the flow velocity using the continuity equation, as described in Section
5.03. Step 3: Compute the EGL by adding the velocity head to the HGL as follows:
g
VHGLEGL sdsdsd 2
2/
// += (7-40)
Where: EGLd/s = Energy Grade Line elevation in the channel or structure, (ft) HGLd/s = Hydraulic Grade Line elevation the channel or structure, (ft) Vd/s = downstream flow velocity, (ft/s) g = acceleration of gravity, (32.2 ft/s2) 7.04.6.2 HYDRAULIC ANALYSIS OF THE PIPE
Once the tailwater conditions have been evaluated, the next step is to compute the energy losses in the pipe. The hydraulic analysis of a storm sewer pipe employs a somewhat different method than the analysis of a culvert. However, a few of the concepts applied in culvert hydraulic analysis, most notably inlet control and outlet control, are also applied to the analysis of a storm sewer pipe. The goal of this part of the analysis is to determine the EGL and HGL at points 2 and 3 in Figure 7-15. 7.04.6.2.1 PROCEDURES FOR INLET AND OUTLET CONTROL
The concepts of inlet control and outlet control are discussed in Section 6.04.2. Due to the significant differences in the hydraulics of inlet control versus outlet control, this section presents separate procedures for each type of control. Thus, the designer should determine the point of control, and then refer to Table 7-10 to determine the procedure to use for the hydraulic analysis of the pipe. The procedure for determining the point of control should be as follows:
Step 1: Determine the critical depth (dc) in the pipe for the design discharge by
interpolating as needed from Table 6A-7. If appears that the dc would exceed the pipe diameter, assume that dc equals the pipe diameter.
Step 2: Determine the normal depth of flow in the pipe by first computing the
dimensionless factor:

TDOT DESIGN DIVISION DRAINAGE MANUAL September 10, 2013
7-64
2138pipeSD
Qn (7-41)
Where: Q = design discharge for the pipe, (ft3/s) n = Mannings n-value of the pipe, (dimensionless) D = pipe diameter, (ft) Spipe = slope of the pipe, (ft/ft)
This factor can be interpolated from Figure 7A-10 to determine a value for the ratio of the normal depth in the pipe (dn) to the pipe diameter (D). This ratio can then be multiplied by the diameter of the pipe to compute the normal depth. If the design discharge is greater than the flow capacity of the pipe (see Section 7.04.5.3), then the dn should be assumed to be equal to the pipe diameter.
Step 3: Compare the values determined in the previous steps for dn and dc. If dn is
greater than dc, the pipe is at a subcritical slope for the design discharge and the hydraulic analysis of the pipe should be based on outlet control. If dc is greater than dn, the pipe is at a supercritical slope for the design discharge and the hydraulic analysis should be based on inlet control. Table 7-10 lists the sections which describe the procedures for each control type.
Tailwater Condition (See Figure 7-16)
dn > dc (Outlet Control)
dn < dc (Inlet Control)
1 7.04.6.2.3 7.04.6.2.3* 2 – 4 7.04.6.2.3 7.04.6.2.2
* If the upstream end of the pipe is not submerged, check for inlet control.
Table 7-11 Procedures to Use for Inlet Control or Outlet Control
(Refer to the listed section of the manual) 7.04.6.2.2 PROCEDURE FOR INLET CONTROL
Because inlet control requires supercritical flow in the pipe, conditions downstream of the pipe inlet do not affect the flows which occur at the upstream end of the pipe. The hydraulic performance of the pipe is governed by the fact that the flow passes through critical depth as it enters the pipe. Thus, pipe exit and friction losses are not considered in this procedure. However, this procedure should not be used where a high tailwater condition (see condition 1 in Figure 7-16) causes the entire pipe to be surcharged. In that case, the procedure in Section 7.04.6.2.3 should be employed. In order to determine the hydraulic grade line and the energy grade line at the upstream end of the pipe (HGLiu/s and EGLiu/s, respectively), the following procedure should be used:
Step 1: The critical depth (dc) in the pipe for the design discharge should have been
determined as described in Step 1 of the preceding section. Since critical depth will occur at the

TDOT DESIGN DIVISION DRAINAGE MANUAL September 10, 2013
7-65
inlet end of the pipe, HGLiu/s may be assumed to be equal to the critical depth plus the upstream invert elevation of the pipe (invu/s).
Step 2: Using Table 7A-12, determine the velocity at critical depth (dc) in the pipe. Step 3: The energy grade line elevation (EGLiu/s) will then be equal to the hydraulic
grade line plus the velocity head:
g
VHGLEGL csiusiu 2
2
// += (7-42)
Where: Vc = velocity at critical depth, (ft/s) g = acceleration of gravity, (32.2 ft/s2) 7.04.6.2.3 PROCEDURE FOR OUTLET CONTROL
Outlet control occurs when the flow in the pipe is in the subcritical flow regime. Thus, tailwater conditions and head losses in the pipe will affect the EGL and HGL at the upstream end of the pipe. Normally, head loss in the pipe will only consider exit losses and friction losses. Additional losses could be caused by transitions in pipe diameter, curved pipe alignments or “tee” or “wye” pipe junctions. These features are not common and reflect poor design and thus are not discussed in this section. Refer to the FHWA publication HEC-22, Urban Drainage Design Manual for more information on analyzing these features.
Hydraulic analysis of a storm sewer pipe in outlet control can be very complex due to the
wide variety of possible flow conditions. The two primary complicating factors are the tailwater condition and the flow capacity of the pipe compared to the design flow. The following procedure refers to the tailwater conditions illustrated in Figure 7-16 (in section 7.04.6.1). The designer should also refer to Section 7.04.5.3 for information on determining the flow capacity of a storm sewer pipe (Qcap).
Step 1: Determine the possible value(s) for the depth inside the downstream end of the
pipe (did/s). Depending upon the tailwater conditions, one or more of four possible values should be determined:
• Option A: The pipe outfall is submerged, did/s would be equal to the pipe diameter. Since this represents a pressure flow situation, HGLid/s would not correspond to the depth.
• Option B: The depth in the pipe corresponds to the hydraulic grade line in the
downstream structure. Where this occurs, did/s may be computed as: sdsdsid invHGLd /// −= (7-43) Where: HGLd/s = the hydraulic grade line in the downstream structure, (ft) invd/s = downstream invert of the pipe, (ft)
• Option C: did/s is equal to the critical depth of flow in the pipe (dc).

TDOT DESIGN DIVISION DRAINAGE MANUAL September 10, 2013
7-66
• Option D: did/s is equal to the average of the critical depth of flow in the pipe and the pipe diameter. In this case:
2/
Ddd csid
+= (7-44)
Where: dc = critical depth in the pipe for the design discharge, (ft) D = pipe diameter, (ft) Table 7-11 provides guidance on the depth which should be determined for different situations:
Tailwater Condition Qdesign < Qcap Qdesign > Qcap
1 Option A Option A 2 Option B Option B or D* 3 Option B Option B or D* 4 Option C Option D
* The option resulting in the greater EGLid/s elevation should be selected.
Table 7-12 Options for Determining the Depth in the Downstream End of the Pipe (did/s)
(Refer to the four options listed in this section)
Step 2: Calculate the flow velocity corresponding to the depth(s) determined in Step 1. This may be accomplished by computing the ratio of did/s to the pipe diameter and interpolating a value of A/Afull from Table 7A-12. Multiplying this by the cross sectional area of the pipe yields the cross sectional area of the flow at the downstream end of the pipe (Aid/s). The flow velocity (Vid/s) can then be computed as:
sid
designsid A
QV
// = (7-45)
Where: Qdesign = the pipe design discharge, (ft3/s)
Step 3: Calculate the head loss at the pipe outfall (ho) for each velocity computed in step 2. As discussed in Section 7.04.6.1, the downstream structure may or may not have a measurable flow velocity. Where there is a measurable downstream flow velocity, the pipe exit loss (ho) may be calculated as:
−
=
gV
gVh sdsid
o 220.1
2/
2/ (7-46)

TDOT DESIGN DIVISION DRAINAGE MANUAL September 10, 2013
7-67
Where: Vid/s = flow velocity in the upstream end of the pipe, (ft/s) Vd/s = flow velocity in the downstream structure or conveyance, (ft/s) g = acceleration of gravity, (32.2 ft/s2) Note that the value of ho may not be less than zero.
Where the downstream flow velocity is negligible (such as a highly surcharged manhole or detention basin), the pipe exit loss (ho) may be calculated as:
=
gVh sid
o 24.0
2/ (7-47)
Where: Vid/s = flow velocity in the upstream end of the pipe, (ft/s) g = acceleration of gravity, (32.2 ft/s2)
Step 4: Calculate a value of EGLid/s for each of the depths determined in step 1. This may be calculated as: osdsid hEGLEGL += // (7-48) Where: EGLd/s = energy grade line elevation in the downstream structure, (ft) ho = head loss as the pipe outfall, (ft)
Where more than one depth was determined, select the depth that resulted in the greater result for EGLid/s. For tailwater conditions 2 through 4, this depth may be considered to be equal to HGLid/s.
Once EGLid/s has been determined, it is necessary to determine EGLiu/s by evaluating
friction losses in the pipe. The procedure used to accomplish this will vary depending upon whether the pipe will be in a full flow condition. The pipe should be assumed to be in a full flow condition if either of these circumstances is true:
• the design discharge (Qdesign) is greater than the pipe flow capacity (Qcap), regardless of the tailwater condition
• the design discharge (Qdesign) is less than the pipe flow capacity (Qcap), but the tailwater EGL is above the crown of the outlet pipe (condition 1 in Figure 7-16)
Where either of the circumstances describe above occur, the procedure in steps 5
through 8 should be followed. Otherwise, the pipe may be assumed to be in part-full flow, and Steps 9 through 11 should be employed.
Step 5: Calculate the friction slope (Sf) in the pipe for full flow as:
2
67.2463.0
=
DnQ
S designf (7-49)

TDOT DESIGN DIVISION DRAINAGE MANUAL September 10, 2013
7-68
Where: Qdesign = the discharge used to analyze the pipe, (ft3/s) n = Mannings n-value of the pipe, (dimensionless) D = pipe diameter, (ft)
Note that the friction slope (Sf) can be very different that the pipe slope (Spipe).
Step 6: Calculate the friction loss in the pipe (hf) as: ff SLh = (7-50) Where: L = the length of the pipe, (ft) Sf = friction slope, (ft/ft)
Step 7: Calculate the energy grade line at the upstream end of the pipe (EGLiu/s) as: fsidsiu hEGLEGL += // (7-51)
Step 8: As described above, a pipe at a steep slope can be assumed to be in outlet control if its outlet is surcharged. For situations where Qdesign is less than Qcap, it is possible that the calculated value of EGLiu/s will be lower than the upstream crown of the pipe. Where this occurs, the pipe can no longer be assumed to be in full flow and the designer should also follow the procedure for inlet control in Section 7.04.6.2.2. This will yield two possible values for EGLiu/s, and the greater of the two should be selected. The designer should jump to the procedure in Section 7.04.6.3 to continue the hydraulic analysis of the storm sewer system
Step 9: This step begins a procedure for calculating EGLiu/s in a pipe which not flowing full. Since HGLid/s will only extremely rarely be equal to the normal depth (dn) in the pipe, an exact solution would require the computation of a backwater curve through the pipe, which is too complex for hand calculations. However, since the water surface will tend towards normal depth as it proceeds upstream through the pipe, it is possible to use a simplified method.
This simplified method separates the water surface profile through the pipe into two parts. Since the starting water surface depth (did/s) at the downstream end of the pipe is usually not equal to the normal depth (dn), the friction slope (Sf) at that point will be different than the pipe slope (Spipe). If HGLid/s is less than dn, Sf will be steeper than Spipe. If HGLid/s is greater than dn, Sf will be flatter than Spipe. Either way, there will be distance (Ltest) over which Sf will “catch up” to the hydraulic grade line for normal flow, which will have slope equal to Spipe. Thus, the energy grade line inside the pipe can be conceptualized as shown in Figure 7-17.

TDOT DESIGN DIVISION DRAINAGE MANUAL September 10, 2013
7-69
Figure 7-17 Conceptual EGL Profile Through a Pipe Flowing Part Full
Since did/s has already been determined in step 1, above, it will be possible to interpolate a value for the factor AR0.67 from Table 7A-12. The friction slope (Sid/s) corresponding to did/s may then computed from:
2
67.0/ 486.1
=
ARnQ
S designsid (7-52)
Where: Qdesign = the discharge used to analyze the pipe, (ft3/s) n = Mannings n-value of the pipe, (dimensionless)
The normal depth (dn) should then be determined by using the procedure in step 2 of Section 7.04.6.2.1.
Step 10: Compute Ltest as:
sidpipe
sidntest SS
ddL
/
/
−
−= (7-53)
Step 11: If the pipe length is greater than Ltest, then it may be assumed that HGLiu/s is
equal to dn, and EGLiu/s may be computed as:
g
VHGLEGL nsiusiu 2
2
// += (7-54)

TDOT DESIGN DIVISION DRAINAGE MANUAL September 10, 2013
7-70
Where: Vn = velocity at normal depth, (ft/s) g = acceleration of gravity, (32.2 ft/s2)
If the pipe length (L) is less than Ltest, then the head loss due to friction (hf) should be computed as: sidf SLh /= (7-55) Where: L = the length of the pipe, (ft) Sid/s = friction slope corresponding to the depth at the pipe outfall, (ft/ft)
EGLiu/s may then be calculated using equation 7-51 (see step 7, above). HGLiu/s may then be determined by assuming a depth at the upstream end of the pipe (diu/s) and then using a procedure similar to step 2 in Section 7.04.6.2.3. The depth of diu/s should be varied by trial and error until the sum of the assumed HGL and the velocity head equal EGLiu/s.
Once EGLiu/s has been determined, it is possible to evaluate the energy in the upstream structure as described in the following section. 7.04.6.3 CALCULATING HYDRAULIC GRADE IN THE UPSTREAM STRUCTURE
Analyzing the energy in the upstream structure is a two-step process. The first step is to develop an estimate of the energy level based on the head loss at the entrance to the outlet pipe. The second step is to adjust this initial estimate for other losses which can occur in the structure due to benching, multiple inflow pipes at different angles and plunging flow.
These computations will make use of specific energy (E) rather than working directly with EGL or HGL. The specific energy in the upstream structure will always be referenced from the upstream pipe invert (invu/s), rather than the floor of the drainage structure.

TDOT DESIGN DIVISION DRAINAGE MANUAL September 10, 2013
7-71
7.04.6.3.1 INITIAL ESTIMATE OF ENERGY IN THE UPSTREAM STRUCTURE
As discussed above, the initial estimate of the energy in the upstream structure is based on head losses at the entrance of the outlet pipe. These losses will be controlled by one of three possible conditions at the pipe inlet: outlet control (for a submerged or un-submerged outlet), inlet control with a submerged outlet and inlet control with an un-submerged outlet. However, if the analysis of the outlet pipe was based on inlet control as described in Section 7.04.6.2, the outlet control condition may be ignored. Otherwise, all three conditions should be checked as follows:
Step 1: Determine the specific energy at the upstream end of the pipe (Eiu/s). This may be computed as: siusiusiu invEGLE /// −= (7-56) Where: EGLiu/s = energy grade line elevation at the pipe inlet, (ft) Inviu/s = invert elevation of the pipe inlet, (ft)
Step 2: If the analysis of the outlet pipe was not based on inlet control, compute the initial estimate for the upstream specific energy based on outlet control (Eu/s est oc) by first computing the velocity of the flow at the upstream end of the outlet pipe (Viu/s). This may be accomplished by taking diu/s and following the procedure provided in step 2 of Section 7.04.6.2.3. Once Viu/s has been computed, the head loss at the pipe inlet (hi) may be computed as:
=
gVKh siu
ii 2
2/ (7-57)
Where: Viu/s = flow velocity inside the upstream end of the pipe, (ft/s) Ki = entrance loss coefficient, (dimensionless) g = acceleration of gravity, (32.2 ft/s2)
Research by the FHWA indicates that the value of Ki should be 0.2. Eu/s est oc may then be calculated as: isiuocestsu hEE += // (7-58)
Step 3: Before computing initial estimates of specific energy for the two inlet control conditions, it is necessary to first compute the discharge intensity (DI) for the outflow pipe:
( ) 5.0gDAQ
DI design=
Where: Qdesign = the discharge used to analyze the pipe, (ft3/s) A = cross sectional area of the full pipe, (ft2) D = pipe diameter, (ft)

TDOT DESIGN DIVISION DRAINAGE MANUAL September 10, 2013
7-72
g = acceleration of gravity, (32.2 ft/s2) The initial estimate of specific energy in the upstream structure for the submerged inlet
control condition (Eu/s est ics) may then be computed as: ( )2/' DIDE icsestsu = (7-59) Where: D = pipe diameter, (ft)
The initial estimate of specific energy in the upstream structure for the un-submerged inlet control condition (Eu/s est icu) may in turn be computed as: ( ) 67.0
/' 6.0 DIDE icuestsu = (7-60)
Analysis of these two equations shows that equation 7-60 for un-submerged flow will dominate the results for discharge intensities up to 1.4. At this point, the estimated upstream specific energy will be twice the outlet pipe diameter. However, equation 7-59 for submerged flow was developed for discharge intensities up to 1.6 and should be used with caution above that level.
Step 4: The initial estimate of specific energy in the upstream structure will be the maximum of the values computed in steps 2 and 3. Thus: ( )icseassuicuestsuocestsuestsu EEEE //// ,,max= (7-61)
The selected value of Eu/s est should be checked to ensure that it is greater than Eiu/s. If not, Eu/s est should be assumed to be equal to Eiu/s. 7.04.6.3.2 ADJUSTMENTS TO THE INITIAL ENERGY ESTIMATE
Once the initial estimate of specific energy in the upstream structure has been completed, it is adjusted for additional minor losses due to benching, multiple inflow pipes at different angles and plunging flow. The following sections provide procedures for computing loss coefficients for each of these factors. 7.04.6.3.2.1 ADJUSTMENT FOR BENCHING
Benching usually consists of constructing a semi-circular channel through a drainage structure to help guide flows from the inlet pipe(s) into the outlet pipe. As such, the correction for benching will usually serve to reduce the minor losses in a manhole rather than increase them. FHWA guidance recognizes a number of different types of benches as illustrated in Figure 7-18. As can be seen, standard TDOT drainage structures generally employ a half bench.

TDOT DESIGN DIVISION DRAINAGE MANUAL September 10, 2013
7-73
Figure 7-18 Bench Types for Drainage Structures
(Reference: FHWA, HEC-22)
The loss coefficient for benching may be determined as follows:
Step 1: Compute the degree of submergence (Si) in the structure as:
D
ES estsu
i/= (7-62)
Where: Eu/s est = initial estimate of specific energy in the structure, (ft) D = pipe diameter, (ft)

TDOT DESIGN DIVISION DRAINAGE MANUAL September 10, 2013
7-74
Step 2: Determine appropriate values for the loss coefficient for benching (CB) from Table 7-12. Where Si is between 1.0 and 2.5, use linear interpolation to compute a value for CB.
Bench Type Submerged Bench (Si > 2.5)
Un-submerged Bench (Si < 1.0)
Flat (level) -0.05 -0.05 Depressed 0.0 0.0
Half -0.05 -0.85 Full -0.25 -0.93
Improved -0.60 -0.98
Table 7-13 Benching Loss Coefficients (CB)
7.04.6.3.2.2 ADJUSTMENT FOR ANGLED INFLOWS
The loss coefficient for angled inflows (CA) is utilized only where a structure has multiple inflow pipes. Further, these inflow pipes must have invert elevations less than Eu/s est. If the invert of a pipe is higher than that, its inflows are considered plunging flows and are discussed in the following section. Figure 7-19 illustrates how angles between the inflow and outflow pipes should be measured.
Figure 7-19
Angle Measurements for Computation of CA (Reference: FHWA, HEC-22)
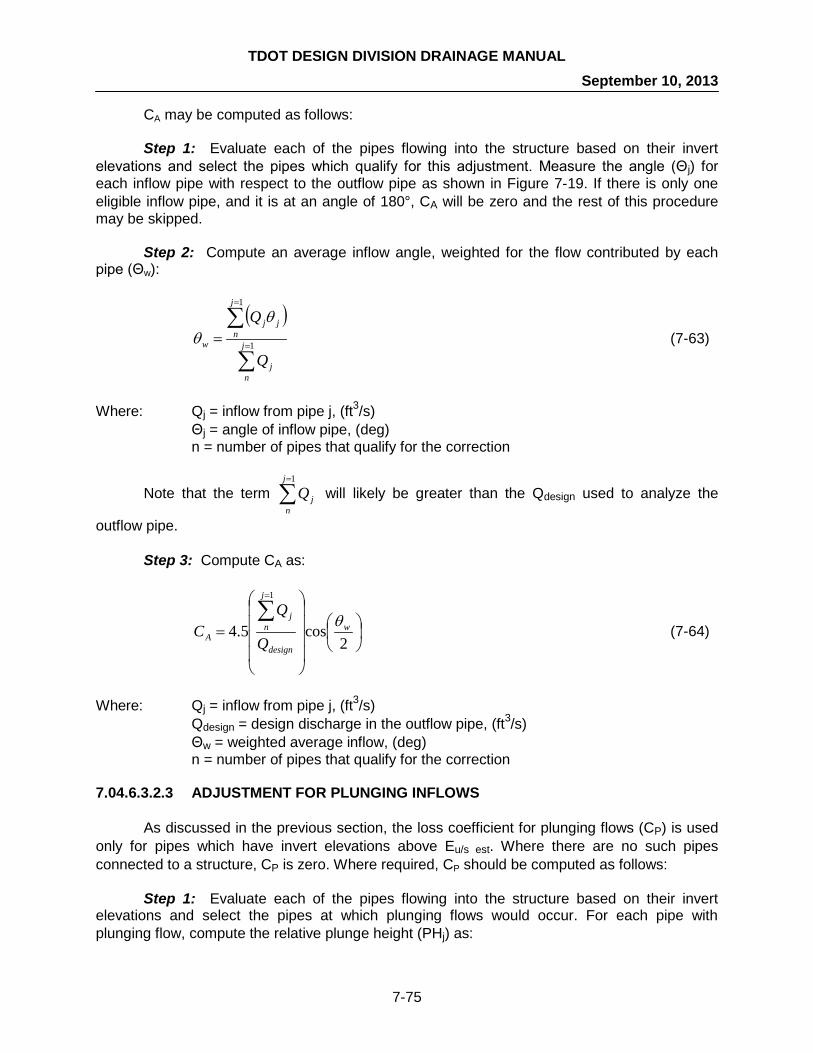
TDOT DESIGN DIVISION DRAINAGE MANUAL September 10, 2013
7-75
CA may be computed as follows:
Step 1: Evaluate each of the pipes flowing into the structure based on their invert elevations and select the pipes which qualify for this adjustment. Measure the angle (Θj) for each inflow pipe with respect to the outflow pipe as shown in Figure 7-19. If there is only one eligible inflow pipe, and it is at an angle of 180°, CA will be zero and the rest of this procedure may be skipped.
Step 2: Compute an average inflow angle, weighted for the flow contributed by each pipe (Θw):
( )
∑
∑=
=
= 1
1
j
nj
j
njj
w
Q
Q θθ (7-63)
Where: Qj = inflow from pipe j, (ft3/s) Θj = angle of inflow pipe, (deg) n = number of pipes that qualify for the correction
Note that the term ∑=1j
njQ will likely be greater than the Qdesign used to analyze the
outflow pipe.
Step 3: Compute CA as:
=∑=
2cos5.4
1
w
design
j
nj
A Q
QC θ
(7-64)
Where: Qj = inflow from pipe j, (ft3/s) Qdesign = design discharge in the outflow pipe, (ft3/s) Θw = weighted average inflow, (deg) n = number of pipes that qualify for the correction 7.04.6.3.2.3 ADJUSTMENT FOR PLUNGING INFLOWS
As discussed in the previous section, the loss coefficient for plunging flows (CP) is used only for pipes which have invert elevations above Eu/s est. Where there are no such pipes connected to a structure, CP is zero. Where required, CP should be computed as follows:
Step 1: Evaluate each of the pipes flowing into the structure based on their invert elevations and select the pipes at which plunging flows would occur. For each pipe with plunging flow, compute the relative plunge height (PHj) as:

TDOT DESIGN DIVISION DRAINAGE MANUAL September 10, 2013
7-76
DEinv
PH estsujj
/−= (7-65)
Where: invj = height of the invert of pipe j above the invert of the outflow pipe, (ft) Eu/s est = initial estimate of specific energy in the structure, (ft) D = outflow pipe diameter, (ft)
Step 2: Compute the loss coefficient for plunging flows (CP) as:
design
j
njj
P Q
PHQC
∑=
=
1
(7-66)
Where: Qj = inflow from pipe j, (ft3/s) PHj = relative plunge height for pipe j, (ft) Qdesign = design discharge in the outflow pipe, (ft3/s) n = number of pipes that qualify for the correction

TDOT DESIGN DIVISION DRAINAGE MANUAL September 10, 2013
7-77
7.04.6.3.3 FINAL COMPUTATION OF ENERGY IN THE UPSTREAM STRUCTURE
Once the initial estimate of specific energy in the upstream structure (Section 7.04.6.3.1) and the loss coefficients for the other minor losses (Section 7.04.6.3.2) have been computed, the conditions in the upstream structure may be determine using the following process:
Step 1: Compute the final value for specific energy (Eu/s) as: ( )( )siuestsuPABestsusu EECCCEE //// −+++= (7-67)
Note that the sum of CB + CA + CP should not be less than zero. Thus, the minimum value for Eu/s would be Eu/s est.
Step 2: The energy grade line elevation in the structure (EGLu/s) can then be computed as: siususu invEEGL /// += (7-68) Where: inviu/s = invert elevation of the outflow pipe, (ft) Step 3: In many cases, it will be necessary to evaluate the hydraulic grade line in the structure (HGLu/s) in order to establish a tailwater condition for the hydraulic analysis of the inflow pipes. In structures which are highly surcharged or where multiple inflow pipes create highly turbulent conditions, HGLu/s may be assumed to be equal to EGLu/s. Otherwise the cross sectional area of the flow through the structure (Astr) may be computed as: wEA sustr /= (7-69) Where: w = width of the structure transverse to the flow, (ft) The flow velocity through the structure (Vstr) may be estimated as:
design
strstr Q
AV = (7-70)
Where: Qdesign = design discharge in the outflow pipe, (ft3/s)
HGLu/s may then be computed from:
g
VEGLHGL strsusu 2
2
// −= (7-71)
Where: g = acceleration of gravity, (32.2 ft/s2)

TDOT DESIGN DIVISION DRAINAGE MANUAL September 10, 2013
7-78
Once the flow conditions in the structure have been determined, the HGL computations would continue upstream for each of pipes in succession until the ends of the storm drainage system are reached. Figures 7A-5 and 7A-6 provide computation forms which may be used for these computations. 7.04.7 SPECIAL CONSIDERATIONS FOR FLAT GRADES
The normal procedure of locating catch basins as described in this chapter implicitly assumes that the roadway will have a consistent cross section or normal crown. However, roadway designs often require variations in cross section and in crown, due to horizontal curves, which could act to either trap or concentrate roadway runoff, resulting in increased hazards to traffic. Thus, drainage structures will be required at these locations, regardless of the contributing drainage area. A number of these situations are listed under Step 5 in Section 7.04.1.2.
This section discusses a few common situations which may need special consideration in the roadway drainage design process. However, in a manual of this nature, it is not possible to anticipate every situation where runoff may tend to collect. Thus, the designer should carefully evaluate the proposed roadway design in order to ensure that water will be adequately drained from all locations. 7.04.7.1 STRATEGIES FOR FLAT PROFILE GRADES
A minimum longitudinal slope of 0.4% is recommended in Section 7.03.1. However, the designer may encounter a variety of circumstances which would tend to make this minimum slope difficult to achieve. In particular, this may be the case in superelevation transitions, since the slope of the gutter line may be significantly different from the profile grade slope. Following are a number of strategies which the designer may employ to prevent drainage problems in flat areas:
• Plan ahead: Typically, the profile grade of roadway is established early in the design process. Anticipating at this time where flat slopes may occur can prevent difficulty and expense later on. In particular, a sag vertical curve should not be located where it may fall on a superelevation transition.
• Vary the shoulder slope: In most cases, shoulders will have a cross slope of
4%. On facilities with flat profile grades, the shoulder slope can be allowed to vary on a regular pattern from 4% to 2%. This will create a rolling profile on the gutter line even though the profile grade may be flat. The high and low points of the gutter profile should be spaced to create a gutter slope of at least 0.4% so that water can be efficiently conveyed along the gutters to catch basins at the low points. In some cases, it may be possible to use curb cuts to draw water into a side ditch. In general, curb cuts are not recommended because they are not feasible where a side walk is present, and they may also present other safety concerns.

TDOT DESIGN DIVISION DRAINAGE MANUAL September 10, 2013
7-79
• Use longitudinal drains: Where the roadway cross section does not include a shoulder, it may be necessary to employ a longitudinal drain. For a curb and gutter cross section, this will most likely involve the use of slotted drain, while other areas may allow the use of trench drain. As described in Section 7.03.3, the use of longitudinal drains requires the approval of the Design Manager and may not be the preferred option. As an alternative, the designer may wish to consider making adjustments to the proposed grade. In making this decision, the designer should consider initial construction cost, the cost of replacing or adjusting the longitudinal drain should a resurfacing project be needed in the future, the service life of the drain, and other design features which may be impacted by a change in the proposed grade.
7.04.7.2 LONG SAG VERTICAL CURVES
As described in Sections 7.03.1 and 7.03.3, the typical design for a vertical sag curve on a curb and gutter cross section would consist of a catch basin at the low point with flanking inlets placed on either side in case the main inlet becomes clogged. In order to maintain the hydraulic efficiency of the curb and gutter, the length of the vertical curve would be limited such that the vertical curve constant, K, would be ≤ 125. In some situations, it may be necessary to extend the length of a vertical curve in order to accommodate the topography of a particular site. This could cause the vertical curve constant to be greater than 125, resulting in relatively long areas of flat profile grade. Where this occurs on projects which include curbs and gutters, the designer should refer to Section 7.03.9.1 for strategies to provide efficient roadway drainage.
The TDOT roadway design standards require sag vertical curve K-values greater than 125 for facilities with design speeds greater than 60 mph. Although such facilities are not usually provided with curb and gutter cross sections, relatively long flat slopes can occur along the median barrier on a paved median. In this situation, trench drains designed according to the information provided in Section 7.03.3 should be used in place of flanking inlets.

TDOT DESIGN DIVISION DRAINAGE MANUAL September 10, 2013
7-80
7.04.7.3 SUPERELEVATION TRANSITIONS
As shown on the RD-SE series of Standard Drawings, when superelevation is required on a roadway, the typical cross section will transition from normal crown to the fully superelevated cross section over a defined distance. Because of this change in roadway cross section, the longitudinal slope at the gutter line will no longer be equal to the slope of the profile grade. The standard drawings indicate that a minimum slope of 0.5% should be maintained on the gutter line. However, this may be difficult to achieve where the profile grade slope is less than 1.5%. As shown in Figure 7-20, at sites where the profile grade is on a negative gradient, the slope of the outside edge of the travel lane on the starting transition, S1, and the inside edge of the travel lane on the ending transition, S4, can become flat. In situations where the profile grade is not sufficiently steep, these two slopes can become reversed with respect to the profile grade. Where the profile grade is on a positive gradient, the situation is reversed, and the slopes S2 and S3 are reduced. Where shoulders are present on the inside of a curve, they typically remain at a constant cross slope, and the slope of the gutter line will be equal to the slope at the edge of the travel lane. However, on the outside of the curve, the cross slope of the shoulder will typically transition from 4% to 1% so that the slope of the gutter line (for example, SG1 in Figure 7-20) will be different from the slope at the edge of the travel lane.
The following procedure can be employed to determine the gutter line slope on the outside of the curve for the starting transition, SG1. As such, it serves as an example, and should be adapted as needed to determine the gutter line slopes for the other parts of the transitions.
Figure 7-20 Typical Superelevation with Gutter Profiles

TDOT DESIGN DIVISION DRAINAGE MANUAL September 10, 2013
7-81
Step 1: Determine the Height of Superelevation: The height of superelevation, ΔHEP, is the difference in height of the edge of the travel lanes with respect to the profile grade across the transition. On the outside of the curve, this height includes the change in height required to transition from normal crown to horizontal plus the height required to transition from horizontal to a fully superelevated cross section. Thus, it may be computed as: ( )dxTEP eSWH +=∆ (7-72) Where: ΔHEP = height of superelevation at the edge of the travel lanes (ft) WT = width of the travel lanes (ft) Sx = cross slope of the travel lanes (ft/ft) ed = superelevation rate (ft/ft)
Note: Sx and ed should both be taken as positive numbers even though the slopes they represent are in opposite directions.
For this procedure, the resulting value of ΔHEP would be taken as a positive number
since the height at the edge of travel lane is increasing with respect to the profile grade. In general, the value of ΔHEP should be taken as positive if the edge of the travel lane is rising with respect to the profile grade, and negative if the edge of the travel lane is falling with respect to the profile grade. Thus, the value of ΔHEP used in determining SG2 would be negative.
Step 2: Determine the Change in Shoulder Height, if Necessary: As discussed above, the shoulder on the outside of the curve usually transitions from a cross slope of 4% to 1% across the length of the superelevation transition. As a result, the change in height of the gutter line with respect to the profile grade will be somewhat greater than the change in height at the edge of the travel lane. Thus, this adjustment, ΔHS may be computed as: ( )esSS SSWH −=∆ (7-73) Where: ΔHS = height adjustment for the change in shoulder slope (ft) WS = shoulder width (ft) Ss = shoulder cross slope at the start of the transition (ft/ft) Se = shoulder cross slope at the end of the transition (ft/ft)
For this procedure, the resulting value of ΔHS would be positive since the shoulder is getting flatter across the transition, and the outside edge is thus rising with respect to the profile grade. However, if this procedure were to determine a value for SG2, ΔHS would be negative since the shoulder cross slope is increasing across the transition. The total change in height, ΔH, may then be computed as: SEP HHH ∆+∆=∆ (7-74)
This adjustment is not needed for gutter slopes on the inside of the curve or for a roadway cross section which does not include a shoulder.

TDOT DESIGN DIVISION DRAINAGE MANUAL September 10, 2013
7-82
Step 3: Compute the Rate of Transition: Since the change in height occurs at a constant rate across the total transition length, L, the rate of superelevation, RT, may be computed as:
LHRT
∆= (7-75)
Step 4: Compute the Gutter Slope: Since the rate of transition computed in the
previous step is determined in relation to the profile grade, the actual gutter slope is computed as: TRGSG +=1 (7-76) Where: SG1 = gutter slope for the starting transition on the outside of the curve (ft/ft) G = slope of the profile grade (ft/ft) RT = rate of transition (ft/ft)
In making this computation, keep track of whether the computed slopes are positive or negative. For example, since the profile grade in Figure 7-20 is sloped down, the grade would represent a negative value. In contrast, the change in height for SG1 is increasing with respect to the profile grade so that RT represents a positive number. If the absolute value of RT is less than the absolute value of G, SG1 would still be negative but would be quite flat. Conversely, if the absolute value of RT is greater than the absolute value of G, SG1 would be positive and sags would be formed at the two locations indicated in Figure 7-20 as “possible low points.”
The procedure above can be used to compute gutter slopes on both sides of the roadway for both transitions. If the resulting slopes are all steeper than the minimum slope of 0.4%, drainage may be provided by placing inlets on a continuous slope as described in Section 7.04.4. The computed gutter slope values SG1, SG2, etc. should be used to compute spread and inlet interception and the flow rate computed for each inlet should account for the direction of the roadway cross slope through the transitions and superelevated area. Note that catch basins would be placed at both locations indicated in Figure 7-20 as “possible low points” regardless of whether sags would be formed at those points.
If any of the gutter line slopes are found to be less than 0.4%, the designer should apply one of the strategies for flat slopes provided in Section 7.04.1.3.1.
Geopak software can be used to determine gutter line slopes along the proposed roadway. If a proposed Geopak TIN surface (digital terrain model) has been developed for the roadway, then Geopak's Draw Profile tool can be used to generate profiles along the gutter line allowing the designer to determine where flat grades or sag points occur due to the combination of the roadway profile grade and superelevation transitions. Geopak also provides various drainage analysis tools to investigate flow directions and ponding locations including Drainage Patterns, Downstream Trace, Delineate Low Points & Surface Ponds.
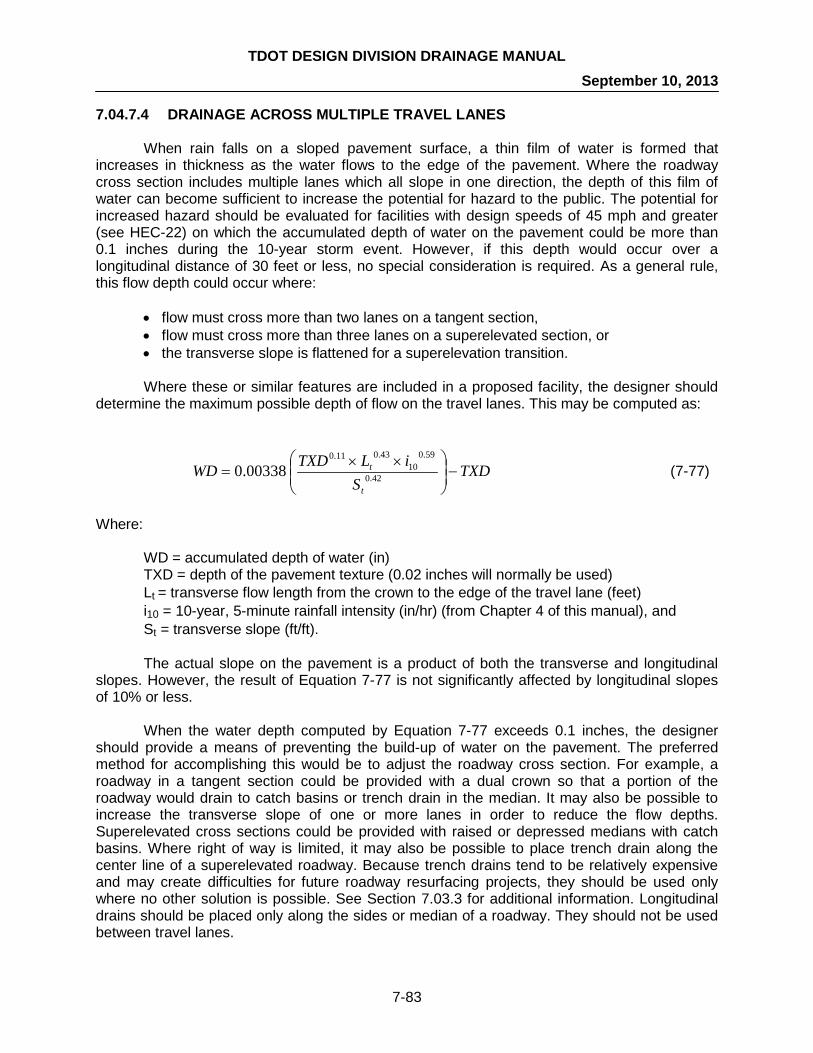
TDOT DESIGN DIVISION DRAINAGE MANUAL September 10, 2013
7-83
7.04.7.4 DRAINAGE ACROSS MULTIPLE TRAVEL LANES
When rain falls on a sloped pavement surface, a thin film of water is formed that increases in thickness as the water flows to the edge of the pavement. Where the roadway cross section includes multiple lanes which all slope in one direction, the depth of this film of water can become sufficient to increase the potential for hazard to the public. The potential for increased hazard should be evaluated for facilities with design speeds of 45 mph and greater (see HEC-22) on which the accumulated depth of water on the pavement could be more than 0.1 inches during the 10-year storm event. However, if this depth would occur over a longitudinal distance of 30 feet or less, no special consideration is required. As a general rule, this flow depth could occur where:
• flow must cross more than two lanes on a tangent section, • flow must cross more than three lanes on a superelevated section, or • the transverse slope is flattened for a superelevation transition.
Where these or similar features are included in a proposed facility, the designer should
determine the maximum possible depth of flow on the travel lanes. This may be computed as:
TXDS
iLTXDWDt
t −
××= 42.0
59.010
43.011.0
00338.0 (7-77)
Where:
WD = accumulated depth of water (in) TXD = depth of the pavement texture (0.02 inches will normally be used) Lt = transverse flow length from the crown to the edge of the travel lane (feet) i10 = 10-year, 5-minute rainfall intensity (in/hr) (from Chapter 4 of this manual), and St = transverse slope (ft/ft).
The actual slope on the pavement is a product of both the transverse and longitudinal
slopes. However, the result of Equation 7-77 is not significantly affected by longitudinal slopes of 10% or less.
When the water depth computed by Equation 7-77 exceeds 0.1 inches, the designer should provide a means of preventing the build-up of water on the pavement. The preferred method for accomplishing this would be to adjust the roadway cross section. For example, a roadway in a tangent section could be provided with a dual crown so that a portion of the roadway would drain to catch basins or trench drain in the median. It may also be possible to increase the transverse slope of one or more lanes in order to reduce the flow depths. Superelevated cross sections could be provided with raised or depressed medians with catch basins. Where right of way is limited, it may also be possible to place trench drain along the center line of a superelevated roadway. Because trench drains tend to be relatively expensive and may create difficulties for future roadway resurfacing projects, they should be used only where no other solution is possible. See Section 7.03.3 for additional information. Longitudinal drains should be placed only along the sides or median of a roadway. They should not be used between travel lanes.

TDOT DESIGN DIVISION DRAINAGE MANUAL September 10, 2013
7-84
7.04.7.5 GORE AREAS
A special case of the situation described in the previous section is where multiple lanes of a freeway or other limited-access facility drain onto a gore area. If runoff from the travel lanes and gore area flows across the adjacent ramp, the accumulated water depth may be sufficient to create an increased hazard to accelerating or decelerating traffic. In this situation, the gore areas should be provided with trench drain in order to intercept the runoff before it reaches the ramp. The gore may be provided with a gentle “V”-shaped cross section in order to facilitate the flow of water into the trench drain. 7.04.8 PIPE SEPARATION COMPUTATIONS FOR CIRCULAR STRUCTURES
Section 7.03.5.5 and Tables 7A-6 through 7A-11 provide criteria for minimum deflection angles for multiple pipe connections at roughly equal elevations to a circular catch basin or manhole. However, where pipes are connected at significantly different elevations, this criteria may be too conservative. The purpose of these minimum deflection angles is to provide adequate wall space between pipes to insure the structural integrity of the manhole. Thus, when pipes are connected at different elevations, the computation of the wall distance between them may include both vertical and the horizontal separation distances.
The underlying concept of this computation may be pictured as “unrolling” the round structure to create a flat surface as shown on Figure 7A-8 of the Appendix. This will cause the circular cut-outs for the round pipe connections to be stretched into elliptical shapes. The minor axis (a) of each elliptical shape will be in the vertical direction and will correspond to half of the diameter of the cut-out hole for the pipe. The major axis of each ellipse (b) will be in the horizontal direction, and will correspond to half of the elongated width of the cut-out hole. The minimum wall space between any two elliptical cut-outs is then computed based on the distance between the centers of the cut-outs and the sizes of the two ellipses.
The following procedure may be followed to make these computations:
Step 1: Measure the horizontal angle, Φ, at which each of the pipes enters the round structure. The centerline of the outlet pipe may be set as zero degrees. The angles of the other pipes would then be measured with respect to the outlet pipe.
Step 2: Determine the size of cut-out hole for each connecting pipe based on the information provided on the TDOT Standard Drawing which applies to the catch basin or manhole being checked.
Step 3: Determine coordinates for the centers of cut-outs on the flattened surface of the round structure. The x-coordinate will correspond to the horizontal distance along the structure wall from the center of the outfall pipe. The y-coordinate will correspond to the elevation of the center of the cut-out.
The x-coordinate may be determined as:
2
imhi Dx
Φ= (7-78)

TDOT DESIGN DIVISION DRAINAGE MANUAL September 10, 2013
7-85
Where: xi = x-coordinate of the center of the cutout, (ft) Dmh = inside diameter of the drainage structure, (ft) Φi = angle of pipe “i” with respect to the outlet pipe, (radians)
The y-coordinate may be determined as:
2
iii
DInvy += (7-79)
Where: yi = elevation of the center of the cut-out, (ft)
Invi = invert elevation of pipe “i” as it enters the structure, (ft) Di = diameter of pipe “i”, (ft)
Step 4: Determine the dimensions of the ellipse formed by the cut-out on the flat
surface. The minor axis, a (in feet), will be equal to the radius of the cutout, and the major axis may be found as:
= −
mh
imhDD
sinD
b 12
(7-80)
Where: b = length of the major axis, (ft)
Dmh = inside diameter of the drainage structure, (ft) Di = diameter of cutout “i”, (ft) The angle returned by the inverse sine function should be in radians.
Step 5: Compute the distance between the centers of two adjacent cut-outs, Lc, as:
( ) ( )( ) 5021
21
.iiiic xxyyL ++ −+−= (7-81)
Where: yi, xi = center coordinates of a cutout, (ft)
yi+1, xi+1 = center coordinates of the next adjacent cutout, (ft)
Step 6: Compute the angle, θ, formed between a line connecting the centers of the cut-outs and a horizontal line as:
−−
=+
+−
ii
iixxyy
1
11tanθ (7-82)
Step 7: The distance from the center of the ellipse to the edge of the ellipse, r, is a
function of the size of the cut-out and the angle, θ, computed in Step 6. For any pipes “i” and “i+1” connected to the structure, compute ri and ri+1 as:
( ) ( )
50
22
22 .
ii
iii
cosbsina
bar
+=
θθ (7-83)
TDOT DESIGN DIVISION DRAINAGE MANUAL September 10, 2013
7-86
Where: ai = minor axis of the ellipse for pipe “i”, (ft) bi = major axis of the ellipse for pipe “i”, (ft)
The distance ri+1 should be computed using the same formula.
Step 8: The minimum wall space between the two cut-outs, Dw, will be:
1+−−= iicw rrLD (7-84)
Step 9: The process is carried out for each set of adjacent pipes that may be connected around the structure. When computing the space between the last pipe and the outflow pipe, the angle Φ for the outlet pipe may be set to 360° (or 2π radians).
If the wall space between any two adjacent pipes does not meet the standards provided in Section 7.03.5.5, the design of the structure should be modified by increasing the diameter of the structure or by adjusting the elevations of the connecting pipes.

TDOT DESIGN DIVISION DRAINAGE MANUAL September 10, 2013
7-87
SECTION 7.05 - ACCEPTABLE SOFTWARE
The computer applications for stormwater drainage design described in this section may be used for the hydraulic analysis and design of many aspects of a drainage system. Although a variety of proprietary software packages are also available, including the program GEOPAK, the Tennessee Department of Transportation does not warrant the results that may be obtained from these computer programs. The evaluation of the results given by any specific computer program and the resulting drainage design are entirely the responsibility of the user.
The designer is advised that no computer method is completely reliable, and the results from any software package should be carefully evaluated. A clear understanding of the various hydraulic methods involved in drainage design is therefore necessary to successfully apply any of these programs. The software packages described below should be used unless special circumstances on the project require other software. The TDOT Design Manager should approve the use of any other software for these special circumstances. 7.05.1 GEOPAK DRAINAGE
Roadway drainage design capabilities provided by GEOPAK Drainage include analysis of gutter flows, slotted drains, and curb and grate inlets both on grade and at a sump. Inlet designs can utilize a user-specified library of standard inlet sizes to determine the most suitable design for a given set of constraints. Design or analysis of Inlets may also include bypass flows between inlets, including bypass flows between inlets in different networks.
GEOPAK Drainage offers a wide variety of analysis features, including:
• hydraulic performance of grates (on grade or at a sump) • hydraulic performance of curb inlets (on grade or at a sump) • hydraulic performance of slotted drains (on grade or at a sump) • depth and spread computations for ponded water • bypass and carry over flows • composite gutter sections • gutter geometry extraction from roadway design files • headwalls • structure inverts • inlet computations based on a constant rainfall intensity option • a drainage library which includes many standard inlet types • inlet spread computations based on an iterative procedure derived from HEC-12
7.05.2 VISUAL URBAN
Visual Urban is a simple Public Domain software package which implements the methods discussed in the FHWA document HEC-22. It is a menu-driven Windows-based program and offers the following capabilities:
• gutter flow computations for uniform and compound gutter cross sections • inlet interception computations for gutter inlets and inlets at sag points, using the
various inlet configurations discussed in HEC-22

TDOT DESIGN DIVISION DRAINAGE MANUAL September 10, 2013
7-88
• computation of uniform flow depth, velocity and critical depth for rectangular and trapezoidal open channels as well as round pipes
• simple reservoir routing computations by the Storage-Indication Method

TDOT DESIGN DIVISION
DRAINAGE MANUAL
CHAPTER VII APPENDIX 7A

TDOT DESIGN DIVISION DRAINAGE MANUAL
August 1, 2012
7A-1
SECTION 7.06 - APPENDIX
7.06.1 FIGURES AND TABLES

TDOT DESIGN DIVISION DRAINAGE MANUAL
August 1, 2012
7A-2
Figure 7A-1
Inlet Spacing on Continuous Slopes

TDOT DESIGN DIVISION DRAINAGE MANUAL
August 1, 2012
7A-3
Figure 7A-2
Curb and Gutter Inlet Interception

TDOT DESIGN DIVISION DRAINAGE MANUAL
August 1, 2012
7A-4
Figure 7A-3
Inlet Performance in a Sump Condition

TDOT DESIGN DIVISION DRAINAGE MANUAL
August 1, 2012
7A-5
Figure 7A-4
Design Discharge for Storm Sewer Pipe Sizing

TDOT DESIGN DIVISION DRAINAGE MANUAL
August 1, 2012
7A-6
Figure 7A-5
Storm Sewer Pipe Capacity

TDOT DESIGN DIVISION DRAINAGE MANUAL
August 1, 2012
7A-7
Figure 7A-6 Area Drain Performance in Sump Conditions for a Clogging Factor of 50%
Depth (feet)
Dis
ch
arg
e (
cfs
)

TDOT DESIGN DIVISION DRAINAGE MANUAL
August 1, 2012
7A-8
Figure 7A-7
Area Drain Performance in Sump Conditions for a Clogging Factor of 50%
Depth (feet)
Dis
ch
arg
e (
cfs
) D
isch
arg
e (
cfs
)

TDOT DESIGN DIVISION DRAINAGE MANUAL
August 1, 2012
7A-9
Figure 7A-8 Definition Sketch for Pipe Separation in Circular Storm Structures

TDOT DESIGN DIVISION DRAINAGE MANUAL
August 1, 2012
7A-10
Figure 7A-9 Flow in Triangular Gutter Sections
Reference: USDOT, FHWA, HEC-12 (1984)

TDOT DESIGN DIVISION DRAINAGE MANUAL
August 1, 2012
7A-11
Figure 7A-10 Capacity Chart for Part-Full Flow in Circular Pipes
Reference: Nashville SWMM (1988)

TDOT DESIGN DIVISION DRAINAGE MANUAL
August 1, 2012
7A-12
Figure 7A-11 Velocity Chart for Part-Full Flow in Circular Pipes
Reference: Nashville SWMM (1988)
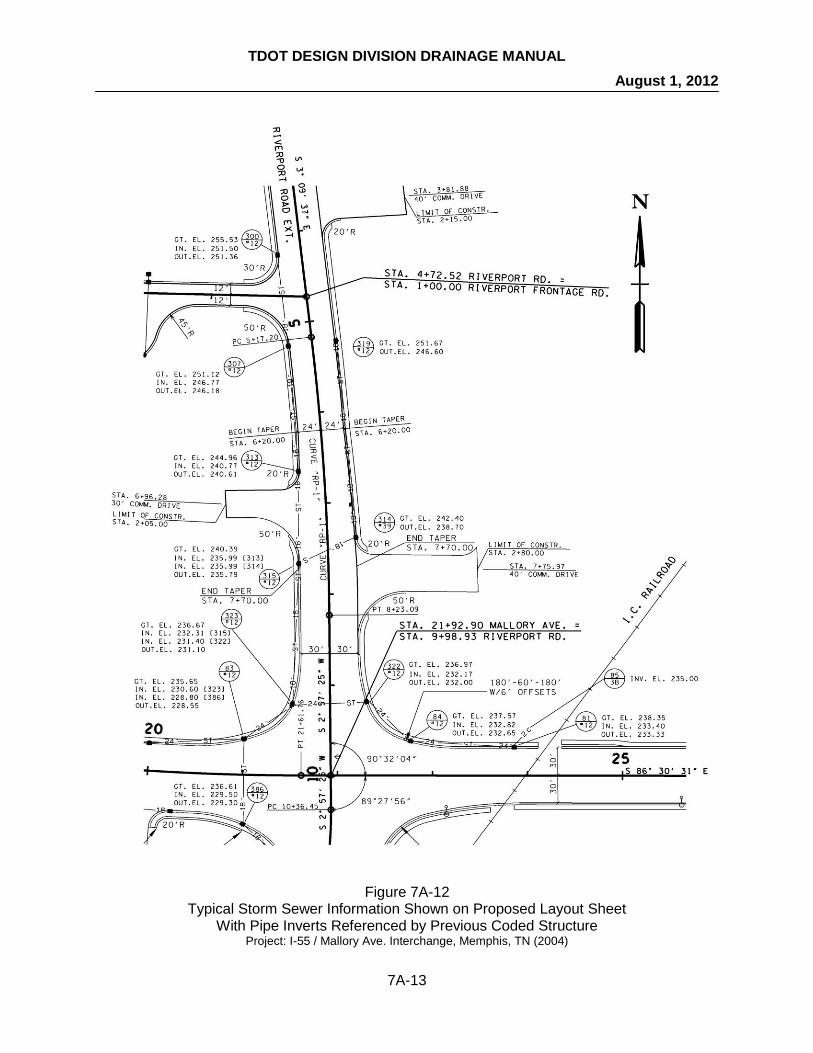
TDOT DESIGN DIVISION DRAINAGE MANUAL
August 1, 2012
7A-13
Figure 7A-12
Typical Storm Sewer Information Shown on Proposed Layout Sheet With Pipe Inverts Referenced by Previous Coded Structure
Project: I-55 / Mallory Ave. Interchange, Memphis, TN (2004)

TDOT DESIGN DIVISION DRAINAGE MANUAL
August 1, 2012
7A-14
Figure 7A-13 Typical Storm Sewer Information Shown on Proposed Layout Sheet
With Pipe Inverts Referenced by Compass Direction Project: I-55 / Mallory Ave. Interchange, Memphis, TN (2004)

TDOT DESIGN DIVISION DRAINAGE MANUAL
August 1, 2012
7A-15
Figure 7A-14 Typical Storm Sewer Information Shown on Profile Sheet
Project: I-55 / Mallory Ave. Interchange, Memphis, TN (2004)

TDOT DESIGN DIVISION DRAINAGE MANUAL
August 1, 2012
7A-16
SECTION WITH A 6-FOOT SHOULDER
Depth (feet)
Spread (feet)
Area (sf)
Conveyance, Kt
0.03 0.40 0.01 0.05
0.07 0.80 0.03 0.31
0.10 1.20 0.06 0.91
0.14 1.60 0.11 1.96
0.17 2.00 0.17 3.55
0.21 3.00 0.27 5.92
0.25 4.00 0.41 9.84
0.29 5.00 0.59 15.61
0.33 6.00 0.81 23.49
0.37 7.00 1.07 33.75
0.41 8.00 1.37 46.67
0.45 10.00 1.73 59.58
0.50 12.50 2.29 82.35
0.55 15.00 2.98 113.16
0.60 17.50 3.79 152.85
Table 7A-1 Conveyance, Spread, and Flow Area for Standard Gutter Sections

TDOT DESIGN DIVISION DRAINAGE MANUAL
August 1, 2012
7A-17
SECTION WITH AN 8-FOOT SHOULDER
Depth (feet)
Spread (feet)
Area (sf)
Conveyance, Kt
0.03 0.40 0.01 0.05
0.07 0.80 0.03 0.31
0.10 1.20 0.06 0.91
0.14 1.60 0.11 1.96
0.17 2.00 0.17 3.55
0.22 3.33 0.31 7.04
0.28 4.67 0.53 13.47
0.33 6.00 0.81 23.49
0.38 7.33 1.17 37.75
0.44 8.67 1.59 56.87
0.49 10.00 2.09 81.43
0.55 13.00 2.78 110.46
0.60 15.50 3.49 144.04
Table 7A-2 Conveyance, Spread, and Flow Area for Standard Gutter Sections

TDOT DESIGN DIVISION DRAINAGE MANUAL
August 1, 2012
7A-18
SECTION WITH A 10-FOOT SHOULDER
Depth (feet)
Spread (feet)
Area (sf)
Conveyance,
Kt
0.03 0.40 0.01 0.05
0.07 0.80 0.03 0.31
0.10 1.20 0.06 0.91
0.14 1.60 0.11 1.96
0.17 2.00 0.17 3.55
0.24 3.67 0.36 8.34
0.30 5.33 0.66 17.98
0.37 7.00 1.07 33.75
0.44 8.67 1.59 56.87
0.50 10.33 2.23 88.48
0.57 12.00 2.97 129.65
0.60 13.50 3.35 146.97
Table 7A-3 Conveyance, Spread, and Flow Area for Standard Gutter Sections

TDOT DESIGN DIVISION DRAINAGE MANUAL
August 1, 2012
7A-19
SECTION WITH NO SHOULDER OR SHOULDER AT 2%
Depth (feet)
Spread (feet)
Area (sf)
Conveyance,
Kt
0.03 0.40 0.01 0.05
0.07 0.80 0.03 0.31
0.10 1.20 0.06 0.91
0.14 1.60 0.11 1.96
0.17 2.00 0.17 3.55
0.20 3.50 0.25 4.81
0.25 6.00 0.49 10.25
0.30 8.50 0.85 20.54
0.35 11.00 1.34 36.84
0.40 13.50 1.95 60.28
0.45 16.00 2.69 91.91
0.50 18.50 3.55 132.73
0.55 21.00 4.54 183.68
0.60 23.50 5.65 245.66
Table 7A-4 Conveyance, Spread, and Flow Area for Standard Gutter Sections

TDOT DESIGN DIVISION DRAINAGE MANUAL
August 1, 2012
7A-20
6-FOOT SHOULDER AT 1%
Depth (feet)
Spread (feet)
Area (sf)
Conveyance, Kt
0.03 0.40 0.01 0.05
0.07 0.80 0.03 0.31
0.10 1.20 0.06 0.91
0.14 1.60 0.11 1.96
0.17 2.00 0.17 3.55
0.18 3.00 0.20 3.46
0.19 4.00 0.23 3.79
0.20 5.00 0.28 4.42
0.21 6.00 0.33 5.33
0.22 7.00 0.40 6.50
0.23 8.00 0.47 7.96
Water above 0.23 feet deep will overflow the shoulder and flow across the roadway.
TABLE 7A-5 Conveyance, Spread, and Flow Area for Standard Gutter Sections (High Side)

TDOT DESIGN DIVISION DRAINAGE MANUAL
August 1, 2012
7A-21
Connecting Pipe Size (RCP)
18” 24” 30” 36” 42” 48” 54” 60” 66” 72” 78” C
on
nec
tin
g P
ipe S
ize
(R
CP
)
18” 38 41 45 48 52 56 60 64 68 74 78
24” 47 51 54 58 62 66 70 74 79 84
30” 59 62 66 70 74 78 82 87 92
36” 69 73 77 80 85 89 94 99
42” 80 84 88 92 96 101 106
48” 91 95 99 103 109 113
54” 102 106 111 116 121
60” 114 118 124 128
66” 126 131 136
72” 141 145
78” 153
Table 7A-6 Minimum Pipe Deflection Angles in Degrees
120 Inch Diameter Structure
Connecting Pipe Size (RCP)
18” 24” 30” 36” 42” 48” 54” 60” 66” 72”
Co
nn
ec
tin
g P
ipe S
ize
(R
CP
) 18” 42 45 50 54 58 62 67 72 77 84
24” 52 56 60 65 69 74 78 84 91
30” 65 69 73 78 82 87 93 100
36” 77 81 86 90 95 100 107
42” 89 94 98 103 108 115
48” 102 106 111 117 124
54” 115 120 125 132
60” 128 134 141
66” 143 150
72” 161
Table 7A-7 Minimum Pipe Deflection Angles in Degrees
108 Inch Diameter Structure

TDOT DESIGN DIVISION DRAINAGE MANUAL
August 1, 2012
7A-22
Connecting Pipe Size (RCP)
18” 24” 30” 36” 42” 48” 54” 60” 66” C
on
nec
tin
g P
ipe S
ize
(R
CP
)
18” 47 51 56 61 66 71 77 83 90
24” 59 64 68 73 78 84 90 97
30” 74 78 83 88 94 100 107
36” 87 92 97 103 109 116
42” 101 106 112 118 125
48” 116 121 128 135
54” 131 138 145
60” 148 155
66” 167
Table 7A-8 Minimum Pipe Deflection Angles in Degrees
96 Inch Diameter Structure
Connecting Pipe Size (RCP)
18” 24” 30” 36” 42” 48” 54” 60”
Co
nn
ec
tin
g P
ipe S
ize
(RC
P)
18” 54 59 65 70 76 83 90 99
24” 67 73 79 85 91 98 107
30” 85 90 96 103 110 119
36” 101 107 113 121 130
42” 117 124 131 140
48” 135 143 152
54” 155 164
60” 178
Table 7A-9 Minimum Pipe Deflection Angles in Degrees
84 Inch Diameter Structure

TDOT DESIGN DIVISION DRAINAGE MANUAL
August 1, 2012
7A-23
Connecting Pipe Size (RCP)
18” 24” 30” 36” 42” 48”
Co
nn
ec
tin
g P
ipe
Siz
e (
RC
P)
18” 65 70 77 84 92 101
24” 79 86 94 102 111
30” 100 107 115 124
36” 119 127 136
42” 141 150
48” 165
Table 7A-10 Minimum Pipe Deflection Angles in Degrees
72 Inch Diameter Structure
Connecting Pipe Size (RCP)
18” 24” 30” 36”
Co
nn
ec
tin
g
Pip
e S
ize
(RC
P)
18” 78 84 94 102
24” 96 106 115
30” 123 133
36” 150
Table 7A-11 Minimum Pipe Deflection Angles in Degrees
60 Inch Diameter Structure
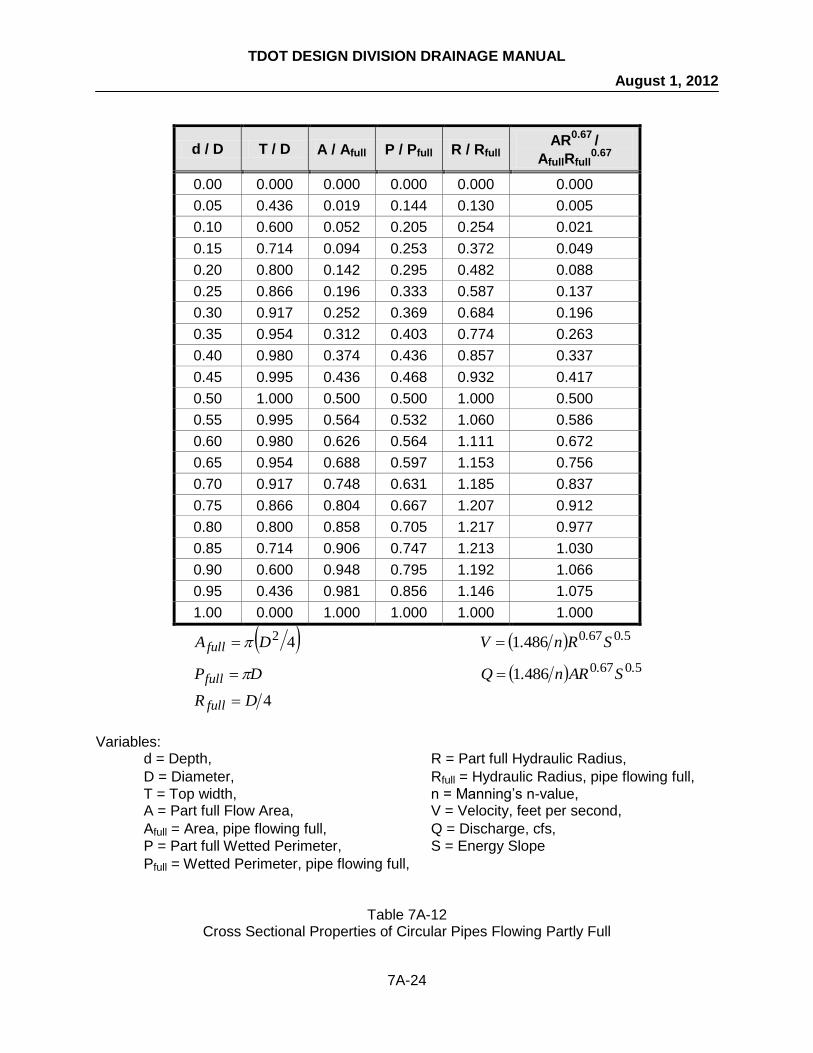
TDOT DESIGN DIVISION DRAINAGE MANUAL
August 1, 2012
7A-24
d / D T / D A / Afull P / Pfull R / Rfull AR
0.67 /
AfullRfull0.67
0.00 0.000 0.000 0.000 0.000 0.000
0.05 0.436 0.019 0.144 0.130 0.005
0.10 0.600 0.052 0.205 0.254 0.021
0.15 0.714 0.094 0.253 0.372 0.049
0.20 0.800 0.142 0.295 0.482 0.088
0.25 0.866 0.196 0.333 0.587 0.137
0.30 0.917 0.252 0.369 0.684 0.196
0.35 0.954 0.312 0.403 0.774 0.263
0.40 0.980 0.374 0.436 0.857 0.337
0.45 0.995 0.436 0.468 0.932 0.417
0.50 1.000 0.500 0.500 1.000 0.500
0.55 0.995 0.564 0.532 1.060 0.586
0.60 0.980 0.626 0.564 1.111 0.672
0.65 0.954 0.688 0.597 1.153 0.756
0.70 0.917 0.748 0.631 1.185 0.837
0.75 0.866 0.804 0.667 1.207 0.912
0.80 0.800 0.858 0.705 1.217 0.977
0.85 0.714 0.906 0.747 1.213 1.030
0.90 0.600 0.948 0.795 1.192 1.066
0.95 0.436 0.981 0.856 1.146 1.075
1.00 0.000 1.000 1.000 1.000 1.000
42DA full 506704861 .. SRn.V
DPfull 506704861 .. SARn.Q
4DR full
Variables: d = Depth, R = Part full Hydraulic Radius,
D = Diameter, Rfull = Hydraulic Radius, pipe flowing full,
T = Top width, n = Manning’s n-value, A = Part full Flow Area, V = Velocity, feet per second,
Afull = Area, pipe flowing full, Q = Discharge, cfs,
P = Part full Wetted Perimeter, S = Energy Slope
Pfull = Wetted Perimeter, pipe flowing full,
Table 7A-12 Cross Sectional Properties of Circular Pipes Flowing Partly Full
TDOT DESIGN DIVISION DRAINAGE MANUAL
August 1, 2012
7A-25
7.06.2 EXAMPLE PROBLEMS 7.06.2.1 EXAMPLE PROBLEM #1: INLET SPACING ON CONTINUOUS GRADE GIVEN: An urban roadway is being designed with a typical cross section determined from the TDOT Standard Drawings. The project is located in Region 3, near Nashville. Starting from the crown of the roadway, the cross section to be drained on one side of the roadway includes half of the 18-foot median, two 12-foot lanes, an 8-foot shoulder, a 2-foot gutter and a sidewalk section 5 feet wide for a total width of 48 feet. Other data regarding the roadway are as follows: Gutter Manning’s n-value = 0.016
Longitudinal Slope, SL = 1 %
Shoulder cross slope = 4 % Gutter cross slope = 0.085 ft/ft High point in the profile is located at Station 22+00 Maximum inlet spacing = 400 feet Inlet Type = TDOT Number 12 catch basins FIND: Determine the distance from the profile high point to the first inlet. Then compute the required spacing for the remaining inlets on the roadway, assuming that the slope will remain a constant 1.0%. SOLUTION: As discussed in Section 7.03.3.7, the spread on the roadway in the 10-year storm event should be used to determine inlet spacing. This sample problem utilizes a number of procedures described in Section 7.04.3 and 7.04.4. The completed worksheets for inlet spacing and inlet interception are shown in Figures 7A-15 and 7A-16. Step 1: Since inlet spacing is based upon the allowable spread of flow on the roadway, it is first necessary to determine the maximum spread allowed on the facility being designed. As discussed in Section 7.03.3.7, the allowable spread is usually 8 feet. Based upon interpolation from Table 7A-2, a spread of 8 feet corresponds to a depth at the curb of approximately 0.41
feet, and a flow area of 1.38 ft2. Since this is not greater than the curb height, a spread of up to
8 feet will be allowed for this design. Step 2: To determine the flow rate which corresponds to an 8 foot spread, it is first necessary to determine the total conveyance of the gutter for that spread. Interpolating from Table 7A-2, a
“table” conveyance value, Kt, of 47.31 is found for a spread of 8 feet. Since this corresponds to
a Manning’s n-value of 0.013, the actual conveyance value, K, for an n-value of 0.016 is determined from Equation 7-6 as:
TDOT DESIGN DIVISION DRAINAGE MANUAL
August 1, 2012
7A-26
44.38016.0
013.031.47
013.0
act
tn
KK
The flow rate, Q, may then be computed from Equation 7-2 as:
84.3010.044.38 5.05.0 lKSQ cfs
Step 3: To determine the distance from the beginning of the profile to the first inlet, it is
necessary to determine the drainage area corresponding to a discharge of 3.84 ft3/s. Since this
is the first inlet in the profile, it is not necessary to consider any upstream bypass flow. Further, since no off-site flow enters the project in this area, it is possible to rewrite Equation 7-33 as:
iACQ rr which, may be re-arranged to iC
QA
rr
Where: Cr = roadway runoff coefficient, (dimensionless)
Ar = area contributing runoff to the site, (acres)
i = rainfall intensity, (in/hr) Using the procedures described in Chapter 4, a runoff coefficient of 0.85 is selected for the roadway. Further from Chapter 4, the 10-year, 5-minute rainfall intensity is determined to be approximately 6.78 in/hr. Thus, the above equation becomes:
6660786850
843.
..
.
iC
QA
r
r acres
Thus, to determine the distance to the first inlet, Equation 7-26 may be rewritten as:
x
rr
W
AL
43560
Where: Lr = length to the inlet, (feet)
Ar = area contributing runoff, (acres)
Wx = width of the roadway
Thus,
60448
66604356043560
.
W
AL
x
rr feet
Thus, the first inlet would be placed at Station 28+04.
TDOT DESIGN DIVISION DRAINAGE MANUAL
August 1, 2012
7A-27
Step 4: Because this distance is comparatively long, it becomes prudent to check whether the flow time to the grate will exceed 5 minutes, which corresponds to a rainfall intensity of 6.78 in/hr. To determine the total flow time, the flow path is broken into two parts: sheet flow from the crown to the gutter, and gutter flow from the top of the profile to the inlet location. The sheet flow time is computed using the Kinematic Wave Method described in Chapter 4 as follows:
3040
6060
..
..
tSi
LnCt
Where: tt = sheet flow travel time, (minutes)
C = constant equal to 0.938, (dimensionless) n = Manning’s n-value for the surface sheet flow L = flow length, (feet) i = rainfall intensity, (in/hr) S = longitudinal slope, (ft/ft) Since the majority of the flow path will be over asphalt, an n-value of 0.012 is selected from Chapter 4. The length from the crown of the roadway to the gutter flow line is 43 feet. Since the fall over this distance is 1.15 feet, the average slope is 0.027 ft/ft. The rainfall intensity is usually determined from the IDF-curve which applies to the site and is thus a function of the time of travel. Since the expected result for flow time will be less than 5 minutes, the maximum rainfall intensity value of approximately 6.78 in/hr will be used at this location. Thus the equation becomes:
8700270786
4301209380
3040
6060
3040
6060
...
..
Si
LnCt
..
..
..
..
t minutes
The velocity of flow in the gutter is then computed from Equation 4-10:
67150671121 ...
x TSShn
.V
Where: V = flow velocity, (ft/sec) n = gutter Manning’s n-value h = depth of flow in the gutter at the curb, (feet)
Sx = roadway cross slope, (ft/ft)
S = longitudinal slope, (ft/ft) T = top width, (feet) It is noted that this equation is normally applied only where the gutter has a uniform cross slope. Although this problem represents a compound cross slope, this equation is applied here as an approximate solution. An average cross slope of 0.063 ft/ft will be used in the above equation. It is also noted that the spread of flow on the roadway is not constant over the entire

TDOT DESIGN DIVISION DRAINAGE MANUAL
August 1, 2012
7A-28
distance and will be 8 feet only at the inlet. Thus, an average spread value of 4 feet is assumed for the flow from the profile high point to the inlet location. This corresponds to a curb depth of 0.25 feet. Thus, the equation becomes:
80204010006302500160
121 67150671 ......
.V ...
ft/sec
Flow time in the gutter may then be computed from Equation 4-3 as:
40.380.260
572
60
V
Ltt minutes
Thus, the total travel time is 274403870 ... minutes. Since this is less than 5
minutes, the assumed rainfall intensity of 7.17 in/hr will be acceptable. Step 5: The process of determining the quantity of flow intercepted by the inlet begins by
computing the quantity of frontal flow, Qf. The depth of flow, y, and the cross section
conveyance, K, at the inlet are already known, and the effective width of a Type B grate is about
21 inches, or 1.75 feet. Thus, Equation 7-11 for the area of frontal flow, Af, becomes:
587.02
085.075.141.0275.1
2
2
g
f
wSywA ft2
The wetted perimeter of the frontal flow, Pf, is computed from Equation 7-12 as:
16.275.141.0 wyPf feet
The unadjusted conveyance of the subsection in front of the grate, Ku, is computed from
Equation 7-13 as:
8722
0160
162
5870587048614861
66706670
..
.
...
n
P
AA.
K
..
f
ff
u
Equation 7-14 indicates that the actual conveyance of the frontal flow, Kf, is computed
as 4419850 .K. u . Thus, the quantity of frontal flow is computed from Equation 7-15 as:
94.144.38
44.1984.3
K
KQQ
f
f cfs
Step 6:
As discussed in Section 7.04.4.1.1, the splash-over velocity, Vo, for a Type B grate is 7.6
ft/sec. The frontal flow velocity is computed from Equation 7-16 as:

TDOT DESIGN DIVISION DRAINAGE MANUAL
August 1, 2012
7A-29
3135870
941.
.
.
A
QV
f
ff ft/sec
Since Vf is less than the splash-over velocity, the ratio of frontal flow intercepted, Rf,
would be greater than 1.0, as computed by Equation 7-17. Thus, 100% of the frontal flow will be
intercepted, and 941.Q fi cfs.
Step 7:
The quantity of side flow, Qs, is computed from Equation 7-19 as:
90.194.184.3 fs QQQ cfs
The side flow area, As, is computed from Equation 7-20 as:
79.059.038.1 fs AAA ft2
The side flow velocity, Vs, is then computed from Equation 7-21 as:
41.279.0
90.1
s
s
sA
QV ft/sec
The ratio of side flow intercepted, Rs, is then computed from Equation 7-22 as:
479.0
04.304.0
41.215.01
1
15.01
1
3.2
5.1
3.2
5.1
LS
VR
x
s
s
Thus, the side flow intercepted, Qsi, is computed from Equation 7-23 as:
91.090.1479.0 sssi QRQ cfs
Step 8:
The total flow intercepted by the inlet, Qi, is computed from Equation 7-24 as:
85.291.094.1 sifii QQQ cfs
and the bypass flow, Qb, is computed from Equation 7-25 as:
990852843 ...QQQ ib cfs
Step 9: To determine the distance to the next inlet, Equation 7-27 is written again, accounting for the upstream bypass flows (but not off-site flows):
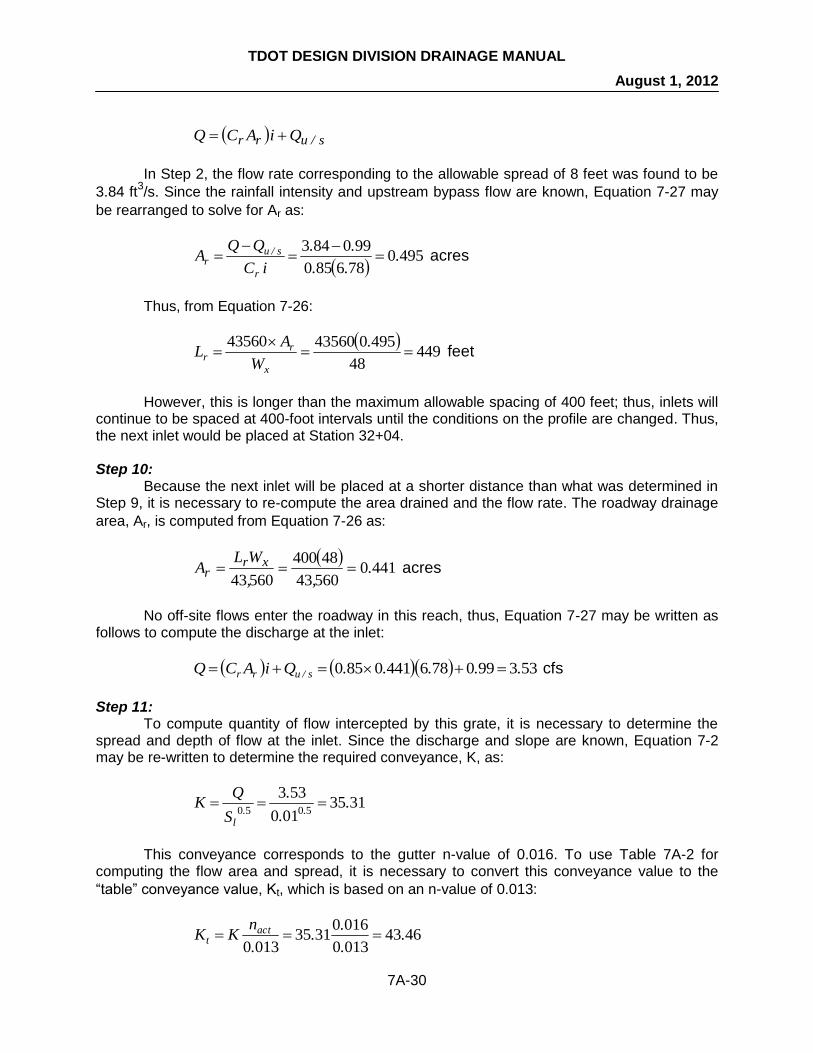
TDOT DESIGN DIVISION DRAINAGE MANUAL
August 1, 2012
7A-30
s/urr QiACQ
In Step 2, the flow rate corresponding to the allowable spread of 8 feet was found to be
3.84 ft3/s. Since the rainfall intensity and upstream bypass flow are known, Equation 7-27 may
be rearranged to solve for Ar as:
4950786850
990843.
..
..
iC
QQA
r
s/ur
acres
Thus, from Equation 7-26:
44948
49504356043560
.
W
AL
x
rr feet
However, this is longer than the maximum allowable spacing of 400 feet; thus, inlets will continue to be spaced at 400-foot intervals until the conditions on the profile are changed. Thus, the next inlet would be placed at Station 32+04. Step 10: Because the next inlet will be placed at a shorter distance than what was determined in Step 9, it is necessary to re-compute the area drained and the flow rate. The roadway drainage
area, Ar, is computed from Equation 7-26 as:
441056043
48400
56043.
,,
WLA xr
r acres
No off-site flows enter the roadway in this reach, thus, Equation 7-27 may be written as follows to compute the discharge at the inlet:
5339907864410850 .....QiACQ s/urr cfs
Step 11: To compute quantity of flow intercepted by this grate, it is necessary to determine the spread and depth of flow at the inlet. Since the discharge and slope are known, Equation 7-2 may be re-written to determine the required conveyance, K, as:
3135010
5335050
..
.
S
QK
..l
This conveyance corresponds to the gutter n-value of 0.016. To use Table 7A-2 for computing the flow area and spread, it is necessary to convert this conveyance value to the
“table” conveyance value, Kt, which is based on an n-value of 0.013:
46430130
01603135
0130.
.
..
.
nKK act
t

TDOT DESIGN DIVISION DRAINAGE MANUAL
August 1, 2012
7A-31
Interpolating Kt from Table 7A-2 yields a spread of 7.73 feet, a depth of 0.40 feet, and a
flow area of 1.30 ft2. The process of determining the quantity of flow intercepted by the grate is
identical the process described in Steps 5 through 8. Thus, details of these computations are not presented here; rather the results are shown in Figures 7A-15 and 7A-16. Step 12: A portion of a small residential development drains onto the roadway about 150 feet downstream from the second inlet. This area contains 0.62 acres of moderately steep residential land use and thus may be assigned a runoff coefficient of 0.65, based on Table values in Chapter 4. The computed time of concentration for this area is 15 minutes, which yields a 10-year rainfall intensity of 4.57 in/hr.
Since the profile slope is still 1%, a flow rate of 3.84 ft3/s still corresponds to the
allowable spread of 8 feet which was computed in Step 2. To determine the location of the next inlet, Equation 7-27 is rewritten to solve for the area of roadway to be drained as:
2850
850
620650574
840843
..
...
..
C
ACi
Ar
oos/u
r
acres
Note that the rainfall intensity used in this computation corresponds to a 15 minute time of concentration. As described in Step 3, the length of roadway corresponding to this area is 258 feet. Thus, the next inlet would be placed at Station 34+62. The results of the computations for the interception of this inlet are shown in Figures 7A-15 and 7A-16.

TDOT DESIGN DIVISION DRAINAGE MANUAL
August 1, 2012
7A-32
Figure 7A-15 Inlet Spacing Computation Results
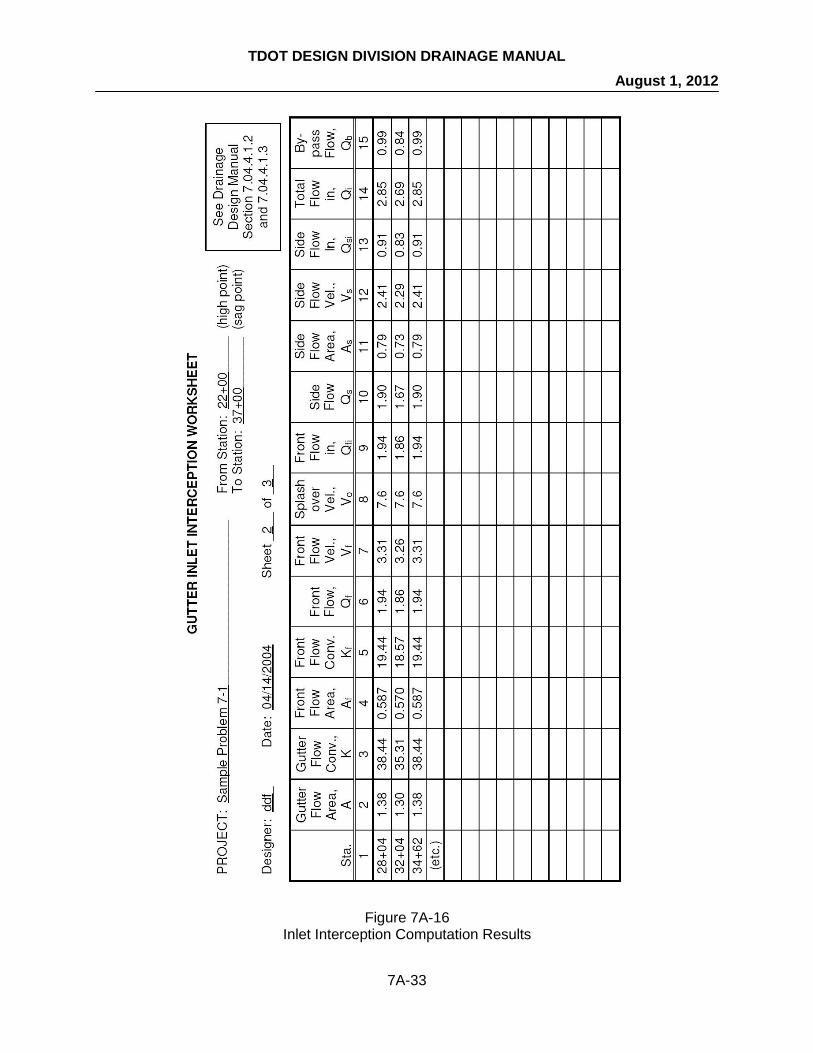
TDOT DESIGN DIVISION DRAINAGE MANUAL
August 1, 2012
7A-33
Figure 7A-16 Inlet Interception Computation Results

TDOT DESIGN DIVISION DRAINAGE MANUAL
August 1, 2012
7A-34
7.06.2.2 EXAMPLE PROBLEM #2: COMPUTATIONS FOR INLET AT SUMP LOCATION GIVEN: A suburban roadway located in is being designed with a typical cross section determined from the TDOT Standard Drawings. Starting from the crown of the roadway, the cross section to be drained on one side of the roadway includes half of the 18-foot median, two 12-foot lanes, an 8-foot shoulder, a 2-foot gutter and a sidewalk section 5 feet wide for a total width of 48 feet. The profile grade proposed for the roadway includes a vertical curve as follows: Curve Length, L = 280 feet PVI Station = 26+79.78 PVI Elevation = 601.18 feet Grade coming into the Curve, G1 = -1.81% Grade coming out of the Curve, G2 = +3.68% Vertical curve analysis indicates that the low point of the curve will be at Station 26+32.06 at an elevation of 602.88. Inlet spacing computations have been completed on both sides of this curve. The final inlet on grade coming into the curve will be located at Station 25+15. Interception analysis of
this inlet for the 50-year event indicates that the bypass flow will be equal to 1.02 ft3/s during the
design storm event. Coming out of the curve, the final inlet will be placed at Station 27+50. This inlet will have a bypass flow of 1.29 cfs. FIND: Determine the depth of ponding which will occur at a Type 14 catch basin to be placed at the low point of the sag and evaluate whether this level of ponding will be acceptable based upon an allowable spread of 8 feet. Determine the locations of the flanking inlets to be placed as a backup to the sump inlet as described in Section 7.03.3.2. SOLUTION: As described in Section 7.04.4.3, the depth at an inlet in a sump condition can be determined either by weir flow or by orifice flow. Thus, in order to evaluate the performance of an inlet at a sump, it is necessary to compute the depth of ponding which would occur for both flow types. The type of flow which results in the greater depth is the controlling depth. Step 1: Because bypass flows do not occur for an inlet in a sump condition, the flow rate at this catch basin will be the sum of the bypass flows from both of the adjacent on-grade inlets as well as any runoff from the roadway between those inlets. The area of the roadway between the
inlets, Ar, is computed from Equation 7-26:
56043,
WLA xr
r

TDOT DESIGN DIVISION DRAINAGE MANUAL
August 1, 2012
7A-35
Where: Lr = the length of the roadway drained
Wx = the width of the roadway drained
Since the only segment of the roadway between the final at-grade inlets on either side of the vertical curve will drain to the sump inlet, Equation 7-26 is written as:
259056043
4815255027.
,Ar
acres
From the methods described in Chapter 4, the runoff coefficient selected for the roadway is 0.85. The rainfall intensity, which is based upon a 5-minute time of concentration, is determined to be approximately 8.14 in/hr (see Chapter 4 for determining i-values). Thus, the total inflow to the inlet is:
104291021259014885050 ......Q cfs
Step 2:
Based on Table 7-8, the effective weir length, Leff, of a Type 14 catch basin inlet is 8.7
feet. Since it is assumed that blockage by debris will not be not be significant at this site, it is not necessary to adjust this length for a clogging factor. Step 3:
The depth of ponding for weir flow, hw, is determined from Equation 7-29 as:
3207862
104
62
66706670
...
.
L.
Qh
..
eff
w
feet
Step 4:
Based on Table 7-8, the effective opening area, Aeff, for a Type 14 catch basin inlet is
4.4 feet. Since it is assumed that blockage by debris will not be significant at this site, it is not necessary to adjust this length for a clogging factor. Step 5:
The depth of ponding for orifice flow, ho, is determined from Equation 7-31 as:
04044814
104
814
22
...
.
A.
Qh
eff
o
feet
Step 6: Since the depth of ponding at the inlet is greater for weir flow than for orifice flow, the controlling depth (or head, h) will be 0.32 feet. Step 7:

TDOT DESIGN DIVISION DRAINAGE MANUAL
August 1, 2012
7A-36
Based upon interpolation from Table 7A-2 in the Appendix, a depth of 0.32 feet corresponds to a spread of 5.73 feet on the roadway. Since this is less than the allowable spread of 8 feet, the performance of the catch basin will be adequate. Step 8: Flanking inlets are added to the system as described in Section 7.03.3.2. To determine where these inlets are to be placed it is first necessary to compute the vertical curve constant, K, for this curve from Equation 7-1:
051811683
280
12.
..GG
LK
Since the computed value of K is less than 125, the minimum profile slope of 0.4% will be maintained to within 50 feet of the low point in the curve, as described in Section 7.03.1.1. Based upon linear interpolation from Table 7-2, it is determined that the flanking inlets should be placed 34.7 feet on either side of the inlet at the sump point. Since the low point in the profile occurs at Station 26+32.09, one flanking inlet will be placed at Station 25+97.4 and the other at 26+66.8. Vertical curve analysis indicates that the profile grade elevation at both of these inlets will be 602.99 feet. Thus, these inlets will be at an elevation 0.11 feet higher than the inlet at the low point in the profile. This means that the depth at the flanking inlets will be 0.20 feet, which is 63 percent of the depth of 0.31 feet at the sump. Figure 7A-17 provides a sample of the completed worksheet for the performance of the inlet in a sump condition.
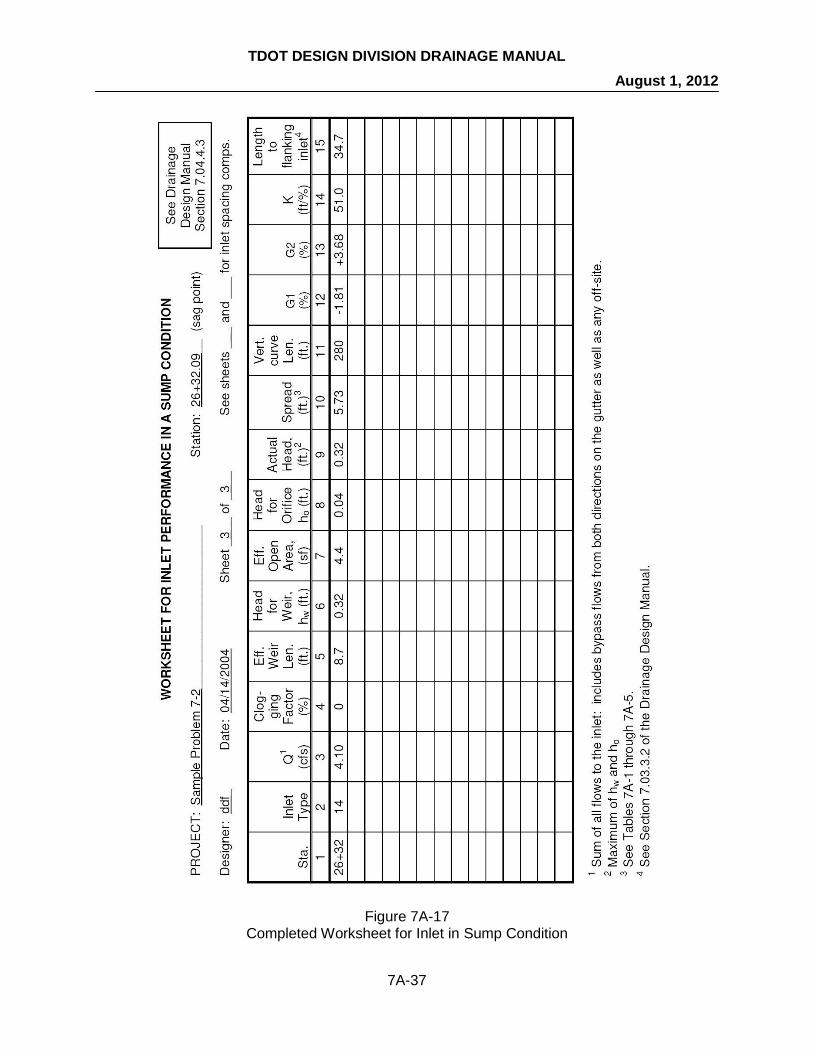
TDOT DESIGN DIVISION DRAINAGE MANUAL
August 1, 2012
7A-37
Figure 7A-17 Completed Worksheet for Inlet in Sump Condition

TDOT DESIGN DIVISION DRAINAGE MANUAL
August 1, 2012
7A-38
7.06.2.3 EXAMPLE PROBLEM #3: STORM SEWER SYSTEM ANALYSIS GIVEN:
A new roadway is being designed in an urban area of east Tennessee. As shown in Figure 7A-18, the roadway cross section will include a center turn lane, two traffic lanes in each direction, and 8-foot shoulders with curb and gutter on both sides of the roadway. The total width on each side of the roadway centerline is 45.67 feet. In addition, 5-foot wide sidewalks draining toward the curb will be placed on both sides of the roadway. The proposed layout of the roadway is shown in Figure 7A-19, which also shows the proposed inlet locations. Structure #28 is a standard square No. 42 area drain which collects runoff from 2.65 acres of grass on other undeveloped areas. It will be connected to Structure #29 with a 23 foot long pipe segment. In addition, a 24 foot commercial driveway is located at Station 33+18 to provide access to a local business. This driveway slopes toward the roadway and conveys runoff to the road from 1.21 acres of developed land.
Figure 7A-18 Proposed Typical Roadway Section
For this example, the project will begin at Station 22+00 and end at Station 41+45. Additionally, stormwater runoff from beyond these points will not be collected by the proposed storm sewer system and will drain away from the area being analyzed. FIND: Determine the design flow rates, required pipe sizes and pipe invert elevations for the storm sewer system proposed for this roadway and shown in Figure 7A-19. SOLUTION: Sections 7.04.5.2 and 7.04.5.3 provide procedures which may be used in determining flow rates for storm sewer design and to compute the required pipe sizes and invert elevations. As discussed in Section 7.03.4.1, the pipe material will be reinforced concrete, which may be assigned a Manning’s n-value of 0.013. The minimum pipe size will be 18 inches, as specified

TDOT DESIGN DIVISION DRAINAGE MANUAL
August 1, 2012
7A-39
Figure 7A-19 Proposed Layout
for Example Problem #3

TDOT DESIGN DIVISION DRAINAGE MANUAL
August 1, 2012
7A-40
in Section 7.03.4.2. Because the flow rate computations are based on the Rational Method, it is first necessary to collect the appropriate Intensity-Duration-Frequency curve for the project. The following table depicts rainfall data determined for this project, using the appropriate methods described in Chapter 4.
Rainfall Duration
(min.)
10-year Intensity
(in/hr)
50-year Intensity
(in/hr)
5 6.06 7.82
6 5.82 7.50
7 5.57 7.18
8 5.33 6.87
9 5.08 6.55
10 4.84 6.23
15 4.08 5.26
Table 7A-13
Example IDF Data for Example Problem #3 (example values ONLY)
The design procedure begins at the upstream end of each sewer run and proceeds in the downstream direction. Each pipe is examined in succession along the system. Thus, the following discussion will be organized by inlet structure, and the pipe to be designed will be the one proceeding downstream from the structure. Figures 7A-20 and 7A-21 present the completed computation worksheets for this sample problem. Structure #39: As discussed in Section 7.04.5.2, the first step in designing the pipe will be to determine the drainage area, runoff coefficient and time of concentration for both the on-site and off-site areas draining to the inlet structure. Structure #39 will not collect off-site flows; thus, only runoff from the roadway will need to be considered. Because this inlet will not receive flow from beyond the end of the project at Station
41+45, the area of roadway draining to the inlet, Ar, is computed from Equation 7-26 as:
419.0560,43
67.4545374541
560,43
xr
r
WLA acres
From Chapter 4, the runoff coefficient selected for the roadway is 0.90. Thus, the factor “ΣCA” may be computed from Equation 7-32 as:
37704190900 ...ACCA rr

TDOT DESIGN DIVISION DRAINAGE MANUAL
August 1, 2012
7A-41
For a 5-minute time of concentration, the rainfall intensity provided above yields a 10-year intensity of 6.06 in/hr. Thus, the flow rate at the inlet is computed from Equation 7-33 as:
2920663770 ...iCAQ cfs
The proposed structure for this location is a Type 12 catch basin. The Standard Drawings specify that the minimum depth of this structure is 4.25 feet when using an 18-inch pipe. Since the casting elevation at this structure is 377.15 feet, the upstream invert elevation of
the pipe, Invus, will be 372.90 feet. This pipe will be connected to Structure #36, which is also a
Type 12 catch basin. Since the casting elevation at Structure #36 is 367.15, the highest possible
invert elevation for the pipe at that structure, Invds, is 362.90 feet.
The distance between the two catch basins, based on stationing is:
40045334537 feet
The distance from the center line of each catch basin to the inside edge of the structure
wall is 2 feet. Thus, the actual pipe length, Lp, will be 4 feet less than the distance by stationing,
or 396 feet. The pipe slope, Slp, is computed from Equation 7-35 as:
02530396
9036290372.
..
L
InvInvSl
p
dsusp
The flow capacity of this pipe, Qcap, is then computed from Equation 7-36 as:
69160253012
18
0130
46304630 506672
506672 ...
.SlD
n
.Q
..
.p
.cap
cfs
Since the capacity of the pipe at minimum depth is considerably greater than the design
flow rate of 2.29 ft3/s, the proposed design is acceptable.
Finally, the velocity in the pipe, Vfull, is computed from Equation 7-37 as:
4492418
6916
2.
.
A
QV
full
capfull
ft/s
The flow time in the pipe, Tt, is then computed from Equation 7-38 as:
70044960
396
60.
.V
LT
full
pt
minutes
Even though the actual design discharge is considerably less than the pipe capacity, the use of the full flow velocity is sufficiently accurate for computing the flow time in the pipe as discussed in Section 7.03.4.3.

TDOT DESIGN DIVISION DRAINAGE MANUAL
August 1, 2012
7A-42
Structure #36: Because this catch basin is the second one in this branch of the storm sewer system, the design procedure will be somewhat modified from the procedure used for Structure #39. The
roadway area draining to the catch basin, Ar, is computed first as the area between the two
inlets:
419056043
674545334537
56043.
,
.
,
WLA xr
r
acres
To compute the parameter “ΣCA” at this location, it will be necessary to express Equation 7-34 as follows:
755041909003770 ....ACCAUpstreamCA rr
To compute the time of concentration, tc, to be used in the design flow rate computation,
flow times for all contributing sources of flow to the catch basin are compared. In this case, the two sources are flow from the roadway, which has a flow time of 5 minutes or less, and flow from the upstream pipe, which has a flow time of:
70570005 ...tc minutes
Since the flow time for the pipe is longer than the flow time at the inlet, the time of concentration for the structure will be 5.70 min. Interpolating from Table 7A-13 yields a 10-year rainfall intensity of 5.89 in/hr. Thus, the design flow rate for the pipe is computed from Equation 7-33 as:
4548957550 ...iCAQ cfs
The pipe from Structure #39 connects to Structure #36 at the minimum depth of 4.25 feet. Since the inlet casting is at elevation 367.15 feet, this represents an inlet elevation of 362.90 feet. To determine the invert elevation of the pipe leaving Structure #36, it will be necessary to account for the drop in elevation which occurs across the catch basin. Thus, the
invert elevation of the outlet pipe, Invus, is placed at 362.73 feet, which is 0.17 feet below the
invert of the inlet pipe.
As shown before, the downstream invert elevation of the pipe, Invds, is based on the
minimum depth of the structure to which it connects. Since the casting elevation at Structure
#33 is 360.99, the downstream pipe invert elevation is 7435625499360 ... feet. Using the
procedure described above, the full-flow capacity of this pipe is determined to be 12.91 ft3/s,
which is still considerably greater than the design discharge. Since this pipe will be acceptable, the pipe flow velocity and flow time are computed as shown in Figure 7A-21. Structure #33: The procedure to design the pipe at this structure is essentially identical to the procedure used for Structure #36. The pipe from the structure will be connected to Structure #29, a standard Number 14 catch basin, which is wider than a Number 12 catch basin. The distance

TDOT DESIGN DIVISION DRAINAGE MANUAL
August 1, 2012
7A-43
from the center of a Number 14 catch basin to the inside wall is approximately 4 feet. Thus, the actual pipe length is computed as:
721024328284530 ..Lp feet
It should also be noted that the minimum depth of a Type 14 catch basin with an 18-inch pipe is 4.42 feet. Since the casting elevation at Structure #29 is 357.88, the downstream pipe invert elevation is 353.46 feet. The pipe from Structure #33 is one of three inlet pipes connected at Structure #29. Before design computations can proceed downstream from Structure #29, it is necessary to determine the flow rates and pipe designs for the other two connections. Structure #25: The procedure used to design this pipe is identical to the procedure used to design the pipe at Structure #39. The results of the design computations are summarized on Figures 7A-20 and 7A-21. Structure #28: This structure is a Type 42 area drain. Since this structure will not collect runoff from the roadway, Equation 7-32 may be written as:
795065230 ...ACCA oo
Interpolating the given time of concentration of 9.8 minutes from Table 7A-13 yields a 10-year rainfall intensity of 4.89 in/hr, which in turn results in a design discharge of
approximately 3.89 ft3/s.
Based on the Standard Drawings, the minimum depth for a Type 42 area drain with an 18-inch pipe is 2.95 feet. Since the inlet casting is at an elevation of 356.37 feet, the upstream
pipe invert elevation, Invus, is 353.42 feet. It was noted in the computations for Structure #33
that the invert elevation of an 18-inch pipe at the minimum depth for Structure #29 would be 353.46 feet, which is 0.04 feet above the invert elevation at Structure #28. Thus, the
downstream invert elevation, Invds, will be at an elevation below the minimum depth for
Structure #29 and will be determined by trial and error. The process of selecting the downstream invert elevation consists of computing the pipe slope, full-flow capacity and flow velocity for varying trial elevations using Equations 7-35, 7-36 and 7-37. The elevation selected for design will be the highest one which yields an acceptable pipe flow capacity and flow velocity at a slope greater than the minimum. For this problem, a downstream invert elevation of 353.32 is selected and:
00430023
3235342353.
.
..
L
InvInvSl
p
dsusp
9260043012
18
0130
46304630 506672
506672 ...
.SlD
n
.Q
..
.p
.cap
cfs
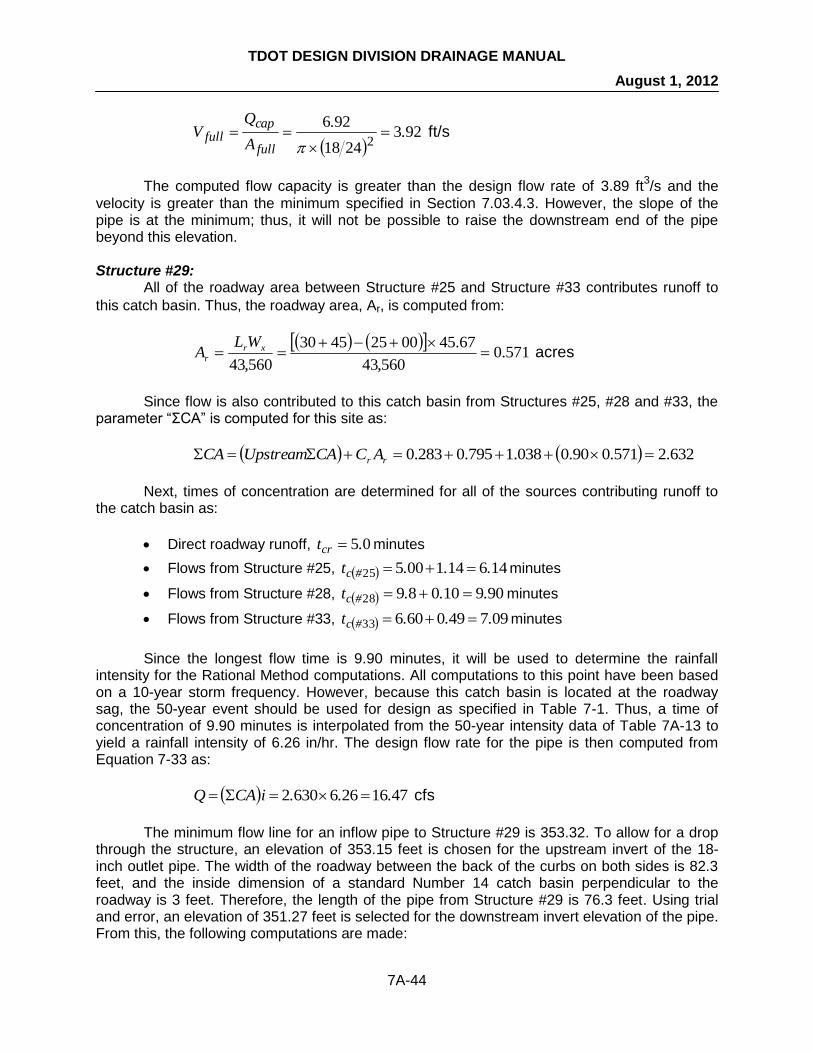
TDOT DESIGN DIVISION DRAINAGE MANUAL
August 1, 2012
7A-44
9232418
926
2.
.
A
QV
full
capfull
ft/s
The computed flow capacity is greater than the design flow rate of 3.89 ft3/s and the
velocity is greater than the minimum specified in Section 7.03.4.3. However, the slope of the pipe is at the minimum; thus, it will not be possible to raise the downstream end of the pipe beyond this elevation. Structure #29: All of the roadway area between Structure #25 and Structure #33 contributes runoff to
this catch basin. Thus, the roadway area, Ar, is computed from:
571.0560,43
67.4500254530
560,43
xr
r
WLA acres
Since flow is also contributed to this catch basin from Structures #25, #28 and #33, the parameter “ΣCA” is computed for this site as:
632.2571.090.0038.1795.0283.0 rr ACCAUpstreamCA
Next, times of concentration are determined for all of the sources contributing runoff to the catch basin as:
Direct roadway runoff, 05.tcr minutes
Flows from Structure #25, 14614100525 ...t #c minutes
Flows from Structure #28, 9091008928 ...t #c minutes
Flows from Structure #33, 09749060633 ...t #c minutes
Since the longest flow time is 9.90 minutes, it will be used to determine the rainfall intensity for the Rational Method computations. All computations to this point have been based on a 10-year storm frequency. However, because this catch basin is located at the roadway sag, the 50-year event should be used for design as specified in Table 7-1. Thus, a time of concentration of 9.90 minutes is interpolated from the 50-year intensity data of Table 7A-13 to yield a rainfall intensity of 6.26 in/hr. The design flow rate for the pipe is then computed from Equation 7-33 as:
47162666302 ...iCAQ cfs
The minimum flow line for an inflow pipe to Structure #29 is 353.32. To allow for a drop through the structure, an elevation of 353.15 feet is chosen for the upstream invert of the 18-inch outlet pipe. The width of the roadway between the back of the curbs on both sides is 82.3 feet, and the inside dimension of a standard Number 14 catch basin perpendicular to the roadway is 3 feet. Therefore, the length of the pipe from Structure #29 is 76.3 feet. Using trial and error, an elevation of 351.27 feet is selected for the downstream invert elevation of the pipe. From this, the following computations are made:

TDOT DESIGN DIVISION DRAINAGE MANUAL
August 1, 2012
7A-45
02460376
2735115353.
.
..
L
InvInvSl
p
dsusp
11180298012
18
0130
46304630 506672
506672 ...
.SlD
n
.Q
..
.p
.cap
cfs
3392418
48162
..
A
QV
full
cap
full
ft/s
Although this design will accommodate the design discharge of 16.47 ft3/s, the proposed
slope and velocity are both comparatively high. In fact, the downstream invert elevation is 0.65 feet above the overall storm sewer outlet elevation of 350.62 feet. This could create difficulties in the final design of the pipe from Structure #30 to the system outfall. The results obtained for an 18-inch pipe are not deemed to be acceptable so the design process is repeated using a 24-inch pipe. Because the diameter of a 24-inch pipe is 6 inches greater than the diameter of an 18-inch pipe, the upstream invert elevation is lowered to 352.65 feet. Again using trial and error, an elevation of 352.23 feet is selected for the downstream invert elevation of the pipe. Thus:
00550376
2335265352.
.
..
L
InvInvSl
p
dsusp
78160055012
18
0130
46304630 506672
506672 ...
.SlD
n
.Q
..
.p
.cap
cfs
3452418
78162
..
A
QV
full
cap
full
ft/s
The selection of a 24-inch pipe allows the downstream invert elevation to be raised by 0.96 feet, which produces a more practical design. Thus, the 24-inch pipe is selected for design. Structure #40: The computations for this structure are similar to those for Structure #39. Structure #37: The computations for this structure are similar to those for Structure #36, except that the pipe length is shorter. Structure #34:
The roadway area draining to this catch basin, Ar, is computed as:
210056043
674545314533
56043.
,
.
,
WLA xr
r
acres

TDOT DESIGN DIVISION DRAINAGE MANUAL
August 1, 2012
7A-46
The commercial drive at Station 33+18 brings 1.21 acres of off-site drainage to the drainage system above Structure #34. Thus, the parameter “ΣCA” is computed from Equation 7-34 as:
oorr ACACCAUpstreamCA
91212118021009007550 ......
The time of concentration, tc, for flow from the commercial site has been determined to
be 5 minutes. Since the flow time in the storm sewer above Structure #34 is greater than 5 minutes, the time of concentration is computed as:
056350705 ...tc minutes
Interpolating from Table 7A-13 yields a 10-year rainfall intensity of 5.81 in/hr and a computed design flow rate of:
10118159121 ...iCAQ cfs
The invert elevations of the proposed 18-inch pipe will be based on the minimum depths allowed at the upstream and downstream structures. Thus:
013707310
4635373357.
.
..
L
InvInvSl
p
dsusp
31120137012
18
0130
46304630 506672
506672 ...
.SlD
n
.Q
..
.p
.cap
cfs
9762418
3112
2.
.
A
QV
full
capfull
ft/s
Although this design will meet the applicable criteria, it should be noted that the slope of the pipe as it proceeds downstream from Structure #34 is about 1.4 percent, while the slope of the profile grade is 2.5 percent. This means that cover over the pipe is diminishing as one proceeds from Structure #34 to Structure #30. Based on a pavement section thickness of 12 inches and a pipe wall thickness of 2.5 inches, the pipe will have 1.71 feet of cover at Structure #34. Comparing the gutter profile and the profile along the outside of the pipe, it is observed that the point of minimum cover along this run of storm sewer is at Station 29+90 where the gutter elevation is 359.00 feet, and the outside crown of the pipe is at elevation 357.34. Thus, the cover at this point is 0.66 feet below the bottom of the subgrade, which does not meet the cover criteria presented in this chapter. Although no action will be taken for this design example, this situation could be resolved by placing an additional catch basin at this point. Structure #26: The computations for this structure are similar to those for Structure #25. Structure #30:

TDOT DESIGN DIVISION DRAINAGE MANUAL
August 1, 2012
7A-47
As was the case with Structure #29, all of the roadway area between Structure #26 and
Structure #34 contributes runoff to this catch basin. Thus, the roadway area, Ar, is computed
from:
676.0560,43
67.4500254531
560,43
xr
r
WLA acres
Since flow is also contributed to this catch basin from Structures #26, #29 and #34, the parameter “ΣCA” is computed for this site as:
43455740900912163022830 ......ACCAUpstreamCA rr
Next, times of concentration are determined for all sources contributing runoff to the catch basin as follows:
Direct roadway runoff, 05.tcr minutes
Flows from Structure #26, 14614100525 ...t #c minutes
Flows from Structure #29, 13102409928 ...t #c minutes
Flows from Structure #34, 79674005633 ...t #c minutes
Since the longest flow time is 10.14 minutes, it will be used to determine the rainfall intensity for the Rational Method computations. Because this catch basin is located at the roadway sag, the 50-year event should be used for design as specified in Table 7-1. Thus, the time of concentration of 10.14 minutes is interpolated from the 50-year intensity data in Table 7A-13 to yield a rainfall intensity of 6.20 in/hr. The design flow rate of the pipe is then computed from Equation 7-33 as:
71332064335 ...iCAQ cfs
To allow for a drop across the structure, an elevation of 352.06 feet is selected for the upstream invert of the 24-inch diameter outlet pipe. Since the downstream end of this pipe is an outfall to an existing stream, the length and downstream invert elevation of the pipe are determined by the physical setting of the site and are not subject to adjustment. Therefore;
07580019
6235006352.
.
..
L
InvInvSl
p
dsusp
26620758012
24
0130
46304630 506672
506672 ...
.SlD
n
.Q
..
.p
.cap
cfs
82192424
26622
..
A
QV
full
cap
full
ft/s
Although this design will accommodate the design discharge of 33.71 ft3/s, the proposed
slope is comparatively high and will results in excessive velocity. This situation could be resolved by lowering the upstream invert to reduce the pipe slope. By doing so, the capacity of the pipe will more closely match the design discharge. Additionally, providing a riprap apron at

TDOT DESIGN DIVISION DRAINAGE MANUAL
August 1, 2012
7A-48
the outfall, as described in Chapter 6, may be necessary, however, this is left as an exercise for the reader.
Figure 7A-20 Completed Discharge Computations Worksheet
For Example Problem #3

TDOT DESIGN DIVISION DRAINAGE MANUAL
August 1, 2012
7A-49
Figure 7A-21 Completed Pipe Computations Worksheet
For Example Problem #3

TDOT DESIGN DIVISION DRAINAGE MANUAL
August 1, 2012
7A-50
7.06.3 GLOSSARY The following list of terms is representative of those used in the design of storm sewers. All of the terms may not necessarily be used in the chapter text; but rather are commonly used by engineers, scientists, and planners. AREA DRAIN – Any TDOT standard inlet used to remove flow from an open ditch or from a median. BACKWATER – The rise of water level upstream due to a downstream obstruction or channel constriction. BRIDGE END DRAIN – A grate inlet structure placed at the downstream end of a bridge to collect stormwater runoff from the deck and convey it to the side of the roadway. BYPASS FLOW – That flow which bypasses a stormwater inlet on grade, and is carried in the road, gutter, or channel to the next downstream structure. CATCH BASIN – A stormwater drainage structure consisting of an inlet and a subgrade structure (usually rectangular or round) which supports the inlet and provides a storm sewer pipe connection. CHANNEL FLOW – The flow of water in a defined conveyance such as a stream, ditch or pipe. CLEANOUT – A small structure attached to a slotted drain which has an opening on the surface to allow access for maintenance. COMBINATION INLET – A storm inlet consisting of both a curb inlet and a grate inlet. COMPOUND CROSS SLOPE – A roadway transverse slope which varies as the cross section transitions between traffic lanes, the shoulder and the gutter. CONVEYANCE – A measure of the capacity of an open channel or pipe to pass water based on its geometric and flow resistance properties. COVER (of a pipe) – The minimum vertical distance from the outside crown of a pipe to the bottom of the roadway subgrade. CRITICAL DEPTH – The depth at which the gravitational and inertial forces acting on the flow are exactly balanced and where the specific energy is at a minimum. For a given discharge and cross-section geometry there is only one critical depth. CRITICAL FLOW – An open channel flow condition in which the depth is exactly at critical depth. CROSS DRAIN – A drainage structure, usually a culvert, which conveys water from one side of a roadway to the other. CROWN (PIPE) – The inside top of a pipe.

TDOT DESIGN DIVISION DRAINAGE MANUAL
August 1, 2012
7A-51
CROWN (ROADWAY) – The highest point, not including any curbs, of a transverse cross section of a roadway. CURB – A raised structure at the edge of a roadway, usually used in combination with a gutter, which acts to contain stormwater runoff on the roadway. CURB INLET (or CURB IRON) – An open, usually vertical inlet which is built into the curb. CUTOUT HOLE – A hole formed in the side of a catch basin, manhole or junction box which is slightly larger than the outside diameter of a storm sewer pipe to accommodate its connection. DEFLECTION ANGLE – The angle formed between the center lines of any two pipes connected to the same round manhole. DESIGN DISCHARGE (or FLOW RATE) – The quantity of flow, usually expressed as the number of cubic feet of water passing a given point in one second (cfs), to accommodated by the proposed drainage facility. DRAINAGE AREA – All of the area which will contribute runoff to a given point. DRAINAGE EASEMENT – The right, obtained from the owner of property adjoining a roadway or other development site, to use a portion of that property to place and maintain part of a proposed drainage facility. DRAINAGE FACILITY – Any engineered system of structures used to convey stormwater runoff through, under or around a roadway or other development. DROP STRUCTURE – A catch basin or manhole where at least one of the inflow pipes is at an elevation significantly above the elevation of the structure outlet pipe. EROSION – The removal of sediments or other soil from a site, especially by the force of moving water. FLANKING INLET – An inlet placed on either side of an inlet located in a sag, to limit the spread of water on the roadway should the sag inlet become clogged. FLOW LINE (or INVERT) – The lowest point in a pipe or open channel. FRONTAL FLOW – That portion of the flow in a gutter which is directly in line with the width of an inlet grate and can flow across it. FULL-FLOW CAPACITY (of a pipe) – The flow rate that would occur in a pipe of a given size, type and slope when the entire cross sectional area of the pipe is utilized. GRATE INLET – A horizontal, or nearly horizontal inlet in a gutter or ditch which is covered with a metal grate and frame. GRAVITY (OPEN SURFACE) FLOW – A flow condition under which the water surface is open to the atmosphere and the behavior of the flow is determined only by gravity and momentum.

TDOT DESIGN DIVISION DRAINAGE MANUAL
August 1, 2012
7A-52
GUTTER – A narrow channel usually at the edge of a roadway specifically used to collect and convey stormwater runoff. Normally placed with a curb. HEAD – One of a number of different measures of the energy available in a given unit of water, including any combination of elevation, velocity and pressure. HDPE – High-density polyethylene pipe, with either a smooth or corrugated interior. HYDRAULIC GRADE LINE – A line which represents the relative force available due to the potential energy available. This is a combination of energy due to the height of the water and internal pressure (pressure head + elevation head). HYDRAULIC RADIUS – A parameter used in the analysis of uniform flow and which is computed as the flow area divided by the wetted perimeter. HYDROPLANING – The loss of control of a moving vehicle due to an excessive build up of water beneath its tires. INLET – An opening in a surface conveyance such a gutter or an open ditch through which stormwater runoff may pass into a storm sewer, and usually covered with some form of metal grate on a frame. INLET TIME – The time of concentration for flows to a specific inlet. INTERCEPTION – The transfer of stormwater runoff from the surface into a drainage facility by means on an inlet. JUNCTION BOX – A rectangular or square concrete structure used to connect two or more storm sewer pipes, but which has no access to the surface. LATERAL – Any portion of a storm sewer system which serves to connect one or more inlets to the trunk line. LONGITUDINAL DRAIN (or INLET) – A long, narrow inlet installed directly on top of a pipe or other drainage channel and which may be placed either perpendicular across, or along the side of a roadway. LONGITUDINAL SLOPE – The slope of a roadway (or gutter) measured parallel to the roadway centerline. MANNING’S EQUATION – An empirical formula used to analyze flow conditions for a steady, uniform flow. MANNING’S N-VALUE: - An empirical number assigned to a given material as a gage of its frictional resistance to the flow of water. NONUNIFORM FLOW – A flow condition characterized by changes in cross section, depth and velocity through a given reach of channel. Under this condition, the slopes of the energy grade line, the water surface and the channel bed may vary and will usually not be equal to one another.

TDOT DESIGN DIVISION DRAINAGE MANUAL
August 1, 2012
7A-53
NORMAL DEPTH – The depth of flow which will occur in an open channel of a given cross section for a given flow rate when the slope of the water surface is exactly equal to the slope of the channel OFF-SITE DRAINAGE AREA – An area not part of a given roadway or development site which collects stormwater runoff and conveys it to the site. ORIFICE – A vertical or horizontal opening through which flows may pass and where pressure is the dominant influence over the flow rate. OUTFALL (or OUTLET) – The point at which flows in a closed drainage system, such as a storm sewer, pass into another drainage system, usually an open conveyance such as a ditch. PAVEMENT DRAINAGE – The removal of water from roadways or other paved areas where the presence of water may present a nuisance or hazard. PLUGGING FACTOR – The portion of an area drain or other inlet blocked by debris, usually expressed as a percentage. PRESSURE FLOW – A flow condition under which the water surface is constrained by the top of a closed conduit and the behavior of the flow is determined by gravity, momentum and pressure within the conduit. RAINFALL DURATION – The length of time between the start of a given rainfall event and its finish. RAINFALL INTENSITY – The rate at which rainfall occurs, usually expressed as inches of rainfall per hour (in/hr). RETICULINE GRATE – An inlet grate which utilizes straight, rectangular bars. ROUGHNESS COEFFICIENT – A numerical measure of the frictional resistance to flow in a channel, such as the Manning's coefficient. SIDE DRAIN – A drainage structure, usually a culvert, which conveys water flowing in a roadway side ditch beneath driveways or other obstructions to flow. SHEET FLOW – A stormwater runoff flow condition in which the water moves as a broad, thin film over a surface. SIDE FLOW – That portion of the flow in a gutter which is not directly in line with the width of an inlet grate and moves along beside it. SLOTTED DRAIN – A type of longitudinal drain which consists of a section of pipe cut along its longitudinal axis connected to a vertical open beam which extends to the surface. SPECIAL DITCH – A side ditch with a profile which is independent of the roadway profile grade. SPLASH-OVER VELOCITY – The flow velocity at which a portion of the frontal flow can skip across a gutter inlet grate without being intercepted.

TDOT DESIGN DIVISION DRAINAGE MANUAL
August 1, 2012
7A-54
SPREAD – The transverse lateral distance from the face of curb to the limit of the water flowing on the roadway. STANDARD DITCH – A side ditch which is a set distance from the centerline of the roadway and has a profile parallel the roadway profile grade. STEADY-STATE FLOW – Flow in which the velocity at a point or cross section is constant, and does not change with time. The local acceleration is zero. SUMP (or SAG) – A low point along an open conveyance, especially a gutter, where stormwater will collect. STORM SEWER – A system of catch basins, manholes and pipes designed to remove stormwater runoff from the ground surface and convey it to a suitable outlet point. STORMWATER RUNOFF – The portion of the water from a rainfall event which flows across the surface of the ground. TANGENT SECTION – Any portion of the horizontal alignment of a roadway which is not curved. TIME OF CONCENTRATION – The time required for a particle of stormwater runoff to flow from the most hydrologically distant point in a drainage area to the point of interest, such as an inlet. TRANSVERSE SLOPE (or CROSS SLOPE) - The slope of a roadway measured perpendicular to the roadway centerline. TRENCH DRAIN – A type of longitudinal drain which consists of a narrow, flat grate placed on a rectangular concrete channel. TRUNK LINE – That portion of a storm sewer system which serves to collect flows from the other parts of the system and convey them to the outlet. UNDERDRAINS – A system of pipes, usually placed under a roadway near the edge of pavement, which serves to collect water from the subbase and thus prevent its saturation. UNIFORM CROSS SLOPE – A roadway transverse slope which is constant from the crown of the roadway to the outer edge of the gutter. UNIFORM FLOW – A flow condition characterized by a constant cross section and velocity through a given reach of channel. Under this condition, the slopes of the energy grade line, the water surface, and the channel bed are constant and equal. VANE (or CURVED VANE) GRATE – An inlet grate which utilizes curved bars to increase its hydraulic efficiency. VERTICAL CURVE – A curve in the profile grade of a roadway which provides a smooth transition between two adjacent segments which have differing longitudinal slopes.

TDOT DESIGN DIVISION DRAINAGE MANUAL
August 1, 2012
7A-55
WEIR – A ridge or raised sill over which flows may freely fall so that gravity is the dominant influence over the flow rate.

TDOT DESIGN DIVISION DRAINAGE MANUAL
August 1, 2012
7A-56
7.06.4 REFERENCES U.S. Department of Transportation, Federal Highway Administration. Design Charts for Open Channel Flow. Hydraulic Design Series No. 3 (HDS-3). Report No. EPD-86-102. Washington, D.C. August 1961. U.S. Department of Transportation, Federal Highway Administration. Introduction to Highway Hydraulics. Hydraulics Design Series No. 4 (HDS-4), Publication No. FHWA NHI 01-019. Washington, D.C. August 2001. U.S. Department of Transportation, Federal Highway Administration. Drainage of Highway Pavements. Hydraulic Engineering Circular No. 12 (HEC-12), Publication No. FHWA-TS-84-202. Washington, DC. April 1984. U.S. Department of Transportation, Federal Highway Administration. Urban Drainage Design Manual. Hydraulic Engineering Circular No. 22 (HEC-22), Publication No. FHWA SA-96-078. Washington, D.C. November 1996. U.S. Department of Transportation, Federal Highway Administration. HYDRAIN-Integrated Drainage Design Computer System, Volumes 1-6. FHWA-RD-88-120, Hydraulic Microcomputer Program HYDRAIN. Washington, D.C. 1987. U.S. Department of Agriculture, Soil Conservation Service. Hydraulics. National Engineering Handbook. Section 5 (NEH-5). 1956. Indiana Department of Transportation. Indiana Design Manual Part IV Volume I. Indianapolis, IN. 1999. Tennessee Department of Transportation, Design Division, Design Guidelines - English. Nashville, TN. May, 2012. Metropolitan Government of Nashville and Davidson County Department of Public Works Engineering Division. Stormwater Management Manual. Nashville, Tennessee. July 1988.
Virginia Department of Transportation. Location and Design Division. Drainage Manual. Richmond, Virginia. April 2002. American Association of State Highway and Transportation Officials. Model Drainage Manual. [Metric Edition]. Washington, D.C. 1999. Brater, Ernest; King, Horace; Lindell, James; Wei, C.Y.; Handbook of Hydraulics, 7th ed., McGraw Hill Book Company, Inc., 1996. Neenah Foundry Company; Construction Castings, Catalog “R” 11th ed., Neenah Foundry Company, Neenah, WI 1989.

TDOT DESIGN DIVISION DRAINAGE MANUAL
August 1, 2012
7A-57
7.06.5 ABBREVIATIONS AASHTO - American Association of State Highway and Transportation Officials ADT - Average Daily Traffic CA - Contributing Area CMP - Corrugated Metal Pipe EPA - Environment Protection Agency FHWA - Federal Highway Administration HDS-1 - Hydraulic Design Series Number 1 HDS-3 - Hydraulic Design Series Number 3 HDS-4 - Hydraulic Design Series Number 4 HDS-5 - Hydraulic Design Series Number 5 HEC-5 - Hydraulic Engineering Circular Number 5 HEC-9 - Hydraulic Engineering Circular Number 9 HEC-10 - Hydraulic Engineering Circular Number 10 HEC-11 - Hydraulic Engineering Circular Number 11 HEC-12 - Hydraulic Engineering Circular Number 12 HEC-22 - Hydraulic Engineering Circular Number 22 HEC-RAS - Hydrologic Engineering Center River Analysis System HDPE - High Density Polyethylene Pipe HW - Headwater IDF - Intensity Duration Frequency PVT - Point of Vertical Tangency PVC - Point of Vertical Curvature PVI - Point of Vertical Intersection RCP - Reinforced Concrete Pipe TDOT - Tennessee Department of Transportation TDEC - Tennessee Department of Environment and Conservation TW - Tailwater USDA - United States Department of Agriculture USDOT - United States Department of Transportation USGS - United States Geological Survey