td bank group investor presentation. number of north american retail outlets at the end of q3/13. 2....
TRANSCRIPT

TD Bank Group Investor Presentation
Q3 2013
1
Caution regarding forward-looking statements From time to time, the Bank makes written and/or oral forward-looking statements, including in this document, in other filings with Canadian regulators or the U.S. Securities and Exchange Commission, and in other communications. In addition, representatives of the Bank may make forward-looking statements orally to analysts, investors, the media and others. All such statements are made pursuant to the “safe harbour” provisions of, and are intended to be forward-looking statements under, applicable Canadian and U.S. securities legislation, including the U.S. Private Securities Litigation Reform Act of 1995. Forward-looking statements include, but are not limited to, statements made in this document, the Management’s Discussion and Analysis in the Bank’s 2012 Annual Report (“2012 MD&A”) under the headings “Economic Summary and Outlook”, for each business segment “Business Outlook and Focus for 2013” and in other statements regarding the Bank’s objectives and priorities for 2013 and beyond and strategies to achieve them, and the Bank’s anticipated financial performance. Forward-looking statements are typically identified by words such as “will”, “should”, “believe”, “expect”, “anticipate”, “intend”, “estimate”, “plan”, “may”, and “could”. By their very nature, these forward-looking statements require the Bank to make assumptions and are subject to inherent risks and uncertainties, general and specific. Especially in light of the uncertainty related to the physical, financial, economic, political, and regulatory environments, such risks and uncertainties – many of which are beyond the Bank’s control and the effects of which can be difficult to predict – may cause actual results to differ materially from the expectations expressed in the forward-looking statements. Risk factors that could cause such differences include: credit, market (including equity, commodity, foreign exchange, and interest rate), liquidity, operational (including technology), reputational, insurance, strategic, regulatory, legal, environmental, capital adequacy, and other risks. Examples of such risk factors include the impact of recent U.S. legislative developments, as discussed under “Significant Events in 2012” in the “Financial Results Overview” section of the 2012 MD&A; changes to and new interpretations of capital and liquidity guidelines and reporting instructions; changes to the Bank’s credit ratings; changes in interest rates; increased funding costs for credit due to market illiquidity and competition for funding; the occurrence of natural and unnatural catastrophic events and claims resulting from such events; the failure of third parties to comply with their obligations to the Bank or its affiliates relating to the care and control of information; disruptions in or attacks (including cyber attacks) on the Bank’s information technology, internet, network access or other voice or data communications systems or services; and the overall difficult litigation environment, including in the United States. We caution that the preceding list is not exhaustive of all possible risk factors and other factors could also adversely affect the Bank’s results. For more detailed information, please see the “Risk Factors and Management” section of the 2012 MD&A, as may be updated in subsequently filed quarterly reports to shareholders and news releases (as applicable) related the transactions discussed under the heading “Significant Events” in the relevant MD&A, which applicable releases may be found on td.com. All such factors should be considered carefully, as well as other uncertainties and potential events, and the inherent uncertainty of forward-looking statements, when making decisions with respect to the Bank and we caution readers not to place undue reliance on the Bank’s forward-looking statements. Material economic assumptions underlying the forward-looking statements contained in this document are set out in the 2012 MD&A under the headings “Economic Summary and Outlook”, and for each business segment, “Business Outlook and Focus for 2013”, each as updated in subsequently filed quarterly reports to shareholders. Any forward-looking statements contained in this document represent the views of management only as of the date hereof and are presented for the purpose of assisting the Bank’s shareholders and analysts in understanding the Bank’s financial position, objectives and priorities and anticipated financial performance as at and for the periods ended on the dates presented, and may not be appropriate for other purposes. The Bank does not undertake to update any forward-looking statements, whether written or oral, that may be made from time to time by or on its behalf, except as required under applicable securities legislation.

2
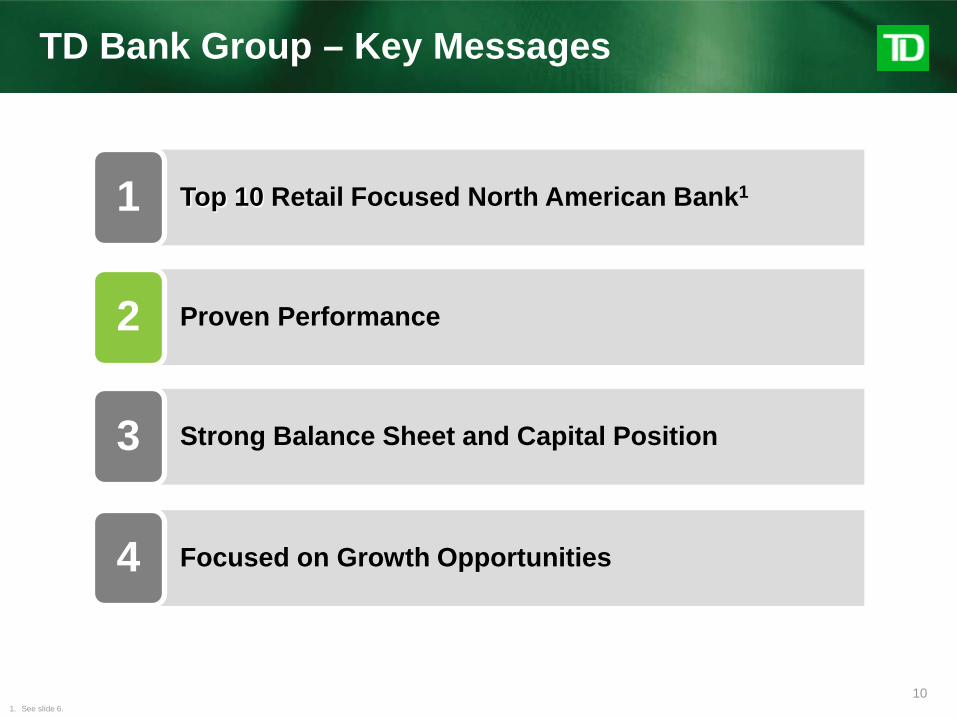
TD Bank Group – Key Messages
Top 10 Retail Focused North American Bank 1
Proven Performance
Strong Balance Sheet and Capital Position
Focused on Growth Opportunities 4
2
3
6th largest bank by Market Cap and
Total Assets1
Targeting 7-10% adjusted EPS
growth over the medium term2
Highly rated by all major credit rating
agencies
Delivering top tier long
term shareholder returns
1. See slide 6. 2. See slide 4, footnote 3, for definition of adjusted results.

3
TD Bank Group
Our Businesses Canadian Personal & Commercial
Wholesale
U.S. Personal & Commercial
Wealth & Insurance
Direct investing Advice-based wealth business Asset management Insurance
2,481
Business Locations1
Q3 20132 (C$) CAD P&C
U.S. P&C
Total Deposits3 $224B $193B
Total Loans4 $308B $106B
Rpt. Earnings5 $3.5B $1.5B
Adj. Earnings5 $3.6B $1.6B
Customers 13MM 8MM
Employees6 28,345 24,811
Lower-risk retail focused North American bank 1. Number of North American retail outlets at the end of Q3/13. 2. Q3/13 is the period from May 1, 2013 to July 31, 2013. 3. Total Deposits based on total of average personal and business deposits during Q3/13. U.S. deposits include TD Ameritrade Insured Deposit Accounts (IDAs). 4. Total Loans based on total of average personal and business loans during Q3/13. 5. For trailing four quarters ended Q3/13. See slide 4, footnote 3 for definition of adjusted results. 6. Average number of full-time equivalent staff during Q3/13.
Personal banking, credit cards and auto finance Small business and commercial banking
Personal banking, credit cards and auto finance Small business and commercial banking Corporate and specialty banking
Research Investment banking Capital markets Global transaction banking

4
Simple Strategy, Consistent Focus
Building the Better Bank
Franchise Businesses
Retail Earnings Focus
Risk Discipline
North America Top 10 Bank in North America1
One of only a few banks globally to be rated Aa1 by Moody’s2
Leverage platform and brand for growth
Strong employment brand
Leader in customer service and convenience
Over 80% of adjusted earnings from retail3,4
Repeatable and growing earnings stream
Focus on customer-driven products
Only take risks we understand
Systematically eliminate tail risk
Strong organic growth engine
Better return for risk undertaken5
Operating a franchise dealer of the future
Consistently reinvest in our competitive advantages
Robust capital and liquidity management
Culture and policies aligned with risk philosophy
Superior execution 1. See slide 6. 2. For long term debt (deposits) of The Toronto-Dominion Bank, as at July 31, 2013. Credit ratings are not recommendations to purchase, sell, or hold a financial obligation
inasmuch as they do not comment on market price or suitability for a particular investor. Ratings are subject to revision or withdrawal at any time by the rating organization. 3. Based on Q3/13 adjusted earnings. Effective November 1, 2011, the Bank prepares its consolidated financial statements in accordance with International Financial Reporting
Standards (IFRS), the current generally accepted accounting principles (GAAP), and refers to results prepared in accordance with IFRS as the ”reported” results. The Bank also utilizes non-GAAP financial measures to arrive at "adjusted" results (i.e. reported results excluding “items of note”, net of income taxes) to assess each of its businesses and measure overall Bank performance. Please see "How the Bank Reports" starting on page 5 of the 3rd Quarter 2013 Earnings News Release for further explanation and a reconciliation of the Bank’s non-GAAP measures to reported basis results.
4. Retail includes Canadian Personal & Commercial Banking, Wealth & Insurance, and U.S. Personal & Commercial Banking segments. See slide 7 for more detail. 5. Based on Q3/13 return on risk-weighted assets (RWA), calculated as adjusted net income available to common shareholders divided by average RWA. See slide 20 for details. See footnote 3 above for definition of adjusted results.

5
Competing in Attractive Markets
10th largest economy Nominal GDP of C$1.7 trillion Population of 35 million
TD’s Canadian P&C3 Business
Canadian Banking System
Country Statistics
World’s largest economy Nominal GDP of US$15.1 trillion Population of 314 million
TD’s U.S. P&C3 Business
U.S. Banking System
Country Statistics
Significant growth opportunities within TD’s footprint 1. World Economic Forum, Global Competitiveness Reports 2008-2013. 2. Includes securitizations. As per Canada Mortgage and Housing Corporation (CMHC). 3. “P&C” refers to Personal & Commercial Banking. 4. Based on SNL Bank and Thrifts as of 06/30/2011. 5. New mortgage origination volume in 2011 from Moody’s.
Soundest banking system in the world1
Market leadership position held by the “Big 5” Canadian Banks
Canadian chartered banks account for more than 70% of the residential mortgage market2
Mortgage lenders have recourse to both borrower and property in most provinces
Network of 1,169 branches and 2,827 ATMs Composite market share of 21% Ranked #1 or #2 in market share for most
retail products Top tier dual credit card issuer
Over 9,000+ banks with market leadership position held by a few large banks
The 5 largest banks have assets > 50% of the U.S. economy
Mortgage lenders have limited recourse in most jurisdictions
Network of 1,312 stores and 1,884 ATMs Operations in 5 of the top 10 metropolitan
statistical areas and 7 of the 10 wealthiest states > US$1.6T deposits market4
US$200B in mortgage originations5
Access to nearly 55 million customers within five miles of TD stores

6
TD Bank Group in North America
TD is a Top 10 Bank in North America 1. See slide 4, footnote 3, for definition of adjusted results. 2. Effective Q1/13, amounts are calculated in accordance with the Basel III regulatory framework, and are presented based on the “all-in”
methodology. Prior to Q1/13, amounts were calculated in accordance with the Basel II regulatory framework. See slide 19 for more detail. 3. Average number of full-time equivalent staff for Q3/13. 4. See slide 4, footnote 2. 5. Canadian Peers – includes other 4 big banks (RY, BMO, BNS and CM) adjusted on a comparable basis to exclude identified non-underlying items. Based on Q3/13 results ended July 31, 2013. 6. North American Peers – includes Canadian Peers and U.S. Peers. U.S. Peers – includes Money Center Banks (C, BAC, JPM) and Top 2 Super-Regional Banks (WFC, USB). Adjusted on a comparable basis to exclude identified non-underlying
items. For U.S. Peers, based on Q2/13 results ended June 30, 2013.
Q3 2013
(C$ billions)
Compared to:
Canadian Peers5
North American
Peers6
Total Assets $835B 2nd 6th
Total Deposits $508B 2nd 6th
Market Cap (as of August 30, 2013) $82B 2nd 6th
Adj. Net Income1 (Trailing 4 Quarters) $7.1B 2nd 6th
Rpt. Net Income (Trailing 4 Quarters) $6.6B n/a n/a
Tier 1 Capital Ratio2 11.0% 4th 9th
Avg. # of Full-Time Equivalent Staff3 78,917 2nd 6th
Moody’s Rating4 Aa1 n/a n/a

7
Composition of Earnings
Retail-focused earnings mix
YTD’13 Normalized Adj. Retail Earnings2,5,6 = 91% $2,158
$7,075
2001 2012
58%
42%
88%
13%
TD is a top 10 bank in North America1
Increasing retail focus Strength of retail franchise Reliable and steady earnings mix
Adjusted Retail Earnings2,6
Wholesale Earnings
Highlights
12%
1. See slide 6. 2. See slide 4, footnote 3, for definition of adjusted results. 3. TD had a reported investment in TD Ameritrade of 42.24% as at July 31, 2013. 4. The “Wealth & Insurance” business segment is comprised of “Wealth & Insurance” and “TD Ameritrade”. 5. For the purposes of calculating a YTD normalized earnings mix (i.e. one the Bank considers would be reflective of normal operations), the $418MM after tax charge taken in the Insurance business in Q3/13 has been excluded from this
figure, which results in normalized YTD earnings of $997MM for Wealth & Insurance (ex-AMTD). The YTD earnings for Wealth & Insurance (ex-AMTD) is $579MM including the Q3/13 charge of $418MM. 6. For the purpose of calculating contribution by each business segment, adjusted earnings from the Corporate segment are excluded. For a definition of retail earnings, see slide 4, footnote 4.
4
Canadian P&C49%
Wealth & Insurance
17%
TD AMTD3%
U.S. P&C22%
Wholesale9%
3,4
4,5

8
Evolution of TD Building Franchise Businesses
Wound down structured products business
Exited non-franchise
proprietary trading
Recorded media/ telecom/energy
loan losses
Did not acquire large-scale investment
dealer
Exited non-franchise
credit products
>>> Increasing Retail focus >>>
Traditional Dealer >>> >>> Franchise Dealer
Strategic evolution to a lower-risk retail focused bank with a franchise dealer
• • • • • • • • • • • • • Late ‘90s
2000 2001 2002- 2004
2005 2006 2007 2008 2009 2010 2011 2012 2013
TD Bank and Canada Trust merge
Acquired 51% of
Banknorth
Privatized TD
Banknorth
Acquired Commerce
Bank
Acquired Newcrest Capital
TD Waterhouse
USA/ Ameritrade transaction
Commerce Bank
integration
Acquired Riverside & TSFG
Acquired Chrysler Financial
and MBNA credit card portfolio
Acquired Target credit card portfolio & Epoch and announced agreement with Aimia

9
Our Risk Appetite
Integrated risk monitoring and reporting To senior management and Board of Directors
Regular review, evaluation and approval of risk framework Structured Risk Appetite governance, from the Business to the Board Executive Committees and Risk Committee of the Board
Risk Management Framework
Fit our business strategy and can be understood and managed
Do not expose the enterprise to any significant single loss events; we don’t “bet the bank” on any single acquisition, business or product
Do not risk harming the TD brand
We take risks required to build our business, but only if those risks:
Proactive and disciplined risk management practices
10
TD Bank Group – Key Messages
Top 10 Retail Focused North American Bank1 1
Proven Performance
Strong Balance Sheet and Capital Position
Focused on Growth Opportunities 4
2
3
1. See slide 6.

11
Solid Growth and Returns Across Businesses
$4,189 $3,813
$4,716
$5,228
$6,432
$7,075
$5,337
2007 2008 2009 2010 2011 2012 YTD 2013
Adjusted Retail Earnings as % of Adjusted Earnings
80% 98% 78% 83% 87% 88%
Wholesale Banking U.S. P&C Wealth & Insurance2
Canadian P&C2
1. The Bank transitioned from Canadian Generally Accepted Accounting Principles (GAAP) to International Reporting Standards (IFRS) effective November 1, 2011. As a result of this transition, balances presented in the graph above are based on Canadian GAAP for 2008 to 2010 and based on IFRS for 2011 to 2012. For details on the Bank’s transition from Canadian GAAP to IFRS please see Note 40 of the 2012 Financial Statements and Notes. See slide 4. footnote 3 for definition of adjusted results. See also pages 186-191 of the 2012 Annual Report for a reconciliation for 10 years ending FY12. For the purpose of calculating contribution by each business segment, adjusted earnings from the Corporate segment are excluded. For additional information, also see the Canadian P&C, Wealth & Insurance, U.S. P&C and Wholesale segment discussions in the Business Segment Analysis section of the 2007-2012 Annual Reports.
2. Effective July 4, 2011, executive responsibilities for TD Insurance were moved from Group Head Canadian P&C Segment to Group Head Wealth Segment. Results are updated to the future reporting format for segment reporting purposes effective Q1 2012. These changes were applied retroactively to 2011 for comparative purposes.
3. As a result of the Bank’s transition to IFRS as described above, the calculation of the Compounded Annual Growth Rate (CAGR) includes balances based on Canadian GAAP from 2008 to 2010 and balances based on IFRS from 2011 to 2012.
Targeting 7-10% adjusted EPS growth over the medium term
Adjusted Earnings1,2 (C$MM)
90%

12
13.9%9.6% 10.9% 12.5%
16.8%
9.4% 10.9% 10.5%
37.6%
10.8%
4.2% 5.4%
Strong Total Shareholder Returns
1 Year 3 Years 5 Years 10 Years
NA Peers3
CDN Peers2
Delivering top tier long-term shareholder returns
1. Compounded Annual Growth Rates (CAGRs) for all periods ended July 31, 2013. Source: Bloomberg. 2. Canadian Peers – includes other 4 big banks (RY, BMO, BNS and CM). 3. North American Peers – includes Canadian Peers and U.S. Peers. U.S. Peers – includes Money Center Banks (C, BAC, JPM) and Top 3 Super-Regional Banks (WFC, PNC, USB). All figures are in local currency.
Total Shareholder Return (CAGR1)

13
Strong, Consistent Dividend History
1993 1994 1995 1996 1997 1998 1999 2000 2001 2002 2003 2004 2005 2006 2007 2008 2009 2010 2011 2012 2013
$3.24 Announced
$0.38 Q3/12: Increased
Target Payout Range to 40%-50%3
Q3/13: Announced
$0.04 dividend increase1
Dividend Yield: 3.7%2
Dividend has grown over time
1. Payable on October 31, 2013. 2. Dividend yield based on dividend per share for trailing four quarters (ending Q3/13) divided by average of high and low common share prices for the period. 3. In Q3/12, the Bank’s target payout range was changed to 40-50% of adjusted earnings.
Dividends Per Share (C$)

14
Q3 2013 Highlights
Dividend per Common Share
= Announced dividend increase
Key Themes
1. See slide 4, footnote 3 for definition of adjusted results. 2. See slide 4, footnote 4 for definition of retail earnings. Reported retail results were $1,425 million, down 11% and 6% versus Q2/13 and Q3/12 respectively.
Net Income $MM (Adjusted, where applicable)1
Adjusted1 EPS decline of 14% YoY driven by Insurance loss
Record quarter for Canadian P&C, Wealth Management and U.S. P&C
Credit quality continues to improve in Canada and the U.S.
Strong capital ratio of 8.9%
Very strong results impacted by insurance charges
Q3/13 QoQ YoY
Retail2 $ 1,449 -12% -10%
Wholesale 147 -33% -18%
Corporate (8) -69% n/a
Adjusted Net Income $ 1,588 -13% -13%
Reported Net Income 1,527 -11% -10%
Adjusted EPS (diluted) $ 1.65 -13% -14%
Reported EPS (diluted) 1.58 -11% -11%
Basel III CET1 Ratio 8.9%

15
Q3 2013 Operating Highlights
Canadian P&C
Adjusted earnings1 up 12% YoY Record adjusted revenue and net income Lending volumes strong in business and solid in personal Adjusted expenses up 2% YoY
New record, strong credit and improved
efficiency
Wealth & Insurance
Record Wealth earnings up 18% YoY due to higher fee-based revenue, the addition of Epoch and improved trading volumes
Insurance loss of $243 million: strengthened reserves for general insurance claims and severe weather-related events
Contribution from TD Ameritrade was $69MM (up 23% YoY)
Record results for Wealth; Challenging quarter for Insurance
U.S. P&C
Adjusted earnings1 up 22% YoY Strong loan growth of 12%2 and deposit growth of 11% YoY Credit quality improved: improved commercial asset quality Adjusted expenses up 28% YoY primarily due to Target and
investments in growth initiatives
A good result in a challenging environment
Wholesale
Earnings down 18% YoY Lower trading-related revenues partially offset by reduced
expenses Return on common equity of 14.3% Maintained top-three dealer status in Canada3
Softer quarter for Wholesale
Key Themes by Segment
Delivering solid result in a challenging environment
1. Adjusted results are defined on slide 4, footnote 3. Reported earnings in Q3 2013 for Canadian P&C was C$973MM and for US P&C was US$432MM. 2. Excluding the impact of the Target U.S. credit card portfolio acquisition. 3. See slide 30 footnote 3.
16
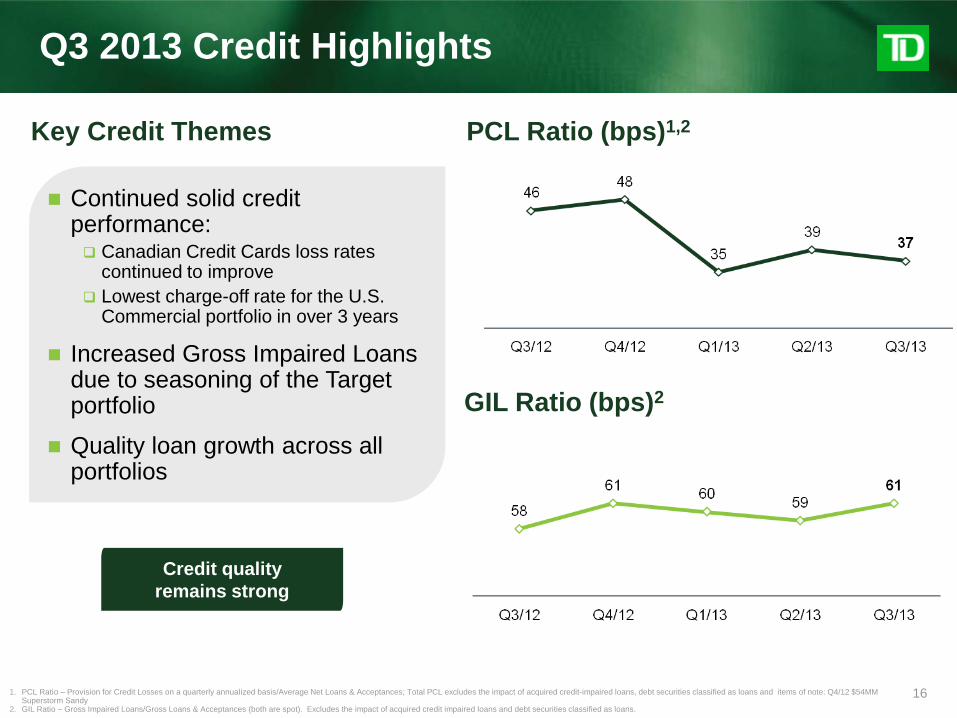
Q3 2013 Credit Highlights
PCL Ratio (bps)1,2
GIL Ratio (bps)2
Key Credit Themes
Credit quality remains strong
1. PCL Ratio – Provision for Credit Losses on a quarterly annualized basis/Average Net Loans & Acceptances; Total PCL excludes the impact of acquired credit-impaired loans, debt securities classified as loans and items of note: Q4/12 $54MM Superstorm Sandy
2. GIL Ratio – Gross Impaired Loans/Gross Loans & Acceptances (both are spot). Excludes the impact of acquired credit impaired loans and debt securities classified as loans.
Continued solid credit performance: Canadian Credit Cards loss rates
continued to improve Lowest charge-off rate for the U.S.
Commercial portfolio in over 3 years
Increased Gross Impaired Loans due to seasoning of the Target portfolio
Quality loan growth across all portfolios

17
TD Bank Group – Key Messages
Top 10 Retail Focused North American Bank1 1
Proven Performance
Strong Balance Sheet and Capital Position
Focused on Growth Opportunities 4
2
3
1. See slide 6.

18
Attractive Balance Sheet Composition
Funding Mix1 Wholesale Term Debt2
1. As of July 31, 2013. Excludes certain liabilities which do not create funding which are: acceptances, trading derivatives, other liabilities, non-controlling interest and certain equity capital: common equity and other capital instruments 2. As of July 31, 2013 3. Bank, Business & Government Deposits less covered bonds and senior MTN notes 4. Obligations related to securities sold short and sold under repurchase agreements 5. Based on first par redemption date. Any assumption on the timing of a redemption is subject to management’s view at the time of redemption as well as applicable regulatory and corporate governance approvals
P&C Deposits 71%
Personal Term Deposits
9%
Personal Non-Term Deposits
36%
Other Deposits3
26%
Short Term Liabilities4
11%
Senior Unsecured MTN 26%
Covered Bonds 15%
Residential Mortgages 58%
Personal Term Deposits
9%
Personal Non-Term Deposits 37%
Other Deposits3 25%
Short Term Liabilities 4
10%
Wholesale Term Debt 10%
Trading Deposits
8%
Sub-Debt 5
1% Credit Card Receivables &
Consumer Installment Loans
1%
Assets Securitized 59%
Personal and commercial deposits are primary sources of funds

19
Strong Capital Position
Basel III Common Equity Tier 11 Highlights
Remain well-positioned for evolving regulatory and capital environment
Risk-Weighted Assets1 (C$B)
Basel III Common Equity Tier 1 ratio of 8.9% as of July 31, 2013 Includes 30 bps of relief from OSFI
on treatment of CVA
Managing capital volatility – AOCI
Dividend increase of $0.04 per share payable in Q4 2013
Share buyback program on track with over 7 million shares repurchased (as at August 23)
1. Effective Q1/13, amounts are calculated in accordance with the Basel III regulatory framework, excluding Credit Valuation Adjustment Capital (CVAc) in accordance with OSFI guidance and are presented based on the “all-in” methodology. Basel III Common Equity Tier 1 ratios reported in 2012 are pro-forma estimates reported in the Q4/12, Q3/12, Q2/12 and Q1/12 MD&A (available at td.com).

20
Strong Focus on Risk – Adjusted Return
1. As a result of the transition to IFRS as described on slide 11, footnote 1, the calculation of risk-weighted assets is based on IFRS for 2012. Return on Risk-Weighted Assets (RWA) is adjusted net income available to common shareholders divided by average RWA. Adjusted results are defined on slide 4, footnote 3. Effective Q1/13, amounts are calculated in accordance with the Basel III regulatory framework, and are presented based on the “all-in” methodology. 2. TD based on Q3/13 adjusted results as defined on slide 4, footnote 3. 3. Canadian Peers – includes other big 4 banks (RY, BMO, BNS, and CM). Based on Q3/13 results ended July 31, 2013. 4. U.S. Peers – includes Money Center Banks (C, BAC, JPM) and Top 2 Super-Regional Banks (WFC, USB). Based on Q2/13 results ending June 30, 2013. 5. Ratings on long term debt (deposits) of The Toronto-Dominion Bank, as at July 31, 2013. Credit ratings are not recommendations to purchase, sell, or hold a financial obligation inasmuch as they do not comment on market price or suitability for a
particular investor. Ratings are subject to revision or withdrawal at any time by the rating organization.
Highly rated franchise
Citations
Global Finance magazine ranked TD as the Safest Bank in North America and one of the World’s 50 Safest Banks (February 2013)
Bloomberg Markets magazine ranked TD as the world’s 8th strongest bank in 2013
Euromoney magazine named TD Best Bank in Canada in 2013
Adjusted Return on Risk-Weighted Assets1
1.65%
2.45%2.14%
TD Canadian Peers U.S. Peers2
Moody's S&P Fitch DBRS
Aa1 AA- AA- AA
Ratings5
3 4
21
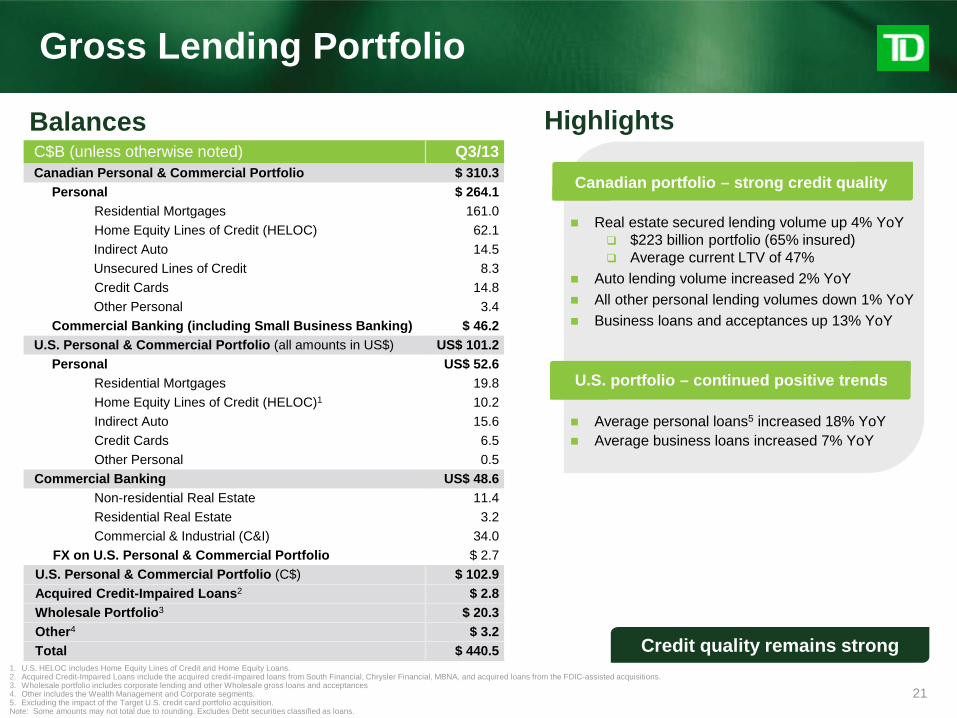
Gross Lending Portfolio
Canadian portfolio – strong credit quality
U.S. portfolio – continued positive trends
Highlights C$B (unless otherwise noted) Q3/13 Canadian Personal & Commercial Portfolio $ 310.3
Personal $ 264.1 Residential Mortgages 161.0 Home Equity Lines of Credit (HELOC) 62.1 Indirect Auto 14.5 Unsecured Lines of Credit 8.3 Credit Cards 14.8 Other Personal 3.4
Commercial Banking (including Small Business Banking) $ 46.2 U.S. Personal & Commercial Portfolio (all amounts in US$) US$ 101.2
Personal US$ 52.6 Residential Mortgages 19.8 Home Equity Lines of Credit (HELOC)1 10.2 Indirect Auto 15.6 Credit Cards 6.5 Other Personal 0.5
Commercial Banking US$ 48.6 Non-residential Real Estate 11.4 Residential Real Estate 3.2 Commercial & Industrial (C&I) 34.0
FX on U.S. Personal & Commercial Portfolio $ 2.7 U.S. Personal & Commercial Portfolio (C$) $ 102.9 Acquired Credit-Impaired Loans2 $ 2.8 Wholesale Portfolio3 $ 20.3 Other4 $ 3.2 Total $ 440.5
Real estate secured lending volume up 4% YoY $223 billion portfolio (65% insured) Average current LTV of 47%
Auto lending volume increased 2% YoY All other personal lending volumes down 1% YoY Business loans and acceptances up 13% YoY
Average personal loans5 increased 18% YoY Average business loans increased 7% YoY
Balances
Credit quality remains strong 1. U.S. HELOC includes Home Equity Lines of Credit and Home Equity Loans. 2. Acquired Credit-Impaired Loans include the acquired credit-impaired loans from South Financial, Chrysler Financial, MBNA, and acquired loans from the FDIC-assisted acquisitions. 3. Wholesale portfolio includes corporate lending and other Wholesale gross loans and acceptances 4. Other includes the Wealth Management and Corporate segments. 5. Excluding the impact of the Target U.S. credit card portfolio acquisition. Note: Some amounts may not total due to rounding. Excludes Debt securities classified as loans.

22
TD Bank Group – Key Messages
Top 10 Retail Focused North American Bank1 1
Proven Performance
Strong Balance Sheet and Capital Position
Focused on Growth Opportunities 4
2
3
1. See slide 6.
23
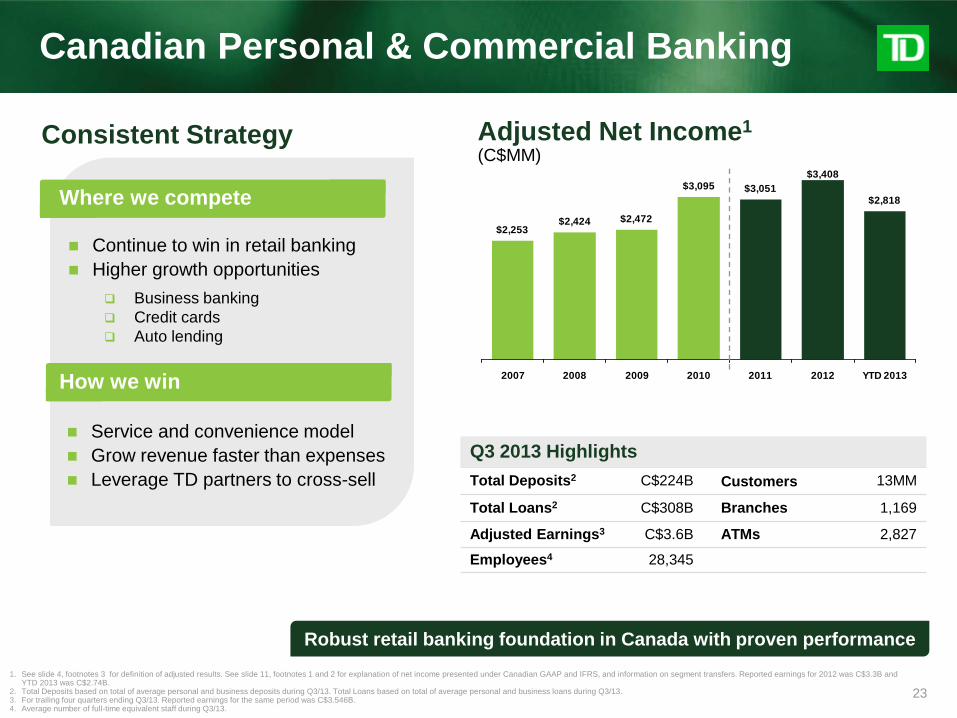
Adjusted Net Income1 (C$MM)
Canadian Personal & Commercial Banking
$2,253$2,424 $2,472
$3,095 $3,051$3,408
$2,818
2007 2008 2009 2010 2011 2012 YTD 2013
Q3 2013 Highlights
Total Deposits2 C$224B Customers 13MM
Total Loans2 C$308B Branches 1,169
Adjusted Earnings3 C$3.6B ATMs 2,827
Employees4 28,345
Continue to win in retail banking Higher growth opportunities
Business banking Credit cards Auto lending
Service and convenience model Grow revenue faster than expenses Leverage TD partners to cross-sell
Where we compete
How we win
Robust retail banking foundation in Canada with proven performance 1. See slide 4, footnotes 3 for definition of adjusted results. See slide 11, footnotes 1 and 2 for explanation of net income presented under Canadian GAAP and IFRS, and information on segment transfers. Reported earnings for 2012 was C$3.3B and
YTD 2013 was C$2.74B. 2. Total Deposits based on total of average personal and business deposits during Q3/13. Total Loans based on total of average personal and business loans during Q3/13. 3. For trailing four quarters ending Q3/13. Reported earnings for the same period was C$3.546B. 4. Average number of full-time equivalent staff during Q3/13.
Consistent Strategy

24
Canadian Personal & Commercial Banking
Leaders in customer service and convenience TD has opened approximately 1 out of every 3 new branches1
On average 45% longer branch hours than peers2
Sunday banking in more than 420 branches
Integrated product offerings #1 or #2 market share in most retail products3
Client referrals and product offerings from across TD family Announced primary issuer agreement with Aimia in August 2013
Relentless focus on operational excellence Best-in-class operational efficiency Customer experience embedded in process and technology Disciplined approach, grow revenues faster than expenses
Consistently reinvesting for the long-term Optimize footprint by balancing branch openings and closings Focus on productivity gains through disciplined expense management Continue to build on our momentum of higher growth businesses:
Business banking – Only bank to increase market share from 2008 to 2011
Credit cards – Leading market share in Canada and untapped U.S. potential Indirect auto lending – North American scale of 12,000+ dealers Under-represented regions – Quebec
8th JD Power Award win in a row4
9th IPSOS Best Banking win in a row5
Target 7-10% earnings growth over the medium term
1. Branches opened by TD vs. Canadian peers from Q1/08 to Q3/13. Canadian Peers – other 4 big banks (RY, BNS, BMO and CM). 2. As at July 31, 2013. Canadian Peers – other 4 big banks (RY, BNS, BMO and CM). 3. Source: Canadian Bankers Association, as at May 2013. 4. TD Canada Trust received the highest numerical score among the big 5 retail banks in the proprietary J.D. Power and Associates 2006-2013 Canadian Retail Banking Customer Satisfaction StudiesSM. 2013 study based on more than 21,000 total
responses. Proprietary study results are based on experiences and perceptions of consumers surveyed between May 7 and May 24, 2013. Your experiences may vary. Visit jdpower.com 5. Rated #1 among Canada’s five major banks for “Overall quality of customer service” by independent market research firm Ipsos (formerly Synovate) from 2005 – 2013.

25
Wealth & Insurance
Q3 2013 Highlights Wealth Assets (AUA) C$279B
Wealth Assets (AUM) C$246B
Insurance Gross Originated Premiums2 C$3.7B
Earnings2 C$1.0B
Employees3 11,661
Consistent Strategy
Wealth Mass affluent and high net worth TD clients in
Canada and U.S.
Self-directed investors in selected markets
Institutional asset management in Canada
Insurance Underserved Canadian mass market
TD customers
Products that meet our risk appetite (Home &
Auto, Life & Health, Creditor and Travel)
Legendary TD client experience
Leverage TD brand and client base
Direct distribution
Conservative risk appetite
Net Income1
(C$MM) Where we compete
How we win
$501 $480$345 $447
$566 $601 $504
$261 $289
$252$194
$207 $209$169
$541 $557
$75$762 $769
$597 $641
$1,314 $1,367
$748
2007 2008 2009 2010 2011 2012 YTD 2013
Wealth TD Ameritrade Insurance
1. See slide 11, footnotes 1 and 2 for explanation of net income presented under Canadian GAAP and IFRS and information on segment transfers. 2. For trailing four quarters ending Q3/13. 3. Average number of full-time equivalent staff during Q3/13.
Strong franchise – poised for growth
26
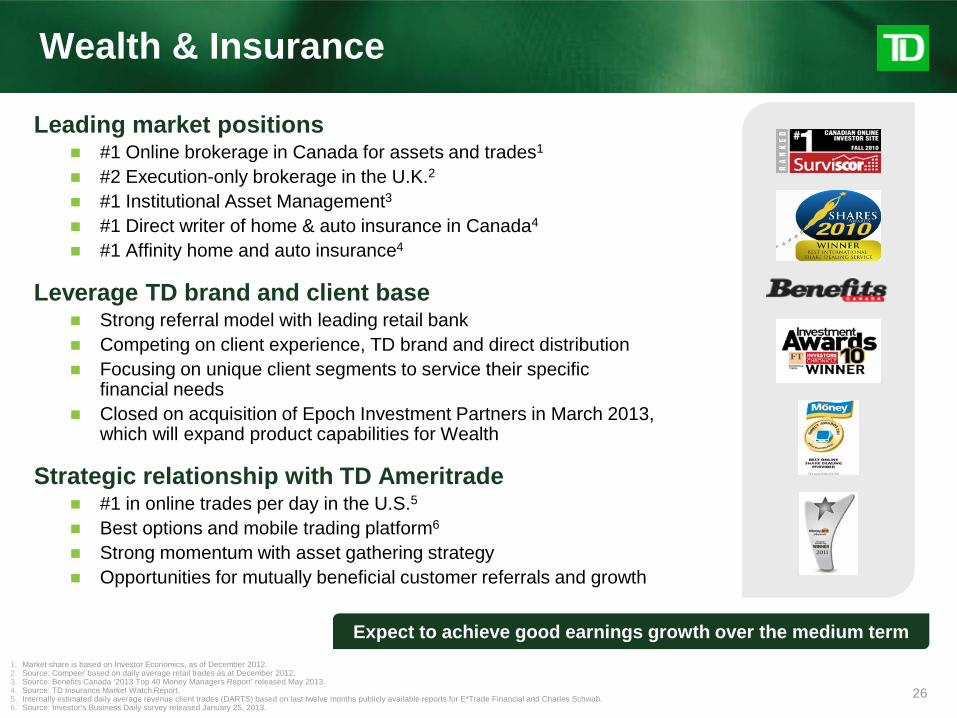
Wealth & Insurance
Leading market positions #1 Online brokerage in Canada for assets and trades1 #2 Execution-only brokerage in the U.K.2
#1 Institutional Asset Management3 #1 Direct writer of home & auto insurance in Canada4 #1 Affinity home and auto insurance4
Leverage TD brand and client base Strong referral model with leading retail bank Competing on client experience, TD brand and direct distribution Focusing on unique client segments to service their specific
financial needs Closed on acquisition of Epoch Investment Partners in March 2013,
which will expand product capabilities for Wealth
Strategic relationship with TD Ameritrade #1 in online trades per day in the U.S.5
Best options and mobile trading platform6
Strong momentum with asset gathering strategy Opportunities for mutually beneficial customer referrals and growth
1. Market share is based on Investor Economics, as of December 2012. 2. Source: Compeer based on daily average retail trades as at December 2012. 3. Source: Benefits Canada ‘2013 Top 40 Money Managers Report’ released May 2013. 4. Source: TD Insurance Market Watch Report. 5. Internally estimated daily average revenue client trades (DARTS) based on last twelve months publicly available reports for E*Trade Financial and Charles Schwab. 6. Source: Investor’s Business Daily survey released January 25, 2013.
Expect to achieve good earnings growth over the medium term

27
U.S. Personal & Commercial Banking
$359
$806$909
$1,042
$1,270
$1,422
$1,228
2007 2008 2009 2010 2011 2012 YTD 2013
Consistent Strategy
1. Metropolitan Statistical Area 2. See slide 4, footnote 3 for definition of adjusted results. Also see slide 11, footnotes 1 and 2 for explanation of net income presented under Canadian GAAP and IFRS. Reported earnings in 2007 was C$320MM, 2008 was C$722MM, 2009 was
C$633MM, 2010 was C$973MM, 2011 was C$1,188MM, 2012 was C$1,128MM and YTD 2013 was C$1,158MM. 3. Total Deposits based on total of average personal deposits, business deposits and TD Ameritrade Insured Deposit Accounts (IDAs) during Q3/13. Total Loans based on total of average personal and business loans during Q3/13. 4. For trailing four quarters ending Q3/13. See slide 4, footnote 3, for definition of adjusted results. Reported earnings for the same period was C$1,474MM. 5. Average number of full-time equivalent staff during Q3/13.
Adjusted Net Income2
($MM)
Retail and commercial banking along the Eastern Seaboard
Operate in 5 of the top 10 MSAs1 and 7 of the 10 wealthiest states
Focused on higher growth markets and products
Unique value proposition
Regional banking model
De novo growth
Accelerate cross-sell
Drive efficiencies
US$
C$
Where we compete
How we win
$328 $794 $1,008 $781 $1,289 $1,416
Significant scale and enviable footprint
Q3 2013 Highlights
Total Deposits3 C$193B Customers 8MM
Total Loans3 C$106B Stores 1,312
Adjusted Earnings4 C$1.6B ATMs 1,884
Employees5 24,811
$1,211

28
U.S. Personal & Commercial Banking
Lead in customer service and convenience Committed to providing legendary service and unparalleled convenience Open longer than the competition, including Sunday banking in most markets 24/7/365 live customer contact center support
Significant scale and enviable footprint Operating retail stores in 15 states and the District of Columbia Top 10 U.S. bank with 8MM+ customers Closed acquisition of Target U.S. Credit Card portfolio in March 2013
Disciplined credit culture In-footprint lending Conservative product suite Distribution through proprietary channels, not brokers
Continued organic growth and de novo expansion Targeting top 5 market share in our major markets, including #3 deposit share in New York Opened 41 stores in fiscal 2012 and will continue to open stores in higher growth markets
during fiscal 2013 (e.g., Boston, South Florida and New York City) Cross-sell initiatives progressing as franchise matures
Expect modest earnings growth given interest rate challenges
From MONEY® Magazine, October 2012 © 2012 Time Inc. MONEY is a registered trademark of Time Inc. and is used under license. MONEY and Time Inc. are not affiliated with, and do not endorse products or services of TD Bank, N.A.

29
Wholesale Banking
$824
$65
$1,137
$987
$815$880
$526
2007 2008 2009 2010 2011 2012 YTD 2013
1. See slide 4, footnote 3 for definition of adjusted results. Also see slide 11, footnotes 1 and 2 for definition of adjusted results and explanation of net income presented under Canadian GAAP and IFRS. Reported earnings in 2010 was C$866MM. 2. Effective Q1/13, amounts are calculated in accordance with the Basel III regulatory framework, and are presented based on the “all-in” methodology. Prior to Q1/13, amounts were calculated in accordance with the Basel II regulatory framework. 3. For trailing four quarters ending Q3/13. 4. Average number of full-time equivalent staff during Q3/13.
Consistent Strategy
A client-centric wholesale franchise
Where we compete
How we win
Q3 2013 Highlights Risk-Weighted Assets2 C$46B
Earnings3 C$835MM
Employees4 3,592
Adjusted Net Income1
(C$MM)
Canada Be the top-ranked integrated investment
dealer
U.S. Extend the goals of the Canadian franchise Be a Wholesale dealer to U.S. P&C Grow U.S. fixed income and foreign
exchange
Outside North America Be a niche player in franchise/client-driven
businesses (energy and mining, super-sovereign agencies, fixed income, foreign exchange)
Franchise businesses
Alignment to TD
Disciplined risk approach

30
Wholesale Banking
Focus on client-driven franchise businesses Diversified business mix with a North American focus Presence in key global financial centres Evolved the business model by strategically repositioning
the dealer to concentrate on core-client driven activities (e.g.: exited global structured products before the financial crisis)
A North American dealer aligned with our TD partners Focus on integrating the strength of TD brand and partnering
with our retail franchises
Solid returns without going out the risk curve Disciplined and proactive risk management Delivered strong business results while repositioning the dealer
Well positioned for growth Build on position as top 3 dealer in Canada3
Grow U.S. fixed income, foreign exchange and commodities & precious metal businesses
Extend competitive advantages outside North America
1. Named Top-Rated Prime Broker in Canada (Source: Global Custodian Survey 2013). 2. Source: IRESS; Canadian equity block trades by value on all Canadian exchanges. 3. Ranked # 1 Completed M&A Advisor (Source Thomson Financial 2012); Ranked # 1 Block Trader on TSX (Source TSX 2012); Ranked # 1 Lead Arranger of Canadian Syndicated Loans (Source Thomson Financial 2012), #2 Corporate Debt
Underwriting (Source Bloomberg 2012); Ranked # 3 Equity Underwriter (Source Thomson Financial 2012); Ranked # 3 Announced M&A Advisor (Source Thomson Financial 2012).
Targeting 15-20% ROE with acceptable risk
Top-Rated Prime Broker
in Canada1
Twelve years as Top Equity
Block Trader in Canada2
31
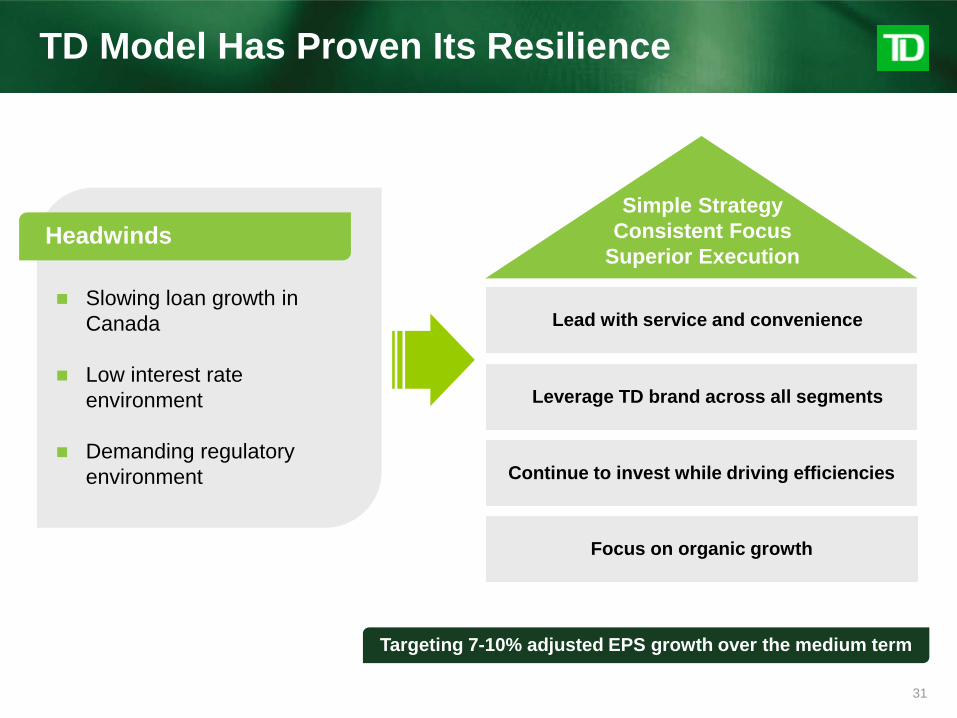
TD Model Has Proven Its Resilience
Targeting 7-10% adjusted EPS growth over the medium term
Slowing loan growth in Canada
Low interest rate environment
Demanding regulatory environment
Headwinds
Continue to invest while driving efficiencies
Leverage TD brand across all segments
Lead with service and convenience
Focus on organic growth
Simple Strategy Consistent Focus
Superior Execution

32
Commitment to Corporate and Social Responsibility
One of Canada’s “Most Responsible Companies” (Macleans magazine and Sustainalytics, in both 2011 and 2012)
One of the “Best 50 Corporate Citizens in Canada” (Corporate Knights, 2011 and 2012)
Best Bank in North America by Euromoney three years running
Greenwich Excellence Awards: National Award in Middle Market Banking for Financial Stability, Northeast Regional Award in Treasury Management for Overall Satisfaction
TD Bank ranked #1 by Brand Finance Canada as Canada’s most valuable brand (2012)
One of the 50 Best Employers in Canada and one of the Top 30 Green Employers1
Named one of The Best Places to Work for LGBT Equality in the U.S. by Human Rights Campaign for the third consecutive year
Recognized as one of the Top 125 training organizations in the world by Training Magazine for the fourth consecutive year
Corporate Knights’ Diversity in the Boardroom Report ranked TD #7 in its Top 10 for Female Representation on Canadian Boards (2012)
Diversity Leadership Council led by senior executives embeds diversity into business plans
For further information about Corporate Responsibility, please visit http://www.td.com/corporateresponsibility/. 1. According to AON Hewitt’s “50 Best Employers in Canada” for 2008 - 2012 and Hewitt’s “Green 30” in Canada for 2010 - 2012.
Supporting customers and employees
Corporate Leadership Extraordinary Workplace that Embraces Diversity
Corporate Responsibility Recognized by sustainability indices
Dow Jones Sustainability Index North America Ethibel Sustainability Index Global Jantzi Social Index FTSE4Good Index Nasdaq OMX CRD Global Sustainability Index 2011 Bloomberg Global Corporate Renewable Energy Index
Transparency and disclosure in reporting demonstrated by a B+ level GRI rating

33
Environmental Leadership & Community Engagement
For further information about Corporate Responsibility, please visit http://www.td.com/corporateresponsibility/.
One of the world’s top 500 corporate environmental leaders (Newsweek 2012)
One of Canada’s top 20 organizations in terms of our approach to greenhouse gas emissions and disclosure (2012 CDP Canada 200 Carbon Disclosure Leadership Index)
First North American-based bank to become carbon neutral (as of Feb.18th, 2010)
One of Canada’s Greenest Employers (Mediacorp Canada Inc., 2010, 2011 and 2012)
Market leader in Canada in financing renewables for retail and commercial through Ontario’s Feed in Tariff Program
Named EPA Green Partner of the Year in 2010 for use of green energy and received the Green Power Leadership Award (2012)
TD Bank’s Net Zero store received: The International Council of Shopping Center’s US
Design and Development Award for Sustainable Design The Community Appearance Award for Outstanding
Achievement in Urban Design (City of Ft. Lauderdale) in 2012 for its LEED design
The Chain Store Age Retail Store of the Year Award for Sustainable Design
TD Friends of the Environment Foundation celebrates 22 years Over 80,000 trees have been planted through TD Tree
Days, TD’s flagship volunteer program, in Canada, the US, the UK and Luxembourg.
Expect to plant another 45,000 trees to the Canadian landscape in 2013.
Taking responsibility to be The Better Bank
Environmental Leader
Community Involvement Donated more than C$65 million in 2012 to not-for-profit groups in
Canada, the U.S., and the U.K. Awarded Outstanding Community Reinvestment Act rating by
Office of the Comptroller (OCC) in June 2012 TD Bank WOW!Zone (U.S.) has taught more than one million
students (kids and their parents) about budgeting, saving and good financial habits
In 2012, more than 1.2 million kids benefitted from a children’s literacy program supported by TD
Framework of environmental/sustainability policies: TD Asset Management is a signatory to United Nations
Principles for Responsible Investment Sustainable Investment Policy applicable to all asset
management instruments Launched TD Forests in 2012, which will increase protected
forest areas and reduce paper consumption by at least 20% by 2015
Responsible lending through Environment and Social Risk Credit Management Policy and Equator Principles

34
Investor Relations Contacts
Phone: 416-308-9030
or 1-866-486-4826
Email: [email protected]
Website:
www.td.com/investor
Grand Prix for Best Overall Investor Relations: Large Cap
Best Investor Relations by
Sector: Financial Services
Best Investor Relations by a CEO: Large Cap
Best Investor Relations
by a CFO: Large Cap
Best Investment Community Meetings
Best Financial Reporting
Best Corporate Governance
Best Use of Technology
TD Bank Group Investor Presentation
Q3 2013