tcs financial results · of commercial software products that serves decision makers in the legal,...
TRANSCRIPT

1| Copyright © 2018 Tata Consultancy Services Limited
TCS Financial Results
Quarter III FY 2018 - 19
January 10, 2019

2
Disclaimer
Certain statements in this release concerning our future prospects are forward-looking statements. Forward-looking
statements by their nature involve a number of risks and uncertainties that could cause actual results to differ materially
from market expectations. These risks and uncertainties include, but are not limited to our ability to manage growth, intense
competition among Indian and overseas IT services companies, various factors which may affect our cost advantage, such
as wage increases or an appreciating Rupee, our ability to attract and retain highly skilled professionals, time and cost
overruns on fixed-price, fixed-time frame contracts, client concentration, restrictions on immigration, our ability to manage
our international operations, reduced demand for technology in our key focus areas, disruptions in telecommunication
networks, our ability to successfully complete and integrate potential acquisitions, liability for damages on our service
contracts, the success of the companies in which TCS has made strategic investments, withdrawal of governmental fiscal
incentives, political instability, legal restrictions on raising capital or acquiring companies outside India, unauthorized use of
our intellectual property and general economic conditions affecting our industry. TCS may, from time to time, make
additional written and oral forward-looking statements, including our reports to shareholders. These forward-looking
statements represent only the Company’s current intentions, beliefs or expectations, and any forward-looking statement
speaks only as of the date on which it was made. The Company assumes no obligation to revise or update any forward-
looking statements.
3
Q3 FY19 Performance Highlights
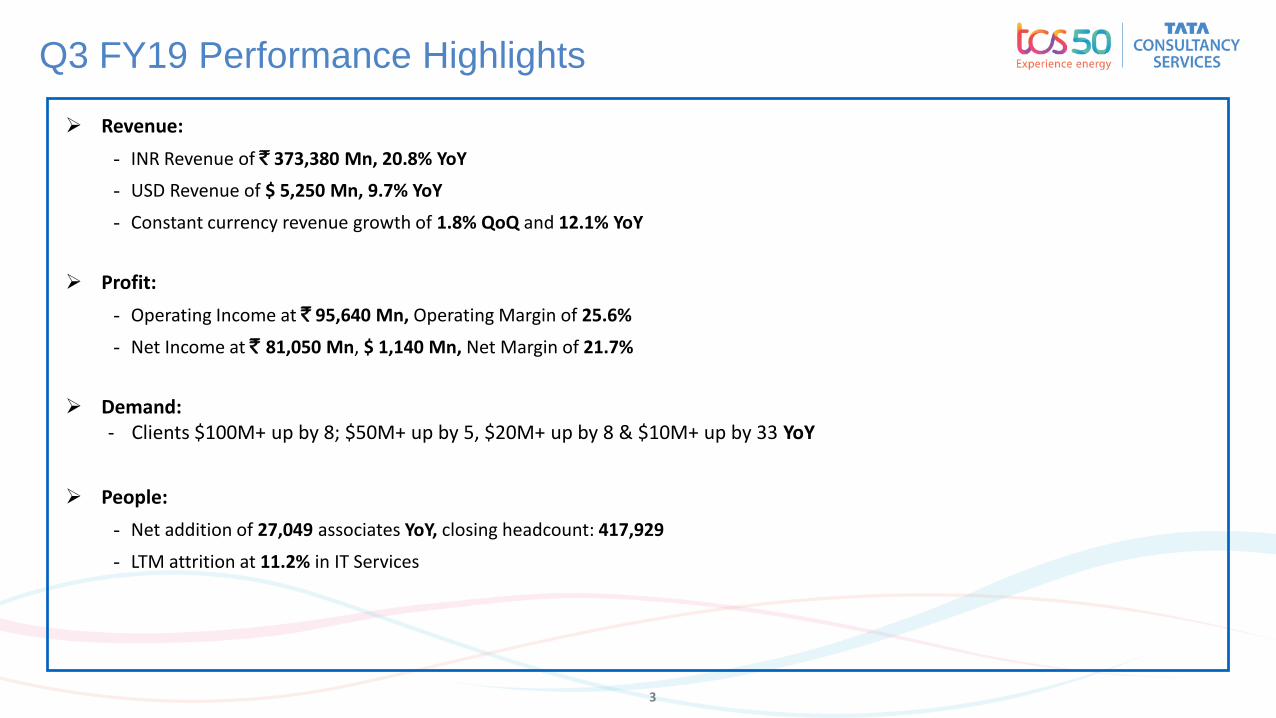
Revenue:
- INR Revenue of ` 373,380 Mn, 20.8% YoY
- USD Revenue of $ 5,250 Mn, 9.7% YoY
- Constant currency revenue growth of 1.8% QoQ and 12.1% YoY
Profit:
- Operating Income at ` 95,640 Mn, Operating Margin of 25.6%
- Net Income at ` 81,050 Mn, $ 1,140 Mn, Net Margin of 21.7%
Demand:- Clients $100M+ up by 8; $50M+ up by 5, $20M+ up by 8 & $10M+ up by 33 YoY
People:
- Net addition of 27,049 associates YoY, closing headcount: 417,929
- LTM attrition at 11.2% in IT Services

4
Growth Summary (INR)
309,040 320,750
342,610 368,540 373,380
Q3 FY18 Q4 FY18 Q1 FY19 Q2 FY19 Q3 FY19
Revenue
`M
illi
on
3.9%
8.2%
15.8%20.7%
20.8%
6.2%7.2%
9.3%11.5% 12.1%
Q3 FY18 Q4 FY18 Q1 FY19 Q2 FY19 Q3 FY19
Y-o-Y Growth Y-o-Y Growth CC
65,310 69,040
73,400
79,010 81,050
Q3 FY18 Q4 FY18 Q1 FY19 Q2 FY19 Q3 FY19
Net Income
`M
illi
on 21.1% 21.5% 21.4% 21.4% 21.7%
Q3 FY18 Q4 FY18 Q1 FY19 Q2 FY19 Q3 FY19
Net margin (%)
77,810 81,470 85,780
97,710 95,640
Q3 FY18 Q4 FY18 Q1 FY19 Q2 FY19 Q3 FY19
Operating Income
`M
illi
on 25.2% 25.4% 25.0%
26.5%25.6%
Q3 FY18 Q4 FY18 Q1 FY19 Q2 FY19 Q3 FY19
Operating margin (%)
5
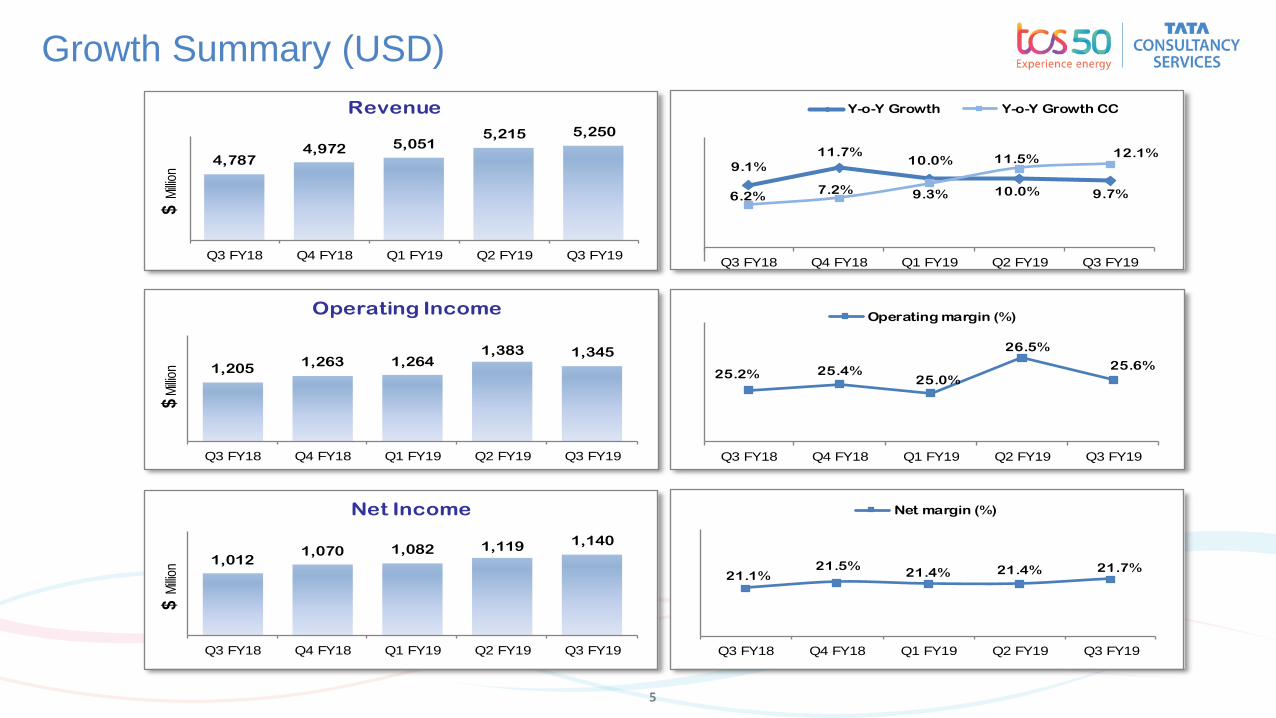
Growth Summary (USD)
4,7874,972 5,051
5,215 5,250
Q3 FY18 Q4 FY18 Q1 FY19 Q2 FY19 Q3 FY19
Revenue
$M
illion
1,0121,070 1,082 1,119 1,140
Q3 FY18 Q4 FY18 Q1 FY19 Q2 FY19 Q3 FY19
Net Income
$M
illion 21.1%
21.5%21.4% 21.4% 21.7%
Q3 FY18 Q4 FY18 Q1 FY19 Q2 FY19 Q3 FY19
Net margin (%)
1,2051,263 1,264
1,383 1,345
Q3 FY18 Q4 FY18 Q1 FY19 Q2 FY19 Q3 FY19
Operating Income
$M
illion 25.2% 25.4%
25.0%
26.5%
25.6%
Q3 FY18 Q4 FY18 Q1 FY19 Q2 FY19 Q3 FY19
Operating margin (%)
6.2%7.2% 9.3%
11.5%12.1%
9.1%
11.7%10.0%
10.0% 9.7%
Q3 FY18 Q4 FY18 Q1 FY19 Q2 FY19 Q3 FY19
Y-o-Y Growth Y-o-Y Growth CC

Operational Parameters
7
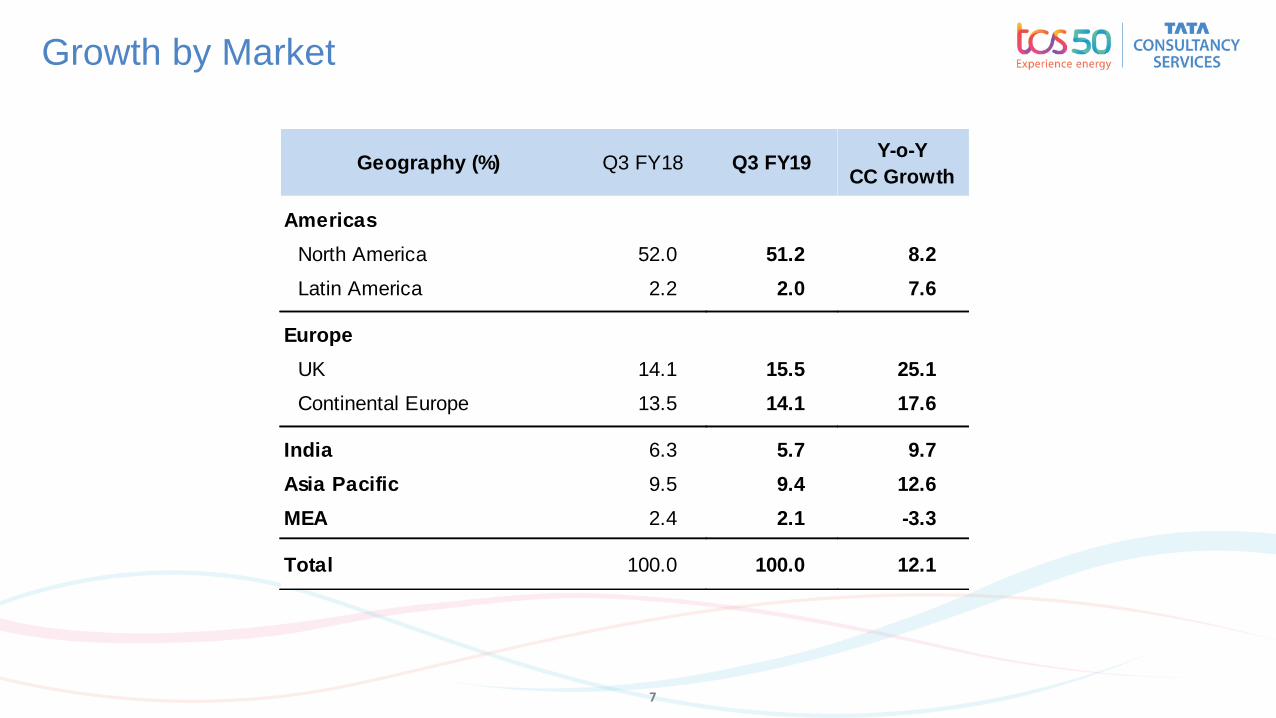
Growth by Market
Geography (%) Q3 FY18
Americas
North America 52.0
Latin America 2.2
Europe
UK 14.1
Continental Europe 13.5
India 6.3
Asia Pacific 9.5
MEA 2.4
Total 100.0
Q3 FY19
51.2
2.0
15.5
14.1
5.7
9.4
2.1
100.0
Y-o-Y
CC Growth
8.2
7.6
25.1
17.6
9.7
12.6
-3.3
12.1
8
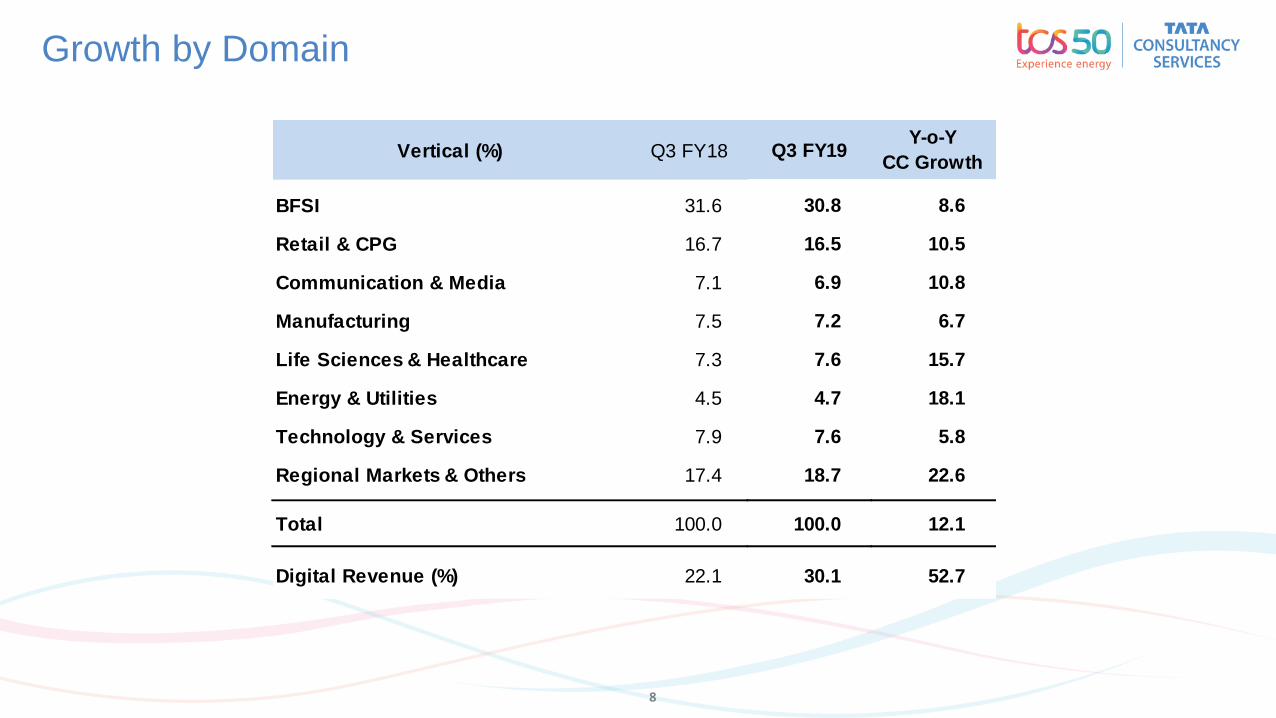
Growth by Domain
Vertical (%) Q3 FY18
BFSI 31.6
Retail & CPG 16.7
Communication & Media 7.1
Manufacturing 7.5
Life Sciences & Healthcare 7.3
Energy & Utilities 4.5
Technology & Services 7.9
Regional Markets & Others 17.4
Total 100.0
Digital Revenue (%) 22.1
Q3 FY19
30.8
16.5
6.9
7.2
7.6
4.7
7.6
18.7
100.0
30.1
Y-o-Y
CC Growth
8.6
10.5
10.8
6.7
15.7
18.1
5.8
22.6
12.1
52.7

9
Service Lines Commentary
• Strong revenue growth led by UK, andstronger pipeline growth led by UK &NA. IoT, TCS Interactive and CyberSecurity had an exceptionally strongquarter.
• Landmark quarter for TCS Interactivewith the acquisition of W12, an iconicdesign & experience studio, and theRed dot design award among otherrecognitions.
• Blockchain, Digital Workplace &Conversational Experiences continuedstrong pipeline buildup.
• TCS received several partner &industry recognitions & awards duringthe quarter.
Internet ofThings
Strong growth powered by MFDM™ &Cognitive Services. Strong demand acrossM&A, Digital Infrastructure, CognitiveBusiness Command Center, EnterpriseBusiness Processes & Intelligent ProcessAutomation.
Strong growth for IoT services andcontract wins, as adoption in facilitiesmanagement, fleet management, digitaltwin and image analytics saw strongtraction during the quarter. TCS launchedthe Intelligent Power Plant solution thisquarter.
TCS Interactive
Simplification & automation of Martechstacks, seamless integration across themarketing ecosystem, and marketinganalytics drove strong growth for ourInteractive services led by Digital Content,Digital Channels and Digital CommerceServices.
CyberSecurity
Ecosystem complexity, privacy concerns andincreased cybercriminal activity is leading tostrong growth for our Cyber Securityservices. Managed Security Services,Identity & Access Management andGovernance Risk & Compliance were themajor growth drivers during the quarter.
Cognitive Business
Operations & Enterprise Intelligent
Automation
Growing Digital Transformation drivingdemand led by M&A, Global Shared Servicesand Enterprise Agility. Large Agile wins withmarquee clients demonstrate the scaling ofagile adoption as well as the maturity of TCSlocation independent agile strategy.
Consulting & Services
Integration
Cloud Services
As enterprise scale adoption matures, Cloudis increasingly accelerating innovation. CloudMigration Factory and EstateModernization were the primary driversfor growth during the quarter. TCS EnterpriseCloud has enhanced its global footprint bylaunching centers in Australia and Canada.
10
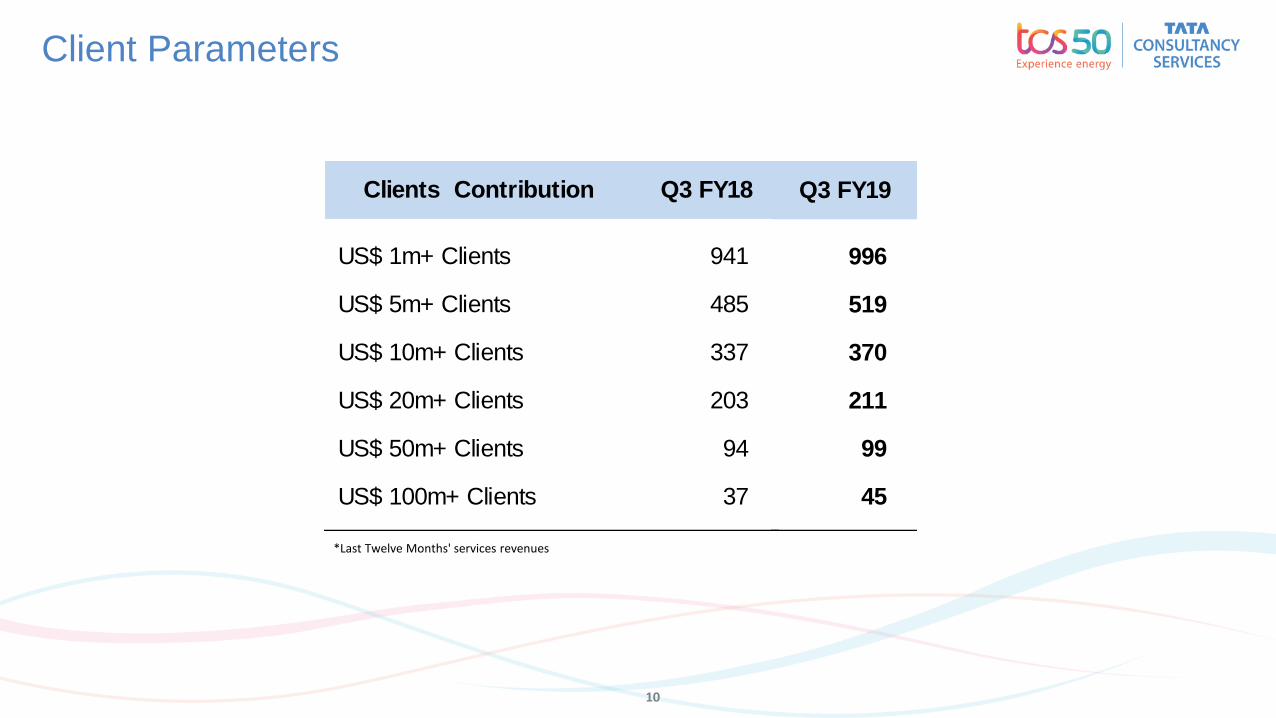
Client Parameters
*Last Twelve Months' services revenues
US$ 1m+ Clients 941
US$ 5m+ Clients 485
US$ 10m+ Clients 337
US$ 20m+ Clients 203
US$ 50m+ Clients 94
US$ 100m+ Clients 37
Clients Contribution Q3 FY18
996
519
370
211
99
45
Q3 FY19

11
• Engaged by a global multi-food products group, to consolidatetheir disparate business processes and create a scalablesolution for their business across geographies by leveraging thelatest digital ERP and analytics technologies.
• NMBS/SNCB (Belgian Rail) selected TCS as a long-term,strategic partner for its SPRITE (Strategic Partner for Rail ITEngagement) program, a key rail transformation journeyencompassing innovative digital technologies and state of theart technological services to enhance customer experience.
• Awarded a multi-year, multi-million dollar contract by a largeGerman insurance major to be its IT transformation partner.
• Thomson Reuters, a leading source of intelligent informationfor the world’s businesses and professionals has partnered withTCS in product engineering and sustenance services for a suiteof commercial software products that serves decision makers inthe legal, tax and accounting businesses.
Enterprise Applications, Cloud & Security
Consulting & Services Integration,
TCS Interactive, Banking Platforms
• Chosen by a large German investment bank and financialservices company to conceptualize and implement the digitaltransformation plan for ensuring service continuity andidentifying new revenue channels in compliance withregulatory directives, leveraging cloud, microservices, analyticsand cyber security capabilities.
• Engaged by a leading Malaysian oil and gas company as aconsulting partner to design and deliver an enterprisevisualization platform that provides visibility and greaterbusiness insights across the entire value chain. TCS will alsooffer digital learning-as-a-Service for managing organizationalchange and employee alignment to the transformationinitiative.
• Selected by a large Brazilian bank as the primary vendor fordigital transformation and innovation leveraging TCS expertisein digital channels, user experience and design capabilities.
• An Australian public electricity and gas company, entered intoa new 3 year contract with TCS to support its shift to a fullyAgile model across operations, whilst delivering on acontemporary set of capabilities such as automation.
• Awarded a multi-year, multi-million dollar contract by a globalhospitality chain to be the IT transformation partner.
• Chosen by a leading Canadian insurer for its platformconsolidation and digital transformation for 500,000 policies ofclosed book business, delivering transformational value,powered by the TCS BaNCS™ platform ecosystem.
Key Highlights
• Selected by a global leader in pool equipment and solutions forcreating IoT-enabled pool equipment services that will enhancecustomer satisfaction and enable new revenue streams.
• Selected by a leading North American telecom services providerto expand the capabilities of their IoT platform with new stateof art features for managing connectivity across IoT devices byimplementing a ThingSpace Connectivity ManagementSolution.
• Selected by a travel commerce platform as a strategic partnerto enable end-customers to acquire and trade their travelassets such as hotel rooms and airline seats across multipletravel service providers through a inter-operable blockchainplatform.
IoT & Blockchain
• Selected by a global Aluminum manufacturing firm to optimizeits procurement spend with an enterprise-wide spend analyticsplatform across its operations and also drive a strong cloudenablement program.
• Engaged by a British retail and commercial bank to simplify andtransform its services across retail and commercial bankingprocess functions with enhanced experience leveragingautomation and Agile practices.
• Chosen by a leading North American Insurance Firm, as astrategic partner to run the Data office Program and lead theirBusiness transformation initiative by empowering the coredecision making process with a data driven approachleveraging strong contextual knowledge.
• Selected by a North American healthcare major to implementignio™ to drive a Machine First™ transformation to provide aseamless experience to business users and improve businessmetrics across the entire healthcare value chain.
• Elisa, a market-leading Nordics Telecommunications, ICT andDigital Services Provider extended its strategic partnershipwith TCS to transform and grow its services by going agile in amachine first digital world.
Automation, Analytics & Insights
• Chosen by an Australian broadband service provider as itspartner in the areas of network planning, design andoperations, and to drive a Machine First™ transformation.
• Selected by an industry-leading American technology companyas a strategic partner to improve the time-to-market across itsproducts leveraging TCS Quality Engineering Transformationplatforms.
Cognitive Business & Digital Assurance
Human Resources

13
Total Employee Base
Q2-18 Q3-18 Q4-18 Q1-19 Q2-19 Q3-19
389,213 390,880394,998
400,875
411,102
417,929
Total Employees : 417,929
Attrition*:
• 11.2% (LTM), IT Services
Diversity:
• Women employees: 35.8%
• Nationalities: 151
* Excluding Subsidiaries
Talent Development:
• 14.2m Learning hours
• 292k+ employees Digital Trained
• 318k+ employees Agile Trained

Annexure

15
IFRS Income Statement
Revenue 309,040 373,380 100.00 100.00
Cost of revenue 178,620 217,350 57.80 58.21
Gross margin 130,420 156,030 42.20 41.79
SG & A expenses 52,610 60,390 17.02 16.17
Operating income 77,810 95,640 25.18 25.62
Other income (expense), net 8,640 11,470 2.80 3.07
Income before income taxes 86,450 107,110 27.98 28.69
Income taxes 21,000 25,900 6.80 6.94
Income after income taxes 65,450 81,210 21.18 21.75
Minority interest 140 160 0.05 0.04
Net income 65,310 81,050 21.13 21.71
Earnings per share in ` 17.06 21.60
Consolidated IFRS` Million % of Revenue
Q3 FY18 Q3 FY19Q3 FY19 Q3 FY18

16
COR – SG&A Details
Employee cost 125,560 154,440 40.63 41.36
Fees to external consultants 20,860 28,220 6.75 7.56
Equipment and software 7,490 5,400 2.42 1.45
Facility expenses 6,670 7,470 2.16 2.00
Depreciation 4,010 4,150 1.30 1.11
Travel 4,510 5,610 1.46 1.50
Communication 1,940 2,430 0.63 0.65
Other expenses 7,580 9,630 2.45 2.58
Cost of Revenue 178,620 217,350 57.80 58.21
Employee cost 39,020 45,500 12.63 12.18
Fees to external consultants 1,460 1,400 0.47 0.37
Facility expenses 3,220 3,200 1.04 0.86
Depreciation 1,060 1,040 0.34 0.28
Travel 2,230 2,940 0.72 0.79
Communication 700 840 0.23 0.23
Provision for Doubtful Debts 660 350 0.21 0.09
Other expenses 4,260 5,120 1.38 1.37
S G & A expenses 52,610 60,390 17.02 16.17
Q3 FY19Q3 FY19 Q3 FY18SGA
` Million % of Revenue
Q3 FY18
Q3 FY18COR
` Million % of Revenue
Q3 FY19Q3 FY18 Q3 FY19
17
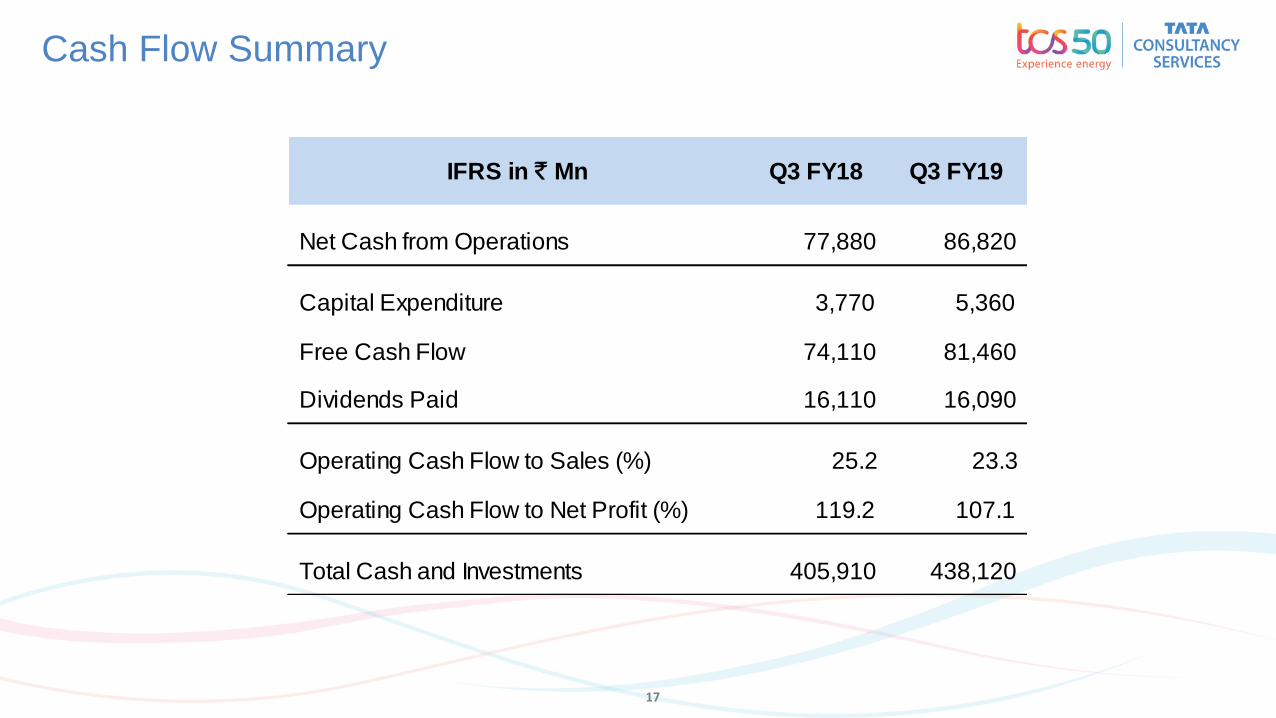
Cash Flow Summary
IFRS in ` Mn Q3 FY18 Q3 FY19
Net Cash from Operations 77,880 86,820
Capital Expenditure 3,770 5,360
Free Cash Flow 74,110 81,460
Dividends Paid 16,110 16,090
Operating Cash Flow to Sales (%) 25.2 23.3
Operating Cash Flow to Net Profit (%) 119.2 107.1
Total Cash and Investments 405,910 438,120

18
IFRS Statement of Financial Position
Assets
Property and equipment 116,000 10.70 114,560 10.44
Intangible assets and Goodwill 38,960 3.59 39,760 3.62
Accounts Receivable 250,370 23.09 273,490 24.92
Unbilled Revenues 69,130 6.38 83,890 7.65
Investments 360,080 33.21 298,040 27.16
Cash and Cash equivalents 48,830 4.51 52,460 4.78
Other current assets 90,050 8.31 151,850 13.84
Other non current assets 110,670 10.21 83,240 7.59
Total assets 1,084,090 100.00 1,097,290 100.00
Liabilities and Shareholders' Equity
Shareholders' Funds 872,410 80.47 853,210 77.76
Long term borrowings 540 0.05 460 0.04
Short term borrowings 1,930 0.18 170 0.02
Other current liabilities 176,350 16.27 211,350 19.26
Other non-current liabilities 28,840 2.66 27,790 2.53
Minority Interest 4,020 0.37 4,310 0.39
Total Liabilities 1,084,090 100.00 1,097,290 100.00
%Consolidated IFRS
` Million
31-Mar-18 31-Dec-18
` Million %

19
IFRS Income Statement – In USD
Revenue 4,787 5,250 100.00 100.00
Cost of revenue 2,767 3,056 57.80 58.21
Gross margin 2,020 2,194 42.20 41.79
SG & A expenses 815 849 17.02 16.17
Operating income 1,205 1,345 25.18 25.62
Other income (expense), net 134 161 2.80 3.07
Income before income taxes 1,339 1,506 27.98 28.69
Income taxes 325 364 6.80 6.94
Income after income taxes 1,014 1,142 21.18 21.75
Minority interest 2 2 0.05 0.04
Net income 1,012 1,140 21.13 21.71
Earnings per share in $ 0.26 0.30
Consolidated IFRS$ Million % of Revenue
Q3 FY18 Q3 FY19 Q3 FY18 Q3 FY19
20
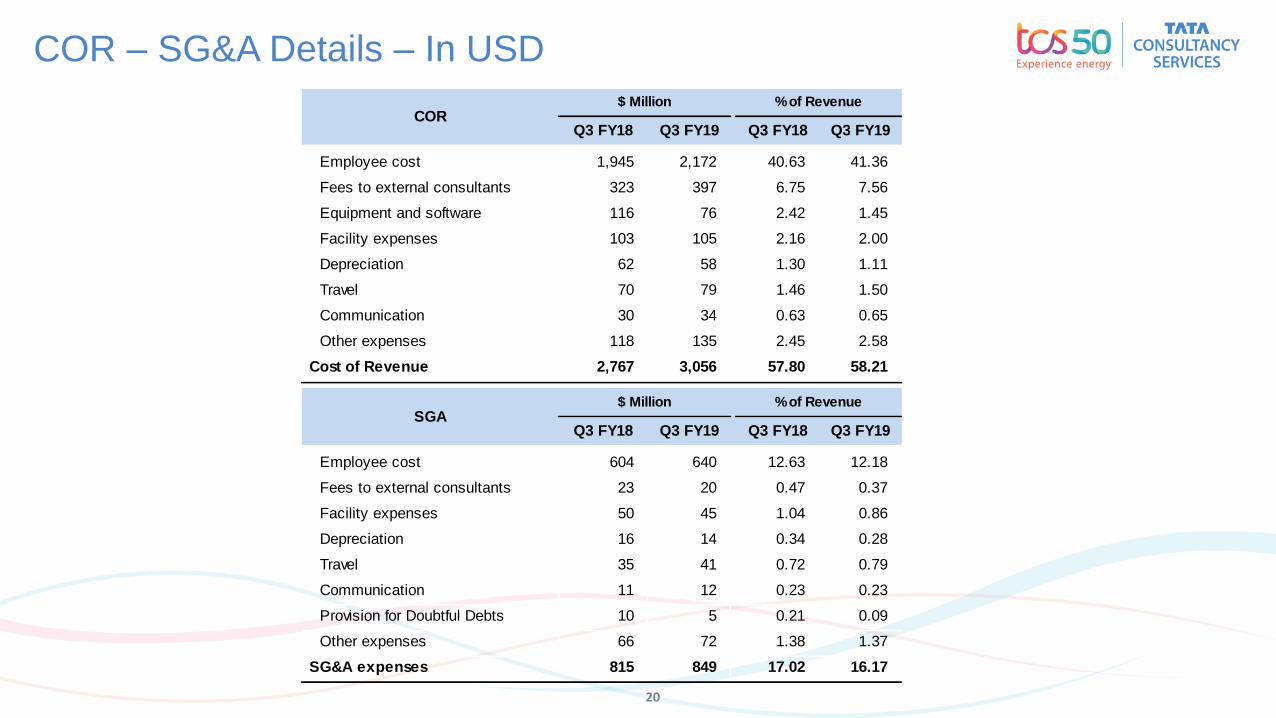
COR – SG&A Details – In USD
Employee cost 1,945 2,172 40.63 41.36
Fees to external consultants 323 397 6.75 7.56
Equipment and software 116 76 2.42 1.45
Facility expenses 103 105 2.16 2.00
Depreciation 62 58 1.30 1.11
Travel 70 79 1.46 1.50
Communication 30 34 0.63 0.65
Other expenses 118 135 2.45 2.58
Cost of Revenue 2,767 3,056 57.80 58.21
Employee cost 604 640 12.63 12.18
Fees to external consultants 23 20 0.47 0.37
Facility expenses 50 45 1.04 0.86
Depreciation 16 14 0.34 0.28
Travel 35 41 0.72 0.79
Communication 11 12 0.23 0.23
Provision for Doubtful Debts 10 5 0.21 0.09
Other expenses 66 72 1.38 1.37
SG&A expenses 815 849 17.02 16.17
Q3 FY19Q3 FY19SGA
$ Million % of Revenue
Q3 FY18
COR$ Million % of Revenue
Q3 FY18
Q3 FY18 Q3 FY19 Q3 FY18 Q3 FY19

21
IFRS Statement of Financial Position in USD
$ Million % $ Million %
Assets
Property and equipment 1,784 10.70 1,642 10.44
Intangible assets and Goodwill 599 3.59 569 3.62
Accounts Receivable 3,849 23.09 3,920 24.92
Unbilled Revenues 1,063 6.38 1,203 7.64
Investments 5,536 33.21 4,272 27.15
Cash and Cash equivalents 751 4.51 752 4.78
Other current assets 1,385 8.31 2,179 13.85
Other non current assets 1,702 10.21 1,194 7.60
Total assets 16,669 100.00 15,731 100.00
Liabilities and Shareholders' Equity
Shareholders' Funds 13,413 80.47 12,230 77.75
Long term borrowings 8 0.05 7 0.04
Short term borrowings 30 0.18 2 0.01
Other current liabilities 2,712 16.27 3,030 19.25
Other non-current liabilities 443 2.66 398 2.54
Minority Interest 63 0.37 64 0.41
Total Liabilities 16,669 100.00 15,731 100.00
31-Dec-18Consolidated IFRS
31-Mar-18

22
Ind AS Income Statement - Consolidated
Revenue 30,904 37,338 100.00 100.00
Expenditure
a) Employee Costs 16,458 19,994 53.25 53.55
b) Cost of equipment and software licences 749 540 2.42 1.45
c) Other Operating expenses 5,410 6,721 17.51 18.00
d) Depreciation 506 519 1.64 1.39
Total Expenditure 23,123 27,774 74.82 74.39
Profit Before Taxes & Other Income 7,781 9,564 25.18 25.61
Other income (expense), net 864 1,147 2.80 3.08
Profit Before Taxes & Exceptional Items 8,645 10,711 27.98 28.69
Provision For Taxes 2,100 2,590 6.80 6.94
Profit After Taxes & Before
Minority Interest 6,545 8,121 21.18 21.75
Minority Interest 14 16 0.05 0.04
Net Profit 6,531 8,105 21.13 21.71
Earnings per share in ` 17.06 21.60
Q3 FY18Consolidated Ind AS
` Crore % of Revenue
Q3 FY19 Q3 FY18 Q3 FY19
23
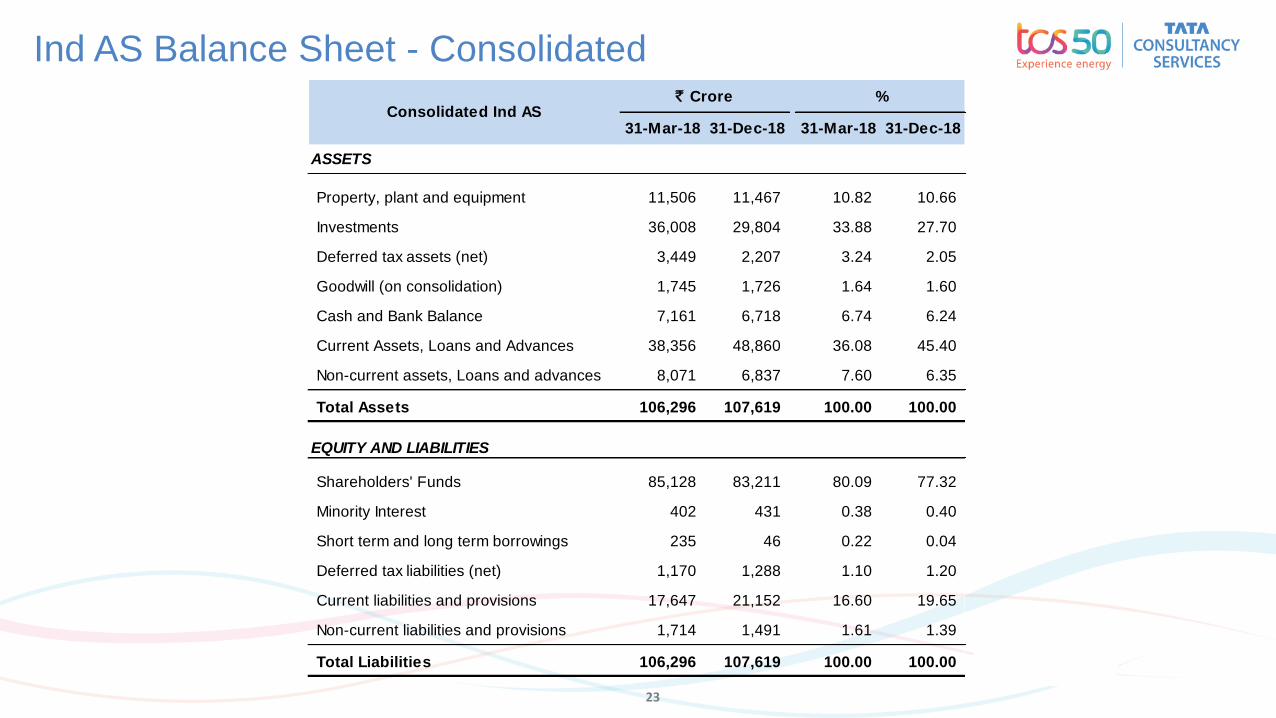
Ind AS Balance Sheet - Consolidated
31-Mar-18 31-Dec-18 31-Mar-18 31-Dec-18
ASSETS
Property, plant and equipment 11,506 11,467 10.82 10.66
Investments 36,008 29,804 33.88 27.70
Deferred tax assets (net) 3,449 2,207 3.24 2.05
Goodwill (on consolidation) 1,745 1,726 1.64 1.60
Cash and Bank Balance 7,161 6,718 6.74 6.24
Current Assets, Loans and Advances 38,356 48,860 36.08 45.40
Non-current assets, Loans and advances 8,071 6,837 7.60 6.35
Total Assets 106,296 107,619 100.00 100.00
EQUITY AND LIABILITIES
Shareholders' Funds 85,128 83,211 80.09 77.32
Minority Interest 402 431 0.38 0.40
Short term and long term borrowings 235 46 0.22 0.04
Deferred tax liabilities (net) 1,170 1,288 1.10 1.20
Current liabilities and provisions 17,647 21,152 16.60 19.65
Non-current liabilities and provisions 1,714 1,491 1.61 1.39
Total Liabilities 106,296 107,619 100.00 100.00
Consolidated Ind AS` Crore %
24
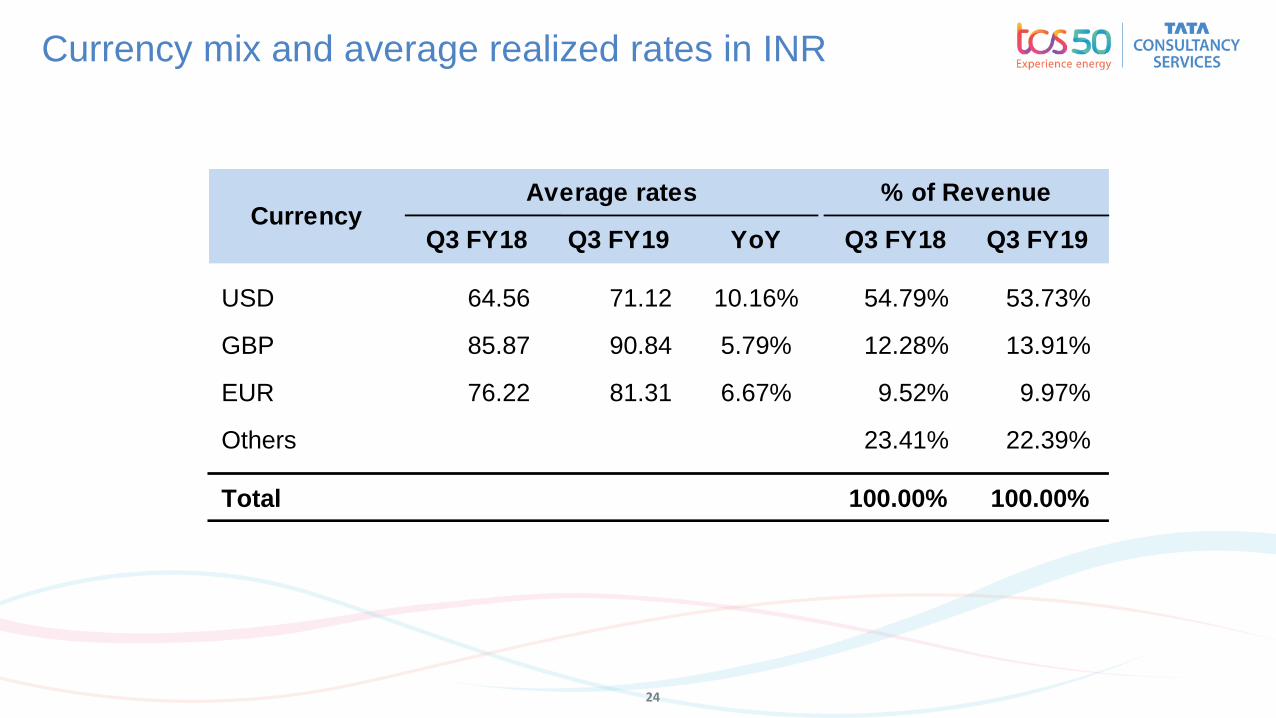
Currency mix and average realized rates in INR
Q3 FY18 Q3 FY19 YoY Q3 FY18 Q3 FY19
USD 64.56 71.12 10.16% 54.79% 53.73%
GBP 85.87 90.84 5.79% 12.28% 13.91%
EUR 76.22 81.31 6.67% 9.52% 9.97%
Others 23.41% 22.39%
Total 100.00% 100.00%
CurrencyAverage rates % of Revenue
Thank You