tcs fact sheet q1 fy15
TRANSCRIPT

1 Copyright © 2014 Tata Consultancy Services Limited
TCS Financial Results
Quarter I FY 2014 - 15
17th July 2014

2
Disclaimer
Certain statements in this release concerning our future prospects are forward-looking statements. Forward-looking statements by their nature involve a number of risks and uncertainties that could cause actual results to differ materially from market expectations. These risks and uncertainties include, but are not limited to our ability to manage growth, intense competition among Indian and overseas IT services companies, various factors which may affect our cost advantage, such as wage increases or an appreciating Rupee, our ability to attract and retain highly skilled professionals, time and cost overruns on fixed-price, fixed-time frame contracts, client concentration, restrictions on immigration, our ability to manage our international operations, reduced demand for technology in our key focus areas, disruptions in telecommunication networks, our ability to successfully complete and integrate potential acquisitions, liability for damages on our service contracts, the success of the companies in which TCS has made strategic investments, withdrawal of governmental fiscal incentives, political instability, legal restrictions on raising capital or acquiring companies outside India, unauthorized use of our intellectual property and general economic conditions affecting our industry. TCS may, from time to time, make additional written and oral forward-looking statements, including our reports to shareholders. These forward-looking statements represent only the Company’s current intentions, beliefs or expectations, and any forward-looking statement speaks only as of the date on which it was made. The Company assumes no obligation to revise or update any forward-looking statements.

3
Click to edit Master title style Highlights
4
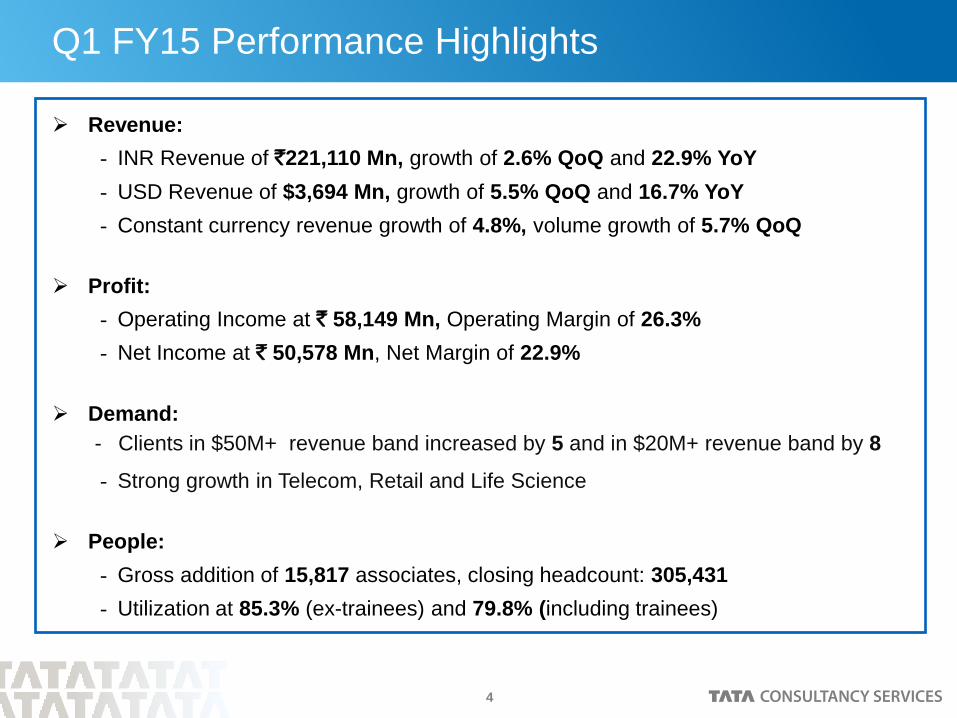
Q1 FY15 Performance Highlights
Revenue:
INR Revenue of `221,110 Mn, growth of 2.6% QoQ and 22.9% YoY
USD Revenue of $3,694 Mn, growth of 5.5% QoQ and 16.7% YoY
Constant currency revenue growth of 4.8%, volume growth of 5.7% QoQ
Profit:
Operating Income at ` 58,149 Mn, Operating Margin of 26.3%
Net Income at ` 50,578 Mn, Net Margin of 22.9%
Demand:
- Clients in $50M+ revenue band increased by 5 and in $20M+ revenue band by 8
Strong growth in Telecom, Retail and Life Science
People:
Gross addition of 15,817 associates, closing headcount: 305,431
Utilization at 85.3% (ex-trainees) and 79.8% (including trainees)

5
Click to edit Master title style Financial Performance

6
Growth Summary (INR)
221,110
179,871 209,772 212,940 215,511
Q1 FY14 Q2 FY14 Q3 FY14 Q4 FY14 Q1 FY15
Revenue`
Mil
lion
48,627
63,295 63,347 62,810 58,149
Q1 FY14 Q2 FY14 Q3 FY14 Q4 FY14 Q1 FY15
Operating Income
`M
illio
n
51,532
66,390 66,865 66,534 63,670
Q1 FY14 Q2 FY14 Q3 FY14 Q4 FY14 Q1 FY15
EBITDA
`M
illio
n
39,866 46,539
51,797 52,967 50,578
Q1 FY14 Q2 FY14 Q3 FY14 Q4 FY14 Q1 FY15
Net Income
`M
illio
n
18.9%
51.5% 44.6% 44.1%
19.6%
11.6%
30.2%
0.1% -0.8% -7.4%
Q1 FY14 Q2 FY14 Q3 FY14 Q4 FY14 Q1 FY15
Y-o-Y Growth Q-o-Q Growth
18.9%
49.5% 43.7% 42.8%
23.6%
10.6%
28.8%
0.7% -0.5% -4.3%
Q1 FY14 Q2 FY14 Q3 FY14 Q4 FY14 Q1 FY15
Y-o-Y Growth Q-o-Q Growth
21.0%34.3% 32.5%
31.2%22.9%
9.5%16.6%
1.5% 1.2% 2.6%
Q1 FY14 Q2 FY14 Q3 FY14 Q4 FY14 Q1 FY15
Y-0-Y Growth Q-0-Q Growth
16.7%
37.5% 43.6%51.5%
26.9%
14.0%
16.7% 11.3%2.3% -4.5%
Q1 FY14 Q2 FY14 Q3 FY14 Q4 FY14 Q1 FY15
Y-o-Y Growth Q-o-Q Growth

7
Growth Summary (USD)
3,1653,337 3,438 3,503
3,694
Q1 FY14 Q2 FY14 Q3 FY14 Q4 FY14 Q1 FY15
Revenue$
Millio
n
856
1,007 1,023 1,021972
Q1 FY14 Q2 FY14 Q3 FY14 Q4 FY14 Q1 FY15
Operating Income
$M
illio
n
701740
836 861 845
Q1 FY14 Q2 FY14 Q3 FY14 Q4 FY14 Q1 FY15
Net Income
$M
illio
n
16.0% 17.0% 16.6%15.2%
16.7%
4.1%5.4%
3.0%1.9%
5.5%
Q1 FY14 Q2 FY14 Q3 FY14 Q4 FY14 Q1 FY15
Y-o-Y Growth Q-o-Q Growth
11.6%
19.6%
26.4%
33.6%
20.5%
8.8%5.6%
13.0%
2.9%
-1.9%
Q1 FY14 Q2 FY14 Q3 FY14 Q4 FY14 Q1 FY15
Y-o-Y Growth Q-o-Q Growth
14.0%
31.9%27.3% 26.6%
13.5%
6.1%
17.7%
1.6%-0.2%
-4.8%
Q1 FY14 Q2 FY14 Q3 FY14 Q4 FY14 Q1 FY15
Y-o-Y Growth Q-o-Q Growth
8
Click to edit Master title style Operational Performance

9
Growth by Market
52.2%
2.2%
17.7%
12.0%
6.3%7.6% 2.0%
North America
Latin America
UK
Continental Europe
India
Asia Pacific
MEA
Geography (%) Q1 FY14 Q4 FY14 Q1 FY15Q-o-Q
Growth
Y-o-Y
Growth
Americas
North America 54.1 52.2 52.2 2.6 18.5
Latin America 2.4 2.2 2.2 1.4 13.5
Europe
UK 17.0 17.8 17.7 2.3 28.1
Continental Europe 9.9 12.1 12.0 1.8 49.3
India 7.6 6.2 6.3 5.2 2.1
Asia Pacific 6.9 7.4 7.6 4.5 34.9
MEA 2.1 2.1 2.0 -2.0 20.1
Total 100.0 100.0 100.0 2.6 22.9
Note: The growth rates reported here are based on actual revenues in INR. Calculating growth using the % Rev figures might result in some variance due to rounding error.
Growth in INR terms
10
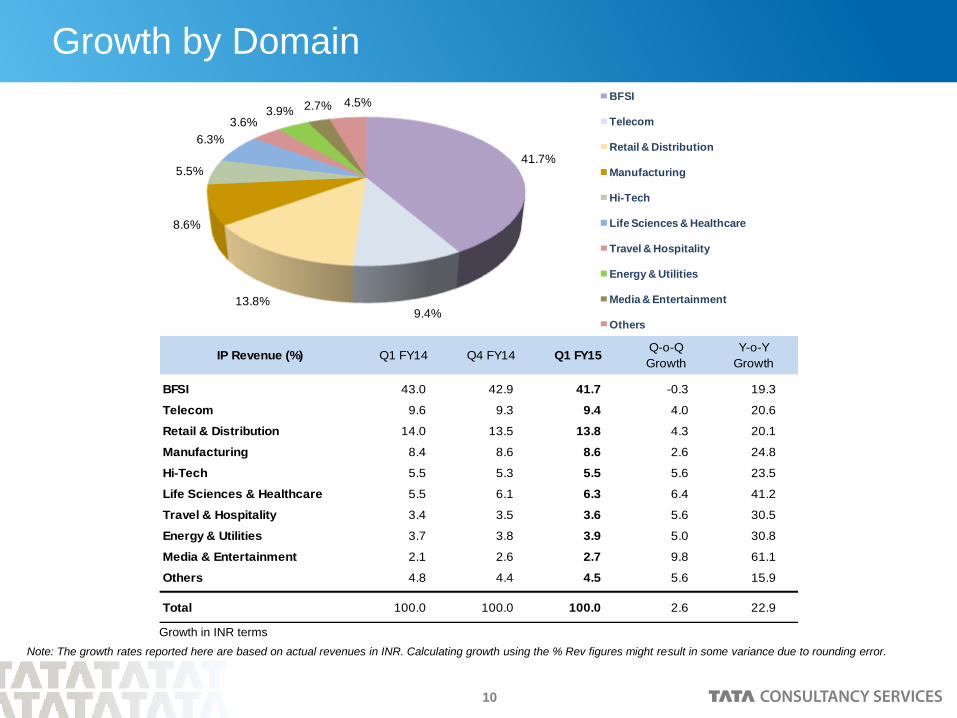
Growth by Domain
41.7%
9.4%13.8%
8.6%
5.5%
6.3%
3.6%3.9% 2.7% 4.5%
BFSI
Telecom
Retail & Distribution
Manufacturing
Hi-Tech
Life Sciences & Healthcare
Travel & Hospitality
Energy & Utilities
Media & Entertainment
Others
IP Revenue (%) Q1 FY14 Q4 FY14 Q1 FY15Q-o-Q
Growth
Y-o-Y
Growth
BFSI 43.0 42.9 41.7 -0.3 19.3
Telecom 9.6 9.3 9.4 4.0 20.6
Retail & Distribution 14.0 13.5 13.8 4.3 20.1
Manufacturing 8.4 8.6 8.6 2.6 24.8
Hi-Tech 5.5 5.3 5.5 5.6 23.5
Life Sciences & Healthcare 5.5 6.1 6.3 6.4 41.2
Travel & Hospitality 3.4 3.5 3.6 5.6 30.5
Energy & Utilities 3.7 3.8 3.9 5.0 30.8
Media & Entertainment 2.1 2.6 2.7 9.8 61.1
Others 4.8 4.4 4.5 5.6 15.9
Total 100.0 100.0 100.0 2.6 22.9
Note: The growth rates reported here are based on actual revenues in INR. Calculating growth using the % Rev figures might result in some variance due to rounding error.
Growth in INR terms

11
Growth by Service Line
40.8%
15.9%
8.6%
4.5%
12.6%
3.2%
2.5%
11.9%Application Development & Maint.
Enterprise Solutions
Assurance Services
Engineering & Industrial Services
Infrastructure Services
Global Consulting
Asset Leveraged Solutions
Business Process Services
SP Revenue (%) Q1 FY14 Q4 FY14 Q1 FY15Q-o-Q
Growth
Y-o-Y
Growth
IT Solutions and Services
Application Development & Maint. 42.3 41.0 40.8 2.0 18.3
Enterprise Solutions 15.1 15.7 15.9 4.1 29.8
Assurance Services 8.1 8.4 8.6 5.9 31.8
Engineering & Industrial Services 4.7 4.8 4.5 -2.6 17.9
Infrastructure Services 11.9 12.0 12.6 7.2 30.0
Global Consulting 3.5 3.4 3.2 -2.1 13.7
Asset Leveraged Solutions 2.5 2.6 2.5 -3.5 20.8
Business Process Services 11.9 12.1 11.9 0.3 22.5
Total 100.0 100.0 100.0 2.6 22.9
Note: The growth rates reported here are based on actual revenues in INR. Calculating growth using the % Rev figures might result in some variance due to rounding error.
Growth in INR terms
12
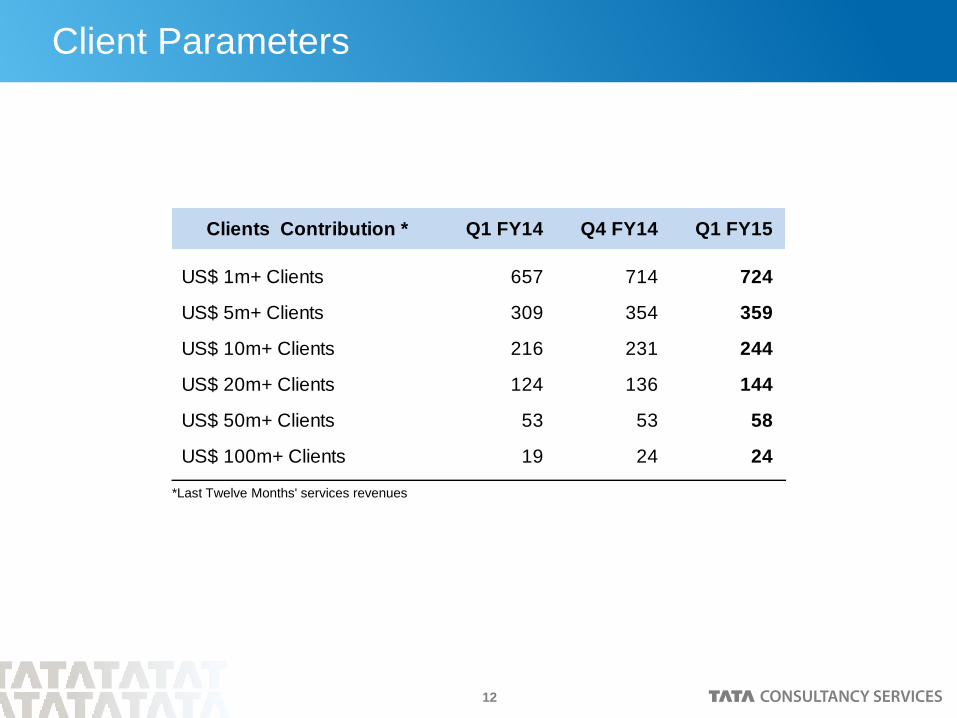
Client Parameters
*Last Twelve Months' services revenues
US$ 1m+ Clients 657 714 724
US$ 5m+ Clients 309 354 359
US$ 10m+ Clients 216 231 244
US$ 20m+ Clients 124 136 144
US$ 50m+ Clients 53 53 58
US$ 100m+ Clients 19 24 24
Q4 FY14Clients Contribution * Q1 FY15Q1 FY14

13
Operational Parameters
Delivery Location
Local Delivery 46.3 47.0 47.1
Remote Delivery 53.7 53.0 52.9
Global DC 5.2 5.6 5.7
India DC 48.5 47.4 47.2
Contract Type
Time & Material 47.8 47.6 47.5
Fixed Price & Time 52.2 52.4 52.5
Revenue % Q1 FY15Q1 FY14 Q4 FY14
14
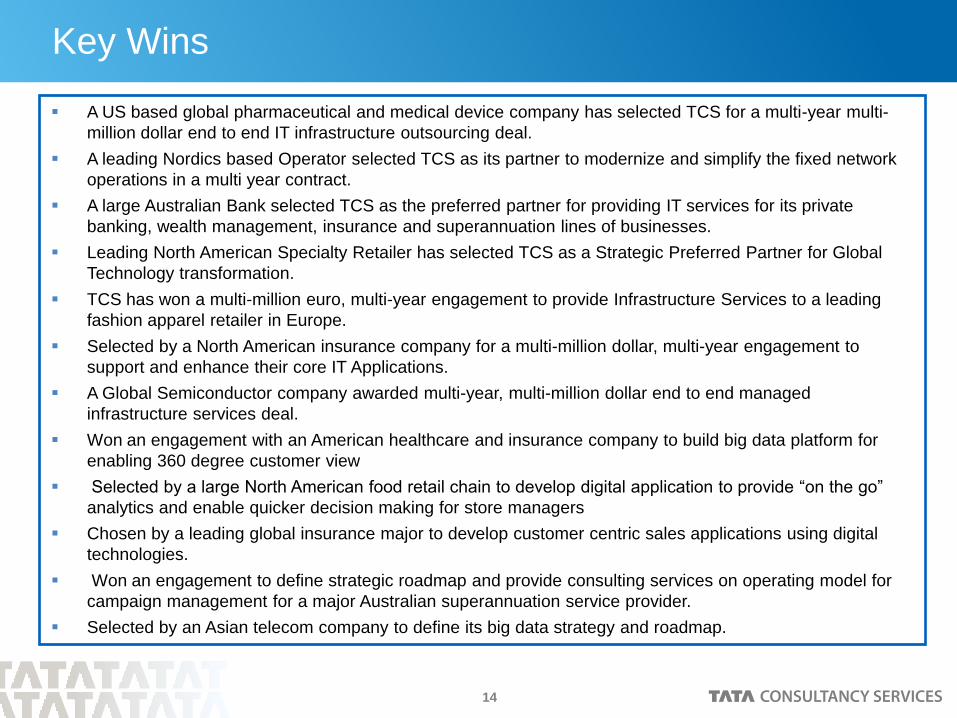
Key Wins
A US based global pharmaceutical and medical device company has selected TCS for a multi-year multi-
million dollar end to end IT infrastructure outsourcing deal.
A leading Nordics based Operator selected TCS as its partner to modernize and simplify the fixed network
operations in a multi year contract.
A large Australian Bank selected TCS as the preferred partner for providing IT services for its private
banking, wealth management, insurance and superannuation lines of businesses.
Leading North American Specialty Retailer has selected TCS as a Strategic Preferred Partner for Global
Technology transformation.
TCS has won a multi-million euro, multi-year engagement to provide Infrastructure Services to a leading
fashion apparel retailer in Europe.
Selected by a North American insurance company for a multi-million dollar, multi-year engagement to
support and enhance their core IT Applications.
A Global Semiconductor company awarded multi-year, multi-million dollar end to end managed
infrastructure services deal.
Won an engagement with an American healthcare and insurance company to build big data platform for
enabling 360 degree customer view
Selected by a large North American food retail chain to develop digital application to provide “on the go”
analytics and enable quicker decision making for store managers
Chosen by a leading global insurance major to develop customer centric sales applications using digital
technologies.
Won an engagement to define strategic roadmap and provide consulting services on operating model for
campaign management for a major Australian superannuation service provider.
Selected by an Asian telecom company to define its big data strategy and roadmap.

15
Click to edit Master title style Human Resources

16
Total Employee Base
Q1-14 Q2-14 Q3-14 Q4-14 Q1-15
277,586
285,250
290,713
300,464
305,431
Total Employees : 305,431

17
Q1 Consolidated - Gross Additions 15,817 & Net Additions 4,967
Gross Additions:
• 3,452 Trainees & 8,488 Laterals in India
• 3,877 employees overseas
FY14 - Q1 FY14 - Q2 FY14 - Q3 FY14 - Q4 FY15 - Q1
10,611
17,362
14,663
18,564
15,817
1,390
7,664
5,463
9,751
4,967
Gross Additions Net Additions
Attrition*:
• 12.0% (LTM), including BPS
Utilization Rate*:
• 85.3% (excluding Trainees)
• 79.8% (including Trainees)
Diversity:
• Women employees: 32.7%
• Nationalities: 119
* Excluding CMC & Diligenta

18
Click to edit Master title style Annexure

19
IFRS Income Statement
Q1 FY14 Q4 FY14 Q1 FY15 Q1 FY14 Q4 FY14 Q1 FY15
Revenue 179,871 215,511 221,110 100.00 100.00 100.00
Cost of revenue 96,700 114,640 122,432 53.76 53.19 55.37
Gross margin 83,171 100,871 98,678 46.24 46.81 44.63
SG & A expenses 34,544 38,061 40,529 19.21 17.66 18.33
Operating income 48,627 62,810 58,149 27.03 29.15 26.30
Other income (expense), net 4,422 6,990 8,151 2.46 3.24 3.69
Income before income taxes 53,049 69,800 66,300 29.49 32.39 29.99
Income taxes 12,312 16,313 15,312 6.84 7.57 6.93
Income after income taxes 40,737 53,487 50,988 22.65 24.82 23.06
Minority interest 871 520 410 0.49 0.24 0.19
Net income 39,866 52,967 50,578 22.16 24.58 22.87
Earnings per share in ` 20.37 27.04 25.82
Consolidated IFRS` Million % of Revenue
Expenses include an additional one time charge of ` 1,746 million in depreciation on account of change in useful life of assets as at April 1, 2014

20
COR – SG&A Details
Q1 FY14 Q4 FY14 Q1 FY15 Q1 FY14 Q4 FY14 Q1 FY15
Employee cost 68,221 79,555 86,468 37.93 36.91 39.11
Fees to external consultants 11,025 12,377 13,244 6.13 5.74 5.99
Equipment & software 4,027 3,559 3,264 2.24 1.65 1.48
Depreciation 1,809 2,469 3,608 1.01 1.15 1.63
Travel 2,447 2,885 3,788 1.36 1.34 1.71
Communication 1,511 1,570 1,594 0.84 0.73 0.72
Facility expenses 3,731 4,534 4,580 2.07 2.10 2.07
Other expenses 3,929 7,691 5,886 2.18 3.57 2.66
Cost of Revenue 96,700 114,640 122,432 53.76 53.19 55.37
Q1 FY14 Q4 FY14 Q1 FY15 Q1 FY14 Q4 FY14 Q1 FY15
Employee cost 24,006 25,794 28,341 13.35 11.97 12.82
Fees to external consultants 766 1,718 1,242 0.43 0.80 0.56
Provision for Doubtful Debts 206 190 374 0.11 0.09 0.17
Depreciation 1,096 1,255 1,913 0.61 0.58 0.87
Facility expenses 2,737 2,818 2,453 1.52 1.31 1.11
Travel 2,117 2,569 2,335 1.18 1.19 1.06
Communication 637 720 779 0.35 0.33 0.35
Education, Recruitment and training 582 756 468 0.32 0.35 0.21
Marketing and Sales promotion 661 914 1,048 0.37 0.42 0.47
Other expenses 1,736 1,327 1,576 0.97 0.62 0.71
S G & A expenses 34,544 38,061 40,529 19.21 17.66 18.33
COR
SGA
` Million
` Million
% of Revenue
% of Revenue

21
IFRS Balance Sheet
` Million % ` Million %
Assets
Property and equipment 103,644 15.04 105,370 14.11
Intangible assets and Goodwill 41,568 6.03 41,539 5.56
Accounts Receivable 182,304 26.45 191,373 25.63
Unbilled Revenues 40,056 5.81 42,961 5.75
Investments 34,617 5.03 86,726 11.62
Cash and Cash equivalents 14,688 2.13 20,730 2.78
Other current assets 180,934 26.26 185,319 24.82
Other non current assets 91,314 13.25 72,685 9.73
Total assets 689,125 100.00 746,703 100.00
Liabilities and Shareholders' Equity
Shareholders' Funds 553,355 80.30 557,555 74.67
Long term borrowings 1,273 0.18 1,209 0.16
Short term borrowings 1,696 0.25 814 0.11
Other current liabilities 109,055 15.83 163,677 21.92
Other non-current liabilities 16,844 2.44 16,526 2.21
Minority Interest 6,902 1.00 6,922 0.93
Total Liabilities 689,125 100.00 746,703 100.00
Consolidated IFRS31-Mar-14 30-Jun-14

22
IFRS Income Statement – In USD
Q1 FY14 Q4 FY14 Q1 FY15 Q1 FY14 Q4 FY14 Q1 FY15
Revenue 3,165 3,503 3,694 100.00 100.00 100.00
Cost of revenue 1,701 1,863 2,045 53.76 53.19 55.37
Gross margin 1,464 1,640 1,649 46.24 46.81 44.63
SG & A expenses 608 619 677 19.21 17.66 18.33
Operating income 856 1,021 972 27.03 29.15 26.30
Other income (expense), net 78 114 136 2.46 3.24 3.69
Income before income taxes 934 1,135 1,108 29.49 32.39 29.99
Income taxes 217 265 256 6.84 7.57 6.93
Income after income taxes 717 870 852 22.65 24.82 23.06
Minority interest 16 9 7 0.49 0.24 0.19
Net income 701 861 845 22.16 24.58 22.87
Earnings per share in $ 0.36 0.44 0.43
Consolidated IFRS$ Million % of Revenue
Expenses include an additional one time charge of $ 29 million in depreciation on account of change in useful life of assets as at April 1, 2014

23
COR – SG&A Details – In USD
Q1 FY14 Q4 FY14 Q1 FY15 Q1 FY14 Q4 FY14 Q1 FY15
Employee cost 1,200 1,293 1,445 37.93 36.91 39.11
Fees to external consultants 194 201 221 6.13 5.73 5.99
Equipment & software 71 58 55 2.24 1.65 1.48
Depreciation 32 40 60 1.01 1.15 1.63
Travel 43 47 63 1.36 1.34 1.71
Communication 26 25 27 0.84 0.73 0.72
Facility expenses 66 74 76 2.07 2.10 2.07
Other expenses 69 125 98 2.18 3.58 2.66
Cost of Revenue 1,701 1,863 2,045 53.76 53.19 55.37
Q1 FY14 Q4 FY14 Q1 FY15 Q1 FY14 Q4 FY14 Q1 FY15
Employee cost 422 419 474 13.35 11.97 12.82
Fees to external consultants 13 28 21 0.43 0.80 0.56
Provision for Doubtful Debts 4 3 6 0.11 0.09 0.17
Depreciation 19 20 32 0.61 0.58 0.87
Facility expenses 48 46 41 1.52 1.31 1.11
Travel 37 42 39 1.18 1.19 1.06
Communication 11 12 13 0.35 0.33 0.35
Education, Recruitment and training 11 12 8 0.33 0.35 0.21
Marketing and Sales promotion 12 15 17 0.37 0.42 0.47
Other expenses 31 22 26 0.96 0.62 0.71
S G & A expenses 608 619 677 19.21 17.66 18.33
COR
SGA$ Million % of Revenue
$ Million % of Revenue

24
IFRS Balance Sheet in USD
$ Million % $ Million %
Assets
Property and equipment 1,726 15.04 1,754 14.11
Intangible assets and Goodwill 692 6.03 692 5.56
Accounts Receivable 3,035 26.46 3,186 25.63
Unbilled Revenues 667 5.81 715 5.75
Investments 576 5.02 1,444 11.61
Cash and Cash equivalents 245 2.13 345 2.78
Other current assets 3,012 26.26 3,085 24.82
Other non current assets 1,520 13.25 1,210 9.74
Total assets 11,473 100.00 12,431 100.00
Liabilities and Shareholders' Equity
Shareholders' Funds 9,213 80.30 9,282 74.67
Long term borrowings 21 0.18 20 0.16
Short term borrowings 28 0.25 14 0.11
Other current liabilities 1,816 15.83 2,725 21.92
Other non-current liabilities 280 2.44 275 2.21
Minority Interest 115 1.00 115 0.93
Total Liabilities 11,473 100.00 12,431 100.00
30-Jun-1431-Mar-14Consolidated IFRS

25
Indian GAAP Income Statement - Consolidated
Q1 FY14 Q4 FY14 Q1 FY15 Q1 FY14 Q4 FY14 Q1 FY15
INCOME
a) IT & Consultancy Services 17,552 21,142 21,793 97.58 98.10 98.56
b) Manufacturing, Sale of equipment and Licences 435 409 318 2.42 1.90 1.44
Total Income 17,987 21,551 22,111 100.00 100.00 100.00
EXPENDITURE
a) Salaries & Wages 6,965 7,581 8,532 38.72 35.18 38.59
b) Overseas business expenditure 2,498 3,186 3,283 13.89 14.78 14.85
c) Other operating expenses 3,380 4,095 3,943 18.79 19.00 17.83
Total Expenditure 12,843 14,862 15,758 71.40 68.96 71.27
Profit Before Interest, Depreciation, Taxes
& Other Income 5,144 6,689 6,353 28.60 31.04 28.73
Interest 7 12 9 0.04 0.06 0.04
Depreciation 297 375 417 1.65 1.74 1.89
Profit Before Taxes & Other Income 4,840 6,302 5,927 26.91 29.24 26.80
Other income (expense), net 259 721 787 1.44 3.35 3.56
Profit Before Taxes & Exceptional Items 5,099 7,023 6,714 28.35 32.59 30.36
Exceptional items - - 490 - - 2.22
Profit Before Taxes 5,099 7,023 7,204 28.35 32.59 32.58
Provision For Taxes 1,226 1,613 1,599 6.82 7.49 7.23
Profit After Taxes & Before Minority Interest 3,873 5,410 5,605 21.53 25.10 25.35
Minority Interest 33 52 37 0.18 0.24 0.17
Net Profit 3,840 5,358 5,568 21.35 24.86 25.18
Consolidated Indian GAAP ` Crore % of Revenue
Exceptional items consist of a write back of ` 665 crore due to change in method of charging depreciation on assets as at April 1, 2014 and a
charge of ` 175 crore in depreciation due to change in useful life of assets as at April 1, 2014

26
Indian GAAP Balance Sheet - Consolidated
31-Mar-14 30-Jun-14 31-Mar-14 30-Jun-14
EQUITY AND LIABILITIES
Shareholders' Funds 49,195 44,373 73.27 60.40
Minority Interest 708 712 1.06 0.97
Short term and long term borrowings 254 158 0.38 0.22
Deferred tax liabilities (net) 309 327 0.46 0.44
Current liabilities and provisions 15,543 26,725 23.15 36.38
Non-current liabilities and provisions 1,129 1,171 1.68 1.59
Total Liabilities 67,138 73,466 100.00 100.00
ASSETS
Fixed Assets (net) 10,444 11,265 15.56 15.34
Investments 3,434 8,598 5.11 11.70
Deferred tax assets (net) 420 444 0.63 0.60
Goodwill (on consolidation) 2,269 2,272 3.38 3.09
Cash and Bank Balance 14,442 14,304 21.51 19.47
Current Assets, Loans and Advances 27,297 29,684 40.66 40.41
Non-current assets, Loans and advances 8,832 6,899 13.15 9.39
Total Assets 67,138 73,466 100.00 100.00
Consolidated Indian GAAP%` Crore

27
Currency mix and average realized rates in INR
Q4 FY14 Q1 FY15 Q4 FY14 Q1 FY15
USD 61.53 59.85 56.03% 55.83%
GBP 101.84 100.80 15.82% 15.85%
EUR 84.32 81.92 9.34% 9.14%
Others 18.81% 19.18%
Total 100.00% 100.00%
CurrencyAverage rates % of Revenue

Thank You
IT Services
Business Solutions
Consulting