tcn : calculate financial projections for investment presentations
TRANSCRIPT

Financial Projections for PresentationsDecember 3, 2015

Heather Onstott
Today’s Speakers
• VP of Finance, Venture Advisors
• MBA
• Prior VP Finance and Controller positions at several area startups/high growth companies
• Over 25 years accounting experience
• BS, UNH; MBA, Rivier College
• Venture Partner, former Director of Small Business with LaunchCapital
• Interim CEO of the Nanny Caddy, a LaunchCapital portfolio company
• Over 20 years experience in small business finance
• BA, Wofford College; MBA, Dartmouth
Pete Basius

Financial Projections: WIFM?
Today’s presentation will focus on the how and why of building and pitching financial projections
• How: Creating financial projections using a spreadsheet and some common accounting knowledge shows you where to focus your resources
• Why: Creating financial projections demonstrates to investors that you have thoroughly considered every aspect of your business model.

Financial Projections: 3 Objectives
1. Force discipline and objectivity through creating a methodical approach
2. Demonstrate thorough understanding of your company’s business model
3. Provide answers to “what if?”

Building Projections: Yeah, but…
I’ve heard that I don’t really have to build a business plan with financial projections because no one actually reads it…
• Business plans with financial projections are necessary…
– Bottoms-up vs. Top-down
– HINT: You're trying to talk yourself out of this!
• Financial projections are a key portion of the due diligence most investors perform
FOR YOU
Investors are more interested in the assumptions made when building financial projections, not the exact bottom line

Building Projections: Pulp fiction?
Projections are just imaginary anyway, so what does it matter what I put in?
A common mistake is to have illogical numbers in the projections– All numbers should be tied to your growth assumptions
• Ex 1: If sales cycle is 6 weeks, should there be sales in month 1?
• Ex 2: If business is seasonal, should growth be smooth in every month?
– All numbers should tie with a rough cash flow statement
• Either a separate tab or at the bottom of the P&L
Projections that have not been planned properly make investors question your understanding of your business model

Building Projections: What if…
Scenario planning is just worst-case (out of business), expected (what I really think will happen), and best-case (Google buys us for a bazillion dollars), right?
Focus on YOUR key success metrics to drive scenario planning– Sales traction
– Gross margins
– Incremental headcount
Fundraise amount range should encompass most likely scenarios to avoid expensive “Bridge” or “A-1” rounds

More on Scenario Planning…
Worst-case scenarios should answer “What happens if there is no outside capital?”– if the answer isn't 'grow slower', is this a pipe dream?
Best-case scenarios should answer “What does this business look like if everything goes right?”– if the answer isn’t a huge financial win for your investor, is this a pipe
dream?
Most-likely scenarios should answer “What does this business look like following comparable companies’ growth paths?”– if the answer isn’t able to be funded with the current “ask”, is this a
pipe dream?
Goldilocks got it right: examine all options!

Building Projections: Common Terms
Common Terms
• Revenue/Sales
• COGS
• Gross Profit/Margin
• Operating expenses
• EBITDA
• Cash flow breakeven
• Working capital
• Burn rate
Important KPI’s
• Total cost of acquisition
• MRR/TCV
• Churn
• Month over month increase in revenue/expenses and other key metrics (%)

Building Projections: How it works
• Fundamental components of model:• Profit & Loss
• Balance Sheet
• Cash Flow
• These three schedules flow together and are essential to understanding your business
• Above schedules should be presented by month
• Have an assumptions page: this allows flexibility – change assumptions for different growth scenarios
• Assumptions are the backbone of your projections, so you should know them COLD
Excel is your friend, but be careful with cell references – it’s easy to make a mistake!

Projections: Getting started…
What is your business model like?
• Look at other businesses/competitors/comparables
• Link for SEC website
• Analyst reports
• Market surveys
• Don’t recreate the wheel

Projections: Getting started…
Start with Revenue
• Ex: We have tracked X unique visitors to our website and with an industry averages 2% conversion rate, sales will be Y.
• Ex: Survey revealed customers are willing to pay $X for a product with Y features.
• Ex: Q4 sales were $X. With a customer acquisition cost of $Y, we expect a 20% growth rate as a result of marketing efforts
• All revenue projections must be backed up with a sales plan
Econ 101: revenue = price * volume. Knowing which element is driving your company’s revenue is a key metric.

Group expenses according to function: COGS/COS
Selling
Marketing
Engineering & Development
General & Administrative
Determine headcount first then build expenses around that
Who are your key hires?
What function and timing and cost?
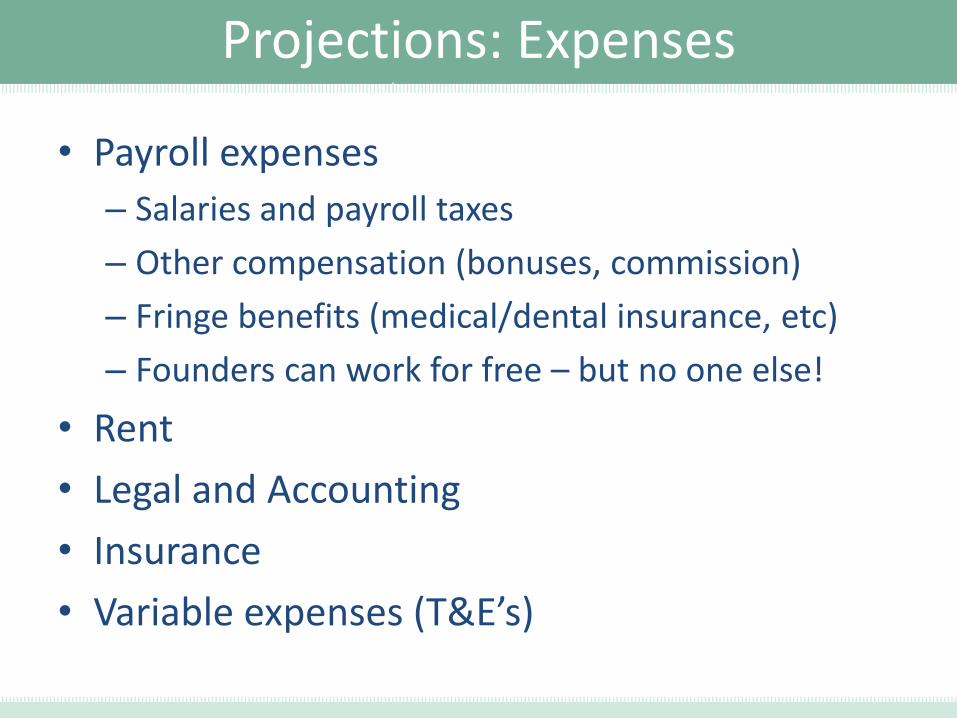
Projections: Expenses
Projections: Expenses
• Payroll expenses
– Salaries and payroll taxes
– Other compensation (bonuses, commission)
– Fringe benefits (medical/dental insurance, etc)
– Founders can work for free – but no one else!
• Rent
• Legal and Accounting
• Insurance
• Variable expenses (T&E’s)
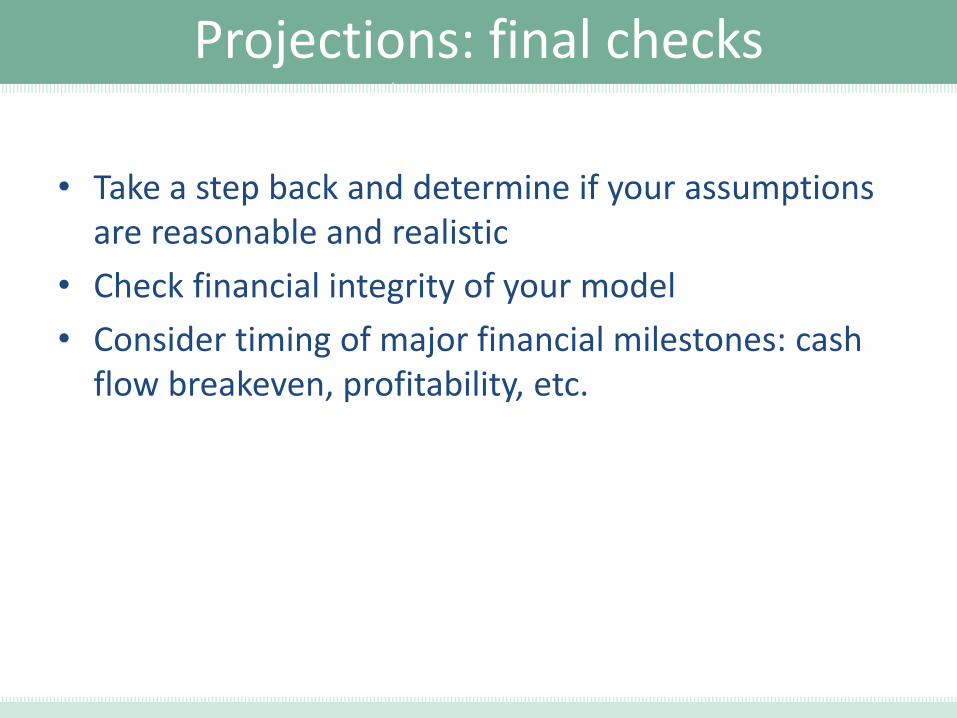
Projections: final checks
• Take a step back and determine if your assumptions are reasonable and realistic
• Check financial integrity of your model
• Consider timing of major financial milestones: cash flow breakeven, profitability, etc.

Pitching projections: What’s the “ask”?
• Put yourself in the investor’s seat – what are they getting for their money?
• Does your ask for cash get you to a value creation point?
• Cash gives you options
• Plan on 12-18 months of cash burn
• The secret to life is “t”
– “t” is the variable for “time” in mathematical equations… and time in projections is everything

Pitching Projections: Rookie moves
– CTRL+C+P entire excel model into a slide
– Using anything less than 18-point font
– Littering clipart from 1995… or 2013
– Stating projections to the $.01
– Failing to summarize projections
– Using ANY of the following phrases:• “conservatively estimated…”
• “at only X% of the market…”
• “with no competition…”
– Forgetting to explain what the amount you raise achieves
– Relying on a short-term exit at a high multiple

Bad Example
RevenueCustom runners $ 480,000 624,000 811,200 1,054,560 1,370,928 Standard runners 60,000 78,000 101,400 131,820 171,366
Total Revenue $ 540,000 $ 702,000 $ 912,600 $ 1,186,380 $ 1,542,294
COGS
Custom runners $ 120,000 $ 156,000 $ 202,800 $ 263,640 $ 342,732
Standard runners 39,000 50,700 65,910 85,683 111,388
Total COGS $ 159,000 $ 206,700 $ 268,710 $ 349,323 $ 454,120
GROSS PROFIT $ 381,000 $ 495,300 $ 643,890 $ 837,057 $ 1,088,174
ExpensesSelling Expenses
Commission $ 36,000 $ 46,800 $ 60,840 $ 79,092 $ 102,820 Marketing/Advertising 50,000 50,000 100,000 150,000 200,000
Research and Development 40,000 50,000 62,500 78,125 97,656 General and Administrative Expenses
Office Rent 30,000 30,000 30,000 30,000 30,000 Insurance 9,600 9,600 9,600 9,600 9,600 Office Utilities 4,800 4,800 4,800 4,800 4,800 Supplies 18,000 18,000 18,000 18,000 18,000 Salaries 120,000 120,000 120,000 120,000 120,000 Benefits 30,000 30,000 30,000 30,000 30,000 Miscellaneous 21,600 21,600 21,600 21,600 21,600
Total Expenses $ 360,000 $ 380,800 $ 457,340 $ 541,217 $ 634,476
EBITDA $ 21,000 $ 114,500 $ 186,550 $ 295,840 $ 453,698

Good Example – For Presentation Purposes
2015 2016 2017 2018 2019
Revenues
Stream 1 25,000$ 100,000$ 750,000$ 2,000,000$ 3,500,000$
Stream 2 - 150,000 400,000 1,150,000 1,650,000
Total Revenues 25,000$ 250,000$ 1,150,000$ 3,150,000$ 5,150,000$
Cost of Goods Sold 25,000 187,500 575,000 1,417,500 2,060,000
Gross Margin - $ - 62,500 575,000 1,732,500 3,090,000
Gross Margin - % 0% 25% 50% 55% 60%
Operating Expenses:
Sales & Marketing 100,000 250,000 325,000 400,000 475,000
Research & Development 325,000 350,000 375,000 400,000 425,000
General & Administrative 250,000 300,000 325,000 360,000 375,000
Total Operating Expenses 675,000 900,000 1,025,000 1,160,000 1,275,000
Operating Income / (Loss) (675,000)$ (837,500)$ (450,000)$ 572,500$ 1,815,000$
Headcount 5 7 8 10 12
Capital Expenditures 100,000 250,000 150,000 100,000 50,000
Cash Burn (775,000)$ (1,087,500)$ (600,000)$ 472,500$ 1,765,000$

20
Good Example – Graphs
$750k $3MM
Raise Raise
2015 2016 2017 2018 2019
Expenses Revenue Customers
# C
ust
om
ers
$ (
in m
illio
ns)
$5
$4
$3
$2
$1
500
400
300
200
100
