tcl- ar-final 1to appoint a director in place of mr. nusli n. wadia, who retires by rotation and is...
TRANSCRIPT


0
2000
4000
6000
8000
10000
12000
14000
16000
2011-122010-112009-102008-092007-08
Standalone
Consol
Turnover*4,
036 5,
982
12,6
52
7,91
39,44
9 10,8
95
13,6
55
6,22
5
8,36
2
5,41
2
CAGR :Standalone =18%Consol =23%
*Turnover = Income from Sales Less Excise Duty**EBIDTA excludes other income, foreign exchange losses on borrowings (net), voluntary retirment scheme cost, impairment losses, actuarial gains/losses for overseas pensionliabilities and restructuring costs.@2007-08 figures includes ` 487 crores profit on sale of investment.# Net debt = Long-term borrowings + Short Term borrowings + Current maturities of Long Term Debts and Finance Lease Obligations - Cash and Cash Equivalents - CurrentInvestments***Return on Invested Capital= [(PAT + Minority Interest + Interest - tax on interest) / (Shareholders’ Funds + Borrowings + Minority Interest)]
(` in crores except per share data, EBITDA %, PAT %, Return on Invested Capital and Net Debt/EBITDA)
0
500
1000
1500
2000
2500
2011-122010-112009-102008-092007-08
744
1,11
3
2,00
2
899
1,84
0
893
2,30
4
EBITDA and EBITDA %**
Standalone
EBITDA % Standalone
EBITDA % Consol
Consol
CAGR:Standalone - 9%Consol - 20%
6%
8%
10%
12%
14%
16%
18%
20%
18%
18%
12%
16%
16%
19%
14%
17%
17%
980
1,86
4
1,05
2 13%
0
200
400
600
800
1000
1200
2011-122010-112009-102008-092007-080
4
8
12
16
20
24
28
16%
23%
5%
8%6%
7%PAT % Standalone
PAT% Consol6%
PAT and PAT %@
6% 6%5%
949
964
452
435
408
58764
8
606 65
3
838
StandaloneConsol
0
5
10
15
20
25
30
35
40
45
50
2011-122010-112009-102008-092007-0842
.82
43.5
1
19.2
5
27.5
9
18.3
8
25.6
1
26.1
0
23.0
3
32.8
8
Earning Per Share (EPS)@ and Dividend Per Share (DPS)
DPS
9 9 9
1010
8
9
10
11
12
Standalone EPSConsol EPS
16.3
2
Net Debt#/EBITDA**
0.00
0.50
1.00
1.50
2.00
2.50
3.00
3.50
4.00
2011-122010-112009-102008-092007-08
2.72
3.67
2.40
2.35
1.98
2.34
2.342.
442.61
2.39
Standalone
Consol
Return on Invested Capital***
0%
2%
4%
6%
8%
10%
12%
14%
16%
18%
2011-122010-112009-102008-092007-08
16%
13%
8%
10%
8%
10%
7%
10%9%
10%Standalone
Consol
0100020003000400050006000700080009000
10000
2011-122010-112009-102008-092007-080
50
100
150
200
250
300
350
400
281MarketCapitalisation
Share Price
328
Market Capitalisation and Share Price
342 347
142
6,56
5
3,32
9
7,98
2
8,71
3
8,83
1
0
1000
2000
3000
4000
5000
6000
7000
2011-122010-112009-102008-092007-08
3,71
83,
572
4,77
0
4,28
3
4,71
6
4,74
1 5,45
2
6,41
8
Net Worth and Book Value (BV) per Share
BV per Sha159
153
203
164
194
176186
214197
252
re
BV per Share
Standalone
Consol
50
100
150
200
250
300
StandaloneConsol
3,85
9
5,01
7

Revenue Breakup - Standalone
Complex Fertilisers42%
Soda Ash13%
Vacuum Salt9%
Urea17%
Cement2%
Others13%
Other Income4%
Revenue Breakup - Consolidated
Complex Fertilisers27%
Soda Ash38%
Vacuum Salt5%
Urea10%
Cement1%
Others16%
Other Income3%
Segment Revenue Consolidated
Chemicals47%
Fertilisers41%
Other AgriInputs11%
Others1%
Geographical Revenue Consolidated
Asia71%
Europe11%
Africa1%
America16%
Others1%
Distribution of Total Income - Standalone
Materials65%
Distribution11%
Employee3%
Overheads5%
Depreciation3%
Dividend3%
Retention2%
Exceptional Items
2%Financial3%
Taxes3%
Distribution of Total Income - Consolidated
Materials52%
Distribution14%
Employee7%
Overheads9%
Depreciation4%
Dividend2%
Retention5%
Exceptional Items
1%Financial3%
Taxes3%

25
NOTICE
NOTICE IS HEREBY GIVEN THAT THE SEVENTY THIRD ANNUAL GENERAL MEETING OF TATA CHEMICALS LIMITED willbe held on Wednesday, 22nd August, 2012 at 3.00 p.m. at Birla Matushri Sabhagar, 19 Sir Vithaldas Thackersey Marg,Mumbai 400 020, to transact the following businesses: -
1. To receive, consider and adopt the Audited Statement of Profit and Loss for the year ended 31st March, 2012and the Balance Sheet as at that date, together with Reports of the Board of Directors and the Auditors thereon.
2. To declare dividend on Ordinary Shares.
3. To appoint a Director in place of Mr. R. Gopalakrishnan, who retires by rotation and is eligible for re-appointment.
4. To appoint a Director in place of Mr. Nusli N. Wadia, who retires by rotation and is eligible for re-appointment.
5. To appoint a Director in place of Mr. E. A. Kshirsagar, who retires by rotation and is eligible for re-appointment.
6. To appoint auditors and fix their remuneration.
7. APPOINTMENT OF MR. CYRUS P. MISTRY AS A DIRECTOR
To consider and, if thought fit, to pass with or without modification(s), the following resolution as an OrdinaryResolution:
“RESOLVED THAT Mr. Cyrus P. Mistry, who was appointed by the Board of Directors as an Additional Director ofthe Company with effect from 30th May, 2012 and who holds office up to the date of the forthcoming AnnualGeneral Meeting of the Company in terms of Section 260 of the Companies Act, 1956 (“the Act”) and in respectof whom the Company has received a notice in writing from a Member under Section 257 of the Act, proposinghis candidature for the office of Director of the Company, be and is hereby appointed a Director of the Companyliable to retire by rotation.”
8. APPOINTMENT OF DR. VIJAY KELKAR AS A DIRECTOR
To consider and, if thought fit, to pass with or without modification(s), the following resolution as an OrdinaryResolution:
“RESOLVED THAT Dr. Vijay Kelkar, who was appointed by the Board of Directors as an Additional Director of theCompany with effect from 30th May, 2012 and who holds office up to the date of the forthcoming Annual GeneralMeeting of the Company in terms of Section 260 of the Companies Act, 1956 (“the Act”) and in respect of whomthe Company has received a notice in writing from a Member under Section 257 of the Act, proposing hiscandidature for the office of Director of the Company, be and is hereby appointed a Director of the Companyliable to retire by rotation.”
Notes:
1. The relative Explanatory Statements, pursuant to Section 173 of the Companies Act, 1956, in respect of thebusiness under Item Nos. 7 and 8 above, are annexed hereto. The relevant details of the Directors seekingappointment/ re-appointment under Item Nos. 3 to 5, 7 and 8 above, as required by Clause 49 of the ListingAgreements entered into with the Stock Exchanges are also annexed.
2. A MEMBER ENTITLED TO ATTEND AND VOTE AT THE MEETING IS ENTITLED TO APPOINT A PROXY TO ATTENDAND VOTE INSTEAD OF HIMSELF AND SUCH PROXY NEED NOT BE A MEMBER OF THE COMPANY. PROXIES,IN ORDER TO BE EFFECTIVE, MUST BE RECEIVED BY THE COMPANY NOT LESS THAN 48 HOURS BEFORE THETIME FOR HOLDING THE MEETING.
3. Members / Proxies should bring the enclosed attendance slip duly filled in, for attending the Meeting, alongwith the Annual Report.
4. Book Closure and Dividend:
The Register of Members and the Share Transfer Books of the Company will be closed from 10th August,2012 to 22nd August, 2012, both days inclusive.

26
CHEMICALS
Seventy Third Annual Report 2011-12
Tata Chemicals Limited
5. The dividend, if declared at the Annual General Meeting, will be paid between 23rd August, 2012 and27th August, 2012 to those persons or their mandates:
(a) whose names appear as Beneficial Owners as at the end of the business hours on 9th August, 2012 inthe list of Beneficial Owners to be furnished by National Securities Depository Limited and CentralDepository Services (India) Limited in respect of the shares held in electronic form; and
(b) whose names appear as Members in the Register of Members of the Company on 9th August, 2012after giving effect to valid share transfers in physical form lodged with the Company / Registrar andShare Transfer Agents on or before the aforesaid date.
6. Nomination Facility:
Members holding shares in physical form may obtain the Nomination forms from the Company’s Registrarand Share Transfer Agents.
Members holding shares in electronic form may obtain the Nomination forms from their respectiveDepository Participants.
7. National Electronic Clearing Services (NECS) :
The Reserve Bank of India has initiated National Electronic Clearing Services (NECS) for credit of dividenddirectly to the bank account of Members.
Members holding shares in dematerialised form are requested to provide their latest bank account details(Core Banking Solutions Enabled account number, 9 digit MICR and 11 digit IFS Code) to their DepositoryParticipants.
Members holding shares in physical form are requested to provide their latest bank account details (CoreBanking Solutions Enabled account number, 9 digit MICR and 11 digit IFS Code) alongwith their FolioNumber to the Company’s Registrar and Share Transfer Agents, TSR Darashaw Limited.
8. Members holding shares in physical form are requested to consider converting their holdings todematerialise form to eliminate all risks associated with physical shares and for ease in portfoliomanagement. Members can contact the Company’s Registrar and Share Transfer Agents, TSRDarashaw Limited, for assistance in this regard.
9. Unclaimed Dividends:
Transfer to General Revenue Account
Pursuant to Section 205A(5) of the Companies Act, 1956, all unclaimed dividend upto the financial yearended 31st March, 1995 have been transferred to the General Revenue Account of the Central Government.Members, who have not yet encashed their dividend warrant(s) for the said period, are requested to forwardtheir claims in Form No. II prescribed under the Companies Unpaid Dividend (Transfer to General RevenueAccount of the Central Government) Rules, 1978 to:
Office of the Registrar of CompaniesCentral Government Office Building‘A’ Wing, Second floor,Next to Reserve Bank of India,CBD, Belapur 400 614
Transfer to the Investor Education and Protection Fund
Consequent upon amendment to Section 205A of the Companies Act, 1956 (“the Act”) and introductionof Section 205C by the Companies (Amendment) Act, 1999, the amount of dividend for the subsequentyears remaining unpaid or unclaimed for a period of seven years from the date of transfer to UnpaidDividend Account of the Company shall be transferred to the Investor Education and Protection Fund (the“Fund”) set up by the Government of India.

27
Accordingly, the dividend which had remained unpaid / unclaimed from the financial years ended 31st March,1996 to 31st March, 2004 have been transferred to the Fund in respect of the Company and that of erstwhileHind Lever Chemicals Limited (since merged with the Company effective 1st June, 2004), for the financial yearended 31st December, 2003 have been transferred to the Fund.
Members are requested to note that pursuant to Section 205(C) of the Act, no claim shall lie against the Companyor the aforesaid Fund in respect of any amount of dividend remaining unclaimed / unpaid for a period of sevenyears from the dates they became first due for payment. Any person / member who has not claimed dividendin respect of the financial year ended 31st March, 2005 or any year thereafter is requested to approach theCompany / Registrar and Share Transfer Agents of the Company for claiming the same. It may be noted thatthe unpaid/unclaimed dividend for the financial year ended 31st March, 2005 declared by the Company on 21stJuly, 2005 will be transferred to the Investor Education and Protection Fund.
10. E-mail Address:
In order to communicate the important and relevant information and event to the members, including quarterlyresults in cost efficient manner, the members are encouraged to register their e-mail addresses with the Registrar& Share Transfer Agents (R&T) in case of shares held in physical form and with their respective DepositoryParticipants (DP) in case of demat holdings.
11. A member desirous of getting any information on the accounts or operations of the Company is required toforward his / her queries to the Company at least seven days prior to the meeting so that the requiredinformation can be made available at the Meeting.
By Order of the Board of Directors
Rajiv ChandanMumbai, 30th May, 2012 General Counsel & Company Secretary
Registered Office:Bombay House24, Homi Mody Street, Fort,Mumbai 400 001
Green Initiative
The Ministry of Corporate Affairs (vide circular nos. 17/2011 and 18/2011 dated 21st April,2011 and 29th April, 2011 respectively), has undertaken a ‘Green Initiative in CorporateGovernance’ and allowed companies to share documents with its shareholders throughan electronic mode. A recent amendment to the Listing Agreement with the StockExchanges permits companies to send soft copies of the Annual Report to all thoseshareholders who have registered their e-mail address for the said purpose. Members arerequested to support this Green Initiatives by registering / updating their e-mail addressesfor receiving electronic communications.

28
CHEMICALS
Seventy Third Annual Report 2011-12
Tata Chemicals Limited
EXPLANATORY STATEMENT
As required by Section 173 of the Companies Act, 1956, (hereinafter referred to as "the Act"),the followingExplanatory Statement sets out all material facts relating to the business mentioned under Item Nos. 7 and 8of the accompanying Notice dated 30th May, 2012.
Item No. 7:
Mr. Cyrus P. Mistry was appointed as an Additional Director by the Board of Directors of the Company with effectfrom 30th May, 2012. In accordance with the provisions of Section 260 of the Act, Mr. Cyrus P. Mistry will hold officeas a Director upto the date of the ensuing Annual General Meeting. The Company has received a Notice under Section257 of the Act from a member proposing his candidature for the office of Director of the Company.
Mr. Cyrus P. Mistry is a graduate of Civil Engineering from Imperial College, UK and has an M.Sc. in Management fromLondon Business School. He has been associated with the Shapoorji Pallonji Group since 1994. Under Mr. Mistry'sguidance, Shapoorji Pallonji's construction business has grown from a turnover of USD 20 million to approximatelyUSD 1.5 billion, with presence in over 10 countries. He joined the Board of Tata Sons Limited in 2006 and is presentlythe Executive Deputy Chairman. He is also Director of Tata Industries Limited, The Tata Power Company Limited,Tata Teleservices Limited, Tata Consultancy Services Limited, Tata Steel Limited and Tata Motors Limited.
Your Directors are of the view that the Company would be immensely benefited by the wide experience of Mr. CyrusP. Mistry and therefore, recommend for approval the Resolution contained in Item No. 7 of the Notice convening theAnnual General Meeting.
None of the Directors except Mr. Cyrus P. Mistry is concerned or interested in Item No. 7 of the Notice.
Item No. 8:
Dr. Vijay Kelkar was appointed as an Additional Director by the Board of Directors of the Company with effect from30th May, 2012. In accordance with the provisions of Section 260 of the Act, Dr. Vijay Kelkar will hold office as a Directorupto the date of the ensuing Annual General Meeting. The Company has received a Notice under Section 257 of theAct from a member proposing his candidature for the office of Director of the Company.
Dr. Vijay Kelkar has done Ph.D. from the University of California at Berkeley. After a brief stint as a teacher in Nepal,Dr. Vijay Kelkar joined the Planning Commission in 1973. From the Planning Commission, Dr. Vijay Kelkar joined theCommerce Ministry in 1977 as an Economic Adviser, and has since then served in various capacities includingSecretary to the Economic Advisory Council to the Prime Minister between 1985 and 1988. In 1994, Dr. Vijay Kelkarcame back to the Government as Petroleum Secretary. Dr. Vijay Kelkar was made Finance Secretary in 1998. During1999-2002, Dr. Vijay Kelkar was an Executive Director in the International Monetary Fund (IMF).
Dr. Vijay Kelkar is currently the Chairman of National Stock Exchange of India Limited, Mumbai and had been conferredthe Padma Vibhushan by the President of India, the Highest Padma Award, in January 2011 for his distinguished andexceptional service to the Nation.
Presently, he is on the Boards of, inter-alia, Tata Consultancy Services Limited, Britannia Industries Limited, Go Airlines(India) Limited, National Stock Exchange of India Limited, JSW Steel Limited, JM Financial Limited, Lupin Limited, GreenInfra Limited and Orbis Capital Limited.
Your Directors are of the view that the Company would be immensely benefited by the wealth of experience andadvice of Dr. Vijay Kelkar and therefore, recommend for approval the Resolution contained in Item No. 8 of the Noticeconvening the Annual General Meeting.
None of the Directors except Dr. Vijay Kelkar is concerned or interested in Item No. 8 of the Notice.
By Order of the Board of Directors
Rajiv ChandanMumbai, 30th May, 2012 General Counsel & Company Secretary
Registered Office:Bombay House24, Homi Mody Street, Fort,Mumbai 400 001

29
Details of the Directors seeking appointment / re-appointment at the Annual General Meeting(Pursuant to Clause 49 of the Listing Agreement)
Particulars Mr. R. Gopalakrishnan Mr. Nusli N. Wadia Mr. E.A. Kshirsagar
Date of Birth 25th December, 1945 15th February, 1944 10th September, 1941
Date of Appointment 30th October, 1998 26th June, 1981 26th November, 2008
Qualifications B.Sc (Physics), B.Tech (IIT) Educated in UK Fellow Member of the Instituteof Chartered Accountantsin England and Wales.
Expertise in specific Wide experience in Marketing and Eminent industrialist with rich Wide experience in the field offunctional areas General Management. business experience. Corporate Strategy and
structuring, Mergers andAcquisitions, valuations andfeasibility.
Directorships in • Tata Sons Limited • The Bombay Dyeing & • Batliboi Limitedother Public Limited • The Tata Power Company Limited Manufacturing Company Limited • JM Financial LimitedCompanies* • Rallis India Limited • Gherzi Eastern Limited • Rallis India Limited
• Tata AutoComp Systems Limited • The Bombay Burmah Trading • HCL Infosystems Limited• Tata Technologies Limited Corporation Limited • Merck Limited• Akzo Nobel India Limited • Britannia Industries Limited • JM Financial Products Limited• Castrol India Limited • Tata Steel Limited• Advinus Therapeutics Limited • Tata Motors Limited• Metahelix Life Sciences Limited • Go Airlines (India) Limited• Dhaanya Seeds Limited
Membership of Audit Committee - Audit CommitteeCommittees in other • Akzo Nobel India Limited • Batliboi LimitedPublic Limited • Castrol India Limited • JM Financial LimitedCompanies (includes • HCL Infosystems Limitedonly Audit & • Rallis India LimitedShareholders’/ • Merck LimitedInvestors’ Grievance • JM Financial Products LimitedCommittee)
Shareholders’/Investors’Grievance Committee• HCL Infosystems Lmited• Rallis India Limited
No. of shares held in 15000 NIL NILthe Company
Contd.

30
CHEMICALS
Seventy Third Annual Report 2011-12
Tata Chemicals Limited
Particulars Mr. Cyrus P. Mistry Dr. Vijay Kelkar
Date of Birth 4th July, 1968 15th May, 1942
Date of Appointment 30th May, 2012 30th May, 2012
Qualifications B.E. (Civil) - Imperial College, UK, Ph.D from University of CaliforniaM.Sc. (Management - London Business School
Expertise in specific Wide business experience in variety of industries. Eminent economist with rich businessfunctional areas experience.
Directorships in • Tata Sons Limited • Tata Consultancy Services Limitedother Public Limited • Tata Industries Limited • Britannia Industries LimitedCompanies* • The Tata Power Company Limited • Go Airlines (India) Limited
• Tata Consultancy Services Limited • National Stock Exchange of India Limited• Tata Teleservices Limited • JSW Steel Limited• Tata Steel Limited • JM Financial Limited• Tata Motors Limited • Lupin Limited
• Green Infra Limited• Orbis Capital Limited
Membership of Audit Committee Audit CommitteeCommittees in other • Tata Sons Limited • Tata Consultancy Services LimitedPublic Limited • JM Financial LimitedCompanies(includes only Audit Shareholders’/ Investors’ Grievance& Shareholders’/ CommitteeInvestors’ Grievance • JM Financial LimitedCommittee)
No. of shares held NIL NILin the Company
* Note: Excludes Directorships in Private Limited Companies, Foreign Companies, Section 25 companies and Government Bodies
Details of the Directors seeking appointment / re-appointment at the Annual General Meeting(Pursuant to Clause 49 of the Listing Agreement)

31
DIRECTORS’ REPORT
TO THE MEMBERSOF TATA CHEMICALS LIMITED
The Directors hereby present their seventy third Annual Report together with the Audited Statement of Accountsfor the year ended 31st March, 2012:
FINANCIAL RESULTS` in crores
Particulars Standalone Consolidated2011-12 2010-11 2011-12 2010-11
Total Income ................................................................ 8267.61 6440.89 13973.87 11156.34
Profit before Depreciation and Exceptional items ...... 1122.13 800.02 2044.47 1608.87
Less : Depreciation ..................................................................... 224.68 204.46 508.68 451.05
Less : Exceptional items ........................................................... 133.10 36.86 152.36 36.86
Profit before tax .......................................................... 764.35 558.70 1383.43 1120.96
Tax ................................................................................ 177.75 150.21 343.92 274.92
Profit after tax ............................................................. 586.60 408.49 1039.51 846.04
Minority Interest ......................................................................... - - 199.46 192.57
Share of Loss in Associates .................................................... - - 2.46 -
Profit Attributable to shareholders ..................................... 586.60 408.49 837.59 653.47
Add:
Balance in Statement of Profit and Loss .......................... 1943.42 1869.33 2666.37 2374.96
Other Adjustments .................................................................... 0.40 - (19.76) -
Amount available for Appropriation ....................... 2530.42 2277.82 3484.20 3028.43
Appropriations -
(a) Proposed Dividend ........................................................... 254.76 254.76 254.76 254.76
(b) Tax on Dividend ................................................................. 38.01 38.79 64.50 41.33
(c) General Reserve ................................................................. 58.66 40.85 68.80 53.47
(d) Debenture Redemption Reserve ................................ - - 12.50 12.50
(e) Transfer to Other Reserves ............................................ - - 5.31 -
(f ) Balance Carried forward ................................................. 2178.99 1943.42 3078.33 2666.37
2530.42 2277.82 3484.20 3028.43
DIVIDEND
For the year under review, the Directors have recommended a dividend of ` 10 per share (` 10.00 per share for theprevious year) on the Equity Shares of the Company aggregating to ` 292.77 crores [including Dividend Tax (net)].
PERFORMANCE REVIEW
The net revenue from the operations of the Company increased from ` 6,333 crores to ` 7,987 crores, registering agrowth of 26% over the previous year. Profit before tax was ` 764 crores whereas the Profit after tax was at ` 587crores, an increase of 37% and 44% respectively, over the previous year.
The consolidated net revenue from the operations increased from ` 11,061 crores to ` 13,806 crores, an increase of25% over the previous year. On consolidated basis the Profit before tax was ` 1,383 crores whereas the Profit aftertax before Minority Interest and share of Loss in Associates was at ` 1,040 crores, an increase of 23% and 23%

Seventy Third Annual Report 2011-12
Tata Chemicals Limited
CHEMICALS
32
respectively, over the previous year. Profit attributable to the Group after deducting the minority interest and shareof loss in Associate was at ` 838 crores, an increase of 28% over the previous year.
Tata Chemicals Limited’s (TCL or the Company) operation is organised under four segments i.e. (1) InorganicChemicals comprising Soda Ash, Salt, Sodium Bicarbonate, Marine Chemicals, Caustic Soda and Cement, (2) Fertiliserssegment comprising Fertilisers and other traded products, (3) Other Agri-inputs including Rallis India Limited’soperations and (4) Others - comprising Water Purifier, Bio-fuels and Pulses. Performance review of these businessesis as under:
1. INORGANIC CHEMICALS SEGMENT
1.1 INDIA OPERATIONS:
During the year, the Company’s Industrial Chemicals operation in India achieved sales of `1,483 crorescompared to sales of `1,202 crores in the previous year. The year witnessed an increase in the Gross SalesRealisation (GSR) of soda ash as compared to the previous year, thereby absorbing some of the substantialcost pressures facing the business and reflecting the market supply-demand balance. Increased usage ofsome low-grade soda ash substitutes, use of cullets and slow down in dyes and other chemical sectors,coupled with de-stocking of the product pipeline by customers resulted in flat domestic demand for sodaash. While the domestic manufacturers maintained their position in the market, a slowdown was seen inimports from most major exporting sources. High energy costs and costs of other key inputs led to anincrease in prices across the globe. A volatile exchange rate added to the adverse impact specifically in theIndian market.
The sodium bicarbonate market demand also remained flat this year on the back of a 15% growth inFinancial Year (FY) 2010-11. While domestic players managed to strengthen their position, imports lost someground in the market. The Company was able to consolidate the sale of Alkakarb® a variant and establishedSodakarb®, a branded food-grade sodium bicarbonate.
The Company also commenced trading operations in the Inorganic Chemicals space to increase its productoffering to customers and leverage its customer connect and distribution network.
Soda Ash
The Indian soda ash demand remained flat due to delays in commissioning of some float glass lines andincreased consumption of low-grade substitutes. However, the Company’s strong relationship with customersand relentless focus on increasing already high service levels has enabled the Company to maintain itsmarket share in spite of sluggish demand. The Company was able to increase its market share on the back ofhigher domestic soda ash sales volumes. Prices remained firm during the year and helped mitigate the inputcost pressures. Key packaging automation projects were completed in the plant at Mithapur. The Companyalso upgraded the salt works during the year to cater to the increasing brine and raw salt requirements forthe site.
The Company’s production of soda ash at Mithapur in FY 2011-12 was 690,181 Metric Tonnes (MT) as againstthe previous year’s figure of 696,746 MT on account of some constraints in the availability of raw materialsand power. However, the Company achieved its highest ever sales in the Indian domestic market of 673,867MT of soda ash during the year, as against 668,774 MT during the previous year.
After a slowdown during the current year, there are signs that the market demand will be boosted bycommissioning of one float and another container glass line. Most of the float glass and container glassunits, including two container glass lines commissioned in the previous year, are expected to operate at fullcapacity. Strengthening end-consumer demand for detergents, silicate and glassware industries will alsotranslate into strong soda ash demand.
Sodium Bicarbonate
During the year, the Company achieved the highest ever sodium bicarbonate production of 80,285 MTwhich was 3% higher than in the previous year. Sales at 81,381 MT were 7% higher than the previous year,helping the Company achieve a market share of more than 50% in the domestic market. In FY 2011-12, theCompany consolidated Alkakarb® and established Sodakarb® brands in the Indian bicarbonate market withconsistent sales and encouraging demand pipeline. This is in line with the Company’s plan to offer valueadded branded variants as the domestic market matures and grows over a period of time and is consistentwith its global portfolio for this product.

33
During the year under review, the market remained flat against a growth of 15% in the previous year. Thisslow down in sodium bicarbonate demand is attributed to reduction in leather exports and slump in thedyeing industry. While any major recovery in the dyes and leather segment is not expected, the full-swingcommencement of commercial operations of a new application and a growing foods segment would helpsustain double digit growth rates through the coming years.
Cement
The Company’s cement plant was set up in 1993 to handle solid wastes generated as by-products of sodaash manufacture. The Company uses technology to separate solid effluents and process them into OrdinaryPortland Cement (OPC) and Masonry Cement. It enables the Company to convert its fly ash (generated in thepower plant) into an useful construction material. While the upward trend in raw material and energy pricesis likely to impact margins, the business will continue to focus on catering to the nearby markets formaximising realisations. During the year, the Company’s production of OPC cement was 435,809 MT andsales was 427,990 MT. It also achieved the highest-ever production and sale of Masonry Cement at 82,594MT and 82,338 MT, respectively.
Consumer Products - Salt and Related Products
During the year, the Consumer Products demonstrated strong performance by leveraging its distributionsystem and brand equity.
Iodised salt production in Mithapur was 621,933 MT, up 12% from 553,386 MT in the previous year. Overall,branded salt sales grew by 9% from 799,668 MT in FY 2010-11 to 868,525 MT in FY 2011-12. Sale of Tata Saltgrew by 12% in volume from 583,839 MT in FY 2010-11 to 654,468 MT in FY 2011-12. Sale of I-Shakti grewfrom 201,888 MT in FY 2010-11 to 202,305 MT in FY 2011-12. Amongst the major brands, I-Shakti continuesto maintain the most distributed brand after Tata Salt with a reach of 5.94 lac retail outlets. The Company’smarket share of its salt portfolio has increased to 64.3% in the National Branded Salt segment, up from61.8% in FY 2010-11.
I-Shakti cooking soda sales showed an encouraging growth of 28% with sales of 1,284 MT during the year ascompared to 1,003 MT in the previous year.
during the year, sales turnover of the consumer business grew by 24% to ` 958 crores from ` 772 crores inthe previous year.
The Consumer Products continue to work towards new product development through salt variants, bi-carbonate based products and development of other categories.
1.2 OVERSEAS OPERATIONS
1.2.1 Tata Chemicals North America Inc.,
During the year, Tata Chemicals North America Inc., (TCNA) achieved gross sales of USD 481 million (` 2,306crores) and EBITDA of USD 123 million (` 589 crores). These were higher by 20.55% and 4% respectively overthe previous year figures.
Soda Ash volumes during the year were 2,376,161 MT as against the previous year volume of 2,383,568 MT.Export sales volumes were up 6% as against the previous year, with sales to Latin America and Asia theprimary drivers. Sales volumes to North American customers were 0.8% higher as against the previous yearwith increase in flat glass, offsetting declining volume demand in container glass, detergent and chemicalend use markets. Price increases throughout the year were driven by high capacity utilisation rates in the USsoda ash industry and raw materials cost increases at global synthetic soda ash producers.
1.2.2 Tata Chemicals Europe
Tata Chemicals Europe achieved sales turnover of GBP 190 million (` 1,452 crores), registering an increase of13.77% over the previous year. EBITDA was up to GBP 39 million (` 287 crores). Low soda ash productionvolumes and some weak carbon quality were offset by good numbers from the salt business.
Soda Ash
Soda ash production was 804,627 MT, up by 3% as compared to the previous year with much improvedproduction at Lostock but continued weak volumes from the Winnington factory due to a number of technicalproblems and enforced instability in plant management.

Seventy Third Annual Report 2011-12
Tata Chemicals Limited
CHEMICALS
34
Sodium Bicarbonate
Sodium bicarbonate production was 101,785 MT, an increase of 2% over the previous year and the first time100,000 MT mark has been exceeded at the Northwich factories.
Salt
Salt production of 466,546 MT and sales of 426,899 MT generated an EBITDA contribution of GBP 17.3million (` 312.21 crores) while borehole debrining earned an EBITDA of GBP 1.9 million (` 14.52 crores) aspart of the contract with E - lectricite de France in respect of gas storage.
1.2.3 Tata Chemicals Magadi Limited
During the year, the Turnover was at USD 116.81 million (` 560 crores) as against USD 97 million (` 442crores) of the previous year, registering an increase of 20.42%. Sales volumes for both the Standard Ash(SAM) and Premium Ash (PAM) were at par with the previous year. Sales price at all regions were higherreflecting stronger capacity utilisation for global soda ash traders and raw material cost increases for syntheticsoda ash producers.
The combined sales volumes for both PAM and SAM were 484,612 MT as compared to 482,731 MT for theprevious year, an increase of 0.4%. EBITDA increased by 129% to USD 20.65 million (` 99 crores) from USD 9million (` 41 crores) in the previous year. This is attributable to higher soda ash prices, improved energy andpower efficiencies and controlled fixed costs.
Going forward, the company will continue its focus on plant optimisation through initiatives such as Lean SixSigma and stringent cost control measures as well as cash conservation.
2. FERTILISER SEGMENT
The Company has been recording consistent growth in Agri sector over the past few years. Attempts havebeen made by the Government of India to develop market oriented policies and curb the subsidy outgo. TheCompany is a prominent manufacturer of Urea and Phosphatic Fertilisers in India.
2.1 CROP NUTRITION BUSINESS
The Crop Nutrition business comprises Nitrogenous Fertilisers i.e. Urea manufactured at Babrala Plant andPhosphatic Fertilisers like Di-ammonium Phosphate (DAP), Nitrogen, Potash and Phosphorous (NPK), SingleSuper Phosphate (SSP) manufactured at the Haldia plant. During this year, the Company commissionedIndia’s first Customised Fertiliser manufacturing facility at Babrala. In addition to these, the Company importsand sells Muriate of Potash (MOP), DAP and supplies other crop nutrition products like Specialty Fertilisersand organic materials. During the year, the Crop Nutrition and Agribusiness operations of the Companyachieved a turnover of ` 5,641 crores as against the previous year’s ` 3,491 crores.
Urea
During the year, the Babrala plant achieved an annual Urea production of 1,165,557 MT, higher by 48,404 MTas compared to the previous year. The specific energy consumption during the year was 5.315 GCal/MT asagainst 5.26 GCal/MT in the previous year due to disruptions in production arising out of damage to theammonia converter.
DAP / NPK / SSP
During the year, the Haldia plant achieved a combined production of 708,230 MT of DAP, NPK and SSP asagainst the previous year’s production of 710,379 MT. The sales of DAP, NPK and SSP were 711,458 MT duringthe year as against 705,384 MT in the previous year.
Imported Products (DAP / MOP)
During the year, due to the anticipated shortage of DAP in the country, a huge quantity of complex fertiliserswere imported into the country. While the Company did not import other complex fertilisers, it sold importedDAP and Potassic fertilisers of 284,773 MT and 160,425 MT as against the previous year volume of 277,018MT and 217,215 MT, respectively. The MOP imports into the country started only in the second half of theyear due to delays in price finalisation in India. This affected the sales volume of this product. The significantincrease in maximum retail price to the farmer also affected the consumption of Potassic fertilisers.

35
Specialty Crop Nutrients and Micro-Nutrients
The Company continued to grow in this area by expanding into western and southern parts of India andintroducing three new products.
Customised Fertilisers
The first set of products under the Paras Farmoola range targeted the key crops of Paddy, Wheat, Potato andSugarcane in western Uttar Pradesh. The Company sold a total quantity of 54,173 MT during the year, whilethe capacity stands at 132,000 MT p.a. This being a new concept in India, the Company would like topromote this product in a phased manner.
2.2 NETWORK OF DEALERS AND FRANCHISEES
The traditional Sales Channel has now been extended throughout India. In addition, the Company alsooperates retail outlets under the brand of Tata Kisan Sansar (TKS) in the Northern and Eastern parts of India.These franchisee outlets act as one-stop shops offering quality agricultural inputs and Agri Solutions such asadvice on crops, application services and farming practices.
The dealer and franchisee network deal with all products such as Primary Nutrients (Urea, DAP, MOP, NPK,etc.), Specialty Fertilisers (Zinc sulphate, boron, micronutrients, calcium nitrate, organics, water soluble fertilisersetc.), Seeds (Field crops, vegetable crops) and the entire range of Pesticides.
Along with the above mentioned inputs, the Company is providing products of other reputed companiesthrough this retail network which help farmers to get all nutrients and inputs under one roof.
3. OTHER AGRI INPUTS
Rallis India Limited (Rallis)
Rallis posted consolidated revenues of ` 1,274.87 crores during the year, registering a growth of 17% overthe previous year figure of ` 1,086.26 crores. Profit before tax on a consolidated basis was ` 149.39 crores,which was 19% lower than the profit before tax of ` 184.48 crores during the previous year. Exceptionalitems such as cessation costs of `17.19 crores and losses relating to foreign exchange of ` 9.67 croresimpacted the profits. However, the EBIDTA percentage on a consolidated basis as compared to the previousyear has gone up by 11%.
The Domestic Formulation business registered a growth of 2% over the previous year, driven by a sustainedperformance of the key brands. The International Business Division registered an increase of 48% in sales ascompared to the sales during FY 2010-11 and it comprised 33% of the total revenues of the company duringthe year.
Subsequent to the year under review, Rallis has entered into definitive agreements for the acquisition of amajority equity stake in Zero Waste Agro Organics Private Limited, a Maharashtra based organic manure andsoil conditioners manufacturing company. With this acquisition, the product portfolio of Rallis will bestrengthened with organic manure and soil conditioner products to improve deteriorating soil health anddrive agriculture productivity.
4. OTHERS
4.1 Water Purifier
Tata Swach Water Purifier is available for sale throughout India except in the North-East and in Jammu &Kashmir and has been accepted well in the market. Tata Swach has been voted the ‘Product of the Year –2012’ in the water purifier category by over 30,000 consumers during a survey conducted by Nielsen in over36 cities.
4.2 Pulses
After promising results from the pilot project, the Company took Tata I-Shakti unpolished pulses nationallyleveraging on its extensive distribution network. The product is now available in 19 States. In the comingyear, the Company intends to focus on brand building activities and consumer awareness campaigns forpromoting Tata I-Shakti unpolished pulses.

Seventy Third Annual Report 2011-12
Tata Chemicals Limited
CHEMICALS
36
4.3 Biofuels
As a part of its Biofuels Research and Development Programme using non conventional raw materials, theCompany had set-up a bio-ethanol test plant of 30 KLPD at Nanded, Maharashtra. After two years of operationalexperience, the plant has been closed during the year. Due to uncertain economic environment in Europe,the Company is taking a cautious approach in its bio-ethanol project based on sugarcane at Mozambiquefor which the Government of Mozambique has given concessions for 15,934 hectares of productive land onthe banks of the river Zambezi in Mozambique.
4.4 Nutraceuticals
Innovation Centre (IC) of the Company has developed a unique process for manufacturing Prebiotics such asFructo, Galacto and Iso-Malto Oligosaccharides (FOS, GOS and IMO). The unique feature of the process lies init being environmentally benign (green), producing cost competitive and high purity product. In the last fewyears, the Prebiotics’ acceptability has grown worldwide due to its effectiveness in improving the digestivesystem, increasing uptake of vital nutrition from foods and thereby combating lifestyle diseases. This, coupledwith the fact that a validated process for the Prebiotics is in place, presents an opportunity to build abusiness around this. Pilot plant trials where undertaken at a third party facility to ascertain customeracceptance of the products and to overcome operational issues typically associated with a scale-up process.
The Company proposes to set up a manufacturing facility in Chennai for nutraceuticals at a cost of ` 12crores. Land has been acquired for this purpose and construction work will start once all the statutoryapprovals are in place.
5. JOINT VENTURES
5.1 Indo Maroc Phosphore S.A. (IMACID)
IMACID is a joint-venture company established in Morocco and is engaged in the manufacture of phosphoricacid. In IMACID, the Company has a 33.33% shareholding, together with two other equal partners, ChambalFertilisers and Chemicals Limited and Office Cherifien Des Phosphates (OCP), Morocco, the world’s largestproducer of Rock Phosphate and other phosphatic fertiliser products. The Company secures phosphoric acidthrough supply from IMACID for manufacture of granulated DAP and NPK fertilisers at its Haldia facility.
During the year, the cumulative production of phosphoric acid in this period was 329,173 MT as against362,842 MT of the previous year. The lower production was on account of a shutdown of the plant duringthe fourth quarter of FY 2011-12 due to adverse market conditions for its product. On a calendar year basis,the year 2011 saw the highest ever production of 429,622 MT as against a design capacity of 430,000 MT.Strong financial performance and cash reserves facilitated payout of 512 Million Moroccan Dirhams (` 299.63crores) as a special Dividend to its shareholders during the year.
5.2 Khet-Se Agriproduce India Private Limited
Khet-Se Agriproduce India Private Limited (Khet-Se) is a joint venture (JV) between TCL and Total Produce,Ireland, one of Europe’s largest fresh produce providers.
During the year, Khet-Se achieved a total distribution of 1,118 MT as against 5,660 MT of fresh producevalued at ` 2.49 crores as against ` 9.46 crores in the previous year. However, due to strategic reasons Khet-Se operations have been suspended from October, 2011.
5.3 JOil (Singapore) Pte. Limited (JOil)
JOil, a Jatropha seedling company, is based in Singapore in which the Company holds a 33.78% stake. JOilhas been set up by the Temasek Life Sciences Laboratory Limited (TLL), Temasek Life Sciences Ventures Pte.Limited (a subsidiary of Temasek Holdings) and other investors in Singapore. JOil has set up commercial seedorchards in India and Indonesia and has established tie-ups with tissue culture labs at various locations toproduce and market high yielding Jatropha seedlings. JOil recently announced the successful yield of morethan 2 tons of seeds per hectare in the first year of its field trials and the world’s first GM Jatropha with higholeic acid. Through this JV, the Company has secured exclusive marketing rights for JOil’s Jatropha seedlingsin India and East Africa and a preferential price for seedlings it requires for its own cultivation of Jatropha.

37
5.4 EPM Mining Ventures Inc.
The Company through its overseas subsidiaries has invested 25.70% stake in EPM Mining Ventures Inc. (EPM),a company listed on the Toronto Stock Exchange, Canada. EPM is an exploration-stage pre-revenue potashdevelopment company. Controlling over 123,000 acres on the Sevier Lake in Millard County, Utah, EPMexpects to develop a world-class mining site. The project intends to produce Sulfate of Potash (SOP - fertiliser)and other beneficial minerals using an environmental-friendly solar evaporation process.
5.5 Natronx Technologies LLC
The Company, through its subsidiary in United States, has signed definitive agreements to form an equalstake (33.33%) joint venture viz. Natronx Technologies LLC (Natronx) with FMC Corporation, U.S.A. and Church& Dwight Co. Inc., U.S.A. to manufacture and market sodium-based dry sorbents for air pollution control inelectric utility and industrial boiler operations. The sorbents, primarily sodium bicarbonate and trona, areused by coal-fired utilities to remove harmful pollutants, such as acid gases, in flue-gas treatment processes.Natronx intends to invest approximately USD 60 million (` 300 crores) to construct a 450,000 ton per yearfacility to produce trona sorbents.
FINANCE
During the year, with a view to augment long-term funds to part-finance the capital expenditure program, theCompany has raised USD 60 million (` 300 crores) through External Commercial Borrowings (ECB) with a bulletrepayment due at the end of 5 years. The Company also generated additional funds through sale of shares of othergroup companies.
Debenture and FCNR (B) loans of ` 150 crores and USD 25 million (` 122 crores) respectively were redeemed /repaid on due-dates during the year.
Significant increase in working capital and a firm interest rate regime during the year were challenges faced by theCompany. Despite this, the Company was able to contain the increase in interest costs which increased marginallyby 4% (` 8.70 crores).
During the year, the Company’s step-down subsidiary Tata Chemicals North America Inc. (TCNA) had entered intoloan agreements to raise debt of USD 375 million (` 1,908 crores) to refinance its high cost debt, fund its capitalexpenditure and to fund distribution to its parent company. The drawdown of the loans were made in March, 2012.
During the year, Rallis India Limited, a subsidiary of the Company and IMACID, a joint venture, have paid dividendsof ` 20.44 crores and ` 100.28 crores respectively to the Company. Further, TCNA, a step-down subsidiary of theCompany, has paid a dividend of USD 98.71 million (` 473 crores); which has been utilised to repay loans taken forfinancing the acquisition of EPM Mining Ventures Inc., USA, repay debt of Tata Chemicals Magadi Limited with aview to restructure its balance sheet and redeem preference capital held by the Company.
REORGANISATION OF GLOBAL CHEMICALS BUSINESS
With a view to reduce the number of intermediate holding companies, as also to bring the holding structure of itsglobal chemicals business under a single umbrella, thereby mirroring the holding and the operating structures, theCompany initiated plans to collapse the multiple entities in the most efficient and effective manner. To this end, theCompany had embarked upon a global reorganisation initiative under which the offshore chemical entities viz.Tata Chemicals Europe Limited, Tata Chemicals Magadi Limited and Tata Chemicals North America Inc. have comeunder a single holding company through the existing step-down subsidiaries.
Consequently, Bio Energy Venture-2 (Mauritius) Pvt. Ltd. merged with Bio Energy Venture -1 (Mauritius) Pvt. Ltd. andWyoming -2 (Mauritius) Pvt. Ltd. merged with Wyoming -1 (Mauritius) Pvt. Ltd. Subsequently, Wyoming -1 (Mauritius)Pvt. Ltd. merged with the Company.
AMALGAMATION OF WYOMING-1 (MAURITIUS) PVT. LTD. WITH THE COMPANY
During the year, the Scheme of Amalgamation of Wyoming-1 (Mauritius) Pvt. Ltd. (Wyoming-1), a wholly ownedsubsidiary, with the Company (‘the Scheme’) was filed before the High Court of Judicature at Bombay for itssanction pursuant to Section 391-394 of the Companies Act, 1956 (‘the Act’).
The Hon’ble High Court of Judicature at Bombay sanctioned the Scheme vide its Order dated 4th May, 2012. TheScheme became effective on 23rd May, 2012 with the Appointed Date of the Scheme as 1st January, 2012. No sharesof the Company were issued and allotted in lieu or exchange of the equity shares of Wyoming 1 under the Scheme.

Seventy Third Annual Report 2011-12
Tata Chemicals Limited
CHEMICALS
38
Accordingly, the standalone balance sheet for the financial year ended 31st March, 2012 of the Company includesfinancial results of Wyoming 1 from 1st January, 2012.
CONSOLIDATED FINANCIAL STATEMENTS
The Consolidated Financial Statements pursuant to clause 32 of the Listing Agreement entered into with the StockExchanges and prepared in accordance with the Accounting Standards is attached herewith.
SUBSIDIARY COMPANIES
The Ministry of Corporate Affairs, the Government of India has vide Circular No. 2/2011 dated 8th February, 2011granted general exemption subject to fulfillment of certain conditions from attaching the Balance Sheet of theSubsidiaries to the Balance Sheet of the Company without making an application for exemption. Accordingly, theBalance Sheet, the Statement of Profit and Loss Account and other documents of the subsidiary companies are notbeing attached with the Balance Sheet of the Company. Financial information of the subsidiary companies isdisclosed in the Annual Report. The Annual Accounts of these subsidiaries and related detailed information will bemade available to any member of the Company/ its subsidiaries seeking such information at any point of time andare also available for inspection by any member of the Company/ its subsidiaries at the Registered Office of theCompany. The Annual Accounts of the said Subsidiaries will also be available for inspection, as above, at the HeadOffices of the respective subsidiary companies.
As on 31st March, 2012, the Company had 46 (direct and indirect) subsidiaries (4 in India and 42 overseas). Duringthe year, following changes have taken place in the subsidiary companies:
• Wyoming-2 (Mauritius) Pvt. Ltd. merged with Wyoming-1 (Mauritius) Pvt. Ltd. with effect from 4th November,2011.
• Bio- Energy Venture-2 (Mauritius) Pvt. Ltd. merged with Bio- Energy Venture-1 ( Mauritius) Pvt. Ltd. with effectfrom 21st November, 2011.
• Rallis Australasia Pty Limited was liquidated with effect from 31st December, 2011.
• General Chemicals (Soda Ash) Inc. and Bayberry Management Corporation were dissolved with effect from11th January, 2012.
Subsequent to the year end, Wyoming-1 (Mauritius) Pvt. Ltd. merged with the Company with the Effective Date as23rd May, 2012.
DIRECTORS
During the year, Dr. M.S. Ananth resigned as Director of the Company with effect from 11th November, 2011. TheBoard has placed on record its appreciation for his valuable contribution during his association with the Company.
Mr. Cyrus P. Mistry and Dr. Vijay Kelkar have been appointed as Additional Directors on the Board with effect from30th May, 2012. Dr. Vijay Kelkar is an Independent Director. As per the provisions of Section 260 of the Act, both theDirectors hold office only up to the date of the forthcoming Annual General Meeting of the Company and are eligiblefor appointment as Directors. The Company has received notices under Section 257 of the Act in respect of the abovepersons, proposing their appointment as Directors of the Company. Resolutions seeking approval of the Members forappointment of Mr. Cyrus P. Mistry and Dr. Vijay Kelkar as Directors of the Company have been incorporated in theNotice of the forthcoming Annual General Meeting alongwith brief details about them.
Mr. R. Gopalakrishnan, Mr. Nusli N. Wadia and Mr. E. A. Kshirsagar, Directors of the Company, are due for retirement byrotation and are eligible for re-appointment.
CORPORATE GOVERNANCE
Pursuant to Clause 49 of the Listing Agreement, the Management Discussion and Analysis and the CorporateGovernance Report together with the Auditors’ Certificate on compliance with the conditions of CorporateGovernance as laid down forms part of the Annual Report.

39
INFORMATION TECHNOLOGY
The Company’s Information Technology (IT) infrastructure is continuously reviewed and renewed in line with thedevelopment in technology and its requirements. Progress over unifying the Company’s IT platform across all itsconstituents is continuing with SAP and is expected to be implemented for UK and US operations during thecurrent financial year i.e. FY 2012-13.
AWARDS AND RECOGNITIONS
The Company/ its subsidiaries during the year has won many awards some of which are listed below:
Excellence
• National Training Award to Tata Chemicals Europe
• National Award for “Significant Achievements in Employee Relations”
• Mother Teresa Award for Corporate Citizen 2011
• Employer Branding Award 2012
Corporate Sustainability and SHE
• “Certificate of Merit” by HP Eco solutions and “Eco recognition”
• Listed in top 5 companies at the FE - EVI Green Business Leadership Awards
• Business Action on Health Awards for its standout efforts in community health care to Tata ChemicalsMagadi Limited
• Ranked in top ten Carbon Disclosure Leadership Index in Carbon Disclosure Project 2011
• CII - ITC Sustainability Awards 2011
Communications
• 11 Awards including the ‘Champion of Champions’ Trophy at the 51st Annual ABCI Awards
Knowledge Management
• Asia’s Most Admired Knowledge Enterprise (MAKE) winner 2011
Product
• Aqua Excellence Awards - 2011 for “Water Supply & Treatment” to Tata Swach
• Awards in three categories at the Annual FAI Awards 2011
• Designomist 2011 for Tata Swach
• Voted by Consumers as the “Product of the Year - 2012” - Tata Swach
Finance
• SAFA Best Presented Accounts Award
CONSERVATION OF ENERGY, TECHNOLOGY ABSORPTION, FOREIGN EXCHANGE EARNINGS AND OUTGO
The information required under Section 217(1)(e) of the Act, read with the Companies (Disclosure of Particulars inthe Report of the Board of Directors) Rules, 1988 is annexed hereto as Annexure ‘A’ and forms part of this Report.
PARTICULARS OF EMPLOYEES
In terms of the provisions of Section 217(2A) of the Act, read with the Companies (Particulars of Employees) Rules,1975 as amended, the names and other particulars of the employees are set out in the Annexure to the Directors’Report. However, having regard to the provisions of Section 219(1)(b)(iv) of the Act, the Annual Report excludingthe aforesaid information is being sent to all the members of the Company and others entitled thereto. Anymember interested in obtaining such particulars may write to the Company Secretary at the Registered Office ofthe Company.

Seventy Third Annual Report 2011-12
Tata Chemicals Limited
CHEMICALS
40
AUDITORS
M/s. Deloitte Haskins & Sells, Chartered Accountants, who are the statutory auditors of the Company, hold office tillthe conclusion of the ensuing Annual General Meeting and are eligible for re-appointment. It is proposed to re-appoint them as Statutory Auditors of the Company for the FY 2012-13. The members are requested to considertheir appointment and authorise the Board of Directors to fix their remuneration. The auditors have, under Section224(1B) and Section 226 of the Act, furnished certificate of their eligibility for the appointment.
COST AUDITORS
The Central Government has approved the appointment of the following Cost Auditors for conducting cost auditfor the financial year ended 31st March, 2012:
� M/s. N.I.Mehta & Co. for manufacture of soda ash, caustic soda and cement at Mithapur; fertilisers and chemicalsat Haldia; and
� M/s. Ramanath Iyer & Co. for manufacture of fertilisers at Babrala.
The due date for filing the Cost Audit Report with the Ministry of Corporate Affairs for the financial year ended31st March, 2011 was 30th September, 2011. The Cost Audit Reports for the products mentioned above were filedbetween 27th September, 2011 to 29th September, 2011.
DIRECTORS’ RESPONSIBILITY STATEMENT
Pursuant to Section 217(2AA) of the Act, the Directors, based on the representations received from the OperatingManagement, confirm that:
i) in the preparation of the annual accounts, the applicable accounting standards have been followed and thatthere are no material departures;
ii) they have in the selection of the accounting policies, consulted the Statutory Auditors and have appliedthem consistently and made judgments and estimates that are reasonable and prudent so as to give a trueand fair view of the state of affairs of the Company at the end of the financial year viz., 31st March, 2012 andof the profit of the Company for the year ended on that date;
iii) they have taken proper and sufficient care, to the best of their knowledge and ability, for the maintenance ofadequate accounting records in accordance with the provisions of the Companies Act, 1956, for safeguardingthe assets of the Company and for preventing and detecting fraud and other irregularities;
iv) they have prepared the annual accounts on a going concern basis.
ACKNOWLEDGEMENTS
The Directors wish to place on record their appreciation for their continued support and co-operation by FinancialInstitutions, Banks, Government authorities and other stakeholders. Your Directors also acknowledge the supportextended by the Company’s Unions and all the employees for their dedicated service.
On behalf of the Board of Directors
RATAN N. TATAMumbai, 30th May, 2012 Chairman

41
ANNEXURE TO THE DIRECTORS’ REPORTAnnexure ‘A’
(UNDER SECTION 217(1)(e) OF THE COMPANIES ACT, 1956)DisclosuresA. CONSERVATION OF ENERGY
(a) Energy Conservation measures taken:• Installation of Energy efficient 16watt LED fittings.• Variable Frequency Drive (VFD) installed for 220hp scrubber fan and 5hp disc feeder in SSP Plant.• Energy Audit was carried out internally. Improved the condensate recovery by activating non-electrical driven
PAPPU pump. The areas where power was wasted in day time were identified and provided with timer.• Transpak sheets were put on roof structure top to minimise day time power consumption.• Reduction in specific power consumption at compressor.• Energy efficiency measures for lighting system. Entire lighting system replaced by 70W MH in Make-up Water
and Kiln.• Reduction in steam rate of Turbine by overhauling.• Rectifier up-gradation in chloro caustic plant.• Increasing the height of Lime kiln and modification of top mechanism and replacement of brick lining.• Supply Voltage optimisation.• Replacement of Split ACs and Township fans by 5 star rated ones.• Intelligent Motor Control Centres installed.• Implementation of Advanced Process Controller (APC) in Captive Power Plant (CPP) to improve its efficiency.• Installation of solar geyser in township houses to reduce electricity consumption.• Renovation of ammonia plant primary reformer catalyst tube, catalyst and furnace and dog house to improve
reformer efficiency and reduce heat loss.• Replacement of Synthesis loop water cooler with duplex tube material and shell of steam super-heater for better
thermal performance.• Titanium Urea Stripper replaced with Bi-metallic Urea Stripper in 11-Urea Stream to reduce steam consumption
in Urea plant.• Replacement of Carbamate Condenser in 21 unit of Urea plant to generate more low pressure steam and hence
to reduce net steam import in urea plant.(b) Additional investments and proposals, if any, being implemented for reduction of energy consumption:
• Overhauling of Turbo Generator to improve reliability and efficiency proposed in FY 2012-13.• Replacement of uneconomical repairable AC / Water cooler/ Refrigerator proposed in FY 2012-13.• New capital projects being done with energy efficient motors, energy efficient lighting, high efficiency distribution
transformers.• New Energy Audit - Power plant energy audit conducted by Electrical Research and Development Association
and Cement Plant energy audit conducted by Confederation of Indian Industries. Recommendations are beingevaluated for implementation.
• Replacement of Membrane, Coated Titanium Medium Mesh for Electrolyser.• Energy efficiency measures for lighting system. Entire lighting system replaced by 70W MH in Cement Plant.• Energy efficient motors of Efficiency Class 3 efficiency class installed at cement plant.• Replacement of Boiler Feed Water turbine with better efficiency turbine to reduce high pressure steam
consumption in ammonia plant.• Installation of Turbo-expander in fuel natural gas line and Ammonia recovery off-gas line to reduce electricity
consumption in ammonia plant.• Pre-heating of feed CO
2 to urea reactor by compressor second stage discharge to increase the temperature up to
its design value. The scheme would result in steam consumption in urea plant.• Up-gradation of Combustion Air pre-heater to reduce heat loss from primary reformer convection zone. The scheme
would result in better combustion efficiency of primary reformer furnace and conserving fuel natural gas.• Installation of 100 KW Solar PV System in township to generate power.
(c) Impact of the measures at (a) and (b) for reduction of energy consumption and consequent impact on the costof production:• Reduction in green house gas emission.• By closing Energy Audit points, the areas where power was wasted in day time were reduced through timer
implementation.• Reduction of power consumption.• Reduction in specific consumption of steam in Ammonia and Urea plant.• Reduction of power consumption in Ammonia and Urea plant.• Reduction of fuel natural gas consumption in Ammonia.

Seventy Third Annual Report 2011-12
Tata Chemicals Limited
CHEMICALS
42
(d) Total Energy consumption per unit of production as per Form A:Form A
The captive Steam Power plant at Mithapur is based on “Total Energy” concept, co-generating steam and power and therefore thecost of steam and power is shown as a composite number in the following calculation:
POWER AND FUEL CONSUMPTION1 ELECTRICITY Current Year Previous Year
2011-12 2010-11(a) Purchased
Units (Kwh) 441,15,696 415,04,115Total Amount (` Crores) 28.44 24.90
Avg. Rate (`/Kwh) 6.44 6.00(b) Own Generation
(i) Through Diesel Generation (Mwh) — —Unit per litre of diesel — —Cost per Unit (`) — —
(ii) Through Power Plant Unit (Mwh) — —Cost per Unit (`/Kwh) — —
(iii) Through Steam Turbine/Generator Unit (Mwh) 4,70,260 4,51,717Steam produced (Tonnes) 48,04,594 46,89,462Total Value of Electricity and Steam produced(` Crores) 406.64 334.24
(iv) Through Gas TurbineUnits produced (Mwh) 1,76,252.00 1,71,757.00Steam produced (Tonnes) 12,30,021.00 11,94,249.00Total Value of Electricity and Steam produced(` Crores) 142.38 117.74
2 Coal (specify quality and where used)(Mostly imported Coal received from various sources and“A” Grade Lignite are used in Boilers)Quantity (Tonnes) 6,55,162 6,56,965Total Cost (` Crores) 393.20 321.48Average Rate (`/Tonne) 6001.55 4,893.36
3 Natural GasPurchased (SCM) 22,13,86,518.63 23,31,49,217.00Total Cost (` Crores) 204.67 187.30Average Cost (`/SCM) 9.24 8.03
4 Regassified Liquified Natural GasPurchased (SCM) 1,92,34,216.00 43,98,184.00Total Cost (` Crores) 36.39 8.81Average Cost (`/SCM) 18.92 20.03
5 NaphthaPurchased (KL) 551.00 1,105.42Total Cost (` Crores) 0.97 1.95Average Cost (`/KL) 17,655.93 17,655.92
6 Furnace OilPurchased(KL) 1190.00 2059.00Total Cost (` Crores) 4.34 5.62Average Cost (`/KL) 36,497.00 27,282.00
7 HSDPurchased(KL) 82.37 674.85Total Cost (` Crores) 0.32 2.51Average Rate(`/KL) 38,766.00 37,263.00
CONSUMPTION PER UNIT OF PRODUCTIONELECTRICITY (Kwh/MT) STEAM (MT/MT)
Current Year Previous year Current Year Previous year2011-12 2010-11 2011-12 2010-11
Soda Ash Light 172.33 169.49 3.63 3.60Sodium Bicarbonate 56.57 53.03 0.89 0.78Caustic Soda Evaporated 2,772.01 2,641.29 0.91 1.88Vacuum Evaporated Salt 61.57 59.39 2.21 2.15Cement 134.00 147.01 — —Urea 60.20 62.46 0.96 1.00Ammonia 154.88 158.33 0.16 0.12Sulphuric Acid 46.13 43.72 — —Phosphoric Acid 287.60 375.09 0.660 0.914Sodium Tripolyphosphate __ 409.68 __ 2.04

43
Diammonium Phosphate 56.22 51.89 0.08 0.07NPK Complexes 32.10 33.27 0.05 0.05Single Super Phosphate 29.38 23.40 — —
Furnace Oil Ltr/Tonne
2011-12 2010-11Sodium Tripolyphosphate — 98Diammonium Phosphate 1.11 0.54NPK Complexes 2.47 2.23
B. TECHNOLOGY ABSORPTIONForm B
Research and Development (R&D)1. Specific areas in which R&D is carried out by the Company
• Our New Product Development team at Haldia has developed process for manufacturing of KNO3 (Potassium Nitrate)and water soluble NPK (19:19:19) and lab trials were taken, process map finalised and the products confirms to thespecification.
• Lab trial was completed for Zincated NPK (10:26:26). After successful plant trial, material has been sent for field trial.• Lab trial successfully completed for the products lik Double fortified SSP (Zn & B) Zincated DAP, Boronated DAP and
Zincated SSP. After successful plant trial, material has been sent for field trial.• Recovery of Potassium Sulphate (SOP) from sea bittern.• Installation of 3 Tonnes Per Day SOP pilot plant in progress.• Installation of Magnesium Oxide pilot plant in progress.• Recovery of Sodium Bicarbonate from Mother Liquor.• Recovery of Sodium chloride and Calcium chloride from soda ash effluent.• Recovery of Sodium chloride and Magnesium chloride from sea bittern.• Improvement in Bicarbonate efficiency.• Waste utilisation.
2. Benefits derived as a result of above R & D• Plant trial has completed for Zincated NPK (10:26:26). Material was sent for field trial. Feedback from market is very
promising.• Plant trial completed for the products, Double fortified SSP (Zn & B) Zincated DAP, Boronated DAP and Zincated SSP.• Collection of data for process scale up and validation of technical and economical feasibility.
3. Future plan of action• Installation of manufacturing plant of sulphate of potash from sea bittern.• Continued R&D efforts to attain objectives of cost reduction, energy conservation, waste minimisation / recycling and
reuse, related value added products, reduction in carbon footprints and environmental improvement.
4. Expenditure on R & D 2011-12 2010-11` Crores ` Crores
(a) Capital 1.39 4.13(b) Recurring 14.99 16.73(c) Total 16.38 20.86(d) Total R & D expenditure as a percentage of Total Turnover 0.20% 0.33%Technology Absorption, Adaptation & Innovation1. Efforts made towards technology absorption, adaptation and innovation 3 22. Benefits derived as a result of the above efforts >2.4 NA3. Imported technology
(a) Technology imported None Evatherm Salt Technology(b) Year of import NA 2010-11(c) Has technology been fully absorbed? NA Yes(d) If not fully absorbed, reasons and future course of action NA NA
C. FOREIGN EXCHANGE EARNINGS AND OUTGO Current year Previous year2011-12 2010-11` Crores ` Crores
1. Foreign exchange earned(a) Export of goods on FOB basis 56.03 41.73(b) Interest Income from subsidiary 0.00 0.47(c) Dividend 100.28 10.98(d) Miscellaneous Income 1.77 0.00
2. Outgo of foreign exchange Value of imports (CIF)(a) Raw materials and fuels 3,801.49 2,529.61(b) Stores, components and spares 14.16 9.31(c) Capital goods 87.46 40.11
3. Expenditure in foreign currencies 150.70 146.804. Remittance of dividends 39.05 29.85
CONSUMPTION PER UNIT OF PRODUCTION (Contd.)ELECTRICITY (Kwh/MT) STEAM (MT/MT)
Current Year Previous year Current Year Previous year2011-12 2010-11 2011-12 2010-11

44
Seventy Third Annual Report 2011-12
Tata Chemicals Limited
CHEMICALS
MANAGEMENT DISCUSSION AND ANALYSIS
GLOBAL BUSINESS ENVIRONMENT
In the Financial Year (FY) 2011-12, there were multiple economic events that impacted the global economy asworld GDP grew by 3.9%. These include Brent crude oil crossing US$ 125 per barrel in early 2011, Portugal needingbailout (following Greece and Ireland), Greece getting its second tranche of bailout funds, downgrading of USsovereign debt to AA+, gold price of US$ 100 per ounce after global stock markets stumbled in August 2011, Italy’sdebt rating reduced by three grades in October 2011, cut in Eurozone interest rate to 3%, Ed Nusbaum’s call for aUS$ 1 trillion bailout fund for European Union (EU) and Russia agreeing to join the World Trade Organisation(WTO). During the year, emerging economies grew at about 6.2% followed by advanced economies at 1.6%.
In FY 2011-12, India’s GDP grew at 6.9% compared to an average of 8.7% growth from 2005-06 to 2010-11. Theservices sector grew at 9.4% and is estimated to have accounted for 59% of GDP during the year. Manufacturingactivity was subdued due to monetary tightening, weak external demand and a lack of investment activity resultingfrom regulatory issues that impacted capital expenditure projects. In agriculture, a normal south-west monsooncombined with high market prices and minimum support prices of food articles resulted in record levels ofproduction of wheat, rice and cotton. However, there were many instances where farm-gate price realisations werelower than minimum support price and thus affected farmers’ margins. The 12 month moving average Index ofIndustrial Production fell from 8.2% at the beginning of the year to 4% in February, 2012. A high interest burdenreduced the profit growth of the corporate sector by 6.6% year-on-year with the manufacturing sector recording asubstantial reduction of 25.4%. For FY 2011-12, the current account deficit is expected to settle at about 4% of GDP,one of the highest ever driven primarily by the ballooning trade deficit estimated at US$ 185 billion, another“highest ever”.
Outlook for the Global Economy in FY 2012-13
Economic disparities, fiscal crises, climate change, energy price volatility combined with geopolitical conflicts,fragile power structures, weakening confidence in governance across the globe and rapid changes in thetechnological landscape make operating in this world, highly complex, challenging and unpredictable for enterprises.
The world economy is projected to grow by about 3.5% in 2012. Emerging economies are projected to grow at5.6%; this is about 0.7% lower than the 6.3% achieved in 2011, partly as a result of slower export growth and partlybecause several of them have been growing above average. Growth of advanced economies will reduce further toabout 1.4% from the already meagre 1.6% growth of 2011. While the US economy is expected to show somerecovery in 2012; its sustainability remains in doubt owing to uncertainty in areas such as fiscal spending, depressedconstruction activity coupled with recessionary conditions in the EU zone. Additionally, the debt crisis in the Eurozone is likely to keep sentiments subdued in 2012.
A larger risk for the global economy is a slowdown in average output per capita, which will determine how fastliving standards can be supported and raised. Globally, since the beginning of the century, the per capita growthrate of income has been around 2.5 percent. The greatest challenge for the global economy in this slower growthperiod is to raise / maintain productivity without destroying opportunities for the millions who are looking for jobsthat will allow them to support their living standards.
India’s GDP growth rate in FY 2012-13 is projected in the 7 - 7.5% band; a modest improvement over the previousfiscal. This implies that overall demand conditions will not be significantly different from FY 2011-12. However,achieving these projections will also necessitate a move away from the current sloth-like stance on reforms requiredto ease bottlenecks in critical sectors such as infrastructure, energy and minerals along with policy measures toimprove investor (global and Indian) sentiment. Looking ahead, the Indian economy could be impacted substantiallyby currency volatility, debt market sentiment, oil price and global trend of protectionism.
BUSINESS UNITS AND GROWTH STRATEGY
Tata Chemicals Limited (‘the Company’ or ‘TCL’) is a global company with interests in chemicals, crop nutrition andconsumer products and serves a diverse set of customers across five continents. Established in the year 1939 atMithapur, the Company today has the world’s second largest capacity in soda ash and is a pioneer and marketleader in the Indian branded iodised salt segment. The Company is also a key producer of nitrogenous andphosphatic fertilisers in the private sector and markets a range of crop nutrition offerings under Tata Paras brand.

45
The Company has its manufacturing facilities across four continents. With manufacturing facilities in India, UK,Kenya and USA, the Company is the world’s most geographically diversified soda ash company with almost two-thirds of capacity comprising natural soda ash giving it global competitive advantage. The Company is also thefourth largest manufacturer of sodium bicarbonate in the world. The Company’s nitrogenous fertiliser plant islocated at Babrala while phosphatic fertilisers are manufactured at Haldia.
The industrial chemicals business continued to focus on building its global market share. The Company continuesto focus on improving the efficiency of the global operations. At Tata Chemicals North America, a capacitydebottlenecking project increased capacity ~ 100,000 Metric Tonnes (MT). The Tata Chemicals Europe (TCE) businessgrew on the back of a strong performance of British Salt Limited (acquired in FY 2010-11). The Company has beentaking multiple measures to improve the profitability of operations at Tata Chemicals Magadi Limited which resultedin improved margin performance in FY 2011-12.
Within the crop nutrition and agri-business, Babrala continues to hold the position of the most energy efficientUrea plant in the country. There was a plant shutdown undertaken in early FY 2012-13 to replace the ammoniaconvertor. The plant has recommenced operations and production has been scaled up smoothly. Complex fertiliseroperations in Haldia helped the Company dominate market share in the Eastern part of the country. During FY2011-12, a debottlenecking project in Haldia helped increase Single Super Phosphate (SSP) capacity by ~ 50,000MT. Customised fertilisers have been well received by the farmers and the Company plans to consolidate itsposition in this business. The Company plans to aggressively grow the specialty nutrients business which has seenaccelerated growth in India in the recent years. Rallis India Limited (Rallis) plans to focus on international businesswhich already accounts for a third of it’s revenue. Rallis has entered into definitive agreements for the acquisitionof Zero Waste Agro Organic Private Limited which will help the company expand its portfolio with organic fertilisersand soil conditioners.
On the consumer products front, the branded salt portfolio continues to enjoy significant market share. Tata Saltand I-Shakti achieved a market share of 64% (National Branded Salt). The 200,000 MT salt capacity expansion inMithapur was successfully commissioned in FY 2011-12 and will add to salt volumes in FY 2012-13. The Companyrecently launched Tata Salt Plus – iron fortified iodised salt. This is India’s first national brand of packaged salt withiodine plus iron and is aimed at addressing and eradicating the prevalence of iron deficiency through one of themost widely consumed food essentials. The Company intends to aggressively grow this business over the next fewyears. Another value added product launched during the year was flavoured salt called Tata Salt ‘Flavoritz’ which isavailable in 3 distinct flavours. The launch marks the entry of the first indigenous brand of flavoured salt in India.
‘I-Shakti’ pulses which were launched in FY 2010-11 were expanded to over 19 states. Sourcing of these pulses isbeing carried out through a unique model wherein the Company organises finance as well as Package of Practice(POP) for the farmers and offers to buy back their produce in a transparent manner. While the farmer gets theadvantage of higher productivity and market access, the Company is able to reach the material to consumers costeffectively by reducing intermediaries.
The Tata Swach water purifier business is focusing on introducing new variants in the units and the bulb.
INORGANIC CHEMICALS SEGMENT
The key products under the segment of Inorganic Chemicals are soda ash, sodium bicarbonate, cement and salt.
Soda Ash
With a capacity of over 5 million MT, the Company is the second largest soda ash manufacturer in the world. Abouttwo-thirds of this capacity is based on natural soda ash. This unique feature helps the Company to have a lowenergy intensity and low environmental footprint. The Company’s natural soda ash (derived from trona) operationsare located at Lake Magadi in Kenya and at the Green River Basin of Wyoming in the USA where the world’s largestdeposits of trona occur. Synthetic soda ash and sodium bicarbonate are manufactured at Northwich, UK andMithapur, India. This process uses brine (salt water) and limestone as key raw materials.
With manufacturing facilities located across four continents: North America, Europe, Africa and Asia, the Companyhas the ability to optimally serve customers across the globe. Additionally, distributed sourcing of raw materialsincreases the reliability of supplies and mitigates the risks associated with potential regional disruptions that canadversely impact the global supply chain.

46
Seventy Third Annual Report 2011-12
Tata Chemicals Limited
CHEMICALS
In 2011, global soda ash demand exhibited strong growth. The emerging economies have been the primarygrowth driver for soda ash over the past decade. With rapidly increasing GDP and urbanisation, these economieshave experienced an increased per capita consumption of products using soda ash including flat glass (automobiles,housing), container glass (beverages), detergents, baked goods, clean water and sodium based chemicals. This yearthe demand has also recovered in the large developed economies such as the EU and USA. Overall, world demandis forecasted to grow 4-5% through 2016.
Global soda ash production capacity increased approximately 6% to 67 million MT with the growth almost entirelyoccurring in China. The global demand grew at 6% to 52 million MT in 2011. However, the over-capacity is regionspecific. China and Europe have more capacity than demand while the producers in US, Kenya and India areoperating at high rates. Global operating rates have recovered from 70% experienced during 2009, but are still wellbelow the 85% realised before the financial crisis. The global average utilisation of name-plate capacity, moderatedby comparatively lower levels of China and Europe, remains around 77%.
Global soda ash prices began to increase in 2011 and continued into 2012 reflecting both increased input costsacross the world as well as tight soda ash supply in some regions. Energy prices in particular have dramaticallyincreased from the lows of 2009, raising the costs of both natural and synthetic soda ash producers and is expectedthat energy and other input costs are likely to continue increasing, more so for the synthetic producers due to theirhigher energy intensity relative to the natural soda ash producers. Consequently, soda ash prices are likely toincrease in the short term in line with energy and other input costs even in the face of excess capacity as themarginal cost producers in China and Europe seek to pass on their cost increases.
The Indian soda ash demand remained flat due to delays in commissioning of float glass lines and increasedconsumption of substitutes. However, due to continued focus on growing the domestic market, the Company’sdomestic soda ash sales volumes increased by 1.5%, leading to an increase in market share by approximately 1%.Increase in realisations helped to partially mitigate the impact of the increase in input costs. The Company’s strongrelationship with customers and its relentless focus on increasing its already high service levels has provided theCompany the opportunity to consolidate its market position in 2011. While global prices remained under pressure,higher domestic sales volumes helped maintain profit levels.
New flat and container glass plants are expected to come on-line in India in the coming years along with expansionof existing operations. With the Indian economy expected to continue robust growth, the detergent and chemicalsectors are also expected to maintain their growth trajectory. Consequently, soda ash demand in India is anticipatedto grow 6% through 2016.
Sodium Bicarbonate
Sodium bicarbonate is commonly used as a pharmaceutical ingredient, food additive, animal feed and in airpollution control. The Company is the world’s fourth largest producer of sodium bicarbonate and the marketleader in India and UK.
In Europe, TCE’s sodium bicarbonate brands, Briskarb® and Alkakarb®, have wide market acceptance and anestablished position. In 2011, demand for sodium bicarbonate in the UK was at its highest level ever at 63,000 MT,which represented a 9% increase over 2010 levels. The sector continues to be driven by treatment of flue gas fromwaste incineration activities. TCE’s production improved marginally over FY 2010-11 levels, but this was not sufficientto take advantage of market growth opportunities; market share declined to 70% (from 73% in 2010). In India,domestic sales were marginally higher during the year helping the Company achieve a market share of 52% in thedomestic market. Sodium bicarbonate demand continues to demonstrate healthy growth across all consumingsectors, particularly in food related applications. Over the past year, the market grew 5% as against 15% in theprevious year. Despite the lower than expected growth for 2011, growth rates of 18% are anticipated for the next 5years. Growth drivers are reagent demand in alkali leaching of uranium ore and sustained incremental demand inthe food and feed sectors.
Cement
The Company’s cement plant was setup in the year 1993 to handle solid wastes generated as by-products of sodaash manufacture. The Company uses technology to separate solid effluents and process them into Ordinary PortlandCement (OPC) and Masonry cement. Masonry cement will enable the Company to convert its fly ash (generated in

47
the power plant) into useful construction material. While the upward trend in raw material and energy prices islikely to impact margins, the business will continue to focus on catering to nearby markets for maximising realisation.Cement sales crossed 500,000 MT for the first time in 5 years in FY 2011-12 and will continue to be supported byhigh regional growth rates of 10% predicted for FY 2012-13, up from 6% for FY 2010-11.
Salt
The estimated current annual consumption of edible salt in India is ~ 5.7 million MT. The demand for edible salt isexpected to grow at 1.3%. The private sector contributes over 88% of the salt production, while the public sectorhas a share of about 2%, the cooperative sector contributes about 10%.
The salt portfolio continued to grow in FY 2011-12 leveraging the brand equity and a strong distribution network.While continuing its leadership position in the packaged salt market, Tata Salt maintained its position in the Top 3Most Trusted Food brands as per Economic Times Brand Equity Survey. I-Shakti Salt is now the second largestpackaged national salt brand after Tata Salt. Tata Salt Lite continues to lead in the premium low-sodium saltsegment. All the brands continued to grow and have together achieved a market share of over 64% among thenational salt brands. In FY 2011-12, the Company expanded the salt production capacity by 0.2 million MT whichwill help in consolidating market position in FY 2012-13.
To enhance Tata Salt’s offerings to the consumers as also to address latent consumer requirements and expectations,two innovative products - ‘Tata Salt Plus’ (Iron fortified salt) and ‘Flavoritz’ (Flavoured salt) have been introduced.The vision for Tata Salt Plus is to help eradicate iron deficiency (anemia) through the ‘Iron fortification’ of iodisedsalt. The Flavoritz innovation intends to involve and empowers the consumers in creating a difference in the dailychore of cooking by offering ‘Taste mein twist’.
FERTILISER AND OTHER AGRI INPUTS
Climate change, energy and food security are major concerns for developing countries. Food grain production inIndia is majorly dependent on monsoon. FY 2011-12 witnessed above average rainfall in the country and agriculturaloutput has been excellent in Northern and Eastern parts of the country which are the main operating geographiesfor the Company. Food grain production in FY 2011-12 is estimated at 253 million MT - a record high. Food grainprices have, however, remained subdued due to higher production. Agriculture sector in India continues toexperience labour shortage which will act as an incentive for increased mechanisation of operations.
Fertilisers and Agri input segment is a major component of the Company’s business in India. The Company alongwith its subsidiary Rallis have in due course of time transformed into an integrated agri input player in the domesticmarket with a unique and diverse product portfolio ranging from basic and specialty nutrients, pesticides, seedsand farm services which are offered by a strong and experienced sales and distribution channel. The Companyremains focused on providing quality agri inputs and solutions to farmers that result in increase in productivity.The Company also plans to build on this relationship with the farmer by sourcing of specific crops for distributionto households through its consumer products distribution network.
The Company manufactures urea (at Babrala) and Phosphatic Fertilisers (at Haldia) in India. Rallis, a subsidiary ofthe Company, is a major player in the fast growing crop protection market in India. With Rallis’ acquisition ofMetahelix Life Sciences Limited (Metahelix), a research led seeds company, the Company has expanded its portfolioto seeds. TCL imports Muriate of Potash (MOP), Di-ammonium Phosphate (DAP), Specialty Fertilisers and other cropinputs which are sold via the Company’s widespread sales and distribution network. The Company also has a jointventure with Indo Maroc Phosphore S.A., Morocco (IMACID) which produces Phosphoric Acid – a key raw materialfor phosphatic fertilisers such as DAP and Nitrogen, Potash and Phosphorous (NPK).
In addition to the conventional sales channel, the Company operates a dedicated retail network of ‘Tata KisanSansar’. Similarly, Rallis operates a farmer connect program known as ‘Rallis Kisan Kutumb’ through which largenumber of farmers are connected with the company for exploring various opportunities of mutual interest.
Outlook for FY 2012-13
The Union Budget for FY 2012-13 has given a very strong emphasis on achieving self sufficiency in urea. The focuson growth of agriculture continues with higher budgetary outlay and increased lending targets for banks. All these

48
Seventy Third Annual Report 2011-12
Tata Chemicals Limited
CHEMICALS
developments will help in spurring demand and augur well for the Company. On the other hand, there has been areduction in the subsidy of Phosphate and Potash. This along with the weakening rupee could potentially lead toextensive price negotiating that may delay the imports of DAP and MOP.
With high food inflation, a substantial shift is being observed towards cash crops, for example, sugarcane acreagehas increased by more than 4% this year. Use of hybrid seeds, especially in crops like cotton, paddy and vegetables,is expected to further increase. Overall outlook for the FY 2012-13 looks encouraging subject to normal monsoonas predicted by the Government.
Urea
Urea imports into India have crossed the 7 million MT per annum mark in FY 2011-12. This figure may likely risesince there has been no addition to indigenous production capacity of urea in India during the last decade. TheCommittee under the chairmanship of Dr. Saumitra Chaudhary, Member, Planning Commission proposed a NewUrea Investment Policy which was approved by the Empowered Group of Ministers in January, 2012. The same isnow awaiting the approval of the Cabinet Committee of Economic Affairs post which it will be formally announced.The Company has already expressed its interest in doubling the production capacity at Babrala subject to asupportive investment policy. The additional capacity will increase the Company’s market share and also widenreach to other geographies (South & West India). The New Urea policy would also promote variants of urea such ascoated urea and fortified urea providing farmers with multiple options for efficient use.
DAP, NPK, SSP
Nutrient Based Subsidy (NBS) introduced in FY 2010-11 has impacted the Crop Nutrition business significantly.Strengthening global prices for DAP and MOP in FY 2011-12 led to a sharp increase in prices in the domesticmarket which in turn has caused some demand destruction. NBS, when extended to all fertilisers including urea,will promote the balanced use of fertilisers – a critical step for enhancing the productivity levels. NBS will alsopromote the use of more efficient fertiliser products and raise farmer awareness levels.
Rallis
Rallis has a significant presence in the crop protection segment with a wide portfolio of offerings such as pesticides,herbicides and fungicides amongst others. With the acquisition of Metahelix, a research based seeds company witha strong pipeline of products, Rallis has expanded its basket of offerings to the farmer.
Globally, the crop protection industry had a very good year in 2011. Overall the global market grew by 17% toreach to US$ 44.92 Billion from US$ 38.31 Billion. The factors giving a boost to the growth of the Agrochemicalsincluded a significant improvement in crop commodity prices in comparison to 2010.
The investments in International Business Division (IBD) is paying off and has shown commendable performanceover last year. Rallis has entered into definitive agreements for the acquisition of a majority equity stake in ZeroWaste Agro Organics Private Limited which will strengthen the Company’s portfolio with organic manure and soilconditioner products to improve deteriorating soil health and drive agriculture productivity. Acquisition of thisorganic manure business will spur the Company’s growth strategy.
New Products
The Company plans to focus on the sale of seeds, fertilisers, specialty nutrients and pesticides which are allcustomised to the need of the local farmer and for achieving this, the Company may extend its domestic presence.The Company plans to expand its product portfolio with the introduction of new Water Soluble Fertilisers, Hybridseeds and Organic fertilisers.
Specialty Nutrients
Water soluble fertilisers and micro nutrients are known for their specialised application and this market has beengrowing rapidly in India. These nutrients are complimentary to bulk fertilisers and its applications are made atcritical crop growth stages for improvement in yield and quality. The Company is well positioned to market theseproducts in existing and new geographies.

49
Customised Fertilisers
Customised fertilisers are knowledge based fertilisers carrying macro and micro nutrients designed for specificarea and crop, thus, providing holistic solution to deteriorating soil health. It has a significant impact on thenutrient use efficiency and helps farmers realise full yield potential for all crops. The Company has already taken alead in the market by commissioning its first customised fertiliser plant at Babrala. Farmers have given favourablefeedback on its convenience of use, increased yield as well as improved quality of the produce. The sales growthhas been slow in view of the current subsidy mechanism and the initial hesitation in adopting an expensive butnovel product. Continued interaction with the farmers will be needed to popularise the concept. It is heartening tonote that the 12th Five year plan document on agriculture also explicitly talks about use of customised fertilisersfor sustainable crop productivity. The Company has so far got four grades registered/approved for major crops likepaddy, wheat, potato and sugarcane for some specific geographies.
Trading
With the introduction of NBS, the risk of global price volatility needs to be managed by the Company. In view ofreducing this risk and importing products like DAP, NPK and MOP at internationally competitive prices, the Companyhas entered into long term tie-ups with the suppliers.
Tata Kisan Sansar and Rallis Kisan Kutumb
Tata Kisan Sansar, a dedicated network for distribution of agri inputs, is well established in North and Eastgeographies. This concept offers “One Stop agri input shop” to farmers. Besides, it provides a credible, dependableshop whose products and services could well be relied upon. Tata Kisan Sansar shops are franchised and located atblock level for ease of access to farmers. It provides direct connect with the farmers to understand their changingneeds and tailor products and services accordingly. Services like Soil Testing, Tata Kisan Parivar Membership (TKPM),Smart Krishi, Foliar Nutrition service help build strong relations with the farmers. Currently, there are more than 700Tata Kisan Sansar’s in operation.
Rallis’ customer relationship building activities branded under the umbrella of Rallis Kisan Kutumba (RKK) hasgrown with successful introduction of key initiatives like Samruddh Krishi , expansion of MoPu (Grow More Pulses),State partnership, Prerna and others. These initiatives, along with customer centric promotional activities and aproduct portfolio current with the market needs, has helped farmers to a great extent in protecting their cropseffectively, improving quality and yield of produce and ultimately in improving their standard of living. The RKKtoday directly services over seven lakh farmers.
OTHERS:
Biofuels
The Company after two years of operational experience closed down its bio-ethanol test plant of 30 KLPD atNanded, Maharashtra during the year. In respect of its bio-ethanol project based on sugarcane at Mozambique, theCompany is taking a cautious approach due to uncertain economic environment in Europe.
Water Purifier
Indian water purifier market is on a growth trajectory and has witnessed steady growth over the past few years.
Tata Swach Water Purifier has had a successful run since launch. As of end April, 2012, the cumulative units sold(purifiers + bulbs) has crossed 1 million units. During the previous year, Tata Swach also became the first purifier inIndia to enter e-commerce and setup an online store. Consumers can now purchase Tata Swach purifiers, bulbs andspare parts directly through the website. The business has also set-up a formal customer care division in TataSwach. Both these initiatives have been very well accepted by the consumers.
Adding to its list of awards and accolades that includes the prestigious Wall Street Journal’s Asian InnovationAwards, the Design of the Decade award, the IFF award, etc., Tata Swach was recently voted as the “Product of theYear 2012” in a survey conducted by Nielsen across 30,000 consumers in over 36 cities.
Pulses
The encouraging performance of the initial pilot led to the expansion of Tata I-Shakti unpolished pulses nationallyleveraging its distribution network. The product is now available in 19 States. In the coming year, the Companyintends to focus on brand building initiatives and expanding reach.

50
Seventy Third Annual Report 2011-12
Tata Chemicals Limited
CHEMICALS
Offering superior quality over polished pulses, TATA I-Shakti unpolished pulses have a clear edge. Tata I-ShaktiUnpolished pulses are all-natural and do not undergo water or oil polishing thereby retaining the nutrients andhave less moisture.
The Grow More Pulses program now engages over 20,000 farmers in 500 villages guiding them to improve theproductivity of pulses and also source good quality pulses.
ANALYSIS OF FINANCIAL PERFORMANCE:
Financial Analysis of Tata Chemicals Limited (Standalone entity in India) – Year Ended 31st March, 2012
1. Net Revenue from Operations:(` in crores)
FY 12 FY 11 Change % Change
Sale of products 8,071 6,352 1,719 27
Other Operating Income 75 108 (33) (31)
Less: Excise Duty 159 127 32 25
Net Sales/Income from Operations 7,987 6,333 1,654 26
Net Sales increased by 26% during FY 12 over FY 11 mainly due to higher realisation in consumer productsand inorganic chemicals and trading business viz., imported DAP/MOP and higher Subsidy income.
2. Other Income:(` in crores)
FY 12 FY 11 Change % Change
Other Income 280 108 172 159
The increase in other income is attributable to higher dividend received from one of the joint venture companiesand profit on sale of Trade investment in quoted equity shares in FY 12.
3. Cost of materials consumed:(` in crores)
FY 12 FY 11 Change % Change
Cost of materials consumed 2,865 2,199 666 30
Raw material consumption showed an increase of 30% during FY 12 over FY 11 mainly due to higher prices ofPhosphoric Acid, Ammonia and Regassified Liquified Natural Gas (RLNG) and Natural Gas.
4. Purchases of stock-in-trade:(` in crores)
FY 12 FY 11 Change % Change
Purchase of stock-in-trade 2,168 1,309 859 66
Cost of traded goods purchased increased by 66% mainly on account of significant increase in price in tradingproducts viz., imported DAP/MOP and higher volumes of traded product (Imported DAP).
5. Power and Fuel:(` in crores)
FY 12 FY 11 Change % Change
Power and Fuel 685 570 115 20
The increase in power and fuel cost during FY 12 over FY 11 is mainly on account of higher consumption inPet Coke and significant increase in prices of coal and Administered Price Mechanism (APM) and LiquifiedNatural Gas (LNG).

51
6. Freight and forwarding charges:(` in crores)
FY 12 FY 11 Change % Change
Freight and forwarding charges 479 427 52 12
The increase in freight and forwarding charges during the FY 12 over FY 11 is due to increase in sales volumesand increase in rail and road freight charges.
7. Other Expenses:(` in crores)
FY 12 FY 11 Change % Change
Other expenses 185 190 (5) (3)
Other expenses have gone down mainly due to decrease in professional fees.
8. Investments:(` in crores)
FY 12 FY 11 Change % Change
Trade Investments:Investment in Subsidiary Companies 4,046 4,304 (258) (6)Investment in Joint Ventures 180 176 4 2Investment in Other Companies 400 422 (22) (5)Current Investments - - - -Less : Prov for diminution in value of investments (12) - - -Total Investment 4,614 4,902 (288) (6)
Decrease in Trade investments is due to redemption of Preference Shares held in Subsidiary Company.
9. Inventories:(` in crores)
FY 12 FY 11 Change % Change
Inventories 1,253 696 557 80
The inventories as on 31st March, 2012 were higher than the level of 31st March, 2011 by ` 557 crore primarilydue to increase in the stock of Traded goods and also increase in raw materials at Mithapur works.
10. Trade Receivable(` in crores)
FY 12 FY 11 Change % Change
Trade receivable 1,510 744 766 103
Less : Provision for doubtful debts 24 20 4 20
Net Trade Receivable 1,486 724 762 105
The debtors as on 31st March, 2012 were higher by ` 762 crores than level of 31st March, 2011. The increase isin line with the increase in turnover.
11. Loans and Advances(` in crores)
FY 12 FY 11 Change % Change
Long-term Loans and Advances 170 189 (19) (10)
Short-term Loans and Advances 254 219 35 16
Loan and Advances 424 408 16 4
Short term loans and advances increased during FY 12 mainly due to increase in advance taxes and long termloans and advances decreased during FY 12 mainly due to reduction in capital advance.

52
Seventy Third Annual Report 2011-12
Tata Chemicals Limited
CHEMICALS
12. Cash Flow and Net Debt:
Net Cash flow from operating activities: The net cash from operating activities was ` 341 crores during FY 12 ascompared to ` 424 crores during FY 11. The cash operating profit before working capital changes and directtaxes during FY 12 was ` 1,091 crores as compared to ` 916 crores during FY 11. The change in workingcapital, during the financial year, was mainly due to increase in inventory, trade and other receivables anddecrease in trade payables, other liabilities and provisions.
Net Cash flow from investing activities: The net cash inflow from investing activities amounted to ` 89 crores inFY 12 as against an outflow of ` 244 crores in FY 11. The inflow broadly represents processed investment insubsidiaries and dividend partly offset by outflow on account of acquisition of fixed assets.
Net Cash flow from financing activities: The net cash outflow from financing activities was ` 337 crores duringFY 12 as compared to outflow of ` 93 crores during FY 11.
(` in crores)
FY 12 FY 11 Change % Change
Long-term Borrowings 2,203 2,586 (383) (15)
Short-term Borrowings 257 123 134 109
Long term Borrowing payable within one year 908 267 641 240
Total Debt 3,368 2,976 392 13
Less : Cash and Bank balances 892 799 93 12
Less : Current investments - - - -
Net Debt 2,476 2,177 299 14
Financial Analysis of Tata Chemicals Group (Consolidated) – Year Ended 31st March, 2012
Profit & Loss Analysis
1. Net Revenue from Operations:(` in crores)
Entity FY 12 FY 11 Change % Change
Tata Chemicals Limited 7,987 6,333 1,654 26
Tata Chemicals Europe and Tata Chemicals Africa 2,088 1,682 406 24
Tata Chemicals North America Inc. 2,307 1,818 489 27
Indo Maroc Phosphore S.A., Morocco 576 442 134 30
Rallis India Limited 1,281 1,092 189 17
Others and Eliminations (433) (306) (127) 42
Total 13,806 11,061 2,745 25
Comments:
Net revenue from operations increased by 25% during FY 12 primarily due to:
a. Inorganic Chemicals: Higher realisation across the continents, higher volumes [India (Salt and Soda Ash)]and appreciating USD and GBP rates (average rate) offset by lower volumes (Europe). British Salt Limited,which became the subsidiary during the fourth quarter of the previous year, contributed incremental `250 crores towards increase in net sales.
b. Fertilisers: Higher realisation (DAP, NPK, Urea and traded business viz. imported DAP and imported MOP)and higher volumes (DAP and traded imported DAP)
c. Rallis India Limited: Due to higher volumes and higher realisation in exports and Metahelix which becamethe subsidiary during fourth quarter of the previous year contributed incremental ` 66 crores.

53
2. Cost of Material Consumed:(` in crores)
Entity FY 12 FY 11 Change % Change
Tata Chemicals Limited 2,865 2,199 666 30
Tata Chemicals Europe and Tata Chemicals Africa 296 217 79 36
Indo Maroc Phosphore S.A., Morocco 397 305 92 30
Rallis India Limited 623 544 79 15
Others and Eliminations (337) (215) (122) 57
Total 3,844 3,050 794 26
Comments:
Raw material consumed increased by 26% as compared to the previous year due to:
a. Inorganic Chemicals: Increase in prices of raw materials (mainly coal) across continents, higher productionvolumes {Europe, Africa (PAM) and India (salt)}, appreciating exchange rates marginally offset by lowerproduction volumes {Africa (SAM) and North America).
b. Fertilisers: Increase in the prices of raw materials (mainly phosphoric acid, ammonia and gases).
c. Rallis India Limited – Increase in production volumes and prices. Metahelix which became the subsidiaryduring fourth quarter of the previous year contributed incremental ` 33 crores.
3. Purchase of Stock-in-trade:(` in crores)
Entity FY 12 FY 11 Change % Change
Tata Chemicals Limited 2,168 1,309 859 66
Tata Chemicals Europe and Tata Chemicals Africa 124 135 (11) (8)
Rallis India Limited 87 90 (3) (3)
Others and Eliminations (79) (85) 6 (7)
Total 2,300 1,449 851 59
Comments:
The cost of traded goods purchased has increased by 59% mainly on account of significant increase in priceand volume in trading products viz. imported DAP and Imported MOP.
4. Employee Benefit Expenses:(` in crores)
Entity FY 12 FY 11 Change % Change
Tata Chemicals Limited 240 207 33 16
Tata Chemicals Europe and Tata Chemicals Africa 264 210 54 26
Tata Chemicals North America Inc. 356 314 42 13
Indo Maroc Phosphore S.A., Morocco 18 13 5 38
Rallis India Limited 90 73 17 23
Others and Eliminations 3 3 - -
Total 971 820 151 18
Comments:
The staff cost increased by 18% mainly due to revision in wages in India, Europe, Africa and US and appreciatingUSD and GBP exchange rates (average rate). British Salt Limited and Metahelix, which became the subsidiaryduring the fourth quarter of the financial year 2010-11, contributed ` 30 crores and ` 10 crores, respectively,towards an increase in staff cost.

54
Seventy Third Annual Report 2011-12
Tata Chemicals Limited
CHEMICALS
5. Power and Fuel:(` in crores)
Entity FY 12 FY 11 Change % Change
Tata Chemicals Limited 685 570 115 20
Tata Chemicals Europe and Tata Chemicals Africa 479 387 92 24
Tata Chemicals North America Inc. 222 181 41 23
Indo Maroc Phosphore S.A., Morocco 10 9 1 11
Rallis India Limited 43 31 12 39
Total 1,439 1,178 261 22
Comments:
Power and Fuel charges have increased by 22% compared to the previous year due to:
a. Inorganic Chemicals: Increase in input cost (Coal) and higher consumption (Pet Coke), along withappreciating USD and GBP rates (average rate). British Salt Limited, which became the subsidiary duringthe fourth quarter of FY 10-11, contributed ` 44 crores towards increase in power cost.
b. Fertilisers: Higher input cost (APM and LNG) and higher cost on account of change in input mix i.e.increase in usage of LNG as compared to NG.
6. Other Manufacturing Expenses:(` in crores)
Entity FY 12 FY 11 Change % Change
Tata Chemicals Limited 978 1,154 (176) (15)
Tata Chemicals Europe and Tata Chemicals Africa 535 542 (7) (1)
Tata Chemicals North America Inc. 1,141 786 355 45
Indo Maroc Phosphore S.A., Morocco 81 63 18 29
Rallis India Limited 228 152 76 50
Others and Eliminations (14) 3 (17) (567)
Total 2,949 2,700 249 9
Other Manufacturing expenses represent the following:(` in crores)
Particulars FY 12 FY 11 Change % Change
Stores and spare parts consumed 194 157 37 24
Packing materials consumed 311 263 48 18
Repairs 312 253 59 23
Rent 141 116 25 22
Royalty, Rates and Taxes 151 122 29 24
Commission, discounts and distributors’service charges 175 112 63 56
Sales promotion expenses 132 116 16 14
Freight and forwarding charges 1,368 1,131 237 21
Changes in inventories of work-in-progress,finished goods and stock-in-trade (491) (47) (444) 945
Others(*) 656 477 179 38
Total 2,949 2,700 249 9
(*) - Others include insurance charges, lease rents, professional fees, hedging cost, travelling expenses, loss onsale of assets sold or discarded (net), provision for doubtful debts and advances, provision for diminution in

55
value of current investments, directors fees/commission, expenditure transferred to capital account and otherexpenses.
The other manufacturing expenses during FY 12 have increased by 9% compared to FY 11 due to:
a. Higher packing and stores expenses (due to higher volumes of most products), sales promotion expenses(including advertising), repairs (higher maintenance expenses at Europe and US), rates and taxes (onaccount of higher volumes), distributors’ commission (due to higher customer discounts in case of Agribusiness), freight and forwarding expenses (due to higher volumes and higher freight charges), hedgingcost, professional fees, IT expenses, appreciating exchange rates and other expenses.
b. Movement in Inventory change (WIP and finished goods) in the current year was primarily on account ofincreased stock levels in case of Indian operations (mainly traded and manufactured fertilisers stocks) inthe Current Year as compared to the Previous Year.
c. British Salt Limited and Metahelix, which became the subsidiary during fourth quarter of FY 10-11,contributed ` 28 crores and ` 23 crores respectively, towards increase in other manufacturing expenses.
7. Finance Costs:(` in crores)
Entity FY 12 FY 11 Change % Change
Tata Chemicals Limited 210 201 9 4
Tata Chemicals Europe and Tata Chemicals Africa 133 87 46 53
Tata Chemicals North America Inc. 82 70 12 17
Indo Maroc Phosphore S.A., Morocco - 2 (2) (100)
Rallis India Limited 14 7 7 100
Others and Eliminations (12) (16) 4 (25)
Total 427 351 76 22
Comments:
The increase in borrowing costs is mainly due to:
- Borrowings on account of British Salt Limited’s acquisition in the fourth quarter of FY 10-11
- Borrowings on account of Metahelix acquisition in the fourth quarter of FY 10-11.
- Appreciation in USD and GBP rates partly offset by repayment of unsecured Loans ` 150 crores andFCNRB US$ 25 Million;
- Higher interest on suppliers’ credit.
8. Exceptional Items:
a. Voluntary Retirement Scheme (VRS) cost of ` 17.19 crores relating to cessation of Turbhe (Mumbai)manufacturing operations of Rallis.
b. VRS at Mithapur - ` 2.38 cores.
c. Impairment of Assets - ` 48.45 crores.
d. During the year, the Company has exercised the option granted vide notification F.No.17/133/2008/CL-Vdated 29th December, 2011 issued by the Ministry of Corporate Affairs and accordingly, the exchangedifferences arising on revaluation of long term foreign currency monetary items have been recognisedover the shorter of the loan repayment period and 31st March, 2020. On account of this, ` 84.34 croreshave been charged to the Profit and Loss in the current year.
e. For the year ended 31st March, 2012, the Company has not recognised subsidy income of ` 44.91 croreson opening stock as on 1st April, 2011 of Raw Materials for Phosphatic and Potassic Fertilisers, in accordance

56
Seventy Third Annual Report 2011-12
Tata Chemicals Limited
CHEMICALS
with the Office Memorandum dated 11th July, 2011 issued by the Department of Fertilisers (DOF) whichprovides for the Subsidy on such Opening Stocks at old rates applicable to F.Y. 2010-11.
Based on the legal opinion made available, the said Office Memorandum is being represented against/contested. Had the Company recognised the subsidy income from sales made from such Opening Stocksas per the prevalent Nutrient Based Subsidy (NBS) policy without giving effect to the said OfficeMemorandum, the Sales/Income from operations and Net Profit of the Group would have been higher by` 44.91 crores and ` 33.64 crores respectively for the year ended 31st March, 2012.
f. Recognition of Actuarial Gains/Losses of overseas subsidiaries in Reserves w.e.f. 1st April, 2009. Had thepractice of recognising the actuarial gains and losses of pension plans of the overseas subsidiaries in thestatement of Profit and Loss been followed, the consolidated Net Profit before tax and Net Profit of theGroup would have been higher/(lower) by amounts as per table below:
` in Crores
Sr. No. Impact on : FY 12 FY 11
1. Consolidated Net Profit before tax (180.18) 22.33
2. Consolidated Net Profit of the Group (157.16) 3.03
INNOVATION AND TECHNOLOGY
Tata Chemicals Innovation Centre
The Tata Chemicals Innovation Centre (TC-IC) is located in Pune and has in its fold, 41 scientists with an excitingspectrum of expertise including nanotechnology and materials science, biotechnology, inorganic chemistry andmolecular biology along with catalysis and bioengineering. To support the Research and Development (R&D)activities and ensure adequate traction with customers and the market, the Innovation Centre has dedicatedBusiness Development and Intellectual Property Rights teams. Some of the projects on which TC-IC is currentlyworking include water purification, nutraceuticals, nano materials, agri solutions, surface coatings and alternateenergy/next generation biofuels/ bio-lubricants and low temperature fuel cells. The Company plans to commercialisea nutraceutical product which has been developed by the Innovation Centre by the end of FY 2012-13.
As part of focus on Innovation in the Company, a world class research center with facilities for scale-up has beendesigned and construction has begun in Pirangut, Pune and is expected to be operational by the end of FY 2012-13. This will enable expansion of the Innovation Centre to bring in an additional critical expertise in applicationsdevelopment, process engineering, etc.
Tata Chemicals Centre for Agri-Solutions and Technology
In order to provide appropriate advice to farmers on farming practices in general and crop nutrition practices andsolutions in particular, a development centre viz. Centre for Agri Solutions and Technology (CAT) has been set up inAligarh (U.P.). This Centre is staffed with experienced scientists who are working in various areas. The CAT team hasdeveloped Customised Fertiliser (CF) basal grades for wheat, rice, maize, potato and sugarcane for operationalregions around Babrala and sweet sorghum for growing regions in Maharashtra state. Crop specific CF (foliar)grades were developed on R&D based field trials and were quite effective on cost-benefit basis. CAT works closelywith the R&D team of TC-IC, Pune in evaluating exciting opportunities in the application of nanotechnology andbiotechnology to plant nutrition. This collaboration is supported by grants from the Department of Biotechnology.
HUMAN RESOURCES
As on 31st March, 2012, the Company had 4,752 employees, 3,176 in India and 1,576 overseas. In line with the HRstrategy, the Company continued the standardisation of HR systems and processes across geographies with a viewto improve operational efficiencies. In order to attract and retain talent at the manufacturing sites, a number ofmeasures have also been initiated. Employee development programs focusing on capability building like competencymapping and 360 degree feedbacks are being implemented. Role Specific Talent development initiatives havebeen initiated across the organisation. This has resulted in steady engagement levels and reduced attrition.

57
SUSTAINABILITY
Safety, Health and Environment (SHE)
Improving work place safety continued to be top priority in all operations and the total recordable injury frequencyrates are maintained and match world class levels. However, at the end of the year safety received a serious setbackwith three fatal incidents involving fall from height in two cases and fall from tractor in the third case. Healthmonitoring of the Company and the contract employees, commensurate with the work environment have continuedand there have been no significant observations relating to deficiencies in workplace health and hygiene conditions.The SHE performance is being reviewed at all review forums including by the Audit Committee. All sites in India arecertified to OHSAS 18001 (Occupational Safety & Health Assesment System), ISO 14001 and British Safety Council(BSC) 5 Star Safety Rating. The Haldia operations received the Sword of Honour from British Safety Council. TheBabrala operation is certified to Responsible Care RC 14001. The Babrala and Haldia operations are certified to BSC5 Star Environmental Sustainability rating. The Company is a member of the American Institute of Chemical Engineers(AIChE)-Center for Chemical Process Safety (CCPS) and British Safety Council and actively engaged with NationalSafety Council (NSC) of India and SHE committees of Indian Chemical Council, Alkali Manufacturers Association ofIndia (AMAI), FICCI, etc. Babrala Plant was assessed under Robert Campbell Safety Award of NSC USA.
Mithapur plant has continued the engagement with DuPont Safety to develop and refine its practices benchmarkedto world class practices. The Company received recognitions from National Safety Council of India, InternationalFertiliser Association, Fertiliser Association of India, Indian Chemical Council and Gujarat Mines Safety for its effortson SHE. The Process Safety Management practices based on OSHA-USA and AIChE-CCPS guidelines are beingintroduced with third party expert audits done at high risk chemicals handling systems at all sites.
The Company has complied with environmental consent conditions at all its locations. The Company continues tomonitor “Green Manufacturing Index” on targets on energy and water consumption, waste recycle and use ofrenewable energy. The Company continues to be a “Responsible Care” Logo holding company granted by IndianChemical Council (ICC) with logo recertification conducted by ICC in this year.
All operations outside India follow their local safety regulatory requirements and the reporting is integrated oncommon metrics. The UK operations are certified to OHSAS 18001.
Energy Conservation, Climate Change and Clean Development Mechanisms
The Company is engaged in fostering Sustainability and introducing Climate Change strategies into its operations.The Corporate Technology and Sustainability Group is building networks within the Company and outside to workon sustainable manufacturing practices and respond to the emerging expectations on Climate Change issues. TheCompany is a signatory to UN Global Compact and the Global Reporting Initiative (GRI), Responsible Care, CII-Mission on Sustainable Growth-Code for Ecologically Sustainable Businesses and the Global Corporate Roundtableon Climate Change at Earth Institute, Columbia University. During the year, it continued to hold the prestigiousResponsible Care Logo granted by Indian Chemical Council. The Babrala plant received in the year the CII-ITCSustainability Trophy and Mithapur got the commendation for Significant Achievement. Tata Chemicals SustainabilityReport for the India operations assured to GRI G3 Protocol is posted on the website.
Manufacturing operations are working on “Green Manufacturing Index” to reduce energy consumption, minimisewater consumption, reduce pollution load by adopting the concept of Reduce, Recycle and Reuse and has settargets in each aspect.
The Company is actively pursuing the Clean Development Mechanism (CDM) Process of United Nations FrameworkConvention on Climate Change (UNFCCC) to derive benefits from energy reduction and alternate fuel projects atits various plant locations and several projects have been identified across Mithapur, Babrala and Haldia withpotential revenues for the protocol period up to 2012. Four projects are already registered and accruing benefitsthrough sale of carbon credits.
The sustainability perspective in different regions globally is being managed as per the regional mandates like theEU Emission Trading System (ETS) in Europe and Environment Protection Agency (EPA) legislative actions in US andstrategic plans are being worked out. Tata Chemicals Europe Limited is pursuing the new Sustainable Energy Planton the plant site in Lostock. This will reduce reliance on expensive, high carbon fossil fuels by building a highlyefficient sustainable energy plant that will produce around a third of the heat energy needs from sustainable fuel
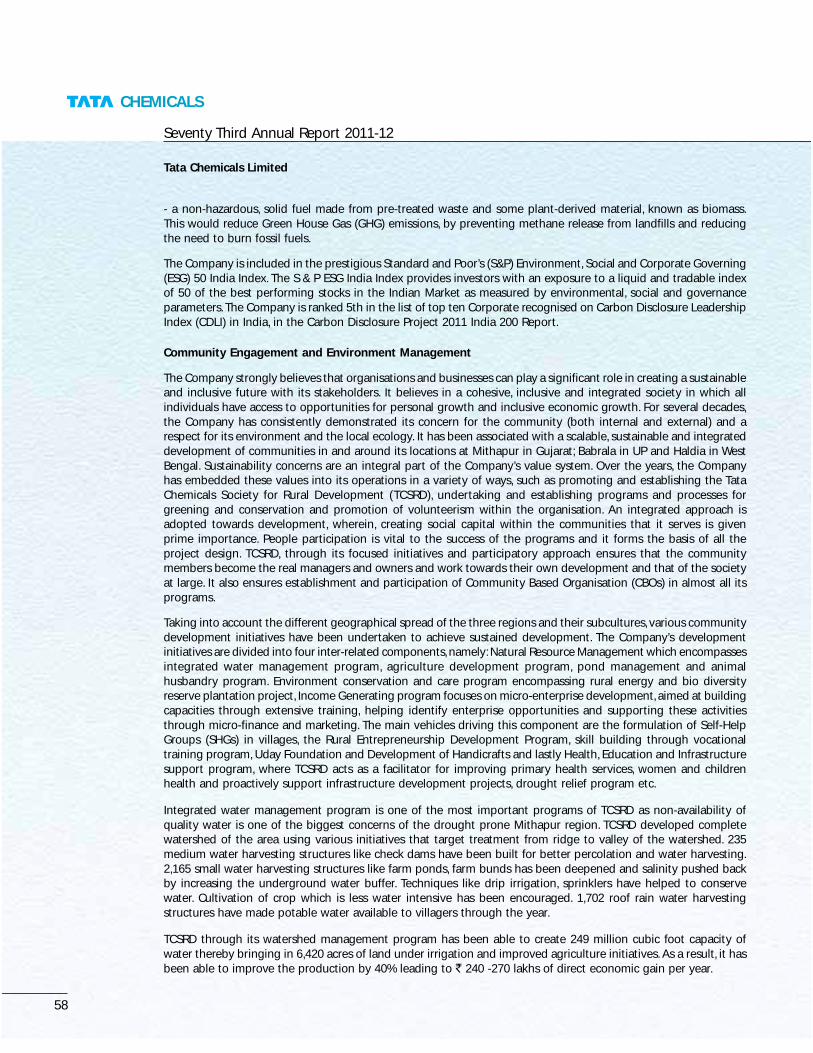
58
Seventy Third Annual Report 2011-12
Tata Chemicals Limited
CHEMICALS
- a non-hazardous, solid fuel made from pre-treated waste and some plant-derived material, known as biomass.This would reduce Green House Gas (GHG) emissions, by preventing methane release from landfills and reducingthe need to burn fossil fuels.
The Company is included in the prestigious Standard and Poor’s (S&P) Environment, Social and Corporate Governing(ESG) 50 India Index. The S & P ESG India Index provides investors with an exposure to a liquid and tradable indexof 50 of the best performing stocks in the Indian Market as measured by environmental, social and governanceparameters. The Company is ranked 5th in the list of top ten Corporate recognised on Carbon Disclosure LeadershipIndex (CDLI) in India, in the Carbon Disclosure Project 2011 India 200 Report.
Community Engagement and Environment Management
The Company strongly believes that organisations and businesses can play a significant role in creating a sustainableand inclusive future with its stakeholders. It believes in a cohesive, inclusive and integrated society in which allindividuals have access to opportunities for personal growth and inclusive economic growth. For several decades,the Company has consistently demonstrated its concern for the community (both internal and external) and arespect for its environment and the local ecology. It has been associated with a scalable, sustainable and integrateddevelopment of communities in and around its locations at Mithapur in Gujarat; Babrala in UP and Haldia in WestBengal. Sustainability concerns are an integral part of the Company’s value system. Over the years, the Companyhas embedded these values into its operations in a variety of ways, such as promoting and establishing the TataChemicals Society for Rural Development (TCSRD), undertaking and establishing programs and processes forgreening and conservation and promotion of volunteerism within the organisation. An integrated approach isadopted towards development, wherein, creating social capital within the communities that it serves is givenprime importance. People participation is vital to the success of the programs and it forms the basis of all theproject design. TCSRD, through its focused initiatives and participatory approach ensures that the communitymembers become the real managers and owners and work towards their own development and that of the societyat large. It also ensures establishment and participation of Community Based Organisation (CBOs) in almost all itsprograms.
Taking into account the different geographical spread of the three regions and their subcultures, various communitydevelopment initiatives have been undertaken to achieve sustained development. The Company’s developmentinitiatives are divided into four inter-related components, namely: Natural Resource Management which encompassesintegrated water management program, agriculture development program, pond management and animalhusbandry program. Environment conservation and care program encompassing rural energy and bio diversityreserve plantation project, Income Generating program focuses on micro-enterprise development, aimed at buildingcapacities through extensive training, helping identify enterprise opportunities and supporting these activitiesthrough micro-finance and marketing. The main vehicles driving this component are the formulation of Self-HelpGroups (SHGs) in villages, the Rural Entrepreneurship Development Program, skill building through vocationaltraining program, Uday Foundation and Development of Handicrafts and lastly Health, Education and Infrastructuresupport program, where TCSRD acts as a facilitator for improving primary health services, women and childrenhealth and proactively support infrastructure development projects, drought relief program etc.
Integrated water management program is one of the most important programs of TCSRD as non-availability ofquality water is one of the biggest concerns of the drought prone Mithapur region. TCSRD developed completewatershed of the area using various initiatives that target treatment from ridge to valley of the watershed. 235medium water harvesting structures like check dams have been built for better percolation and water harvesting.2,165 small water harvesting structures like farm ponds, farm bunds has been deepened and salinity pushed backby increasing the underground water buffer. Techniques like drip irrigation, sprinklers have helped to conservewater. Cultivation of crop which is less water intensive has been encouraged. 1,702 roof rain water harvestingstructures have made potable water available to villagers through the year.
TCSRD through its watershed management program has been able to create 249 million cubic foot capacity ofwater thereby bringing in 6,420 acres of land under irrigation and improved agriculture initiatives. As a result, it hasbeen able to improve the production by 40% leading to ` 240 -270 lakhs of direct economic gain per year.

59
TCSRD has motivated 270 farmers to adopt new water saving technology (drip and sprinkler) under its waterconservation initiative. The farmers are using the water saving technology in 1,345 acres of land, resulting in watersaving by 32-50% and increase in area under irrigation.
Land reclamation program has been successfully carried out at Babrala in 10 villages as some of the pockets in theregion had ‘USAR’ land which was severely saline. TCSRD, through the land reclamation process, has reclaimedmore than 1,500 acres of land. Under the agriculture growth program, Babrala has followed three pronged strategy-crop diversification, building capacity of farmers and promotion of new modern agricultural systems andtechnologies. Experts from TCSRD visit the fields regularly and offer advice and solutions to the agricultural problems.This program has helped farmers get better returns for their efforts.
Animal Husbandry is another important program of TCSRD. Agriculture is the predominant occupation followed bycattle rearing. It has been given special importance as it provides an alternate source of income for farmers ofMithapur and Babrala. Almost all households in these regions have at least a pair of cattle. TCSRD supports thefarmers by providing animal health check up at the door step and also at the animal health clinic which has beenopened at Babrala to provide care and treatment to animals. Breed improvement, cattle insurance, green fodderdemonstrations are the other services being provided under this program.
Seeing the importance of ponds to the Bengali families staying near the ponds, TCSRD started pond managementprogram in areas adjoining TCL’s operation at Haldia. It started training the people in scientific methods of pondmanagement. This method helped around 1,800 women increase their family income as they use ponds for personalas well as for commercial use.
TCSRD has always believed in strengthening the community it operates in. Enterprise among youth and channelingidle savings into growth projects was perceived to be a key towards making self-reliant communities. This programwas initiated in 2003 as a strategic step for training in livelihood generation and to counter the possible fallout ofdownsizing. The program has found wide acceptance in community. Besides helping individual entrepreneurs toeither set up new enterprises or to improve existing businesses, the program has also spurred the self help groupmembers into utilising their idle savings for investing in an enterprise. This program has helped increase individualsaving leading to financial security. Collaboration with local training Non-Government Organisations and theGovernment Organisations like Dalit Shakti Kendra, NABARD, Gram Technology has further strengthened thisprogram.105 training programs have been conducted across locations covering 62 villages wherein around 521people have undergone this training program. 85 people have set up their own enterprise.
Self-help groups formed by TCSRD at Mithapur and Babrala are making a difference in the lives of women. It hashelped them overcome the shackle of poverty and dependence. The simple procedure of lending has made itpopular among the women. Now they do not have to pay high rates of interest to money lenders. 415 self helpgroups have been formed so far with close to 100% recovery rate for loans. Regular training in team dynamics,leadership quality development, micro finance and economic activities are provided so that they are able to takedecisions on their own and develop confidence to take charge of SHG activities independently.
TCSRD has played a significant role in improving the lives of the rural poor through its livelihood developmentprogram. Skill building initiative through vocational training has helped them look beyond agriculture for gainfulemployment. The program covers employable trades such as welding, turning, fitting, computer hardware,housekeeping, masonry, carpentry, mobile repairing, household electrical work and beauty management. 3,500people have been trained through this program. Uday Foundation is one more initiative under this banner. Inpartnership with Tata Business Service Solutions, Uday Foundation- a rural BPO has been set up to bridge the gapbetween the rural and urban digital divide. It employs 135 educated youth. “Ohkai” a well known brand for handicraftand garments made by communities’ around Mithapur and Babrala has employed 317 rural women. It aims topromote rural handicraft produce and help brand and market the same.
TCSRD has been involved in various environment conservation activities, some of them in partnership withinstitutions of excellence. “Dharti Ko Arpan” program under the umbrella of sustainability aims at restoration andconservation of coastal ecosystems as also for the protection of some endangered species like the whale shark. Thecoral reef conservation, mangroves plantation, biodiversity reserve plantation project, eco clubs to create awarenessamong the community members about the importance of nature conservation are some of the initiatives undertaken

60
Seventy Third Annual Report 2011-12
Tata Chemicals Limited
CHEMICALS
under this program. 275 whale sharks have been saved and mangroves plantation has been done on 102 acres ofland so far. 3,535 community members including students from 25 schools have been made aware aboutenvironment conservation and its importance through various activities being held by the eco club.
Promotion of alternate source of energy is one of the thrust areas of TCSRD. 31 solar street lights were installed atpublic places. 85 solar lanterns were distributed in Babrala. Energy efficient chulhas (cook stoves) are being promotedacross locations. The community willingly accepted these chulhas. More than 200 chulhas have been installed atMithapur and Haldia. The biogas plant has also been constructed to generate energy by making proper use of cowdung. The gas is being used for cooking food. Around 8 of them have been constructed at the sites.
Education and health continues to be an integral part of the overall strategy. TCSRD has initiated host of healthcareinitiatives across its three locations. Mobile health clinic and a health clinic ensure that rural population has accessto efficient health management via competent clinical care and generic medicines. From time to time, it keepsorganising health awareness camps, eye camps and blood donation drives. In addition, HIV/AIDS awareness programshave been initiated to give the right information about the disease and ensure preventive care. The results havebeen encouraging.
Since education holds the key to progress, TCSRD has made concentrated efforts to improve the quality of education,both through formal as well as informal means. TCSRD spearheaded several education programs like scholarshipprogram to meritorious children, teachers training program, girl education program through SNDT university distancelearning course, formation of balwadi, promoting enrollment and book bank, tuitions for children and adult educationclasses for women. 186 students have been given scholarships and more than 1,300 women are being madeliterate through the adult education program.
Society empowers villages by providing proper infrastructure for schools, sanitation and water supply. By constructingbrick paved tracks, panchyat ghar, primary health centers, approach road, low cost houses, aanganwadi building,community cattle shed, TCSRD has contributed towards the overall development of the community. 2,273 householdshave been provided with safe drinking water by constructing the water pipeline system. Sanitation and personnelhygiene has been given equal importance. 921 individual household sanitation blocks have been constructed inselected villages of Mithapur and Babrala. These projects not only help in improving the standard of living but alsohelp TCSRD in establishing relationships with the rural communities for undertaking community developmentwork.
By building the capacities and creating awareness, TCSRD has been able to provide the right kind of guidance andfacilitation, villagers are not only willing but also capable of undertaking productive developmental work in theirvillages. This was most evident in villages covered under the integrated watershed Development Program wherethe farmers were willing to invest as much as ` 20,000 in pipelines, pump sets, etc. in order to draw water forirrigation from the dam to their fields.
The objective of social responsibility is equally well-entrenched in the minds of its employees who play an activepart in providing financial support and empowering rural communities to chart their own development. ThroughHarnessing Opportunities for People’s Empowerment (HOPE) program, employee volunteers of the Company cometogether and harness their resources, time or skill towards the social cause and make a difference in theircommunities. HOPE has a database of volunteers across the organisation hierarchy, from senior management tocontract employees. Family members of the employees of the Company also contribute their time, skill towardsprograms organised by TCSRD.
INTERNAL CONTROLS AND RISK MANAGEMENT
The Company believes that good internal control is an intrinsic part of the overall governance process and freedomof management should be exercised within a framework of appropriate checks and balances. The Company remainscommitted to ensuring an effective internal control environment that provides assurance on the efficacy ofoperations and security of assets. The Company has robust systems for internal audit, risk assessment and mitigationand has an independent Internal Audit Department with well established internal control and risk managementprocesses both at business and corporate level. The Chief Audit & Risk Officer reports directly to the Chairman ofthe Audit Committee of the Board of Directors, thereby ensuring total independence.

61
The Corporate Audit function plays a key role in providing to both the operating management and the AuditCommittee of the Board an objective view and reassurance of the overall control systems and effectiveness of therisk management process across the Company and its subsidiaries. Corporate Audit also assesses opportunities forimprovement in business processes, systems and controls and provides recommendations designed to add valueto the operations.
The scope and authority of the Corporate Audit Department is derived from the Audit Charter approved by theAudit Committee. Internal Audits are performed by an in-house team of multi-disciplinary professionals comprisingChartered Accountants, Engineers and Management graduates. Reviews are conducted on an ongoing basis, basedon a comprehensive risk-based audit plan, which is approved by the Audit Committee at the beginning of the year.The internal audit department which operates on a decentralised basis, continuously monitors the adequacy andeffectiveness of the internal control environment across the Company and the status of compliance with operatingsystems, internal policies and regulatory requirements. Besides, validation of IT security and Business ContinuityPlan receives focused attention from the internal audit team. The Audit Committee meets on a quarterly basis toreview and discuss the reports submitted by the Chief Audit & Risk Officer and also review closure of all agreedactions. The Audit Committee also meets the Statutory Auditors separately to ascertain their views on the adequacyand efficacy of internal control systems. A peer review of the Internal Audit function is done once in four years toassess quality effectiveness of internal audits with reference to standards and best practices. In keeping with this, apeer review was done in the first quarter of 2011 by a leading firm and the conclusions /recommendations wereshared with the Audit Committee. While the overall ratings were excellent, the Company will work towards furtherraising the bar.
The Company believes that every employee has a role to play in fostering an environment in which controls,assurance, accountability and ethical behavior are given high importance. To supplement the reviews carried outby the internal audit teams, the Company follows an elaborate system of Control Self Assurance (CSA) (self audit)which is carried out through the year. The CSA coverage includes all critical departments in the organisation andalso important third party operations like CFA’s and Salt Packing Centres. The IT enabled CSA process provides agood bottom-up approach and build up for the CEO/CFO certification as required by clause 49 of the listingagreement, besides helping in awareness creation of controls across a wide segment of TCL employees. Thiscomplements the internal audits in ensuring total universe coverage in a year. This year the Internal Audit teamwas honoured by the Institute of Internal Auditors (IIA) Western Region - ‘Productivity Award’ for continuouslyraising the bar in terms of efficiency and effectiveness.
Risk Management and Internal audit functions complement each other. Over the years, the Enterprise RiskManagement (ERM) process has evolved into a robust exercise entailing a balanced bottom up and top downapproach covering all units, functions and departments of the Company and its subsidiaries. The basic frameworkfollowed is the international standard AS/NZS 4360:1999.
The Company’s risk identification and assessment process is dynamic and hence it has been able to identify,monitor and mitigate the most relevant strategic and operational risks both during periods of accelerated growthand recessionary pressures. Identified risks are used as an input whilst developing the strategy and business plans.The Company strives to identify opportunities that enhance organisational values while managing or mitigatingrisks that can adversely impact its future performance.
The Risk Management framework of the Company encompasses the following activities:
Risk Identification: A periodic assessment across the Company and the subsidiaries together with a triggerbased assessment is undertaken to identify and thereafter prioritise significant risks. This assessment is basedon an online risk perception survey, environment scanning and inputs from key stakeholders.
Risk Measurement and control: Owners are identified for all identified risks and they go on to develop anddeploy mitigation strategies. Measurement indices are used to evaluate effectiveness of the mitigation plans.
Risk Reporting and Review: Besides detailed review by the Executive Committee, Enterprise Risks are reviewedquarterly by the Audit Committee of the Board. Risk owners present status updates on their mitigation planson rotation basis.

62
Seventy Third Annual Report 2011-12
Tata Chemicals Limited
CHEMICALS
The framework is benchmarked with ISO 31000 standards.
Some of the major risks and concerns identified are:
1. Financial Risks: The Company’s breadth in international operations, its foreign currency borrowings anddependency on imports for phosphatic fertilisers, continue to subject the Company to risks from changes inthe relative value of currencies. The elaborate Treasury Policy of the Company ensures that foreign exchangeexposures are within prescribed limits and the use of foreign exchange forward contracts is resorted tojudiciously. The Company has a separate Risk Management Committee which monitors and helps mitigate itscurrency and interest rate risks.
2. Input costs and securitisation of raw materials: The prices of raw materials for phosphatic fertilisers are subjectto economic conditions and global demand-supply balances. With the change in policy to Nutrient BasedSubsidy, it is imperative that imports are competitive. While the Company has entered into long term supplycontracts for its key raw materials, the pricing of these are normally formula based. The Company activelymonitors the environment for opportunities and maintains good supplier relationships to ensure minimalimpact from commodity price fluctuations. Acquisition of British Salt Limited through Tata Chemicals Europewas a key step in securitising brine supply for the future.
3. Energy: The securitisation of right energy sources at competitive rates is critical for energy intensive operations.The Company also gives paramount importance to sustainability considerations and hence the specific energyconsumptions are rigorously monitored and attempts are made to make the operations more and moreenergy efficient. Securing term contracts for competitive sources of energy is also on the radar.
4. People and Talent: Attracting and retaining talented employees is core to our success. The Company has overthe years embarked on several “people initiatives” to enhance the environment and help employees achievetheir personal and professional goals. Work life balance is consciously pursued. The Company’s performanceappraisal systems are well integrated with its business objectives and help bring out the best in individuals.Investments in employees through training are constantly made to ensure the Company equips its employeesfor challenges in their roles.
5. Safety and Environment related risks: The Company is conscious of its strong corporate reputation and thepositive role it can play by focusing on social and environmental issues. Towards this, the Company has setvery exacting standards in safety, ethics and environmental management. The Company continues to recognisethe importance of safety and environmental issues in its operations and have established comprehensiveindicators to track performance in these areas. The Company values the safety of its employees and constantlyraises the bar in ensuring a safe work place.
BUSINESS EXCELLENCE
The Company believes that continuous improvement in all aspects of business is important for retaining theculture of excellence and attaining superior business results. The Company has been on the journey of excellencefor several years and has adapted the TBEM (TATA Business Excellence Model) framework, which is mirrored on theMalcolm Balridge criteria. Besides continually raising the bar on performance, the Business excellence model helpsalign and integrate operations across the various businesses and geographies of the Company and its subsidiaries.
Cautionary Statement
Statements in this Management Discussion and Analysis describing the Company’s objectives, projections, estimates andexpectations may be ‘forward looking statements’ within the meaning of applicable laws and regulations. Actual resultsmight differ substantially or materially from those expressed or implied. Important developments that could affect theCompany’s operations include a downtrend in the agriculture, fabric wash and glass industry— global or domestic orboth, significant changes in political and economic environment in India or key markets abroad, tax laws, litigation,labour relations, exchange rate fluctuations, interest and other costs.

63
CORPORATE GOVERNANCE REPORT1. Company’s Philosophy on the Code of Governance
Introduction
Corporate Governance essentially is the system by which companies are directed and controlled by themanagement in the best interest of the stakeholders and others. Corporate Governance ensures fairness,transparency and integrity of the management. Corporate Governance is a way of life, rather than a mere legalcompulsion. It further inspires and strengthens investor’s confidence and commitment to the Company.
The corporate governance philosophy of the Company has been further strengthened with the adoption ofthe Tata Code of Conduct, Tata Business Excellence Model, Tata Code for Prevention of Insider Trading andCode of Corporate Disclosure Policies. The Company, through its Board and Committees, endeavours to strikeand deliver the highest governing standards for the benefit of its stakeholders.
In compliance with the disclosure requirements of Clause 49 of the Listing Agreement executed with thestock exchanges, the details are set out below:
2. Board of Directors
The Board comprised of 10 Directors as at 31st March, 2012. The Managing Director and the Executive Director& Chief Financial Officer are the Whole-time Directors of the Company. The remaining are Non- ExecutiveDirectors comprising of five Independent Directors and three Non-Independent Directors who possess therequisite qualifications and experience in general corporate management, finance, banking and other alliedfields which enable them to contribute effectively to the Company in their capacity as Directors of the Company.
Apart from reimbursement of expenses incurred in the discharge of their duties and the remuneration thatthese Directors would be entitled under the Companies Act, 1956 as Non-Executive Directors, none of theDirectors has any other material pecuniary relationships or transactions with the Company, its Promoters, itsDirectors, its Senior Management or its Subsidiaries and Associates. None of the Directors of the Company areinter-se related to each other.
The Directors and Senior Management of the Company have made disclosures to the Board confirming thatthere are no material, financial and / or commercial transactions between them and the Company whichcould have potential conflict of interest with the Company at large.
Composition
The Board has a combination of Executive and Non-Executive Directors and is in conformity with Clause 49 ofthe Listing Agreement entered into with the stock exchanges in which the Company’s Ordinary Shares arelisted. The composition of the Board as at 31st March, 2012 was as under:
Category of Directors Number of Directors Percentage to the Board
Executive (including Managing Director) 2 20%
Independent, Non-Executive 5 50%
Non-Independent, Non-Executive (Including Chairman) 3 30%
None of the Directors on the Board is a Member of more than 10 Committees and Chairman of more than 5Committees (as per Clause 49(I)(C)(ii)) across all the companies in which he is a Director. All the Directors havemade the requisite disclosures regarding Committee positions held by them in other companies.
Board Procedure
The annual calendar of Board Meetings is agreed upon at the beginning of the year.
The Agenda is circulated well in advance to the Board members. The items in the Agenda are backed bycomprehensive background information to enable the Board to take appropriate decisions. To enable theBoard to discharge its responsibilities effectively, the Managing Director apprises the Board at every meetingon the overall performance of the Company. The Managing Director’s Report is also circulated to the Board.The Board also, inter-alia, reviews the strategy, annual business plan and capital expenditure budgets, compliancereports for all laws applicable to the Company, review of major legal issues, minutes of the Board Meetings ofthe Company’s unlisted subsidiary companies, significant transactions and arrangements entered into by the

Seventy Third Annual Report 2011-12
Tata Chemicals Limited
CHEMICALS
64
unlisted subsidiary companies, adoption of quarterly / half-yearly / annual results, transactions pertaining topurchase / disposal of property, major accounting provisions and write-offs / write backs, corporate restructuring,Minutes of Meetings of the Audit and other Committees of the Board. In addition to the information requiredunder Annexure IA to Clause 49 of the Listing Agreement, the Board is also kept informed of major events /items and approvals are taken wherever necessary.
Meetings held
The Board met 8 (eight times) on the following dates during the financial year 2011-12.6th April, 2011 16th December, 201123rd May, 2011 12th January, 20128th August, 2011 10th February, 201211th November, 2011 27th March, 2012
The gap between two Meetings did not exceed four months.
The Seventy-Second Annual General Meeting (AGM) of the Company was held on 9th August, 2011.
Category and Attendance of Directors
The names and categories of the Directors on the Board, their attendance at the Board Meetings held duringthe financial year 2011-12 and at the last AGM, as also the number of Directorships and Committee positionsheld by them in other public limited companies as at 31st March, 2012 are as follows:
Name Category No. of Whether Number of No. of CommitteeBoard attended Directorships positions held
Meetings AGM in other public in other publicattended held on limited companies* limited companies*
during the 9th August,financial 2011 Chairman Board Chairman Committee
year of the Member of the Member2011-12 Board Committee
Mr. Ratan N. Tata Non-Independent, 5 Yes 9 1 - -(Chairman) Non-Executive
Mr. R. Gopalakrishnan Non-Independent, 7 Yes 5 5 - 2(Vice Chairman) Non-Executive
Mr. Nusli N. Wadia Independent, 7 No 4 3 - -Non-Executive
Mr. Prasad R. Menon Non-Independent, 7 No 2 6 - 3Non-Executive
Mr. Nasser Munjee Independent, 8 Yes 3 11 3 5Non-Executive
Dr. Yoginder K. Alagh Independent, 8 Yes - 3 - 4Non-Executive
Dr. M.S. Ananth Independent, 2 No - 2 - 2(ceased to be a Director Non-Executivew.e.f. 11th November,2011)
Mr. E.A. Kshirsagar Independent, 8 Yes - 6 5 3Non-Executive
Dr. Y.S.P. Thorat Independent, 7 Yes 1 6 3 -Non-Executive
Mr. R. Mukundan Managing Director 8 Yes - 4 - -
Mr. P. K. Ghose Executive Director 8 Yes - 3 2 1and CFO
* Note: Excludes Directorships in Private Limited Companies, Foreign companies, companies registered under Section25 of the Companies Act, 1956 and Government Bodies. Only Audit Committee and Shareholders’/ Investors’Grievance Committee have been considered for the committee positions.

65
Details of the Directors seeking appointment / re-appointment at the Annual General Meeting, pursuant toClause 49 of the Listing Agreement, have been given along with the Notice of Annual General Meeting.
Code of Conduct
The Company has adopted the Tata Code of Conduct for all the employees of the Company including theWhole-time Directors. The Board had also approved a Code of Conduct for Non-Executive Directors. The Codeof Conduct for the employees as well as Non-Executive Directors are posted on the Company’s website.Further, all the Board members and senior management personnel (as per Clause 49 of the Listing Agreement)have affirmed the compliance with the respective Code of Conduct. A declaration to this effect signed by theManaging Director (CEO) forms part of this report.
Shareholdings of Non-Executive Directors as at 31st March, 2012 are as under:
Name No. of Ordinary shares held % of Paid-up Capital
Mr. Ratan N. Tata (Chairman) 28,695 0.01%
Mr. R. Gopalakrishnan (Vice-Chairman) 15,000 0.01%
3. Audit Committee: The Committee comprises of Mr. Nasser Munjee, Mr. R. Gopalakrishnan, Dr. Yoginder K.Alagh and Mr. E. A. Kshirsagar. The Company Secretary is the Secretary to the Committee.
Mr. Nasser Munjee is an eminent Economist and leading banker. All members of the Committee have wideexposure and possess sound knowledge in the area of accounts, finance, audit, internal controls, etc. Thecomposition of the Committee is in conformity with Clause 49 (II) (A) of the Listing Agreement.
Mr. Nasser Munjee – Chairman of Audit Committee, Mr. R. Gopalakrishnan, Dr. Yoginder K. Alagh and Mr. E.A.Kshirsagar – Members of the Audit Committee were present at the last Annual General Meeting held on9th August, 2011.
Terms of Reference
The terms of reference of this Committee are very wide. The terms of reference of the Audit Committee are,inter-alia, as under:
1. Integrity of the Company’s financial statements together with any significant financial reportingjudgements contained in them and adherence to Accounting Standards.
2. Company’s financial reporting process.3. Company’s compliance with the legal and regulatory requirements and the Tata Code of Conduct (TCoC).4. External Auditors qualification and independence.5. Performance of the Company’s external auditors and the Internal Audit function.6. Adequacy of the Enterprise Risk Management Process.7. Adequacy and reliability of the internal control system.
Generally all items listed in Clause 49 II (D) of the Listing Agreement are covered in the terms of reference. TheAudit Committee has been granted powers as prescribed under Clause 49 II (C).
The Managing Director, Executive Director & CFO, External Auditors, Head - Internal Audit and Risk Managementand Controller attend and participate at all the meetings of the Committee. The Committee from time to timealso invites such of the executives, as it considers appropriate, to be present at the meetings.
During the year, the Committee reviewed key audit findings covering operational, financial and complianceareas and the risk mitigation plans were presented to the Committee. The Chairman of the Audit Committeebriefs the Board members about the significant discussions at Audit Committee meetings.
Meetings held:
During the financial year 2011-12, 7 (Seven) Audit Committee meetings were held on the following dates:
20th May, 2011 14th December, 20115th August, 2011 8th February, 201228th September, 2011 29th March, 20129th November, 2011

Seventy Third Annual Report 2011-12
Tata Chemicals Limited
CHEMICALS
66
Composition and Attendance:
Name of Director No. of meetings attended
Mr. Nasser Munjee - Chairman 7
Mr. R. Gopalakrishnan 5*
Dr. Yoginder K. Alagh 7
Mr. E. A. Kshirsagar 6
The gap between two Meetings did not exceed four months.
* In addition to attending five meetings, Mr. R. Gopalakrishnan attended one meeting throughvideoconference.
4. Remuneration Committee and Policy
The role of the Remuneration Committee is to review market practices and to decide on remuneration packagesapplicable to the Managing Director and the Executive Director & CFO and retirement benefits to be paid tothem under the Retirement Benefit Guidelines approved by the Board. During the course of its review, theCommittee also decides on the commission of the Directors and/or other incentives payable, taking intoaccount the individual’s performance as well as that of the Company.
The Remuneration Committee comprises of two Independent Directors (including the Chairman of theCommittee) and two Non-Executive Directors.
Meetings held:
During the financial year 2011-12, 1 (one) Remuneration Committee meeting was held on 23rd May, 2011.
Composition and Attendance:
Name of Director No. of meetings attended
Mr. Nusli N. Wadia - Chairman 1
Mr. Ratan N. Tata 1
Mr. R. Gopalakrishnan 1
Mr. Nasser Munjee 1
Remuneration Policy:
Managing Director and Executive Directors:
a. While deciding on the remuneration of the Managing / Executive Directors, the Board and theRemuneration Committee (“Committee”) considers the performance of the Company, the current trendsin the industry, their experience, past performance and other relevant factors. The Board / Committeeregularly keep track of the market trends in terms of compensation levels and practices in relevantindustries. This information is used to review remuneration policies.
The Company pays remuneration by way of salary, perquisites and allowances (fixed component), incentiveremuneration and/or commission (variable components) to its Managing/ Executive Directors. Annualincrements are decided by the Remuneration Committee within the salary scale approved by the Membersand are effective from April 1 every year.
Non-Executive Directors:
b. Non-Executive Directors are paid sitting fees of ` 20,000 for every Meeting of the Board or the Committeeattended (except for Shareholders’ / Investors’ Grievance Committee, Ethics and Compliance Committeeand Nomination Committee where the sitting fee is ` 5,000 per meeting)
c. The remuneration by way of commission to the Non-Executive Directors is decided by the Board ofDirectors and distributed to them based on their participation and contribution at the Board / Committee

67
meetings and the time spent on matters other than at meetings. In terms of the approval of the membersat the 69th Annual General Meeting of the Company held on 4th August, 2008, commission is paid at arate not exceeding one per cent of the net profits of the Company calculated in accordance with theprovisions of Sections 198, 349 and 350 of the Companies Act, 1956.
Retirement Policy for Directors:
a. The Company has adopted the guidelines for retirement age wherein the Managing and the ExecutiveDirectors retire at the age of 65 years. The Company has also adopted the retirement policy for theManaging and Executive Directors which has also been approved by the Members of the Company,offering special retirement benefits including pension, ex gratia, medical and other benefits. In additionto the above, the retiring Managing Director is entitled to residential accommodation or compensation inlieu of accommodation on retirement. The quantum and payment of the said benefits are subject to aneligibility criteria of the retiring Director and is payable at the discretion of the Board in each individual case.
b. Further, as per the above guidelines, all Non-Executive Directors retire at the age of 75 years.
Details of remuneration paid to the Managing Director and the Executive Directors during the financialyear 2011-12.
Director Salary Perquisites and CommissionAllowance # (for the financial
year 2010-11)paid in 2011-12
(`) (`) (`)
Mr. R. Mukundan – Managing Director 54,00,000 79,91,110 1,65,00,000
Mr. P.K. Ghose – Executive Director & CFO 40,80,000 44,35,067 1,10,00,000
Mr. Kapil Mehan – Former Executive Director(resigned w.e.f. 31st August , 2010) - - 75,00,000
Non-Executive Directors:
Director Sitting Fees Commission(for the financial
year 2010-11)paid in 2011-12
(`)
Mr. Ratan N. Tata 1,60,000 48,50,000
Mr. R. Gopalakrishnan 3,00,000 49,00,000
Mr. Nusli N. Wadia 1,80,000 5,80,000
Mr. Prasad R. Menon 1,80,000 22,40,000
Mr. Nasser Munjee 3,20,000 37,80,000
Dr. Yoginder K. Alagh 3,60,000 39,80,000
Dr. M. S. Ananth(Ceased to be a Director w.e.f. 11th November, 2011) 40,000 4,20,000
Mr. E.A. Kshirsagar 2,80,000 34,00,000
Dr. Y.S.P. Thorat 1,40,000 8,50,000
Commission payable to the Directors for the financial year 2011-12Non Executive Directors : ` 250 lacsMr. R. Mukundan : ` 200 lacsMr. P.K. Ghose : ` 135 lacs

Seventy Third Annual Report 2011-12
Tata Chemicals Limited
CHEMICALS
68
Service Contracts, Severance Fees and Notice Period
Terms of Agreement Mr. R. Mukundan Mr. P. K. Ghose
Period of Contract 5 years upto 25th November, 2013 5 years upto 25th November, 2013
Severance fees / The Contract may be terminated by The Contract may be terminatednotice period either party giving the other party Six by either party giving the other
months’ notice or the Company party Six months’ notice or thepaying six months’ salary in lieu Company paying six months’thereof. There is no separate provision salary in lieu thereof. There is nofor payment of Severance fees. separate provision for payment of
Severance fees.
5. Shareholders’ / Investors’ Grievance Committee
During the financial year 2011-12, 3 (three) meetings were held on 13th July, 2011, 9th November, 2011 and8th February, 2012.
Composition and Attendance:
Name of Director No. of meetings attended
Dr. Yoginder K. Alagh - Chairman 3
Mr. R. Mukundan 3
Terms of Reference:
· To look into redressal of investors’ complaints and requests such as transfer of shares/debentures, non-receipt of dividend, annual report, etc.
Based on the report received from the Company’s Registrars, the number of Complaints received fromshareholders comprises of correspondence identified as complaints i.e. letter received through statutory /regulatory bodies and letter pertaining to fraudulent encashment.
Status of Investor Complaints as at 31st March, 2012 and reported under Clause 41 of the Listing Agreementare as under:
Complaints as at 1st April, 2011 : 0
Received during the year : 24
Resolved during the year : 22
Pending as at 31st March, 2012 : 2
Name, Designation and address of Compliance Officer
Mr. Rajiv ChandanGeneral Counsel & Company SecretaryTata Chemicals LimitedBombay House, 24 Homi Mody StreetFort, Mumbai 400 [email protected]
On the recommendations of the Committee, the Company has taken various investor friendly initiatives likesending reminders to investors who have not claimed their dividends, sending reminders to encouragedematerialisation of shares, etc.

69
6. Executive Committee of the Board
Terms of Reference:To periodically review the ongoing capital expenditure and the investments made by the Company.To examine new proposals for investments from the stand point of their business and financial impact.To formulate the future strategic direction and business development of the Company.
In addition to the above terms of reference for this Committee, the Committee is expected to review thefollowing items before they are presented to the Board:
The Business and Strategy of the Company.
Long term financial projections and cash flows.
Capital and Revenue Budgets and Capital Expenditure programmes.
Acquisitions, divestments and business restructuring proposals.
Senior management succession planning.
Any other item as may be decided by the Board.
Meetings held:
During the financial year 2011-12, 2 (Two) Executive Committee of the Board meetings were held on 13th July,2011 and 16th March, 2012.
Composition and Attendance:
Name of Director No. of meetings attended
Mr. Ratan N. Tata - Chairman 2
Mr. R. Gopalakrishnan 2
Mr. Nusli N. Wadia 1
Mr. Prasad R. Menon 2
Dr. Yoginder K. Alagh 2
Mr. R. Mukundan 2
Mr. P.K. Ghose 2
7. Nomination Committee
The Committee (Non-mandatory) was constituted on 27th May, 2008. The Nomination Committee comprisesof Dr. Yoginder K. Alagh (Chairman), Mr. Ratan N. Tata and Mr. R. Gopalakrishnan as Members.
Terms of Reference:
To make recommendations to the Board regarding the composition of the Board.
To identify Independent Directors to be inducted to the Board from time to time.
To take steps to refresh the composition of the Board from time to time.
8. Ethics and Compliance Committee
This Committee (Non-mandatory) was constituted on 29th October, 2009.
Terms of Reference:
To set forth policies relating to and oversee the implementation of the Insider Code.
To take on record status reports prepared by the Compliance Officer detailing the dealings in Securitiesby the Specified Persons and their dependants on a monthly basis.
To decide penal action in respect of violation of the Regulations / the Code by any Specified Person.

Seventy Third Annual Report 2011-12
Tata Chemicals Limited
CHEMICALS
70
Meetings held:
During the financial year 2011-12, 1 (one) Ethics and Compliance Committee meeting was held on8th February, 2012.
Composition and Attendance:
Name of Director No. of meetings attended
Dr. Yoginder K. Alagh - Chairman 1
Mr. R. Mukundan 1
Tata Code for Prevention of Insider Trading Practices
The Company has instituted a comprehensive Code of Conduct for Prevention of Insider Trading for itsdesignated employees, in compliance with Securities and Exchange Board of India (Prohibition of InsiderTrading) Regulations, 1992, as amended from time to time. The Code lays down Guidelines, which advisesthem on procedures to be followed and disclosures to be made, while dealing with the shares of the Company,and cautioning them of the consequences of violations.
9. Safety Health Environment and Sustainability Committee
The Safety Health Environment and Sustainability (SHES) Committee of the Board (Non-mandatory) wasconstituted on 27th March, 2012 to oversee the policies and their implementation across Tata Chemicalsgroup. The main purpose of the Committee would be, inter alia, to :
Review and monitor the sustainability, environmental, safety and health policies and activities across theTata Chemicals group;
Provide guidance to management to ensure that all long term strategic proposals made to the Boardinclude SHES implications;
Investigate or cause to be investigated, any extraordinary negative sustainability, environment, healthand safety performance or issues of asset integrity which can impact safety, health, environment andsustainability where appropriate.
The Committee comprises of Mr. Prasad R. Menon (Chairman), Mr. Nasser Munjee, Dr. Y.S.P. Thorat and Mr. R.Mukundan as Members.
The Company Secretary acts as the Secretary of the Safety Health Environment and Sustainability Committee.The Managing Directors of the overseas operating companies shall be permanent invitees to the meetings ofthe Committee.
10. Risk Management
The Company has a well-defined risk management framework in place. The risk management frameworkadopted by the Company is discussed in detail in the Management Discussion and Analysis Chapter of thisAnnual Report. The Company has established procedures to periodically place before the Audit Committeeand the Board, the risk assessment and minimisation procedures being followed by the Company and stepstaken by it to mitigate these risks.
11. Subsidiary Companies
Clause 49 defines a “material non-listed Indian subsidiary” as an unlisted subsidiary, incorporated in India,whose turnover or net worth (i.e. paid-up capital and free reserves) exceeds 20% of the consolidated turnoveror net worth respectively, of the listed holding company and its subsidiaries in the immediately precedingaccounting year.
Under this definition, the Company did not have any “material non-listed Indian subsidiary” during the yearunder review. The Subsidiaries of the Company function independently, with an adequately empowered Boardof Directors and sufficient resources. For more effective governance, the Minutes of the Board Meetings of theSubsidiaries of the Company are placed before the Board of the Company for its review.

71
12. Details on General Body Meetings:
Location, date and time of General Meetings held during the last 3 years:
Annual General Meeting (AGM):
Year Location Date Day Time
2008-09 Birla Matushri Sabhagar, 19, 30th July, 2009 Thursday 3.00 p.m.Sir Vithaldas Thackersey Marg,Mumbai 400 020
2009-10 Birla Matushri Sabhagar, 19, 9th August, 2010 Monday 3.00 p.m.Sir Vithaldas Thackersey Marg,Mumbai 400 020
2010-11 Birla Matushri Sabhagar, 19, 9th August, 2011 Tuesday 3.00 p.m.Sir Vithaldas Thackersey Marg,Mumbai 400 020
Special resolutions passed at the last 3 AGMs:
1. At the AGM held on 30th July, 2009 – A Special Resolution was passed for approving the amendment toCommon Seal provision in the Articles of Association of the Company.
2. Postal Ballot:
During the year under review, no resolution was put through by Postal Ballot.
13. Disclosures
Accounting Treatment in preparation of Financial Statements
The Company has followed the Accounting Standards laid down by The Companies (Accounting Standards)Rules, 2006 in preparation of its financial statements.
Related Party Transactions
During the financial year 2011-12, there were no materially significant transactions entered into between theCompany and its promoters, directors or the management, subsidiaries or relatives, etc. that may have potentialconflict with the interests of the Company at large. Declarations have been received from the seniormanagement personnel to this effect.
Statutory Compliance, Penalties and Strictures
The Company has complied with the requirements of the Stock Exchanges / SEBI and Statutory Authority onall matters related to capital markets during the last three years. No penalties or strictures have been imposedon the Company by these authorities.
CEO/CFO Certification
The Managing Director (CEO) and the Executive Director & Chief Financial Officer (CFO) have certified to theBoard in accordance with Clause 49(V) of the Listing Agreement pertaining to CEO / CFO certification for thefinancial year ended 31st March, 2012.
Whistle Blower Policy
The Company has adopted a Whistle Blower policy to provide a formal mechanism to the employees to reporttheir concerns about unethical behaviour, actual or suspected fraud or violation of the Company’s Conduct orEthics policy. The policy provides for adequate safeguards against victimisation of employees who avail of themechanism and also provides for direct access to the Chairman of the Audit Committee. It is affirmed that nopersonnel of the Company has been denied access to the Audit Committee.

Seventy Third Annual Report 2011-12
Tata Chemicals Limited
CHEMICALS
72
Non-Mandatory Requirements:
The Company has complied with all the mandatory requirements of Clause 49 of the Listing Agreementrelating to Corporate Governance.
The status of compliance with Non-mandatory requirement is as under:
Chairman of the Board – Being the Group Chairman, the Company does not reimburse expenses incurredby the Non-Executive Chairman for maintenance of a separate Chairman’s office.
The Company has adopted the guidelines for the composition of the Board of Directors, which providefor the tenure and retirement age for the Non-Executive Directors.
The Company has setup a Remuneration Committee pursuant to Clause 49 of the Listing Agreement. Thebroad terms of reference of the Committee are to appraise the performance of the Managing / ExecutiveDirectors, determine and recommend to the Board, compensation payable to the Managing / ExecutiveDirectors.
The Company has also set up an Executive Committee of the Board, Nomination Committee, Ethics andCompliance Committee and Safety Health Environment and Sustainability Committee. The details ofthese Committees are given above.
During the year under review, there is no audit qualification in the Company’s financial statements. TheCompany continues to adopt best practices to ensure regime of unqualified financial statements.
The Company has adopted a Whistle Blower policy as mentioned above.
14. Means of Communication:
The quarterly results were published on the next day of the meeting for that quarter i.e. for quarter andyear ended 31st March, 2011 the results were published on 24th May, 2011, for first quarter ended30th June, 2011 the results were published on 9th August, 2011, for second quarter ended 30th September,2011 the results were published on 12th November, 2011 and for the third quarter ended 31st December,2011 the results were published on 11th February, 2012.
The quarterly results are published in the following newspapers.
Indian Express (English)
Business Standard (English)
Business Line (English)
Loksatta (Marathi)
Free Press Journal (English)
The financial results are displayed on www.tatachemicals.com.
Management Discussion and Analysis forms part of the Annual Report.
The official news releases, presentation made to the Shareholders at the Annual General Meeting and thepresentation made to analysts are posted on the Company’s website under “investor relations”.
Company’s Corporate Website –
The Company’s website is a comprehensive reference on Tata Chemicals’ management, vision, mission, policies,corporate governance, corporate sustainability, investor relations, updates and news. The section on ‘Investors’serves to inform the shareholders, by giving complete financial details, shareholding patterns, corporate benefits,information relating to stock exchanges, registrars, share transfer agents, etc. The section on ‘Media’ includesall major press reports and releases, awards, campaigns, etc.

73
15. General Shareholder Information
The Company is registered with the Registrar of Companies, Maharashtra, Mumbai. The Corporate IdentityNumber (CIN) allotted to the Company by the Ministry of Corporate Affairs (MCA) is L24239MH1939PLC002893.
Annual General Meeting
Date and Time : 22nd August, 2012 at 3.00 p.m.
Venue : Birla Matushri Sabhagar, 19 Sir Vithaldas Thackersey Marg,Mumbai - 400 020.
Financial year : April to March
Book Closure Date : 10th August, 2012 to 22nd August, 2012 (both days inclusive for the purposeof AGM and Dividend)
Dividend payment date : Between 23rd August, 2012 and 27th August, 2012
Listing on Stock Exchanges : The Company’s Ordinary Shares are listed on the following Stock Exchanges:
(1) The Bombay Stock Exchange Limited (BSE),Phiroze Jeejeebhoy Towers, Dalal Street, Mumbai 400 001.
(2) The National Stock Exchange of India Limited (NSE)Exchange Plaza, Bandra-Kurla Complex, Bandra (E),Mumbai 400 051.
The Company has paid the Annual Listing fees for the financial year 2011-12.
Stock Code:
BSE (Physical Segment) TATACHM770BSE (Demat Segment) 500770NSE TATACHEM EQInternational Securities Identification Number (ISIN) INE092A01019
Market Price Data:
Market price data - monthly high/low of the closing price and trading volumes on BSE/NSE depicting liquidityof the Company’s Ordinary Shares on the said exchanges is given hereunder.
BSE NSE(in `) (in `)
High Low High Low
Apr-2011 392.00 339.00 394.00 340.35
May-2011 382.00 343.50 385.00 343.45
Jun-2011 384.25 345.20 385.75 345.05
Jul-2011 389.60 303.00 389.70 353.05
Aug-2011 366.75 328.25 367.07 328.00
Sep-2011 342.60 312.60 342.30 313.00
Oct-2011 340.55 287.80 341.00 287.00
Nov-2011 357.50 320.00 359.90 318.40
Dec-2011 359.90 302.85 360.35 301.50
Jan-2012 342.60 295.00 344.70 307.35
Feb-2012 374.50 336.25 374.70 333.95
Mar-2012 366.40 335.55 367.00 335.10

Seventy Third Annual Report 2011-12
Tata Chemicals Limited
CHEMICALS
74
Graphical Representation of Performance of Tata Chemicals Limited’s Share Price in comparison with BSESensex.
Registrar and Transfer Agents:-
Members are requested to correspond with the Company’s Registrar & Transfer Agents - TSR Darashaw Limited(formerly Tata Share Registry Limited) quoting their folio no. / DP ID and Client ID at the following addresses :-
(i) For transfer lodgement, delivery and correspondence:
TSR Darashaw Limited Tel: 022-6656 8484Unit: Tata Chemicals Limited Fax: 022- 6656 84946-10 Haji Moosa Patrawala Industrial Estate e-mail : [email protected] Dr. E Moses Road, Near Famous Studio website : www.tsrdarashaw.comMahalaxmi Mumbai – 400 011.
(ii) For the convenience of investors based in the following cities, transfer documents and letters will also beaccepted at the following branches/agencies of TSR Darashaw Limited:-
1 TSR Darashaw Limited 2 TSR Darashaw Limited503, Barton Centre, 5th Floor Bungalow No.1, “E” Road84, Mahatma Gandhi Road Northern Town, BistupurBangalore - 560 001 Jamshedpur – 831 001Tel : 080– 25320321 Tel: 0657 – 2426616Fax : 080-25580019 Fax: 0657 – 2426937E-mail : [email protected] E-mail : [email protected]
3 TSR Darashaw Limited 4 TSR Darashaw LimitedTata Centre, 1st Floor Plot No.2/42, Sant Vihar43, Jawaharlal Nehru Road Ansari Road, DaryaganjKolkata – 700 071 New Delhi – 110 002Tel : 033 – 22883087 Tel : 011 – 23271805Fax : 033 – 22883062 Fax : 011 – 23271802E-mail : [email protected] E-mail : [email protected]
0
5000
10000
15000
20000
25000
Mar
-12
Feb
-12
Jan
-12
Dec
-11
Nov
-11
Oct
-11
Sep
-11
Au
g-1
1
Jul-
11
Jun
-11
May
-11
Ap
r-11
0
100
200
300
400
Share Price Sensex
BSE
Sens
ex
TCL
Shar
e Pr
ice

75
5 TSR Darashaw LimitedShah Consultancy Services Limited3, Sumathinath Complex, Pritam NagarAkhada Road, Ellis BridgeAhmedabad-380 006Telefax: 079–2657 6038E-mail: [email protected]
Share Transfer Process:
Share in physical forms are processed by the Registrar and Share Transfer Agent within 15-20 days from the date ofreceipt, if the documents are complete in all respects. The Managing Director, Executive Director & Chief FinancialOfficer, General Counsel & Company Secretary, Deputy General Manager-Secretarial & Legal and Sr. Manager-Secretarial have been severally empowered to approve transfers.
Distribution of Shareholding as at 31st March, 2012
Sr.No. Range of No. of Amount % to No. of % toHolding Shares (`) Capital Shareholders Shareholders
1 1 to 500 2,03,17,472 20,31,74,720 7.98 1,80,571 89.58
2 501 to 1000 84,45,029 8,44,50,290 3.31 11,334 5.62
3 1001 to 2000 78,91,163 7,89,11,630 3.10 5,505 2.73
4 2001 to 3000 42,54,517 4,25,45,170 1.67 1,710 0.85
5 3001 to 4000 26,24,844 2,62,48,440 1.03 742 0.37
6 4001 to 5000 20,62,855 2,06,28,550 0.81 451 0.22
7 5001 to 10000 52,00,188 5,20,01,880 2.04 744 0.37
8 Above10000 20,39,60,210 2,03,96,02,100 80.06 521 0.26
TOTAL 25,47,56,278 254,75,62,780 100.00 2,01,578 100.00
Category of shareholding as at 31st March, 2012
Category No. of Shares Percentage
Tata Companies & Trusts 7,91,25,857 31.06
Resident Individuals 5,22,63,594 20.52
Foreign Holdings 3,70,54,040 14.54
Public Financial Institutions 5,63,31,583 22.11
Government / Government Companies 74,598 0.03
Other Companies, Mutual Funds 2,94,03,628 11.54
Nationalised Banks 5,02,978 0.20
Total 254,756,278 100.00
Dematerialization of shares and liquidity:
Percentage of Shares held in
Physical form : 3.74
Electronic form with National Securities Depository Limited : 92.79
Electronic form with Central Depository Services (India) Limited : 3.47
The Company’s Ordinary shares are regularly traded on BSE and on NSE.

Seventy Third Annual Report 2011-12
Tata Chemicals Limited
CHEMICALS
76
AUDITORS’CERTIFICATETO THE MEMBERS OFTATA CHEMICALS LIMITED
We have examined the compliance of conditions of Corporate Governance by TATA CHEMICALS LIMITED (“theCompany”), for the year ended 31st March, 2012, as stipulated in Clause 49 of the Listing Agreements of theCompany with the stock exchanges.
The compliance of conditions of Corporate Governance is the responsibility of the Management. Our examinationwas limited to a review of the procedures and implementation thereof adopted by the Company for ensuringcompliance with the conditions of Corporate Governance. It is neither an audit nor an expression of opinion on thefinancial statements of the Company.
In our opinion and to the best of our information and according to the explanations given to us, we certify that theCompany has complied with the conditions of Corporate Governance as stipulated in Clause 49 of the ListingAgreements.
We further state that such compliance is neither an assurance as to the future viability of the Company nor of theefficiency or effectiveness with which the Management has conducted the affairs of the Company.
For DELOITTE HASKINS & SELLSChartered Accountants
(Registration No.117366W)
B. P. Shroff(Partner)
(Membership No. 34382)MUMBAI, 30th May, 2012
Plant Locations:Indian Locations:Chemicals Division : Mithapur 361 345,
Okhamandal, GujaratFertiliser Division : Indira Dham, P. O. Box No. 1
Babrala 202 521, Dist. Badaun, Uttar PradeshHaldia Works : P. O. Durgachak, Haldia, Dist. East Midnapore
West Bengal - 721 602Overseas Locations:USA – Chemical Soda Ash : Tata Chemicals North America Inc.
Green River Basin, WyomingUK – Chemicals : Tata Chemicals Europe Limited
Northwich West (Winnington) andNorthwich East (Lostock)
Kenya – Chemicals : Tata Chemicals Magadi LimitedLake Magadi, Kenya
UK - Salt : British Salt LimitedMiddlewich Cheshire
Address for correspondence : Tata Chemicals LimitedBombay House, 24, Homi Mody StreetFort, Mumbai 400 001.
DECLARATIONI R. Mukundan, Managing Director of Tata Chemicals Limited, hereby declare that all the members of the Board ofDirectors and the Senior Management personnel have affirmed compliance with the Code of Conduct, applicableto them as laid down by the Board of Directors in terms of Clause 49(1)(D)(ii) of the Listing Agreement entered intowith the Stock Exchanges for the year ended 31st March, 2012.
For Tata Chemicals Limited
R. MukundanMumbai, 30th May, 2012 Managing Director

77
AUDITORS’ REPORT
TO THE MEMBERS OFTATA CHEMICALS LIMITED
1. We have audited the attached Balance Sheet of TATA CHEMICALS LIMITED (“the Company”) as at 31st March,2012, the Statement of Profit and Loss and the Cash Flow Statement of the Company for the year ended onthat date, both annexed thereto. These financial statements are the responsibility of the Company’sManagement. Our responsibility is to express an opinion on these financial statements based on our audit.
2. We conducted our audit in accordance with the auditing standards generally accepted in India. Those Standardsrequire that we plan and perform the audit to obtain reasonable assurance about whether the financialstatements are free of material misstatements. An audit includes examining, on a test basis, evidence supportingthe amounts and the disclosures in the financial statements. An audit also includes assessing the accountingprinciples used and the significant estimates made by the Management, as well as evaluating the overallfinancial statement presentation. We believe that our audit provides a reasonable basis for our opinion.
3. As required by the Companies (Auditor’s Report) Order, 2003 (CARO) issued by the Central Government interms of Section 227(4A) of the Companies Act, 1956, we enclose in the Annexure a statement on the mattersspecified in paragraphs 4 and 5 of the said Order.
4. Further to our comments in the Annexure referred to in paragraph 3 above, we report that:
(a) we have obtained all the information and explanations which to the best of our knowledge and beliefwere necessary for the purposes of our audit;
(b) in our opinion, proper books of account as required by law have been kept by the Company so far as itappears from our examination of those books;
(c) the Balance Sheet, the Statement of Profit and Loss and the Cash Flow Statement dealt with by this reportare in agreement with the books of account;
(d) in our opinion, the Balance Sheet, the Statement of Profit and Loss and the Cash Flow Statement dealtwith by this report are in compliance with the Accounting Standards referred to in Section 211(3C) of theCompanies Act, 1956;
(e) in our opinion and to the best of our information and according to the explanations given to us, the saidaccounts give the information required by the Companies Act, 1956 in the manner so required and give atrue and fair view in conformity with the accounting principles generally accepted in India:
(i) in the case of the Balance Sheet, of the state of affairs of the Company as at 31st March, 2012;
(ii) in the case of the Statement of Profit and Loss, of the profit of the Company for the year ended onthat date and
(iii) in the case of the Cash Flow Statement, of the cash flows of the Company for the year ended on thatdate.
5. On the basis of the written representations received from the Directors as on 31st March, 2012 taken on recordby the Board of Directors, none of the Directors is disqualified as on 31st March, 2012 from being appointed asa director in terms of Section 274 (1) (g) of the Companies Act, 1956.
For DELOITTE HASKINS & SELLS
Chartered Accountants
(Registration No.117366W)
B. P. Shroff
(Partner)
(Membership No. 34382)MUMBAI, 30th May, 2012

78
Seventy Third Annual Report 2011-12
Tata Chemicals Limited
CHEMICALS
ANNEXURE TO THE AUDITORS’ REPORT
(Referred to in paragraph 3 of our report of even date)
(i) Having regard to the nature of the Company’s business/activities/result/transactions, etc., clauses (x), (xiii),(xiv), (xviii) and (xix) of paragraph 4 of CARO are not applicable.
(ii) In respect of its fixed assets:
(a) The Company has maintained proper records showing full particulars, including quantitative details andsituation of fixed assets.
(b) The fixed assets were physically verified during the year by the Management in accordance with a regularprogramme of verification which, in our opinion, provides for physical verification of all the fixed assets atreasonable intervals. According to the information and explanations given to us, no material discrepancieswere noticed on such verification.
(c) The fixed assets disposed off during the year, in our opinion, do not constitute a substantial part of thefixed assets of the Company and such disposal has, in our opinion, not affected the going concern statusof the Company.
(iii) In respect of its inventory:
(a) As explained to us, the inventories were physically verified during the year by the Management atreasonable intervals.
(b) In our opinion and according to the information and explanations given to us, the procedures of physicalverification of inventories followed by the Management were reasonable and adequate in relation to thesize of the Company and the nature of its business.
(c) In our opinion and according to the information and explanations given to us, the Company has maintainedproper records of its inventories and no material discrepancies were noticed on physical verification.
(iv) The Company has neither granted nor taken any loan, secured or unsecured, to/from companies, firms orother parties listed in the Register maintained under Section 301 of the Companies Act, 1956.
(v) In our opinion and according to the information and explanations given to us, having regard to the explanationsthat some of the items purchased are of special nature and suitable alternative sources are not readily availablefor obtaining comparable quotations, there is an adequate internal control system commensurate with thesize of the Company and the nature of its business with regard to purchases of inventory and fixed assets andthe sale of goods and services. During the course of our audit, we have not observed any major weakness insuch internal control system.
(vi) To the best of our knowledge and belief and according to the information and explanations given to us, therewere no contracts or arrangements the particulars of which needed to be entered into the register maintainedunder Section 301 of the Companies Act, 1956.
(vii) According to the information and explanations given to us, there are no deposits from the public in terms ofSections 58A and 58AA or any relevant provision of the Companies Act, 1956.
(viii) In our opinion, the Company has an adequate internal audit system commensurate with the size and thenature of its business.
(ix) We have broadly reviewed the cost records maintained by the Company pursuant to the Companies (CostAccounting Records) Rules, 2011 or other relevant rules prescribed by the Central Government under Section209(1)(d) of the Companies Act, 1956 and are of the opinion that prima facie the prescribed cost records havebeen maintained. We have, however, not made a detailed examination of the cost records with a view todetermine whether they are accurate or complete.
(x) According to the information and explanations given to us in respect of statutory dues:
(a) The Company has generally been regular in depositing undisputed dues, including Provident Fund, InvestorEducation and Protection Fund, Employees’ State Insurance, Income-tax, Sales Tax, Wealth Tax, Service Tax,Custom Duty, Excise Duty, Cess and other material statutory dues applicable to it with the appropriateauthorities.

79
(b) There were no undisputed amounts payable in respect of Income-tax, Wealth Tax, Custom Duty, ExciseDuty, Cess and other material statutory dues in arrears as at 31st March, 2012 for a period of more than sixmonths from the date they became payable.
(c) Details of dues of Income-tax, Sales Tax, Wealth Tax, Service Tax, Custom Duty, Excise Duty and Cess whichhave not been deposited as on 31st March, 2012 on account of disputes are given below:
Statute Nature of Dues Forum where Period to which Amountdispute is the amount involvedpending relates (` in crores)
Central Sales Sales Tax High Court 1997-2001 7.48Tax Act,1956 and (Central and State) Tribunal 1991-92, 1999-2000,Sales Tax Act of and Value Added 2002-03,2004-05various states Tax and 2007-08 1.00
Appellate 1991-92, 1993-99 9.73authority upto and 2002-09Commissioner’slevel
Customs Act, 1962 Custom Duty Appellate authority 1987-88, 1992-93 0.19upto Commissioner’s and 2001-02level
Central Excise Excise Duty Supreme Court 1974-1980 and 0.31Act, 1944 1981-85
Tribunal 1985-88, 1996-97and 2005-07 0.96
Appellate authority 1994-2000 and 2.75upto Commissioner’s 2004-09level
Income Tax Act, 1961 Income Tax Appellate authority 2003-04 and 2002-03 22.99upto Commissioner’slevel
Total 45.41
(xi) In our opinion and according to the information and explanations given to us, the Company has not defaultedin the repayment of dues to banks, financial institutions and debenture holders.
(xii) In our opinion, the Company has not granted loans and advances on the basis of security by way of pledge ofshares, debentures and other securities.
(xiii) In our opinion and according to the information and explanations given to us, the terms and conditions of theguarantees given by the Company for loans taken by others from banks and financial institutions are notprima facie prejudicial to the interests of the Company.
(xiv) In our opinion and according to the information and explanations given to us, the term loans have beenapplied for the purposes for which they were obtained.
(xv) In our opinion and according to the information and explanations given to us and on an overall examinationof the Balance Sheet, we report that funds raised on short-term basis have not been used during the year forlong- term investment.
(xvi) The Company has not raised any money by way of a public issue during the year.(xvii) To the best of our knowledge and according to the information and explanations given to us, no fraud by or
on the Company has been noticed or reported during the year.
For DELOITTE HASKINS & SELLSChartered Accountants
(Registration No.117366W)B. P. Shroff
(Partner)(Membership No. 34382)
MUMBAI, 30th May, 2012

80
Seventy Third Annual Report 2011-12
Tata Chemicals Limited
CHEMICALS
Balance Sheet as at 31st March, 2012As at
31-Mar-11Note ` in crores ` in crores ` in crores
I. EQUITY AND LIABILITIES1. Shareholders’ Funds
(a) Share Capital ............................................. 3 254.82 254.82(b) Reserves and Surplus ............................ 4 4,762.41 4,485.86
5,017.23 4,740.682. Non-Current Liabilities
(a) Long-Term Borrowings ......................... 5 2,202.57 2,586.45(b) Deferred Tax Liabilities (net) ............... 6 88.67 159.71(c) Other Long Term Liabilities ................ 7 57.48 21.77(d) Long-Term Provisions ............................ 8 92.86 95.11
2,441.58 2,863.043. Current Liabilities
(a) Short-Term Borrowings ......................... 9 256.86 122.74(b) Trade Payables .......................................... 10 1,727.21 988.04(c) Other Current Liabilities ....................... 11 1,107.48 474.66(d) Short-Term Provisions ........................... 12 324.23 306.38
3,415.78 1,891.82
TOTAL 10,874.59 9,495.54
II. ASSETS1. Non-Current Assets
(a) Fixed Assets(i) Tangible Assets ............................... 13 1,810.03 1,587.58(ii) Capital Work-in-Progress ............ 13 265.38 299.53
(b) Non-Current Investments .................... 14 4,613.62 4,901.44(c) Long-Term Loans and
Advances ..................................................... 15 169.75 189.23(d) Other Non-Current Assets ................... 16 35.65 16.77
6,894.43 6,994.552. Current Assets
(a) Current Investments ............................... 17 0.25 0.25(b) Inventories .................................................. 18 1,253.22 696.30(c) Trade Receivables .................................... 19 1,485.83 724.48(d) Cash and Cash Equivalents ................. 20 891.85 798.76(e) Short-Term Loans and
Advances ..................................................... 21 253.88 218.59(f ) Other Current Assets ............................. 22 95.13 62.61
3,980.16 2,500.99
TOTAL 10,874.59 9,495.54
Notes forming part of Financial Statements 1 - 28
In terms of our report attached For and on behalf of the Board
For DELOITTE HASKINS & SELLS Ratan N. Tata ChairmanChartered Accountants R. Gopalakrishnan Vice-Chairman
Nusli N. WadiaPrasad R. Menon
B. P. Shroff Nasser MunjeePartner Dr. Yoginder Alagh Directors
Dr. Y. S. P. ThoratEknath A. Kshirsagar
Rajiv Chandan R. Mukundan Managing DirectorMumbai, 30th May, 2012 General Counsel & Company Secretary P. K. Ghose Executive Director & CFO
}

81
Statement of Profit and Loss for the year ended 31st March, 2012Previous year
Note ` in crores ` in crores ` in croresI. REVENUE
(a) Revenue From Operations (Gross) ............. 23 8,146.21 6,459.73(b) Less : Excise Duty .............................................. 158.93 126.87
(c) Net Revenue From Operations ................... 7,987.28 6,332.86II. Other Income 24 280.33 108.03
III. Total Revenue (I+II) 8,267.61 6,440.89
IV. EXPENSES(a) Cost of Materials Consumed ........................ 2,864.91 2,198.87(b) Purchases of Stock-in-trade .......................... 2,167.65 1,308.92(c) Changes in Inventories of Work-In-progress,
Finished goods and Stock-in-trade ........... (409.36) (10.07)(d) Employee Benefits Expense ......................... 25 239.75 207.38(e) Finance Costs (Net) .......................................... 26 210.19 201.49(f ) Depreciation and Amortisation .................. 224.68 204.46(g) Other Expenses .................................................. 27 2,072.34 1,744.50
7,370.16 5,855.55(h) Less : Expenditure Transferred to
Capital Account .................................................. - 10.22
Total Expenses ........................................................... 7,370.16 5,845.33
V. Profit Before Exceptional Items andTax (III-IV) ...................................................................... 897.45 595.56
VI. Exceptional Items(a) Compensation on Voluntary Retirement 2.38 26.75(b) Provision for Diminution in the
Value of Long Term Investments ................ 12.38 -(c) Impairment of Assets ...................................... 34.00 10.08(d) Notional Exchange Loss on Restatement
of Long Term Borrowings (Net) .................. 84.34 0.03
133.10 36.86
VII. Profit Before Tax (V-VI) ......................................... 764.35 558.70VIII. Tax Expense
(a) Current Tax ........................................................... 209.52 188.80(b) Deferred Tax ........................................................ (31.77) (38.59)
177.75 150.21
IX. Profit For The Year (VII-VIII) ................................ 586.60 408.49
X. EARNINGS PER SHARE (`) (Note 28(i))(Face value per share - ` 10)(a) Basic ........................................................................ 23.03 16.32(b) Diluted ................................................................... 23.03 16.32
Notes forming part of Financial Statements 1 - 28
In terms of our report attached For and on behalf of the Board
For DELOITTE HASKINS & SELLS Ratan N. Tata ChairmanChartered Accountants R. Gopalakrishnan Vice-Chairman
Nusli N. WadiaPrasad R. Menon
B. P. Shroff Nasser MunjeePartner Dr. Yoginder Alagh Directors
Dr. Y. S. P. ThoratEknath A. Kshirsagar
Rajiv Chandan R. Mukundan Managing DirectorMumbai, 30th May, 2012 General Counsel & Company Secretary P. K. Ghose Executive Director & CFO
}

82
Seventy Third Annual Report 2011-12
Tata Chemicals Limited
CHEMICALS
Cash Flow Statement for the year ended 31st March, 2012
Previous year` in crores ` in crores
A Cash Flow from Operating Activities
Net Profit before Tax ........................................................................................................................ 764.35 558.70
Adjustments for :
Unrealised foreign exchange loss (net) ................................................................................... 127.38 32.40
Depreciation and amortisation ................................................................................................... 224.68 204.46
Impairment of assets ........................................................................................................................ 34.00 10.08
Finance cost ......................................................................................................................................... 210.19 201.49
Profit on sale of investments (net) ............................................................................................. (51.28) (16.99)
Foreign exchange gain realised on sale of investments .................................................. (28.20) -
Interest income ................................................................................................................................... (28.75) (4.71)
Dividend income ................................................................................................................................ (200.30) (86.33)
Provision for doubtful debts and advances ........................................................................... 3.96 (0.15)
Provision for employee benefits ................................................................................................. (0.43) 8.63
Provision for diminution in the value of long term/current investments ................ 12.38 (0.25)
Loss on assets sold or discarded (net) ..................................................................................... 22.63 8.86
Operating Profit before Working Capital Changes ...................................................... 1,090.61 916.19
Adjustments for :
Trade and other receivables ......................................................................................................... (720.12) (226.40)
Inventories ............................................................................................................................................ (556.92) (85.11)
Trade payables, other liabilities and provisions ................................................................... 769.16 64.54
Payment towards employee separation compensation ................................................... (0.51) (0.56)
Cash generated from Operations ........................................................................................... 582.22 668.66
Taxes paid (net of refund) .............................................................................................................. (241.49) (244.40)
Net Cash generated from Operating Activities .............................................................. 340.73 424.26
B Cash Flow from Investing Activities
Acquisition of fixed assets(including capital work-in-progress) ................................... (490.59) (323.32)
Proceeds on sale of fixed assets ................................................................................................. 12.02 2.38
Proceeds on sale of investments in subsidaries .................................................................. 324.19 30.94
Proceeds on sale of long term investments .......................................................................... 99.31 3.53
Proceeds on sale of current investments ................................................................................ 6,426.05 10,659.20
Purchase of long term investments .......................................................................................... (26.78) (95.25)
Purchase of current investments ................................................................................................ (6,425.62) (10,426.06)
Investment in subsidiaries ............................................................................................................. (40.39) (170.27)
Investment in joint venture .......................................................................................................... (1.68) (0.38)
Advance towards preference/equity commitment ............................................................ (16.27) (16.48)
Interest received ................................................................................................................................. 28.75 4.71
Dividend received ............................................................................................................................. 200.30 86.33
Net Cash generated/(used) in Investing Activities ....................................................... 89.29 (244.67)

83
Previous year` in crores ` in crores
Cash Flow Statement for the year ended 31st March, 2012 (Contd.)
C Cash Flow from Financing Activities
Repayment of borrowings ............................................................................................................. (625.27) (75.15)
Proceeds of borrowings .................................................................................................................. 780.12 72.94
Proceeds from issue of shares ..................................................................................................... - 363.40
Finance costs paid ............................................................................................................................. (199.52) (200.82)
Dividends paid including distribution tax .............................................................................. (292.26) (253.85)
Net Cash used in Financing Activities ................................................................................. (336.93) (93.48)
Net Increase in Cash and Cash equivalents ........................................................................... 93.09 86.11
Cash and Cash equivalents as at 1st April .............................................................................. 798.76 712.65
(Opening balance)
Cash and Cash equivalents as at 31st March as per note 20 ......................................... 891.85 798.76
(Closing balance)
Notes :
(a) Cash and Cash Equivalents include unclaimed dividend of ` 9.95 crores (previous year ` 9.28 crores).
(b) Previous year’s figures have been regrouped / reclassified wherever necessary to make them comparable withthe current year’s figures.
In terms of our report attached For and on behalf of the Board
For DELOITTE HASKINS & SELLS Ratan N. Tata ChairmanChartered Accountants R. Gopalakrishnan Vice-Chairman
Nusli N. WadiaPrasad R. Menon
B. P. Shroff Nasser MunjeePartner Dr. Yoginder Alagh Directors
Dr. Y. S. P. ThoratEknath A. Kshirsagar
Rajiv Chandan R. Mukundan Managing DirectorMumbai, 30th May, 2012 General Counsel & Company Secretary P. K. Ghose Executive Director & CFO
}

84
Seventy Third Annual Report 2011-12
Tata Chemicals Limited
CHEMICALS
Notes forming part of the Financial Statements
Note 1: Significant Accounting Policies :
(a) Basis of Accounting
The financial statements of the company have been prepared in accordance with generally accepted accounting principlesin India (Indian GAAP) to comply with the Accounting Standards notified under the Companies (Accounting Standards)Rules, 2006, (as amended) and the relevant provisions of the Companies Act, 1956. The accounts of the Company areprepared under the historical cost convention using the accrual method of accounting. The accounting policies adopted inthe preparation of financial statements are consistent with those of the previous year.
(b) Use of Estimates
The presentation of the financial statements in conformity with Indian GAAP requires the Management to make estimatesand assumptions that affect the reported amounts of assets and liabilities, revenues and expenses and disclosure of contingentliabilities. Management believes that the estimates used in the preparation of the financial statements are prudent andreasonable, future results could differ, the differences between the actual results and the estimates are recognised in theperiod in which the results are known / materialise.
(c) Tangible Fixed Assets
Fixed Assets are carried at original cost net of taxes / duties, credits availed if any, less depreciation and impairment loss. Thecost of fixed assets includes interest on borrowings attributable to acquisition of qualifying fixed assets up to the date ofcommissioning of the assets and other incidental expenses incurred up to that date. Machinery spares whose use is expectedto be irregular are capitalised and depreciated over the useful life of the principal item of asset. Subsequent expenditurerelating to the fixed assets is capitalised only if such expenditure results in an increase in the future benefits from suchassets beyond its previously assessed standard of performance.
Fixed Assets acquired and put to use for projects are capitalised and depreciation thereon is included in project cost tillcommissioning of the project.
Fixed Assets retired from active use and held for sale are stated at lower of their net book value and net realisable value andare disclosed separately in the Balance Sheet.
(d) Capital Work-in-Progress
Projects under commissioning and other Capital Work-in-Progress are carried at cost, comprising direct cost, related incidentalexpenses and attributable interest.
(e) Depreciation
(i) Depreciation has been provided on the straight line method as per Section 205(2)(b) of the Companies Act, 1956 asfollows :
(a) In respect of assets acquired on or after 1st April, 1987, at the rates and in the manner prescribed in Schedule XIV ofthe Companies Act, 1956 as amended, except in respect of the following categories of assets, in which case the life ofthe assets has been assessed as under :
Membrane Cells 4 years
Catalyst 5-7 years
Vehicles 4 years
Computers and data processing equipments 4 years
High Pressure Boiler 4 & Turbine 12 8 years
RO Water Plant 4 years
Railway wagons procured under Wagon Investment scheme 15 years
Moulds for Water Purifiers and Bulbs 3 years
(ii) Leasehold land is amortised over the duration of the lease.
(iii) Capital assets whose ownership does not vest in the Company are depreciated over their estimated useful life.
(f) Impairment of Tangible Fixed Assets
The carrying values of assets / cash generating units at each Balance Sheet date are reviewed for impairment of assets. If anyindication of such impairment exists, the recoverable amount of such assets is estimated and impairment is recognised, ifthe carrying amount of these assets exceeds their recoverable amount. The recoverable amount is the greater of the netselling price and their value in use. Value in use is arrived at by discounting the future cash flows to their present valuebased on an appropriate discount factor. When there is indication that an impairment loss recognised for an asset in prioraccounting periods no longer exists or may have decreased, such reversal of impairment loss is recognised in the Statementof Profit and Loss.

85
(g) Investments
Long term investments are carried individually at cost less provision for diminution, other than temporary, in the value ofsuch investments. Current investments are carried individually, at lower of cost and fair value. Cost of investments includesacquisition charges such as brokerage, fees and duties.
(h) Inventories
Inventories are valued at lower of cost (on weighted average basis) and net realisable value after providing for obsolescenceand other losses, where considered necessary. Cost includes all charges in bringing the goods to their present location andcondition, including Octroi and other levies, transit insurance and receiving charges. Work- in- process and finished goodsinclude appropriate proportion of overheads and where applicable, excise duty.
(i) Revenue Recognition
Sales of Goods
Sales are recognised, net of returns and trade discounts, Sales Tax and Value Added Tax, on dispatch of goods to customers.In respect of Urea, sales are recognised based on provisional rates of group concession as notified under the New PricingScheme. Equated freight claims and escalation claims for Urea sales are estimated by the Management based on the normsprescribed or notified under the said Scheme. In case of complex fertilisers, sales include price concession, as notified underthe Concession Scheme, or as estimated by the Management based on the norms prescribed.
Income from Services
Revenues from contracts priced on a time and material basis are recognised when services are rendered and related costsare incurred. Foreseeable losses on such contracts are recognised when probable.
(j) Other Income
Interest income is accounted on accrual basis. Dividend income is accounted for when the right to receive income isestablished.
(k) Insurance claims
Insurance claims are accounted for on the basis of claims admitted / expected to be admitted and to the extent that thereis no uncertainty in receiving the claims.
(l) Research and Development Expenses
Revenue expenditure pertaining to Research and Development is charged to the Statement of Profit and Loss. Expenditureon Tangible fixed assets used in Research and Development is capitalised.
(m) Leases
Lease arrangements where the risks and rewards incidental to ownership of an asset substantially vest with the lessor arerecognised as operating leases. Lease rentals under operating leases are recognised in the Statement of Profit and Loss ona straight-line basis.
(n) Debenture Issues Expenses
Debenture issue expenses and redemption premium are adjusted against the Securities Premium Account as permissibleunder Section 78(2) of the Companies Act, 1956.
(o) Employee Benefits
Employee benefits consist of Provident Fund, Superannuation Fund, Gratuity Fund, Compensated absences, Long serviceawards, Post retirement medical benefits, Directors’ retirement obligations and Family Benefit Scheme.
(i) Post-employment benefit plans
Payments to defined contribution retirement benefit scheme for eligible employees in the form of SuperannuationFund are charged as an expense as they fall due.
For defined benefit schemes in the form of gratuity fund, post retirement medical benefits, Directors’ Pension Liabilitiesand Family Benefit Scheme, the cost of providing benefits is determined using the Projected Unit Credit Method, withactuarial valuations being carried out at each Balance Sheet date. Actuarial gains and losses are recognised in theStatement of Profit and Loss for the period in which they occur. Past service cost is recognised immediately to theextent that the benefits are already vested, and otherwise is amortised on a straight-line basis over the average perioduntil the benefits become vested. The retirement benefit obligation recognised in the Balance Sheet represents thepresent value of the defined benefit obligation as adjusted for unrecognised past service cost and as reduced by thefair value of scheme assets. Any asset resulting from this calculation is limited to past service cost plus the presentvalue of available refunds and reductions in future contributions to the schemes.
The Company makes contribution towards provident fund in substance a defined contribution retirement benefit plan.The provident fund is administered by the Trustees of the Tata Chemicals Limited Provident Fund. The Rules of the
Notes forming part of the Financial Statements (Contd.)

86
Seventy Third Annual Report 2011-12
Tata Chemicals Limited
CHEMICALS
Company’s Provident Fund administered by a Trust, require that if the Board of Trustees are unable to pay interest atthe rate declared by the Employees’ Provident Fund by the Government under para 60 of the Employees’ ProvidentFund Scheme, 1952 for the reason that the return on investment is less or for any other reason, then the deficiencyshall be made good by the Company. Having regard to the assets of the Fund and the return on the investments, theCompany does not expect any deficiency as at the year end.
Family Benefit Scheme is an unfunded defined benefit plan. The benefits of the plan accrue to eligible employees atthe time of death or permanent disablement while in service, either as a result of an injury or as certified by theCompany’s Medical Board. The monthly payment to dependents of the deceased / disabled employee under the planequals 100% of the last drawn basic salary in case of Management and Officer cadre employees and 100% of the lastdrawn basic salary plus Dearness Allowance & Fixed Additional Dearness Allowance for employees in the workmencategory. The Company accounts for the liability for Family Benefit Scheme payable in future based on an independentactuarial valuation carried out at each Balance Sheet date.
(ii) Short-term employee benefits
The undiscounted amount of short-term employee benefits expected to be paid in exchange for the services renderedby employees is recognised during the period when the employees render the service. These benefits includecompensated absences such as paid annual leave and performance incentives.
The cost of compensated absences is accounted as under :
(a) in case of accumulated compensated absences, when employees render the services that increase their entitlementof future compensated absences; and
(b) in case of non-accumulating compensated absences, when the absences occur.
(iii) Long-term employee benefits
Compensated absences which are not expected to occur within twelve months after the end of the period in whichthe employee renders the related services are recognised as a liability at the present value of the defined benefitobligation at the Balance Sheet date. Long Service Awards are recognised as a liability at the present value of thedefined benefit obligation at the Balance Sheet date.
(p) Employee Separation Compensation
(i) Compensation paid / payable to employees who have opted for retirement under “Early Separation Scheme” is amortisedover the period for which benefit is expected.
(ii) Liability under “Early Separation Scheme” is computed and accounted at the Net Present Value.
(iii) Compensation paid / payable to employees who have opted for retirement under Voluntary Retirement Schemeincluding ex-gratia is charged to statement of Profit and Loss in the year of separation.
(q) Finance Costs
Costs in connection with the borrowing of funds to the extent not directly related to the acquisition of fixed assets areamortised and charged to Statement of Profit and Loss, over the tenure of the loan. Interest on borrowed money, allocatedto and utilised for qualifying fixed assets, pertaining to the period upto the date of capitalisation is added to the cost of theassets.
Borrowing cost includes interest and amortisation of ancillary costs incurred in connection with the arrangement ofborrowings.
(r) Foreign Currency Transactions and Translation
(i) Foreign currency transactions (other than derivatives) of the Company and its net investment in non-integral foreignoperations are recorded on initial recognition in the reporting currency, using the exchange rate at the date of thetransaction. Foreign currency monetary assets and liabilities (other than derivatives) of the company and its netinvestment in non-integral foreign operations as at the Balance Sheet date are restated at the year end rates and theresultant net gains or losses are recognised as income or expense in the Statement of Profit and Loss in the year inwhich they arise. The exchange differences on long term loans to non-integral foreign operations are accumulated in aForeign Currency Translation Reserve, until disposal / recovery of the net investment.
The exchange differences arising on revaluation of long term foreign currency monetary items for the year ended 31stMarch, 2008 to 2011 had been amortised over the shorter of the maturity period or 31st March 2011.
During the current year, the company has exercised the option granted vide notification F.No.17/133/2008/CL-V dated29th December, 2011 issued by the Ministry of Corporate Affairs and accordingly, the exchange differences arising onrevaluation of long term foreign currency monetary items for the year ended 31st March, 2012 have been recognisedover the shorter of the loan repayment period and 31st March, 2020. The unamortised balance is presented as “ForeignCurrency Monetary item Translation Difference Account” net of tax effect thereon. For the period upto 31st March,2011, such exchange loss was amortised upto 31st March, 2011 from the period of incurrence
Notes forming part of the Financial Statements (Contd.)

87
(ii) Premium / discount on forward exchange contracts, related to monetary items which are not intended for trading orspeculation purposes, are amortised over the period of the contract,
(s) Derivative Contracts
The Company enters into derivative contracts in the nature of full currency swaps, currency options, forward contracts withan intention to hedge its existing assets and liabilities, firm commitments and highly probable transactions. Derivativecontracts which are closely linked to the underlying transactions are recognised in accordance with the contract terms andaccounted as per the policy stated for foreign currency transaction and translation. All other contracts are marked-to-market and losses are recognised in the Statement of Profit and Loss. Gains arising on the same are not recognised ongrounds of prudence.
(t) Government Grants
Government grants and subsidies are recognised when there is reasonable assurance that the company will comply withthe conditions attached to them and the grants/subsidy will be received. Government grants whose primary condition isthat the company should purchase, construct or otherwise acquire capital assets are presented by deducting them from thecarrying value of the assets. The grant is recognised as income over the life of the depreciable assets by way of a reduceddepreciation charge. Other government grants and subsidies are recognised as income over the periods necessary to matchthem with the costs for which they are intended to compensate on a systematic basis.
(u) Segment Reporting
The Company identifies primary segments based on the dominant source, nature of risks, returns and the internal organisation.The operating segments are the segments for which separate financial information is available and for which operatingprofit/loss amounts are evaluated regularly by the executive Management in deciding how to allocate resources and inassessing performance.
The accounting policies adopted for segment reporting are in line with the accounting policies of the Company. Segmentrevenue, segment expenses, segment assets and segment liabilities have been identified to segments on the basis of theirrelationship to the operating activities of the segment. Inter Segment revenue is accounted on the basis of transactionswhich are primarily determined based on market/ fair value factors. Revenue, expenses, assets and liabilities which relate tothe Company as a whole and are not allocable to segments on reasonable basis have been included under “unallocatedrevenue / expenses / assets / liabilities”.
Segment information has been presented in the Consolidated Financial Statements as permitted by Accounting Standards(AS-17) on Segment Reporting as notified under the Companies (Accounting Standards) Rules, 2006.
(v) Taxes on Income
Current tax is the amount of tax payable on the taxable income for the year as determined in accordance with the provisionsof the Income Tax Act,1961.
Deferred Tax is recognised on timing differences, being the differences between the taxable income and the accountingincome that originate in one period and are capable of reversal in one or more subsequent periods.
Deferred Tax Assets in respect of unabsorbed depreciation and carry forward of losses are recognised if there is virtualcertainty that there will be sufficient future taxable income available to realise such losses. Other Deferred Tax Assets arerecognised if there is reasonable certainty that there will be sufficient future taxable income to realise such assets.
(w) Provisions and Contingencies
A provision is recognised when the Company has a present obligation as a result of past events and it is probable that anoutflow of resources will be required to settle the obligation, in respect of which a reliable estimate can be made. Provisions(excluding retirement benefits) are not discounted to their present value and are determined based on best estimaterequired to settle the obligation at the Balance Sheet date. These are reviewed at each Balance Sheet date and adjusted toreflect the current best estimates. Contingent liabilities are disclosed in Notes forming part of the financial statements.
Note 2: Cash Flow Statement
Cash flows are reported using the indirect method, whereby profit / (loss) before extraordinary items and tax is adjusted forthe effects of transactions of non-cash nature and any deferrals or accruals of past or future cash receipts or payments. Thecash flows from operating, investing and financing activities of the Company are segregated based on the availableinformation.
Cash and Cash Equivalents
Cash comprises cash on hand and demand deposits with banks. Cash equivalents are short-term balances (with an originalmaturity of three months or less from the date of acquisition), highly liquid time deposits that are readily convertible intoknown amounts of cash and which are subject to insignificant risk of changes in value.
Notes forming part of the Financial Statements (Contd.)

88
Seventy Third Annual Report 2011-12
Tata Chemicals Limited
CHEMICALS
Notes forming part of the Balance Sheet
Note 3: Share Capital As atNumber of Number of 31-Mar-11
shares ` in crores shares ` in crores1. Authorised:
Ordinary shares of ` 10 each 27,00,00,000 270.00 27,00,00,000 270.00
2 Issued:Ordinary shares of ` 10 each 25,48,42,598 254.84 25,48,42,598 254.84
3 Subscribed and fully paid up:Ordinary shares of ` 10 each 25,47,56,278 254.76 25,47,56,278 254.76
4. Forfeited shares:Amount originally paid-up on forfeited shares 86,320 0.06 86,320 0.06
254.82 254.82
Notes :
(a) Reconciliation of the number of shares and amount outstanding at the beginning and at the end of the reporting period:
As atNumber of Number of 31-Mar-11
shares ` in crores shares ` in croresOrdinary shares :
At the beginning of the year 25,48,42,598 254.84 24,33,42,598 243.34
Issued during the year - - 1,15,00,000 11.50
Outstanding at the end of the year 25,48,42,598 254.84 25,48,42,598 254.84
Subscribed and paid up:
Ordinary shares :
At the beginning of the year 25,47,56,278 254.76 24,32,56,278 243.26
Issued during the year - - 1,15,00,000 11.50
Outstanding at the end of the year 25,47,56,278 254.76 25,47,56,278 254.76
(i) Based on approval of the members of the Company, in August 2010, the Company has issued 1,15,00,000 equity shareson a preferential basis to Tata Sons Limited (the promoter entity).
(b) The equity shares of the Company have voting rights and are subject to the preferential rights as prescribed under law orthose of the preference shareholders, if any. The equity shares are also subject to restrictions as prescribed under theCompanies Act 1956.
(c) Details of shares held by each shareholder more than 5 % of shares :
Ordinary shares with voting rights Number of % Age Number of % Ageshares shares
(i) Tata Sons Ltd. 4,93,06,423 19.35 4,50,34,323 17.68
(ii) Life Insurance Corporation of India. 2,05,54,959 8.07 2,21,65,107 8.70
(iii) Tata Investment Corporation Ltd. 1,57,53,501 6.18 1,57,53,501 6.18
(iv) Tata Global Beverages Ltd. - - 1,53,85,522 6.04
(d) Aggregate number and class of shares allotted as fully paid up pursuant to contract(s) without payment being received incash, bonus shares and pursuant to schemes of amalgamation :
Number of Number ofshares shares
Ordinary shares with voting rights
(i) Scheme of amalgamation
Hind Lever Chemicals Limited 3,44,64,000 3,44,64,000
Tata Fertilisers Ltd 42,49,864 42,49,864
(ii) Contract without payment being received in cash 37,000 37,000
(iii) Bonus Shares by way of capitalisation of
Securities premium account 9,29,70,000 9,29,70,000
General reserve 1,24,32,144 1,24,32,144

89
Notes forming part of the Balance Sheet (Contd.)
Note 4: Reserves and Surplus As at
31-Mar-11
` in crores ` in crores ` in crores
1. Capital reserve:
Balance as per last account 0.66 0.66
2. Capital redemption reserve:
Balance as per last account 0.10 0.10
3. Securities premium:
(a) Balance as per last account 1,258.21 906.31
(b) Add : Additions during the year on account of issue of shares - 351.90
1,258.21 1,258.21
4. Debenture redemption reserve:
Balance as per last account 240.00 240.00
5. Foreign currency translation reserve:
(a) Balance as per last account 17.38 38.00
(b) Less : Transfer to statement of profit and loss upon conversion
of preference shares in Homefield International Pvt. Ltd.,
Mauritius (17.38) (20.62)
- 17.38
6. Surplus on amalgamation:
(a) Balance as per last account 20.75 20.75
(b) Less : On account of Wyoming 1 merger with TCL (note 28(xix)) (0.30) -
20.45 20.75
7. General reserve:
(a) Balance as per last account 1,005.34 964.49
(b) Add : Transfer from statement of profit and loss 58.66 40.85
1,064.00 1,005.34
8. Surplus in statement of profit and loss
Balance as per last account 1,943.42 1,869.33
Add : Profit for the year 586.60 408.49
Add : On account of Wyoming 1 merger with TCL 0.40 -
Less :
(a) Dividends proposed to be distributed to equity shareholders(` 10 per share) 254.76 254.76
(b) Tax on dividend 38.01 38.79
(c) Transfer to general reserve 58.66 40.85
2,178.99 1,943.42
4,762.41 4,485.86

90
Seventy Third Annual Report 2011-12
Tata Chemicals Limited
CHEMICALS
Notes forming part of the Balance Sheet (Contd.)Note 5: Long-Term Borrowings As at
31-Mar-11` in crores ` in crores ` in crores
1. Debentures(a) Secured (note ‘a’ below) 240.00 240.00(b) Unsecured (note ‘b’ below) 250.00 250.00
490.00 490.002. Other loans and advances
(a) Unsecured from banksExternal commercial borrowing 1,712.57 2,096.45
2,202.57 2,586.45
Notes :(a) 11.80% Secured Redeemable Non-Convertible Debentures face value ` 10 lakhs each redeemable at par on 18th December,
2013, secured by pari passu charge on the Company’s properties at Babrala and Mithapur.(b) 10% Unsecured Redeemable Non-Convertible Debentures face value `10 lakhs each redeemable at par on 2nd July, 2019.(c) The external commercial borrowing is due for repayments on 4th June 2013, 4th December 2013, 4th June 2014 and
October 2016 in installments of ` 465.65 crores (USD 95 million), ` 472.41 crores (USD 95 million), ` 472.41 crores (USD 95million) and ` 302.10 crore (USD 60 million) respectively.
Note 6: Deferred Tax Liabilities (Net)The significant component and classification of deferred tax assets and liabilities on account of timing differences are:
As at31-Mar-11
1. Deferred Tax Assets : ` in crores ` in crores ` in crores(a) Provision for doubtful debts and advances 7.49 6.16(b) Provision for employee benefits 14.05 15.17(c) Exchange differences 145.94 79.31(d) Other timing differences 8.22 5.54
175.70 106.182. Deferred Tax Liability :
(a) Depreciation (including impairment) 261.76 261.05(b) Borrowing costs 2.16 4.39(c) Other timing differences 0.45 0.45
264.37 265.89
Net deferred tax liability 88.67 159.71
Notes :(a) Deferred tax asset of ` 39.27 crores (previous year ` 8.08 crores) have been adjusted on, exchange gain/loss on long term
foreign currency monetary asset/liability have been offset against “ Foreign currency monetary translation difference account”.
Note 7: Other Long Term LiabilitiesAs at
31-Mar-11` in crores ` in crores ` in crores
1. Trade payables 31.33 6.92
2. Others
(a) Pension payable on employee separation scheme 1.28 1.79
(b) Security deposit 13.36 10.15
(c) Other payables 11.51 2.91
26.15 14.85
57.48 21.77
Notes :
(a) Provision for compensation under employee separation scheme (ESS) has been calculated on the basis of the net presentvalue of the future monthly payments of pension.
(b) During the year, the Company entered into an agreement with Department of Science and Technology for creation ofCapital Assets for Sulphate of Potash (SOP) Project. For the above Project, the Company has received its first installment ofGovernment Grant amounting to ` 8.50 crores which has been retained in a separate bank account and included in “Otherpayables” above.

91
Notes forming part of the Balance Sheet (Contd.)Note 8: Long-Term Provisions As at
31-Mar-11` in crores ` in crores ` in crores
1. Provision for employee benefits
(a) Provision for compensated absences 33.35 38.25
(b) Provision for post retirement medical benefit 15.13 13.92
(c) Provision for long service award 3.06 2.04
(d) Provision for directors pension liabilities 14.66 17.63
(e) Provision for family benefit scheme 14.09 10.70
80.29 82.54
2. Provision for site restoration expenditure (note 28(v)) 12.57 12.57
92.86 95.11
Note 9: Short-Term Borrowings As at31-Mar-11
` in crores ` in crores1. Loans repayable on demand
(a) Secured
From Banks : cash credits 8.93 12.73
(b) Unsecured
From Banks : buyer’s credit 247.93 110.01
256.86 122.74
Notes :(a) Loans from banks on cash credit are secured by hypothecation of stocks of raw materials, finished products, stores and
work-in-process as well as book debts.
Note 10: Trade Payables As at31-Mar-11
` in crores ` in crores
1. Acceptances (supplier’s credit) 1,016.29 473.53
2. Trade payables other than acceptances 655.10 473.98(including total dues of micro, small and medium enterprises)
3. Other payables 55.82 40.53
1,727.21 988.04
Notes :
(a) According to information available with the Management and relied upon by the auditors, on the basis of intimationreceived from suppliers regarding their status under the Micro, Small and Medium Enterprises Development Act, 2006(MSMED Act), the Company has amounts due to Micro and Small Enterprises under the said Act as at 31st March, 2012 asfollows :
As at31-Mar-11
` in crores ` in crores
1. (a) Principal amount remaining unpaid to any supplier as at 31st March, 2012 3.18 3.05(b) Interest on 1(a) above 0.01 *
2. (a) The amount of principal paid beyond the appointed date 2.32 2.48(b) The amount of interest paid beyond the appointed date 0.01 0.02
3. Amount of interest due and payable on delayed payments 0.01 0.014. Amount of interest accrued and due as at 31st March, 2012 0.01 0.015. Total outstanding dues of micro enterprises and small enterprises 3.19 3.06
* value below ` 50,000/-

92
Seventy Third Annual Report 2011-12
Tata Chemicals Limited
CHEMICALS
Notes forming part of the Balance Sheet (Contd.)
Note 11: Other Current Liabilities As at31-Mar-11
` in crores ` in crores ` in crores
1. Current maturities of long term debts(a) Debentures
Unsecured (note 5(a)) - 150.00(b) From Banks
UnsecuredForeign currency non resident (banking) loan - 116.75
(c) Other loans and advancesUnsecuredExternal commercial borrowings 907.66 -
907.66 266.752. Interest accrued but not due on borrowings 49.63 37.553. Liability towards Investor protection fund
(a) Unclaimed dividends 9.94 9.27(b) Unclaimed debentures and interest 0.01 0.01
9.95 9.284. Deposits 31.26 20.805. Other payables
(a) Advances received from customers 23.12 42.16(b) Creditors for capital goods 14.48 34.93(c) Creditors for statutory dues 20.66 15.53(d) Other liabilities 50.72 47.66
108.98 140.28
1,107.48 474.66
Notes:
(a) The external commercial borrowing is due for repayments on 4th June, 2012 and 4th December, 2012 in installments of` 448.66 crores (USD 95 million) and ` 459.00 crores (USD 95 million) respectively.
Note 12: Short-Term Provisions As at31-Mar-11
` in crores ` in crores ` in crores
1. Provision for employee benefits
(a) Provision for compensated absences 5.78 6.74
(b) Provision for gratuity 3.02 0.33
(c) Provision for post retirement medical benefit 0.50 0.48
(d) Provision for long service award 0.54 0.42
(e) Provision for directors Pension liabilities 0.68 0.94
(f ) Provision for family benefit scheme 0.86 0.66
11.38 9.57
2. Others
(a) Proposed dividend 254.76 254.76
(b) Tax on dividend 39.71 39.87
(c) Provision for contingencies (note 28(v)) 14.13 -
(d) Others (note 28(v)) 4.25 2.18
312.85 296.81
324.23 306.38

93
No
tes
form
ing
par
t o
f th
e B
alan
ce S
hee
t (C
ontd
.)N
ote
13
:Fi
xed
Ass
ets
` i
n c
rore
s
Tan
gib
le A
sset
sG
ross
Blo
ckD
epre
ciat
ion
/ A
mo
rtis
atio
nIm
pai
rmen
tN
et B
lock
(At
Co
st)
As
atA
dd
itio
ns
Ded
uct
ion
s/A
s at
As
atFo
rD
edu
ctio
ns/
As
atA
s at
1-A
pr-
11
du
rin
gA
dju
stm
ents
31
-Mar
-12
1-A
pr-
11
the
year
Ad
just
men
ts3
1-M
ar-1
23
1-M
ar-1
2th
e ye
ar
1.
Lan
d :
(a)
Free
ho
ld2
7.7
65
.61
0.0
13
3.3
6-
--
--
33
.36
18.2
09.
610.
0527
.76
--
--
-27
.76
(b)
Leas
eho
ld1
7.1
9-
1.4
71
5.7
23
.44
0.1
80
.26
3.3
6-
12
.36
17.1
9-
-17
.19
3.28
0.16
-3.
44-
13.7
52
.B
uil
din
gs
:(a
)Fa
cto
ry B
uild
ing
s2
55
.39
59
.76
0.0
83
15
.07
92
.99
8.5
30
.57
10
0.9
5-
21
4.1
224
5.79
10.4
70.
8725
5.39
86.0
67.
470.
5492
.99
3.37
159.
03(b
)O
ther
Bu
ildin
gs
#1
91
.28
3.0
31
.24
19
3.0
74
6.3
73
.84
0.3
74
9.8
4-
14
3.2
319
1.61
0.80
1.13
191.
2842
.83
3.87
0.33
46.3
7-
144.
913
.P
lan
t an
d M
ach
iner
y3
,26
9.7
43
82
.75
10
8.3
63
,54
4.1
32
,03
2.2
11
98
.17
75
.93
2,1
54
.45
50
.21
1,3
39
.47
3,15
4.63
185.
8670
.75
3,26
9.74
1,91
1.73
179.
4558
.97
2,03
2.21
56.8
61,
180.
674
.Fu
rnit
ure
an
d F
itti
ng
s6
5.9
91
3.1
15
.10
74
.00
43
.56
6.5
14
.67
45
.40
-2
8.6
060
.81
5.83
0.65
65.9
938
.31
5.65
0.40
43.5
60.
0522
.38
5.
Veh
icle
s1
6.3
01
.25
1.1
41
6.4
11
2.1
51
.95
0.1
21
3.9
8-
2.4
316
.79
0.91
1.40
16.3
011
.47
1.97
1.29
12.1
50.
014.
146
.O
ffic
e Eq
uip
men
t1
3.5
61
.18
0.3
61
4.3
86
.23
0.7
70
.32
6.6
8-
7.7
013
.09
0.94
0.47
13.5
65.
820.
740.
336.
23-
7.33
7.
Salt
wo
rks,
Res
ervo
irs
and
Pan
s4
3.1
33
.81
-4
6.9
43
7.6
83
.46
-4
1.1
4-
5.8
041
.29
1.84
-43
.13
33.6
04.
08-
37.6
8-
5.45
8.
Trac
tio
n L
ines
, Rai
lway
Sid
ing
s an
d W
ago
ns
38
.74
1.2
00
.14
39
.80
17
.34
1.2
01
.02
17
.52
-2
2.2
836
.24
4.66
2.16
38.7
418
.40
0.99
2.05
17.3
4-
21.4
09
.W
ater
Wo
rks
7.4
8-
0.0
17
.47
6.7
20
.07
-6
.79
-0
.68
7.86
-0.
387.
486.
980.
080.
346.
72-
0.76
Tota
l3
,94
6.5
64
71
.70
11
7.9
14
,30
0.3
52
,29
8.6
92
24
.68
83
.26
2,4
40
.11
50
.21
1,8
10
.03
3,80
3.50
220.
9277
.86
3,94
6.56
2,15
8.48
204.
4664
.25
2,29
8.69
60.2
91,
587.
5810
.Cap
ital
Wo
rk-i
n-P
rog
ress
26
5.3
829
9.53
Tota
l2
,07
5.4
1
1,88
7.11
No
tes
:
1#
Incl
ud
es c
ost
of
resi
den
tial
fla
ts a
gg
reg
atin
g `
1.8
7 c
rore
s (p
revi
ou
s ye
ar `
1.8
7 cr
ore
s) f
or
wh
ich
leg
al f
orm
alit
ies
rela
tin
g t
o t
ran
sfer
of
titl
e ar
e p
end
ing
.
2A
dd
itio
ns
du
rin
g t
he
year
in
clu
des
` 1
.15
cro
res
(pre
vio
us
year
` 6
.85
cro
res)
in
res
pec
t o
f Sc
ien
tific
Res
earc
h a
nd
Dev
elo
pm
ent
Act
ivit
es p
erta
inin
g t
o I
nn
ova
tio
nC
entr
e, a
s ce
rtifi
ed b
y th
e M
anag
emen
t an
d a
ccep
ted
by
the
Au
dit
ors
.
3G
ross
bo
ok
valu
e an
d a
ccu
mu
late
d d
epre
ciat
ion
ab
ove
in
clu
de `
0.3
7 c
rore
(p
revi
ou
s ye
ar `
24.
33 c
rore
s) a
nd
` N
il (
pre
vio
us
year
` 1
3.88
cro
res)
res
pec
tive
ly f
or
asse
ts h
eld
fo
r sa
le. T
he
asse
ts h
eld
fo
r sa
le h
ave
bee
n v
alu
ed a
t lo
wer
of
carr
yin
g v
alu
e o
r n
et r
ealis
able
val
ue.
Acc
ord
ing
ly`
Nil
(p
revi
ou
s ye
ar `
10.
08 c
rore
s) h
ave
bee
n p
rovi
ded
.
4C
apit
al w
ork
-in
-pro
gre
ss a
bov
e in
clu
des
gro
ss v
alu
e o
f `
48
.62
cro
res
(pre
vio
us
year
` N
il) o
f as
sets
hel
d f
or
sale
an
d a
n i
mp
airm
ent
of `
34
cro
res
(pre
vio
us
year
` N
il) h
ave
bee
n p
rovi
ded
du
rin
g t
he
year
.
5Th
e fig
ure
s in
lig
ht
pri
nt
are
for
the
pre
vio
us
year
.

94
Seventy Third Annual Report 2011-12
Tata Chemicals Limited
CHEMICALS
Notes forming part of the Balance Sheet (Contd.)Note 14: Non-Current Investments
Face As at 31-Mar-12 As at 31-Mar-11Value Holdings Quoted Unquoted Total Holdings Quoted Unquoted Total
` in crores ` in crores ` in crores `in crores `in crores `in crores
Investments (At cost) :A Trade
Investments in equity instruments(fully paid up)i) Investment in Subsidiary Companies:
Rallis India Ltd. ` 1 97,341,610 479.97 - 479.97 9,734,161 479.97 - 479.97Homefield International Pvt. Ltd., Mauritius MUR 1 90,016,001 - 408.76 408.76 90,016,001 - 408.76 408.76Bio Energy Ventures -1 (Mauritius) Pvt Ltd. USD 1 569,381,426 - 2,365.12 2,365.12 13,994,200 - 67.74 67.74Wyoming 1 (Mauritius) Pvt. Ltd.* USD 1 - - - - 720,240,000 - 2,973.17 2,973.17
ii) Investment in Joint Venture Companies:Khet-Se Agriproduce India Pvt Ltd** ` 1 139,035,429 - 13.90 13.90 96,885,429 - 9.69 9.69Indo Maroc Phosphore, S.A. , Morocco MAD 1,000 206,666 - 166.26 166.26 206,666 - 166.26 166.26
Investments in Redeemable Preference sharesi) Investment in Subsidiary Companies:
5% Non Cumulative Redeemable PreferenceShares of Homefield International Pvt. Ltd., Mauritius USD 100 170,005 - 77.86 77.86 779,850 - 374.02 374.025% Non Cumulative Redeemable Preference Shares ofBio Energy Venture -1(Mauritius) Pvt.Ltd USD 100 1,728,489 - 713.58 713.58 - - - -
Total - Trade (A) 479.97 3,745.48 4,225.45 479.97 3,999.64 4,479.61
B Other InvestmentsInvestments in equity instruments(fully paid up)i) Investment in other companies:
The Indian Hotels Co. Ltd. ` 1 7,271,666 9.82 - 9.82 7,271,666 9.82 - 9.82Oriental Hotels Ltd. ` 1 4,123,000 4.57 - 4.57 4,123,000 4.57 - 4.57Tata Investment Corporation Ltd. ` 10 475,840 6.83 - 6.83 416,360 4.45 - 4.45Tata Steel Ltd. ` 10 2,491,977 58.16 - 58.16 4,251,977 99.23 - 99.23Tata Motors Ltd. ` 2 1,863,705 7.89 - 7.89 703,741 14.89 - 14.89Tata Global Beverages Ltd. ` 1 43,175,140 16.09 - 16.09 43,175,140 16.09 - 16.09Titan Industries Ltd. ` 1 13,826,180 10.31 - 10.31 691,309 10.31 - 10.31The Associated Building Co. Ltd. ` 900 550 - 0.02 0.02 550 - 0.02 0.02Taj Air Ltd. ` 10 4,000,000 - 4.00 4.00 4,000,000 - 4.00 4.00Tata Industries Ltd. ` 100 9,861,303 - 170.19 170.19 9,861,303 - 170.19 170.19Tata Capital Ltd. ` 10 3,230,859 - 4.85 4.85 3,230,859 - 4.85 4.85Tata International Ltd. ` 1,000 48,000 - 27.34 27.34 24,000 - 3.34 3.34Tata Projects Ltd. ` 100 193,500 - 0.38 0.38 193,500 - 0.38 0.38Tata Services Ltd. ` 1,000 1,260 - 0.13 0.13 1,260 - 0.13 0.13Tata Sons Ltd. ` 1,000 10,237 - 56.86 56.86 10,237 - 56.86 56.86Tata Teleservices Ltd. # ` 10 1,285,110 - 3.11 3.11 1,206,545 - 2.70 2.70
Investments in Redeemable Preferenceshares (fully paid up)i) Fully paid Redeemable Preference Shares
7.50% Redeemable Preference Shares of Tata Sons Ltd. ` 1,000 200,000 - 20.00 20.00 200,000 - 20.00 20.00
Total - Other Investments (B) 113.67 286.88 400.55 159.36 262.47 421.83
Total (A+B) 593.64 4,032.36 4,626.00 639.33 4,262.11 4,901.44Less: Provision for diminution in value of investments** - 12.38 12.38 - - -
Total 593.64 4,019.98 4,613.62 639.33 4,262.11 4,901.44
Aggregate of Quoted Investments (net of provision) 593.64 639.33Aggregate market value of listed and quoted investments 2,211.31 2,408.59Aggregate amount of unquoted investments 4,019.98 4,262.11
# Shares can be transferred only with the prior approval of the Board of Directors of Tata Teleservices Ltd.
* With effect from January 1, 2012, Wyoming 1 (Mauritius) Pvt. Ltd. merged with Tata Chemicals Ltd pursuant to scheme of amalgamation
Abbreviations for Currencies
`. : Indian RupeesMUR : Mauritius RupeesUSD : United States DollarsMAD : Moroccan Dirhams

95
Notes forming part of the Balance Sheet (Contd.)Note 15: Long-Term Loans and Advances As at
31-Mar-11` in crores ` in crores ` in crores
1. Unsecured, considered good(a) Capital advances 5.63 40.52(b) Security deposits (with govt, public bodies and others) 18.10 18.27(c) Advance towards preference/equity commitments of
subsidiaries (note 28(ii(b))) 16.27 17.55(d) Loans and advances to employees 4.99 4.41(e) Advances recoverable in cash/kind 7.39 17.59(f ) Advances to suppliers 19.21 19.21(g) Advance payment of taxes (net of provision) 98.16 71.68
2. Doubtful(a) Advances recoverable in cash/kind 0.44 -(b) Less : Provision for advances recoverable in cash/kind (0.44) -
- -
169.75 189.23
Note 16: Other Non-Current Assets As at31-Mar-11
` in crores ` in crores
1. Foreign currency monetary translation difference account (note 22(a)) 29.34 -
2. Other non current assets 6.31 16.77
35.65 16.77
Note 17: Current InvestmentsFace As at 31-Mar-12 As at 31-Mar-11
Value Holdings Quoted Unquoted Total Holdings Quoted Unquoted Total
` in crores ` in crores ` in crores ` in crores ` in crores ` incrores
A Current Investments (At lower of cost and fair value)Investments in equity instrumensts (fully paid up)i) Investment in Other Companies:
IFCI Venture Capital Funds Ltd. ` 10 250,000 - 0.25 0.25 250,000 - 0.25 0.25Kowa Spinning Ltd. ` 10 60,000 - * - 60,000 - * -
ii) Investments in other instrumentsTata Investment Corporation Ltd. - Warrants ` - - - - 59,480 - - -
Total - Other Current Investments (A) - 0.25 0.25 - 0.25 0.25
Aggregate amount of unquoted investments 0.25 0.25* value below ` 50,000/-
Note 18: Inventories As at31-Mar-11
` in crores ` in crores
1. Raw materials 556.15 411.722. Work-in-process 30.79 23.253. Finished goods 108.06 90.844. Stock in trade (acquired for trading) 457.41 72.805. Stores and spare parts, packing materials 100.81 97.69
1,253.22 696.30
Includes above, goods in transit :(a) Raw materials 10.91 169.50(b) Finished goods 0.61 -(c) Stock in trade (acquired for trading) 337.38 1.64(d) Stores and spares 0.06 -

96
Seventy Third Annual Report 2011-12
Tata Chemicals Limited
CHEMICALS
Notes forming part of the Balance Sheet (Contd.)
Note 19: Trade Receivables As at31-Mar-11
` in crores ` in crores ` in crores1. Over six months old from due date :
(a) Unsecured, considered good 50.82 117.92(b) Doubtful 17.92 20.37
68.74 138.29(c) Less : Provision for doubtful trade receivables 17.92 20.37
50.82 117.922. Others :
(a) Secured, considered good - 8.83(b) Unsecured, considered good 1,435.01 597.73(c) Doubtful 5.97 -
1,440.98 606.56(d) Less : Provision for doubtful trade receivables 5.97 -
1,435.01 606.56
1,485.83 724.48
Notes :(a) Trade receivables include ` 5.91 crores (previous year ` 8.32 crores) receivable from “Tata Chemicals Magadi Ltd, U.K” a
subsidiary company. Maximum balance during the year is ` 6.55 crores (previous year ` 12.84 crores).(b) Trade receivables include ` 1,166.73 crores (previous year ` 586.43 crores) on account of subsidy receivable from the
Government.Note 20: Cash and Cash Equivalents As at
31-Mar-11` in crores ` in crores ` in crores
1. Balances with banks in(a) Current accounts 51.44 86.09(b) Deposit accounts 840.15 708.00
891.59 794.092. Cheques, drafts on hand 0.14 4.613. Cash on hand 0.12 0.06
891.85 798.76
Notes :(a) Earmarked balance with banks 9.95 9.28
Note 21: Short-Term Loans and Advances As at31-Mar-11
` in crores ` in crores1. Unsecured, considered good
(a) Deposits with Government, public bodies and others 45.91 24.82(b) Advance payment of taxes (net of provision) 25.54 20.05(c) Advances recoverable in cash/kind 92.02 33.66(d) Advances to suppliers 73.56 114.87(e) Advances to employees 1.91 1.62(f ) Other advances 14.94 23.57
253.88 218.59
Notes:(a) To officer of the Company ` 0.01 crore (previous year ` 0.02 crore) maximum balance during the year ` 0.02 crore (previous
year ` 0.02 crore).Note 22: Other Current Assets As at
31-Mar-11` in crores ` in crores
1. Foreign currency monetary translation difference account (net of taxes) 52.38 -2. Income accrued on investments 1.62 1.103. Claims receivable 33.73 54.054. Other current assets 7.40 7.46
95.13 62.61
Notes :(a) During the year ended 31st March 2012 the Company exercised the option granted vide notification F.No.17/133/2008/CL-
V dated 29th December, 2011 issued by the Ministry of Corporate Affairs and accordingly, the exchange differences arisingon revaluation of long term foreign currency monetary items have been recognised over the shorter of the loan repaymentperiod and 31st March, 2020. The unamortised balance as at 31st March 2012 of ` 81.72 crores (net of tax) (previous year` Nil (net of tax)) is presented as “Foreign Currency Monetary item Translation Difference Account” (FCMTDA).

97
Note 23: Revenue From Operations Previous year` in crores ` in crores ` in crores
1. Sales :
(a) Sales (note a) 8,071.56 6,352.14
2. Operating income :
(a) Insurance claims 1.04 38.14
(b) Town income 2.41 1.93
(c) Liabilities no longer required - written back 6.03 17.94
(d) Miscellaneous income 65.17 49.58
74.65 107.59
8,146.21 6,459.73
Notes :
(a) Sales includes subsidy income of ` 2,841.04 crores (previous year ` 2,376.73 crores)
(b) Insurance claims includes ` Nil (previous year ` 36.09 crores ) towards estimated loss of profit pertaining to the Company’sFertiliser Plant at Babrala (on account of temporary disruption due to fault in Synthesis Converter in the ammonia plant upto 31st August, 2010) and ` Nil (previous year ` 2.04 crores ) towards estimated claim for loss of stocks due to devastatingrain fall coupled with cyclonic wind in the months of July and August 2010 in and around Mithapur plant.
Note 24: Other Income Previous year` in crores ` in crores ` in crores
1. Dividend Income
(a) Current investments 50.12 33.60
(b) Long term Investments
(i) Subsidiaries 20.44 15.25
(ii) Joint ventures 100.28 10.98
(iii) Other 29.46 26.50
150.18 52.73
200.30 86.33
2. Interest Income
(a) On bank deposits 14.59 1.67
(b) On loans and advances 0.19 0.19
(c) On refund of taxes 13.82 2.85
(d) Other interest 0.15 -
28.75 4.71
3. Net gain/loss on sale of investments
(a) Current investments 0.05 0.24
(b) Long term investments 51.23 16.75
51.28 16.99
280.33 108.03
Notes forming part of the Statement of Profit and Loss

98
Seventy Third Annual Report 2011-12
Tata Chemicals Limited
CHEMICALS
Notes forming part of the Statement of Profit and Loss (Contd.)Note 25: Employee Benefits Expenses Previous year
` in crores ` in crores
1. Salaries, wages and bonus 183.44 155.50
2. Contribution to provident and other funds 18.42 15.68
3. Contribution to group insurance scheme 0.03 0.03
4. Workmen and staff welfare expenditure 37.86 36.17
239.75 207.38
Note 26: Finance Costs Previous year` in crores ` in crores ` in crores
1. Interest expenses
(a) Debentures and fixed loans 174.40 178.79
(b) Other loans 15.51 9.21
189.91 188.00
2. Discounting and other charges 20.28 13.49
210.19 201.49
Note 27: Other Expenses Previous year` in crores ` in crores
1. Stores and spare parts consumed 75.12 58.43
2. Packing materials consumed 211.65 181.27
3. Power and fuel 685.22 570.34
4. Repairs - Buildings 6.04 3.53
- Machinery 52.44 41.95
- Others 1.01 1.37
5. Rent 27.13 28.67
6. Royalty, rates and taxes 12.23 9.98
7. Commission and distributors’ service charges / discount 140.22 89.62
8. Sales promotion expenses 93.10 88.43
9. Insurance charges 12.77 6.52
10. Freight and forwarding charges 478.98 427.05
11. Loss on assets sold or discarded 22.63 8.86
12. Provision for doubtful debts and advances - written back (net) 3.96 (0.15)
13. Foreign exchange (gain)/loss (net) 43.05 32.37
14. Directors’ fees / commission 6.05 6.20
15. Other provisions (note 28(v)) 16.20 -
16. Other expenses 184.54 190.06
2,072.34 1,744.50

99
Notes :(a) Other expenses ` 184.54 crores (previous year ` 190.06 crores) (note 27(16)) includes :
Previous year` in crores ` in crores
1. Auditors’ Remuneration
(i) For Services as Auditors [includes ` 0.03 crore to Cost Auditors(previous year ` 0.03 crore)] 1.68 1.68
(ii) For tax matters 0.24 0.24
(iii) For other services [includes ` * to Cost Auditors (previous year ` 0.01 crore)] 1.37 0.50
(iv) Reimbursement of travelling and out-of-pocket expenses[includes ` * to Cost Auditors (previous year ` * crore)] 0.18 0.02
(v) Service Tax [includes ` * to Cost Auditors (previous year ` *)] 0.34 0.27
3.81 2.71
2. Donations 1.54 5.00
3. Excise duty adjustment for stocks 4.37 2.60
(b) Note 25 and 27 of statement of profit and loss includesPrevious year
` in crores ` in crores
Payments to and provisions for employees, operation and other expenses andDirectors’ fees / commission includes remuneration to the Managing Directorand Whole-time Directors
(a) Remuneration including ` 0.11 crore (previous year ` 0.14 crore) towardsCompany’s contribution to provident fund and superannuation fund, ` Nil(previous year ` 1.02 crores) towards compensated absences and gratuityfor any Ex-Director. 5.88 6.87
(b) (Write back) / Provision for post retirement obligation (2.89) 4.00
(c) Commission 3.35 3.50
(d) Estimated value of benefits in cash or in kind 0.14 0.15
6.48 14.52
Note :The above figures do not include provision for compensated absences and contribution to gratuity fund, as separate figuresare not available for the Managing Director and Whole-time Directors other than disclosed above.
(c) Expenditure incurred on Scientific Research and Development activities @Previous year
` in crores ` in crores
(i) Revenue Expenditure (note 25 and 27 of statement of profit and loss includes) :
(a) Payment to and Provision for employees 7.44 5.97
(b) Consumables 1.37 1.53
(c) Other expenses 6.18 9.23
(ii) Capital Expenditure 1.39 4.13
@ The above figure are as certified by the management and accepted by the Auditors.
Notes forming part of the Statement of Profit and Loss (Contd.)

100
Seventy Third Annual Report 2011-12
Tata Chemicals Limited
CHEMICALS
(ii) Related Party Disclosure :(a) Related Parties and their relationship (As identified by the Management)
Subsidiaries Joint Ventures Associates Key ManagementDirect Direct EPM Mining Venture Inc, PersonnelHomefield International Pvt. Limited, Indo Maroc Phosphore S. A., Canada # Mr. R. Mukundan,Mauritius Morocco Managing DirectorWyoming 1 (Mauritius) Pvt. Ltd., Khet-Se Agri Produce India Pvt. Ltd., Mr. P. K. Ghose,Mauritius India Executive Director & CFORallis India Limited, India *Indirect Indirect Promoter GroupBio Energy Venture - 1 Alcad, United State of America Tata Sons Limited(Mauritius) Pvt. Ltd, Mauritius Kemex B.V., NetherlandsHomefield Pvt. UK Limited, Joil (S) Pte. Ltd, SingaporeUnited Kingdom The Block Salt Company Limited,Tata Chemicals Africa Holdings Limited, United KingdomUnited Kingdom Natronx Technologies LLC,Tata Chemicals South Africa Pty Limited, United States of America #South AfricaTata Chemicals Magadi Limited, United KingdomMagadi Railway Company Limited, KenyaHomefield 2 UK Limited, United KingdomTata Chemicals (Europe) Holdings Limited, United KingdomCheshire Salt Holdings Limited, United KingdomCheshire Salt Limited, United KingdomBritish Salt Limited, United KingdomBrinefield Storage Limited, United KingdomBroomco (4118) Limited, United KingdomBroomco (4119) Limited, United KingdomBroomco (4120) Limited, United KingdomCheshire Cavity Storage 2 Limited, United KingdomCheshire Compressor Limited, United KingdomIrish Feeds Limited, United KingdomNew Cheshire Salt Works Limited, United KingdomBrunner Mond Group Limited, United KingdomTata Chemicals Europe Limited, United KingdomBrunner Mond B.V., NetherlandBrunner Mond Generation Company Limited, United KingdomBrunner Mond Limited, United KingdomNorthwich Resource Management Limited, United KingdomGusiute Holdings (UK) Limited, United KingdomValley Holdings Inc., United States of AmericaTata Chemicals North America Inc., United States of AmericaGeneral Chemical International Inc, United States of AmericaGeneral Chemical Great Britain Limited, United States of AmericaNHO Canada Holdings Inc, United States of AmericaGeneral Chemical Canada Holding Inc, CanadaTCSAP Holdings, United State of America **TCSAP LLC, United State of AmericaTata Chemicals (Soda Ash) partners (TCSAP), United State of America **GCSAP Canada Inc, CanadaTata Chemicals Asia Pacific Pte. Limited, SingaporeGrown Energy Zambeze Holdings Pvt. Ltd, MauritiusGrown Energy (Proprietary) Limited, South AfricaGrown Energy Zambeze Limitada, MozambiqueRallis Chemistry Exports Limited, IndiaMetahelix Life Sciences Ltd (Metahelix), IndiaDhaanya Seeds Ltd, India* Rallis India Limited is a listed company.** a general partnership formed under the laws of the State of Delaware (USA)# Arising out of acquisitions during the year.Wyoming 2 (Mauritius) Pvt. Limited merged with Wyoming 1 (Mauritius) Pvt. Limited w.e.f. 4th November, 2011Bio Energy Venture - 2 (Mauritius) Pvt. Ltd merged with Bio Energy Venture - 1 (Mauritius) Pvt. Ltd w.e.f. 21st November, 2011Wyoming 1 (Mauritius) Pvt. Limited merged with the Company w.e.f. 1st Janurary, 2012Rallis Australasia Pty. Limited had liquidated as at 31st December, 2011General Chemical (Soda Ash) Inc and Bayberry Management Corporation dissolved as at 11th January, 2012
Notes forming part of the Financial StatementsNote 28: Other Notes
(i) Earnings per Share (EPS) :
Basic and Diluted 2011-12 2010-11
(a) Profit after tax ` in crores 586.60 408.49
(b) The weighted average number of ordinary shares of ` 10 each
Total number of shares Nos. 25,47,56,278 25,03,45,319
(c) Earnings Per Share 23.03 16.32

101
(b)
Tran
sact
ion
s w
ith
th
e re
late
d p
arti
es d
uri
ng
th
e ye
ar e
nd
ed 3
1st
Mar
ch 2
01
2 a
nd
bal
ance
s o
uts
tan
din
g a
s at
31
st M
arch
20
12
.(`
in
cro
res)
Subs
idia
ries
Join
t Ve
ntur
esPr
omot
erKe
yTo
tal
Gro
upM
anag
e-m
ent
Pers
onne
lRa
llis
Dhaa
nya
Hom
efie
ldTa
taW
yom
ing
1Bi
oTa
taHo
mef
ield
Tata
Tata
Briti
shGr
own
Indo
Khet
-se
aTa
taIn
dia
Seed
sU.
K.ch
emic
als
(Mau
ritiu
s)En
ergy
Chem
ical
sIn
ter
Chem
ical
sCh
emic
als
Salt
Ltd,
Ener
gyM
aroc
Agri
Sons
Ltd
.Lt
d.,
Ltd
Pvt.
Ltd.
,So
uth
Pvt.
Ltd.
,Ve
ntur
e - 1
Asi
ana
tiona
l,No
rth
Mag
adi
U. K
.Za
mbe
zePh
osph
ore
Prod
uce
Indi
aU.
K.Af
rica
Mau
ritiu
s.(M
aurit
ius)
Paci
ficPv
t. Lt
d.Am
eric
aLt
d.,
Lim
itada
,S.
A.,
Indi
aPt
y Lt
d.,
Pvt.
Ltd.
,Pt
e Lt
d.,
Mau
ritiu
sIn
c,U.
K.M
ozam
biqu
eM
oroc
coPv
t. Lt
d.,
Sout
hM
aurit
ius
Sing
apor
eUn
ited
Indi
aAf
rica
Stat
es o
fAm
eric
aPu
rch
ase
of
go
od
s(in
clu
des
sto
ck i
n t
ran
sit)
- N
et2
7.9
82
.03
--
--
--
--
1.3
6-
81
1.4
9-
--
84
2.8
68.
88-
--
--
--
8.99
4.34
--
589.
83-
--
612.
04
Sale
of
go
od
s2
.01
--
--
--
--
--
--
--
-2
.01
6.25
--
0.14
--
--
--
--
--
--
6.39
Oth
er S
ervi
ces
--
--
--
--
--
--
--
19
.85
-1
9.8
5-
--
--
--
--
--
--
-15
.02
-15
.02
Inve
stm
ents
(in
clu
din
g a
dva
nce
tow
ard
s su
bsc
rip
tio
n t
op
refe
ren
ce s
har
es)
--
--
-3
5.9
1-
32
.58
--
--
-4
.21
--
72
.70
--
--
5.61
13.5
1-
172.
84-
--
--
2.93
--
194.
89
Sale
of
Inve
stm
ents
--
--
--
--
--
--
--
99
.48
-9
9.4
8-
--
--
--
--
--
--
--
--
Loan
s g
iven
(incl
ud
ing
In
tere
st c
apit
alis
ed)
--
--
--
--
--
--
--
--
--
--
--
--
--
--
1.19
--
--
1.19
Am
ou
nt
Rec
eiva
ble
(in
res
pec
t o
flo
ans
and
in
tere
st t
her
eon
)-
--
--
--
--
3.3
8-
1.1
9-
--
0.0
14
.58
0.71
--
--
--
--
6.07
--
--
-0.
026.
80A
mo
un
t Pa
yab
le (
in r
esp
ect
of
go
ods
pu
rch
ased
an
do
ther
ser
vice
s)0
.10
2.8
3-
--
-0
.13
-0
.14
-0
.37
-2
80
.72
0.0
91
9.8
5-
30
4.2
30.
13-
--
--
0.13
-1.
30-
--
197.
280.
2815
.02
-21
4.14
Inte
rest
pai
d-
--
--
--
--
--
-3
.23
--
-3
.23
--
--
--
--
--
--
0.37
--
-0.
37
Max
imu
m a
mo
un
t o
uts
tan
din
gd
uri
ng
th
e ye
ar4
.27
1.6
4-
--
-0
.13
-1
.44
4.0
20
.37
1.3
25
15
.41
-1
9.8
5-
54
8.4
50.
24-
--
--
0.13
-1.
4812
.84
-1.
1934
7.31
1.72
15.0
2-
379.
93
Div
iden
d r
ecei
ved
20
.44
--
--
--
--
--
-1
00
.28
--
-1
20
.72
15.2
5-
--
--
--
--
--
10.9
8-
--
26.2
3
Am
ou
nts
rec
eiva
ble
on
acc
ou
nt
of
any
Man
agem
ent
Co
ntr
acts
incl
ud
ing
fo
r d
epu
tati
on
of
emp
loye
es0
.02
--
--
--
--
2.5
3-
-0
.22
0.2
5-
-3
.02
--
--
--
--
-2.
25-
-0.
16-
--
2.41
Gu
aran
tees
to
th
ird
par
ties
on
beh
alf
of
sub
sid
iari
es-
-4
59
.40
--
--
--
24
4.2
0-
--
--
-7
03
.60
--
402.
69-
--
--
-21
4.06
--
--
--
616.
75A
dva
nce
s to
war
ds
Pref
eren
ces/
equ
ity
com
mit
men
ts o
f su
bsi
dar
ies
--
--
--
-1
6.2
7-
--
--
--
-1
6.2
7-
--
-2.
2711
.83
-0.
90-
--
--
2.55
--
17.5
5Pr
efer
ence
sh
ares
red
eem
edd
uri
ng
th
e ye
ar-
--
--
--
31
3.1
7-
--
--
--
-3
13
.17
--
--
--
-20
2.88
--
--
--
--
202.
88N
ote
s :
1In
ad
dit
ion
to
th
e ab
ove,
rem
un
erat
ion
is
pai
d t
o K
ey M
anag
emen
t Pe
rso
nn
el (
no
te 2
7 (b
)), u
nd
er t
hei
r co
ntr
act
of
emp
loym
ent
wit
h t
he
Co
mp
any.
2Fo
r in
vest
men
ts i
n r
elat
ed p
arti
es a
s at
31s
t M
arch
201
2 (n
ote
14)
.3
The
fig
ure
s in
lig
ht
pri
nt
are
for
pre
vio
us
year
.
No
tes
form
ing
par
t o
f th
e Fi
nan
cial
Sta
tem
ents
(C
ontd
.)

102
Seventy Third Annual Report 2011-12
Tata Chemicals Limited
CHEMICALS
Notes forming part of the Financial Statements (Contd.)(iii) Employee Benefit Obligations :
(a) The Company makes contribution towards provident fund in substance a defined contribution retirement benefit planand towards pension, superannuation fund, a defined contribution retirement plan for qualifying employees. The providentfund is administered by the Trustees of the Tata Chemicals Limited Provident Fund and the superannuation fund isadministered by the Trustees of the Tata Chemicals Limited Superannuation Fund. Under the schemes, the Company isrequired to contribute a specified percentage of salary to the retirement benefit schemes to fund the benefit.
On account of the above Contribution Plans, a sum of ` 5.70 crores (previous year ` 4.67 crores) has been charged tothe Statement of Profit and Loss.
(b) The Company makes annual contributions to the Tata Chemicals Employees’ Gratuity Trust and to the Employees’Group Gratuity-cum-Life Assurance Scheme of the Life Insurance Corporation of India, both are funded defined benefitplans for qualifying employees. The scheme provides for lump sum payment to vested employees at retirement, deathwhile in employment or on termination of employment as per the Company’s Gratuity Scheme. Vesting occurs uponcompletion of five years of service.
The Company is also providing post retirement medical benefits to qualifying employees. Similarly, the Companyprovides pension, housing / house rent allowance and medical benefits to retired Managing and Executive Directors.
The most recent actuarial valuations of plan assets and the present values of the defined benefit obligations werecarried out at 31st March, 2012. The present value of the defined benefit obligations and the related current servicecost and past service cost, were measured using the Projected Unit Credit Method.
The following tables set out the funded status and amounts recognised in the Company’s financial statements as at31st March, 2012 for the Defined Benefits Plans.
(` in crores)
As at 31-Mar-12 As at 31-Mar-11
Gratuity Post Directors’ Gratuity Post Directors’retirement retirement retirement retirement
medical obligations medical obligationsbenefits benefits
1 Changes in the defined benefit obligation:Projected defined benefit obligation
At the beginning of the year 58.13 14.40 18.57 56.89 15.00 14.68
Current service cost 3.35 0.47 0.25 2.76 0.52 0.45
Interest cost 4.72 1.19 1.49 4.66 1.25 1.22
Actuarial (gain) / loss 3.23 0.54 (4.31) (1.72) (1.53) 2.82
Past service cost - - - - - -
Benefits paid (5.31) (0.97) (0.66) (4.46) (0.84) (0.60)
At the end of the year 64.12 15.63 15.34 58.13 14.40 18.57
2 Changes in the fair value of plan assets:Fair value of plan assets
At the beginning of the year 57.80 - - 57.08 - -
Expected return on plan assets 4.70 - - 4.61 - -
Employer’s contributions 2.51 0.97 0.66 4.92 0.84 0.60
Actuarial gain / (loss) 1.40 - - (4.35) - -
Benefits paid (5.31) (0.97) (0.66) (4.46) (0.84) (0.60)
At the end of the year 61.10 - - 57.80 - -
(Asset)/Liability (net) 3.02 15.63 15.34 0.33 14.40 18.57

103
Notes forming part of the Financial Statements (Contd.)3 Net employee benefit expense (recognised in Employee Cost) for the year :
(` in crores)
As at 31-Mar-12 As at 31-Mar-11
Gratuity Post Directors’ Gratuity Post Directors’retirement retirement retirement retirement
medical obligations medical obligationsbenefits benefits
Current service cost 3.35 0.47 0.25 2.76 0.52 0.45Interest defined benefit obligation 4.72 1.19 1.49 4.66 1.25 1.22Expected return on plan assets (4.70) - - (4.61) - -Net actuarial (gain) / loss recognised in the year 1.83 0.54 (4.31) 2.63 (1.53) 2.82Past service cost - - - - - -
Total expenses recognised in the statementof profit and loss 5.20 2.20 (2.57) 5.44 0.24 4.49
Expected Employer’s contribution next year 3.02 0.50 0.68 3.00 0.48 0.94
Actual Return on Plan Assets 6.10 - - 0.26 - -
4 Categories of plan assets as a percentage of the fair value of total plan assets :Gratuity
2011-12 2010-11
% %
Government of India Securities 56 64Corporate Bonds 37 30Equity Shares of Listed Companies 2 3Others 5 3Total 100 100
5 Assumptions used in accounting for gratuity and compensated absences, long service awards, post retirement medicalbenefits, directors’ retirement obligations and family benefit scheme :
As at 31-Mar-12
Gratuity & Long Post Directors’ FamilyCompensated Service retirement retirement Benefit
absences Awards medical obligations Scheme benefits
Discount rate 8.55% 8.55% 8.55% 8.55% 8.55%8.20% 8.20% 8.20% 8.20% 8.20%
Expected rate of return on plan assets 9.00% NA NA NA NA8.50% NA NA NA NA
Increase in Compensation cost 7.5% for first 7.5% for first NA 7.5% for first 7.5% for firstyear, 10% year, 10% year, 10% year, 10%for second for second for second for second
year and 7.5% year and 7.5% year and 7.5% year and 7.5%thereafter thereafter thereafter thereafter
7.5% for 2 7.5% for 2 NA 7.5% for 2 7.5% for 2years, 10% years, 10% years, 10% years, 10%
for third for third for third for third year and 7.5% year and 7.5% year and 7.5% year and 7.5%
thereafter thereafter thereafter thereafter
Increase in cost of award NA NA NA NA NANA NA NA NA NA
Healthcare cost increase rate NA NA 6.00% 6.00% NANA NA 6.00% 6.00% NA
Pension increase rate NA NA NA 5.00% NANA NA NA 5.00% NA
(a) Discount rate is based on the prevailing market yields of Indian Government securities as at the Balance Sheet date for the estimatedterm of the obligations.
(b) Expected rate of return on plan assets is based on the average long term rate of return expected on investments of the Fund during theestimated term of the obligations.
(c) The estimates of future salary increases, considered in actuarial valuation, take into account the inflation, seniority, promotion andother relevant factors.
(d) The figures in light print are for previous year.

104
Seventy Third Annual Report 2011-12
Tata Chemicals Limited
CHEMICALS
Notes forming part of the Financial Statements (Contd.)6 Effect of Change in Assumed Health Care Cost Trend Rate : (` in crores)
2011-12 2010-11
1% increase 1% decrease 1% increase 1% decrease
Effect on the aggregate of the service cost andinterest cost 0.37 (0.29) 0.30 (0.30)Effect on defined benefit obligation 2.86 (2.24) 2.77 (2.15)
7 Experience Adjustments : (` in crores)
2011-12 2010-11 2009-10 2008-09 2007-08 2011-12 2010-11 2009-10 2008-09 2007-08
Gratuity Directors’ retirement obligations
Defined Benefit Obligation 64.12 58.13 53.31 49.64 47.49 15.34 18.57 14.67 16.02 3.40
Plan Assets 61.10 57.80 57.08 50.87 46.83 - - - - -
Surplus / (Deficit) (3.02) (0.33) 3.77 1.23 (0.67) (15.34) (18.57) (14.67) (16.02) (3.40)
Experience Adjustments onPlan Liabilities 5.25 (1.64) 3.47 (1.81) (2.77) (3.53) 2.82 (0.16) 10.46 -
Experience Adjustments onPlan Assets 1.40 (4.35) 0.31 1.76 2.39 - - - - -
Post retirement medical benefits Family Benefit Scheme
Defined Benefit Obligation 15.63 14.40 15.00 11.32 7.31 14.95 11.36 11.32 - -
Plan Assets - - - - - - - - - -
Surplus / (Deficit) (15.63) (14.40) (15.00) (11.32) (7.31) (14.95) (11.36) (11.32) - -
Experience Adjustments onPlan Liabilities 1.65 (1.53) 4.95 2.60 1.00 2.89 (0.85) - - -
Experience Adjustments onPlan Assets - - - - - - - - - -
8 The details of the Company’s post-retirement and other benefit plans for its employees given above are certified bythe actuary and relied upon by the Auditors.
(iv) The proportionate share of assets, liabilities, income and expenditure, contingent liabilities and capital commitments of theJoint Ventures are as given below :
(` in crores)
PARTICULARS Khet-se Indo Maroc Kemex B.V. ALCAD Joil (S) Pte. The Block NatronxAgriproduce Phosphore Ltd Salt Technologies
India Pvt. Ltd. S. A. Company LLCLtd.
Country of India Morocco Netherlands United States Singapore United United StatesIncorporation of America Kingdom of America
Percentage of 50.00% 33.33% 49.99% 50.00% 33.78% 50.00% 33.30%ownership interest
2011-12 2010-11 2011-12 2010-11 2011-12 2010-11 2011-12 2010-11 2011-12 2010-11 2011-12 2010-11 2011-12 2010-11
Liabilities 2.35 4.18 83.90 120.95 0.42 2.34 6.91 6.03 1.73 0.40 1.01 2.27 9.53 -
Assets 3.38 5.17 264.11 330.87 0.77 0.24 9.58 8.47 40.36 46.56 2.62 4.73 36.22 -
Income 1.28 4.76 581.97 447.20 - 0.76 100.32 89.71 1.68 0.29 5.20 2.21 4.48 -
Expenditure 3.16 8.01 528.26 410.35 0.18 2.09 65.72 58.46 14.65 7.53 4.98 2.05 9.05 -
Profit/(Loss)after taxfor the year (1.88) (3.25) 53.71 36.85 (0.18) (1.33) 34.60 31.25 (12.97) (7.24) 0.22 0.16 (4.57) -
ContingentLiabilities - - - - - - - - - 4.98 - - - -
CapitalCommitments - - - - - - - - 2.92 15.92 - - - -

105
Notes forming part of the Financial Statements (Contd.)(v) Disclosure as required by AS 29 “Provisions, Contingent Liabilities and Contingent Assets” in respect of
provisions as at 31st March, 2012
The company has made provision for various obligations and disputed liabilities based on its assessment of theamount it estimates to incurre to meet such obligations, details of which are given below.
(` in crores)
Particular Warranty Site Provision for Others TotalRestoration Contingencies
Expenses
As at As at As at As at As at As at As at As at As at As at2011-12 2010-11 2011-12 2010-11 2011-12 2010-11 2011-12 2010-11 2011-12 2010-11
Opening Balance - - 12.57 12.57 - - 2.18 2.18 14.75 14.75
Add : Provision duringthe year 0.34 - - - 14.13 - 1.92 - 16.39 -
Less : Payments /Reversalduring the year (0.19) - - - - - - - (0.19) -
Closing Balance 0.15 - 12.57 12.57 14.13 - 4.10 2.18 30.95 14.75
(vi) Derivative Instruments:
(a) As at 31st March, 2012 the Company has the following derivative instruments outstanding:
(in Million)
Particulars Hedged Exposure Currency As at As at2011-12 2010-11
Foreign CurrencyExchange Contracts
USD / INR Foreign Currency Loans USD 48.73 24.67
USD / INR Foreign Currency Acceptances USD 94.66 112.49
USD / INR Highly Probable Forecast Transactions USD 0.08 58.16
EUR / INR Highly Probable Forecast Transactions EUR 0.16 2.60
EUR / USD Highly Probable Forecast Transactions EUR Nil 0.45
USD / INR External Commercial Borrowing USD 46.00 71.00
Currency OptionContracts
USD / INR Foreign Currency Acceptances USD 88.12 Nil
USD / INR External Commercial Borrowing USD 93.00 78.00
Swaps
Full Currency Swap(exchange rate/interest rate) USD / INR External Commercial Borrowing USD 121.00 76.00
Cross Currency Swap USD / JPY External Commercial Borrowing USD 475.00 475.00
Coupon only Swap External Commercial Borrowing USD 15.00 Nil
(b) The year end foreign currency exposures that have not been hedged by a derivative instrument or otherwiseare as under:
(i) Export receivables ` 7.12 crores (USD 1.40 million) (previous year ` 7.58 crores (USD 1.7 million)).
(ii) Accounts payable ` 49.04 crores (USD 9.64 million) (previous year ` 46.87 crores (USD 10.51 million)).
(iii) Liability arising out of cross currency swap ` 1,399.06 crores (USD 275 million) (previous year` 1,226.36 crores (USD 275 million)).

106
Seventy Third Annual Report 2011-12
Tata Chemicals Limited
CHEMICALS
Notes forming part of the Financial Statements (Contd.)(vii) Contingent Liabilities and commitments (to the extent not provided for)
(i) Contingent Liabilities :
(a) Guarantees:
(i) Bank Guarantees issued by Banks on behalf of the Company ` 163.39 crores (previous year` 193.96 crores). These are covered by the charge created in favour of the Company’s bankersby way of hypothecation of stocks and debtors.
(ii) Guarantees provided to third parties on behalf of subsidiaries USD 138.30 million(` 703.60 crores) (previous year USD 138.30 million (` 616.75 crores)).
(b) Claims not acknowledged by the Company relating to cases contested by the Company andwhich, in the opinion of the Management, are not likely devolve on the Company relating to thefollowing areas :
(` in crores)
As at As at2011-12 2010-11
(i) Excise and Customs 4.21 73.92(ii) Sales Tax 89.11 81.06(iii) Demand for utility charges 56.86 56.83(iv) Labour and other claims against the Company
not acknowledged as debt 1.89 1.94(v) Income Tax (Pending before Appellate authorities
in respect of which the Company is in appeal) 186.72 239.23(vi) Income Tax (Decided in Company’s favour by Appellate
authorities and Department is in further appeal) 37.33 37.33
(c) Various claims pending before Industrial Tribunals and Labour Courts of which amounts areindeterminate.
(ii) Commitments:
(a) Estimated amount of contracts remaining to be executed on capital account and not provided for` 59.67 crores (previous year ` 141.87 crores).
(b) Capital commitment towards investment in joint ventures ` 42 crores (previous year` 72 crores).
(c) For commitments related to leases and derivatives refer note 28 (viii) and 28 (vi) respectively.
(viii) Operating Leases :
As a lessee(a) General description of significant leasing arrangements :
The payments made by the Company as lessee in accordance with operational leasing contractsor rental agreements are expensed proportionally during the lease or rental period respectively.The Company has entered into operating lease arrangement for storage tank from a vendor. Theleases are non cancellable and are for the period 15 years and may be renewed for a furtherperiod of 10 years based on mutual agreements of the parties.
(` in crores)
As at As at2011-12 2010-11
(b) Total of minimum lease payments 101.74 117.01The total of future minimum lease payments undernon-cancellable operating leases for a period :Not later than one year 15.73 15.28Later than one year and not later than five years 67.77 65.79Later than five years 18.24 35.95
(c) Lease payments recognised in the Statement of Profit andLoss for the year 16.85 16.35
(d) The lease deposit of ` 25 crores (previous year ` 25 crores) for plant and machinery remainingwith the lessors is provided over the useful life of the asset and consequently a net amount of `2.20 crores (previous year ` 2.17 crores) has been charged to the Statement of Profit and Loss onthe principle of matching of revenue and costs.

107
Notes forming part of the Financial Statements (Contd.)(ix) Borrowing Costs Capitalised
(` in crores)
Particulars As at As at2011-12 2010-11
Borrowing costs capitalised during the year- as fixed assets/ intangible assets/ capital work in progress 1.41 -
(x) Details of unutilised amounts out of issue of securities for the specific purpose.
During 2010-11, the Company has issued equity shares to Tata Sons Limited amounting to ` 363.40crores to fund Company’s various growth projects. As at 31st March, 2012, this balance of ` 363.40crores (31st March, 2011 ` 363.40 crores) is pending utilisation for the specified activities and thisunutilised amount has been kept invested in bank fixed deposits / money market mutual funds, pendingfinal utilisation.
(xi) Sales of Products comprises of:(` in crores)
2011-12 2010-11
Manufactured Goods :
Soda Ash 1,121.08 974.95
Sodium Bicarbonate 138.93 119.97
Caustic Soda 14.41 10.41
Liquid Chlorine 0.17 0.94
Hydrochloric Acid 0.08 0.29
Bromine 24.33 16.46
Vacuum Salt # 731.88 596.40
Pure Salt 0.14 2.30
Gypsum 14.24 13.78
Cement 175.53 153.59
Clinker 4.15 0.55
Customised Fertiliser 71.97 -
Urea 1,398.07 1,187.38
Sodium Tripolyphosphate (STPP) 0.47 56.75
Diammonium Phosphate (DAP) 956.56 546.44
Nitrogen Phosphate Potash (NPK) 1,000.67 847.01
Single Super Phosphate 123.06 107.41
Sulphuric Acid 63.12 36.71
Phosphoric Acid 0.06 0.03
Total - Sale of Manufactured goods 5,838.92 4,671.37
Traded Goods :
Solar Evaporated Salt I shakti 151.15 143.21
Diammonium Phosphate (DAP) 1,041.09 745.91
Muriate of Potash (MOP) 451.69 445.72
Soda Ash 10.13 3.37
Bicarb trading 0.60 0.10
Fertiliser 497.05 145.53
Others 80.94 196.94
Total - Sale of Traded goods 2,232.64 1,680.77
Total Sales 8,071.56 6,352.14
# Sales of Vacuum Salt includes free issues under sales promotion schemes.

108
Seventy Third Annual Report 2011-12
Tata Chemicals Limited
CHEMICALS
Notes forming part of the Financial Statements (Contd.)(xii) Closing Stocks of Finished Goods and Work in Process comprises:
(` in crores)
Finished Goods Work in Process
As at As at As at As at31-Mar-12 31-Mar-11 31-Mar-12 31-Mar-11
Soda Ash 10.78 22.82 1.32 3.29Sodium Bicarbonate 1.57 2.24 - -Liquid Chlorine - 0.01 - -Bromine 0.06 0.06 - -Vacuum Salt 22.80 16.85 - -Pure Salt - 0.06 - -Clinker - - 14.79 3.98Gypsum 1.26 0.23 - -Cement 0.58 0.54 0.72 0.91Ammonia - - 3.76 1.68Urea 46.15 13.05 - 4.50Customised Fertiliser 21.29 7.09 - 3.32Sodium Tripolyphosphate (STPP) - 0.12 - 0.06Diammonium Phosphate (DAP) 0.26 5.89 - 0.14Nitrogen Phosphate Potash (NPK) 0.24 11.40 - -Single Super Phosphate 0.22 0.07 8.65 4.16Sulphuric Acid 1.18 1.55 - -Phosphoric Acid 0.52 2.09 - -Sulphonic Acid 0.03 0.03 - -Others 1.11 6.74 1.55 1.21Traded Goods :Solar Evaporated Salt I Shakti 12.35 9.80 - -Other Complex Fertilisers - 29.10 - -Diammonium Phosphate (DAP) 259.70 - - -Muriate of Potash (MOP) 109.85 33.90 - -Other - Trading 75.52 - - -
565.47 163.64 30.79 23.25
(xiii) Raw Materials consumed comprises:(inclusive of materials produced and captively consumed)
(` in crores)
2011-12 2010-11
Limestone 132.47 115.40Liquid Ammonia 8.73 5.21Salt 35.85 26.20Coke 88.50 94.76Anthracite Coal 64.88 41.82Natural Gas 411.13 369.45Regasified Liquefied Natural Gas (RLNG) 204.31 129.36Customised Fertiliser 54.04 -Phosphoric Acid 942.89 671.64Ammonia 279.81 189.11Muriate of Potash (MOP) 292.61 282.98Rock 106.76 91.02Sulphur 73.65 52.94Soda Ash 1.60 9.66Neem Oil 2.90 1.07Other Raw Materials 164.78 118.24
2,864.91 2,198.87

109
Notes forming part of the Financial Statements (Contd.)(xiv) Value of Imports (C.I.F. Value) :
(` in crores)
2011-12 2010-11
(a) Raw Materials, fuel and traded products 3,801.49 2,529.61
(b) Stores, components and spare parts 14.16 9.31
(c) Capital goods 87.46 40.11
3,903.11 2,579.03(xv) Expenditure in Foreign Currencies :
(` in crores)
2011-12 2010-11
(a) Technical know how fees @ 3.69 15.84
(b) Interest # 140.72 124.94
(c) Payments on other accounts # 6.29 6.02
150.70 146.80
@ Expenditure ` 0.35 crores (previous year ` 6.55 crores) at gross of TDS and ` 3.34 crores (previousyear ` 9.29 crores) net of TDS for the year 2011-12.
# Expenditure at gross of TDS for the year 2011-12 and 2010-11.
(xvi) Remittances in Foreign Currencies for Dividends :
The Company has remitted during the year ` 39.05 crores (previous year ` 29.85 crores) in foreigncurrencies on account of dividends and does not have information as to the extent to which otherremittances, if any, in foreign currencies on account of dividends have been made by / on behalf ofnon-resident shareholders.
2011-12 2010-11
(a) Number of Non-Resident Shareholders 2,650 2,447
(b) Number of Ordinary Shares held by them 3,90,50,165 3,31,64,110
(c) Gross amount of dividend (` in crores) 39.05 29.85
(d) Year ended to which the dividend related March-2011 March-2010
(` in crores)
(xvii) Earnings in Foreign Exchange : 2011-12 2010-11
(a) Export of goods on F.O.B. basis 56.03 41.73(b) Interest - 0.47(c) Miscellaneous Income 1.77 -(d) Dividend 100.28 10.98
158.08 53.18
(xviii) Value of imported and indigenous raw materials, stores, components and spare parts consumed:
2011-12 2011-12 2010-11 2010-11
Raw Materials Stores, Raw Materials Stores,Components Components
and Spare Parts and Spare Parts
` in crores % ` in crores % ` in crores % ` in crores %
(a) Imported 1,872.88 65.37 5.50 7.33 1,412.20 64.73 6.29 10.77
(b) Indigenous # 992.03 34.63 69.62 92.67 786.67 35.27 52.14 89.23
2,864.91 100.00 75.12 100.00 2,198.87 100.00 58.43 100.00
# Includes ` 15.43 crores (previous year ` 12.03 crores) pertaining to wages, salaries and other revenueaccounts.

110
Seventy Third Annual Report 2011-12
Tata Chemicals Limited
CHEMICALS
Notes forming part of the Financial Statements (Contd.)(xix) Scheme of Arrangement between erstwhile Wyoming 1 (Mauritius) Pvt. Ltd., a wholly owned
subsidiary of the Company, with the Company :
(a) The Scheme of Arrangement between erstwhile Wyoming 1 (Mauritius) Pvt. Ltd. (Wyoming 1), awholly owned subsidiary of the Company, with the Company was approved by the HonourableHigh Court of Mumbai, vide its order dated 4th May, 2012. The certified copy of the said HighCourt order has been received and filed with the Registrar of Companies, Mumbai and the saidScheme became effective on 23rd May, 2012.
(b) Accordingly, the Scheme has been given effect in the accounts and assets and liabilities andreserves of Wyoming 1, at their respective book value are appearing in the audited financialstatements as at 31st December, 2011, have been transferred to and vested in the Company,along with profit for the period from 1st January, 2012 to 31st March, 2012 recognised in theStatement of Profit and Loss for the year ended 31st March, 2012. (the appointment date “date ofthe Scheme being 1st January, 2012”)
(c) The summarised Statement of Profit and Loss relating to Wyoming 1 operations for the periodfrom 1st January to 31st March is as under.
Statement of Profit and Loss for the period 1st January, 2012 to 31st March, 2012
Particulars (` in crores)
REVENUE -
EXPENDITURE
Audit Fees 0.01
Administration Expenses 0.01
Other expenses 0.01
Total expenses 0.03
Profit before Tax (0.03)
Tax Expense -
Profit (loss) for the period (0.03)
(d) The amalgamation has been accounted for under the “Pooling of interest” method as prescribedby Accounting Standard -14 “Accounting for Amalgamation” as notified under the Companies(Accounting Standards) Rules, 2006, (as amended) and the relevant provisions of the CompaniesAct, 1956.
Particulars (` in crores)
Investment 2,975.05Current Assets, Loans and advances
Cash and Bank Balances 0.63Loans and Advances 0.02
Total Assets 2,975.70
Reserves 0.10Current Liabilities and Provisions 0.16
Total Liabilities 0.26
Net Assets 2,975.44Less : Cancellation of investment in subsidiary (2,975.44)
-
(e ) As Wyoming 1 is a wholly owned subsidiary of the Company, no shares of the Company has beenissued and allotted in lieu or exchange of the equity shares of Wyoming 1 under the Scheme.720,240,000 equity shares of the Wyoming 1 held by the company stands cancelled.
(f ) In view of the aforesaid amalgamation, the figures for the current year are not comparable tothose of the previous year.

111
Notes forming part of the Financial Statements (Contd.)(xx) For the year ended 31st March, 2012, the Company has not recognised subsidy income of ` 44.91
crores on Opening stock as at 1st April, 2011 of Raw Materials for Phosphatic & Potassic Fertilisers, inaccordance with the Office Memorandum dated 11th July, 2011 issued by the Department of Fertilisers(DOF) which provides for the Subsidy on such Opening Stocks at old rates applicable to F.Y. 2010-11.
Based on the legal opinion made available, the said Office Memorandum is being represented against/ contested. Had the Company recognised the subsidy income from sales made from such OpeningStocks as per the prevalent Nutrient Based Subsidy (NBS) policy without giving effect to the said OfficeMemorandum, the Sales / Income from operations and Net Profit After Tax would have been higher by` 44.91 crores and ` 33.64 crores respectively for the year ended 31st March, 2012.
(xxi) Asterisk (*) denotes figures below ` 50,000.
(xxii) During the year ended 31st March, 2012, the Revised Schedule VI notified under the Companies Act1956, has become applicable to the company, for preparation and presentation of financial statements,hence financial statements have been prepared as per notified Schedule VI. This has significantlyimpacted the disclosure and presentation made in the Financial statements. previous year figures havebeen regrouped/reclassified wherever necessary to correspond with the year’s classification/disclosure.
Signatures to Notes ‘1’ to ‘28’
For and on behalf of the Board
Ratan N. Tata ChairmanR. Gopalakrishnan Vice-ChairmanNusli N. WadiaPrasad R. MenonNasser MunjeeDr. Yoginder Alagh DirectorsDr. Y. S. P. ThoratEknath A. Kshirsagar
Rajiv Chandan R. Mukundan Managing DirectorMumbai, 30th May, 2012. General Counsel & Company Secretary P. K. Ghose Executive Director & CFO
}

112
Seventy Third Annual Report 2011-12
Tata Chemicals Limited
CHEMICALS
For the year ended 31st March, 2012Summary of Financial Information of Subsidiary Companies under Section 212 (` in crores)
Sr. Name of the Subsidiary Country of Reporting Share Reserves Total Total Invest- Turnover Profit Before Provision Profit After Proposed No. Company Incorporation Currency Capital Assets Liabilities ments Taxation for Taxation Taxation Dividend
1 Homefield International Pvt. Limited Mauritius USD 560.73 117.66 678.98 0.59 668.17 - 2.54 0.49 2.05 -
2 Tata Chemicals Asia Pacific Pte. Limited Singapore SGD 69.17 (0.32) 68.88 0.03 68.81 - (0.11) 0.00 (0.11) -
3 Homefield Pvt. UK Limited United Kingdom GBP 422.04 (99.24) 1,075.94 753.13 1,075.33 - (28.36) 0.22 (28.58) -
4 Homefield 2 UK Limited United Kingdom GBP 81.46 761.77 843.23 - 843.23 - - - - -
5 Tata Chemicals (Europe) Holding Limited United Kingdom GBP 81.46 237.35 1,744.23 1,425.42 1,715.17 - (80.00) - (80.00) -
6 Brunner Mond Group Limited United Kingdom GBP 518.21 526.73 1,044.94 - 598.86 - 29.92 - 29.92 -
7 Tata Chemicals Europe Limited United Kingdom GBP 138.80 134.80 1,094.42 820.82 - 1,233.93 55.25 23.94 31.31 -
8 Brunner Mond Limited United Kingdom GBP - - - - - - - - - -
9 Tata Chemicals Magadi Limited United Kingdom USD 9.16 128.46 756.56 618.95 - 600.38 (3.41) 45.99 (49.40) -
10 Tata Chemicals South Africa Pty Limited South Africa ZAR * 26.64 44.62 17.98 - 89.02 5.85 1.62 4.23 -
11 Northwich Resource ManagementLimited United Kingdom GBP * - * - - - - - - -
12 Brunner Mond Generation CompanyLimited United Kingdom GBP * - * - - - - - - -
13 Tata Chemicals Africa Holding Limited United Kingdom GBP 32.14 8.76 40.91 - 37.30 - - - - -
14 Magadi Railway Company Limited Kenya USD 0.01 - 0.01 - - - - - - -
15 Brunner Mond B.V. Netherlands EUR 0.14 (293.63) 0.74 294.23 0.56 - 3.27 - 3.27 -
16 Gusiute Holdings (UK) Limited United Kingdom USD 3,477.49 496.11 4,050.44 76.84 4,049.24 - 496.23 - 496.23 -
17 Valley Holdings Inc. United States of USD * 4,316.49 4,308.06 (8.43) - - (7.95) 1.68 (6.26) 528.61America
18 Tata Chemicals North America Inc. United States of USD * (875.95) 1,291.73 2,167.67 - 48.21 (155.40) (55.30) (210.70) -America
19 General Chemical International Inc. United States of USD - 0.01 0.01 - - - - - - -America
20 NHO Canada Holdings Inc. United States of USD - * * - - - - - - -America
21 Tata Chemicals (Soda Ash) Partners United States of USD - 1,126.14 1,774.09 674.45 26.51 2,457.95 667.04 - 667.04 -America
22 General Chemical (Great Britain) Limited United Kingdom GBP - 0.99 0.99 - - - - - - -
23 General Chemical Canada Holding Inc. Canada CAD - - - - - - - - - -
24 GCSAP Canada Inc Canada CAD - - - - - - - - - -
25 TCSAP Holdings United States of USD - (576.86) (571.37) 5.49 - - (0.41) - (0.41) -America
26 TCSAP LLC United States of USD - (15.62) (15.62) - - - - - - -America
27 Bio Energy Venture - 1 ( Mauritius) Mauritius USD 4,444.27 (20.09) 4,424.63 0.45 4,023.40 - (18.77) (0.64) (19.42) -Pvt. Ltd.
28 Grown Energy Zambeze Holdings Mauritius USD 48.96 (29.96) 20.49 1.50 19.33 - (29.67) - (29.67) -Pvt. Ltd.
29 Grown Energy (Proprietary) Limited South Africa ZAR * (*) * - * - - - - -
30 Grown Energy Zambeze Limitada Mozambique MZN * (15.36) 31.70 47.06 - - (2.60) - (2.60) -
31 Rallis India Limited India INR 19.45 543.21 1,029.04 466.38 180.94 1,151.94 150.09 (48.70) 198.79 42.78
32 Rallis Chemistry Exports Limited India INR 0.05 (0.12) 0.12 0.19 - - (0.04) - (0.04) -
33 Metahelix Life Sciences Ltd # India INR 0.11 58.93 62.60 3.56 - 10.30 3.23 - 3.23 -
34 Dhaanya Seeds Ltd # India INR 2.57 (1.72) 92.93 92.08 - 98.17 1.20 - 1.20 -
35 British Salt Limited United Kingdom GBP - 131.19 729.63 598.44 6.83 471.17 131.78 0.95 130.83 -
36 Cheshire Salt Holdings Limited United Kingdom GBP 1.14 (1.12) 0.02 - - - (0.01) - (0.01) -
37 Cheshire Salt Limited United Kingdom GBP - 153.31 599.38 446.07 - - 0.26 2.48 (2.22) -
38 Brinefield Storage Limited United Kingdom GBP 0.01 (0.06) - (0.05) - - - - - -
39 Broomco (4118) Limited United Kingdom GBP * - * - - - - - - -
40 Broomco (4119) Limited United Kingdom GBP * - * - - - - - - -
41 Broomco (4120) Limited United Kingdom GBP * - * - - - - - - -
42 Cheshire Cavity Storage 2 Limited United Kingdom GBP * - * - - - - - - -
43 Cheshire Compressor Limited United Kingdom GBP * - * - - - - - - -
44 Irish Feeds Limited United Kingdom GBP 0.14 5.06 6.23 1.03 - 25.86 1.38 (0.11) 1.48 -
45 New Cheshire Salt Works Limited United Kingdom GBP 6.21 8.26 14.47 - - - 0.88 (0.07) 0.95 -
Note :1. The financial statements of subsidiaries are converted into Indian Rupees on the basis of exchange rate as at closing day of the financial year.2. # Turnover, Profit/(Loss) before taxation, Provision for Taxation and Profit/(Loss) after Tax shown above is for the period 01/04/2011 to 31/03/2012. However same is considered on a
proportionate basis for the purposes of Consolidation from the date of acquisition based on the consolidated financial statements of Metahelix Life Sciences Ltd.3. Asterisk (*) denotes figures below ` 50,000.

113
AUDITORS’ REPORTTO THE BOARD OF DIRECTORS OF
TATA CHEMICALS LIMITED
1. We have audited the attached Consolidated Balance Sheet of TATA CHEMICALS LIMITED (“the Company”), its subsidiariesand jointly controlled entities (the Company, its subsidiaries and jointly controlled entities constitute “the Group”) as at 31st
March, 2012, the Statement of Consolidated Profit and Loss and the Consolidated Cash Flow Statement of the Group for theyear ended on that date, both annexed thereto. The Consolidated Financial Statements include investments in the jointlycontrolled entities accounted in accordance with Accounting Standard 27 (Financial Reporting of Interests in Joint Ventures)and its share of loss of the associate of the Company accounted in accordance with Accounting Standard 23 (Accounting forInvestments in Associates in consolidated financial statement) as notified under the Companies (Accounting Standards)Rules, 2006. These financial statements are the responsibility of the Company’s Management and have been prepared onthe basis of the separate financial statements and other financial information regarding components. Our responsibility is toexpress an opinion on these Consolidated Financial Statements based on our audit.
2. We conducted our audit in accordance with the auditing standards generally accepted in India. Those Standards requirethat we plan and perform the audit to obtain reasonable assurance about whether the financial statements are free ofmaterial misstatements. An audit includes examining, on a test basis, evidence supporting the amounts and the disclosuresin the financial statements. An audit also includes assessing the accounting principles used and the significant estimatesmade by the Management, as well as evaluating the overall financial statement presentation. We believe that our auditprovides a reasonable basis for our opinion.
3. Without qualifying our opinion, we invite attention to Note 29(iv)(d) regarding the accounting of actuarial gains and losseson employee pension funds of overseas subsidiaries in “Reserves and Surplus” in accordance with the generally acceptedaccounting principles applicable in the country of incorporation for the reasons stated therein, as against such gains andlosses being accounted in the Statement of Consolidated Profit and Loss as per the generally accepted accounting principlesin India. Had the Group followed the practice of recognising such gains and losses in the Statement of Consolidated Profitand Loss, the consolidated net profit before tax and consolidated net profit after tax after the minority interest of the Groupfor year ended 31st March, 2012 would have been lower by ` 180.18 crores and ` 157.16 crores respectively.
4. We did not audit the financial statements of certain subsidiaries and joint ventures, whose financial statements reflect totalassets of ` 4,155.27 crores as at 31st March, 2012, total revenues of ` 2,410.22 crores and net cash outflow amounting to` 100.32 crores for the year ended on that date as considered in the Consolidated Financial Statements. The ConsolidatedFinancial Statement also includes the Group’s share of net loss of ` 2.46 crores of one entity accounted as an associate in thecurrent year and not audited by us. These financial statements have been audited by other auditors whose reports havebeen furnished to us and our opinion, in so far as it relates to the amounts included in respect of these subsidiaries, jointventures and associate is based solely on the reports of the other auditors.
5. We report that the Consolidated Financial Statements have been prepared by the Company in accordance with therequirements of Accounting Standard 21 (Consolidated Financial Statements), Accounting Standard 23 (Accounting forInvestments in Associates in consolidated financial statement) and Accounting Standard 27 (Financial Reporting of Interestsin Joint Ventures) as notified under the Companies (Accounting Standards) Rules, 2006.
6. Based on our audit and on consideration of the separate audit reports on financial statements of the Company, its aforesaidsubsidiaries, joint ventures and an associate and to the best of our information and according to the explanations given tous, in our opinion read with our comments in paragraph 3 above, the Consolidated Financial Statements give a true and fairview in conformity with the accounting principles generally accepted in India:
(i) in the case of the Consolidated Balance Sheet, of the state of affairs of the Group as at 31st March, 2012;(ii) in the case of the Statement of Consolidated Profit and Loss, of the profit of the Group for the year ended on that date
and(iii) in the case of the Consolidated Cash Flow Statement, of the cash flows of the Group for the year ended on that date.
For DELOITTE HASKINS & SELLS
Chartered Accountants (Registration No.117366W)
B. P. Shroff
(Partner)
(Membership No. 34382)
MUMBAI, 30th May, 2012

Seventy Third Annual Report 2011-12
Tata Chemicals Limited
CHEMICALS
114
Consolidated Balance Sheet as at 31st March, 2012As at
31-Mar-11Note ` in crores ` in crores ` in crores
I. EQUITY AND LIABILITIES1. Shareholders’ Funds
(a) Share Capital ....................................................... 3 254.82 254.82(b) Reserves and Surplus ...................................... 4 6,163.17 5,196.87
6,417.99 5,451.692. Minority Interest 448.09 406.453. Non-Current Liabilities
(a) Long-Term Borrowings ................................... 5 5,484.54 4,916.29(b) Deferred Tax Liabilities (net) ........................ 6 101.80 218.29(c) Other Long Term Liabilities .......................... 7 365.14 324.10(d) Long-Term Provisions ...................................... 8 1,047.15 864.52
6,998.63 6,323.204. Current Liabilities
(a) Short-Term Borrowings .................................. 9 461.59 198.49(b) Trade Payables .................................................... 10 2,664.07 1,737.88(c) Other Current Liabilities ................................. 11 1,630.27 1,057.38(d) Short-Term Provisions ..................................... 12 496.75 455.90
5,252.68 3,449.65
TOTAL 19,117.39 15,630.99
II. ASSETS1. Non-Current Assets
(a) Fixed Assets ......................................................... 13(i) Tangible Assets ......................................... 4,374.74 3,756.12(ii) Intangible Assets ..................................... 19.71 25.29(iii) Capital Work-in-Progress ...................... 524.23 639.22(iv) Intangible Assets held under
development ............................................. 24.96 11.80
4,943.64 4,432.43(b) Goodwill on Consolidation ........................... 6,358.74 5,632.42(c) Non-Current Investments .............................. 14 606.39 447.40(d) Deferred Tax Assets (net) ............................... 6 134.31 163.47(e) Long-Term Loans And Advances ................ 15 368.37 310.73(f ) Other Non-Current Assets ............................. 16 200.65 275.01
12,612.10 11,261.462. Current Assets
(a) Current Investments ........................................ 17 3.27 0.50(b) Inventories ............................................................ 18 1,863.24 1,145.59(c) Trade Receivables ............................................. 19 2,310.68 1,362.37(d) Cash and Cash Equivalents ........................... 20 1,678.03 1,345.04(e) Short-Term Loans and Advances ............... 21 487.17 416.32(f ) Other Current Assets ....................................... 22 162.90 99.71
6,505.29 4,369.53
TOTAL 19,117.39 15,630.99
Notes forming part of Consolidated Financial Statements 1 - 29In terms of our report attached For and on behalf of the Board
For DELOITTE HASKINS & SELLS Ratan N. Tata ChairmanChartered Accountants R. Gopalakrishnan Vice-Chairman
Nusli N. WadiaPrasad R. Menon
B. P. Shroff Nasser Munjee DirectorsPartner Dr. Yoginder Alagh
Dr. Y. S. P. ThoratEknath A. Kshirsagar
Rajiv Chandan R. Mukundan Managing DirectorMumbai, 30th May, 2012 General Counsel & Company Secretary P. K. Ghose Executive Director & CFO
}

115
Statement of Consolidated Profit and Loss for the year ended 31st March, 2012Previous
yearNote ` in crores ` in crores ` in crores
I. REVENUE
(a) Revenue From Operations (gross) ....................... 23 14,045.25 11,268.36
(b) Less : Excise Duty ........................................................ 239.19 207.78
(c) Net Revenue From Operations ............................. 13,806.06 11,060.58
II. Other Income .......................................................................... 24 167.81 95.76
III. Total Revenue .......................................................... 13,973.87 11,156.34
IV. EXPENSES
(a) Cost of Materials Consumed .................................. 3,844.09 3,050.07
(b) Purchases of Stock-in-Trade ................................... 2,299.80 1,448.84
(c) Changes in Inventories of Work-In-Progress,Finished Goods and Stock-in-Trade .................... (490.60) (46.64)
(d) Employee Benefits Expense ................................... 25 971.01 819.71
(e) Finance Costs (net) ..................................................... 26 427.00 350.83
(f ) Depreciation and Amortisation Expense ......... 508.68 451.05
(g) Other Expenses ............................................................ 27 4,878.10 3,934.88
12,438.08 10,008.74
(h) Less : Expenditure transferred to Capital Account - 10.22
Total Expenses ......................................................... 12,438.08 9,998.52
V. Profit Before Exceptional Items and Tax (III-IV) 1,535.79 1,157.82
VI. Exceptional Items .................................................... 28 152.36 36.86
VII. Profit Before Tax (V-VI) .......................................... 1,383.43 1,120.96
VIII. Tax Expense
(a) Current Tax ..................................................................... 326.30 299.71
(b) Deferred Tax .................................................................. 17.62 (24.79)
343.92 274.92
IX. Profit After Tax Before Minority Interest (VII-VIII) 1,039.51 846.04X. Share of Loss in Associate ..................................... 2.46 -XI. Minority Interest ..................................................... 199.46 192.57
XII. Profit for the year (IX-X-XI) .................................... 837.59 653.47
XIII. EARNINGS PER SHARE (`)
(Face value per share - ` 10)
(a) Basic .................................................................................. 32.88 26.10
(b) Diluted ............................................................................. 32.88 26.10
Notes forming part of Consolidated Financial Statements 1 - 29
In terms of our report attached For and on behalf of the Board
For DELOITTE HASKINS & SELLS Ratan N. Tata ChairmanChartered Accountants R. Gopalakrishnan Vice-Chairman
Nusli N. WadiaPrasad R. Menon
B. P. Shroff Nasser Munjee DirectorsPartner Dr. Yoginder Alagh
Dr. Y. S. P. ThoratEknath A. Kshirsagar
Rajiv Chandan R. Mukundan Managing DirectorMumbai, 30th May, 2012 General Counsel & Company Secretary P. K. Ghose Executive Director & CFO
}

Seventy Third Annual Report 2011-12
Tata Chemicals Limited
CHEMICALS
116
Consolidated Cash Flow Statement for the year ended 31st March, 2012
Previous year` in crores ` in crores
A Cash Flow from Operating Activities
Profit before Tax ............................................................................................. 1,383.43 1,120.96
Adjustments for :
Depreciation and amortisation ............................................................... 508.68 451.05
Impairment of assets .................................................................................... 48.45 10.08
Finance costs ................................................................................................... 427.00 350.83
Interest income ............................................................................................... (36.57) (14.50)
Amortisation of capital grant ................................................................... - (4.32)
Dividend income ............................................................................................ (79.83) (64.25)
(Profit) / loss on sale of investments (net) .......................................... (51.41) (17.01)
Provision for doubtful debts and advances/(writen back) .......... 0.97 (0.19)
Liability no longer required written back ........................................... (11.66) (31.78)
Provision for diminution in value of current investments ........... - (0.25)
Unrealised foreign exchange loss/(gain)(net) ................................... 135.67 (29.09)
Loss on assets sold or discarded (net) ................................................. 25.94 9.31
Operating Profit before Working Capital Changes ............... 2,350.67 1,780.84
Adjustments for :
Trade and other assets ................................................................................ (1,072.21) (581.41)
Inventories ........................................................................................................ (717.65) (152.13)
Trade payables, other liabilities and provisions ............................... 964.23 337.33
Employee separation compensation .................................................... (0.51) (0.56)
Cash generated from Operations ............................................ 1,524.53 1,384.07
Taxes paid (net of refund) .......................................................................... (280.64) (427.05)
Net Cash generated from Operating Activities ..................... 1,243.89 957.02
B Cash Flow from Investing Activities
Acquisition of fixed assets (including Capital Work-in-Progress) (794.82) (619.55)
Proceeds on sale of fixed assets ............................................................. 33.79 26.39
Consideration paid on acquisition/investment in subsidiary .... (3.97) (814.86)
Proceeds from sale of other long term investments ..................... 99.31 3.53
Proceeds on sale of current investments ............................................ 6,552.18 11,024.67
Purchase of long term investments ...................................................... (58.17) (95.25)
Purchase of current investments ............................................................ (6,549.42) (10,805.98)
Investment in associate .............................................................................. (188.58) -
Interest received ............................................................................................. 35.13 15.96
Dividend received ......................................................................................... 79.83 64.25
Net Cash used in Investing Activities ..................................... (794.72) (1,200.84)

117
C Cash Flow from Financing Activities
Proceeds of borrowings .............................................................................. 2,801.15 1,481.17
Proceeds from Issue of Shares ................................................................. - 363.41
Repayment of borrowings ......................................................................... (2,019.72) (817.82)
Finance costs paid ......................................................................................... (480.00) (273.93)
Dividends paid including distribution tax .......................................... (496.70) (391.81)
Net Cash generated from / (used in) Financing Activities ... (195.27) 361.02
Net Increase in Cash and Cash equivalents ....................................... 253.90 117.20
Cash and Cash equivalents as at 1st April .......................................... 1,345.04 1,158.90
(Opening Balance)
Add: Cash and bank balance taken over on acquisition .............. 0.17 56.71
Exchange difference on translation of foreign currencycash and cash equivalents ......................................................................... 78.92 12.23
Cash and Cash equivalents as at 31st March .................................... 1,678.03 1,345.04(Closing Balance)
Notes :(a) Cash and cash equivalents include unclaimed dividend of ` 9.95 crores (previous year ` 9.28 crores).(b) Previous year’s figures have been regrouped / reclassified wherever necessary to make them comparable with
the current year’s figures.
In terms of our report attached For and on behalf of the Board
For DELOITTE HASKINS & SELLS Ratan N. Tata ChairmanChartered Accountants R. Gopalakrishnan Vice-Chairman
Nusli N. WadiaPrasad R. Menon
B. P. Shroff Nasser Munjee DirectorsPartner Dr. Yoginder Alagh
Dr. Y. S. P. ThoratEknath A. Kshirsagar
Rajiv Chandan R. Mukundan Managing DirectorMumbai, 30th May, 2012 General Counsel & Company Secretary P. K. Ghose Executive Director & CFO
Consolidated Cash Flow Statement for the year ended 31st March, 2012
Previous year` in crores ` in crores
}

Seventy Third Annual Report 2011-12
Tata Chemicals Limited
CHEMICALS
118
Notes forming part of Consolidated Financial Statement
Note 1: Basis of Consolidation
The consolidated financial statements relate to Tata Chemicals Limited (the Company), its subsidiary companies, jointventures and an associate. The Company, its subsidiaries and joint ventures constitute the Group.
(a) Basis of Accounting :
I The financial statements of the subsidiary companies and Joint ventures used in the consolidation aredrawn upto the same reporting date as of the Company, i.e. for the year ended 31st March, 2012.
II The financial statements of the Group have been prepared in accordance with the applicable AccountingStandards in India and other generally accepted accounting principles. The company has prepared thesefinancial statements to comply in all material respects with the accounting standards notified under theCompanies (Accounting Standards) Rules, 2006, (as amended) and the relevant provisions of the CompaniesAct, 1956.
(b) Principles of Consolidation:
The consolidated financial statements have been prepared on the following basis:
I The financial statements of the Company and its subsidiary companies have been consolidated on a line-by- line basis by adding together the book values of like items of assets, liabilities, income and expenses,after fully eliminating intra-group balances and intra-group transactions and resulting unrealised profit asper the applicable Accounting Standard in India.
II Interests in joint ventures have been accounted by using the proportionate consolidation method as perthe applicable Accounting Standard in India. The intra - group balances and intra - group transactions andunrealised profits are eliminated to the extent of the Group proportionate share.
III The consolidated financial statements include the share of profit / loss of the associate company which hasbeen accounted as per the ‘Equity method’, and accordingly, the share of profit / loss of the an associatecompany (the loss being restricted to the cost of investment) has been added to / deducted from the costof investments. An associate is an enterprise in which the Company has significant influence and which isneither a Subsidiary nor a joint venture of the investor.
IV The excess of the cost to the Company of its investment in subsidiaries and joint ventures over the Company’sportion of equity as at the dates on which the investments in subsidiary companies and joint ventures aremade is recognised in the financial statements as “Goodwill on Consolidation”.
V The consolidated financial statements are presented, to the extent possible, in the same format as thatadopted by the Company for its separate financial statements. Differences if any, in accounting policies havebeen disclosed separately.
VI The operations of the Company’s subsidiaries and joint ventures are considered as non-integral operationsfor the purpose of consolidation.
VII Minority interest in the net assets of subsidiaries consists of:
a) The amount of equity attributable to minority at the date on which the investment in the subsidiary ismade.
b) The minority’s share of movements in equity since the date the parent - subsidiary relationship comesinto existence.
Minority interest in share of net result for the year is identified and adjusted against the profit after tax.Excess of loss, if any, attributable to the minority over and above the minority interest in the equity of thesusbidiaries is absorbed by the Group.

119
(c) Particulars of subsidiaries and joint ventures :
Name of the Company Country of Incorporation Percentage of Voting poweras at 31st March, 2012
Subsidiaries
Rallis India Limited* India 50.06%
Rallis Chemistry Exports Limited India 100% subsidiary of Rallis
Metahelix Life Sciences Ltd India 75.64% subsidiary of Rallis
Dhaanya Seeds Ltd India 100% subsidiary of Metahelix
Valley Holdings Inc. United States of America 100%
Tata Chemicals North America Inc. United States of America 100%
General Chemical International Inc. United States of America 100%
NHO Canada Holdings Inc. United States of America 100%
Tata Chemicals (Soda Ash) Partners (TCSAP)** United States of America 75%
TCSAP Holdings** United States of America 75%
TCSAP LLC United States of America 75%
General Chemical Canada Holding Inc. Canada 100%
GCSAP Canada Inc. Canada 75%
Homefield Pvt. UK Limited United Kingdom 100%
Homefield 2 UK Limited United Kingdom 100%
Tata Chemicals Africa Holdings Limited United Kingdom 100%
Tata Chemicals (Europe) Holdings Limited United Kingdom 100%
Tata chemicals Europe Limited United Kingdom 100%
Brunner Mond Group Limited United Kingdom 100%
Brunner Mond Limited United Kingdom 100%
Tata Chemicals Magadi Limited United Kingdom 100%
Northwich Resource Management Limited United Kingdom 100%
Brunner Mond Generation Company Limited United Kingdom 100%
Gusiute Holdings (UK) Limited United Kingdom 100%
General Chemical (Great Britain) Limited United Kingdom 100%
British Salt Limited United Kingdom 100%
Cheshire Salt Holdings Limited United Kingdom 100%
Cheshire Salt Limited United Kingdom 100%
Brinefield Storage Limited United Kingdom 100%
Broomco (4118) Limited United Kingdom 100%
Broomco (4119) Limited United Kingdom 100%
Broomco (4120) Limited United Kingdom 100%
Notes forming part of Consolidated Financial Statement (Contd.)

Seventy Third Annual Report 2011-12
Tata Chemicals Limited
CHEMICALS
120
Cheshire Cavity Storage 2 Limited United Kingdom 100%
Cheshire Compressor Limited United Kingdom 100%
Irish Feeds Limited United Kingdom 100%
New Cheshire Salt Works Limited United Kingdom 100%
Brunner Mond B.V. Netherlands 100%
Homefield International Pvt. Limited Mauritius 100%
Wyoming 1 (Mauritius) Pvt. Limited*** Mauritius 100%
Bio Energy Venture - 1 ( Mauritius) Pvt. Ltd. Mauritius 100%
Grown Energy Zambeze Holdings Pvt. Ltd. Mauritius 100%
Tata Chemicals Asia Pacific Pte. Limited Singapore 100%
Tata Chemicals South Africa Pty Limited South Africa 100%
Grown Energy (Proprietary) Limited South Africa 100%
Magadi Railway Company Limited Kenya 100%
Grown Energy Zambeze Limitada Mozambique 95%
* Rallis India Limited is a listed company.
** A general partnership formed under the laws of the State of Delaware (USA)
*** Wyoming 2 (Mauritius) Pvt. Limited merged with Wyoming 1 (Mauritius) Pvt. Limited w.e.f. 4th November, 2011which inturn merged with the Company w.e.f. 1st January, 2012.
Bio Energy Venture - 2 (Mauritius) Pvt. Ltd merged with Bio Energy Venture - 1 (Mauritius) Pvt. Ltd w.e.f. 21st November,2011.
Rallis Australasia Pty. Limited had liquidated as at 31st December, 2011
General Chemicals (Soda Ash) Inc and Bayberry Management Corporation dissolved as at 11th January, 2012
Joint Ventures
Khet-Se Agriproduce India Pvt. Limited India 50.00%
Alcad United States of America 50.00%
The Block Salt Company Limited United Kingdom 50.00% holding by New CheshireSalt Works Limited
Kemex B.V. Netherlands 49.99%
Joil (S) Pte. Ltd and its subsidaries Singapore 33.78%
Indo Maroc Phosphore S. A. Morocco 33.33%
Natronx Technologies LLC* United States of America 33.3% holding by TCSAP
Associate
EPM Mining Ventures Inc.,* Canada 25.70%
* Arising out of aquisition during the year
Promoter Group
Tata Sons Limited India
(c) Particulars of subsidiaries and joint ventures :
Name of the Company Country of Incorporation Percentage of Voting poweras at 31st March, 2012
Subsidiaries
Notes forming part of Consolidated Financial Statement (Contd.)

121
Note 2: Significant Accounting Policies
(a) Basis of Accounting
The accounts of the Group are prepared under the historical cost convention using the accrual method ofaccounting.
The financial statements of the company have been prepared in accordance with generally accepted accountingprinciples in India (Indian GAAP) to comply with the Accounting Standards notified under the Companies(Accounting Standards) Rules, 2006, (as amended) and the relevant provisions of the Companies Act, 1956. Theaccounts of the Company are prepared under the historical cost convention using the accrual method ofaccounting. The accounting policies adopted in the preparation of financial statements are consistent with thoseof the previous year.
(b) Use of Estimates
The presentation of the financial statements in conformity with Indian GAAP requires the Management to makeestimates and assumptions that affect the reported amounts of assets and liabilities, revenues and expenses anddisclosure of contingent liabilities. Management believes that the estimates used in the preparation of the financialstatements are prudent and reasonable, future results could differ, the differences between the actual results andthe estimates are recognised in the period in which the results are known / materialise.
(c) Tangible and Intangible Fixed Assets
Tangible Fixed Assets are carried at original cost net of taxes / duties, credits availed if any, less depreciation andimpairment loss. The cost of fixed assets includes interest on borrowings attributable to acquisition of qualifyingfixed assets up to the date of commissioning of the assets and other incidental expenses incurred up to that date.Machinery spares whose use is expected to be irregular are capitalised and depreciated over the useful life of theprincipal item of asset. Subsequent expenditure relating to the fixed assets is capitalised only if such expenditureresults in an increase in the future benefits from such assets beyond its previously assessed standard ofperformance.
Fixed Assets acquired and put to use for projects are capitalised and depreciation thereon is included in projectcost till commissioning of the project.
Fixed Assets retired from active use and held for sale are stated at lower of their net book value and net realisablevalue and are disclosed separately in the Consolidated Balance Sheet.
Intangibles assets
Computer Software, Patents, Intellectual Property Rights (IPR), Trademarks, Licenses and other intangibles ofsimilar nature are initially recognised at cost. Intangible assets are amortised using straight line method overtheir estimated useful lives / period of contractual rights or ten years whichever is lower and are tested for anyimpairment.
(d) Capital Work-in-Progress
Projects under commissioning and other Capital Work-in-Progress are carried at cost, comprising direct cost,related incidental expenses and attributable interest.
(e) Depreciation
(i) Depreciation on fixed assets is provided at the rates determined on straight line method over the useful lifeestimated by the Management or on the basis of depreciation rates prescribed under respective domesticlaws, whichever is higher, except for mines, machinery and equipment of a subsidiary, which are depreciatedusing the units-of-production method. Approximately 6% of the net block of machinery and equipment ofthe Group (previous year 6%) and 100% of the net block of mines and quarries of the Group (previous year100%) are depreciated using the units-of-production method.
(ii) Leasehold land is amortised over the duration of the lease.
(iii) Capital assets whose ownership does not vest in the Company are depreciated over their estimated usefullife.
Notes forming part of Consolidated Financial Statement (Contd.)

Seventy Third Annual Report 2011-12
Tata Chemicals Limited
CHEMICALS
122
(f) Impairment of Tangible and Intangible Fixed Assets
The carrying values of assets / cash generating units at each Balance Sheet date are reviewed for impairment ofassets. If any indication of such impairment exists, the recoverable amount of such assets is estimated andimpairment is recognised, if the carrying amount of these assets exceeds their recoverable amount. The recoverableamount is the greater of the net selling price and their value in use. Value in use is arrived at by discounting thefuture cash flows to their present value based on an appropriate discount factor. When there is indication that animpairment loss recognised for an asset in prior accounting periods no longer exists or may have decreased, suchreversal of impairment loss is recognised in the Statement of Profit and Loss.
(g) Investments
Long term investments are carried individually at cost less provision for diminution, other than temporary, in thevalue of such investments. Current investments are carried individually, at lower of cost and fair value. Cost ofinvestments includes acquisition charges such as brokerage, fees and duties.
(h) Inventories
Inventories are valued at lower of the cost on weighted average basis (except two foreign subsidiaries and twoJVs which are on FIFO basis constituting 10% (previous year 10%) of the total inventory value) and net realisablevalue after providing for obsolescence and other losses, where considered necessary. Cost includes all charges inbringing the goods to their present location and condition, including Octroi and other levies, transit insuranceand receiving charges. Work in process and finished goods include appropriate proportion of overheads and,where applicable, excise duty. Net realisable value is the estimated selling price in the ordinary course of business,less estimated costs of completion and estimated costs necessary to make the sale.
(i) Revenue Recognition
Sales of Goods
Sales are recognised, net of returns and trade discounts, Sales Tax and Value Added Tax, on dispatch of goods tocustomers. In respect of Urea, sales are recognised based on provisional rates of group concession as notifiedunder the New Pricing Scheme. Equated freight claims and escalation claims for Urea sales are estimated by theManagement based on the norms prescribed or notified under the said Scheme. In case of complex fertilisers,sales include price concession, as notified under the Concession Scheme, or as estimated by the Managementbased on the norms prescribed.
Income from Services
Revenues from contracts priced on a time and material basis are recognised when services are rendered andrelated costs are incurred. Foreseeable losses on such contracts are recognised when probable.
(j) Other Income
Interest income is accounted on accrual basis. Dividend income is accounted for when the right to receiveincome is established.
(k) Insurance claims
Insurance claims are accounted for on the basis of claims admitted / expected to be admitted and to the extentthat there is no uncertainty in receiving the claims.
(l) Research and Development Expenses
Revenue expenditure pertaining to Research and Development is charged to the Statement of Profit and Loss.Expenditure on Tangible/Intangible fixed assets used in Research and Development is capitalised.
(m) Leases
Lease arrangements where the risks and rewards incidental to ownership of an asset substantially vest with thelessor are recognised as operating leases. Lease rentals under operating leases are recognised in the Statement ofProfit and Loss on a straight-line basis.
(n) Debenture Issues Expenses
Debenture issue expenses and redemption premium are adjusted against the Securities Premium Account aspermissible under Section 78(2) of the Companies Act, 1956.
Notes forming part of Consolidated Financial Statement (Contd.)

123
(o) Employee Benefits
(A) In respect of the Company and Indian consolidating entities
Employee benefits consist of Provident Fund, Superannuation Fund, Gratuity Fund, compensated absences,long service awards, post retirement medical benefits, Directors’ retirement obligations and Family BenefitScheme.
(i) Post-employment benefit plans
Payments to defined contribution retirement benefit schemes for eligible employees in the form ofSuperannuation Fund are charged as an expense as they fall due.
For defined benefit schemes in the form of gratuity fund, post retirement medical benefits, Directors’Pension Liabilities and Family Benefit Scheme, the cost of providing benefits is determined using theProjected Unit Credit Method, with actuarial valuations being carried out at each Balance Sheet date.Actuarial gains and losses are recognised in the Statement of Profit and Loss for the period in which theyoccur. Past service cost is recognised immediately to the extent that the benefits are already vested, andotherwise is amortised on a straight-line basis over the average period until the benefits become vested.The retirement benefit obligation recognised in the Consolidated Balance Sheet represents the presentvalue of the defined benefit obligation as adjusted for unrecognised past service cost and as reduced bythe fair value of scheme assets. Any asset resulting from this calculation is limited to past service costplus the present value of available refunds and reductions in future contributions to the schemes.
The Company makes contribution towards provident fund in substance a defined contribution retirementbenefit plan. The provident fund is administered by the Trustees of the Tata Chemicals Limited ProvidentFund. The Rules of the Company’s Provident Fund administered by a Trust, require that if the Board ofTrustees are unable to pay interest at the rate declared by the Employees’ Provident Fund by theGovernment under para 60 of the Employees’ Provident Fund Scheme, 1952 for the reason that thereturn on investment is less or for any other reason, then the deficiency shall be made good by theCompany. Having regard to the assets of the Fund and the return on the investments, the Company doesnot expect any deficiency as at the year end.
Family Benefit Scheme is an unfunded defined benefit plan. The benefits of the plan accrue to eligibleemployees at the time of death or permanent disablement while in service, either as a result of an injuryor as certified by the Company’s Medical Board. The monthly payment to dependents of the deceased /disabled employee under the plan equals 100% of the last drawn basic salary in case of Managementand Officer cadre employees and 100% of the last drawn basic salary plus Dearness Allowance & FixedAdditional Dearness Allowance for employees in the workmen category. The Company accounts for theliability for Family Benefit Scheme payable in future based on an independent actuarial valuation carriedout at each Balance Sheet date.
(ii) Short-term employee benefits
The undiscounted amount of short-term employee benefits expected to be paid in exchange for theservices rendered by employees is recognised during the period when the employee renders the service.These benefits include compensated absences such as paid annual leave and performance incentives.
The cost of compensated absences is accounted as under :
(a) In case of accumulated compensated absences, when employees render service that increasetheir entitlement of future compensated absences; and
(b) In case of non - accumulating compensated absence, when the absences occur.
(iii) Long-term employee benefits
Compensated absences which are not expected to occur within twelve months after the end of theperiod in which the employee renders the related services are recognised as a liability at the presentvalue of the defined benefit obligation at the Balance Sheet date. Long Service Awards are recognised asa liability at the present value of the defined benefit obligation at the Balance Sheet date.
(B) In respect of overseas subsidiaries and joint ventures , the liabilities for employee benefits are determinedand accounted as per the regulations and principles followed in the respective countries (note 29(iv)).
The actuarial gains and losses on the funds for employee benefits (pension plans) of the overseas subsidiarieshave been accounted in “Reserves and Surplus” in the consolidated financial statements in accordance withthe generally accepted accounting principles applicable and followed in the respective country ofincorporation instead of the practice followed under Indian GAAP.
Notes forming part of Consolidated Financial Statement (Contd.)

Seventy Third Annual Report 2011-12
Tata Chemicals Limited
CHEMICALS
124
(p) Employee Separation Compensation
(i) Compensation paid / payable to employees who have opted for retirement under “Early Separation Scheme”is amortised over the period for which benefit is expected.
(ii) Liability under “Early Separation Scheme” is computed and accounted at the Net Present Value.
(iii) Compensation paid / payable to employees who have opted for retirement under Voluntary RetirementScheme including ex-gratia is charged to Statement of Profit and Loss in the year of separation.
(q) Finance Costs
Costs in connection with the borrowing of funds to the extent not directly related to the acquisition of fixedassets are amortised and charged to Statement of Profit and Loss, over the tenure of the loan. Interest onborrowed money, allocated to and utilised for qualifying fixed assets, pertaining to the period upto the date ofcapitalisation is added to the cost of the assets.
Borrowing cost includes interest and amortisation of ancillary costs incurred in connection with the arrangementof borrowings.
(r) Foreign Currency Transactions and Translation
(i) Foreign currency transactions (other than derivatives) of the company and its net investment in non-integralforeign operations are recorded on initial recognition in the reporting currency, using the exchange rate atthe date of the transaction. Foreign Currency monetary assets and liabilities (other than derivatives) of thecompany and its net investment in non-integral foreign operations as at the Balance Sheet date are restatedat the year end rates and the resultant net gains or losses are recognised as income or expense in theStatement of Profit and Loss in the year in which they arise. The exchange differences on long term loans tonon-integral foreign operations are accumulated in a Foreign Currency Translation Reserve, until disposal /recovery of the net investment.
The exchange differences arising on revaluation of long term foreign currency monetary items for the yearended 31st March, 2008 to 2011 had been amortised over the shorter of the maturity period or 31st March2011.
During the current year, the company has exercised the option granted vide notification F.No.17/133/2008/CL-V dated 29th December, 2011 issued by the Ministry of Corporate Affairs and accordingly, the exchangedifferences arising on revaluation of long term foreign currency monetary items for the year ended 31stMarch, 2012 have been recognised over the shorter of the loan repayment period and 31st March, 2020. Theunamortised balance is presented as “Foreign Currency Monetary item Translation Difference Account” netof tax effect thereon. For the period upto 31st March, 2011, such exchange loss was amortised upto 31stMarch, 2011 from the period of incurrence.
(ii) Premium / discount on forward exchange contracts, related to monetary items which are not intended fortrading or speculation purposes, are amortised over the period of the contract.
(s) Derivative Contracts
The Group enters into derivative contracts in the nature of full currency swaps, interest rate swaps, currencyoptions, forward contracts and commodity hedges with an intention to hedge its existing assets and liabilities,raw material requirements and firm commitments and highly probable transactions. Derivative contracts whichare closely linked to the underlying transaction are recognised in accordance with the contract terms andaccounted as per the policy stated for foreign currency transaction and translation. All other contracts are marked-to-market and losses are recognised in the Statement of Profit and Loss. Gains arising on the same are notrecognised on grounds of prudence.
Notes forming part of Consolidated Financial Statement (Contd.)

125
(t) Government Grants
Government grants and subsidies are recognised when there is reasonable assurance that the company willcomply with the conditions attached to them and the grants/subsidy will be received. Government grants whoseprimary condition is that the company should purchase, construct or otherwise acquire capital assets are presentedby deducting them from the carrying value of the assets. The grant is recognised as income over the life of adepreciable assets by way of a reduced depreciation charge. Other government grants and subsidies are recognisedas income over the periods necessary to match them with the costs for which they are intended to compensateon a systematic basis.
(u) Segment Reporting
The Company identifies primary segments based on the dominant source, nature of risks and returns and theinternal organisation. The operating segments are the segments for which separate financial information is availableand for which operating profit/loss amounts are evaluated regularly by the executive Management in decidinghow to allocate resources and in assessing performance.
The accounting policies adopted for segment reporting are in line with the accounting policies of the Company.Segment revenue, segment expenses, segment assets and segment liabilities have been identified to segmentson the basis of their relationship to the operating activities of the segment. Inter Segment revenue is accountedon the basis of transactions which are primarily determined based on market / fair value factors. Revenue,expenses, assets and liabilities which relate to the Company as a whole and are not allocable to segments onreasonable basis have been included under “unallocated revenue / expenses / assets / liabilities”.
(v) Taxes on Income
Current Tax is the amount of tax payable on the taxable income for the year as determined in accordance withthe provisions of the Income Tax Act, 1961, except for the overseas subsidiaries and joint ventures where currenttax provision is determined based on the local tax laws.
Deferred tax is recognised for all timing differences, being the differences between the taxable income and theaccounting income that originate in one period and are capable of reversal in one or more subsequent periods.
Deferred Tax Assets in respect of unabsorbed depreciation and carry forward of losses are recognised if there isvirtual certainty that there will be sufficient future taxable income available to realise such losses. Other DeferredTax Assets are recognised if there is reasonable certainty that there will be sufficient future taxable income torealise such assets.
(w) Provisions and Contingencies
A provision is recognised when the Company has a present obligation as a result of past events and it is probablethat an outflow of resources will be required to settle the obligation, in respect of which a reliable estimate canbe made. Provisions (excluding retirement benefits) are not discounted to their present value and are determinedbased on best estimate required to settle the obligation at the Balance Sheet date. These are reviewed at eachBalance Sheet date and adjusted to reflect the current best estimates. Contingent liabilities are disclosed in Notesfollowing part of the financial statements.
(x) Goodwill on Consolidation
Goodwill on Consolidation represents the difference between the Group’s share in the net worth of the investeecompany at the time of acquisition and the cost of investment made. The said goodwill is not amortised; however,it is tested for impairment at each Balance Sheet date and impairment loss, if any, is provided for.
(xi) Cash Flow Statement
Cash flows are reported using the indirect method, whereby profit / (loss) before extraordinary items and tax isadjusted for the effects of transactions of non-cash nature and any deferrals or accruals of past or future cashreceipts or payments. The cash flows from operating, investing and financing activities of the Company aresegregated based on the available information.
(xii) Cash and Cash Equivalents
Cash comprises cash on hand and demand deposits with banks. Cash equivalents are short-term balances (withan original maturity of three months or less from the date of acquisition), highly liquid time deposit that arereadily convertible into known amounts of cash and which are subject to insignificant risk of changes in value.
Notes forming part of Consolidated Financial Statement (Contd.)

Seventy Third Annual Report 2011-12
Tata Chemicals Limited
CHEMICALS
126
Notes forming part of the Consolidated Balance SheetAs at
31-Mar-11Number ` in crores Number ` in crores
of shares of sharesNote 3: Share Capital1. Authorised:
Ordinary shares of ` 10 each ................................... 27,00,00,000 270.00 27,00,00,000 270.00
2 Issued:Ordinary shares of ` 10 each ................................... 25,48,42,598 254.84 25,48,42,598 254.84
3 Subscribed and fully paid up:Ordinary shares of ` 10 each ................................... 25,47,56,278 254.76 25,47,56,278 254.76
4. Forfeited shares:Amount originally paid-up on forfeited shares 86,320 0.06 86,320 0.06
254.82 254.82
Notes :(a) Reconciliation of the number of shares and amount outstanding at the beginning and at the end of the
reporting period:Issued share capital: Number ` in crores Number ` in crores
of shares of sharesOrdinary shares :At the beginning of the year .......................... 25,48,42,598 254.84 24,33,42,598 243.34Issued during the year ....................................... - - 1,15,00,000 11.50
Outstanding at the end of the year ....... 25,48,42,598 254.84 25,48,42,598 254.84
Subscribed and paid up:Ordinary shares :At the beginning of the year .......................... 25,47,56,278 254.76 24,32,56,278 243.26Issued during the year ....................................... - - 1,15,00,000 11.50
Outstanding at the end of the year ....... 25,47,56,278 254.76 25,47,56,278 254.76
(i) Based on approval of the members of the Company, in August 2010, the Company has issued 1,15,00,000equity shares on a preferential basis to Tata Sons Limited (the promoter entity).
(b) The equity shares of the Company have voting rights and are subject to the preferential rights as prescribedunder law or those of the preference shareholders, if any. The equity shares are also subject to restrictions asprescribed under the Companies Act 1956.
(c) Details of shares held by each shareholder more than 5 % of shares :
Ordinary shares with voting rights Number % Age Number % Ageof shares of shares
(i) Tata Sons Ltd. ......................................................... 4,93,06,423 19.35 4,50,34,323 17.68(ii) Life Insurance Corporation of India. ............ 2,05,54,959 8.07 2,21,65,107 8.70(iii) Tata Investment Corporation Ltd. ................. 1,57,53,501 6.18 1,57,53,501 6.18(iv) Tata Global Beverages Ltd. .............................. - - 1,53,85,522 6.04
(d) Aggregate number and class of shares allotted as fully paid up pursuant to contract(s) without payment beingreceived in cash, bonus shares and pursuant to schemes of amalgamation :
Ordinary shares with voting rights Number Number of shares of shares
(i) Scheme of amalgamationHind Lever Chemicals Limited ................. 3,44,64,000 3,44,64,000Tata Fertilisers Ltd ......................................... 42,49,864 42,49,864
(ii) Contract without payment being receivedin cash ....................................................................... 37,000 37,000
(iii) Bonus Shares by way of capitalisation ofSecurities premium account ..................... 9,29,70,000 9,29,70,000General reserve .............................................. 1,24,32,144 1,24,32,144

127
Notes forming part of the Consolidated Balance Sheet (Contd.)Note 4: Reserves and Surplus As at
31-Mar-11` in crores ` in crores ` in crores
1. Capital reserve:Balance as per last account ....................................................................... 0.66 0.66
2. Capital redemption reserve:Balance as per last account 0.10 0.10
3. Securities premium:Balance as per last account ......................................................................... 1,258.89 906.99Add : Additions during the year on account of issue of shares .. - 351.90
1,258.89 1,258.894. Debenture redemption reserve:
Balance as per last account ....................................................................... 252.50 240.00Add : Transferred from statement of profit and loss ...................... 12.50 12.50
265.00 252.505. Foreign currency translation reserve:
Balance as per last account ....................................................................... 121.98 110.22Add : Net adjustments during the year ............................................... 625.57 11.76
747.55 121.986. Surplus on amalgamation:
Balance as per last account ....................................................................... 20.75 20.75Less : Net adjustments during the year ............................................... (0.68) -
20.07 20.757. General reserve:
Balance as per last account ....................................................................... 1,028.06 974.59Add : Transferred from statement of profit and loss ...................... 68.80 53.47
1,096.86 1,028.068. Actuarial gains / (losses) (net of tax) (Note 29(iv(d))) :
Balance as per last account ....................................................................... (158.32) (161.35)Add/(Less) : Net adjustments during the year .................................. (157.16) 3.03
(315.48) (158.32)9. Other reserves:
Balance as per last account ....................................................................... 5.88 6.18Add/(Less) : Net adjustments during the year .................................. 5.31 (0.30)
11.19 5.8810. Surplus in statement of profit and loss
Balance as per last account ....................................................................... 2,666.37 2,374.96Add : Profit for the year ............................................................................... 837.59 653.47Less :(a) Dividends proposed to be distributed to equity shareholders
(` 10 per share) ..................................................................................... (254.76) (254.76)(b) Tax on dividend .................................................................................... (64.50) (41.33)(c) Transfer to general reserve .............................................................. (68.80) (53.47)(d) Transfer to debenture redemption reserve .............................. (12.50) (12.50)(e) Transfer to other reserves ................................................................ (5.31) -(f ) Transfer from FCTR .............................................................................. (19.76) -
3,078.33 2,666.37
6,163.17 5,196.87

Seventy Third Annual Report 2011-12
Tata Chemicals Limited
CHEMICALS
128
Note 5: Long-Term Borrowings As at31-Mar-11
` in crores ` in crores ` in crores
1. Debentures
(a) Secured
(i) 11.80% Secured redeemable non-convertible debentures ..................... 240.00 240.00
(ii) 9.05% Secured redeemable non-convertible debentures ....................... 75.00 75.00
315.00 315.00
(b) Unsecured .............................................................................................................. 250.00 250.00
565.00 565.00
2. Term Loans (Secured)
(a) From Banks ..................................................................................................... 2,839.86 1,938.92
3. Finance lease obligations (Secured) ........................................................... 0.24 -
4. Other loans and advances (Unsecured)
(a) From banks
(i) External commercial borrowing ...................................................... 1,712.57 2,096.45
(ii) Others ....................................................................................................... 224.95 197.07
1,937.52 2,293.52
(b) 6.44% Senior notes due in 2017 ........................................................... 127.45 111.98
(c) From others .................................................................................................... 14.47 6.87
2,079.44 2,412.37
5,484.54 4,916.29
Note 6: Deferred Taxes
The significant component and classification of deferred tax assets and liabilities on account of timing differences are:
` in crores
As at As at As at As at
31st March, 31st March, 31st March, 31st March,
2012 2011 2012 2011
Deferred Tax Liability Deferred Tax Asset*
1. Deferred Tax Assets :
(a) Provision for doubtful debts and advances 23.95 23.66 - -
(b) Provision for employee benefits .................... 14.05 99.67 234.96 102.42
(c) Exchange differences ........................................... 145.94 79.31 - 15.39
(d) Other timing differences .................................... 15.94 10.76 84.64 51.80
199.88 213.40 319.60 169.61
2. Deferred Tax Liability :
(a) Depreciation ............................................................ 295.98 318.92 29.50 6.14
(b) Other timing differences .................................... 5.70 103.56 155.79 -
(c) Asset retirement obligations ............................ - 9.21 - -
301.68 431.69 185.29 6.14
Net deferred tax asset/(liability) (101.80) (218.29) 134.31 163.47
* The deferred tax assets have been created only if there is reasonable certainty on the date of the Balance Sheet, thatthere will be sufficient taxable income available to realise such assets in future.
Notes forming part of the Consolidated Balance Sheet (Contd.)

129
Note 7: Other Long-Term Liabilities As at31-Mar-11
` in crores ` in crores ` in crores1. Trade payables .............................................................................................. 31.33 6.92
2. Others
(a) Pension payable on Employee Separation Scheme (Note a) 1.28 1.79
(b) Security deposit .................................................................................... 13.36 10.15
(c) Other payables ...................................................................................... 319.17 305.24
333.81 317.18
365.14 324.10
Notes:
(a) Provision for compensation under employee separation scheme (ESS) has been calculated on the basis of the netpresent value of the future monthly payments of pension.
(b) During the year, the Company entered into an agreement with Department of Science and Technology forcreation of Capital Assets for Sulphate of Potash (SOP) Project. For the above Project, the Company has receivedits first installment of Government Grant amounting to ` 8.50 crores which has been retained in a separate bankaccount and included in “Other payables” above.
Note 8: Long-Term Provisions As at31-Mar-11
` in crores ` in crores1. Provision for employee benefits ........................................................... 1,022.87 848.61
2. Provision for site restoration expenditure (note 29(vi)) ............. 24.28 15.91
1,047.15 864.52
Note 9: Short-Term Borrowings As at31-Mar-11
` in crores ` in crores ` in crores1. Loans repayable on demand
(a) SecuredFrom Banks : Cash credits ................................................................. 8.93 43.23
2. Other loans and advances(a) Secured
From Banks : Term loan ...................................................................... 204.73 45.25(b) Unsecured
From Banks : Buyer’s credit .............................................................. 247.93 110.01
452.66 155.26
461.59 198.49
Note 10: Trade Payables As at
31-Mar-11
` in crores ` in crores
1. Acceptances (Supplier’s credit) ............................................................. 1,016.29 473.53
2. Trade payables other than acceptances ............................................ 1,469.15 1,113.88
3. Other payable ............................................................................................... 178.63 150.47
2,664.07 1,737.88
Notes forming part of the Consolidated Balance Sheet (Contd.)

Seventy Third Annual Report 2011-12
Tata Chemicals Limited
CHEMICALS
130
Note 11: Other Current Liabilities As at31-Mar-11
` in crores ` in crores ` in crores1. Current maturities of long term debts
(a) DebenturesUnsecured7.40% Unsecured redeemable non-convertible debentures .. - 150.00
(b) From BanksUnsecuredForeign currency non resident (banking) loan ................ - 116.75
(c) Other loans and advancesUnsecured(i) External commercial borrowings .................................... 907.66 -(ii) From others .............................................................................. 198.46 309.13
1,106.12 575.88
2. Current maturities of Finance Lease obligation ..................... 8.48 9.06
3. Interest accrued but not due on borrowings .......................... 69.53 122.53
4. Liability towards investor protection fund
(a) Unclaimed dividends .................................................................. 10.73 9.27
(b) Unclaimed debentures and interest ..................................... 0.01 0.01
10.74 9.28
5. Deposits 31.26 32.42
6. Other payables
(a) Advances received from customers ...................................... 24.29 75.66
(b) Creditors for capital goods ....................................................... 14.53 34.93
(c) Other liabilities ............................................................................... 365.32 197.62
404.14 308.21
1,630.27 1,057.38
Notes :
(a) 7.40% Unsecured Redeemable Non-Convertible Debentures face value ` 10 lakhs each redeemable at paron 23 November, 2011.
(b) The external commercial borrowing is due for repayments on 4th June 2012 and 4th December 2012 ininstallments of ` 448.66 crores (USD 95 million) and ` 459.00 crores (USD 95 million) respectively.
Note 12: Short - Term Provisions As at31-Mar-11
` in crores ` in crores ` in crores
1. Provision for employee benefits .................................................... 49.10 39.552. Others
(a) Proposed dividend ................................................................... 254.76 254.76(b) Tax on dividend ......................................................................... 39.71 39.87(c) Provision for tax (net of advances) .................................... 18.64 12.93(d) Provision for contingencies
(note 29(vi)) .................................................................................. 14.13 -(e) Provision for site restoration
expenditure (note 29(vi)) ...................................................... 115.65 106.61(f ) Others (note 29(vi)) .................................................................. 4.76 2.18
447.65 416.35
496.75 455.90
Notes forming part of the Consolidated Balance Sheet (Contd.)

131
Note 13 : Tangible Fixed Assets and Intangible Assets ` in crores
Gross Block Depreciation/Amortisation Impairment Net Block
Fixed Assets As at Acquisitions Additions Deductions/ Exchange As at As at Acquisitions For the Deductions/ Exchange As at As at
(At Cost) 1-Apr-11 during during Adjustments Fluctuations 31-Mar-12 1-Apr-11 during the year Adjustments Fluctuations 31-Mar-12 31-Mar-12
the year the year the year
(i) Tangible Assets:
1. Land:
(a) Freehold 126.63 1.09 8.84 (0.04) 12.85 149.37 - - - - - - - 149.37
94.54 36.09 9.61 (17.11) 3.50 126.63 - - - - - - - 126.63
(b) Leasehold 212.19 - 41.17 (4.20) 23.29 272.45 18.97 - 6.25 (0.49) 2.26 26.99 2.28 243.18
157.16 0.08 57.38 (1.23) (1.20) 212.19 14.66 0.08 4.77 (0.43) (0.11) 18.97 - 193.22
2. Works :
(a) Saltworks, Reservoirs
and Pans 167.05 - 3.81 (0.01) 16.69 187.54 49.03 - 3.57 (0.02) 1.55 54.13 - 133.41
45.87 117.89 1.84 - 1.45 167.05 37.65 6.62 4.67 - 0.09 49.03 - 118.02
(b) Plant and Machinery 6,664.88 1.87 647.92 (179.41) 419.55 7,554.81 3,970.17 1.65 415.94 (130.09) 240.37 4,498.04 231.70 2,825.07
5,825.59 505.73 333.77 (87.61) 87.40 6,664.88 3,345.38 276.82 366.99 (72.58) 53.56 3,970.17 211.99 2,482.72
(c) Traction Lines,
Railway Sidings and
Wagons 243.64 - 1.20 (0.30) 28.28 272.82 123.95 - 24.88 (1.02) 15.78 163.59 - 109.23
241.15 - 5.64 (2.16) (0.99) 243.64 103.91 - 22.69 (2.05) (0.60) 123.95 - 119.69
(d) Buildings 770.78 4.14 167.88 (0.92) 61.02 1,002.90 299.49 3.08 31.21 (1.14) 25.04 357.68 0.86 644.36
585.91 167.40 11.59 (2.46) 8.34 770.78 215.80 56.06 23.84 (1.46) 5.25 299.49 3.37 467.92
3. Other Buildings 229.86 - 3.03 (2.48) 4.44 234.85 66.63 - 4.45 (0.38) 2.83 73.53 - 161.32
229.94 - 1.17 (1.13) (0.12) 229.86 62.61 - 4.39 (0.33) (0.04) 66.63 4.49 158.74
4. Water Works 7.47 - - 0.00 - 7.47 6.73 - 0.07 (0.01) - 6.79 - 0.68
7.85 - - (0.38) - 7.47 6.98 - 0.08 (0.34) 0.01 6.73 - 0.74
5. Furniture & Fittings &
Office Equipment 153.71 0.41 25.03 (9.05) 13.21 183.31 108.53 0.41 11.61 (11.66) 9.62 118.51 4.87 59.93
141.29 0.62 10.58 (1.30) 2.52 153.71 96.62 0.40 10.10 (0.89) 2.30 108.53 4.35 40.83
6. Vehicles 52.31 0.24 2.87 (3.96) 3.39 54.85 31.85 0.22 5.65 (2.50) 2.10 37.32 - 17.53
53.07 0.70 2.31 (3.78) 0.01 52.31 29.24 0.34 5.67 (3.40) - 31.85 0.01 20.45
7. Mines & Quarries 28.57 - 0.27 (0.01) 4.04 32.87 1.41 - 0.59 (0.02) 0.23 2.21 - 30.66
28.99 - - (0.23) (0.19) 28.57 1.10 - 0.54 (0.23) - 1.41 - 27.16
Total Tangible Assets 8,657.09 7.75 902.02 (200.38) 586.76 9,953.24 4,676.76 5.36 504.22 (147.33) 299.78 5,338.79 239.71 4,374.74
7,411.36 828.51 433.89 (117.39) 100.72 8,657.09 3,913.95 340.32 443.74 (81.71) 60.46 4,676.76 224.21 3,756.12
(ii) Intangible Assets:
1. Goodwill 1.64 - - - - 1.64 1.64 - - - - 1.64 - -
1.64 - - - - 1.64 1.64 - - - - 1.64 - -
2. Computer software 34.86 - 0.29 (0.87) (0.25) 34.03 32.38 - 1.80 (0.08) (0.97) 33.13 - 0.90
34.30 0.60 0.16 0.05 (0.25) 34.86 27.89 1.06 3.69 0.04 (0.30) 32.38 - 2.48
3. Technical knowhow 27.04 - - (7.41) 0.02 19.65 11.25 - 0.01 (1.52) 0.01 9.75 - 9.90
24.83 - 0.25 (0.04) 2.00 27.04 7.90 - 3.05 (0.01) 0.31 11.25 - 15.79
4. Seed Development
cost 7.54 - 2.25 (0.40) 3.08 12.47 0.57 - 2.64 (0.40) 0.81 3.62 - 8.85
- 6.34 1.20 - - 7.54 - - 0.56 - 0.01 0.57 - 6.97
5. Patents (license fees) 0.07 - - - 0.02 0.09 0.02 - 0.01 - - 0.03 - 0.06
0.07 - - - - 0.07 0.02 - 0.01 - (0.01) 0.02 - 0.05
Total Intangible Assets 71.15 - 2.54 (8.68) 2.87 67.88 45.86 - 4.46 (2.00) (0.15) 48.17 - 19.71
60.84 6.94 1.61 0.01 1.75 71.15 37.45 1.06 7.31 0.03 0.01 45.86 - 25.29
(iii) Capital Work-in-Progress 524.23
639.22
(iv) Intangible Assets
held under development 24.96
11.80
Total Fixed Assets 4,943.64
4,432.43
Notes:
1. Gross book value and accumulated depreciation above include ` 10.96 crore (previous year ` 33.66 crores) and ` Nil (previous year ` 13.88 crores) respectively for assets held for sale. The assets held forsale have been valued at lower of carrying value or net realisable value.
2 Capital work-in-progress above includes gross value of ` 48.62 crores (previous year ` Nil) of assets held for sale and an impairment of ` 34 crores (previous year ` Nil) have been provided during the year.3. The figures in light print are for the previous year.
Notes forming part of the Consolidated Balance Sheet (Contd.)

Seventy Third Annual Report 2011-12
Tata Chemicals Limited
CHEMICALS
132
As at31-Mar-11
` in crores ` in croresNote 14: Non-Current Investments ...............................................
Investments (At cost) :
Trade Investments in
(a) Equity shares fully paid (Quoted) ................................... 113.67 159.36
(b) Investment in associate (Quoted) ................................... 186.12 -
(c) Equity shares fully paid (Unquoted) .............................. 287.65 270.13
(d) Cumulative redeemable preference shares (Unquoted) 20.00 20.00
(e) Debentures and bonds ....................................................... 1.04 -
Total .................................................................................................... 608.48 449.49
Less : Provision for diminution in value of investments 2.09 2.09
606.39 447.40
Book Market Book MarketValue Value Value Value
` in crores ` in crores ` in crores ` in crores
Aggregate of Quoted Investments (net of provision) ............ 299.79 1,026.18 159.36 1,132.20
Aggregate of Unquoted Investments (net of provision) ....... . 306.60 - 288.04 -
Note 15: Long-term loans and advances As at
31-Mar-11
` in crores ` in crores ` in crores1. Unsecured - Considered Good
(a) Capital advances ....................................................................... 7.77 58.04
(b) Security deposits (deposits with government, public
bodies and others) .................................................................. 26.23 53.43
(c) Advance payment of taxes (net of provision) ............. 178.54 147.83
(d) Other loans and advances ................................................... 155.83 51.43
368.37 310.73
2. Doubtful
(a) Advances recoverable in cash/kind .................................. 0.44 -
(b) Less : Provision for advances recoverable in cash/kind 0.44 -
- -
368.37 310.73
Notes forming part of the Consolidated Balance Sheet (Contd.)

133
Note 16: Other non-current assetsAs at
31-Mar-11` in crores ` in crores
1. Long-Term Trade Receivables ................................................................ 164.79 258.24
2. Foreign Currency Monetary Translation Difference Account
(note 22(a)) .................................................................................................... 29.34 -
3. Others ............................................................................................................... 6.52 16.77
200.65 275.01
Note 17: Current InvestmentsAs at
31-Mar-11` in crores ` in crores
1. Current investments (Unquoted)(At lower of cost and fair value)(a) Fully paid Equity ................................................................................. 0.25 0.25(b) Units of mutual funds ....................................................................... 0.06 0.25(c) Investment in debentures or bonds .......................................... 2.96 -
3.27 0.50
Note 18: InventoriesAs at
31-Mar-11` in crores ` in crores
1. Raw materials 684.57 502.09
2. Work-in-process ............................................................................................ 71.43 59.84
3. Finished goods ............................................................................................. 378.20 369.39
4. Stock-in-trade (acquired for trading) .................................................. 480.58 17.03
5. Stores and spare parts, packing materials ........................................ 248.46 197.24
1,863.24 1,145.59
Notes forming part of the Consolidated Balance Sheet (Contd.)

Seventy Third Annual Report 2011-12
Tata Chemicals Limited
CHEMICALS
134
Notes forming Part of the Consolidated Balance Sheet (Contd.)
Note 20: Cash and Cash Equivalents As at
31-Mar-11` in crores ` in crores ` in crores
1 Balances with banks in
(a) Current accounts ................................................................................................. 689.11 466.67
(b) Deposit accounts ................................................................................................ 987.74 873.44
1,676.85 1,340.11
2. Cheques, drafts on hand ............................................................................................ 0.14 4.61
3. Cash on hand .................................................................................................................. 1.04 0.32
1,678.03 1,345.04
Notes :
(a) Earmarked balance with banks ............................................................................... 9.95 9.28
As atNote 19: Trade Receivables 31-Mar-11
` in crores ` in crores ` in crores1. Over six months old from due date :
(a) Secured, considered good .............................................................. 0.11 0.14
(b) Unsecured, considered good ........................................................ 225.18 126.41
(c) Unsecured, considered doubtful ................................................. 27.89 33.46
253.18 160.01
(d) Less : Provision for doubtful trade receivables ...................... 27.89 33.46
225.29 126.55
2. Others :
(a) Secured, considered good .............................................................. 3.10 11.98
(b) Unsecured, considered good ........................................................ 2,082.29 1,223.84
(c) Unsecured, considered doubtful ................................................. 6.99 0.89
2,092.38 1,236.71
(d) Less : Provision for doubtful trade receivables ...................... 6.99 0.89
2,085.39 1,235.82
Total ................................................................................................................... 2,310.68 1,362.37
Notes :
(a) Trade receivables include ` 1,166.73 crores (previous year ` 586.43 crores) on account of subsidy receivable from theGovernment.

135
Note 21: Short Term Loans and Advances As at31-Mar-11
` in crores ` in crores ` in crores
1. Unsecured, considered good
(a) Balances with government authorities ..................................................... 131.87 58.32
(b) Advance payment of taxes (net) .................................................................. 25.54 96.20
(c) Receivables from employees ......................................................................... 1.91 0.55
(d) Other advances
(i) Considered good ..................................................................................... 327.85 261.25
(ii) Considered doubtful .............................................................................. 45.24 45.24
373.09 306.49
(iii) Less: Provision for doubtful advances ............................................. 45.24 45.24
327.85 261.25
487.17 416.32
Note 22: Other Current Assets As at31-Mar-11
` in crores ` in crores
1. Foreign Currency Monetary Translation Difference Account ..................... 52.38 -
2. Interest accrued on investments ............................................................................ 2.54 1.10
3. Claims receivable ........................................................................................................... 33.73 54.05
4. Other current assets ..................................................................................................... 74.25 44.56
162.90 99.71
(a) During the year ended 31st March 2012 the Company exercised the option granted vide notification F.No.17/133/2008/CL-V dated 29th December, 2011 issued by the Ministry of Corporate Affairs and accordingly, the exchange differences arisingon revaluation of long term foreign currency monetary items have been recognised over the shorter of the loan repaymentperiod and 31st March, 2020. The unamortised balance as at 31st March 2012 of ` 81.72 crores (net of tax) (previous year `Nil (net of tax) is presented as “Foreign Currency Monetary item Translation Difference Account” (FCMTDA).
Notes forming Part of the Consolidated Balance Sheet (Contd.)

Seventy Third Annual Report 2011-12
Tata Chemicals Limited
CHEMICALS
136
Note 23: Revenue From Operations Previousyear
` in crores ` in crores ` in crores1. Sales :
(a) Sales (note a) ........................................................................................................ 13,894.30 11,102.40
2. Operating income:(a) Town income ........................................................................................................ 2.41 1.93(b) Liabilities no longer required - written back .......................................... 11.66 31.78(c) Insurance claims (note b) ................................................................................ 12.62 38.16(d) Miscellaneous income ...................................................................................... 124.26 94.09
150.95 165.96
Revenue From Operations (Gross) 14,045.25 11,268.36
Notes :(a) Sales include subsidy income of ` 2,841.04 crores (previous year ` 2,376.73 crores).
(b) Insurance claims includes ` Nil (previous year ` 36.09 crores) towards estimated loss of profit pertaining to Company’sFertiliser Plant at Babrala (on account of temporary disruption due to fault in Synthesis Converter in the ammonia plant upto 31st August, 2010) and ` Nil (previous year ` 2.04 crores) towards estimated claim for loss of stocks due to devastatingrain fall coupled with cyclonic wind in the months of July and August 2010 in and around Mithapur plant.
Note 24: Other Income Previousyear
` in crores ` in crores ` in crores1. Dividend Income
(a) Income from current investments ............................................................... 50.35 37.75(b) Income from long-term trade investments ............................................. 29.48 26.50
79.83 64.252. Interest Income From
(a) Current investments .......................................................................................... 22.66 0.22(b) Inter-corporate loans and bank deposits ................................................. 0.09 3.84(c) Other advances .................................................................................................... - 7.59(d) Interest on refund of taxes ............................................................................. 13.82 2.85
36.57 14.503. Net Gain / Loss on Sale of Investments (net)
(a) Current investments .......................................................................................... 0.05 0.26(b) Long term Investments .................................................................................... 51.36 16.75
51.41 17.01
167.81 95.76
Note 25: Employee Benefits Expenses Previousyear
` in crores ` in crores
1. Salaries, wages and bonus ......................................................................................... 752.29 629.352. Contribution to provident and other funds ....................................................... 100.00 83.723. Contribution to group insurance scheme .......................................................... 0.03 0.034. Workmen and staff welfare expenditure ............................................................ 118.69 106.61
971.01 819.71
Notes forming Part of the Statement of Consolidated Profit and Loss

137
Notes forming Part of the Statement of Consolidated Profit and Loss (Contd.)
Note 26: Finance Costs (net) Previousyear
` in crores ` in crores ` in crores1. Interest Expenses
(a) Debentures and fixed loans ........................................................................... 330.52 299.93
(b) Other loans ............................................................................................................ 33.49 16.28
(c) Others .................................................................................................................... 10.02 4.18
374.03 320.39
2. Discounting and other charges ............................................................................... 52.97 30.44
427.00 350.83
Note 27: Other Expenses Previousyear
` in crores ` in crores ` in crores
1. Stores and spare parts consumed ......................................................................... 194.37 157.28
2. Packing materials consumed .................................................................................... 310.71 263.06
3. Power and fuel ................................................................................................................ 1,438.81 1,177.79
4. Repairs - Buildings ......................................................................................................... 11.65 4.65
- Machinery ................................................................................................................... 293.89 243.39
- Others .................................................................................................................... 6.05 5.01
5. Rent .................................................................................................................................... 140.50 116.37
6. Royalty, rates and taxes ............................................................................................... 151.27 122.08
7. Commission, discount and distributors’ service charges .............................. 174.77 111.84
8. Sales promotion expenses ........................................................................................ 132.45 116.27
9. Insurance charges .......................................................................................................... 34.10 25.11
10. Freight and forwarding charges ............................................................................. 1,367.70 1,131.07
11. Provision for Doubtful debts and advances-written back (net) ................ 0.97 (0.19)
12. Loss on assets sold or discarded ............................................................................ 25.94 9.31
13. Directors’ fees / commission ..................................................................................... 8.81 9.50
14. Other provisions (note 29(vi)) .................................................................................. 34.12 7.34
15. Others ................................................................................................................................. 551.99 435.00
4,878.10 3,934.88
4,878.10 3,934.88
Notes :(a) Others above includes Excise duty adjustment for stocks of ` 1.99 crores (previous year ` 5.45 crores).
Note 28: Exceptional Items Previousyear
` in crores ` in crores
1. Compensation on voluntary retirement .............................................................. 19.57 26.75
2. Impairment of Assets ................................................................................................... 48.45 10.08
3. Notional exchange loss on restatement of long-term borrowings ........ 84.34 0.03
152.36 36.86

Seventy Third Annual Report 2011-12
Tata Chemicals Limited
CHEMICALS
138
Note 29:(i) Segment Information
(a) Information about Primary Business Segments(` in crores)
Inorganic Chemicals Fertilisers Other Agri Inputs Others Elimination Total
2011-12 2010-11 2011-12 2010-11 2011-12 2010-11 2011-12 2010-11 2011-12 2010-11 2011-12 2010-11
Revenue :
External (Net of Excise) 6,518.24 5,377.84 5,547.56 4,294.34 1,513.42 1,171.30 75.89 51.14 - - 13,655.11 10,894.62
Inter-segment 103.43 41.67 - - - 3.13 - - (103.43) (44.80) - -
Total Revenue 6,621.67 5,419.51 5,547.56 4,294.34 1,513.42 1,174.43 75.89 51.14 (103.43) (44.80) 13,655.11 10,894.62
Result :
Segment Result 1,242.79 890.20 511.35 428.47 173.29 192.20 (102.38) (31.72) - - 1,825.05 1,479.15
Unallocated expenditure net of Unallocated income 14.62 7.36Finance Costs 427.00 350.83
Profit before Tax 1,383.43 1,120.96
Tax Expense (343.92) (274.92)Profit after Tax before Minority Interest and Share of Loss in Associate 1,039.51 846.04
Other Information : (` in crores)
Inorganic Chemicals Fertilisers Other Agri Inputs Others Unallocated Total
2011-12 2010-11 2011-12 2010-11 2011-12 2010-11 2011-12 2010-11 2011-12 2010-11 2011-12 2010-11
Segment Assets 12,265.17 10,225.62 3,249.46 2,290.09 1,372.67 1,210.19 147.76 151.87 2,082.33 1,753.22 19,117.39 15,630.99
Segment Liabilities 2,678.36 2,275.47 1,525.74 859.47 369.99 351.97 22.05 18.92 7,655.17 6,267.02 12,251.31 9,772.85
Capital Expenditure 516.66 294.98 179.57 139.22 229.11 158.44 27.71 19.39 16.04 7.52 969.09 619.55
Depreciation and amortisation 335.09 308.65 133.71 116.19 28.66 17.48 6.28 4.08 4.94 4.65 508.68 451.05
Impairment of assets(net of reversal) - 10.08 1.13 - - - 47.32 - - - 48.45 10.08
Notional Exchange loss on
restatement of long-term
borrowings. - - - - - - - - 84.34 0.03 84.34 0.03
Non-cash Expenses other than
Depreciation and impairment 0.22 (0.21) 3.41 0.02 (3.20) - 0.01 - 0.53 - 0.97 (0.19)
(b) Information about Secondary Geographical SegmentsRevenue by geographical market
(` in crores)Asia Europe Africa America Others Total
2011-12 2010-11 2011-12 2010-11 2011-12 2010-11 2011-12 2010-11 2011-12 2010-11 2011-12 2010-11
External 9,722.14 7,850.96 1,456.31 1,203.39 191.61 146.30 2,179.72 1,683.95 105.33 10.02 13,655.11 10,894.62Segment Assets 8,221.40 6,355.08 2,774.22 2,552.95 1,297.99 1,081.61 6,818.39 5,634.25 5.39 7.10 19,117.39 15,630.99Capital Expenditure 704.12 482.13 96.54 72.96 50.89 15.08 117.54 49.38 - - 969.09 619.55
(c) Notes:
(i) Management has identified three reportable business segments, namely :- Inorganic Chemicals : comprising of Soda Ash, Marine Chemicals, Caustic Soda, Cement and Bulk Chemicals and Salt.- Fertilisers : comprising of fertilisers including Urea and Phosphatic.- Other Agri Inputs : comprising of other Agricultural inputs.Segments have been identified and reported taking into account the nature of products, the integration ofmanufacturing processes, the organisation structure and the internal financial reporting systems.
(ii) The Segment Revenue in the geographical segments considered for disclosure is as follows :- Asia : comprising of sales to customers located in Asia.- Europe : comprising of sales to customers located in Europe.- Africa : comprising of sales to customers located in Africa.- America : comprising of sales to customers located in America.
(iii) Segment Revenue, Results, Assets and Liabilities include the respective amounts identifiable to each of the segmentsand amounts allocated on a reasonable basis.
Notes forming Part of Consolidated Financial Statement

139
Notes forming Part of Consolidated Financial Statement (Contd.)
(ii) Earnings per Share2011-12 2010-11
(a) Profit after tax ` in crores 837.59 653.47(b) The weighted average number of equity shares of ` 10 each
Total number of shares Nos. 254,756,278 250,345,319(c) Earning Per Share ` 32.88 26.10
(iii) Related Party Disclosure(a) Related Parties and their relationship (As identified by the Management)
Joint Ventures Key Management PersonnelDirect Mr. R. Mukundan, Managing DirectorKhet-Se Agri Produce India Pvt. Ltd., India Mr. P. K. Ghose, Executive Director & CFOIndo Maroc Phosphore S. A., Morocco
Indirect Promoter GroupAlcad, United State of America Tata Sons LimitedKemex B.V., NetherlandsJoil (S) Pte. Ltd, SingaporeThe Block Salt Company Limited , United KingdomNatronx Technologies LLC, United States of America #
# Arising out of acquitions during the year.
(b) Transactions with the related parties during the year ended 31st March, 2012 and balances outstanding as at31st March, 2012 (` in crores)
The BlockIndo Khet-Se Salt
Maroc Kemex Agri Company KeyPhosphore B.V, produce Joil (S) Limited, Manage-
S.A. Netherlands Alcad Pvt. Ltd. Pte. Ltd, United ment Tata SonsIndia Singapore Kingdom Personnel Ltd Total
Purchase of goods (includesstock in transit) - Net 541.02 - - - - - - - 541.02
393.22 - 54.87 - - - - - 448.09Sale of goods - - - - - 2.93 - - 2.93
- 1.98 - - - 1.34 - - 3.32Interest Paid 2.15 - - - - - - - 2.15
0.25 - - - - - - - 0.25Sale of Investments - - - - - - - 99.48 99.48
- - - - - - - - -Other Services - - - - - - - 27.81 27.81
- - - - - - - 18.05 18.05Amount Payable (inrespect of goods purchasedand other services) 187.16 - - - - - - 28.32 215.48
131.52 - 5.69 - - - - 18.14 155.35Amount receivable (inrespect of loans andinterest there on) - 0.28 - - - - 0.01 - 0.29
- - - - - - 0.02 - 0.02Amount payable (inrespect of loans) - - - 0.05 - - - - 0.05
- - - 0.14 - - - - 0.14Maximum Amountoutstanding during the year 343.62 1.54 - - - 0.64 - 28.32 374.12
231.54 - - 0.86 - - - 18.14 250.54Provision for managementservices 0.15 - - - - 0.09 - - 0.24
0.11 - - - - - - - 0.11Amounts received/receivableon account of any ManagementContracts including fordeputation of employees - - - 0.13 - - - - 0.13
- - - - - 0.14 - - 0.14
Notes :1. In addition to the above, remuneration is paid to Key Management Personnel, under their contract of employment with the Company.2. The figures in light print are for previous year.

Seventy Third Annual Report 2011-12
Tata Chemicals Limited
CHEMICALS
140
(iv) Employee Benefits obligations :
(a) The Company makes contribution towards provident fund in substance a defined contribution retirementbenefit plan and towards pension and superannuation fund a defined contribution retirement plan forqualifying employees. The provident fund is administered by the Trustees of the Tata Chemicals LimitedProvident Fund and the superannuation fund is administered by the Trustees of the Tata ChemicalsLimited Superannuation Fund. Under the schemes, the Company is required to contribute a specifiedpercentage of salary to the retirement benefit schemes to fund the benefit.
(b) The Company is also providing post retirement medical benefits to qualifying employees. Similarly theCompany provides pension, housing / house rent allowance and medical benefits to retired Managingand Executive Directors.
The most recent actuarial valuations of plan assets and the present values of the defined benefit obligationswere carried out at 31st March, 2012. The present value of the defined benefit obligation and the relatedcurrent service cost and past service cost, were measured using the Projected Unit Credit Method.
(c) Tata Chemicals (Europe) Holdings Limited operates pension arrangements in United Kingdom (UK) andTata Chemicals (Africa) Holdings Limited operates pension arrangement in Africa. The UK arrangement isa defined benefit scheme and the arrangement in Africa is a defined contribution scheme.
(d) The actuarial gains and losses on the funds for employee benefits (pension plans) of the overseassubsidiaries have been accounted in “Reserves and Surplus” in the consolidated financial statements inaccordance with the generally accepted accounting principles applicable and followed in the respectivecountry of incorporation. The Management is of the view that due to volatility and structure of theoverseas pension funds, it is not considered practicable to adopt a common accounting policy anddeviation is as permitted by AS 21. Had the practice of recognising the actuarial gains and losses ofpension plans of the overseas subsidiaries in the Consolidated Statement of Profit and Loss, theconsolidated net profit before tax and net profit after tax and minority interest would have been higher/(lower) by amounts as per table below.
(` in crores)
Year Ended Year EndedSr. No. Impact on : 31st March, 2012 31st March, 2011
1 Consolidated Net profit before tax (180.18) 22.332 Consolidated Net profit after tax & minority interest (157.16) 3.03
The following tables set out the funded status and amounts recognised in the Group’s financial statementsas at 31st March, 2012 for the Defined Benefits Plans.
(` in crores)
Domestic Overseas Domestic Overseas
Funded Unfunded Funded Unfunded Funded Unfunded Funded Unfunded
(i) Changes in the definedbenefit obligation: As at 31st March, 2012 As at 31st March, 2011
Projected defined benefitobligation, beginning of the year 73.55 48.82 2,344.88 146.10 71.91 45.66 2,074.55 150.74
Current service cost 4.66 0.82 25.66 1.52 4.07 1.18 23.04 1.44
Interest cost 6.03 3.98 138.72 8.37 5.86 3.66 121.82 8.77
Net actuarial (gain) / loss 4.17 (4.38) 194.13 2.64 (3.29) 1.50 (4.57) (7.41)
Benefits paid (9.20) (3.07) (106.27) (6.13) (6.28) (3.18) (93.13) (6.50)
Past Service Cost - - 2.33 0.45 0.83 - - -
Exchange Variation - - 336.50 20.99 - - 73.59 (0.94)
Recognised on Acquisition - - - - 0.45 - 149.58 -
Projected defined benefitobligation, end of the year 79.21 46.17 2,935.95 173.94 73.55 48.82 2,344.88 146.10
Notes forming Part of Consolidated Financial Statement (Contd.)

141
Notes forming Part of Consolidated Financial Statement (Contd.)
(` in crores)
Domestic Overseas Domestic Overseas
Funded Unfunded Funded Unfunded Funded Unfunded Funded Unfunded
(ii) Changes in the fairvalue of plan assets: As at 31st March, 2012 As at 31st March, 2011
Fair value of plan assets,beginning of the year 72.50 - 1,737.57 - 70.50 - 1,444.81 -Expected return on plan assets 5.89 - 130.13 - 5.72 - 113.08 -Employer’s contributions 3.62 1.63 119.97 6.13 6.59 3.18 71.10 6.50Net actuarial gain / (loss) 0.67 - 8.04 - (4.40) - 0.17 -Benefits paid (9.20) (1.63) (106.27) (6.13) (6.28) (3.18) (93.13) (6.50)Exchange Variation - - 246.85 - - - 51.96 -Recognised on Acquisition - - - - 0.37 - 149.58 -Fair value of plan assets, endof the year 73.48 - 2,136.29 - 72.50 - 1,737.57 -Liability (net) before cappingadjustment 5.73 46.17 799.66 173.94 1.05 48.82 607.31 146.10Adjustment to cap surplus* - - - - - - 2.87 -
Liability (net) after cappingadjustment 5.73 46.17 799.66 173.94 1.05 48.82 610.18 146.10
*The Group has not recognised the actuarial surplus incase of one of its overseas subsidiaries acquired during the year,amounting to ` Nil (previous year ` 2.87 crores) in view of the fact that it does not expect to benefit from reduced contributionsor refunds from the scheme in the future.
(iii) Net employee benefit expense (recognised in Employee Cost) for the year (` in crores)
Domestic Overseas Domestic Overseas
Funded Unfunded Funded Unfunded Funded Unfunded Funded Unfunded
31st March, 2012 31st March, 2011
Current service cost 4.66 0.82 25.66 1.52 4.07 1.18 23.04 1.44Interest defined benefit obligation 6.03 3.98 138.72 8.37 5.86 3.66 121.82 8.77Expected return on plan assets (5.89) - (130.13) - (5.72) - (113.08) -Net actuarial (gain) / lossrecognised in the year 3.50 (4.38) 14.89 - 1.11 1.50 10.18 -Past Service Cost - - - - 0.83 - - -Net benefit expense 8.30 0.42 49.14 9.89 6.15 6.34 41.97 10.21Net actuarial (gain) / lossrecognised in reserves - - 171.21 2.64 - - (14.92) (7.41)Actual Return on Plan Assets 6.56 - 138.17 - 1.32 - 113.25 -
(iv) Categories of plan assets as a percentage of the fair value of total plan assets :
Domestic % Overseas % Domestic % Overseas %
31st March, 2012 31st March, 2011
Government Securities 51 4 54 4
Corporate Bonds 31 43 24 35
Equity Shares of Listed Companies 5 41 5 52
Insurer Managed/Hedged Funds - - - 5
Others 13 12 17 4
Total 100 100 100 100

Seventy Third Annual Report 2011-12
Tata Chemicals Limited
CHEMICALS
142
(v) Assumptions used in accounting for gratuity and post retirement medical benefit obligations :
Domestic US Plans UK Plans
Funded Unfunded Funded Unfunded Funded
Discount rate 8.25% to 8.60% - 4.99% 4.99% 5.00%
8% to 8.5% 8% to 8.5% 5.69% 5.69% 5.50%
Expected rate of return onplan assets 8.60% to 9 % NA 7.25% NA 5.50%
8% to 10% NA 8.00% NA 7.05%
Increase in Compensation cost 7.5% for firstyear, 10% for
second year & Varies7.5% thereafter NA by plan NA NA
7.5% for2 years, 10% for
third year & Varies7.5% thereafter NA by plan NA NA
Healthcare cost increase rate NA NA NA 8.50% NA
NA 6.00% NA 8.50% NA
Pension increase rate NA 5.00% NA NA 2.40%
NA 5.00% NA NA 3.60%
(a) Discount rate for the domestic plans is based on the prevailing market yields of IndianGovernment securities as at the Balance Sheet date for the estimated term of the obligations.
(b) Expected rate of return on plan assets is based on the average long term rate of return expectedon investments of the Fund during the estimated term of the obligations.
(c) The estimates of future salary increases, considered in actuarial valuation, take into account theinflation, seniority, promotion and other relevant factors.
(d) The figures in light print are for previous year.(e) The details of the Company’s post-retirement and other benefit plans for its employees given
above, are certified by the actuaries and relied upon by the Auditors.(v) The proportionate share of audited assets, liabilities, income and expenditure, contingent liabilities
and capital commitments of the Joint Ventures included in the consolidated financial statements aregiven below:-
(` in crores)
PARTICULARS Khet-se Indo Maroc Kemex B.V. ALCAD Natronx Joil (S) Pte. The BlockAgriproduce Phosphore Ltd Salt
India Pvt. Ltd. S. A. CompanyLtd.
Country of India Morocco Netherlands United States United States Singapore UnitedIncorporation of America of America Kingdom
Percentage of 50.00% 33.33% 49.99% 50.00% 33.30% 33.78% 50.00%ownership interest
2011-12 2010-11 2011-12 2010-11 2011-12 2010-11 2011-12 2010-11 2011-12 2010-11 2011-12 2010-11 2011-12 2010-11
Liabilities 2.35 4.18 83.90 120.95 0.42 2.34 6.91 6.03 9.53 - 1.73 0.40 1.01 2.27
Assets 3.38 5.17 264.11 330.87 0.77 0.24 9.58 8.47 36.22 - 40.36 46.56 2.62 4.73
Income 1.28 4.76 581.97 447.20 - 0.76 100.32 89.71 4.48 - 1.68 0.29 5.20 2.21
Expenditure 3.16 8.01 528.26 410.35 0.18 2.09 65.72 58.46 9.05 - 14.65 7.53 4.98 2.05
Profit/(Loss) after tax
For the year (1.88) (3.25) 53.71 36.85 (0.18) (1.33) 34.60 31.25 (4.57) - (12.97) (7.24) 0.22 0.16
Contingent Liabilities - - - - - - - - - - - 4.98 - -
Capital Commitments - - - - - - - - - - 2.92 15.92 - -
Notes forming Part of Consolidated Financial Statement (Contd.)

143
(vi) Disclosure as required by AS 29 “Provisions, Contingent Liabilities and Contingent Assets” inrespect of provisions as at 31st March, 2012
The company has made provision for various obligations and disputed liabilities based on itsassessment of the amount it estimates to incurre to meet such obligations, details of which are givenbelow.
(` in crores)
Particular SiteRestoration Provision for
Warranty Expenses contingencies Others Total
As at As at As at As at As at As at As at As at As at As at2011-12 2010-11 2011-12 2010-11 2011-12 2010-11 2011-12 2010-11 2011-12 2010-11
Opening Balance - - 122.52 115.18 - - 2.18 2.18 124.70 117.36Add: Provision during the year 0.34 - 7.31 16.84 14.13 - 2.43 - 24.21 16.84Less: Payments / Reversalduring the year (0.19) - (4.15) (9.59) - - - - (4.34) (9.59)Add/(Less): ExchangeDifference - - 14.25 0.09 - - - - 14.25 0.09
Closing Balance 0.15 - 139.93 122.52 14.13 2.10 4.61 2.18 158.82 124.70
(vii) Derivative Instruments:
(a) As at 31st March, 2012, the Group has the following derivative instruments outstanding:
(in Million)
Particulars Hedged Exposure Currency As at As at2011-12 2010-11
Foreign Currency Exchange
Contracts
USD / INR Foreign Currency Loans USD 48.73 24.67
USD / INR Foreign Currency Acceptances USD 104.23 115.84
USD / JPY Foreign Currency Acceptances USD 303.16 185.87
USD / INR Highly Probable Forecast Transactions USD 0.08 58.16
EUR / INR Highly Probable Forecast Transactions EUR 0.16 2.60
EUR / USD Highly Probable Forecast Transactions EUR - 0.45
USD / INR External Commercial Borrowing USD 46.00 71.00
USD / INR Foreign Currency Receivable USD 6.24 Nil
AUD / USD Foreign Currency Receivable AUD 0.33 Nil
Currency Option Contracts
USD / INR Foreign Currency Receivable USD - 5.90
USD / INR Foreign Currency Acceptances USD 91.07 Nil
USD / INR External Commercial Borrowing USD 93.00 78.00
Commodity Forward Contracts GBP Fluctation in Natural Gas GBP 3.09 3.09
Swaps
Interest Rate Swap USD Floating Interest Rate Liabliity USD 1005.90 139.74
Full Currency Swap (exchange
rate / interest rate) USD / INR External Commercial Borrowing USD 121.00 76.00
Cross Currency Swap USD / JPY External Commercial Borrowing USD 475.00 475.00
Coupon only Swap External Commercial Borrowing USD 15.00 Nil
Notes forming Part of Consolidated Financial Statement (Contd.)

Seventy Third Annual Report 2011-12
Tata Chemicals Limited
CHEMICALS
144
(b) The year end foreign currency exposures that have not been hedged by a derivative instrumentor otherwise are as under:
(i) Export receivables USD 4.01 Million (` 20.4 crores), EUR 0.01 Million (` 0.07 crore) andAUD 0.55 Million (` 2.91 crores) (previous year USD 13.63 million (` 60.79 crores), EUR0.05 million (` 0.32 crore) and AUD 1.27 million (` 5.86 crores)).
(ii) Accounts payable USD 23.29 Million (` 118.49 crores), EUR 0.07 Million (` 0.48 crore),AUD Nil and JPY 9.34 Million (` 0.58 crore) (previous year USD 29.28 million (` 130.85crores), EUR 0.11 million (` 0.70 crore), AUD 0.02 million (` 0.09 crore) and JPY 254.57million (` 13.7 crores)).
(iii) Customer advances USD Nil (previous year USD 0.32 million (` 1.43 cores)).
(iv) Liability arising out of cross currency swap USD 275.00 Million (` 1399.06 crores) (previousyear USD 275 million (` 1226.50 crores)).
(v) Packing credit USD Nil (previous year USD 0.82 million (` 3.66 crores)).
(viii) Contingent Liabilities and commitments (to the extent not provided for)
(I) Contingent Liabilities :
(a) Guarantees:
(i) Bank Guarantees issued by Banks on behalf of the Group ` 165.24 crores (previousyear ` 195.79 crores). These are covered by the charge created in favour of theCompany’s bankers by way of hypothecation of stocks and debtors.
During the previous year, a Bank Guarantee was issued by a Bank on behalf of one ofthe overseas subsidiary in favour of Mauritius Revenue Authorities (MRA) for MUR 3.5million (` 0.56 crore) against Notice of Assessment issued by MRA against whichobjection are filed. In all probabilities, the management is of the opinion that theobjection will be decided in favour of the said subsidiary and demand will be deleted.
(ii) Guarantees provided to third parties on behalf of subsidiaries USD 138.30 million(` 703.60 crores) (previous year USD 138.30 million (` 616.75 crores)).
(b) Claims not acknowledged by the Company relating to cases contested by the Companyand which, in the opinion of the Management, are not likely to be devolved on the Companyrelating to the following areas :
(` in crores)
As at As at2011-12 2010-11
(i) Excise and Customs 9.31 79.02(ii) Sales Tax / VAT 110.69 100.23(iii) Demand for utility charges 56.86 56.83(iv) Labour and other claims against the Group not
acknowledged as debt 8.17 7.99(v) Income Tax (Pending before Appellate authorities in
respect of which the Company is in appeal) 253.27 305.07(vi) Income Tax (Decided in Company’s favour by Appellate
authorities and Department is in further appeal) 37.33 37.33(vii) Uncalled partly paid shares held as investments - -(viii) Others 0.42 5.34
(c) Various claims pending before Industrial Tribunals and Labour Courts of which amountsare indeterminate.
(d) Bills discounted by subsidiaries ` 1.04 crores (previous year ` 79.56 crores)
Notes forming Part of Consolidated Financial Statement (Contd.)

145
(II) Commitments:
(a) Estimated amount of contracts remaining to be executed on capital account and notprovided for ` 86.16 crores (previous year ` 213.34 crores)
(b) Capital commitment towards investment in joint ventures ` 42 crores (previous year ` 72crores).
(c) During the year 2010-11, one of the subsidiary group acquired a majority of the equityshares of Metahelix Life Sciences Limited (Metahelix). Besides, the shares already acquired,it has made the following commitments:
(i) to acquire from certain shareholders (other than founder shareholders) 2,591 equityshares (previous year 16,099 equity shares) held by them for an amount aggregating` 5.07 crores (previous year ` 31.49 crores);
(ii) to allow the founder shareholders, a put option exercisable over a period of 4 years(previous year 5 years), 11,244 shares (previous year 14,055 shares) held by them foran amount aggregating ` 21.99 crores (previous year ` 27.49 crores);
At the end of 4 years (previous year 5 years), the subsidiary group has a call option toacquire the balance shares held by founder shareholders, at the fair market value as atthe date of exercise.
(d) Estimated amount of contract with minimum commitment for plant activity ` 3.83 crores(Previous Year ` 3.46 crores).
(e) For commitments related to leases and derivatives refer note 29 (ix) and 29 (vii) respectively.
(ix) Operating Leases :
As a lessee(` in crores)
As at As at2011-12 2010-11
(a) Total of minimum lease payments 301.70 223.72The total of minimum lease payments for a period:Not later than one year 69.89 63.79Later than one year and not later than five years 213.11 123.55Later than five years 18.70 36.38
(b) Lease payments recognised in the statement of profit and lossfor the year 75.65 66.75
(c) The lease deposit of ` 25 crores (previous year ` 25 crores) for plant and machinery remainingwith the lessors is provided over the useful life of the asset and consequently a net amount of` 2.20 crores (previous year ` 2.17 crores) has been charged to the Statement of Profit and Losson the principle of matching of revenue and costs.
(d) In respect of various subsidiaries, as at 31st March, 2012 Plant & Machinery includes assets heldunder finance lease with a net book value of ` 32.29 crores (previous year ` 32.83 crores) andgross book value of ` 51.50 crores (previous year ` 40.99 crores) and vehicles includes assetspurchased under hire purchase arrangements with fair value amounting to ` 3 crores (previousyear ` 3.19 crores). The future minimum lease payments under finance leases are as follows-
(i) Not later than one year - ` 8.32 crores (previous year ` 10.35 crores).
(ii) Later than one year but not later than five years - ` 4.55 crores (previous year ` 12.86crores).
(iii) Later than five years - ` Nil (previous year ` Nil).
Notes forming Part of Consolidated Financial Statement (Contd.)

Seventy Third Annual Report 2011-12
Tata Chemicals Limited
CHEMICALS
146
(x) Disclosure under Borrowing Cost Capitalised (` in crores)
Particular As at As at2011-12 2010-11
Borrowing costs Capitalised during the year- as fixed assets/ intangible assets/ capital work in progress 1.41 -
(xi) Details of unutilised amounts out of issue of securities for the specific purpose.
During 2010-11, the Company has issued Equity shares to Tata Sons Limited amounting to ` 363.40crores to fund Company’s various growth projects. As at 31st March, 2012, this balance of ` 363.40crores (31st March, 2011 ` 363.40 crores) is pending utilisation for the specified activities and thisunutilised amount has been kept invested in bank fixed deposits / money market mutual funds,pending final utilisation.
(xii) For the year ended 31st March, 2012, the Company has not recognised subsidy income of ` 44.91crores on Opening stock as at 1st April, 2011 of Raw Materials for Phosphatic & Potassic Fertilisers, inaccordance with the Office Memorandum dated 11th July, 2011 issued by the Department of Fertilisers(DOF) which provides for the Subsidy on such Opening Stocks at old rates applicable to F.Y. 2010-11.
Based on the legal opinion made available, the said Office Memorandum is being represented against/ contested. Had the Company recognised the subsidy income from sales made from such OpeningStocks as per the prevalent Nutrient Based Subsidy (NBS) policy without giving effect to the saidOffice Memorandum, the Sales / Income from operations and Net Profit After Tax would have beenhigher by ` 44.91 crores and ` 33.64 crores respectively for the year ended 31st March, 2012.
(xiii) Asterisk (*) denotes figures below ` 50,000.
(xiv) During the year ended 31st March 2012, the Revised Schedule VI notified under the Companies Act1956, has become applicable to the company, for preparation and presentation of financial statements,hence financial statements have been prepared as per notified Schedule VI. This has significantlyimpacted the disclosure and presentation made in the Financial statements. Previous year figureshave been regrouped/reclassified wherever necessary to correspond with the year’s classification/disclosure.
Signatures to Notes ‘1’ to ‘29’
For and on behalf of the Board
Ratan N. Tata ChairmanR. Gopalakrishnan Vice-ChairmanNusli N. WadiaPrasad R. MenonNasser Munjee DirectorsDr. Yoginder AlaghDr. Y. S. P. ThoratEknath A. Kshirsagar
Rajiv Chandan R. Mukundan Managing DirectorMumbai, 30th May, 2012. General Counsel & Company Secretary P. K. Ghose Executive Director & CFO
}
Notes forming Part of Consolidated Financial Statement (Contd.)

147
FIN
AN
CIA
L ST
ATI
STIC
S -
STA
ND
ALO
NE
CA
PITA
LA
CC
OU
NTS
REV
ENU
EA
CC
OU
NTS
Shar
eRe
serv
esB
orr
ow
-C
apit
alG
ross
Dep
re-
Net
Gro
ssEx
pen
ses
Dep
re-
Pro
fitTa
xes
Dis
tri-
Div
iden
ds
Earn
ing
sD
ivid
end
Net
Cap
ital
ing
sEm
plo
yed
Blo
ckci
atio
nBl
ock
Reve
nu
eci
atio
nb
efo
reb
uta
ble
(incl
ud
ing
per
per
Wo
rth
Year
Taxe
sp
rofit
for
Div
iden
dO
rdin
ary
Ord
inar
yp
erth
e ye
arTa
x)Sh
are
Shar
eO
rdin
ary
(Bas
ic)
Shar
e
` in
lacs
` in
lacs
` in
lacs
` in
lacs
` in
lacs
` in
lacs
` in
lacs
` in
lacs
`. i
n la
cs`
in la
cs`
in la
cs`
in la
cs`
in la
cs`
in la
cs`
``
1944
-45
152
869
229
186
717
916
29—
(13)
——
——
—8.
1119
49-5
015
210
126
288
240
1722
311
610
79
——
——
0.07
—7.
8319
54-5
519
224
8630
231
510
521
022
319
118
14—
1414
(a)
1.03
—10
.80
1959
-60
312
6432
570
170
820
750
135
130
321
271
1219
(b)
0.90
0.60
11.6
819
64-6
536
222
028
186
310
8644
364
387
664
972
155
6380
532.
911.
6015
.52
1974
-75
994
906
1189
3089
3765
1375
2390
3464
2652
201
611
250
309
154
3.82
1.60
18.0
619
79-8
099
420
3628
4858
7874
8030
4844
3258
6044
2151
392
636
443
419
15.
972.
0031
.80
1980
-81
994
2681
3522
7197
8877
3544
5333
7888
6010
649
1229
370
619
214
9.16
2.25
38.7
019
81-8
299
432
6744
4487
0510
459
4198
6261
8350
6514
670
1166
365
601
214
8.53
2.25
44.9
919
82-8
311
0539
8244
1094
9711
683
4758
6925
7694
6143
610
941
118
691
197
8.03
1.90
48.1
0(9
Mo
nth
s)19
83-8
414
0549
0667
2713
038
1425
462
5480
0012
610
9413
1516
1681
760
660
297
7.84
2.50
46.4
719
84-8
515
9467
0511
987
2028
617
032
7317
9715
1357
010
429
968
2173
450
1204
352
12.3
42.
5053
.70
1985
-86
2779
8636
1277
924
194
1955
982
8511
274
1674
612
898
1102
2746
578
1644
684
7.96
2.50
41.7
619
86-8
727
19(c
)10
212
2192
934
860
2225
791
7013
087
1935
414
878
1341
3135
875
1803
683
8.30
2.50
47.5
519
87-8
837
1715
036
2351
642
269
2599
110
631
1536
023
040
1787
516
4535
2080
027
1810
867.
513.
0051
.80
1988
-89
4492
2109
325
850
5143
528
559
1212
516
434
2917
222
392
1751
5029
1450
3229
1392
7.97
3.10
56.9
619
89-9
049
1725
926
3412
964
972
3531
014
017
2129
330
902
2317
220
5656
7416
0036
1214
758.
293.
0062
.73
1990
-91
7375
2607
058
398
9184
349
989
1604
733
942
3520
227
354
2403
5445
1000
3945
1844
6.03
2.50
45.3
519
91-9
273
7529
831
6226
299
468
6979
718
618
5117
941
204
2958
026
5089
7430
0039
7422
128.
103.
0050
.45
1992
-93
9262
4193
195
966
1471
5911
9358
2105
098
308
4874
334
754
2623
1136
638
7164
9529
448.
91*
3.50
54.8
419
93-9
411
268
7122
512
5245
2077
3819
4562
2263
217
1930
6469
840
424
2266
2200
850
016
508
6385
20.2
1*6.
0073
.03
1994
-95
1128
892
630
1526
6425
6582
2097
4726
717
1830
3092
443
5917
146
0128
671
623
165
7342
25.3
86.
5092
.00
1995
-96
1806
911
3349
1548
9228
6310
2244
7536
872
1876
0315
5565
1034
2010
489
4165
622
0022
231
1174
721
.83
6.50
72.7
219
96-9
718
070
1254
4916
1606
3051
2524
1799
4783
719
3962
1628
1312
2372
1140
929
032
3800
2048
712
916
13.9
66.
5079
.42
1997
-98
1807
014
1396
1527
5531
2221
2608
9659
053
2018
4316
6151
1214
3211
513
3320
543
5028
863
1291
615
.97
6.50
88.2
819
98-9
918
070
1495
3715
7023
3246
3027
3995
7051
620
3479
1500
3011
7432
1161
520
983
2816
1816
710
026
10.0
65.
0092
.79
1999
-00
1807
015
1240
1370
2330
6313
2844
8882
244
2022
4416
5882
1391
9012
347
1434
526
1611
729
1002
66.
505.
0093
.73
2000
-01
1807
017
6474
1146
2730
9171
2812
3892
802
1884
3617
3411
1415
1813
284
1860
921
1416
495
9953
9.13
5.00
105.
3620
01-0
218
070
1370
.66
1060
7130
7638
2859
8910
4522
1814
6715
1605
1182
7813
321
2000
673
2412
682
9032
7.02
5.00
84.3
520
02-0
318
070
1455
1681
626
2892
8828
3490
1150
4916
8441
1704
8313
0588
1369
326
202
6544
1965
811
208
10.8
85.
5089
.81
2003
-04
2151
6(d
)18
2018
7655
432
4291
3070
2513
2880
1741
4527
2984
2259
6114
415
3260
810
555
2205
313
347
10.2
55.
5094
.48
2004
-05
2151
617
8268
1324
2236
7544
3117
9015
5551
1562
3932
2515
2634
5113
770
4529
411
239
3405
515
973
15.8
36.
5092
.80
2005
-06
2151
619
5254
1454
4939
4514
3228
9916
7802
1550
9737
3461
3084
8113
893
5108
715
784
3530
317
169
16.4
17.
0010
0.45
2006
-07
2151
621
7768
1041
7737
2583
3326
5718
1183
1514
7442
6923
3485
0415
035
6338
418
963
4442
120
133
20.6
58.
0011
1.07
2007
-08
2340
633
3762
2343
8461
9375
3460
8219
4824
1512
5848
4819
3542
3314
876
1157
1020
792
9491
824
715
42.8
29.
0015
2.64
2008
-09
2352
336
2407
3676
1076
3842
3901
7620
5801
1843
7587
2402
7900
7216
303
6602
720
822
4520
524
762
19.2
59.
0016
4.11
2009
-10
2433
240
3964
2946
5174
1969
4041
1522
1106
1830
0957
6975
4994
4318
719
5881
315
335
4347
825
529
18.3
89.
0017
6.07
2010
-11
2548
244
8586
2975
94@
7718
2242
8661
#23
5898
1927
6365
6776
5804
6020
446
5587
015
021
4084
929
355
16.3
210
.00
186.
0920
11-1
225
482
4762
4133
6709
@83
8521
4571
36#
2490
3220
8104
8426
5473
1772
2246
876
435
1777
558
660
2927
723
.03
10.0
019
6.94
Not
e:(a
)In
clu
din
g a
rrea
rs o
f div
iden
ds
on
Pre
fere
nce
Sh
ares
, (b
) In
clu
din
g in
tere
st p
aid
ou
t of C
apit
al o
n O
rdin
ary
Shar
es, (
c) R
edu
ctio
n d
ue
to c
ance
llati
on
of P
refe
ren
ce S
har
e C
apit
al a
nd
Issu
e o
f No
n-C
on
vert
ible
Bo
nd
s. (d
) In
clu
des
th
e b
alan
ce ly
ing
in S
har
e C
apit
al S
usp
ense
Acc
ou
nt
amo
un
tin
g t
o `
34.
46 C
rore
s.*
An
nu
alis
ed.
@Fo
r th
e Y
E 31
st M
arch
, 201
2 an
d 3
1st
Mar
ch, 2
011
Bo
rro
win
gs
incl
ud
e Lo
ng
-ter
m b
orr
ow
ing
s +
Sho
rt T
erm
bo
rro
win
gs
+ C
urr
ent
mat
uri
ty o
f Deb
t#
For
the
YE
31st
Mar
ch, 2
012
and
31s
t M
arch
, 201
1 G
ross
Blo
ck in
clu
des
Cap
ital
Wo
rk-i
n-P
rog
ress
+ C
apit
al A
dva
nce
s

148
Seventy Third Annual Report 2011-12
CHEMICALSEQ
UIT
Y SH
ARE
S IS
SUED
ON
CO
NV
ERSI
ON
OF
BON
DS/
DEB
ENTU
RES
RIG
HTS
ISSU
ES
` L
acs
Prem
ium
` L
acs
1982
-83
116
` 8
/- p
er s
har
e19
54-5
51
for 2
at P
ar48
1983
-84
300
` 1
0/- p
er s
har
e19
57-5
84
for 5
at P
ar11
2
1984
-85/
1985
-89
600
` 3
0/- p
er s
har
e19
61-6
21
for 5
at P
rem
Re.
0.5
per
sh
are
50
1987
-88
725
` 4
0/- p
er s
har
e19
72-7
31
for 5
at P
rem
Re.
0.5
per
sh
are
104
1987
-88
725
` 6
0/- p
er s
har
e
1992
-93
1960
` 4
0/- p
er s
har
e
1993
-94
1960
` 4
0/- p
er s
har
e20
07-0
818
89`
220
.78
per
sh
are
2008
-09
117
` 2
20.7
8 p
er s
har
e
2009
-10
809
` 2
20.7
8 p
er s
har
e
9201
314
1054
0
BON
US
ISSU
ES
` L
acs
1966
-67
1 fo
r 10
30
1968
-69
3 fo
r 10
100
1970
-71
1 fo
r 587
1974
-75
1 fo
r 231
1
1985
-86
2 fo
r 577
7
1990
-91
1 fo
r 224
58
1995
-96
3 fo
r 567
77
FIN
AN
CIA
L ST
ATI
STIC
S -
STA
ND
ALO
NE
(Co
ntd
.)
FIN
AN
CIA
L ST
ATI
STIC
S -
CO
NSO
LID
ATE
D
CA
PITA
L A
CC
OU
NTS
REV
ENU
E A
CC
OU
NTS
Year
Shar
eR
eser
ves
Min
ori
tyB
orr
ow
-C
apit
alG
ross
Dep
re-
Net
Go
od
will
Gro
ssEx
pen
ses
Dep
rec-
Pro
fit
Taxe
sM
ino
rity
Shar
e o
fPr
ofi
tEa
rnin
gs
Net
Cap
ital
Inte
rest
ing
s*Em
plo
-B
lock
ciat
ion
blo
cko
nR
even
ue
iati
on
bef
ore
Inte
rest
Pro
fit/
for
the
per
Wo
rth
yed
##
Co
nso
li-Ta
xes
(Lo
ss)
year
Ord
inar
yp
erd
atio
nin
Shar
eO
rdin
ary
Ass
oci
ate
(Bas
ic)
Shar
e
` in
lacs
` in
lacs
` in
lacs
` in
lacs
` in
lacs
` in
lacs
` in
lacs
` in
lacs
` in
lacs
` in
lacs
` in
lacs
` in
lacs
` in
lacs
` in
lacs
` in
lacs
` in
lacs
` in
lacs
``
2005
-06
2151
620
0419
-18
2769
4393
8654
0514
2625
7327
7941
7074
942
5315
3468
4618
404
6006
517
231
--
4283
419
.91
103.
11
2006
-07
2151
623
5666
-18
6420
4748
3760
1187
2955
8230
5605
7632
460
6283
5040
8227
388
7481
324
009
--
5080
423
.62
119.
52
2007
-08
2340
634
8439
4234
4806
6989
0269
6592
7832
2157
3371
2146
4924
6777
8352
8813
3138
311
7587
2114
7-
-96
440
43.5
115
8.96
2008
-09
2352
345
3455
1521
962
8381
1132
638
7502
0837
3512
3766
9656
2128
1300
712
1166
716
4226
491
732
1575
111
171
-64
810
27.5
920
2.81
2009
-10
2433
244
7310
3500
649
9372
1025
491
7990
6241
5966
3830
9653
2470
9831
4484
5176
4467
893
290
2093
213
114
1347
6059
125
.61
193.
89
2010
-11
2548
251
9687
4064
556
9972
1177
615
9437
3049
4683
4490
4756
3242
1136
412
9792
1145
105
1120
9627
492
1925
7-
6534
726
.10
214.
00
2011
-12
2548
261
6317
4480
970
6073
1402
861
1057
808
5626
6749
5141
6358
7414
2130
612
3209
550
868
1383
4334
392
1994
6(2
46)
8375
932
.88
251.
93
* Fo
r th
e Y
E 31
st M
arch
, 201
2 an
d 3
1st
Mar
ch, 2
011
Bo
rrow
ing
s in
clu
de
Lon
g-t
erm
bo
rrow
ing
s +
Sho
rt T
erm
bo
rro
win
gs
+ C
urr
ent
mat
uri
ties
of
Lon
g T
erm
Deb
ts a
nd
Fin
ance
Lea
se O
blig
atio
ns
# Fo
r th
e Y
E 31
st M
arch
, 201
2 an
d 3
1st
Mar
ch, 2
011
Gro
ss B
lock
an
d N
et B
lock
in
clu
des
Cap
ital
Wo
rk-i
n-P
rog
ress
+ I
nta
ng
ible
s as
sets
hel
d u
nd
er d
evel
op
men
t +
Cap
ital
Ad
van
ces

Notes

Notes

Registered Office: Bombay House, 24, Homi Mody Street, Fort, Mumbai 400 001.
ATTENDANCE SLIP
Folio No.
DP ID
Account ID
No. of Shares
I hereby record my presence at the SEVENTY-THIRD ANNUAL GENERAL MEETING of the Company at Birla Matushri Sabhagar, 19, Sir Vithaldas ThackerseyMarg, Mumbai 400 020, at 3.00 p.m. on Wednesday, 22nd August, 2012.
Signature of the attending
Member/Proxy
Notes: 1. A Member/Proxyholder attending the meeting must bring the Attendance Slip to the meeting and hand it over at the entrance duly signed.
2. A Member/Proxyholder attending the meeting should bring copy of the Annual Report for reference at the meeting.
Registered Office: Bombay House, 24, Homi Mody Street, Fort, Mumbai 400 001.
PROXY
I/We ............................................................................................................................................................................................................................................................................................... of
....................................................................................................................................................................... in the district of ........................................................................................ being
a Member/Members of the above named Company, hereby appoint ......................................................................................................................................................................
........................................................................ of ............................................................................ in the district of ..................................................................................... or failing him
............................................................................................................................................................................ of ........................................................................................... in the district of
........................................................................................................................................................... as my/our Proxy to attend and vote for me/us and on my/our behalf at the
SEVENTY-THIRD ANNUAL GENERAL MEETING of the Company to be held on Wednesday, 22nd August, 2012 at 3.00 p.m. and at any adjournment thereof.
Signed this ..................................................................................................................................... day of .............................................................. 2012
Folio No.
DP ID
Account ID
No. of Shares
This form is to be used the resolution. Unless otherwise instructed, the proxy will act as he thinks fit.
*Strike out whichever is not desired.
Note: 1. The proxy must be returned so as to reach the Registered Office of the Company, Bombay House, 24, Homi Mody Street, Fort, Mumbai-400 001,not less than FORTY-EIGHT HOURS before the time for holding the aforesaid meeting.
2. A Proxy need not be a member of the Company.
Signature
AffixRevenue
Stamp
*in favour of*against
�����

