tc research report eng 210901
TRANSCRIPT
Under new Mid-Term Plan, the Company will plant seeds for new businesses toward “Where Tsubaki wants to be by 2030” On June 14, 2021, Tsubakimoto Chain (The “Company”) announced its Long-Term Vision 2030 and Mid-Term Plan 2025
(for FY2021 - FY2025). Setting the next five years as a planting period to achieve what the Company wants to be by 2030 (“aiming to become a corporate group that contributes to solving social issues through Linked Automation technology”), the Company is poised to allocate 60% of ¥50-60 billion FCF to be created over the next five years to new business operations. Through the efforts of strengthening existing businesses in terms of profitability among other things, the Company aims for ¥300-320 billion net sales, 9-11% operating income margin (or ¥27-35.2 billion operating income, for reference), and 8% or more ROE for FY2025. The Company will keep the dividend payout ratio at a 30% level as its priority is advance investment, but intends to increase dividends in line with profit growth.
The Company’s Chain Operations and Motion Control (MC) Operations handle a lot of parts and equipment with top market share, such as those that transmit the power of various motors. In addition, some products in the Chain Operations and orders in the MC Operations are linked to orders in Yaskawa Electric’s motion and robot businesses, making them hidden FA/motor-related businesses. Among the Company’s foreign competitors in the chain and mobility businesses, Rexnord (US) and BorgWarner (US) are shifting and diversifying their businesses through M&A transactions, while RENOLD (UK) clings to existing businesses and falls into excess debt. Capital markets tend to highly value the Company’s capacity to adapt to change, and we expect the seeds planted in the new Mid-Term Plan will bear fruit at the earliest date possible.
In CGRA’s view, the reason behind the Company’s PBR=0.69 and PER=9.9 is that Mobility Operations (former Automotive Parts Operations), which handles timing chains for automotive engines, is experiencing a structural decline in demand as BEVs (Battery Electric Vehicles) spread, and that capital markets may be concerned about the risk of impairment of segment assets, which account for 32% of the Company’s total assets. However, VW Europe and some of the Japanese companies such as Toyota Motor are reinforcing their activities to develop e-fuel, which synthesizes hydrogen and CO2 catalystically, and hydrogen engines, in an effort to reduce CO2 emissions while keeping internal combustion engines. The Company’s focus product, Enedrive Chains, are also intended to bring a shift to “motors + chains,” which has more advantages than “motors + gears” on BEVs. Depending on how these products are adopted, the discount on the Company’s stock in the stock market could be reconsidered.
(Tsubakimoto Chain’s consolidated earnings and stock price data: ¥100 million/yen/%) Trading data Earnings FY2016 FY2017 FY2018 FY2019 FY2020 FY2021
(the Company’s forecast) Stock price (2021/8/27) 3,340 yen Net sales 1,987 2,157 2,385 2,264 1,933 2,250 52-week range 2,620-3,585 yen Operating income 216 206 217 161 88 160 Market cap 1,279 ¥100 million Ordinary income 220 217 216 166 110 170 Number of shares issued 38,281 thousand
shares Profit attributable to owners of parent
145 146 137 115 87 125
Average trading value (20-day) 2.7 ¥100 million EPS 390.1 387.4 364.0 308.7 235.2 337.7 PER (the Company’s forecast) 9.9 times ROE 9.9 9.2 8.1 6.7 4.8 - PBR (as of 2021/3/31) 0.69 times Dividends per share 120.00 120.00 120.00 120.00 75.00 110.00 Expected dividend per share 110.00 yen Payout ratio 30.8 31.0 33.0 38.9 31.9 32.6 Expected dividend yield 3.3 % FCF 120 102 -78 60 183 - ROIC (2021/3) 2.8 % Net cash -3 76 -60 -85 68 -
Note: EPS and dividends per share for FY2016/FY2017/FY2018 are adjusted on a post-stock consolidation (reverse split) basis.
Company Report
TSE-I / Machinery September 1, 2021
Tsubakimoto Chain (6371)
Analyst
Shinji Kuroda Hidehiko Hoshino / CMA
Capital Goods Research & Advisory
This report's purpose is not to solicit, recommend, or offer advice regarding investment, but is prepared from our own perspective for the purpose of providing information about the company in question. In addition, although the contents of this report have been prepared based on publicly-available information, we do not guarantee their accuracy or completeness. Capital Goods Research & Advisory Co., Ltd. retains copyright to this report. Reproduction is prohibited without prior permission. The contents of this report are subject to change without notice.

2021-9-1
2 Tsubakimoto Chain (6371)
Table of Contents
(1) Tsubakimoto Chain: Three Highlights: P3-4
(2) Operations and Business Models: P5-9
• Operations: P5
• Core Products: P6
• Business Models and 6 Types of Operating Capital: P7-8
• Company History: P9
(3) Mid-Term Plan and SWOT & Five Forces Analyses: P10-12
• Announcement of Long-Term Vision 2030 and Mid-Term Plan 2025: P10
• CGRA Focus in Mid-Term Plan 2025: P11
• SWOT & Five Forces Analyses: P12
(4) Earnings Outlook and Segment Trends: P13-19
• Past Results and FY2021 Earnings Forecasts: P13
• Market Overview and Earnings Outlook for Chain Operations: P14
• Market Overview and Earnings Outlook for Motion Control Operations: P15
• Market Overview and Earnings Outlook for Mobility Operations: P16-18
• Market Overview and Earnings Outlook for Materials Handling Systems Operations: P19
(5) Financial and Non-Financial Analyses: P20-22
• Financial Analysis: P20
• Non-Financial Analysis and Governance Structure: P21-22
(6) Consolidated Statements of Income/Balance Sheets/Cash Flows: P23-24

2021-9-1
3 Tsubakimoto Chain (6371)
(1) Tsubakimoto Chain: Three Highlights Highlight #1: The Company announced Long-Term Vision 2030 and Mid-Term Plan 2025 On June 14, 2021, the Company announced Long-Term Vision 2030 and Mid-Term Plan 2025. The Company’s earnings continued to worsen in FY2019 and FY2020 in the wake of the trade dispute between China and the US and the negative impact of COVID-19 on a global scale. However, they bottomed out on a quarterly basis in FY2020-1Q (April-June 2020) and are now in a recovery phase as automobile production and the private capital investment environment have improved. On May 11, the Company announced strong growth guidance on profit as well as on dividends for FY2021, with an operating income forecast of ¥16 billion (+80% year-on-year, operating income margin: 7.1%) and dividend per share forecast of 110 yen (75 yen in the previous fiscal year).
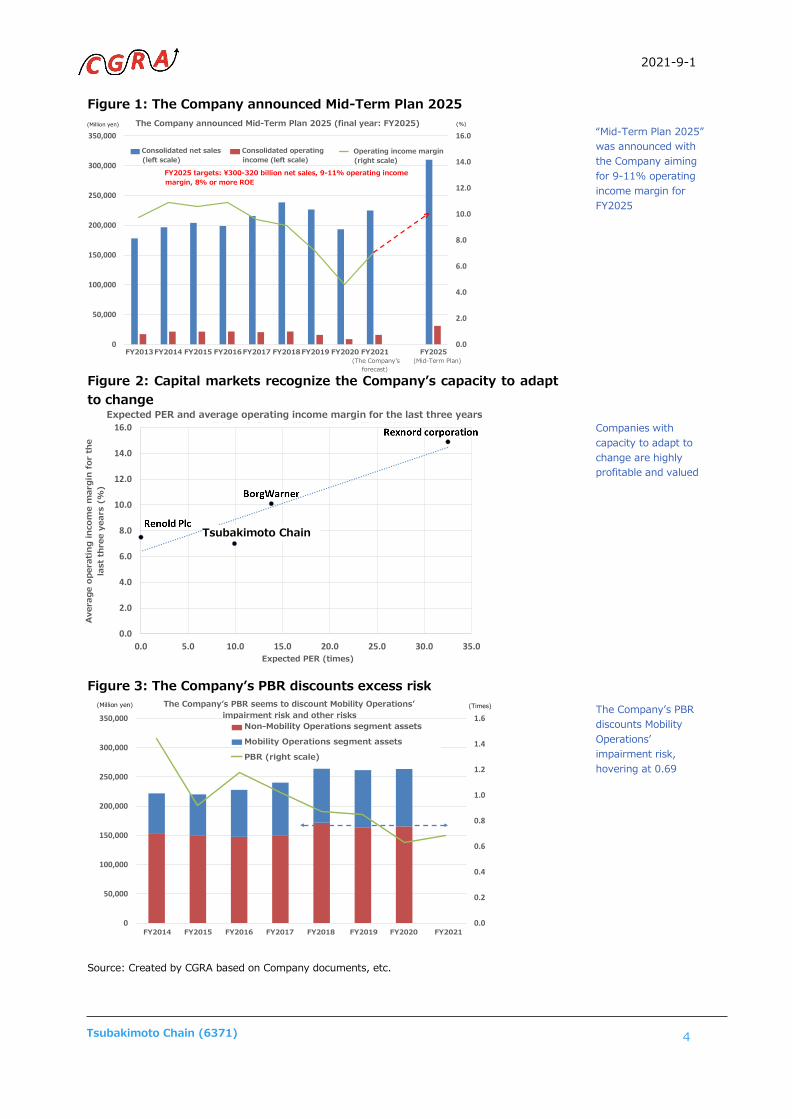
Meanwhile, the Company aims to achieve a new record-high profit in FY2025, the final year under the new Mid-Term Plan, with target net sales of ¥300-320 billion and target operating income margin of 9-11% (operating income of ¥27-35.2 billion, for reference) (Figure 1). Setting the new Mid-Term Plan period as a planting period, with a sense of impending crisis for what the Company strives for by 2030, the Company is poised to allocate 60% of ¥50-60 billion FCF to be created over the next five years to new business operations.
Highlight #2: Foreign competitors embark on fast-paced business restructuring Among the Company’s competitors are BorgWarner (US), Rexnord (US), RENOLD (UK), and Diamond Chain Company (US, unlisted). BorgWarner acquired an automotive battery company, ROMEO, in 2019 and an EV motor company, Delphi Technologies, in 2020, rushing to prepare for the EV era. Rexnord also engages in the water management business through M&A deals, in which operating income margin reaches almost 23% for various valves and household plumbing equipment. As shown in Figure 2, the two companies’ PER is highly valued for these fast-paced business conversions and diversification efforts. On the other hand, RENOLD, unable to break away from its existing businesses such as chains, has become insolvent, and its valuation estimate is not available for the moment. Tsubakimoto Chain stock price may have been affected by the RENOLD discount. If the Company’s operating income margin comes close to 9-11% as set out in the new Mid-Term Plan, and if it can secure PER=15.0, as BorgWarner does, and ROE=8% or more (Mid-Term Plan target), its PBR could be valued as high as 1.2 (= ROE 0.08 × PER 15.0).
Highlight #3: The Company’s PBR seems to discount excess impairment risk After dipping below 1.0 at one point when its performance weakened following the bankruptcy of Lehman Brothers (2008 global financial crisis), the Company’s PBR has remained in a 1.0-1.5 range overall despite the impact of valuation discounts in the automotive parts industry, which continues to be based on a low PER structure. However, it has declined significantly since FY2018 due to concerns over decreasing demand for timing chains for internal combustion engines as a result of structural changes (electrification) in the automobile industry. As the segment assets of Mobility Operations account for 32% of total assets, current PBR (0.69) can be considered to be a level that discounts Mobility Operations’ impairment risk (Figure 3).
Mobility Operations is expected to maintain stable performance for the time being, and contribution to profits by the non-timing chain business should become apparent as one of the planting effects under the new Mid-Term Plan for 2030. (Particularly, Enedrive Chains may be adopted as an alternative to BEV gears.) These days, debate is heating up over existing internal combustion engines that utilize e-fuel and hydrogen engines, which are led by Toyota Motor and European automakers such as VW. Depending on measures taken by existing automakers to reduce CO2 emissions using internal combustion engines, the Company’s EV (electric vehicle) risk and Mobility Operations’ impairment risk, being talked about in the stock market, could be mitigated.
The Company announced Mid-Term Plan 2025 (final year: FY2025)
Capital markets tend to highly value the Company’s capacity to adapt to change We hope for the early realization of non-timing chain businesses
2021-9-1
4 Tsubakimoto Chain (6371)
Figure 1: The Company announced Mid-Term Plan 2025
Figure 2: Capital markets recognize the Company’s capacity to adapt to change
Figure 3: The Company’s PBR discounts excess risk
Source: Created by CGRA based on Company documents, etc.
“Mid-Term Plan 2025” was announced with the Company aiming for 9-11% operating income margin for FY2025 Companies with capacity to adapt to change are highly profitable and valued The Company’s PBR discounts Mobility Operations’ impairment risk, hovering at 0.69
0.0
2.0
4.0
6.0
8.0
10.0
12.0
14.0
16.0
0
50,000
100,000
150,000
200,000
250,000
300,000
350,000
14/3 15/3 16/3 17/3 18/3 19/3 20/3 21/3 22/3 26/3
26/3期を最終年度とする中期経営計画2025を発表
連結売上高(左目盛) 連結営業利益(左目盛) 営業利益率(右目盛)
(百万円) (%)
26/3期に売上高3,000∼3,200億円、営業利益率9∼11%、
ROE 8%以上を目指す方針
(中計)(会予)
0.0
2.0
4.0
6.0
8.0
10.0
12.0
14.0
16.0
0.0 5.0 10.0 15.0 20.0 25.0 30.0 35.0
過去
3ヶ年
平均
営業
利益
率(%
)
予想PER(倍)
各社の予想PERと過去3ヶ年平均営業利益率
0.0
0.2
0.4
0.6
0.8
1.0
1.2
1.4
1.6
0
50,000
100,000
150,000
200,000
250,000
300,000
350,000
15/3 16/3 17/3 18/3 19/3 20/3 21/3 22/3
PBRはモビリティ事業の減損リスクなどを織り込んでいる印象
モビリティ事業以外のセグメント資産
モビリティ事業のセグメント資産
PBR(右目盛)
(百万円) (倍)
(Million yen) (%) The Company announced Mid-Term Plan 2025 (final year: FY2025)
Consolidated net sales (left scale)
Consolidated operating income (left scale)
FY2025 targets: ¥300-320 billion net sales, 9-11% operating income margin, 8% or more ROE
FY2013 FY2014 FY2015 FY2016 FY2017 FY2018 FY2019 FY2020 FY2021 FY2025 (The Company’s (Mid-Term Plan) forecast)
Expected PER and average operating income margin for the last three years
Tsubakimoto Chain
(Million yen) (Times)
Expected PER (times)
Non-Mobility Operations segment assets
Mobility Operations segment assets
PBR (right scale)
FY2014 FY2015 FY2016 FY2017 FY2018 FY2019 FY2020 FY2021
Operating income margin (right scale)
The Company’s PBR seems to discount Mobility Operations’ impairment risk and other risks
2021-9-1
5 Tsubakimoto Chain (6371)
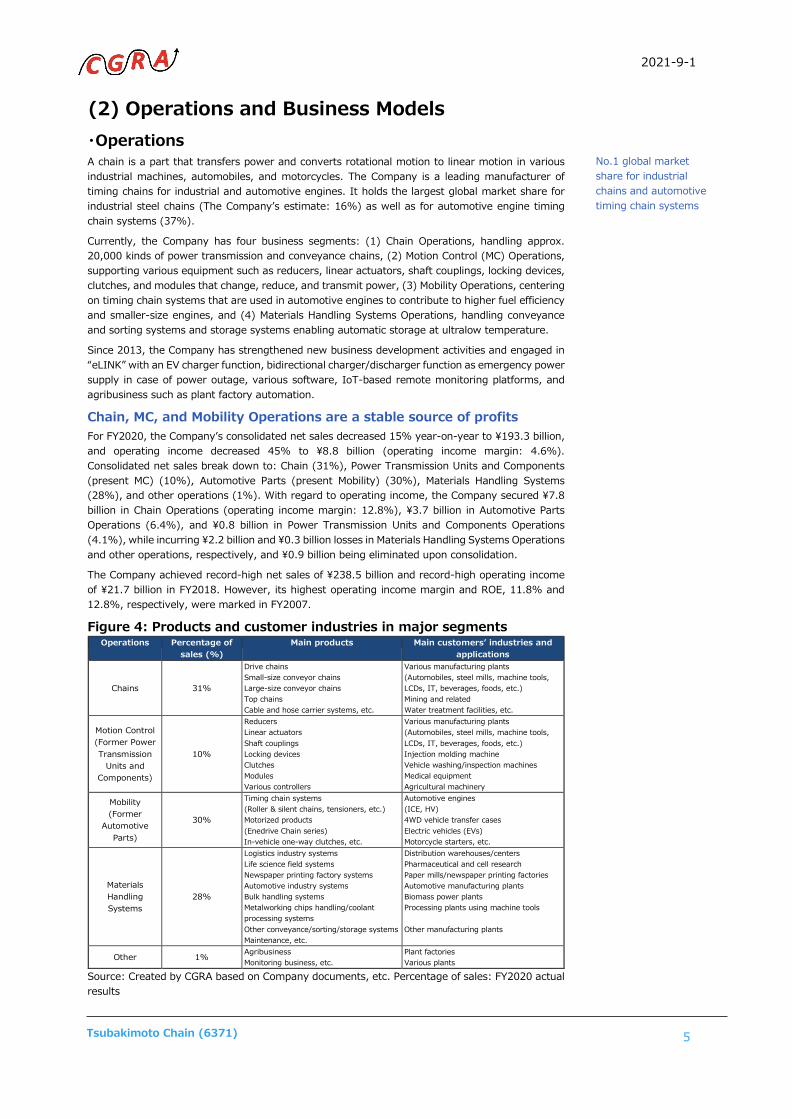
(2) Operations and Business Models ・Operations A chain is a part that transfers power and converts rotational motion to linear motion in various industrial machines, automobiles, and motorcycles. The Company is a leading manufacturer of timing chains for industrial and automotive engines. It holds the largest global market share for industrial steel chains (The Company’s estimate: 16%) as well as for automotive engine timing chain systems (37%).
Currently, the Company has four business segments: (1) Chain Operations, handling approx. 20,000 kinds of power transmission and conveyance chains, (2) Motion Control (MC) Operations, supporting various equipment such as reducers, linear actuators, shaft couplings, locking devices, clutches, and modules that change, reduce, and transmit power, (3) Mobility Operations, centering on timing chain systems that are used in automotive engines to contribute to higher fuel efficiency and smaller-size engines, and (4) Materials Handling Systems Operations, handling conveyance and sorting systems and storage systems enabling automatic storage at ultralow temperature.
Since 2013, the Company has strengthened new business development activities and engaged in “eLINK” with an EV charger function, bidirectional charger/discharger function as emergency power supply in case of power outage, various software, IoT-based remote monitoring platforms, and agribusiness such as plant factory automation.
Chain, MC, and Mobility Operations are a stable source of profits For FY2020, the Company’s consolidated net sales decreased 15% year-on-year to ¥193.3 billion, and operating income decreased 45% to ¥8.8 billion (operating income margin: 4.6%). Consolidated net sales break down to: Chain (31%), Power Transmission Units and Components (present MC) (10%), Automotive Parts (present Mobility) (30%), Materials Handling Systems (28%), and other operations (1%). With regard to operating income, the Company secured ¥7.8 billion in Chain Operations (operating income margin: 12.8%), ¥3.7 billion in Automotive Parts Operations (6.4%), and ¥0.8 billion in Power Transmission Units and Components Operations (4.1%), while incurring ¥2.2 billion and ¥0.3 billion losses in Materials Handling Systems Operations and other operations, respectively, and ¥0.9 billion being eliminated upon consolidation.
The Company achieved record-high net sales of ¥238.5 billion and record-high operating income of ¥21.7 billion in FY2018. However, its highest operating income margin and ROE, 11.8% and 12.8%, respectively, were marked in FY2007.
Figure 4: Products and customer industries in major segments Operations Percentage of
sales (%) Main products Main customers’ industries and
applications
Chains 31%
Drive chains Small-size conveyor chains Large-size conveyor chains Top chains Cable and hose carrier systems, etc.
Various manufacturing plants (Automobiles, steel mills, machine tools, LCDs, IT, beverages, foods, etc.) Mining and related Water treatment facilities, etc.
Motion Control (Former Power Transmission
Units and Components)
10%
Reducers Linear actuators Shaft couplings Locking devices Clutches Modules Various controllers
Various manufacturing plants (Automobiles, steel mills, machine tools, LCDs, IT, beverages, foods, etc.) Injection molding machine Vehicle washing/inspection machines Medical equipment Agricultural machinery
Mobility (Former
Automotive Parts)
30%
Timing chain systems (Roller & silent chains, tensioners, etc.) Motorized products (Enedrive Chain series) In-vehicle one-way clutches, etc.
Automotive engines (ICE, HV) 4WD vehicle transfer cases Electric vehicles (EVs) Motorcycle starters, etc.
Materials Handling Systems
28%
Logistics industry systems Life science field systems Newspaper printing factory systems Automotive industry systems Bulk handling systems Metalworking chips handling/coolant processing systems Other conveyance/sorting/storage systems Maintenance, etc.
Distribution warehouses/centers Pharmaceutical and cell research Paper mills/newspaper printing factories Automotive manufacturing plants Biomass power plants Processing plants using machine tools Other manufacturing plants
Other 1% Agribusiness Monitoring business, etc.
Plant factories Various plants
Source: Created by CGRA based on Company documents, etc. Percentage of sales: FY2020 actual results
No.1 global market share for industrial chains and automotive timing chain systems

2021-9-1
6 Tsubakimoto Chain (6371)
・Core Products The Company’s No.1 global share comes from high reliability The Company’s chains, its original primary business, have unparalleled wear resistance (wear life) and the world’s top level of power transmission capability, with a product lineup including environmentally resistant chains and lube-free chains. A chain mechanism is simple, but the Company secures a 16% global share (ranked 1st) thanks to its products’ high performance/reliability and extensive lineup. With a 37% global share (ranked 1st) for timing chain systems for automotive engines, the Company supplies mainly chains, as well as tensioners, lever guides, and sprockets to automakers.
Figure 5: Mechanism of roller chain/timing chain systems
Source: Company website
Electric cylinders have higher energy-saving and environmental characteristics compared to hydraulic or pneumatic cylinders. Electric cylinders account for about 20% of MC Operations’ net sales and help the Company hold a 76% market share in Japan (ranked 1st). The Company’s electric cylinders (product name: Power Cylinder) are compact and easy to install and handle because they are not based on hydraulic or air pressure. As shown in Figure 6, they are superior to hydraulic or pneumatic cylinders in terms of (extremely low) CO2 emissions and power consumption. MC Operations also has many other products with a top domestic market share, such as locking devices (product name: Power-Lock, 56% share), worm reducers (36%), and cam clutches (90%). MC Operations can be said to be a hidden FA/motor-related business (est. 30% of consolidated net sales).
Figure 6: Power Cylinder’s competitive edge
Source: Company website
33 13 42
584493
910
100
200
300
400
500
600
700
800
Air Cylinder Hydraulic Cylinder Power Cylinder
CO2Emission per year(kg-CO2/y)
4.6x
3.8x
Upper row: CO2 Emission from OperationLower row:CO2 Emission from Production
CO2 Emission
1987
1676
3100
500
1000
1500
2000
Air Cylinder Hydraulic Cylinder Power Cylinder
Comparison of yearly basis Electric Power Usage per unit(kWh/y) 6.4x
5.4x
Electric Power Usage

2021-9-1
7 Tsubakimoto Chain (6371)
・Business Models and 6 Types of Operating Capital Typical economically sensitive company but resistant to recessions Demand in the three operations of Chain, MC, and Materials Handling Systems (which collectively account for 69% of total sales) is influenced by private capital investment. However, due to their aspects of consumables, Chain and MC are linked to industrial production and US ISM index, which makes them relatively resistant to recessions. Not only MC product lines but also power transmission chains and sprockets are often used incidentally with industrial motors, and an estimated 30% of sales are FA/motor-related products. Mobility Operations (30%) is linked to global vehicle production but tends to outperform it thanks to newly acquired projects.
Looking back on past business results, operating income fell from the ¥19.8 billion recorded in FY2007 to ¥4.7 billion in FY2009 (operating income margin: 4.2%) after the bankruptcy of Lehman Brothers, yet an operating surplus was secured. Even when the negative impact of COVID-19 was seen on the Company’s operating income for FY2020, a surplus of ¥8.8 billion was achieved (operating income margin: 4.6%). This indicates that the Company has become increasingly resistant to recessions as its profit levels tend to rise during recessions.
The Company’s business model is based on industrial chains for power transmission and conveyance, selling various equipment such as reducers, shaft couplings, and locking devices, as well as parts and units such as timing chains for automotive engines, and diversifying into the materials handling business of system products. In response to changing customer needs, the Company will vertically expand its operations by increasing the added value of products and composite products and strengthening its capability to propose solutions.
Figure 7: Tsubakimoto Chain is resistant to recessions
Source: Created by CGRA based on Company documents, etc.
Key points about 6 types of operating capital In terms of the production aspect as the Company’s manufacturing capital, the mother plants are the Kyotanabe Plant for Chain Operations, the Nagaokakyo Plant for MC Operations, and the Saitama Plant for Mobility Operations. Capital investment was ¥8.2 billion in FY2020 (4.3% of net sales), and depreciation was ¥12.6 billion (6.6% of net sales). The Company made proactive capital investment with the aim of achieving ¥100 billion in sales in Mobility Operations, and capital investment reached ¥18.1 billion for FY2017 (8.4% of net sales). Capital investment has since normalized, but depreciation has remained high. With 81 affiliates in 26 countries and regions, the Company’s overseas sales ratio was 57% for FY2020.
An estimated 30% of consolidated net sales tend to be linked to demand for various industrial motors
0.0
2.0
4.0
6.0
8.0
10.0
12.0
14.0
16.0
0
50,000
100,000
150,000
200,000
250,000
00/3 01/3 02/3 03/3 04/3 05/3 06/3 07/3 08/3 09/3 10/3 11/3 12/3 13/3 14/3 15/3 16/3 17/3 18/3 19/3 20/3 21/3 22/3
椿本チエインのヒストリカル業績推移
連結売上高(左軸) 連結営業利益(左軸)
営業利益率(右軸)
(百万円) (%)
(会予)
(Million yen) (%) Tsubakimoto Chain Historical Earnings
Consolidated net sales (left scale)
Consolidated operating income (left scale)
FY19
99
FY20
00
FY20
01
FY20
02
FY20
03
FY20
04
FY20
05
FY20
06
FY20
07
FY20
08
FY20
09
FY20
10
FY20
11
FY20
12
FY20
13
FY20
14
FY20
15
FY20
16
FY20
17
FY20
18
FY20
19
FY20
20
FY20
21
(The
Co
mpa
ny’s
fo
reca
st)
Operating income margin (right scale)

2021-9-1
8 Tsubakimoto Chain (6371)
As intellectual capital, R&D expenses were ¥4.2 billion or 2.2% of net sales for FY2020 (average annual R&D expenses for the last five years: ¥4.4 billion or 2.1% of net sales). The Company has approximately 400 R&D staff groupwide (about 5% of consolidated employees), who are engaged in the development of products that differentiate from other companies’ products and meet customer needs.
As human capital, the Company had 8,535 employees on a consolidated basis as of the end of FY2020 (+956 over the last five years). Based on a merit system by function/role, the Company is promoting personnel system reforms, with a keyword being “diversity,” and is committed to global human development by establishing an “overseas trainee program.” About 50% of the Company’s consolidated workforce are foreign nationals, helped in part by the acquisition of US CCC (Central Conveyor Company). Further, the Company is committed to increasing the percentage of female employees and their promotion to managerial positions. “Tsubaki Techno School” was opened to train young engineers and raise the level of their skills. The Company’s net sales per employee of ¥22 million for FY2020 was relatively low compared to NSK’s ¥25 million, Yaskawa Electric’s ¥30 million, and Daifuku’s ¥40 million.
As financial capital, total assets were ¥307.3 billion (interest-bearing debt: ¥41.1 billion, net cash: ¥6.8 billion), while shareholders’ equity was ¥185.7 billion with 60.5% equity ratio for FY2020. As financial capital-based outputs, the Company has a profit structure that generated in FY2020 consolidated net sales of ¥193.3 billion, operating income of ¥8.8 billion (operating income margin: 4.6%, equivalent to 41% of record-high operating income ¥21.7 billion marked in FY2018), ROE of 4.8%, operating CF of ¥27.8 billion (average for the last five years: ¥25 billion), and free CF of ¥18.3 billion (average for the last five years: ¥7.7 billion).
As social capital, the Company seeks to turn its corporate activities based on “advancing the ‘art of moving’ and surpassing society’s expectations” as set out in its corporate philosophy, “TSUBAKI SPIRIT,” into the realization of a sustainable society, and enhance its corporate value through technological innovation, and contribution to SDGs.
As natural capital, the Company already developed the “Group Basic Environmental Policy” in 2000, having been committed to manufacturing and supplying eco-friendly products from a medium and long-term perspective in an effort to contribute to the realization of a sustainable society. In order to achieve the long-term environmental targets by 2030, environmental accounting has been introduced at production sites, with various KPIs set for environmental impact reduction. At the same time, the Company indirectly contributes to global environmental conservation by developing and supplying products that take into account CO2 reduction from the perspective of the product life cycle, and by actively supplying products to the SDGs market. Specifically, the Company authorized about 17% of FY2020 consolidated net sales or about ¥32 billion (a total of 254 products) as eco-products (SDG-oriented products) to expand sales. (Note: Applicable only to domestic production in Japan. Overseas production is excluded.)
Figure 8: Tsubakimoto Chain outputs and outcomes
Source: Created by CGRA based on Company documents, etc.
Intellectual capital
About 2,000 patents. World’s No.1 market share in industrial
chains/timing chains manufacturing
Providing products and services that meet customer
needs
Financial capital
Securing investment capacity and
maintaining stable credit ratings
Net cash: ¥6.8 billion, average
capital investment for last five years: ¥14.1 billion
Manufacturing capital
Average operating cash flow for last
five years: ¥25 billion
Providing stable and high-quality products/services
Focusing on SDGs and ESG
Social capital
Strengthening sustainability by sharing corporate philosophy/
basic policy
Human capital
Outputs & outcomes Outputs & outcomes
Developing global human resources and promoting
female employees
Contributing to a recycling society
Helping curb global warming
Overseas employees (%): about 50%
Female employees (%): 9%
Natural capital
2030 goal: Reduce domestic CO2
emissions by 46% from 2013 levels

2021-9-1
9 Tsubakimoto Chain (6371)
・Company History Mobility Operations are faced with challenges for the second time In 1917 amidst World War I, Setsuzo Tsubakimoto, the Company’s founder, began manufacturing bicycle chains. That was the Company’s beginning. With a catalog of foreign chains as inspiration, the Company began manufacturing industrial machine chains in 1923, ceased bicycle chain production, and switched to machine chain production in 1928. In 1937, the Company delivered a large-scale conveyor plant incorporated with Company chains for the first time and launched the conveyor (present Materials Handling Systems) business. In 1957, the Company started manufacturing timing chains for automotive engines, and entered the automotive parts (present Mobility) business. In 1958, the Company developed a large chain reducer, and launched the power transmission units and components (present MC) business. Since 2013, the Company also focused on developing new businesses. In the first half of the 1980s, the Company was faced with a structural problem, that timing chains for automotive engines were being replaced by rubber belts, and then around 1995 a countertrend (revival of chains) gained momentum. Currently, a new automotive industry trend, “CASE” (Connectivity, Autonomous, Shared, and Electric) has emerged as a new challenge.
New risks and opportunities for exponential growth both seen in Mobility Operations
Figure 9: Company history and major events (by segment) Tsubakimoto Chain Chains Motion Control Mobility
Materials Handling Systems
New Business
1917 Founded in Oyodo-ku (present Kita-ku), Osaka
1928 Shifted to industrial chain production 1931 Became a designated naval factory
1937 Entered the materials handling business
1938 Construction of Tsurumi Plant in Osaka City completed
1949 Listed on OSE and TSE Marine roller chains approved by the Lloyd’s Register
1951 Exported roller chains to the US for the first time
1953 Became a JIS certified plant 1957 Started production of timing chains 1958 Developed a large chain reducer
1961 Supplied overhead traveling conveyors to automobile factories
1962 Completed construction of the Saitama Plant
1965 Established a joint venture with BorgWarner
1966 Completed construction of an automotive parts factory within the Saitama Plant
1966 Released small-size gear motors 1967 Released Power Cylinders 1970 Established first overseas base in Taiwan
1971 Established a sales company in the US Completed construction of the Kyoto Plant (present the Nagaokakyo Plant)
1972 Established subsidiaries in the
Netherlands, Canada, and other countries
1976 Achieved the highest quality RS roller chains in the world
Late 1970s Supplied multiple advanced FA systems 1980 Started supply of timing belts
1982
Completed construction of the Hyogo Plant
1984 A shift from chains to belts advanced
1985 Released linear actuators
1986 Started local production in North America
1986 Started in-house production of plastic chains
1989 Started production of timing chains in North America
1992 Construction of Okayama Plant completed
Released a high-speed automatic sorting machine “LiniSort”
1993 Released hypoid motors
Around 1995 A return from belts to chains advanced Amazon began operations
1996 Released paper-feeding AGVs 1998 Released LiniPower Jacks 1998 Released silent chains
2000 Formulated Group Basic Environmental Policy
2001 Completed construction of the Kyotanabe Plant
2002 Spun off Precision Machinery Business Unit
Released life science support equipment
“LaboStocker” series
2003 Formulated Group Basic Risk Management Policy
(Established Tsubakimoto Emerson) Tesla Motors (US) began operations
2004 Introduced a corporate executive officer system
2006 Acquired Yamakyu Chain Co. Released starter clutches for motorcycles Released PD chains for 4WD vehicles
2007 Achieved record-high operating income in FY2007
2008 Developed and released zip chain lifters 2009 Created Auto Engineering Laboratory 2010 Acquired Kabelschlepp (Germany)
2011 Released Lift Master Commercialized environmentally friendly Zerotech series
New businesses
2012 Established a manufacturing subsidiary in China
Acquired Mayfran Holdings (US)
2013 Made Tsubakimoto Emerson wholly-owned subsidiary
Released an EV charging system “eLINK”
2014 Formulated “Long-Term Vision 2020”
(Renamed to Tsubaki E&M) Completed construction of a plant in Indonesia Entered the agribusiness in full scale
2016 Released the 100th anniversary model “G8” series
Marked new record-high operating income in FY2016
Released IoT-based remote monitoring software
2017 Formulated “Tsubaki Spirit” to mark the Company’s centennial
Merged Tsubaki E&M Established a “12 plants in 8 countries” system
2018 Marked new record-high operating income in FY2018
Marked new record-high operating income in FY2018
Marked new record-high operating income in FY2018
CASE automotive debate gained momentum
Acquired Central Conveyor Company (US)
2019 Completely separated strategy formulation/supervision and
business execution (functions)
2020 Formulated Group Basic Sustainability Policy
Source: Created by CGRA based on Company documents, etc.

2021-9-1
10 Tsubakimoto Chain (6371)
(3) Mid-Term Plan and SWOT & Five Forces Analyses Announcement of Long-Term Vision 2030 and Mid-Term Plan 2025 On June 14, 2021, the Company announced Long-Term Vision 2030 and a new 5-year “Mid-Term Plan 2025” (FY2021-FY2025).
Describing what the Company strives for by 2030 as “aiming to become a corporate group that contributes to solving social issues through Linked Automation technology, the Company presented the following three themes as its social issues to address: “creating a people-friendly society,” “building a safe and secure living infrastructure,” and “creating an Earth-friendly society.”
The Mid-Term Plan basic policy is to “strengthen the profitability of existing business fields and use the next five years to plant seeds for new business fields that will lead to sustainable growth toward realizing Long-Term Vision 2030.” The numerical targets are as shown in Figure 10. As a capital efficiency KPI, the target ROE of 8% or more is clearly stated for the first time.
<Specific policies> (1) Create next-generation businesses that will enable sustainable growth: Enter new business
fields that address social issues, and create and develop new products and technologies (2) Further establish market position and strengthen profitability of existing businesses:
Maintain and strengthen competitive advantage of leading global/niche products, and expand sales by improving price competitiveness
(3) Strengthen business foundation through manufacturing reforms and enhanced human resource development
(4) Strengthen ESG initiatives: Reduce total CO2 emissions (E), enhance social value through products (S), and strengthen governance and business infrastructure (G)
<Create next-generation businesses that will enable sustainable growth (specific measures)> (1) Human assist: Develop and provide automated and labor-saving equipment for general
consumers, such as for the medical welfare and agriculture sectors (2) Maintenance: Strengthen maintenance services, and enhance and expand “service sales”
business (3) Agribusiness: Propose automated/smart agriculture for agriculture businesses such as plant
factories (4) Life science: Participate in the field of regenerative medicine, and manufacture and sell
automated equipment for cell culture processes (5) Energy infrastructure: Enter the EV charging infrastructure market, and propose a system
linking V2X charging/discharging equipment, solar power generation, and storage batteries (6) Mobility: Strengthen the mobility parts business, such as clutches and Enedrive Chains for
EVs, and various driving parts (7) New business search: Create a new independent and dedicated department to continuously
generate seeds for new businesses (8) Strengthen profitability: Enhance competitiveness and utilize human resources by linking
market information with manufacturing (9) Manufacturing DX: Manufacturing DX Reform (visualization of production, AI-based data
analysis, etc.)
Figure 10: Mid-Term Plan 2025 numerical targets
Source: The Company’s briefing materials on Long-Term Vision 2030 and Mid-Term Plan 2025
* Excluding expenses related to other operations groups and new business development
2021-9-1
11 Tsubakimoto Chain (6371)
・CGRA Focus in Mid-Term Plan 2025 Proactively plant seeds for new growth over the next five years Long-Term Vision 2030 and Mid-Term Plan 2025 announced this time cover the following four key points:
(1) With SDGs at the forefront, the Company will “aim to become a corporate group that contributes to solving social issues through Linked Automation technology” (What Tsubaki Strives for by 2030).
(2) In the next five years, the Company will “expand the scale of existing businesses through innovative methods including M&A transactions, as well as pursuing their growth. In addition, the next five years will be used to plant seeds for new growth to achieve sales of ¥500 billion in 2030. The Company will expand its business fields through new technology development, M&A, forming alliances, etc.”
(3) This time, a new target ROE (8% or more) is set as a KPI. Financial analysis will be dealt with later, but a relatively large room for improvement in the Company’s B/S is seen. The Company’s corporate value can be expected to increase if profitability and capital efficiency are improved with management indicators broken down to the department level.
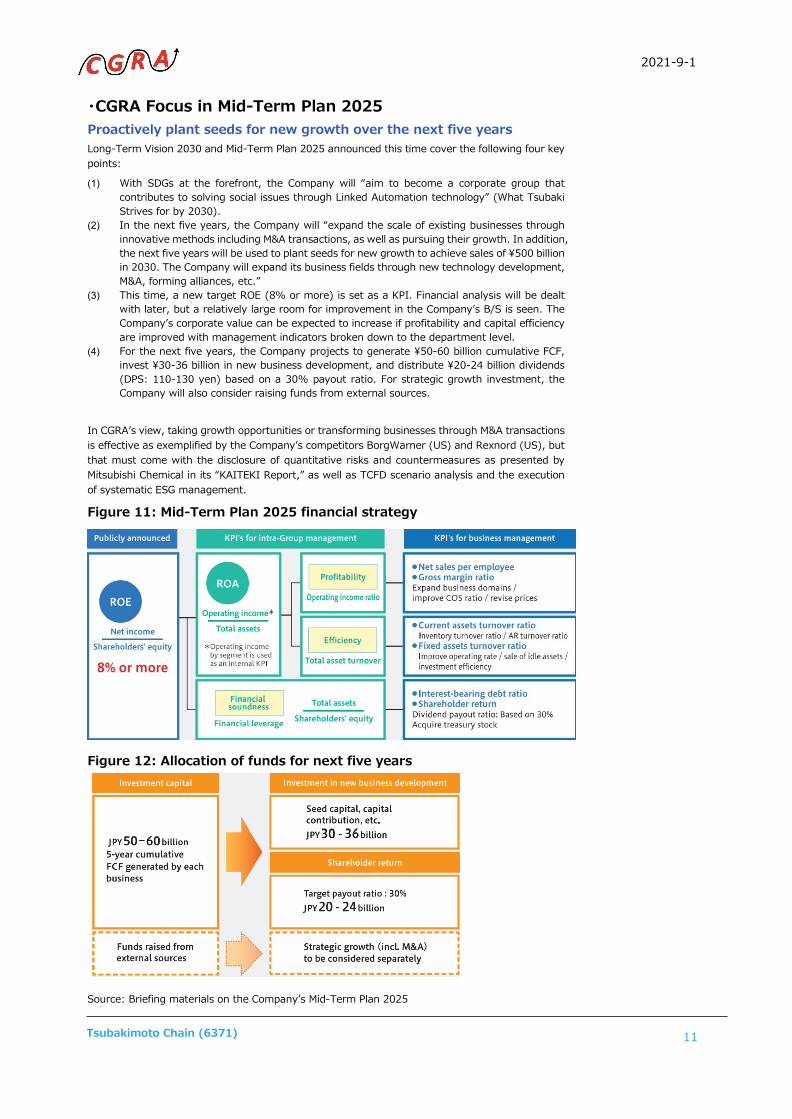
(4) For the next five years, the Company projects to generate ¥50-60 billion cumulative FCF, invest ¥30-36 billion in new business development, and distribute ¥20-24 billion dividends (DPS: 110-130 yen) based on a 30% payout ratio. For strategic growth investment, the Company will also consider raising funds from external sources.
In CGRA’s view, taking growth opportunities or transforming businesses through M&A transactions is effective as exemplified by the Company’s competitors BorgWarner (US) and Rexnord (US), but that must come with the disclosure of quantitative risks and countermeasures as presented by Mitsubishi Chemical in its “KAITEKI Report,” as well as TCFD scenario analysis and the execution of systematic ESG management.
Figure 11: Mid-Term Plan 2025 financial strategy
Figure 12: Allocation of funds for next five years
Source: Briefing materials on the Company’s Mid-Term Plan 2025

2021-9-1
12 Tsubakimoto Chain (6371)
・SWOT & Five Forces Analysis Demonstrating the strengths of the component manufacturer with a high market share The following SWOT and five forces analysis of the Company was put together by taking into account its characteristics, external environment, and domestic/international competitors. Figure 13 below displays the Company’s Strengths, Weaknesses, Opportunities, and Threats. As far as the valuation of the Company’s stock price goes, capital markets seem to view the Company’s explanations on measures to deal with its weaknesses and risks as inadequate. As for its strengths, the Company’s presentation (explanations) to the public on its high market share and technological edge in Chain and MC Operations seems to be inadequate as well.
Price competition risk likely to be low Although the five forces analysis is similar to the SWOT analysis, the former is more effective in understanding the position of buyers and sellers in the industry, including their bargaining power.
Competition within the industry: Although the competitive environment appears to have eased relatively for Chain Operations, it is still intense for MC and Mobility Operations. Materials Handling Systems Operations, despite its severe competitive environment, carries out a strategy specializing in offering solutions mainly with core products. Threat of newcomers: Nothing in particular to be noted. Threat of substitutes (alternative products): Electric vehicles (EVs) that do not require internal combustion engines is a structural problem to the Company’s timing chains, but even EVs without internal combustion engines could help sustain demand for chains if “motors + gears” shifts to “motors + chains.” There are no substitutes for industrial chains. Sellers’ bargaining power: Rising cost of various steel materials is a risk and already discounted in the Company’s earnings forecasts for FY2021. In the past, however, the Company actually raised the prices of its products. Buyers’ bargaining power: In the automobile industry, the Company normally incurs a risk of lower selling prices. However, in the industrial machinery industry, the Company has raised the prices of products. The Company seems to have strong bargaining power over buyers using its high market share and productivity improvement measures as a weapon.
Figure 13: Tsubakimoto Chain SWOT & Risk/Challenge Analysis
Source: Created by CGRA
Source: Created by CGRA
Extended explanation about MC Operations’ competitive edge, etc., for capital markets is awaited
<Strengths> ・High market share and extensive track record
・High-level knowhow in production reforms
・Strong B/S and high profitability
<Weaknesses> ・Capability to diversify (to be addressed under new Mid-Term Plan)
<Opportunities> ・Expansion of applications of the industrial chain market
・Automation/labor-saving/energy-saving needs in the manufacturing and non-manufacturing industries
・Development and sale of differentiated products for BEVs
SWOT Analysis <Threats>
・Structural extinction of timing chain markets
・Intensifying competition in the materials handling systems market
• Risk: Rising material prices, etc. • Challenge: Establishment of production bases in
Europe/after-sales service systems Chain
• Risk: High dependency on the domestic market for profits
• Challenge: Exploration of overseas markets, development of composite/new products, and rebuilding of profit structure
Motion Control
• Risk: Structural extinction of timing chain markets • Challenge: Development of differentiated/new
products Mobility
• Risk: Volatile profits from overseas subsidiaries and intensifying competition
• Challenge: Strengthening and expansion of systems integration/after-sales service businesses
Materials Handling Systems
2021-9-1
13 Tsubakimoto Chain (6371)
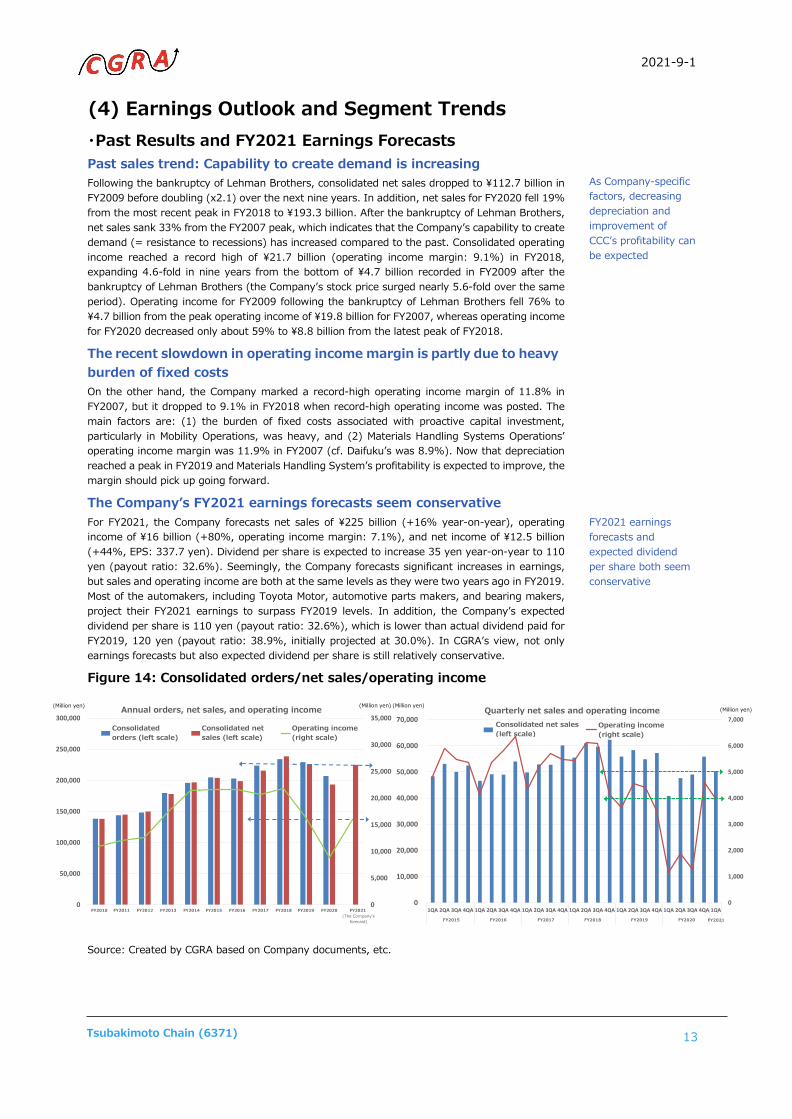
(4) Earnings Outlook and Segment Trends ・Past Results and FY2021 Earnings Forecasts Past sales trend: Capability to create demand is increasing Following the bankruptcy of Lehman Brothers, consolidated net sales dropped to ¥112.7 billion in FY2009 before doubling (x2.1) over the next nine years. In addition, net sales for FY2020 fell 19% from the most recent peak in FY2018 to ¥193.3 billion. After the bankruptcy of Lehman Brothers, net sales sank 33% from the FY2007 peak, which indicates that the Company’s capability to create demand (= resistance to recessions) has increased compared to the past. Consolidated operating income reached a record high of ¥21.7 billion (operating income margin: 9.1%) in FY2018, expanding 4.6-fold in nine years from the bottom of ¥4.7 billion recorded in FY2009 after the bankruptcy of Lehman Brothers (the Company’s stock price surged nearly 5.6-fold over the same period). Operating income for FY2009 following the bankruptcy of Lehman Brothers fell 76% to ¥4.7 billion from the peak operating income of ¥19.8 billion for FY2007, whereas operating income for FY2020 decreased only about 59% to ¥8.8 billion from the latest peak of FY2018.
The recent slowdown in operating income margin is partly due to heavy burden of fixed costs On the other hand, the Company marked a record-high operating income margin of 11.8% in FY2007, but it dropped to 9.1% in FY2018 when record-high operating income was posted. The main factors are: (1) the burden of fixed costs associated with proactive capital investment, particularly in Mobility Operations, was heavy, and (2) Materials Handling Systems Operations’ operating income margin was 11.9% in FY2007 (cf. Daifuku’s was 8.9%). Now that depreciation reached a peak in FY2019 and Materials Handling System’s profitability is expected to improve, the margin should pick up going forward.
The Company’s FY2021 earnings forecasts seem conservative For FY2021, the Company forecasts net sales of ¥225 billion (+16% year-on-year), operating income of ¥16 billion (+80%, operating income margin: 7.1%), and net income of ¥12.5 billion (+44%, EPS: 337.7 yen). Dividend per share is expected to increase 35 yen year-on-year to 110 yen (payout ratio: 32.6%). Seemingly, the Company forecasts significant increases in earnings, but sales and operating income are both at the same levels as they were two years ago in FY2019. Most of the automakers, including Toyota Motor, automotive parts makers, and bearing makers, project their FY2021 earnings to surpass FY2019 levels. In addition, the Company’s expected dividend per share is 110 yen (payout ratio: 32.6%), which is lower than actual dividend paid for FY2019, 120 yen (payout ratio: 38.9%, initially projected at 30.0%). In CGRA’s view, not only earnings forecasts but also expected dividend per share is still relatively conservative.
Figure 14: Consolidated orders/net sales/operating income
Source: Created by CGRA based on Company documents, etc.
As Company-specific factors, decreasing depreciation and improvement of CCC’s profitability can be expected FY2021 earnings forecasts and expected dividend per share both seem conservative
0
5,000
10,000
15,000
20,000
25,000
30,000
35,000
0
50,000
100,000
150,000
200,000
250,000
300,000
11/3 12/3 13/3 14/3 15/3 16/3 17/3 18/3 19/3 20/3 21/3 22/3
年度ベースの受注高、売上高、営業利益の推移
連結受注高(左軸) 連結売上高(左軸) 営業利益(右軸)
(百万円) (百万円)
(会予)
0
1,000
2,000
3,000
4,000
5,000
6,000
7,000
0
10,000
20,000
30,000
40,000
50,000
60,000
70,000
1QA 2QA 3QA 4QA 1QA 2QA 3QA 4QA 1QA 2QA 3QA 4QA 1QA 2QA 3QA 4QA 1QA 2QA 3QA 4QA 1QA 2QA 3QA 4QA 1QA
16/3 17/3 18/3 19/3 20/3 21/3 22/3
四半期ベースの売上高と営業利益の推移
連結売上高(左軸) 営業利益(右軸)
(百万円) (百万円)(Million yen) Annual orders, net sales, and operating income
Consolidated orders (left scale)
(Million yen) (Million yen)
Consolidated net sales (left scale)
Operating income (right scale)
Quarterly net sales and operating income
FY2010 FY2011 FY2012 FY2013 FY2014 FY2015 FY2016 FY2017 FY2018 FY2019 FY2020 FY2021 (The Company’s forecast) FY2015 FY2016 FY2017 FY2018 FY2019 FY2020
(Million yen)
Consolidated net sales (left scale)
Operating income (right scale)
FY2021
2021-9-1
14 Tsubakimoto Chain (6371)
・ Market Overview and Earnings Outlook for Chain Operations
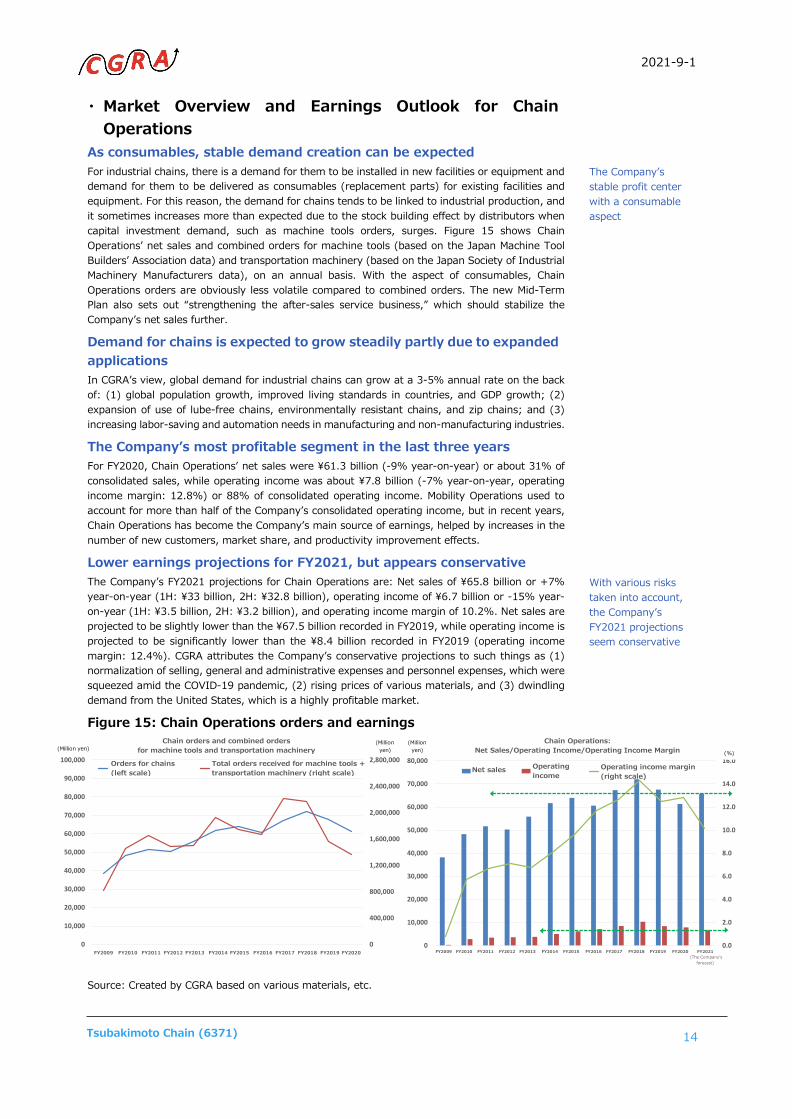
As consumables, stable demand creation can be expected For industrial chains, there is a demand for them to be installed in new facilities or equipment and demand for them to be delivered as consumables (replacement parts) for existing facilities and equipment. For this reason, the demand for chains tends to be linked to industrial production, and it sometimes increases more than expected due to the stock building effect by distributors when capital investment demand, such as machine tools orders, surges. Figure 15 shows Chain Operations’ net sales and combined orders for machine tools (based on the Japan Machine Tool Builders’ Association data) and transportation machinery (based on the Japan Society of Industrial Machinery Manufacturers data), on an annual basis. With the aspect of consumables, Chain Operations orders are obviously less volatile compared to combined orders. The new Mid-Term Plan also sets out “strengthening the after-sales service business,” which should stabilize the Company’s net sales further.
Demand for chains is expected to grow steadily partly due to expanded applications In CGRA’s view, global demand for industrial chains can grow at a 3-5% annual rate on the back of: (1) global population growth, improved living standards in countries, and GDP growth; (2) expansion of use of lube-free chains, environmentally resistant chains, and zip chains; and (3) increasing labor-saving and automation needs in manufacturing and non-manufacturing industries.
The Company’s most profitable segment in the last three years For FY2020, Chain Operations’ net sales were ¥61.3 billion (-9% year-on-year) or about 31% of consolidated sales, while operating income was about ¥7.8 billion (-7% year-on-year, operating income margin: 12.8%) or 88% of consolidated operating income. Mobility Operations used to account for more than half of the Company’s consolidated operating income, but in recent years, Chain Operations has become the Company’s main source of earnings, helped by increases in the number of new customers, market share, and productivity improvement effects.
Lower earnings projections for FY2021, but appears conservative The Company’s FY2021 projections for Chain Operations are: Net sales of ¥65.8 billion or +7% year-on-year (1H: ¥33 billion, 2H: ¥32.8 billion), operating income of ¥6.7 billion or -15% year-on-year (1H: ¥3.5 billion, 2H: ¥3.2 billion), and operating income margin of 10.2%. Net sales are projected to be slightly lower than the ¥67.5 billion recorded in FY2019, while operating income is projected to be significantly lower than the ¥8.4 billion recorded in FY2019 (operating income margin: 12.4%). CGRA attributes the Company’s conservative projections to such things as (1) normalization of selling, general and administrative expenses and personnel expenses, which were squeezed amid the COVID-19 pandemic, (2) rising prices of various materials, and (3) dwindling demand from the United States, which is a highly profitable market.
Figure 15: Chain Operations orders and earnings
Source: Created by CGRA based on various materials, etc.
The Company’s stable profit center with a consumable aspect
With various risks taken into account, the Company’s FY2021 projections seem conservative
0
400,000
800,000
1,200,000
1,600,000
2,000,000
2,400,000
2,800,000
0
10,000
20,000
30,000
40,000
50,000
60,000
70,000
80,000
90,000
100,000
10/3 11/3 12/3 13/3 14/3 15/3 16/3 17/3 18/3 19/3 20/3 21/3
チェーン受注高と工作機械+運搬機械合算受注高の推移
チェーン受注高(左軸) 工作機械+運搬機械合算受注高(右軸)
(百万円) (百万円)
0.0
2.0
4.0
6.0
8.0
10.0
12.0
14.0
16.0
0
10,000
20,000
30,000
40,000
50,000
60,000
70,000
80,000
10/3 11/3 12/3 13/3 14/3 15/3 16/3 17/3 18/3 19/3 20/3 21/3 22/3
チェーン事業の売上高、営業利益および営業利益率の推移
売上高 営業利益 営業利益率(右軸)
(百万円) (%)
(会予)
(Million yen)
(Million yen)
(Million yen) (%)
Chain orders and combined orders for machine tools and transportation machinery
Chain Operations: Net Sales/Operating Income/Operating Income Margin
Net sales
FY2009 FY2010 FY2011 FY2012 FY2013 FY2014 FY2015 FY2016 FY2017 FY2018 FY2019 FY2020 FY2021 (The Company’s forecast)
FY2009 FY2010 FY2011 FY2012 FY2013 FY2014 FY2015 FY2016 FY2017 FY2018 FY2019 FY2020
Operating income
Operating income margin (right scale)
Orders for chains (left scale)
Total orders received for machine tools + transportation machinery (right scale)
2021-9-1
15 Tsubakimoto Chain (6371)
・ Market Overview and Earnings Outlook for Motion Control Operations
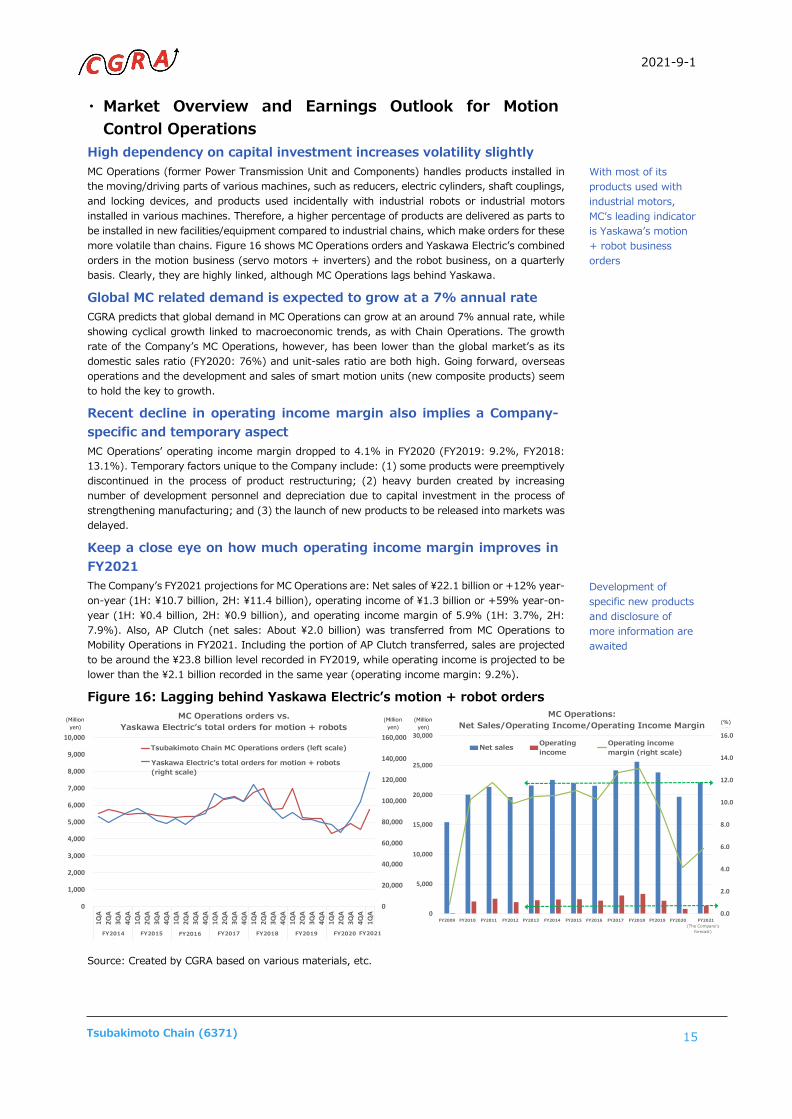
High dependency on capital investment increases volatility slightly MC Operations (former Power Transmission Unit and Components) handles products installed in the moving/driving parts of various machines, such as reducers, electric cylinders, shaft couplings, and locking devices, and products used incidentally with industrial robots or industrial motors installed in various machines. Therefore, a higher percentage of products are delivered as parts to be installed in new facilities/equipment compared to industrial chains, which make orders for these more volatile than chains. Figure 16 shows MC Operations orders and Yaskawa Electric’s combined orders in the motion business (servo motors + inverters) and the robot business, on a quarterly basis. Clearly, they are highly linked, although MC Operations lags behind Yaskawa.
Global MC related demand is expected to grow at a 7% annual rate CGRA predicts that global demand in MC Operations can grow at an around 7% annual rate, while showing cyclical growth linked to macroeconomic trends, as with Chain Operations. The growth rate of the Company’s MC Operations, however, has been lower than the global market’s as its domestic sales ratio (FY2020: 76%) and unit-sales ratio are both high. Going forward, overseas operations and the development and sales of smart motion units (new composite products) seem to hold the key to growth.
Recent decline in operating income margin also implies a Company-specific and temporary aspect MC Operations’ operating income margin dropped to 4.1% in FY2020 (FY2019: 9.2%, FY2018: 13.1%). Temporary factors unique to the Company include: (1) some products were preemptively discontinued in the process of product restructuring; (2) heavy burden created by increasing number of development personnel and depreciation due to capital investment in the process of strengthening manufacturing; and (3) the launch of new products to be released into markets was delayed.
Keep a close eye on how much operating income margin improves in FY2021 The Company’s FY2021 projections for MC Operations are: Net sales of ¥22.1 billion or +12% year-on-year (1H: ¥10.7 billion, 2H: ¥11.4 billion), operating income of ¥1.3 billion or +59% year-on-year (1H: ¥0.4 billion, 2H: ¥0.9 billion), and operating income margin of 5.9% (1H: 3.7%, 2H: 7.9%). Also, AP Clutch (net sales: About ¥2.0 billion) was transferred from MC Operations to Mobility Operations in FY2021. Including the portion of AP Clutch transferred, sales are projected to be around the ¥23.8 billion level recorded in FY2019, while operating income is projected to be lower than the ¥2.1 billion recorded in the same year (operating income margin: 9.2%).
Figure 16: Lagging behind Yaskawa Electric’s motion + robot orders
Source: Created by CGRA based on various materials, etc.
With most of its products used with industrial motors, MC’s leading indicator is Yaskawa’s motion + robot business orders Development of specific new products and disclosure of more information are awaited
0
20,000
40,000
60,000
80,000
100,000
120,000
140,000
160,000
0
1,000
2,000
3,000
4,000
5,000
6,000
7,000
8,000
9,000
10,000
1QA
2QA
3QA
4QA
1QA
2QA
3QA
4QA
1QA
2QA
3QA
4QA
1QA
2QA
3QA
4QA
1QA
2QA
3QA
4QA
1QA
2QA
3QA
4QA
1QA
2QA
3QA
4QA
1QA
15/3 16/3 17/3 18/3 19/3 20/3 21/3 22/3
MC事業受注高と安川電機モーション+ロボット合算受注動向
椿本チエインMC事業受注高(左軸)
安川電機モーション+ロボット合算受注高(右軸)
(百万円) (百万円)
0.0
2.0
4.0
6.0
8.0
10.0
12.0
14.0
16.0
0
5,000
10,000
15,000
20,000
25,000
30,000
10/3 11/3 12/3 13/3 14/3 15/3 16/3 17/3 18/3 19/3 20/3 21/3 22/3
MC事業の売上高、営業利益および営業利益率の推移
売上高 営業利益 営業利益率(右軸)
(百万円) (%)
(会予)
Tsubakimoto Chain MC Operations orders (left scale)
(Million yen)
(Million yen)
(%) MC Operations orders vs.
Yaskawa Electric’s total orders for motion + robots MC Operations:
Net Sales/Operating Income/Operating Income Margin
Net sales Operating income
Operating income margin (right scale)
FY2009 FY2010 FY2011 FY2012 FY2013 FY2014 FY2015 FY2016 FY2017 FY2018 FY2019 FY2020 FY2021 (The Company’s forecast) FY2015 FY2016 FY2017 FY2018 FY2019 FY2020 FY2021 FY2014
Yaskawa Electric’s total orders for motion + robots (right scale)
(Million yen)

2021-9-1
16 Tsubakimoto Chain (6371)
・ Market Overview and Earnings Outlook for Mobility Operations
Operating income margin surged close to 20% at one point... Mobility Operations (former Automotive Parts) saw rapid growth in the trend of downsizing (= timing chains are optimized for smaller-size engines) for better fuel economy for automobiles, and record-high net sales of ¥79.5 billion were posted in FY2017 (1.6-fold in the last five years). Record-high operating income of ¥12.3 billion was posted in FY2016, with an operating income margin of 16.5% (cf. record-high operating income margin: 17.8% in FY2014). As a result of proactive investments made since FY2015 with the aim of achieving ¥100 billion sales, the Company saw increases in depreciation and fixed costs due to a growing number of employees, and a subsequent gradual decline in operating income margin.
For FY2020, Mobility Operations recorded net sales of ¥57.7 billion (-19% year-on-year) and operating income of ¥3.7 billion (-36% year-on-year, operating income margin: 6.4%), but in FY2020-4Q (January-March 2021) operating income showed a 47% year-on-year increase to ¥2.0 billion and operating income margin recovered to 11.8%. In FY2021-1Q (April-June 2021), operating income was ¥2.1 billion (operating income margin: 12.6%), which indicates its recovery trend is intensifying.
Operating income margin likely to stay above 10% by around 2025 Capital investment in Mobility Operations increased to ¥12.0 billion in FY2017, then decreased to ¥3.3 billion in FY2020 upon the completion of the “12 plants in 8 countries” system. Depreciation has also been on a gradual decline, after reaching a peak at around ¥6.9 billion in FY2019. CGRA thus believes that keeping operating income margin stable at 10% or more is feasible, given further improvements in production efficiency and a decrease in fixed costs.
The Company’s FY2021 projections for Mobility Operations are: Net sales of ¥72.3 billion or +25% year-on-year (1H: ¥36 billion, 2H: ¥36.3 billion), operating income of ¥8.0 billion or +115% year-on-year (1H: ¥3.8 billion, 2H: ¥4.2 billion), and an operating income margin of 11.1%. Sales are expected to be slightly stronger than the ¥70.9 billion recorded in FY2019, but more or less the same after the transfer of AP Clutch is considered. Operating income is expected to be stronger than the ¥5.8 billion recorded in FY2019 (operating income margin: 8.2%). With operating income margin already above 12% in the most recent quarter, the Company’s projections should be achieved.
Figure 17: Mobility Operations net sales/operating income/operating income margin
Source: Created by CGRA based on Company documents, etc.
Aiming for stable operating income margin of 10% or more toward 2025
Operating income margin already at 12.6% in April-June 2021
0.0
2.0
4.0
6.0
8.0
10.0
12.0
14.0
16.0
18.0
20.0
0
10,000
20,000
30,000
40,000
50,000
60,000
70,000
80,000
90,000
10/3 11/3 12/3 13/3 14/3 15/3 16/3 17/3 18/3 19/3 20/3 21/3 22/3
モビリティ事業の売上高、営業利益および営業利益率の推移
売上高(左軸) 営業利益(左軸) 営業利益率(右軸)
(百万円) (%)
(会予)
(Million yen) (%) Mobility Operations: Net Sales/Operating Income/Operating Income Margin
FY2009 FY2010 FY2011 FY2012 FY2013 FY2014 FY2015 FY2016 FY2017 FY2018 FY2019 FY2020 FY2021 (The Company’s forecast)
Net sales (left scale)
Operating income (left scale)
Operating income margin (right scale)

2021-9-1
17 Tsubakimoto Chain (6371)
The Company’s Mobility Operations growing faster than global vehicle production Sales of Mobility Operations showed rapid growth in the wake of a trend of downsizing engines for better fuel economy for automobiles, growing at a significantly faster pace than global vehicle production thanks to a shift from rubber timing belts to steel timing chains and capture of market share (Figure 18).
Mobility Operations’ target customers, the ICE (Internal Combustion Engine) & HV (Hybrid Vehicle) markets, are expected to remain steady until around 2025 at the earliest, according to automakers’ plans for the launch of new engines. With the Company’s global market share expected to continue to grow, Mobility Operations should be able to maintain sales growth that exceeds global vehicle production. In addition, as a shift to HVs does not involve any significant change in engine chain mechanisms, apparently there is no particular downward trend, just because of HVs, seen in unit prices.
EV trend (automotive electrification) likely to become noticeable/visible after 2025 In the new Mid-Term Plan, the Company discloses its projected vehicle production and Mobility Operations sales by 2025. It projects net sales of ¥72.3 billion for FY2021, mainly driven by growth in the existing business areas with environment-friendly products for next-generation engines, and net sales of around ¥80 billion and ¥100 billion for FY2022 and FY2025, respectively.
CGRA has analyzed automakers’ electrification strategies and the tightening of government regulations and made the following predictions about structural changes in global vehicle production toward 2030: (1) global ICE/HV production will remain at a high level until around 2025; (2) HV will become a major model toward 2030, accounting for approx. 40% of the market; (3) the launch of new NEV (New Energy Vehicle = BEV: Battery Electric Vehicle+ FCV: Fuel Cell Vehicle) models will accelerate from around 2026, reaching approx. 25% of global vehicle production by 2030; and (4) the ICE market will visibly shrink from around 2025, with its share of global vehicle sales down to approx. 34% by 2030.
Figure 18: Mobility Operations sales outperform vehicle production
Source: Created by CGRA based on various materials, etc. / Vehicle production: Projected by CGRA
Final year (FY2025) target under Mid-Term Plan: ¥100 billion net sales
0
1,500
3,000
4,500
6,000
7,500
9,000
10,500
12,000
13,500
15,000
0
10,000
20,000
30,000
40,000
50,000
60,000
70,000
80,000
90,000
100,000
10/3 11/3 12/3 13/3 14/3 15/3 16/3 17/3 18/3 19/3 20/3 21/3 22/3
モビリティ事業売上高とグローバル自動車生産台数の推移
モビリティ事業売上高(左軸) グローバル生産台数(右軸)
(百万円) (万台)
(会予)0.0
5.0
10.0
15.0
20.0
25.0
30.0
0
2,000
4,000
6,000
8,000
10,000
12,000
2020 2021 2022 2023 2024 2025 2026 2027 2028 2029 2030
グローバル自動車生産台数の構成変化
HV ICE NEV(BEV,FCV) NEV比率(右目盛)
(万台) (%)
(暦年)
(Million yen)
Mobility Operations sales (left scale)
Global production (right scale)
Mobile Operations Sales and Global Vehicle Production (10 thousands)
(10 thousands) (%) Global vehicle production breakdown (right scale)
(Calendar year)
NEV ratio (right scale)
FY2009 FY2010 FY2011 FY2012 FY2013 FY2014 FY2015 FY2016 FY2017 FY2018 FY2019 FY2020 FY2021 (The Company’s forecast)

2021-9-1
18 Tsubakimoto Chain (6371)
BEVs do not need timing chains In the mid-1980s, automakers shifted their focus to lighter-weight and lower-noise models, and a movement to replace steel timing chains with rubber timing belts was seen. From around 1995, however, a trend of returning to timing chains was intensifying in response to increasing needs for smaller-size/higher-performance engines. As a result, the Company’s Mobility Operations posted record-high operating income of ¥12.3 billion in FY2016 and record-high net sales of ¥79.5 billion in FY2017.
However, in around 2017, a CASE (Connectivity, Autonomous, Shared, and Electric) automotive debate set in, and countermeasures against global warming and increasingly intensifying ESG momentum accelerated discussions on automotive electrification. BEVs (Battery Electric Vehicles), on which only a motor is used as a driving unit (division), do not need timing chains, as no engine is required. This could be one of the causes of a decline in the Company’s PBR. But engines are equipped in HV and PHV models, for which timing chains should continue to be adopted as well.
Enedrive Chains, e-fuel, and hydrogen engines are the key to Operations’ future As the adoption of small-size and high-speed motors on BEVs is expected to increase, “motors + gears” should become a generally accepted mechanism. That said, compared to gears, chains have more flexibility in layout, higher power transmission efficiency, as well as more advantages in terms of quantity and cost. We should continue to closely watch the adoption of the Company’s Enedrive Chains.
An e-fuel is a liquid hydrocarbon fuel catalytically synthesizing CO2 and H2 (hydrogen), made through water electrolysis, and its development is led by VW Europe and Toyota Motor. Automakers are trying to keep newcomers such as Apple Inc. away by preserving their existing ICE technologies. Japanese automakers are in an advantageous position in HV technologies, while U.S., Chinese, and South Korean automakers are more EV-oriented. As such, mainly among European and Japanese automakers, some moves to explore e-fuel options are seen. In addition, a hydrogen engine led by Toyota Motor generates power by changing the fuel-supply/fuel-injection system in a conventional gasoline engine to burn compressed hydrogen gas, thus it does not generate CO2 when driving. Depending on developments in e-fuel and hydrogen engine operations, CGRA believes that “demand for timing chains for engines will disappear in the EV era,” about which the stock market is concerned, could transform into “they become a stable profit center.”
Figure 19: EV chain/gear characteristic analysis and Company products mapping
Source: Company website and briefing materials on Mid-Term Plan 2025
Timing chains will not be needed for FCVs
The “motors + chains” mechanism on BEVs has many benefits
2021-9-1
19 Tsubakimoto Chain (6371)
・ Market Overview and Earnings Outlook for Materials Handling Operations
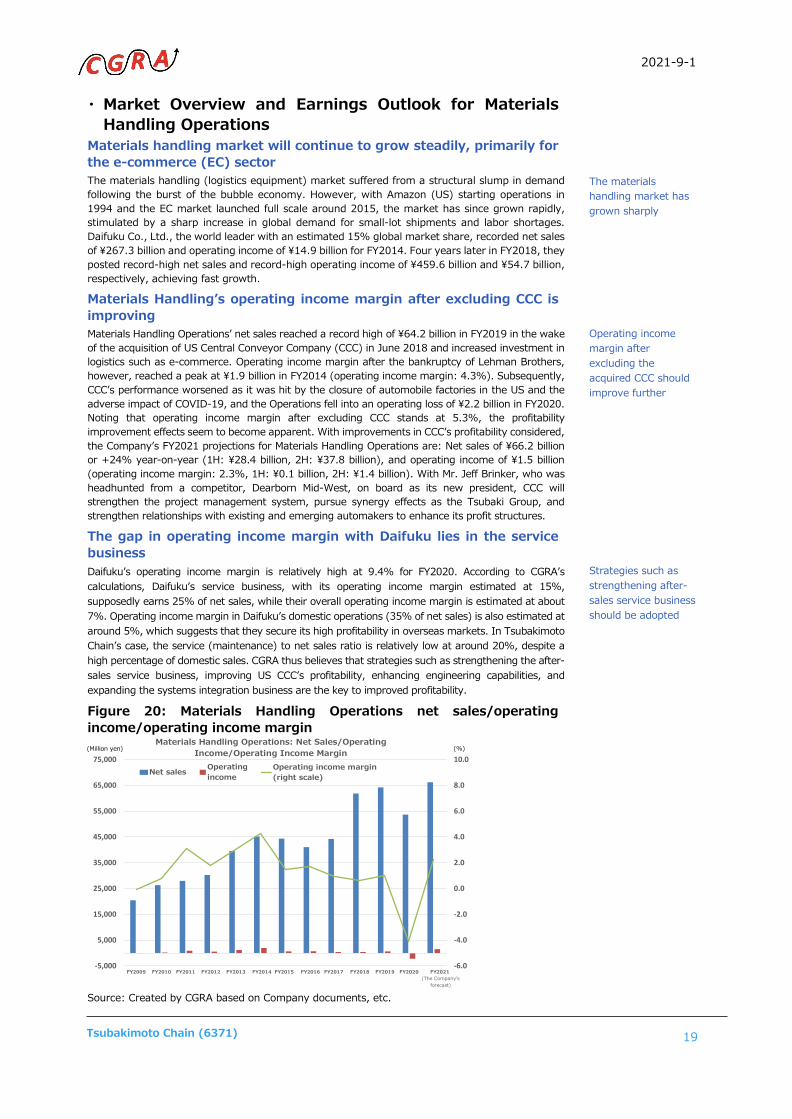
Materials handling market will continue to grow steadily, primarily for the e-commerce (EC) sector The materials handling (logistics equipment) market suffered from a structural slump in demand following the burst of the bubble economy. However, with Amazon (US) starting operations in 1994 and the EC market launched full scale around 2015, the market has since grown rapidly, stimulated by a sharp increase in global demand for small-lot shipments and labor shortages. Daifuku Co., Ltd., the world leader with an estimated 15% global market share, recorded net sales of ¥267.3 billion and operating income of ¥14.9 billion for FY2014. Four years later in FY2018, they posted record-high net sales and record-high operating income of ¥459.6 billion and ¥54.7 billion, respectively, achieving fast growth.
Materials Handling’s operating income margin after excluding CCC is improving Materials Handling Operations’ net sales reached a record high of ¥64.2 billion in FY2019 in the wake of the acquisition of US Central Conveyor Company (CCC) in June 2018 and increased investment in logistics such as e-commerce. Operating income margin after the bankruptcy of Lehman Brothers, however, reached a peak at ¥1.9 billion in FY2014 (operating income margin: 4.3%). Subsequently, CCC’s performance worsened as it was hit by the closure of automobile factories in the US and the adverse impact of COVID-19, and the Operations fell into an operating loss of ¥2.2 billion in FY2020. Noting that operating income margin after excluding CCC stands at 5.3%, the profitability improvement effects seem to become apparent. With improvements in CCC’s profitability considered, the Company’s FY2021 projections for Materials Handling Operations are: Net sales of ¥66.2 billion or +24% year-on-year (1H: ¥28.4 billion, 2H: ¥37.8 billion), and operating income of ¥1.5 billion (operating income margin: 2.3%, 1H: ¥0.1 billion, 2H: ¥1.4 billion). With Mr. Jeff Brinker, who was headhunted from a competitor, Dearborn Mid-West, on board as its new president, CCC will strengthen the project management system, pursue synergy effects as the Tsubaki Group, and strengthen relationships with existing and emerging automakers to enhance its profit structures.
The gap in operating income margin with Daifuku lies in the service business Daifuku’s operating income margin is relatively high at 9.4% for FY2020. According to CGRA’s calculations, Daifuku’s service business, with its operating income margin estimated at 15%, supposedly earns 25% of net sales, while their overall operating income margin is estimated at about 7%. Operating income margin in Daifuku’s domestic operations (35% of net sales) is also estimated at around 5%, which suggests that they secure its high profitability in overseas markets. In Tsubakimoto Chain’s case, the service (maintenance) to net sales ratio is relatively low at around 20%, despite a high percentage of domestic sales. CGRA thus believes that strategies such as strengthening the after-sales service business, improving US CCC’s profitability, enhancing engineering capabilities, and expanding the systems integration business are the key to improved profitability.
Figure 20: Materials Handling Operations net sales/operating income/operating income margin
Source: Created by CGRA based on Company documents, etc.
The materials handling market has grown sharply
Operating income margin after excluding the acquired CCC should improve further Strategies such as strengthening after-sales service business should be adopted
-6.0
-4.0
-2.0
0.0
2.0
4.0
6.0
8.0
10.0
-5,000
5,000
15,000
25,000
35,000
45,000
55,000
65,000
75,000
10/3 11/3 12/3 13/3 14/3 15/3 16/3 17/3 18/3 19/3 20/3 21/3 22/3
マテハン事業の売上高、営業利益および営業利益率の推移
売上高 営業利益 営業利益率(右軸)
(百万円) (%)
(会予)
(Million yen) (%) Materials Handling Operations: Net Sales/Operating
Income/Operating Income Margin
Net sales Operating income
Operating income margin (right scale)
FY2009 FY2010 FY2011 FY2012 FY2013 FY2014 FY2015 FY2016 FY2017 FY2018 FY2019 FY2020 FY2021 (The Company’s forecast)

2021-9-1
20 Tsubakimoto Chain (6371)
(5) Financial and Non-Financial Analyses ・Financial Analysis The Company maintains strong B/S, but its challenge is how to manage working capital As of the end of FY2020, the Company secured a consolidated equity ratio of 60.5% (+4.6% from five years ago) and retained earnings, to be used as the source of dividends, reached ¥96.8 billion on a stand-alone basis. With dividend per share for FY2021 expected at 110 yen (total dividends: ¥4.1 billion), the Company seems to have generous funds for dividends compared to a total of ¥20-24 billion dividends set out in the new Mid-Term Plan.
As of the end of FY2020, tangible fixed assets turnover (=net sales / average tangible fixed assets for the last two years) was 1.66 (which reached a peak at 2.07 in FY2018), higher than 1.32 for OSG, a tool manufacturer, but lower than 2.43 for Aisin, a manufacturer of automotive parts such as transmission parts, or 1.96 for NSK, a bearing maker. Proactive investments made in Mobility Operations since FY2015, as well as a decline in revenue resulting from the trade dispute between China and the US and the COVID-19 impact, seem to be among the factors.
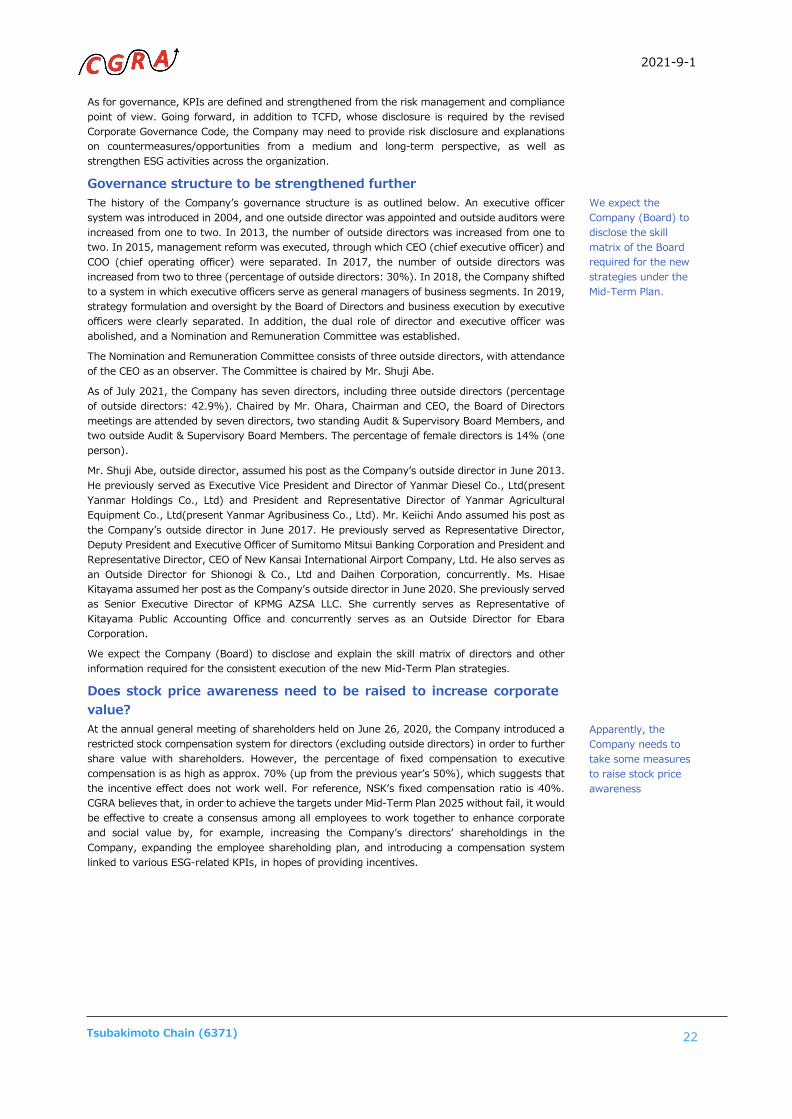
Looking at working capital as of the end of FY2020, CCC (Cash Conversion Cycle = days of inventory outstanding + days of sales outstanding - days of payables outstanding) was 154.8 days (average for the last five years: 134.0 days). This cycle is also longer than NSK’s 120.9 days (average for the last five years: 99.9 days). Specifically, days of inventory outstanding and days sales outstanding are long. This figure seems to be affected by Materials Handling Operations earning 28% of the Company’s net sales, but the CCC of Daifuku, the largest materials handling company, is 98.8 days. In CGRA’s view, the Company must have some issues other than Materials Handling Operations. For reference, the CCC of Daido Kogyo, a manufacturer of chains for internal combustion engines and industrial machines, was 145 days for FY2020.
On B/S, goodwill is stated at only ¥2.5 billion, whereas investment securities is at ¥28.5 billion (approx. 15% of shareholders’ equity). This makes us wonder, in terms of corporate governance, if there is any problem left with the Company’s unwinding of cross shareholdings.
The Company is able to create stable FCF, which ensures positive net cash Average operating cash flow and average free cash flow for the last five years were ¥25 billion and ¥7.7 billion, respectively. As of the end of FY2020, the Company had interest-bearing debt of ¥41.1 billion and liquidity in hand of ¥48 billion (cash and deposits ¥41.8 billion + securities ¥6.1 billion), totaling ¥6.8 billion positive net cash. The Company had ¥7.6 billion positive net cash in FY2017, then the figure turned negative in the last two fiscal years due to an increase in interest-bearing debt, before recovering to a positive in FY2020 for the first time in three fiscal years, thanks to the reduction of working capital and capital investment.
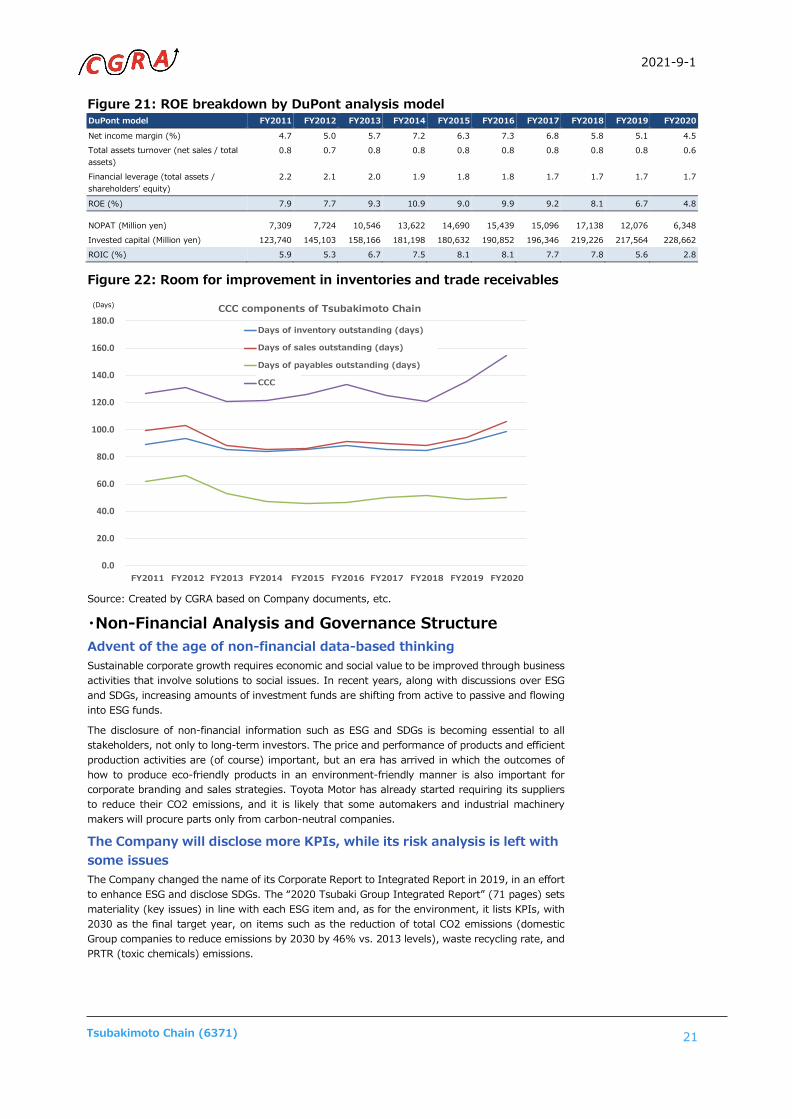
CGRA’s view: B/S reforms are needed to achieve 10% ROE After the bankruptcy of Lehman Brothers, ROE reached a peak at 10.9% in FY2014 and fell to 4.8% in FY2020 (record high: 12.8% in FY2007). The breakdown of 4.8% ROE based on the DuPont model is as follows: Net income margin: 4.5% (FY2014: 7.2%), total assets turnover (= net sales/average total assets for the last two fiscal years): 0.6 (FY2014: 0.8), and financial leverage (= average total assets for the last two fiscal years/average shareholders’ equity for the last two fiscal years): 1.7 (FY2014: 1.9). This gives an impression of excess shareholders’ equity. In fact, the Company’s shareholders’ equity increased nearly 1.3-fold from ¥140.4 billion at the end of FY2014 to ¥185.7 billion at the end of FY2020 (while total assets increased nearly 1.2-fold).
Among other companies, NSK, for example, marked its record-high ROE at 15.2% in FY2014. Despite its net income margin of 6.4% then, which was lower than Tsubakimoto Chain’s, NSK’s total assets turnover was 0.9, with financial leverage at 2.6. Therefore, CGRA believes that for Tsubakimoto Chain to improve ROE, improving profitability as well as B/S reforms, such as reducing inventories and trade receivables, selling off cross shareholdings, using outsourcing (= reducing tangible fixed assets), and enhancing shareholder returns, are required.
B/S is strong, but there is still room for improvement in comparison to other companies
Cross shareholdings should be liquidated
2021-9-1
21 Tsubakimoto Chain (6371)
Figure 21: ROE breakdown by DuPont analysis model DuPont model FY2011 FY2012 FY2013 FY2014 FY2015 FY2016 FY2017 FY2018 FY2019 FY2020
Net income margin (%) 4.7 5.0 5.7 7.2 6.3 7.3 6.8 5.8 5.1 4.5 Total assets turnover (net sales / total assets)
0.8 0.7 0.8 0.8 0.8 0.8 0.8 0.8 0.8 0.6
Financial leverage (total assets / shareholders’ equity)
2.2 2.1 2.0 1.9 1.8 1.8 1.7 1.7 1.7 1.7
ROE (%) 7.9 7.7 9.3 10.9 9.0 9.9 9.2 8.1 6.7 4.8
NOPAT (Million yen) 7,309 7,724 10,546 13,622 14,690 15,439 15,096 17,138 12,076 6,348 Invested capital (Million yen) 123,740 145,103 158,166 181,198 180,632 190,852 196,346 219,226 217,564 228,662 ROIC (%) 5.9 5.3 6.7 7.5 8.1 8.1 7.7 7.8 5.6 2.8
Figure 22: Room for improvement in inventories and trade receivables
Source: Created by CGRA based on Company documents, etc.
・Non-Financial Analysis and Governance Structure Advent of the age of non-financial data-based thinking Sustainable corporate growth requires economic and social value to be improved through business activities that involve solutions to social issues. In recent years, along with discussions over ESG and SDGs, increasing amounts of investment funds are shifting from active to passive and flowing into ESG funds.
The disclosure of non-financial information such as ESG and SDGs is becoming essential to all stakeholders, not only to long-term investors. The price and performance of products and efficient production activities are (of course) important, but an era has arrived in which the outcomes of how to produce eco-friendly products in an environment-friendly manner is also important for corporate branding and sales strategies. Toyota Motor has already started requiring its suppliers to reduce their CO2 emissions, and it is likely that some automakers and industrial machinery makers will procure parts only from carbon-neutral companies.
The Company will disclose more KPIs, while its risk analysis is left with some issues The Company changed the name of its Corporate Report to Integrated Report in 2019, in an effort to enhance ESG and disclose SDGs. The “2020 Tsubaki Group Integrated Report” (71 pages) sets materiality (key issues) in line with each ESG item and, as for the environment, it lists KPIs, with 2030 as the final target year, on items such as the reduction of total CO2 emissions (domestic Group companies to reduce emissions by 2030 by 46% vs. 2013 levels), waste recycling rate, and PRTR (toxic chemicals) emissions.
0.0
20.0
40.0
60.0
80.0
100.0
120.0
140.0
160.0
180.0
12/3 13/3 14/3 15/3 16/3 17/3 18/3 19/3 20/3 21/3
椿本チエインのCCC構成項目の推移
棚卸資産回転日数(日)
売上債権回転日数(日)
仕入債務回転日数(日)
CCC
(日)(Days) CCC components of Tsubakimoto Chain
Days of inventory outstanding (days)
Days of sales outstanding (days)
Days of payables outstanding (days)
CCC
FY2011 FY2012 FY2013 FY2014 FY2015 FY2016 FY2017 FY2018 FY2019 FY2020
2021-9-1
22 Tsubakimoto Chain (6371)
As for governance, KPIs are defined and strengthened from the risk management and compliance point of view. Going forward, in addition to TCFD, whose disclosure is required by the revised Corporate Governance Code, the Company may need to provide risk disclosure and explanations on countermeasures/opportunities from a medium and long-term perspective, as well as strengthen ESG activities across the organization.
Governance structure to be strengthened further The history of the Company’s governance structure is as outlined below. An executive officer system was introduced in 2004, and one outside director was appointed and outside auditors were increased from one to two. In 2013, the number of outside directors was increased from one to two. In 2015, management reform was executed, through which CEO (chief executive officer) and COO (chief operating officer) were separated. In 2017, the number of outside directors was increased from two to three (percentage of outside directors: 30%). In 2018, the Company shifted to a system in which executive officers serve as general managers of business segments. In 2019, strategy formulation and oversight by the Board of Directors and business execution by executive officers were clearly separated. In addition, the dual role of director and executive officer was abolished, and a Nomination and Remuneration Committee was established.
The Nomination and Remuneration Committee consists of three outside directors, with attendance of the CEO as an observer. The Committee is chaired by Mr. Shuji Abe.
As of July 2021, the Company has seven directors, including three outside directors (percentage of outside directors: 42.9%). Chaired by Mr. Ohara, Chairman and CEO, the Board of Directors meetings are attended by seven directors, two standing Audit & Supervisory Board Members, and two outside Audit & Supervisory Board Members. The percentage of female directors is 14% (one person).
Mr. Shuji Abe, outside director, assumed his post as the Company’s outside director in June 2013. He previously served as Executive Vice President and Director of Yanmar Diesel Co., Ltd(present Yanmar Holdings Co., Ltd) and President and Representative Director of Yanmar Agricultural Equipment Co., Ltd(present Yanmar Agribusiness Co., Ltd). Mr. Keiichi Ando assumed his post as the Company’s outside director in June 2017. He previously served as Representative Director, Deputy President and Executive Officer of Sumitomo Mitsui Banking Corporation and President and Representative Director, CEO of New Kansai International Airport Company, Ltd. He also serves as an Outside Director for Shionogi & Co., Ltd and Daihen Corporation, concurrently. Ms. Hisae Kitayama assumed her post as the Company’s outside director in June 2020. She previously served as Senior Executive Director of KPMG AZSA LLC. She currently serves as Representative of Kitayama Public Accounting Office and concurrently serves as an Outside Director for Ebara Corporation.
We expect the Company (Board) to disclose and explain the skill matrix of directors and other information required for the consistent execution of the new Mid-Term Plan strategies.
Does stock price awareness need to be raised to increase corporate value? At the annual general meeting of shareholders held on June 26, 2020, the Company introduced a restricted stock compensation system for directors (excluding outside directors) in order to further share value with shareholders. However, the percentage of fixed compensation to executive compensation is as high as approx. 70% (up from the previous year’s 50%), which suggests that the incentive effect does not work well. For reference, NSK’s fixed compensation ratio is 40%. CGRA believes that, in order to achieve the targets under Mid-Term Plan 2025 without fail, it would be effective to create a consensus among all employees to work together to enhance corporate and social value by, for example, increasing the Company’s directors’ shareholdings in the Company, expanding the employee shareholding plan, and introducing a compensation system linked to various ESG-related KPIs, in hopes of providing incentives.
We expect the Company (Board) to disclose the skill matrix of the Board required for the new strategies under the Mid-Term Plan.
Apparently, the Company needs to take some measures to raise stock price awareness

2021-9-1
23 Tsubakimoto Chain (6371)
(6)Consolidated Statements of Income/Balance Sheets/Cash Flows
・Figure 23:Consolidated Statements of Income
Note: The Company renamed its segments in FY2021: Precision Machinery Operations became Motion Control (MC) Operations, and AP Clutch was transferred to Mobility Operations. Automotive Parts Operations was renamed Mobility Operations. Power Transmission Operations, which controls the chain operations and the MC operations, was established.
Consolidated EPS for FY2016/FY2017/FY2018 are adjusted to reflect the value after stock consolidation (reverse split).
Source: Created by CGRA based on Company documents, etc.
(¥ mn,%) 12/3 13/3 14/3 15/3 16/3 17/3 18/3 19/3 20/3 21/3 22/3COESales 144,896 150,002 178,022 196,738 203,976 198,762 215,716 238,515 226,423 193,399 225,000 yoy 4.8 3.5 18.7 10.5 3.7 -2.6 8.5 10.6 -5.1 -14.6 16.3Cost of goods sold 104,156 107,396 126,132 137,014 142,241 138,191 152,630 171,959 166,158 145,764 - Cost of goods sold/Sales 71.9 71.6 70.9 69.6 69.7 69.5 70.8 72.1 73.4 75.4 -SG&A 28,657 30,027 34,536 38,296 40,164 38,924 42,392 44,767 44,118 38,737 - SG&A/Sales 19.8 20.0 19.4 19.5 19.7 19.6 19.7 18.8 19.5 20.0 -Operating income 12,081 12,579 17,354 21,427 21,570 21,647 20,694 21,789 16,146 8,896 16,000 yoy 9.6 4.1 38.0 23.5 0.7 0.4 -4.4 5.3 -25.9 -44.9 79.9 OP margin 8.3 8.4 9.7 10.9 10.6 10.9 9.6 9.1 7.1 4.600 7.1Non-operating balance 59 235 639 836 539 357 1,049 -167 552 2,129 1,000Recurring profits 12,140 12,813 17,993 22,263 22,109 22,004 21,743 21,622 16,698 11,025 17,000 yoy 9.3 5.5 40.4 23.7 -0.7 -0.5 -1.2 -0.6 -22.8 -34.0 54.2 RP margin 8.4 8.5 10.1 11.3 10.8 11.1 10.1 9.1 7.4 5.7 7.6Extraordinary balance -233 -168 -421 321 -1,665 -429 -579 -2,189 111 1,133 - Extraordinary profits 73 6 6 365 75 10 0 4 533 1,190 - Extraordinary losses 306 174 427 44 1,740 439 579 2,193 422 57 -Pretax income 11,907 12,645 17,572 22,583 20,444 21,575 21,164 19,433 16,809 12,158 -Taxes and deferred taxes 4,469 4,750 6,856 8,163 7,643 6,721 6,422 5,577 5,123 3,377 - Tax ratio 37.5 37.6 39.0 36.1 37.4 31.2 30.3 28.7 30.5 27.8 -Minority interests 623 464 503 267 33 257 75 75 109 75 -Net profits 6,815 7,431 10,213 14,153 12,768 14,597 14,667 13,781 11,576 8,706 12,500 yoy 11.8 9.0 37.4 38.6 -9.8 14.3 0.5 -6.0 -16.0 -24.8 43.6 NP margin 4.7 5.0 5.7 7.2 6.3 7.3 6.8 5.8 5.1 4.5 5.6EPS 36.63 39.69 54.58 75.65 68.24 390.15 387.44 364.03 308.71 235.23 337.70
Segment SalesChain 51,692 50,250 55,828 61,721 63,998 60,600 67,338 72,023 67,526 61,312 65,800Motion Control 21,364 19,664 21,612 22,557 21,975 21,563 24,156 25,591 23,813 19,697 22,100Mobility 43,509 49,397 60,674 66,978 73,473 75,147 79,545 78,992 70,949 57,777 72,300Material Handling 27,977 30,246 39,565 45,169 44,354 41,043 44,187 61,827 64,212 53,618 66,200Others 2,913 2,846 2,719 2,968 3,186 3,001 3,331 3,548 3,542 3,941 2,200Elimination -2,559 -2,402 -2,378 -2,658 -3,011 -2,594 -2,843 -3,469 -3,622 -2,948 -3,600Consolidated Sales 144,896 150,002 178,022 196,738 203,976 198,762 215,716 238,515 226,423 193,399 225,000
Segment ProfitChain 3,462 3,586 3,763 5,002 6,172 7,102 8,502 10,292 8,406 7,862 6,700Motion Control 2,512 1,955 2,273 2,400 2,427 2,218 3,060 3,340 2,189 816 1,300Mobility 4,846 6,494 10,119 11,916 12,258 12,385 10,258 8,734 5,791 3,714 8,000Material Handling 878 531 1,192 1,940 659 706 416 402 647 -2,202 1,500Others 170 143 63 123 84 -1 -40 -43 20 -330 -300Elimination 213 -130 -56 46 -30 -763 -1,502 -936 -907 -964 -1,200Consolidated Operating Income 12,081 12,579 17,354 21,427 21,570 21,647 20,694 21,789 16,146 8,896 16,000
Profit MarginChain 6.7 7.1 6.7 8.1 9.6 11.7 12.6 14.3 12.4 12.8 10.2Motion Control 11.8 9.9 10.5 10.6 11.0 10.3 12.7 13.1 9.2 4.1 5.9Mobility 11.1 13.1 16.7 17.8 16.7 16.5 12.9 11.1 8.2 6.4 11.1Material Handling 3.1 1.8 3.0 4.3 1.5 1.7 0.9 0.7 1.0 -4.1 2.3Others 5.8 5.0 2.3 4.2 2.6 0.0 -1.2 -1.2 0.6 -8.4 -13.6Consolidated Operating Income Margin 8.3 8.4 9.7 10.9 10.6 10.9 9.6 9.1 7.1 4.6 7.1
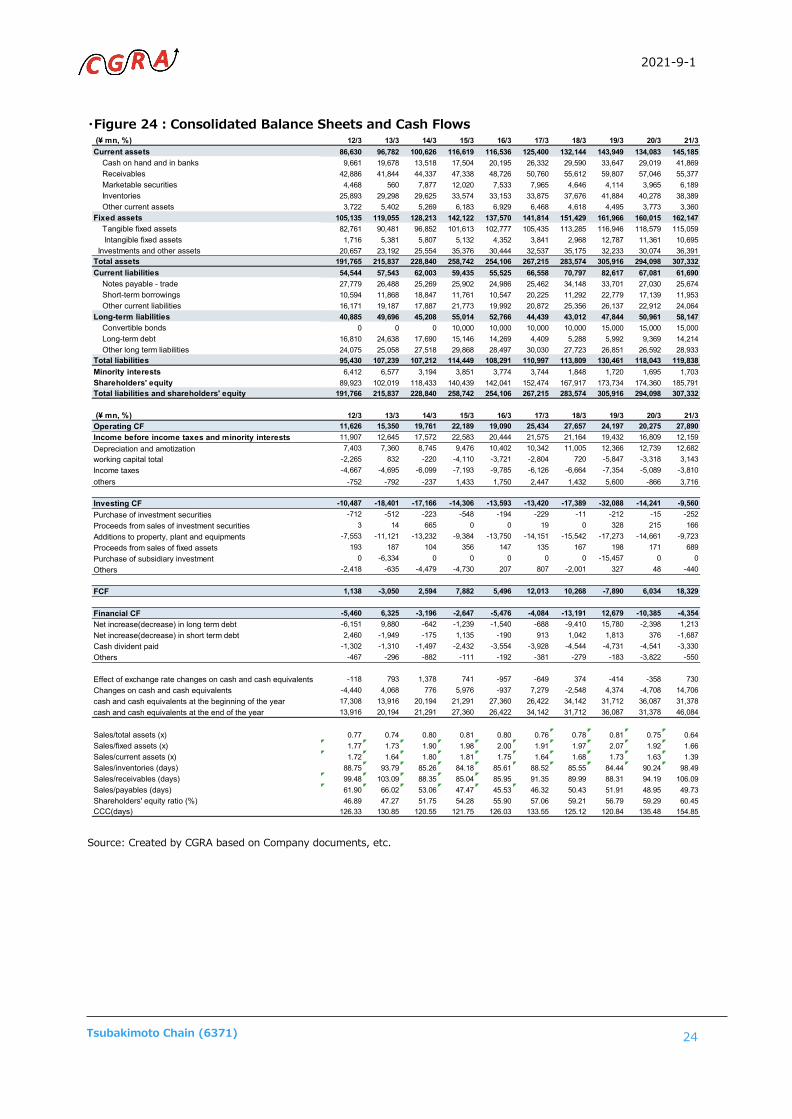
2021-9-1
24 Tsubakimoto Chain (6371)
・Figure 24:Consolidated Balance Sheets and Cash Flows
Source: Created by CGRA based on Company documents, etc.
(¥ mn, %) 12/3 13/3 14/3 15/3 16/3 17/3 18/3 19/3 20/3 21/3Current assets 86,630 96,782 100,626 116,619 116,536 125,400 132,144 143,949 134,083 145,185 Cash on hand and in banks 9,661 19,678 13,518 17,504 20,195 26,332 29,590 33,647 29,019 41,869 Receivables 42,886 41,844 44,337 47,338 48,726 50,760 55,612 59,807 57,046 55,377 Marketable securities 4,468 560 7,877 12,020 7,533 7,965 4,646 4,114 3,965 6,189 Inventories 25,893 29,298 29,625 33,574 33,153 33,875 37,676 41,884 40,278 38,389 Other current assets 3,722 5,402 5,269 6,183 6,929 6,468 4,618 4,495 3,773 3,360Fixed assets 105,135 119,055 128,213 142,122 137,570 141,814 151,429 161,966 160,015 162,147 Tangible fixed assets 82,761 90,481 96,852 101,613 102,777 105,435 113,285 116,946 118,579 115,059 Intangible fixed assets 1,716 5,381 5,807 5,132 4,352 3,841 2,968 12,787 11,361 10,695 Investments and other assets 20,657 23,192 25,554 35,376 30,444 32,537 35,175 32,233 30,074 36,391Total assets 191,765 215,837 228,840 258,742 254,106 267,215 283,574 305,916 294,098 307,332Current liabilities 54,544 57,543 62,003 59,435 55,525 66,558 70,797 82,617 67,081 61,690 Notes payable - trade 27,779 26,488 25,269 25,902 24,986 25,462 34,148 33,701 27,030 25,674 Short-term borrowings 10,594 11,868 18,847 11,761 10,547 20,225 11,292 22,779 17,139 11,953 Other current liabilities 16,171 19,187 17,887 21,773 19,992 20,872 25,356 26,137 22,912 24,064Long-term liabilities 40,885 49,696 45,208 55,014 52,766 44,439 43,012 47,844 50,961 58,147 Convertible bonds 0 0 0 10,000 10,000 10,000 10,000 15,000 15,000 15,000 Long-term debt 16,810 24,638 17,690 15,146 14,269 4,409 5,288 5,992 9,369 14,214 Other long term liabilities 24,075 25,058 27,518 29,868 28,497 30,030 27,723 26,851 26,592 28,933Total liabilities 95,430 107,239 107,212 114,449 108,291 110,997 113,809 130,461 118,043 119,838Minority interests 6,412 6,577 3,194 3,851 3,774 3,744 1,848 1,720 1,695 1,703Shareholders' equity 89,923 102,019 118,433 140,439 142,041 152,474 167,917 173,734 174,360 185,791Total liabilities and shareholders' equity 191,766 215,837 228,840 258,742 254,106 267,215 283,574 305,916 294,098 307,332
(¥ mn, %) 12/3 13/3 14/3 15/3 16/3 17/3 18/3 19/3 20/3 21/3Operating CF 11,626 15,350 19,761 22,189 19,090 25,434 27,657 24,197 20,275 27,890Income before income taxes and minority interests 11,907 12,645 17,572 22,583 20,444 21,575 21,164 19,432 16,809 12,159Depreciation and amotization 7,403 7,360 8,745 9,476 10,402 10,342 11,005 12,366 12,739 12,682working capital total -2,265 832 -220 -4,110 -3,721 -2,804 720 -5,847 -3,318 3,143Income taxes -4,667 -4,695 -6,099 -7,193 -9,785 -6,126 -6,664 -7,354 -5,089 -3,810others -752 -792 -237 1,433 1,750 2,447 1,432 5,600 -866 3,716
Investing CF -10,487 -18,401 -17,166 -14,306 -13,593 -13,420 -17,389 -32,088 -14,241 -9,560Purchase of investment securities -712 -512 -223 -548 -194 -229 -11 -212 -15 -252Proceeds from sales of investment securities 3 14 665 0 0 19 0 328 215 166Additions to property, plant and equipments -7,553 -11,121 -13,232 -9,384 -13,750 -14,151 -15,542 -17,273 -14,661 -9,723Proceeds from sales of fixed assets 193 187 104 356 147 135 167 198 171 689Purchase of subsidiary investment 0 -6,334 0 0 0 0 0 -15,457 0 0Others -2,418 -635 -4,479 -4,730 207 807 -2,001 327 48 -440
FCF 1,138 -3,050 2,594 7,882 5,496 12,013 10,268 -7,890 6,034 18,329
Financial CF -5,460 6,325 -3,196 -2,647 -5,476 -4,084 -13,191 12,679 -10,385 -4,354Net increase(decrease) in long term debt -6,151 9,880 -642 -1,239 -1,540 -688 -9,410 15,780 -2,398 1,213Net increase(decrease) in short term debt 2,460 -1,949 -175 1,135 -190 913 1,042 1,813 376 -1,687Cash divident paid -1,302 -1,310 -1,497 -2,432 -3,554 -3,928 -4,544 -4,731 -4,541 -3,330Others -467 -296 -882 -111 -192 -381 -279 -183 -3,822 -550
Effect of exchange rate changes on cash and cash equivalents -118 793 1,378 741 -957 -649 374 -414 -358 730Changes on cash and cash equivalents -4,440 4,068 776 5,976 -937 7,279 -2,548 4,374 -4,708 14,706cash and cash equivalents at the beginning of the year 17,308 13,916 20,194 21,291 27,360 26,422 34,142 31,712 36,087 31,378cash and cash equivalents at the end of the year 13,916 20,194 21,291 27,360 26,422 34,142 31,712 36,087 31,378 46,084
Sales/total assets (x) 0.77 0.74 0.80 0.81 0.80 0.76 0.78 0.81 0.75 0.64Sales/fixed assets (x) 1.77 1.73 1.90 1.98 2.00 1.91 1.97 2.07 1.92 1.66Sales/current assets (x) 1.72 1.64 1.80 1.81 1.75 1.64 1.68 1.73 1.63 1.39Sales/inventories (days) 88.75 93.79 85.26 84.18 85.61 88.52 85.55 84.44 90.24 98.49Sales/receivables (days) 99.48 103.09 88.35 85.04 85.95 91.35 89.99 88.31 94.19 106.09Sales/payables (days) 61.90 66.02 53.06 47.47 45.53 46.32 50.43 51.91 48.95 49.73Shareholders' equity ratio (%) 46.89 47.27 51.75 54.28 55.90 57.06 59.21 56.79 59.29 60.45CCC(days) 126.33 130.85 120.55 121.75 126.03 133.55 125.12 120.84 135.48 154.85

2021-9-1
25 Tsubakimoto Chain (6371)
Analysts Responsible for this Report Shinji Kuroda, Partner and Senior Analyst Kuroda joined Kankaku Research Institute (now Mizuho Securities) in April 1992, assigned to the Industrial Research Department. He then would join Jardine Fleming Securities (now JP Morgan Securities) in September 1999, then Goldman Sachs. Until January 2020, he worked for Credit Suisse Securities. He served as Vice President at Goldman Sachs, and Director at Credit Suisse Securities. In his career, he has been in charge of the machinery, shipbuilding, and heavy machinery sectors. He joined CGRA as a partner in June 2020. Member of the Machinery Industry Disclosure Committee, The Securities Analysts Association of Japan
Hidehiko Hoshino, CMA, Representative Director and Chief Advisor Hoshino joined Shinko Securities (currently Mizuho Securities) in April 1987, assigned to the Corporate Research Department. He then would join Jardine Fleming Securities (now JP Morgan Securities) in 1997, joining Deutsche Securities in 2000 and UBS Securities in 2006, where he would serve until April 2016. As a sell-side analyst, he has been in charge of the machinery, shipbuilding, heavy machinery, and plant sectors for 28 years. Has served for more than 10 years as Vice Chairman of the Machinery Industry Disclosure Committee, The Securities Analysts Association of Japan. He served as Managing Director from 2003 to 2016. In June 2017, Hoshino established Capital Goods Research & Advisory Co., Ltd. (CGRA), and was appointed as Representative Director. Certified Analyst, The Securities Analysts Association of Japan
Capital Goods Research & Advisory Co., Ltd. An advisory company specializing in the machinery sector. CGRA's main businesses are (1) support for creating integrated reports offering feedback to management while satisfying the needs of capital markets, (2) advisory services for medium-term plan creation and business strategy, as well as various IR & SR areas, (3) preparation of various materials and English translation, and (4) drafting corporate analysis sponsored reports useful for long-term investors and management.
This report's purpose is not to solicit, recommend, or offer advice regarding investment, but is prepared from our own perspective for the purpose of providing information about the company in question. In addition, although the contents of this report have been prepared based on publicly-available information, we do not guarantee their accuracy or completeness. Capital Goods Research & Advisory Co., Ltd. retains copyright to this report. Reproduction is prohibited without prior permission. The contents of this report are subject to change without notice.